1. Introduction
Concrete is the most widely used building material in construction of infrastructures such as buildings, bridges, highways, dams and many others [
1]. The increase in world cement production indicates that concrete will continue to be the most common construction material in the future [
2,
3]. Cement production consumes a lot of energy and is associated with huge amounts of carbon dioxide emissions. Another alternative to make environmentally friendly concrete is the development of geopolymers [
4,
5].
Geopolymer materials are thought to consist of three-dimensional inorganic amorphous structures created by the polycondensation of -Si-O-Al-O- oligomers [
6,
7]. These materials are developed as soon as the solid aluminosilicates are mixed with the three consecutive phases, the strongly alkaline, the silicate and the aqueous phase [
8,
9]. The mixing of the two phases, solid and liquid, leads to the formation of a viscous paste that can be easily molded, giving the desired shape to the end products. Then, the molded products are cured at a temperature in the range 50–90 °C and converted into solid, durable materials with excellent physical, chemical and mechanical properties [
10,
11,
12,
13]. The reaction time of the geopolymerization is particularly short. The produced materials are amorphous or semicrystalline, depending on the curing conditions. Geopolymerization uses aluminosilicate minerals as silicon and aluminum donors [
7,
14].
In order to prepare the geopolymers, an activation solution is usually used, which comprises sodium and/or potassium compounds. These two elements are capable of forming highly concentrated aqueous solutions and dissolving large amounts of silicon and aluminum from the aluminosilicate raw material. The activation solutions used are mainly alkali silicates, alkali hydroxides, alkali carbonates or mixtures of them. Other additives such as sodium aluminate can also be used [
15].
Fly ash (FA) is a by-product coming from the combustion of lignite in the power plants, and its negative impact on the environment is well known. FA is an aluminosilicate material, and its chemical/mineral composition depends on the composition of the coal and the combustion conditions. Fly ash is mainly amorphous (up to 80%
w/
w) with minor amounts of quartz and mullite [
16,
17]. The FA geopolymers produced are influenced by its particle size, morphology and the presence of crystalline phases. For the synthesis of geopolymers with high compressive strength, FA with a high fineness is required [
18].
The scope of the present research is to (a) design geopolymer concrete based on FA, (b) evaluate its mechanical and physical properties, and (c) compare them to those of conventional concrete. The final goal of the research project is to incorporate FA into concrete technology, not as an additive of mineral origin but as the exclusive binder (instead of cement).
2. Experimental Procedure
In the context of the research, geopolymer concretes (GC) with different content of siliceous FA by volume, 15%, 22.5% and 30%, were prepared. In addition, three Portland cement concretes (CC) of suitable composition and mechanical properties were prepared for comparative reasons. The measured properties of GC and CC are the workability, air content, density, ultrasonic pulse velocity, compressive strength, modulus of elasticity, Poisson ratio, and tensile strength through splitting and bending tests.
2.1. Materials
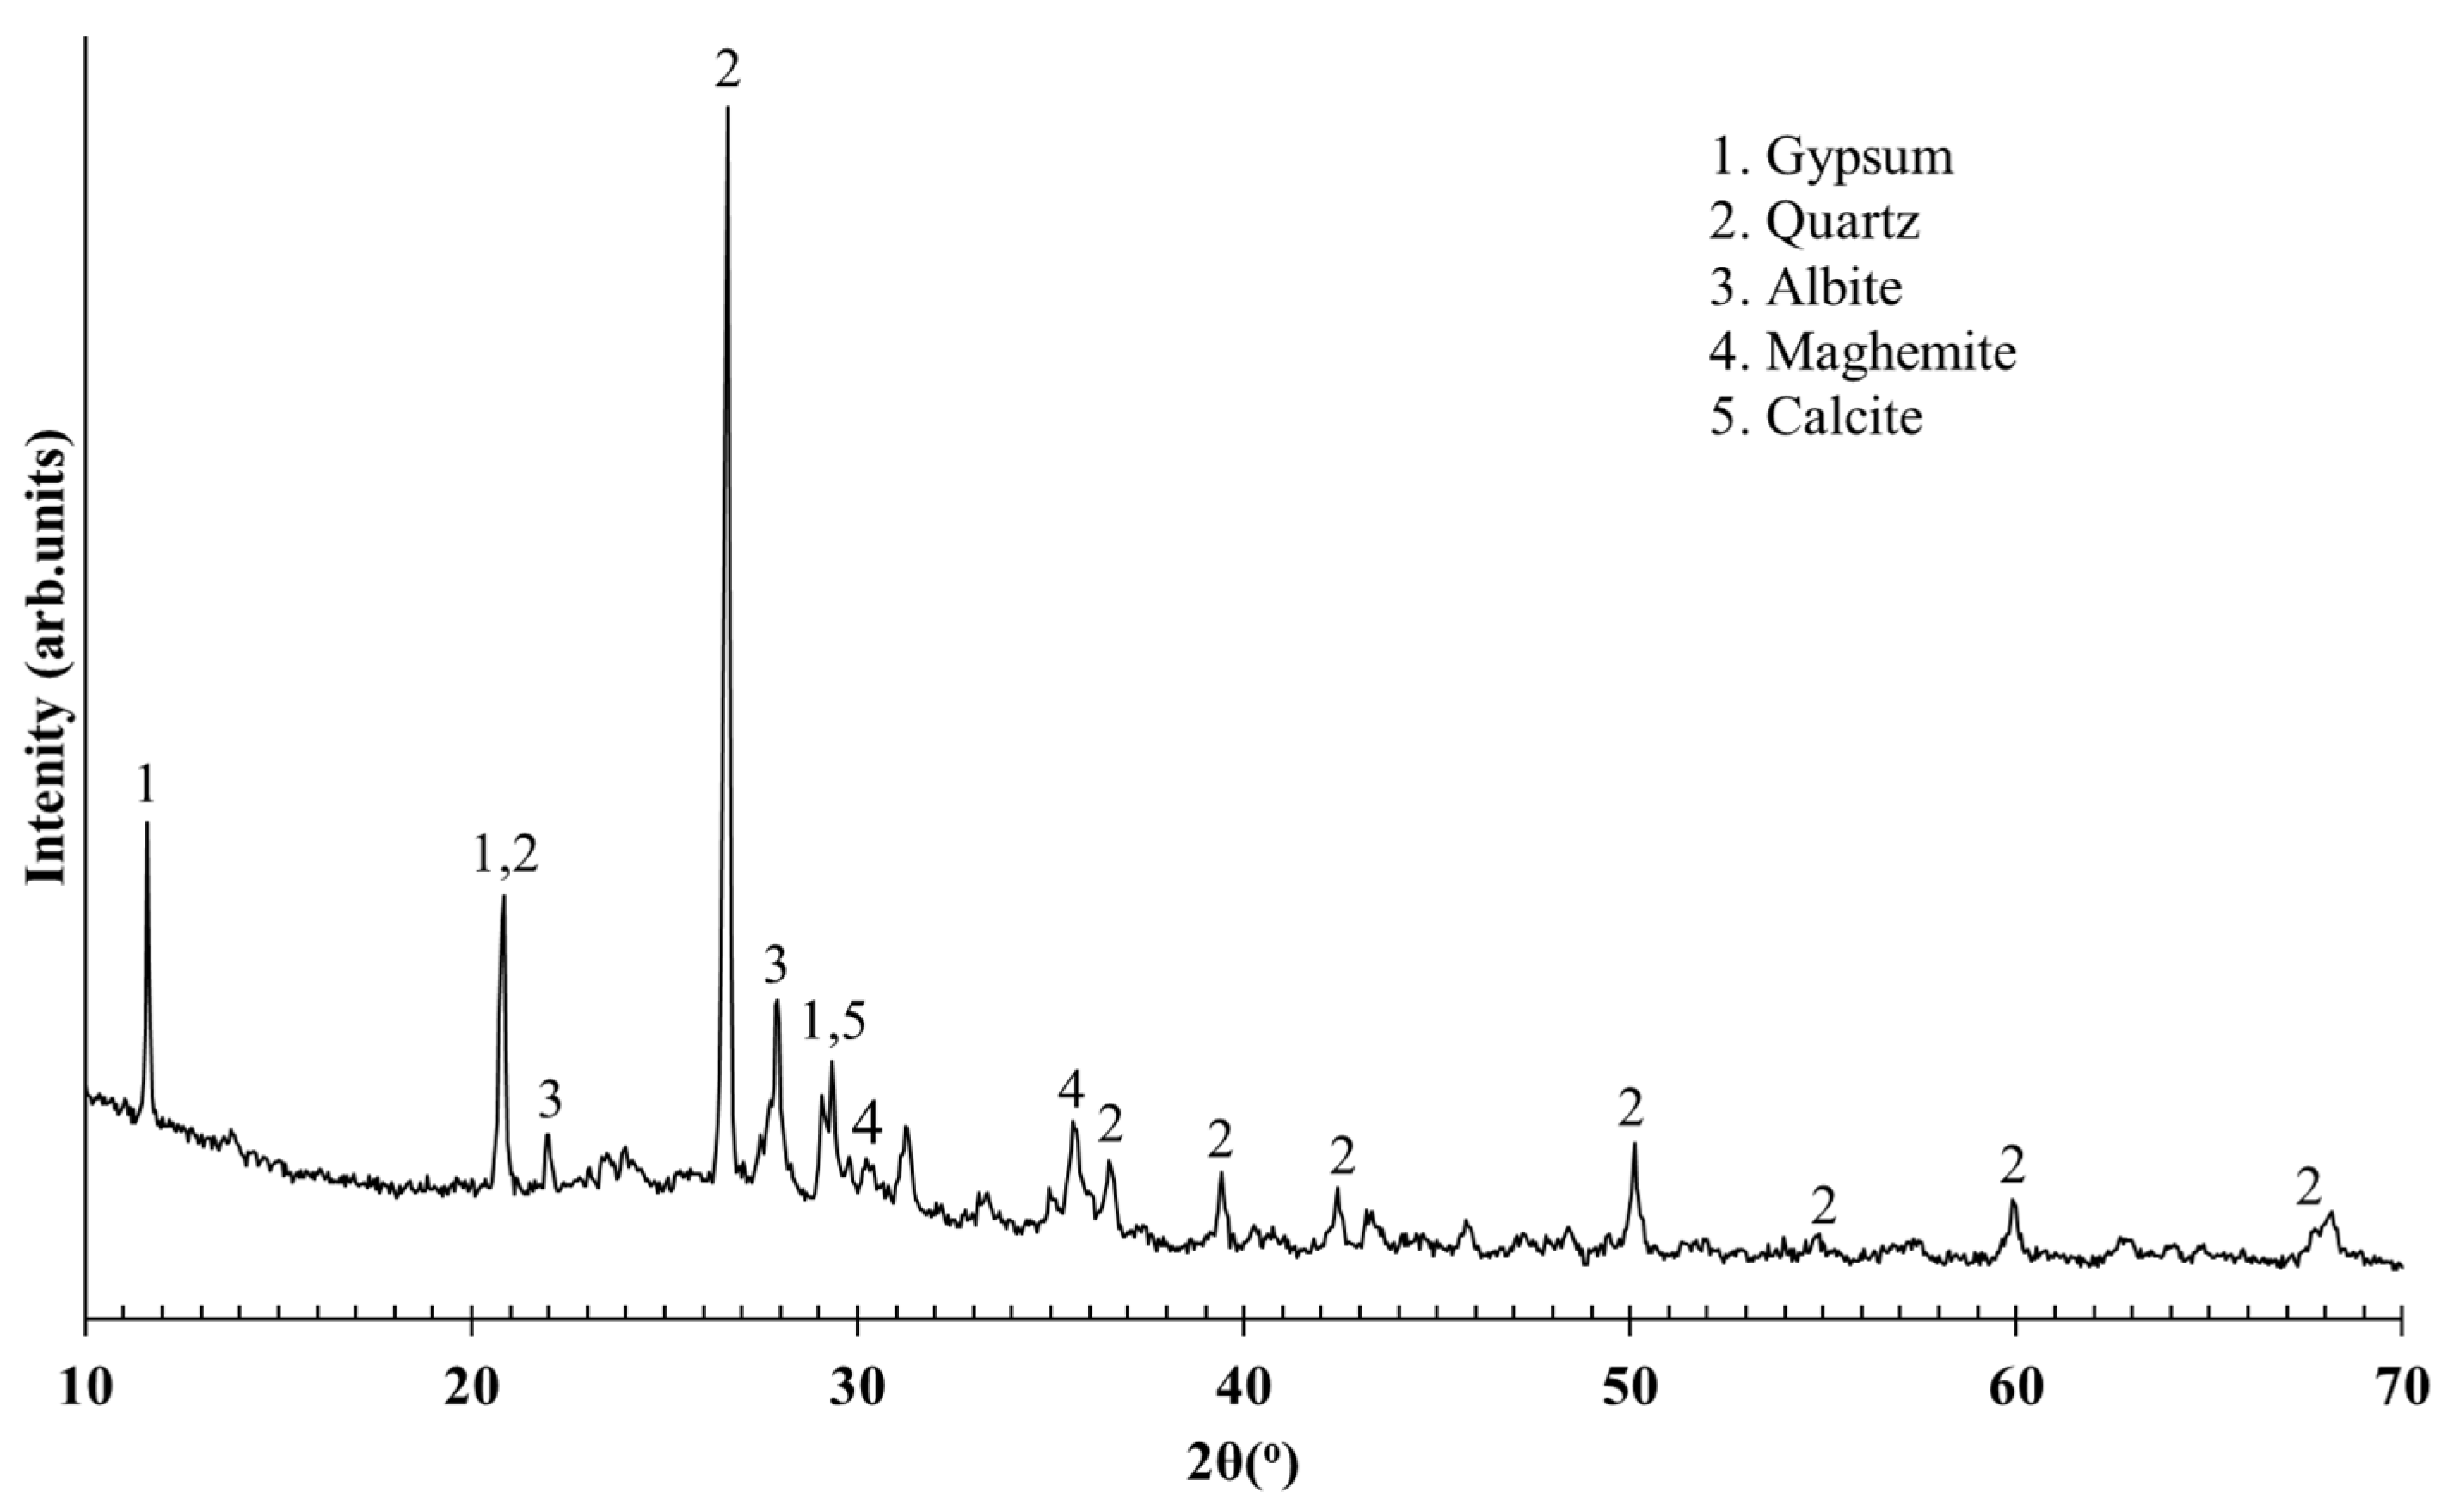
The FA came from the power plant of PPC S.A. Hellas in Megalopolis, Greece. This material can be classified as Type F according to ASTM C618. The chemical composition of FA is shown in
Table 1, while the mineralogical analysis by XRD (D8 Advance Twin, Bruker, Billerica, MA USA) is shown in
Figure 1. The density of FA was measured according to ASTM C188 and found at approximately 2500 kg/m
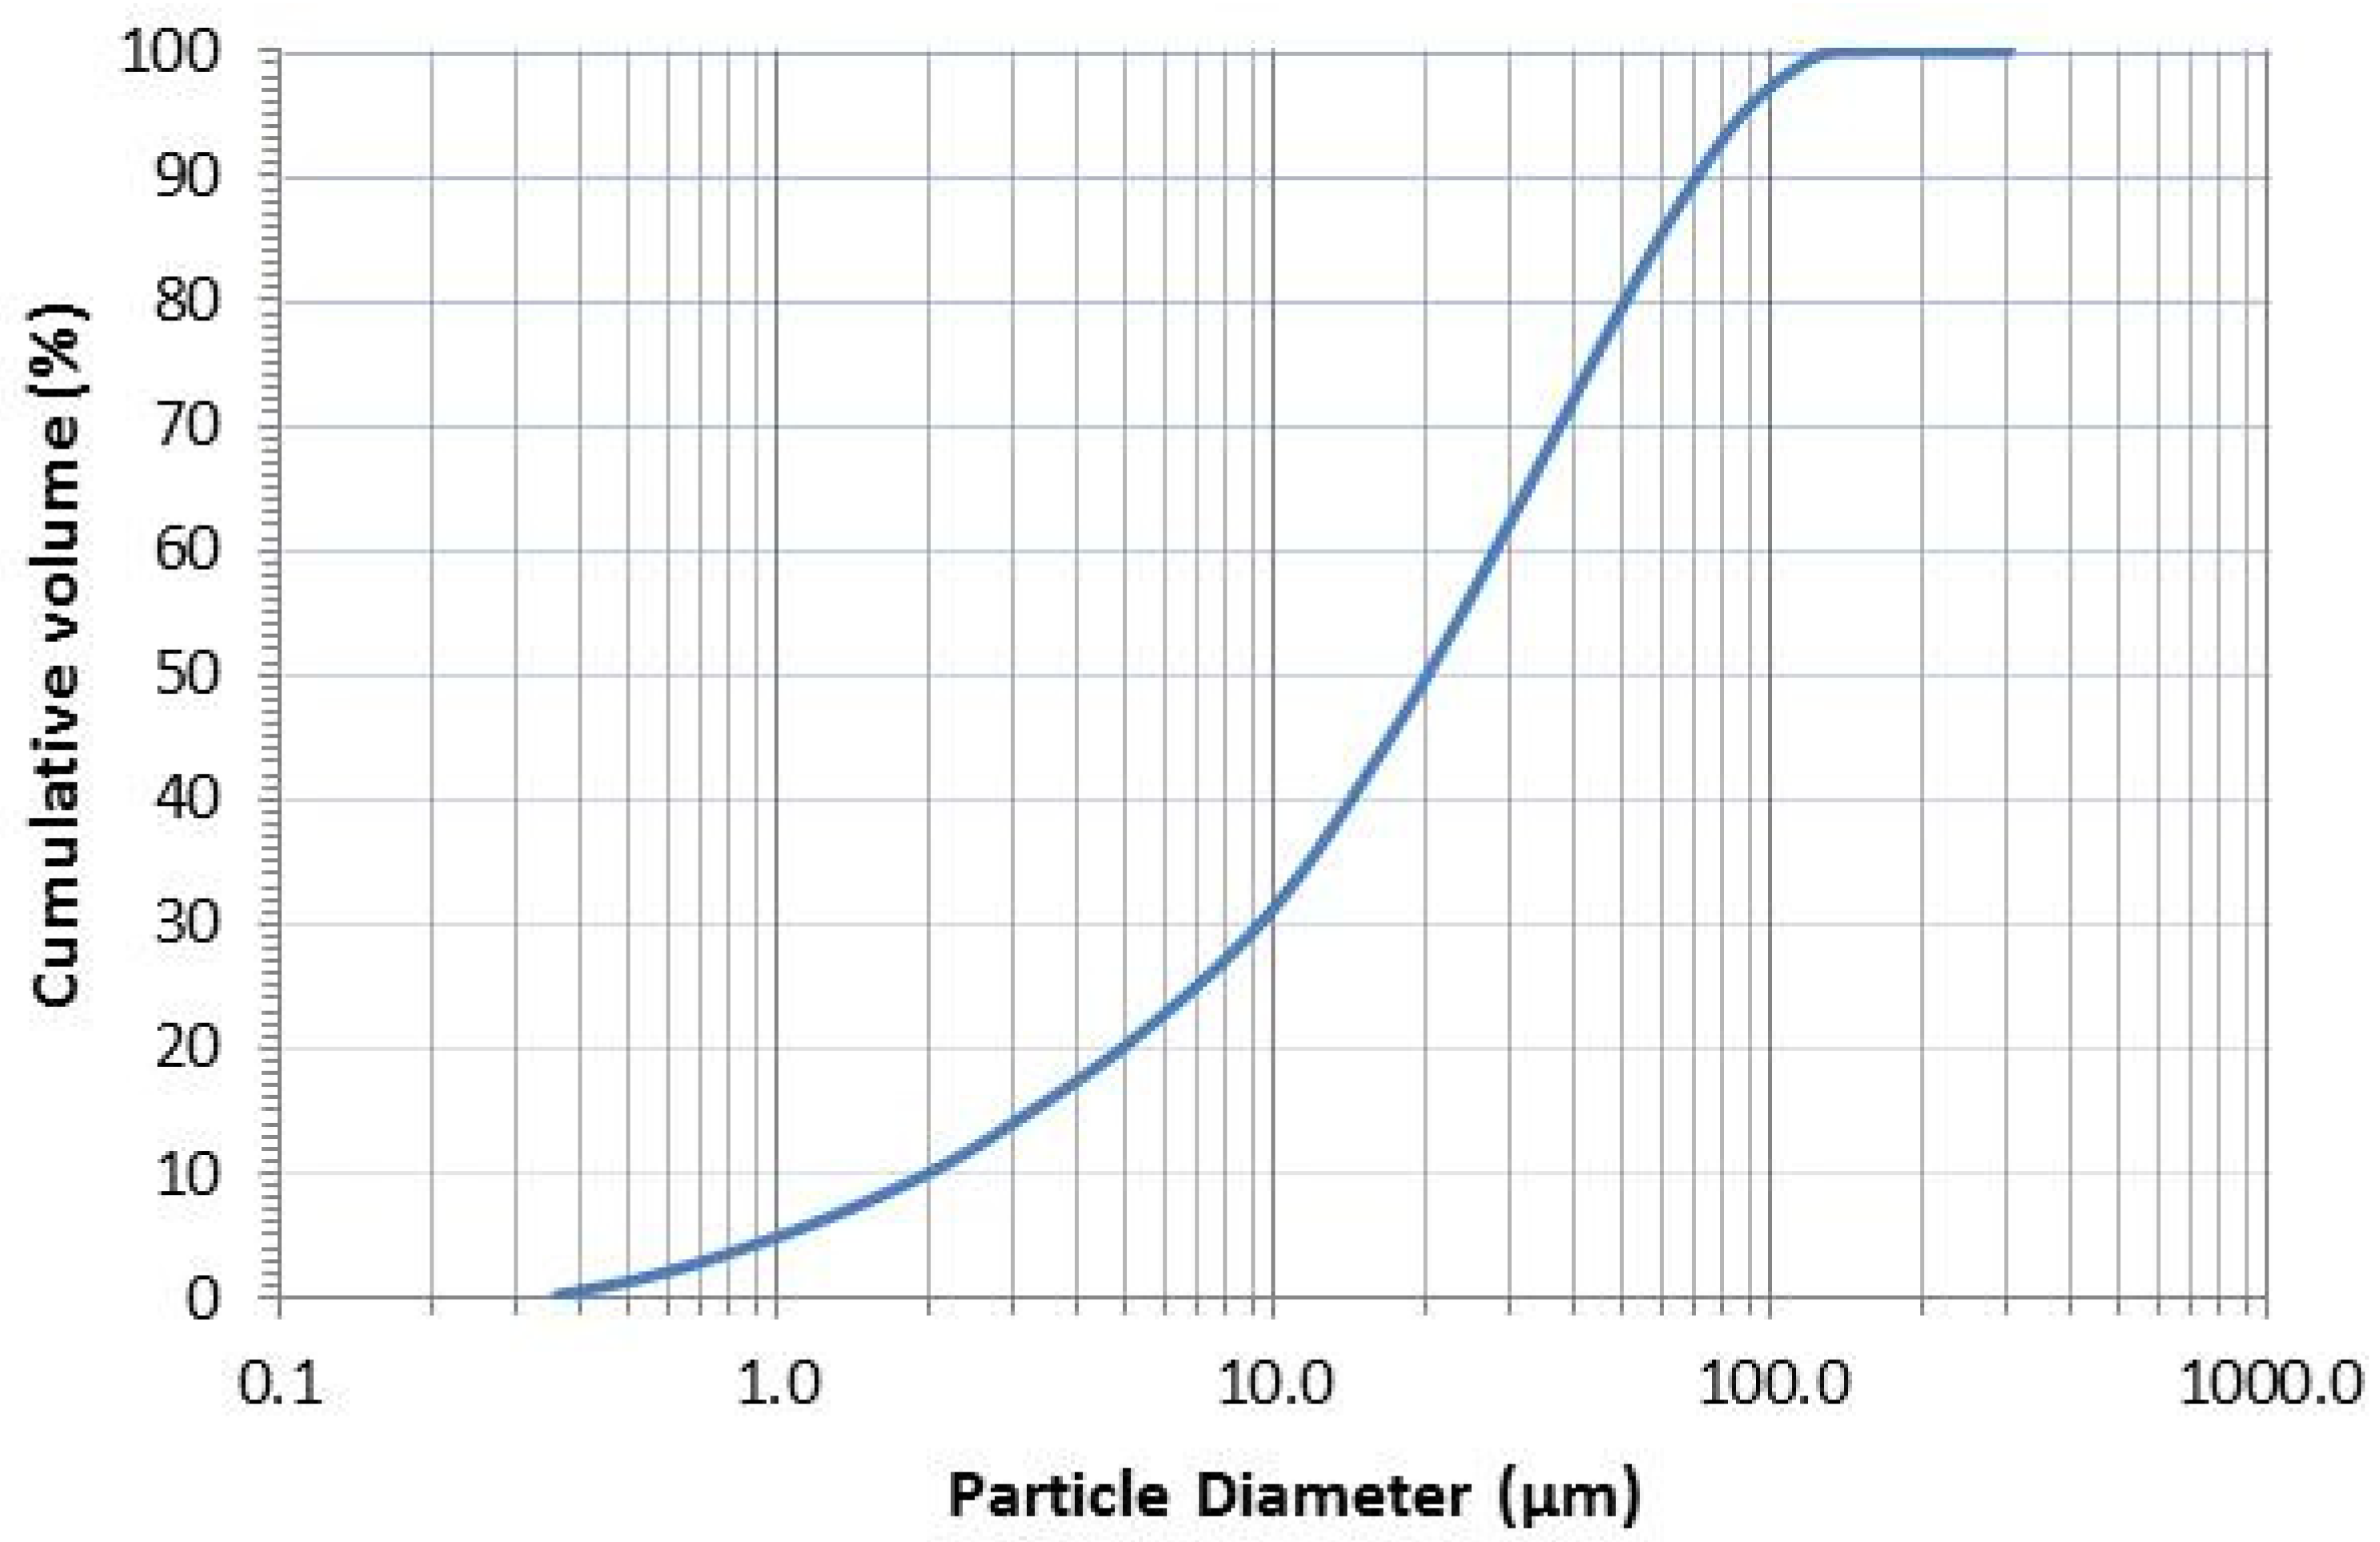
3. The particle size of FA must be less than 100 μm to allow the activation solution to penetrate the material core and achieve geopolymerization [
16,
18]. Prior to use, FA was ground in a pro-pilot plant ball mill. As shown in
Figure 2, the average particle size (d50) is 20 μm, while d90 is 70 μm (equipment: Mastersizer Micro, Malvern Panalytical, Malvern, UK).
It is well known that an activation solution has to be used in order to provide the alkaline environment that is necessary for the activation of the geopolymerization reactions [
7,
9,
14,
19,
20,
21,
22,
23]. The activation solution used contains commercial sodium hydroxide (purity ≥ 98.0%) and commercial water silica solution (water glass, water content: 63.35%). The activation solution was stirred at 500 rpm for 1 h to homogenize.
Two different types of Portland cement, CEM II/B-M (W-L) 32.5 R and CEM II/B-M (P-W-L) 42.5 R, were used for the production of CC. A superplasticizer (Viscoflow 700, Sika Hellas, Athens, Greece) was used in order to achieve the required workability of CC.
Calcareous aggregates with a maximum size of 16 mm were used in all the GC and CC mixes (EN 12620).
2.2. Concrete Preparation and Curing
The composition of the GCs is shown in
Table 2. The minimum and maximum content of FA was selected based on preliminary experiments. The Si/Al and Na/Al molar ratios were defined (Si/Al = 2.90, Na/Al = 1.00) using the Taguchi method for the optimization of the geopolymer synthesis. The liquids to solids ratio (L/S) varies from 0.31 to 0.42. The mass of liquids is calculated from the mass of the added water and the mass of water contained in the water glass, minus the mass of water absorbed by the aggregates (water absorption of aggregates (
w/
w): coarse 0.54%; fine 0.44%). The mass of the solids (S) includes the mass of fly ash and the mass of dissolved solids in the activation solution [
16,
24,
25,
26,
27]. The selection of L/S was based on preliminary tests. The target of these tests was to determine the minimum amount of water that had to be added in order to achieve satisfactory geopolymerization and accepted workability.
The composition of the GC (
Table 2) was carried out in accordance with the ACI method of concrete mix design (ACI 211.1), which is appertained to the classic cement concretes. The composition of CCs (
Table 3) was designed in order to prepare concretes having 28-days compressive strength in the same value range with GCs. All the mixtures, after mechanical mixing, were casted in three different types of molds and were mildly vibrated. The GC encoding was based on the percentage (
v/
v) of FA, while the CC encoding was based on the cement type.
The produced specimens of CC were maintained in humidity 100% and temperature 20 °C [
28], while the GC were cured at 70 °C for 48 h and then were maintained in laboratory environment until testing age [
16,
29,
30,
31].
Three types of specimens were prepared according to EN 12390-1, cubic (100 × 100 × 100 mm3), cylindrical (D = 100 mm, L = 200 mm) and prismatic (100 × 100 × 500 mm3).
2.3. Physical and Mechanical Properties Testing
The workability was measured (two tests for each mix) with two different methods: the flow table test (EN 12350-5) and the slump test (EN 12350-2).
The air content and the density of the mixes (two tests for each mix) were measured according to EN 12350-7 and EN 12350-6, respectively.
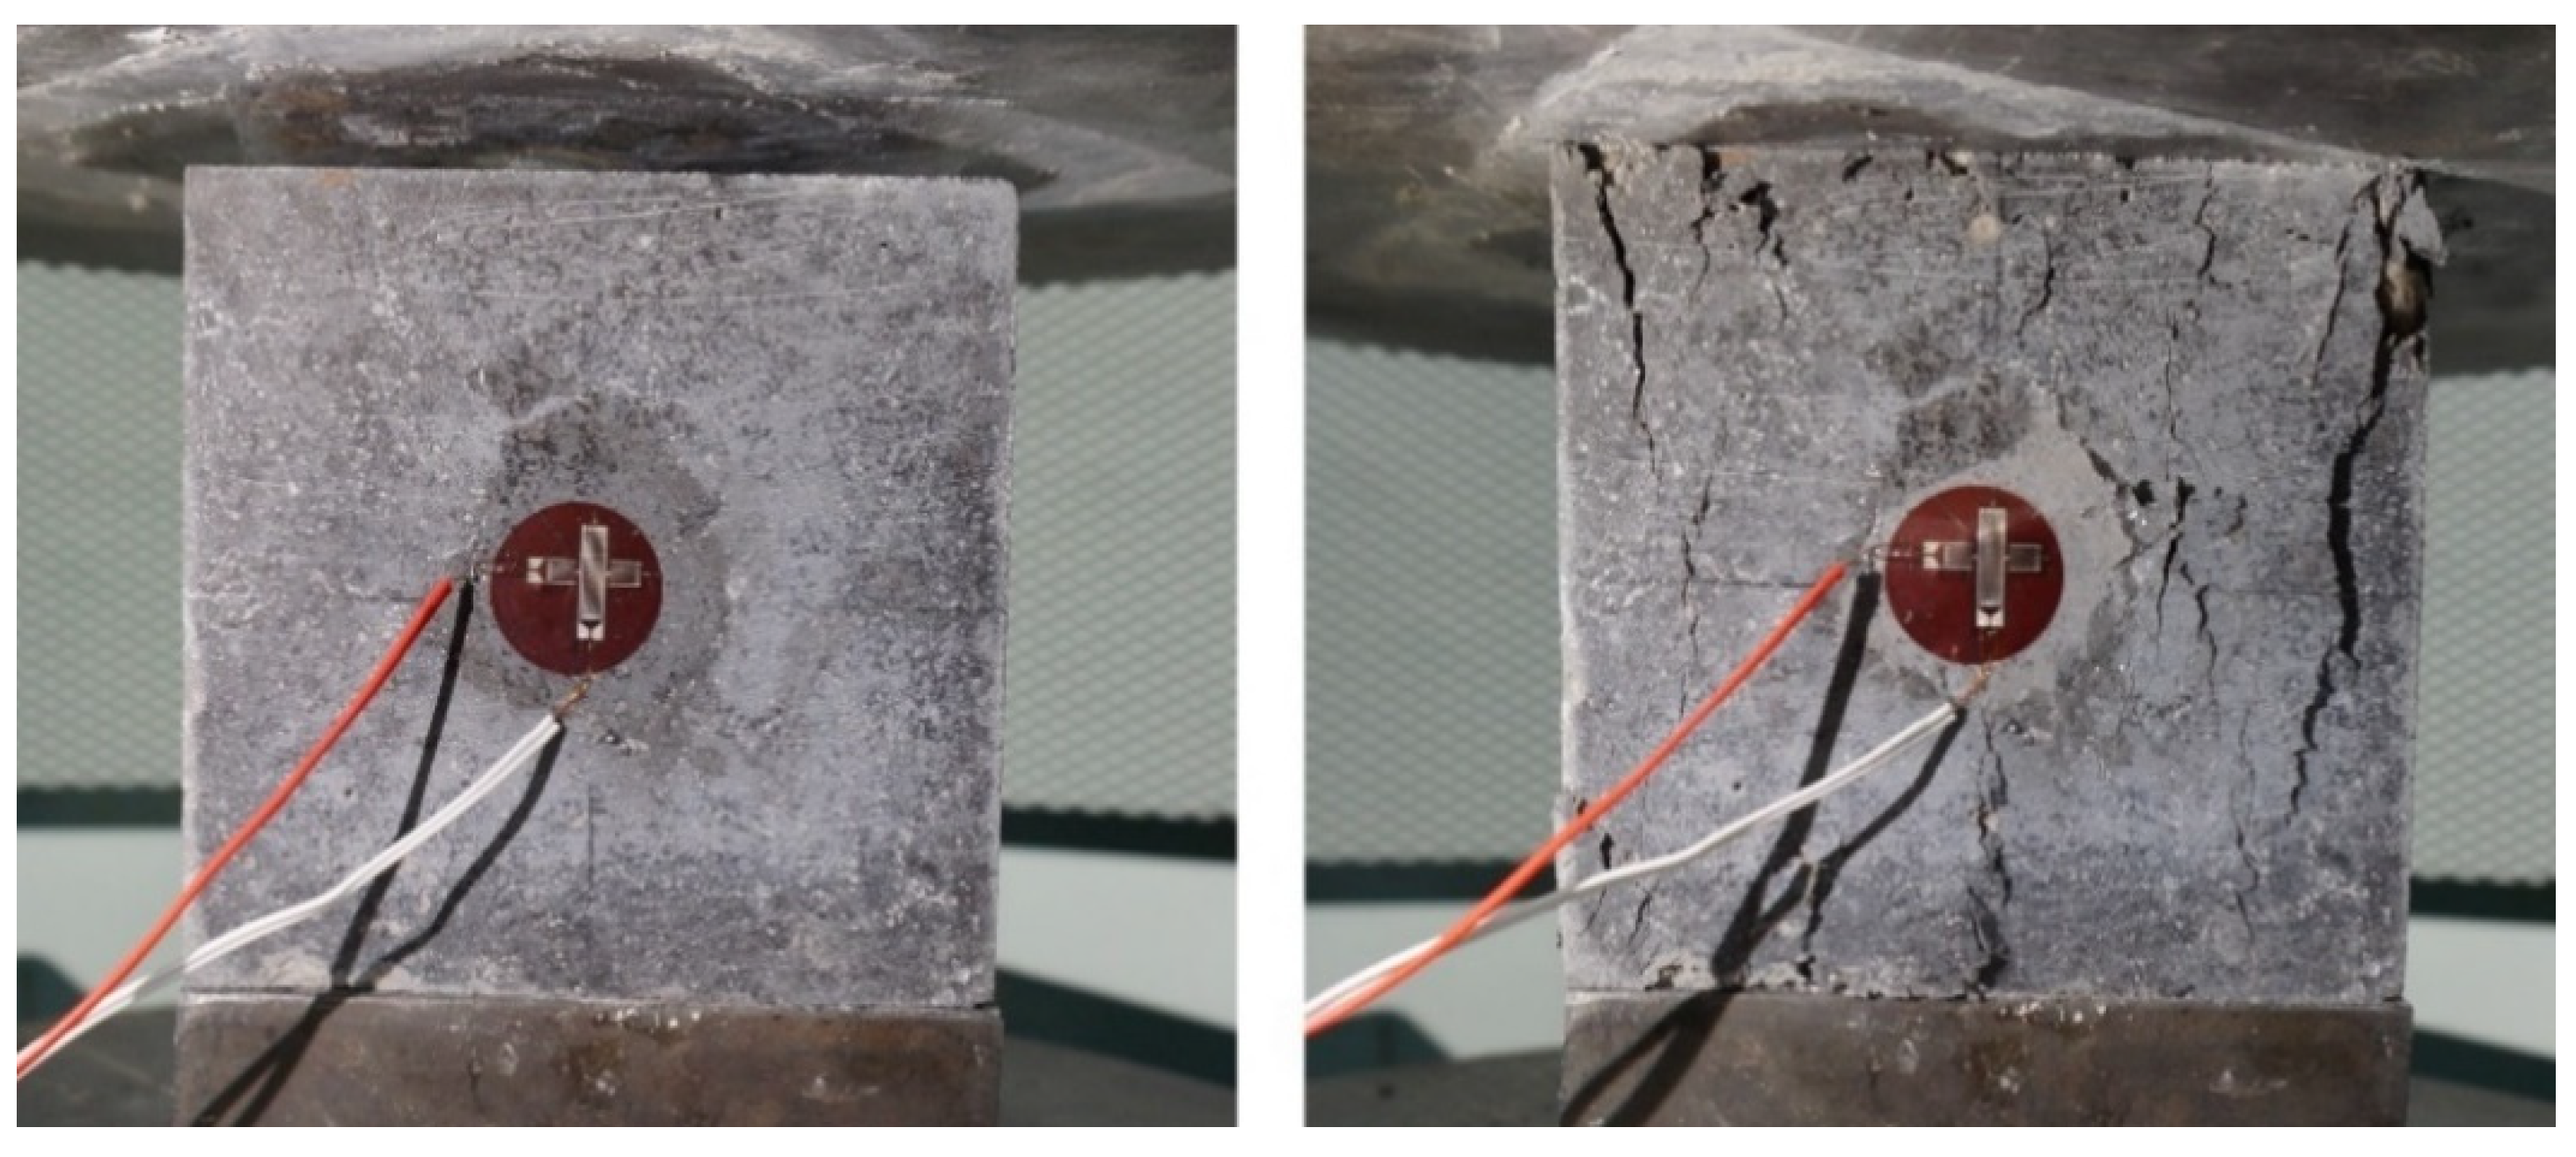
The CC and GC cubes (three specimens for each test) were tested (Avery 7112 CCG) on uniaxial compression tests (EN 12390-3) at the ages of 3, 7, 28, 90, 180, 365 and 730 days. At the age of 28 days, the modulus of elasticity (
Εcm) and the Poisson ratio were calculated with the help of a biaxial rosette strain gauge (EN 12390-13).
Ecm is an important property of concrete, used to determine the deflection of structures for serviceability requirements and in seismic analysis for deformation and drift calculations [
32,
33].
Figure 3 shows a GC sample, before and after the test.
The ultrasonic pulse velocity (UPV) test is an inexpensive in situ test method for assuring the quality of concrete placed in a structure [
34]. UPV was determined (EN 12504-4) for all the CC and GC cubic specimens (equipment: Pundit 7, Germann Instruments, Copenhagen, Denmark - three cubes for each measurement) just before the compression test.
The cylindrical specimens were tested (two specimens for each test) on splitting test (EN 12390-6) at the age of 28 days.
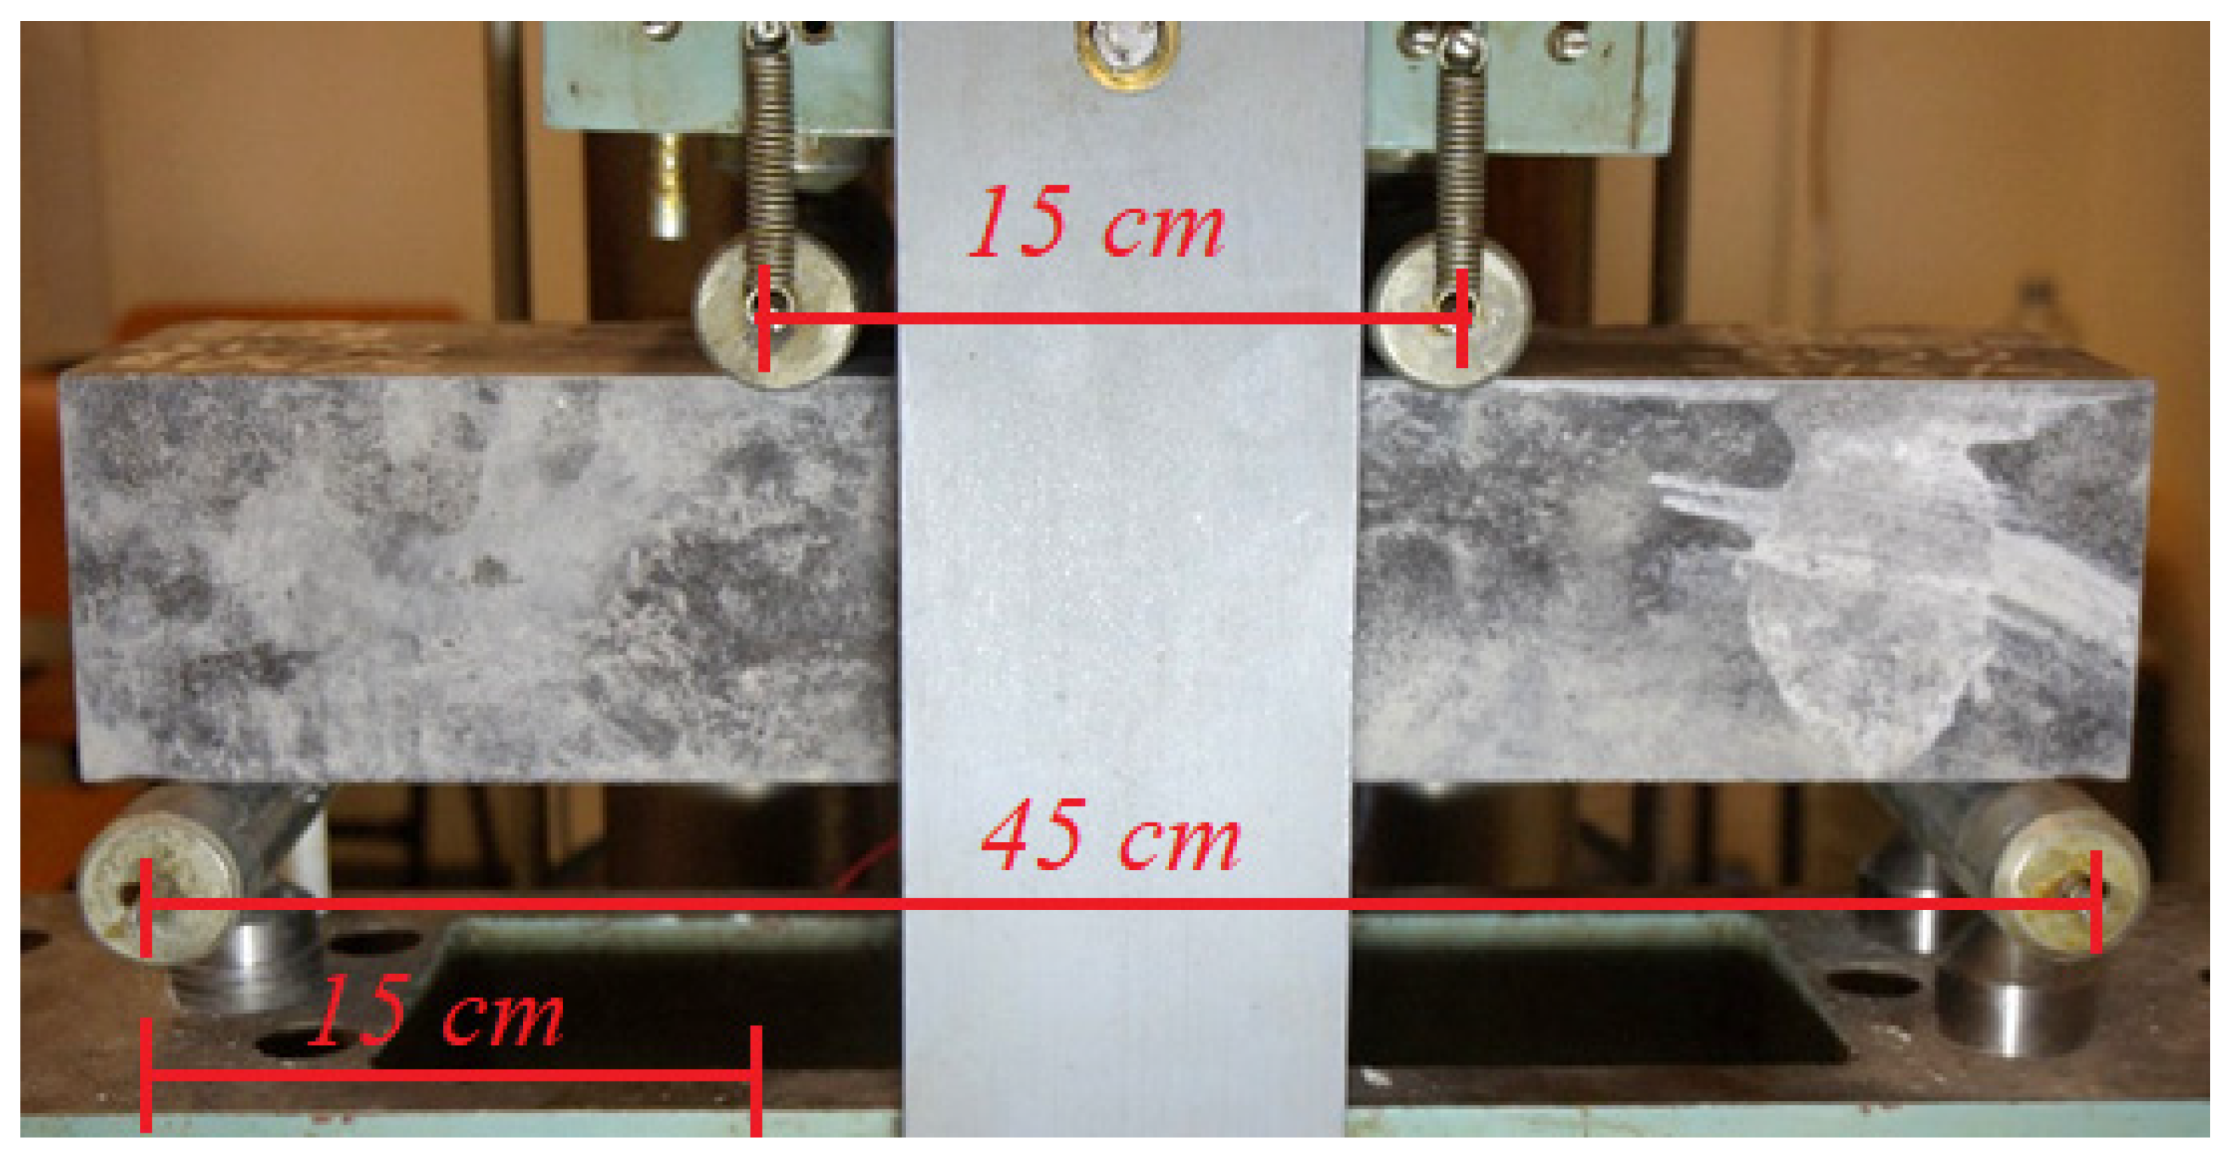
The prismatic specimens (two beams for each concrete) were tested on the two-point bending test (EN 12390-5) at the age of 28 days (
Figure 4). During the test, the mid-span deflection was measured. At the bottom-center of all beams, a strain gauge was attached to measure the tensile strain [
35,
36].
3. Results and Discussion
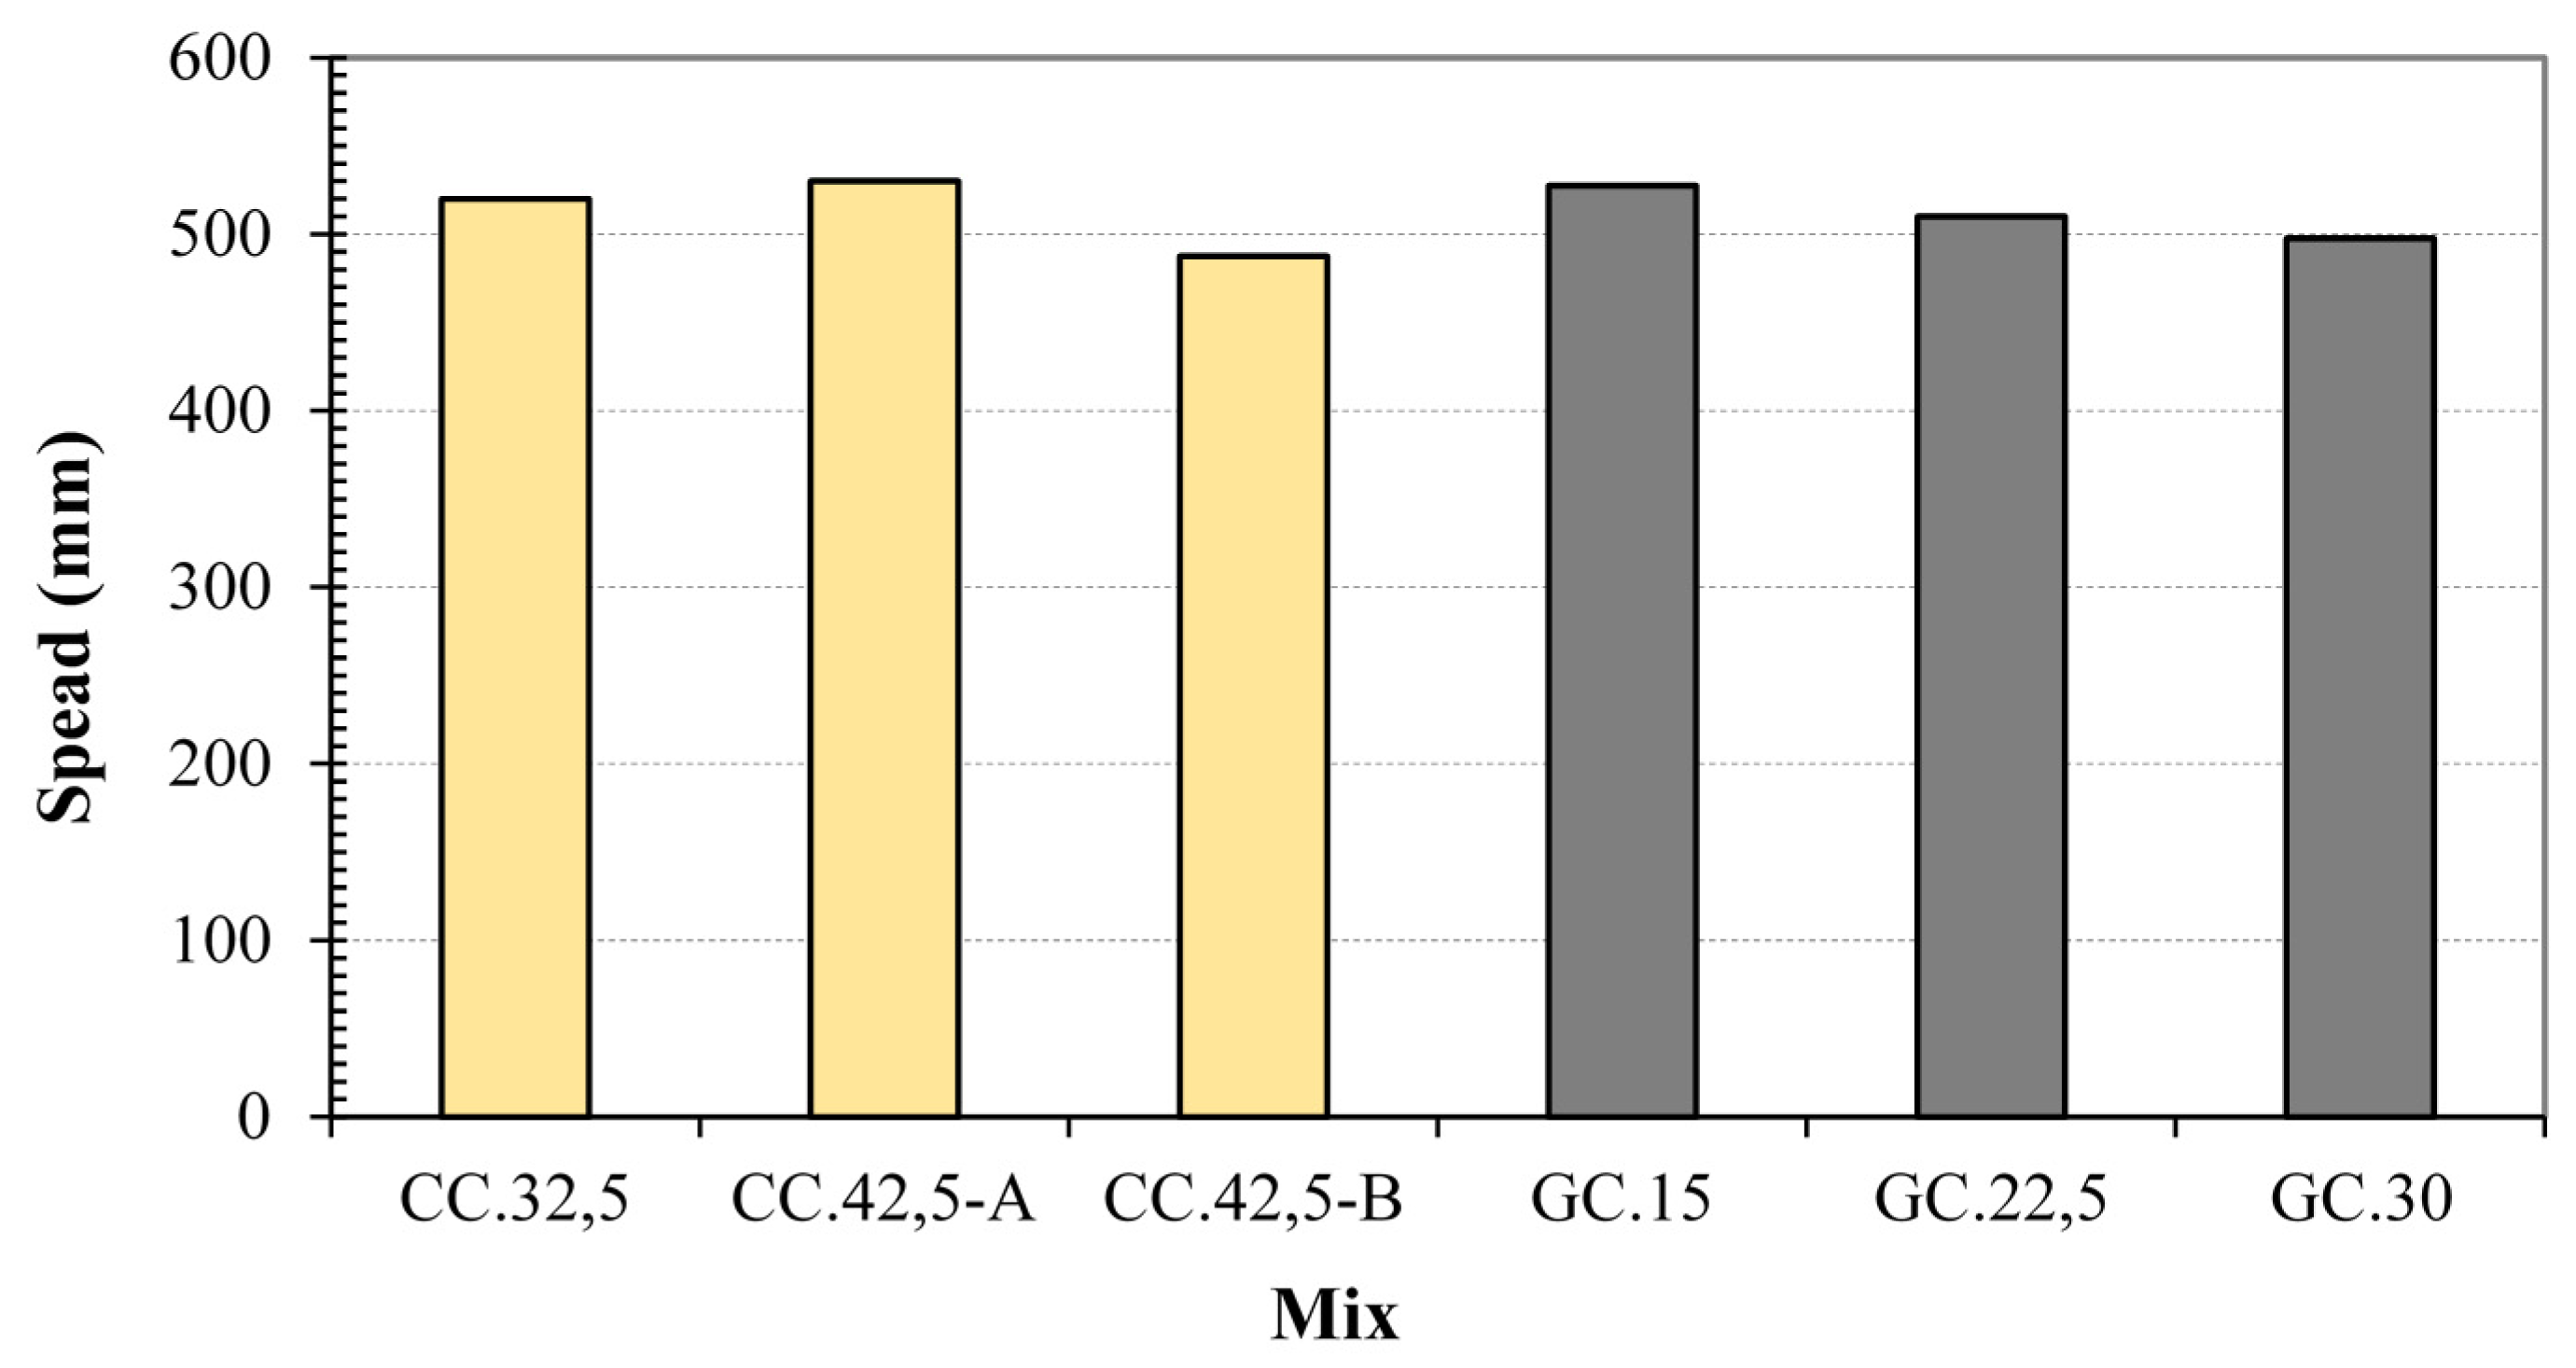
3.1. Workability
In the concrete mix design, it was assumed, based on preliminary experiments, that GC and CC would belong to flow class F4 [
28].
Figure 5 shows that this assumption was right because the range of the class F4 as stated in EN 206-1 is between 490 and 550 mm.
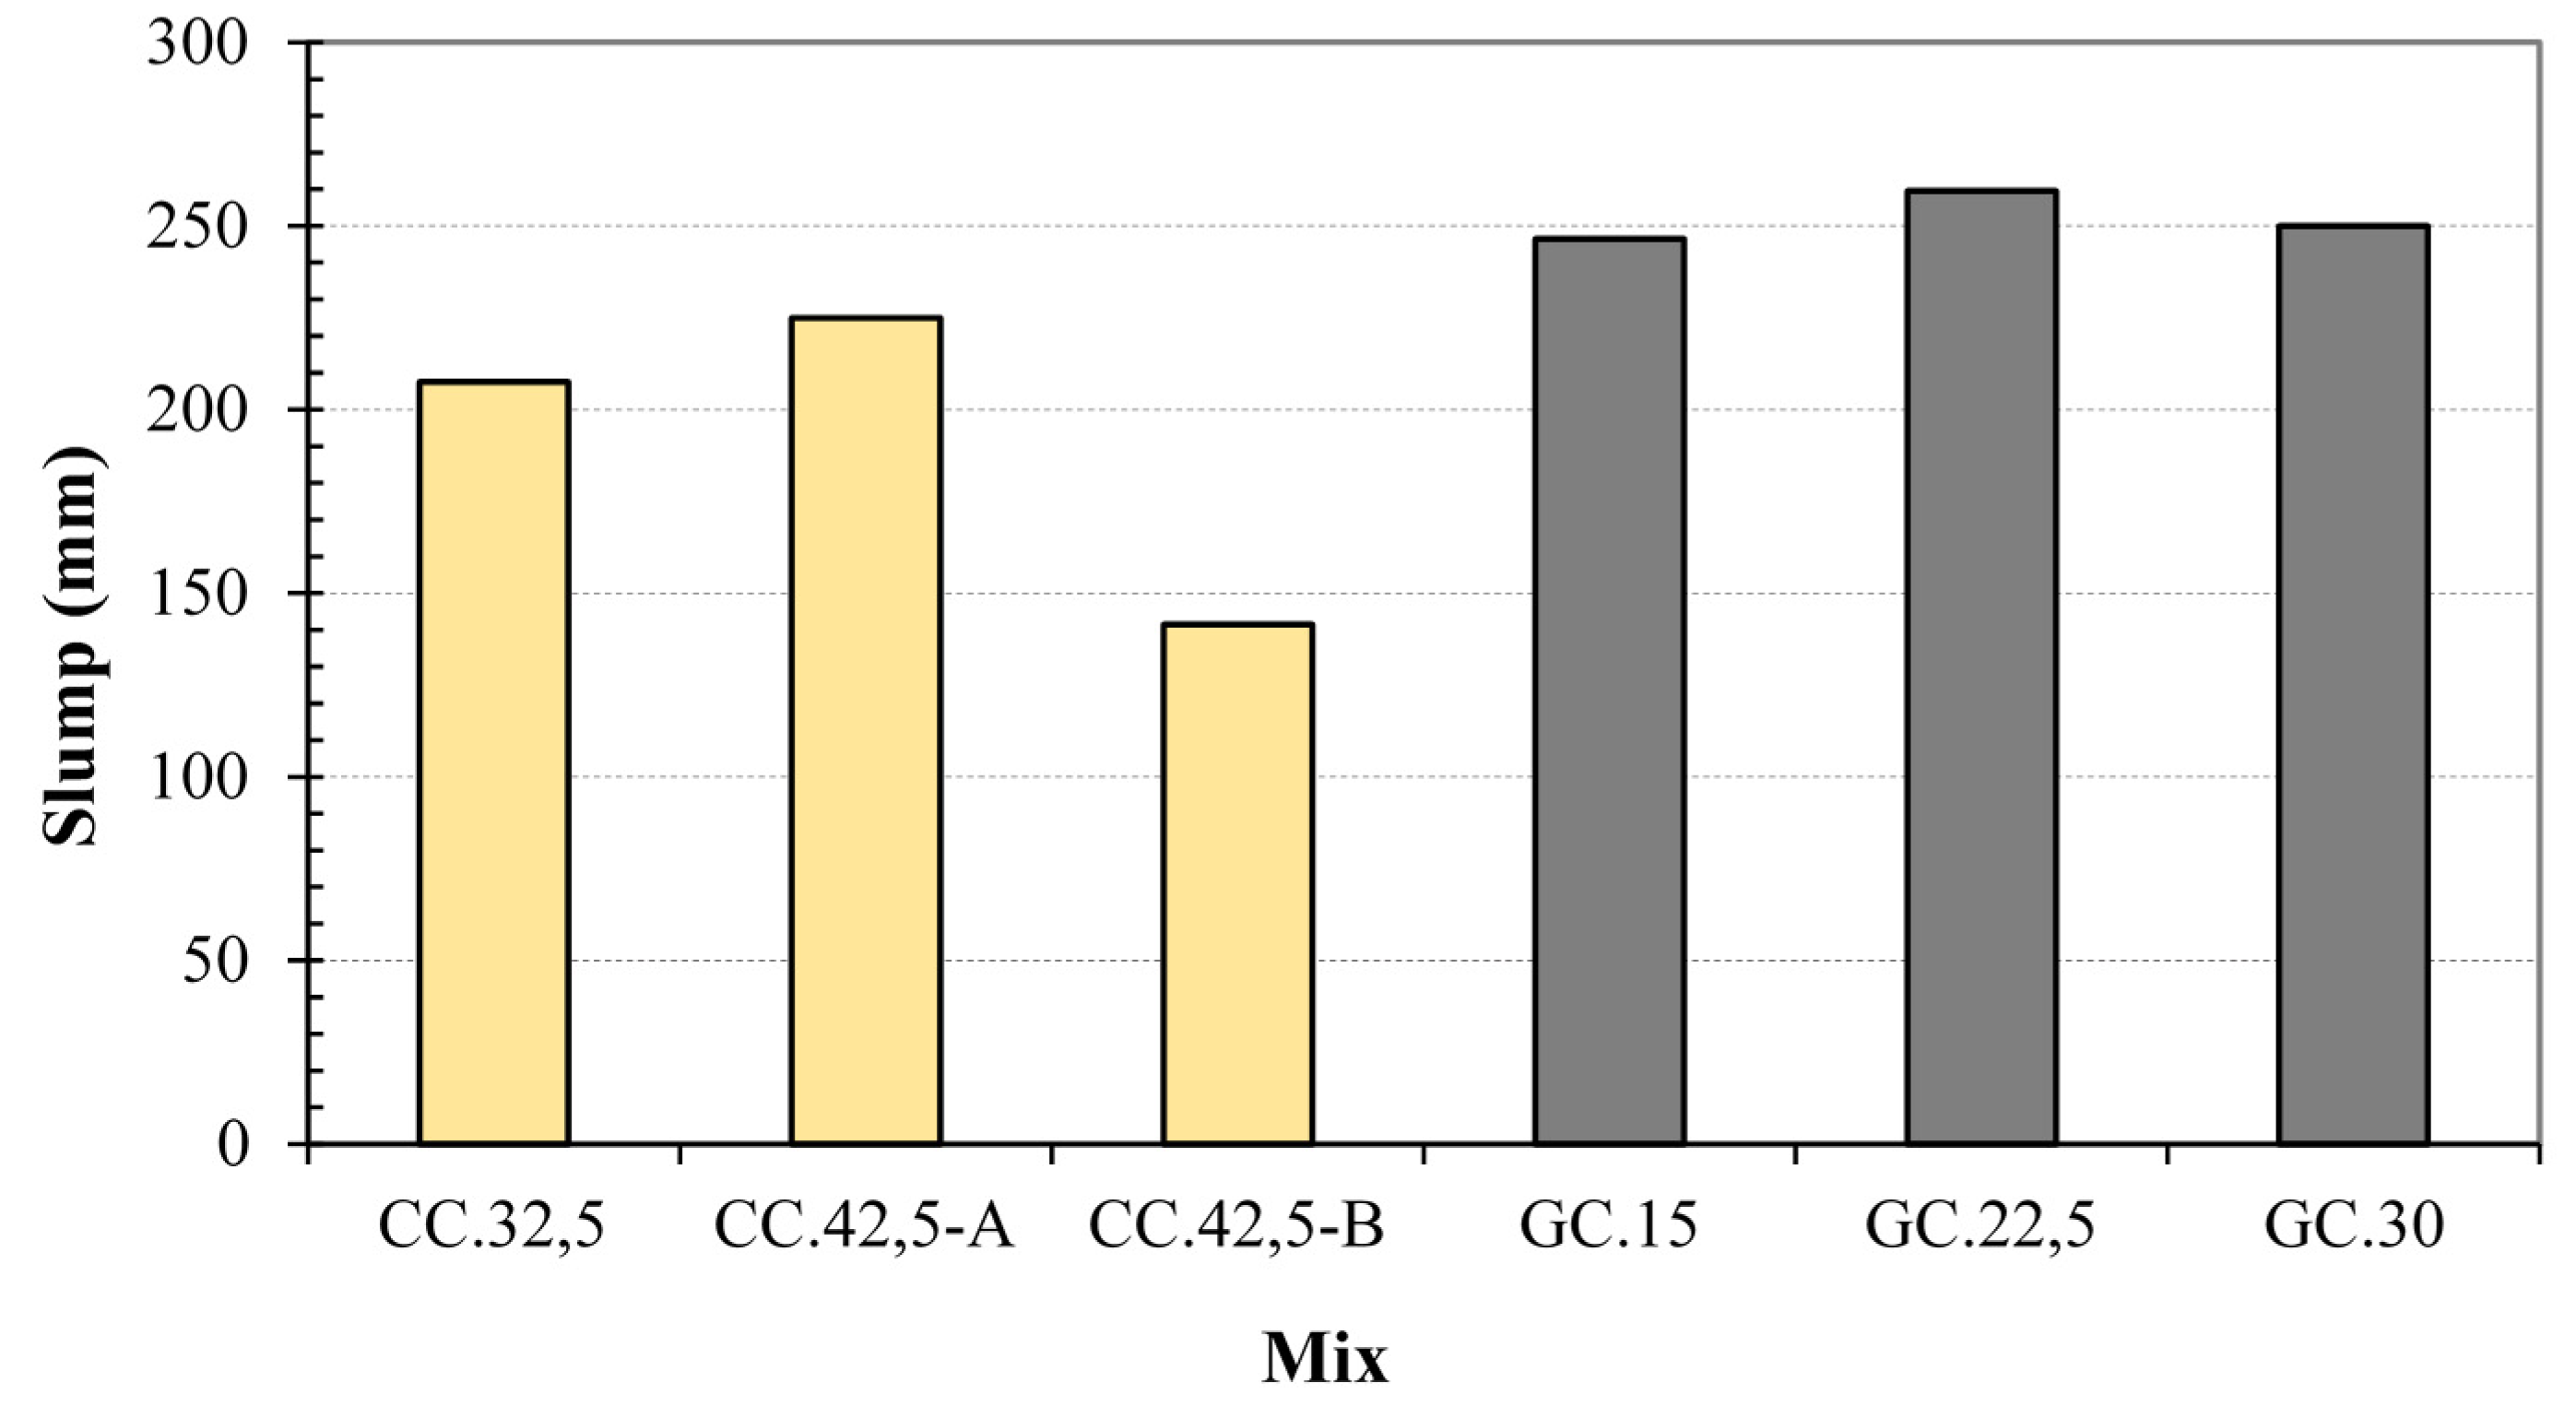
Figure 6 shows the results from the slump test. According to EN 206-1, CC.42,5-B belongs to class S3, CC.32,5 to S4 and the rest mixes to S5. All the GCs are classified in the same workability class (flow: F4, slump: S5). There are some differences in the classification of CC with the two methods and this is noted in the literature [
37,
38,
39].
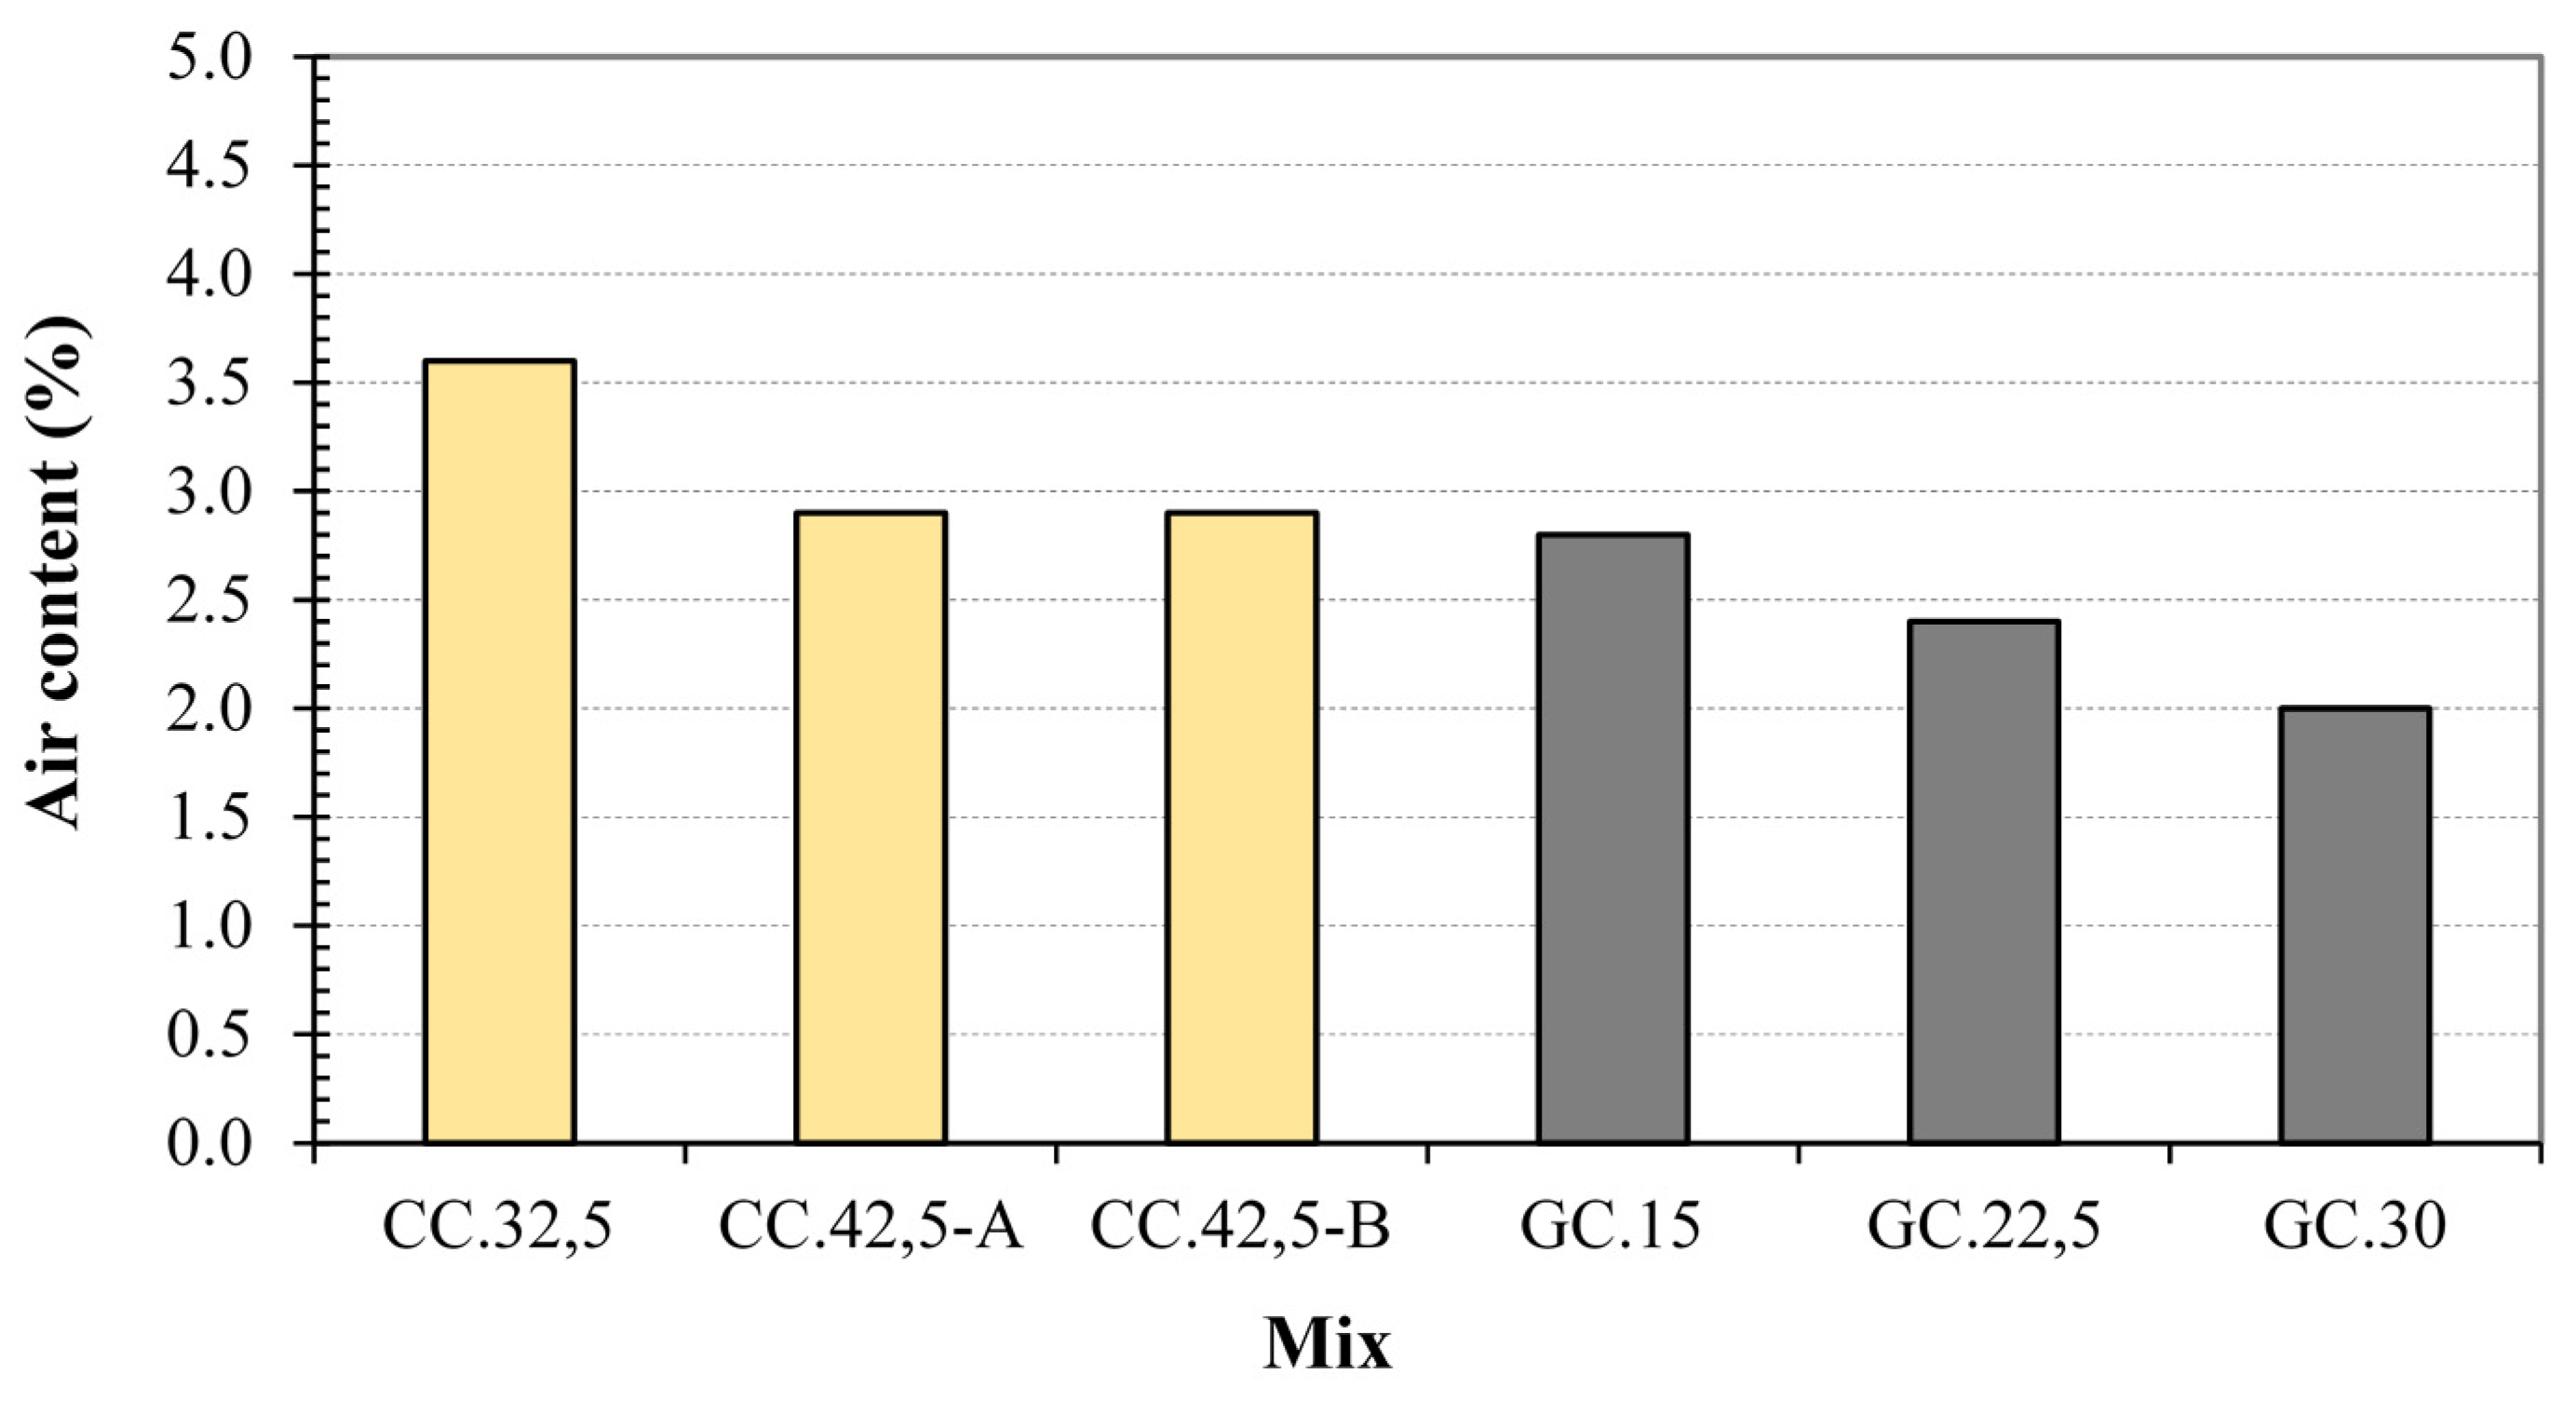
3.2. Air Content and Density
The air content of the mixes is shown in
Figure 7. The air content of CC was in the required range 0–4% [
28] despite the use of superplasticizer [
35,
36]. The air content of GC was lower than that of CC and it decreases as the FA content increases.
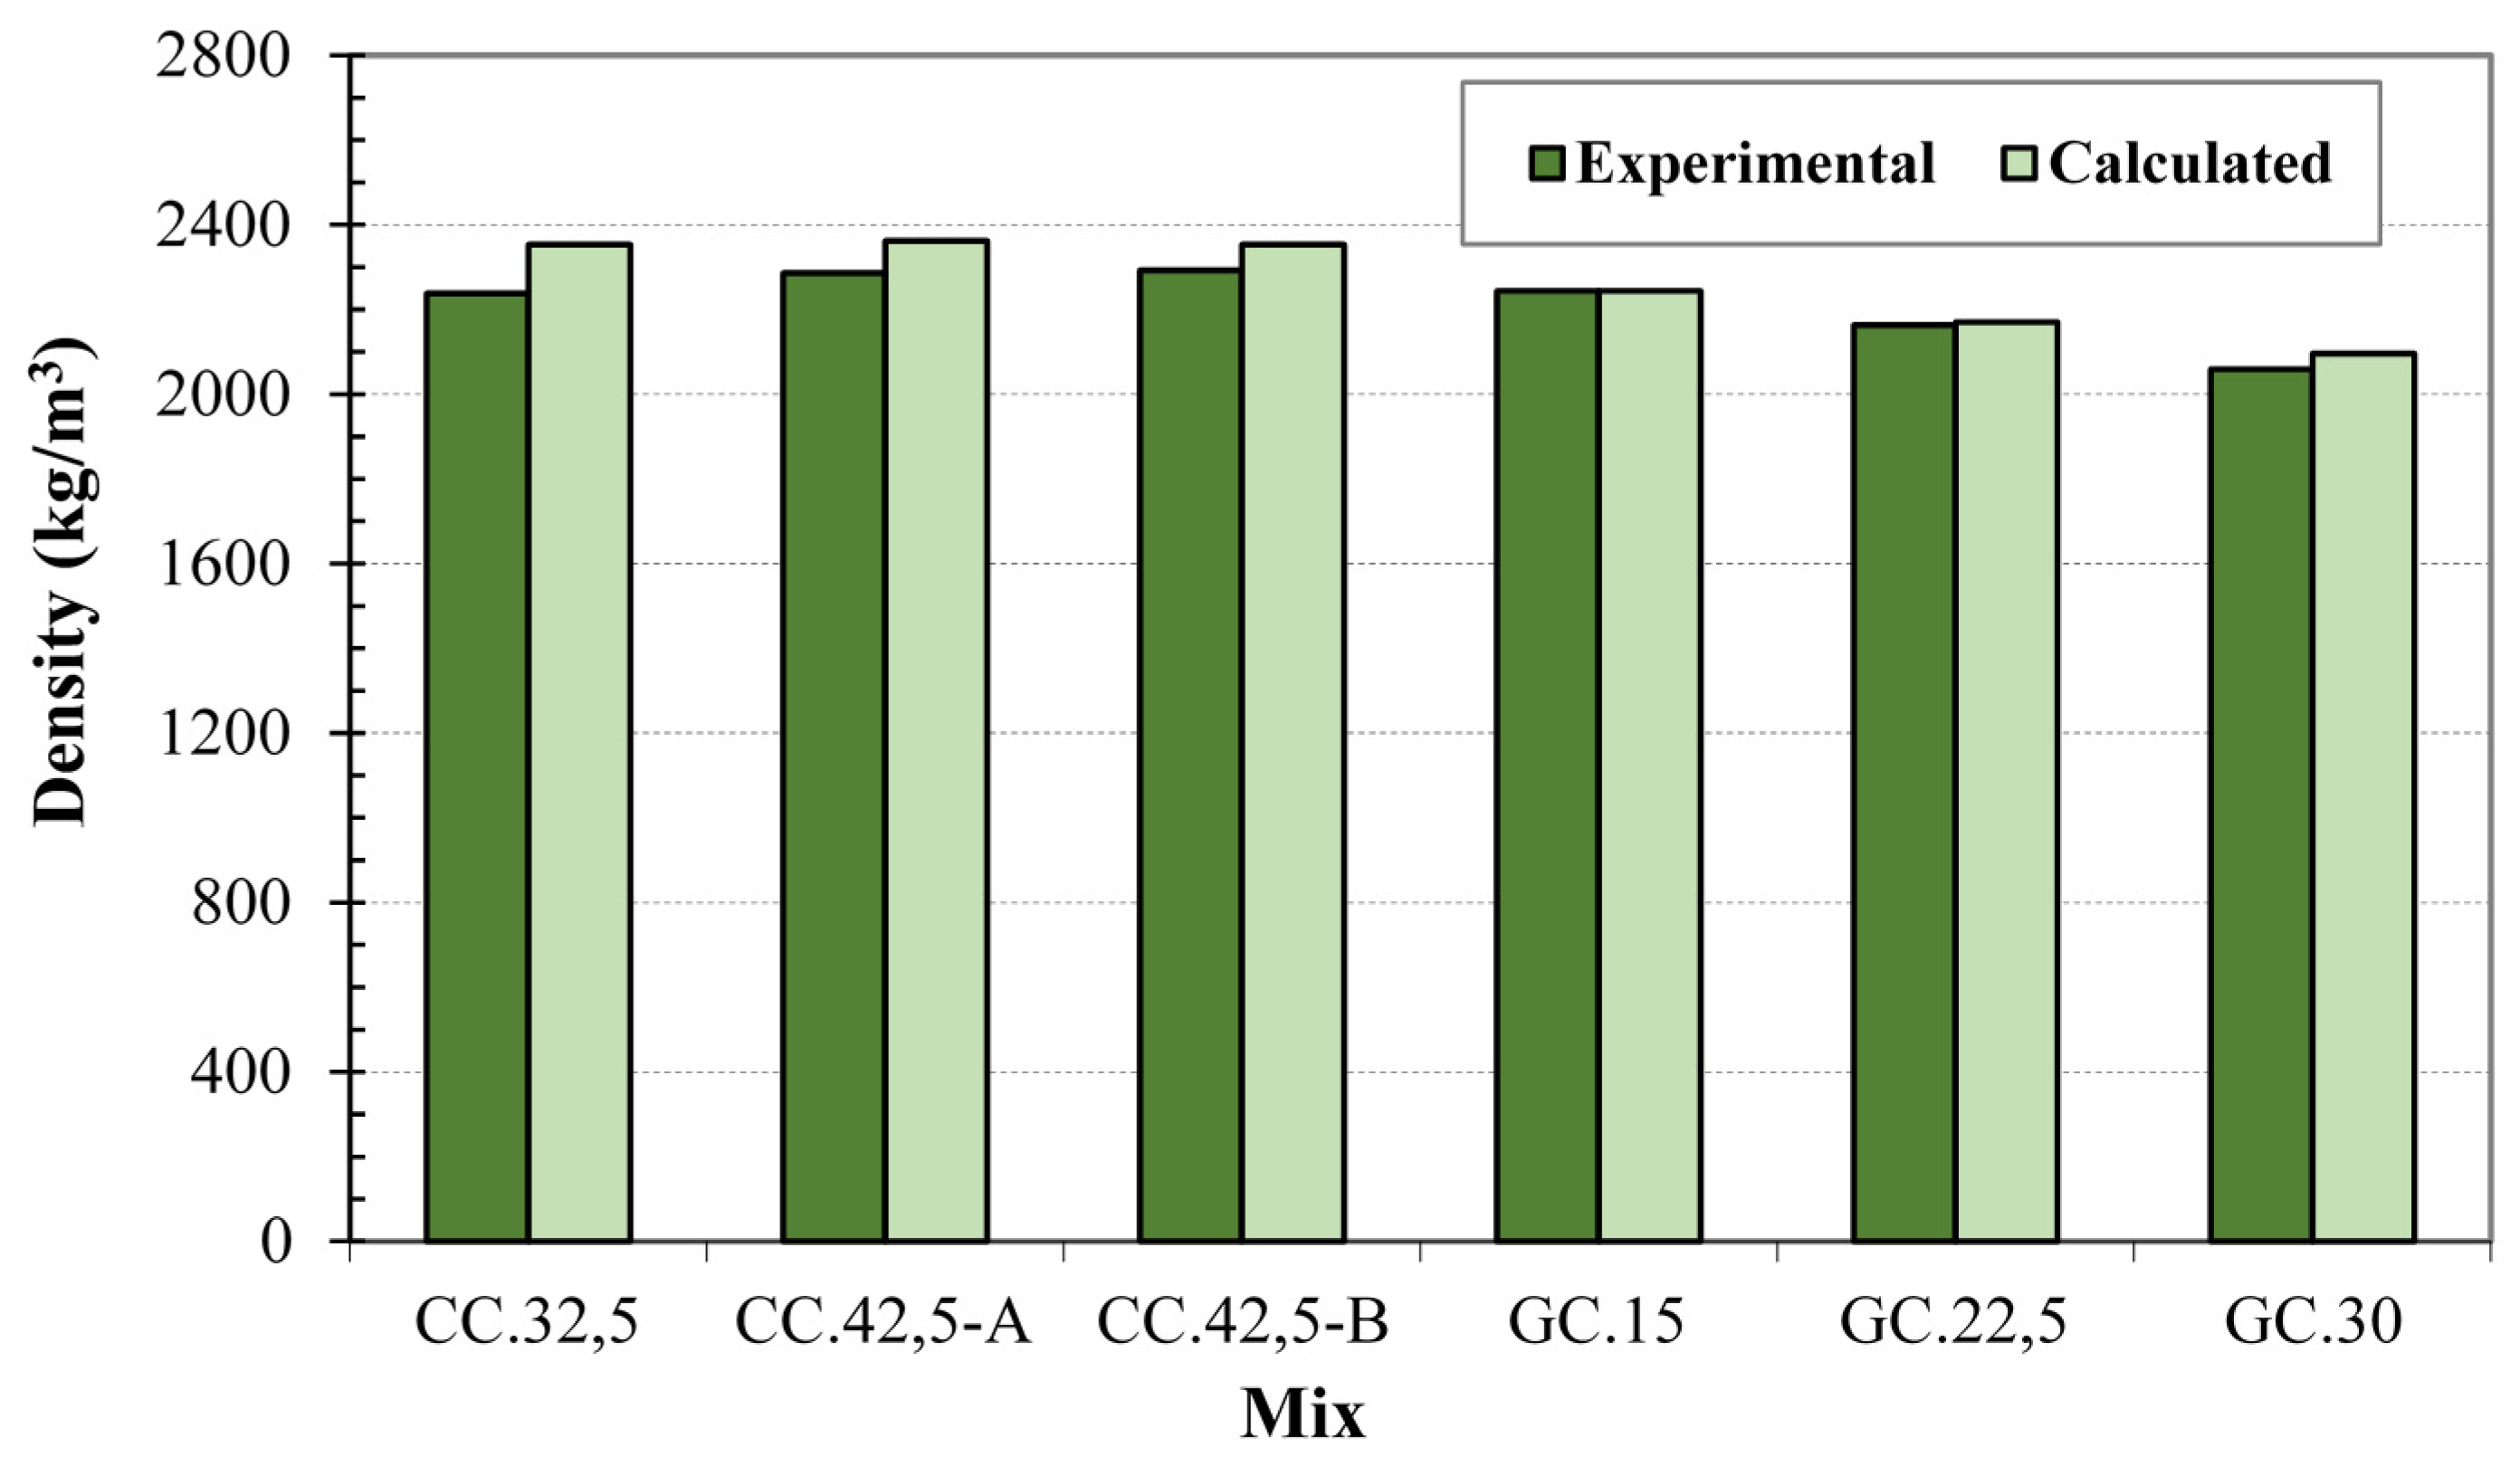
The experimental (EN 12350-6) and the calculated (ACI 211.1) density of CC and GC is shown in
Figure 8. The experimental value was very close to the calculated one in all mixes. The density of GC decreases as the FA content increases, in agreement with the literature [
33,
40].
3.3. Compressive Strength, Modulus of Elasticity and Poisson Ratio
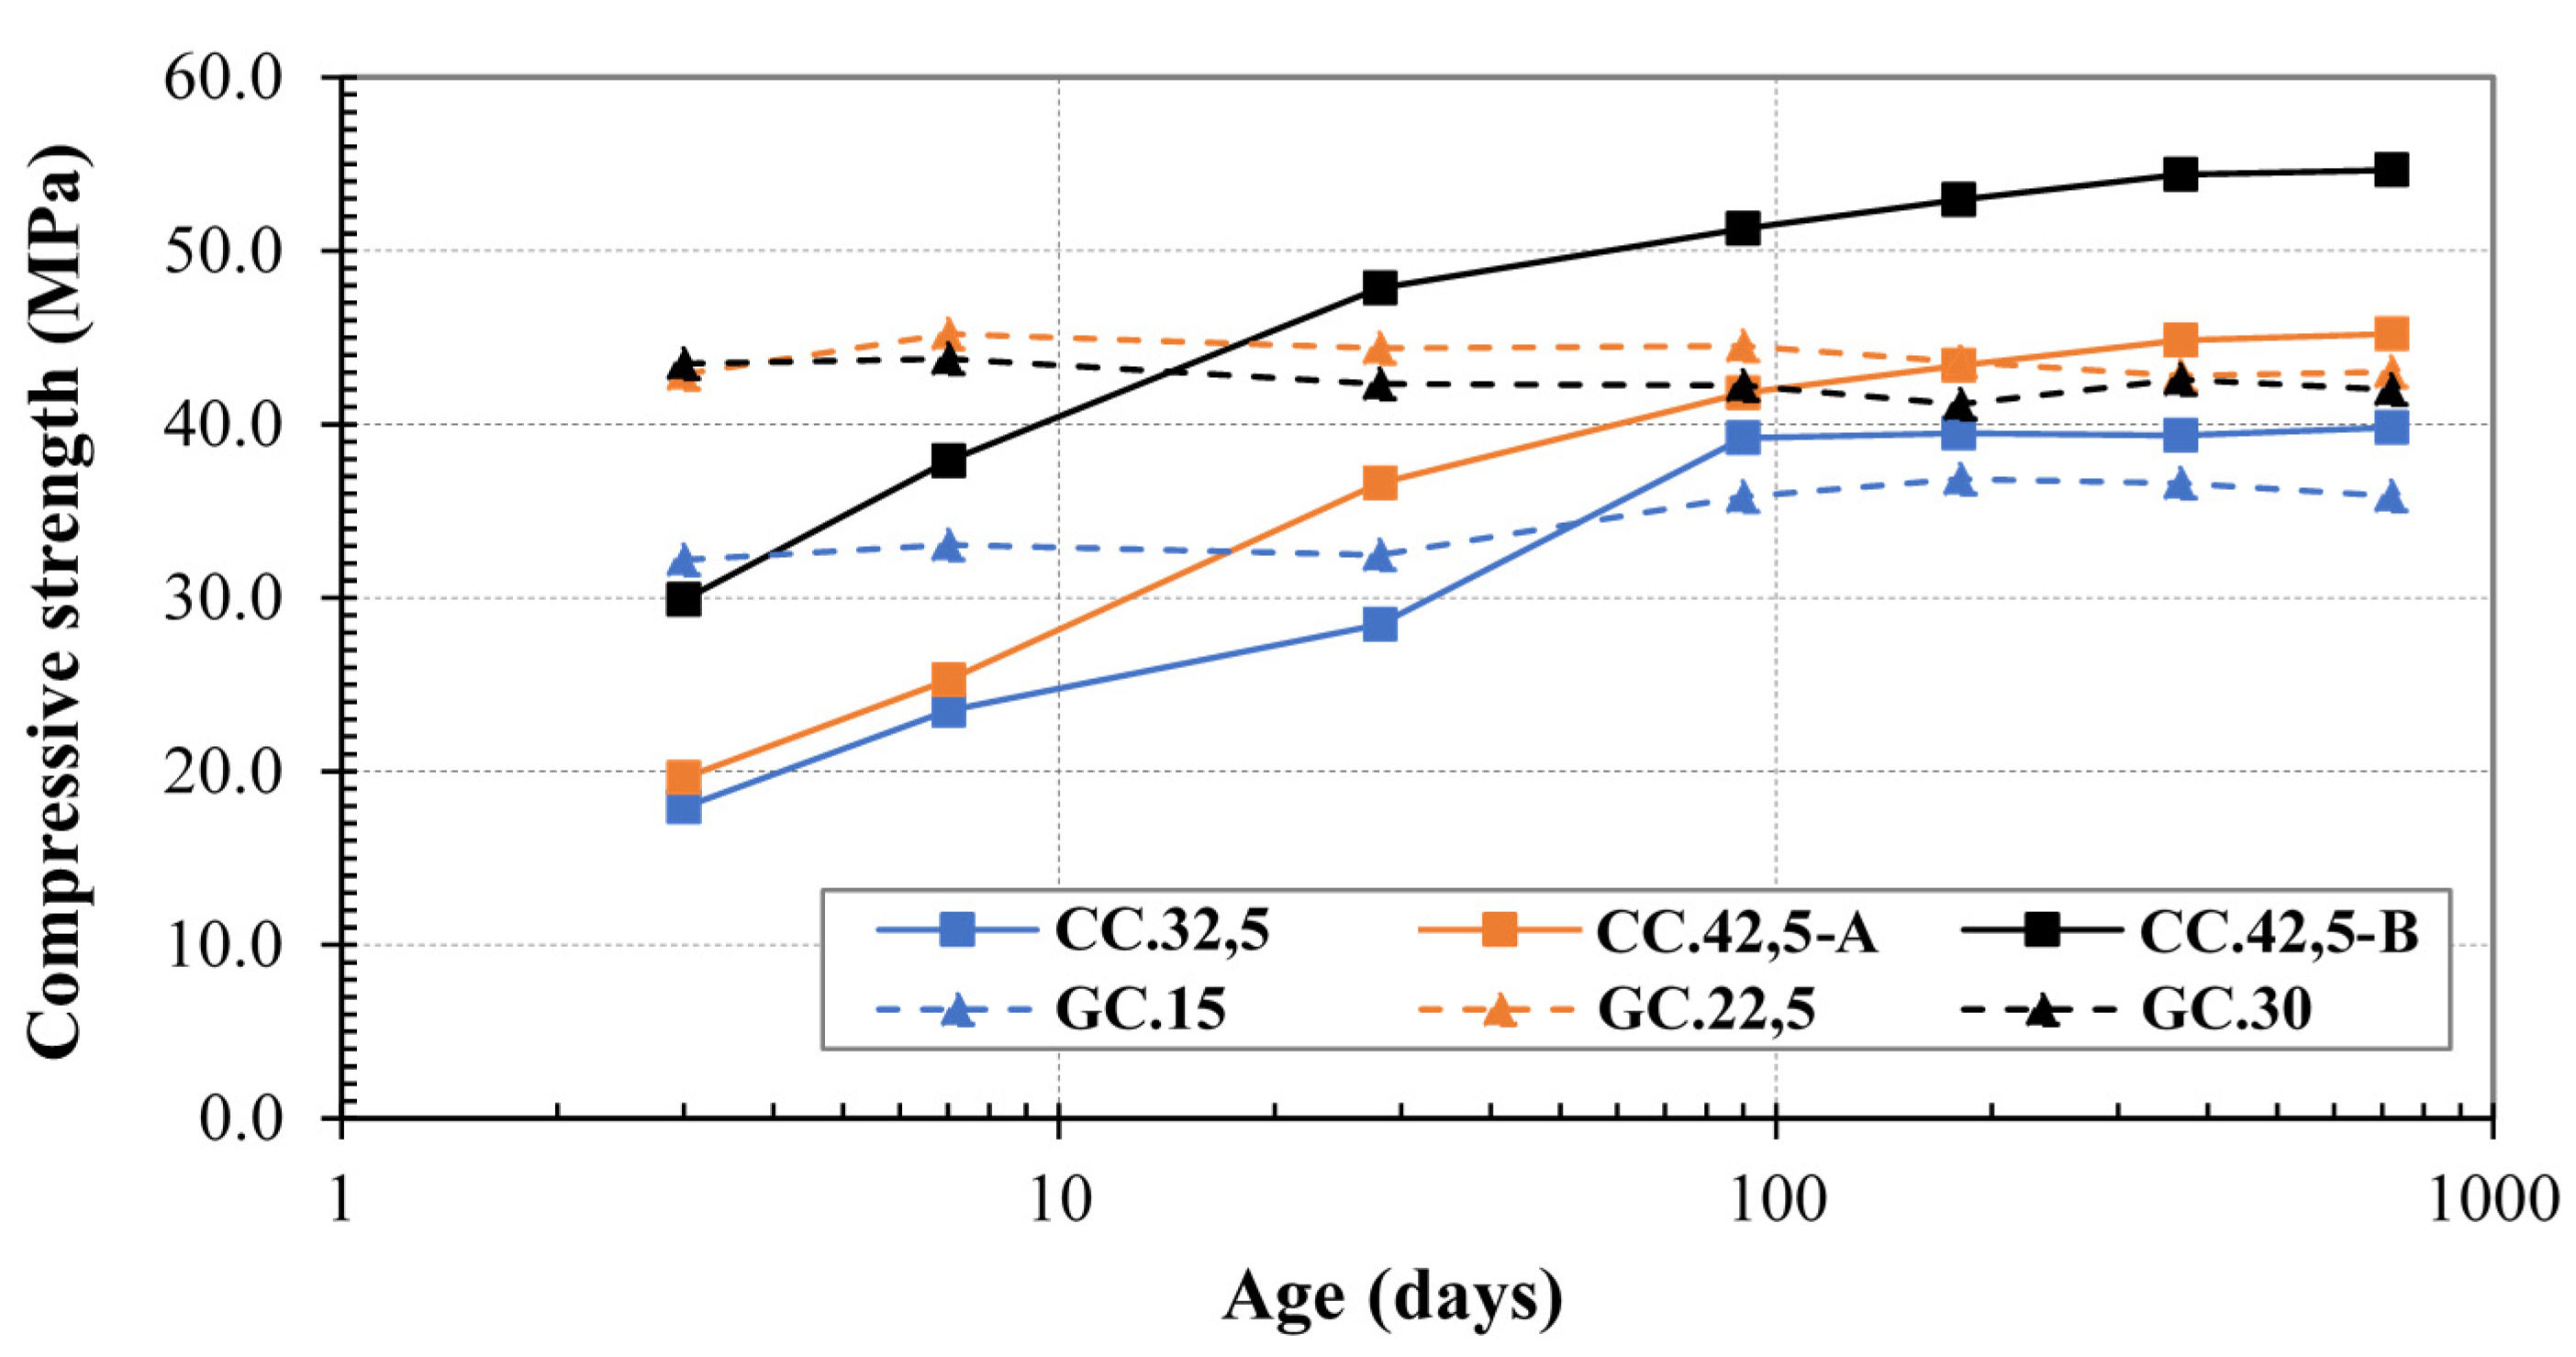
The compressive strength development of GC and CC is shown in
Figure 9. As expected, according to the literature [
35,
36], all CCs show an increasing trend in strength, which is intense up to 28 days and milder thereafter, and is stabilized after 180 days. All GCs acquire their maximum strength at the age of three days, which is consistent with the literature [
41,
42]. Their strength remained practically stable until the age of two years (
Figure 9) with a standard deviation of ±2.0 MPa and an average coefficient of variation 4%.
The concrete strength class is associated with the 28-day compressive strength [
28,
35,
36].
Table 4 classifies CC and GC according to their compressive strength at 28 and 7 days, respectively. The age of seven days was chosen for the classification of GC because at this age, it has confidently developed the maximum compressive strength.
The experimental modulus of elasticity (
Ecm) of the tested concretes is shown in
Table 4.
Ecm is the slope of the straight-line at stress–strain diagram at a stress level equal to 40% of the concrete’s compressive strength [
35,
36,
43]. The
Ecm of CC corresponds to the category to which it belongs according to Eurocode 2 [
43]. The
Ecm of GC appears to be about half of the corresponding one of the classifications of
Table 4 [
1,
33].
Table 4 also shows the Poisson ratio (
v) as derived from Equation (1) [
43]. The Poisson ratio of CC is within the range of regulation, 0.0–0.20 [
43]. The Poisson ratio of GC seems to be above this limit. This indicates that the transverse and longitudinal deformation of GC has a different relationship than the CC one [
44,
45].
where
εq is the transverse strain and
ε is the longitudinal strain, calculated with the help of a biaxial rosette strain gauge (
Figure 3).
3.4. Flexural and Splitting Tensile Strength
Table 5 shows the maximum mid-span deflection of concretes at the corresponding maximum load at failure. It is observed that CC shows a mid-span deflection in agreement with the literature [
46] and smaller than GC. This indicates that GC has a higher deformation capacity than CC, which is confirmed by the modulus of elasticity (
Table 4).
Table 6 shows the tensile strain distortion and the corresponding experimental flexural tensile strength (
fct,fl), which is calculated by Equation (2) [
1].
where
F is the maximum applied load,
L is the distance between the supporting rollers,
b is the depth of the specimen and
h is height of the specimen.
It was found that GC has greater distortion capability than CC. It was also observed that in the case of GC, the lower the tensile strength, the greater the distortion.
Table 7 shows the experimental splitting tensile strength (
fct,sp), which is calculated by Equation (3) [
1,
44].
where
F is the maximum applied load,
d is the diameter of the specimen and
L is the length of the specimen.
The tensile strength of concrete (
fct) can be estimated from the flexural tensile strength (
fct,fl) or splitting tensile strength (
fct,sp) using Equations (4) and (5), respectively [
43].
Table 8 shows
fct of tested concretes, as well as their limits according to Eurocode 2. It is observed that for all concretes,
fct calculated by
fct,sp differs from that calculated by
fct,fl. It is also seen that
fct calculated from
fct,sp (Equation (5)) is within the classification limits of Eurocode 2 (with the exception of GC.22,5). In the case of GC,
fct calculated from
fct,fl (Equation (4)) is within the same limits and lower than the CC one. Finally, it is concluded that the classification limits set by Eurocode 2 can be used for GC.
The tensile strength of concrete (
fctm) can also be estimated based on its characteristic strength (
fck) [
43]. The compressive strength of the cylindrical specimen (
fck,cyl) can be derived from the strength of the cubic one (
fck,cube) using Equation (6) [
43].
Table 8 also shows the estimated tensile strength (
fctm) of CC and GC, which results from Equation (7) [
43]. It is seen that the estimation of the tensile strength of concrete through the compressive strength is effectively applied to GC.
3.5. Ultrasonic Pulse Velocity
The determination of the velocity of propagation of pulses of ultrasonic longitudinal waves in hardened concrete is used for a number of applications. The literature reports that concrete is qualitatively classified based on the ultrasonic pulse velocity (UPV), as presented in
Table 9 [
47,
48,
49].
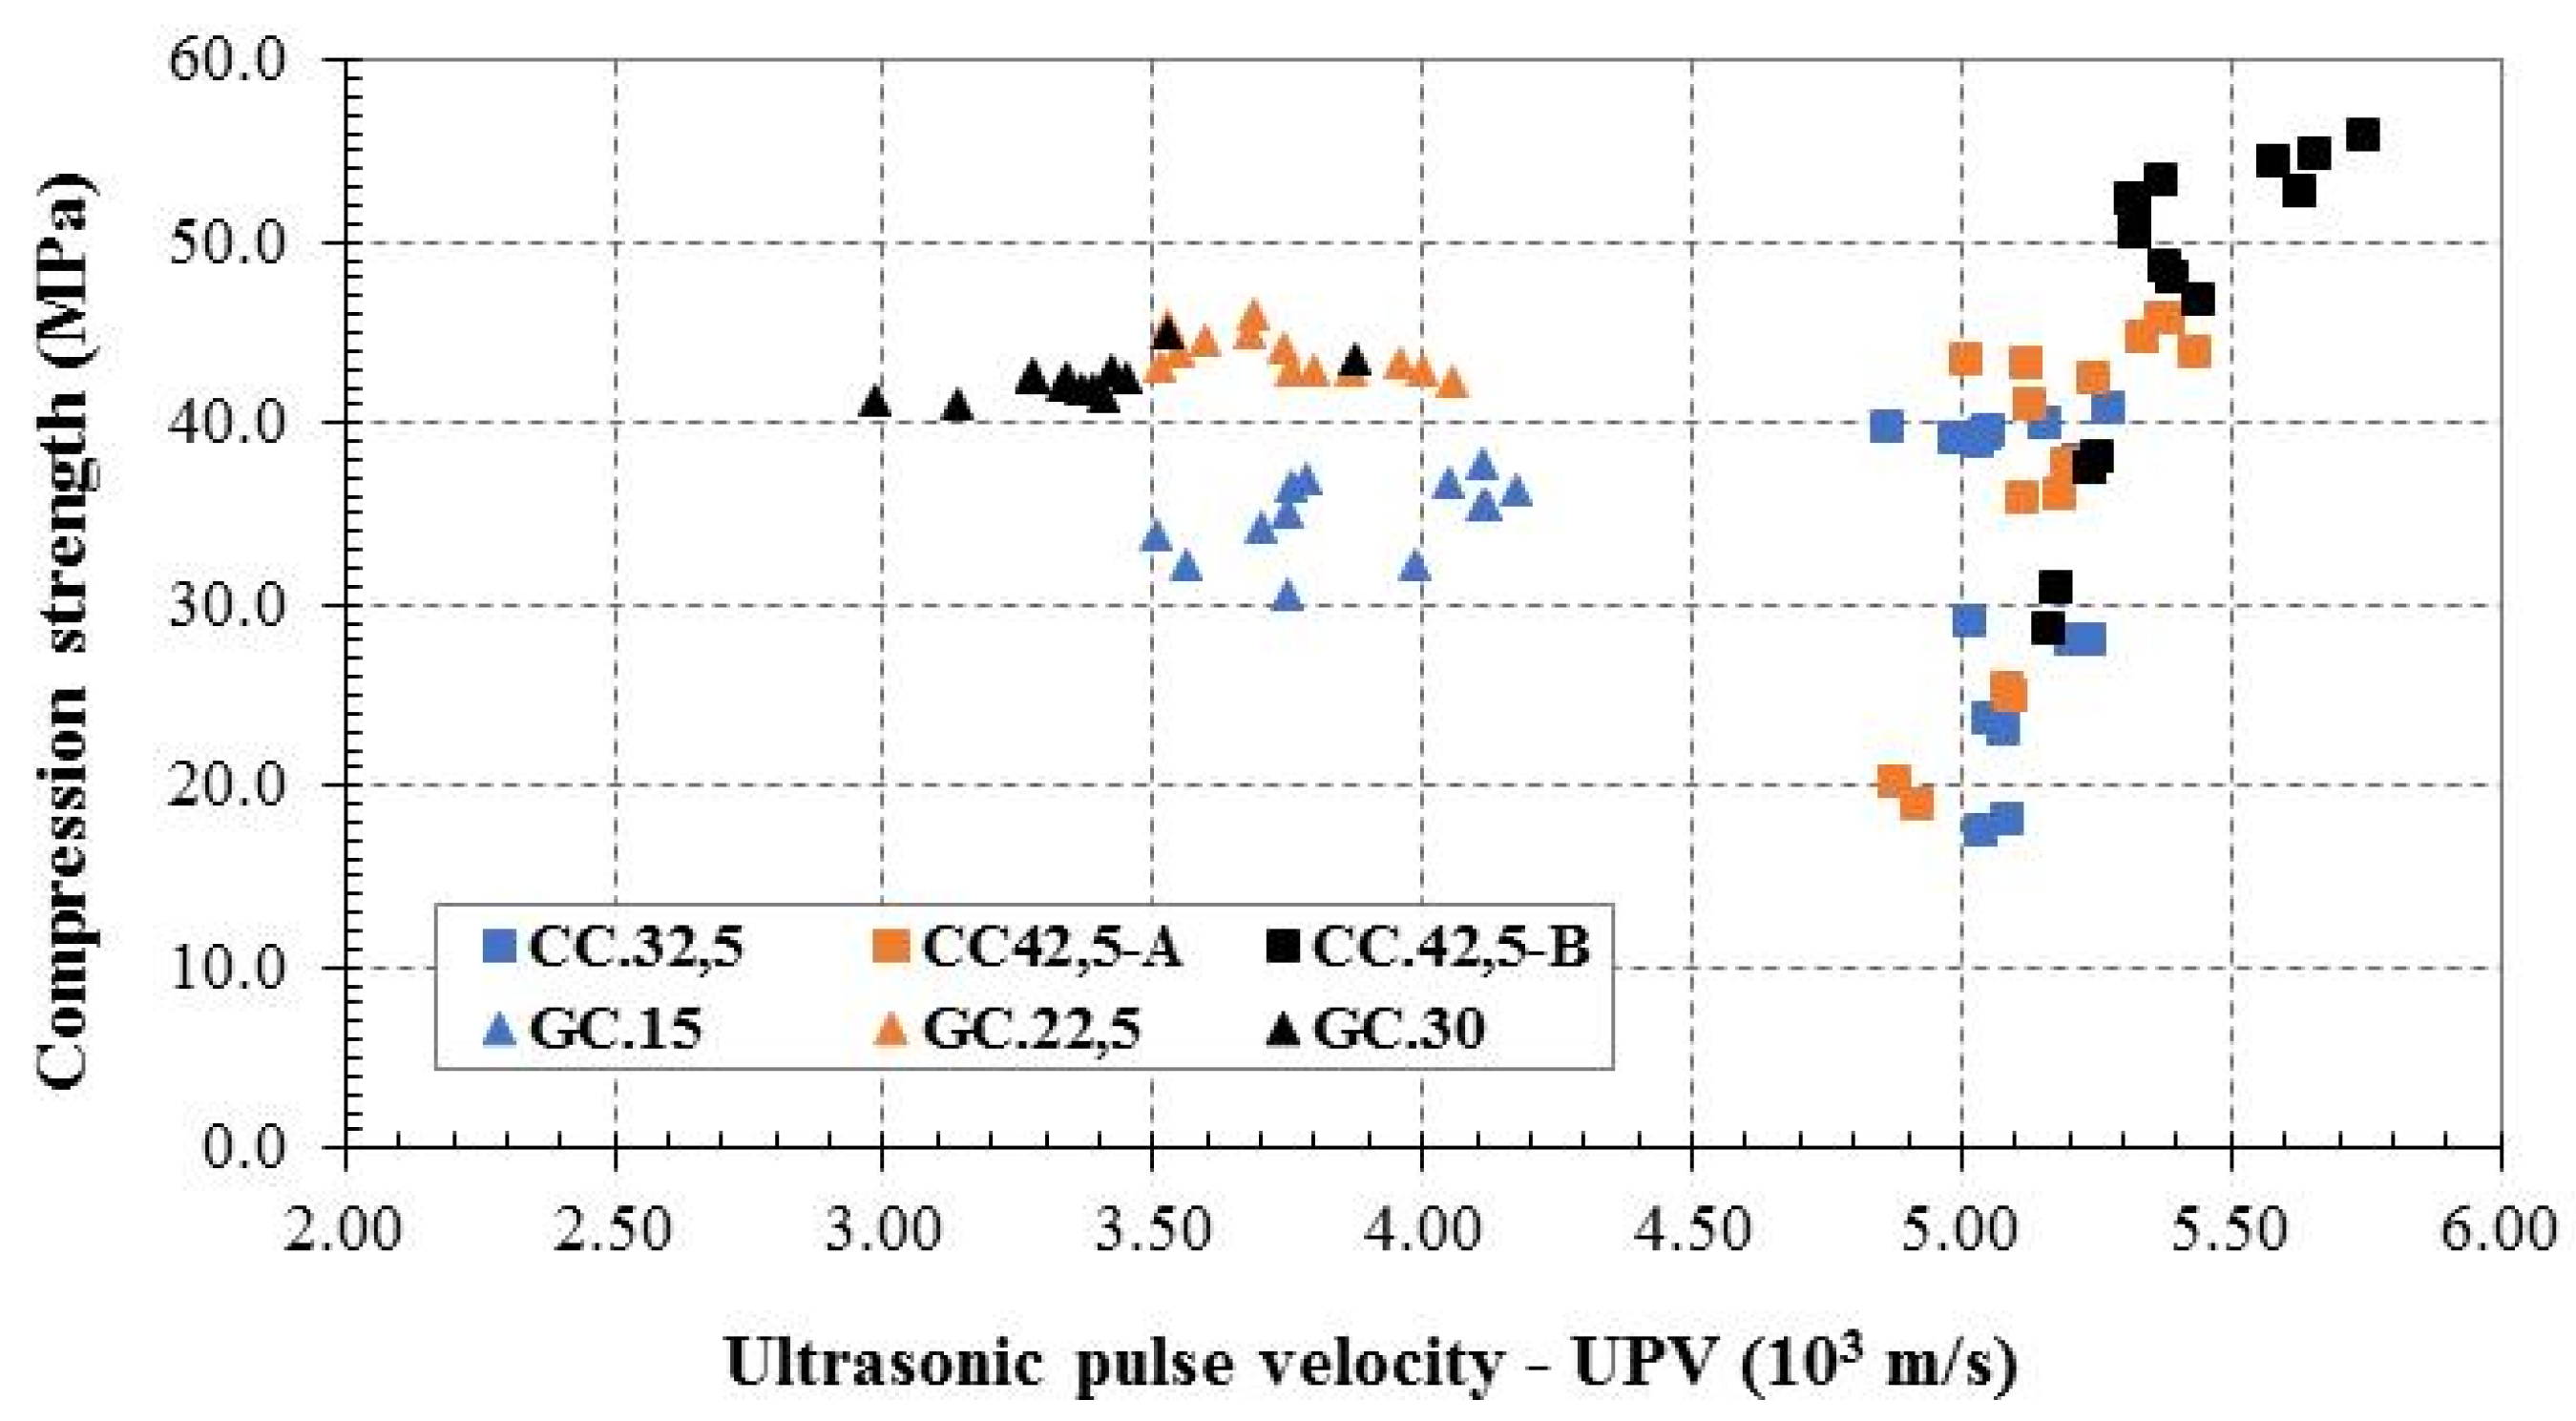
Figure 10 shows the correlation between UPV and the compressive strength of concretes at the tested ages.
Two distinguished areas, GC and CC, are formed in
Figure 10. The quality of CC is rated as excellent, while the quality of GC is mainly rated as good (
Table 9), which is in agreement with the literature [
34,
50]. It is concluded that a new quality classification table for GC should be developed because it had to be rated as “excellent” according to its compressive strength.
3.6. Comparative Evaluation of the Tested Concretes
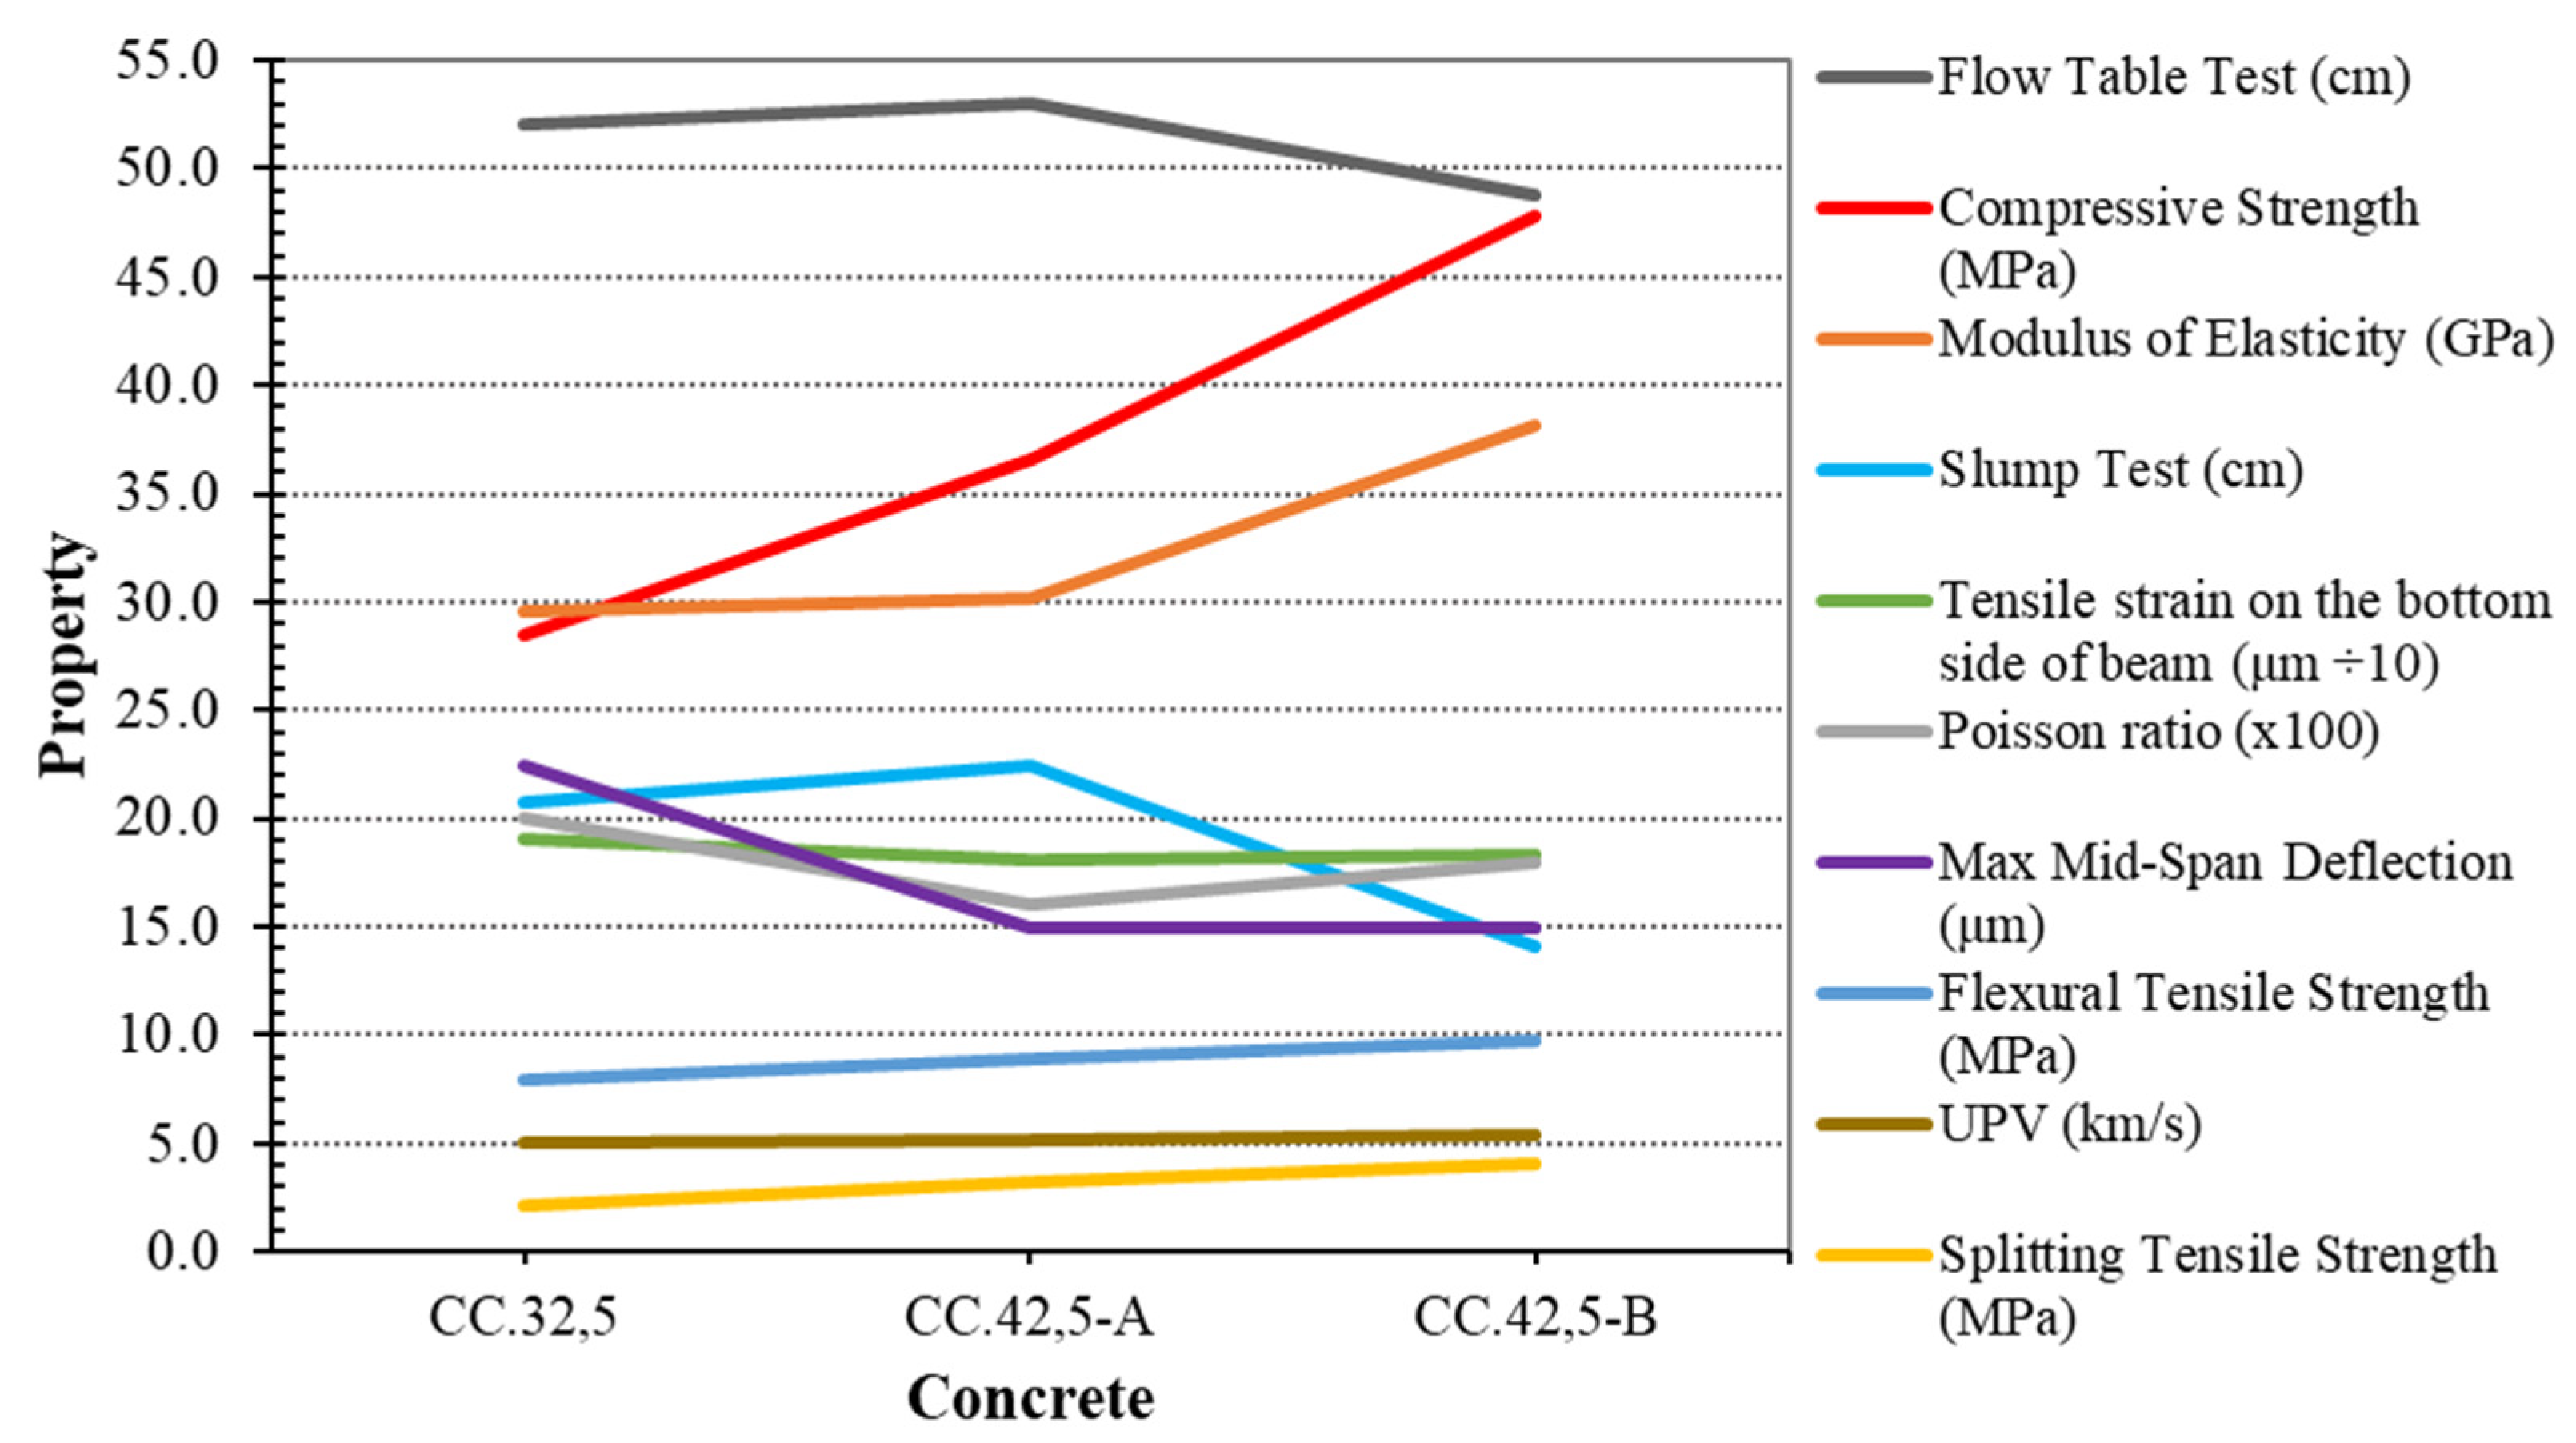
Figure 11 shows the measured properties of the cement concretes CC.32,5, CC.42,5-A and CC.42,5-B. The workability (flow test) is almost equal for all mixes and they belong to class F4. Concerning the slump test, CC.32,5, CC.42,5-A and CC.42,5-B belong to classes S4, S5 and S3, respectively. The compressive strength development is normal and expected. CC.42,5-A exhibits about 30% greater strength than CC.32,5, while CC.42,5-B exhibits about 30% greater strength than CC.42,5-A. Concerning the splitting and flexural tensile strength, concretes exhibit similar behavior to compressive strength. CC.42,5-B presents about 25% greater modulus of elasticity than CC.32,5 and CC.42,5-A. The concrete with the lowest compressive strength (CC.32,5) shows the greatest mid-span deflection and Poisson ratio. The tensile strain distortion on the bottom of prismatic specimen and the ultrasonic pulse velocity are almost similar in all concretes.
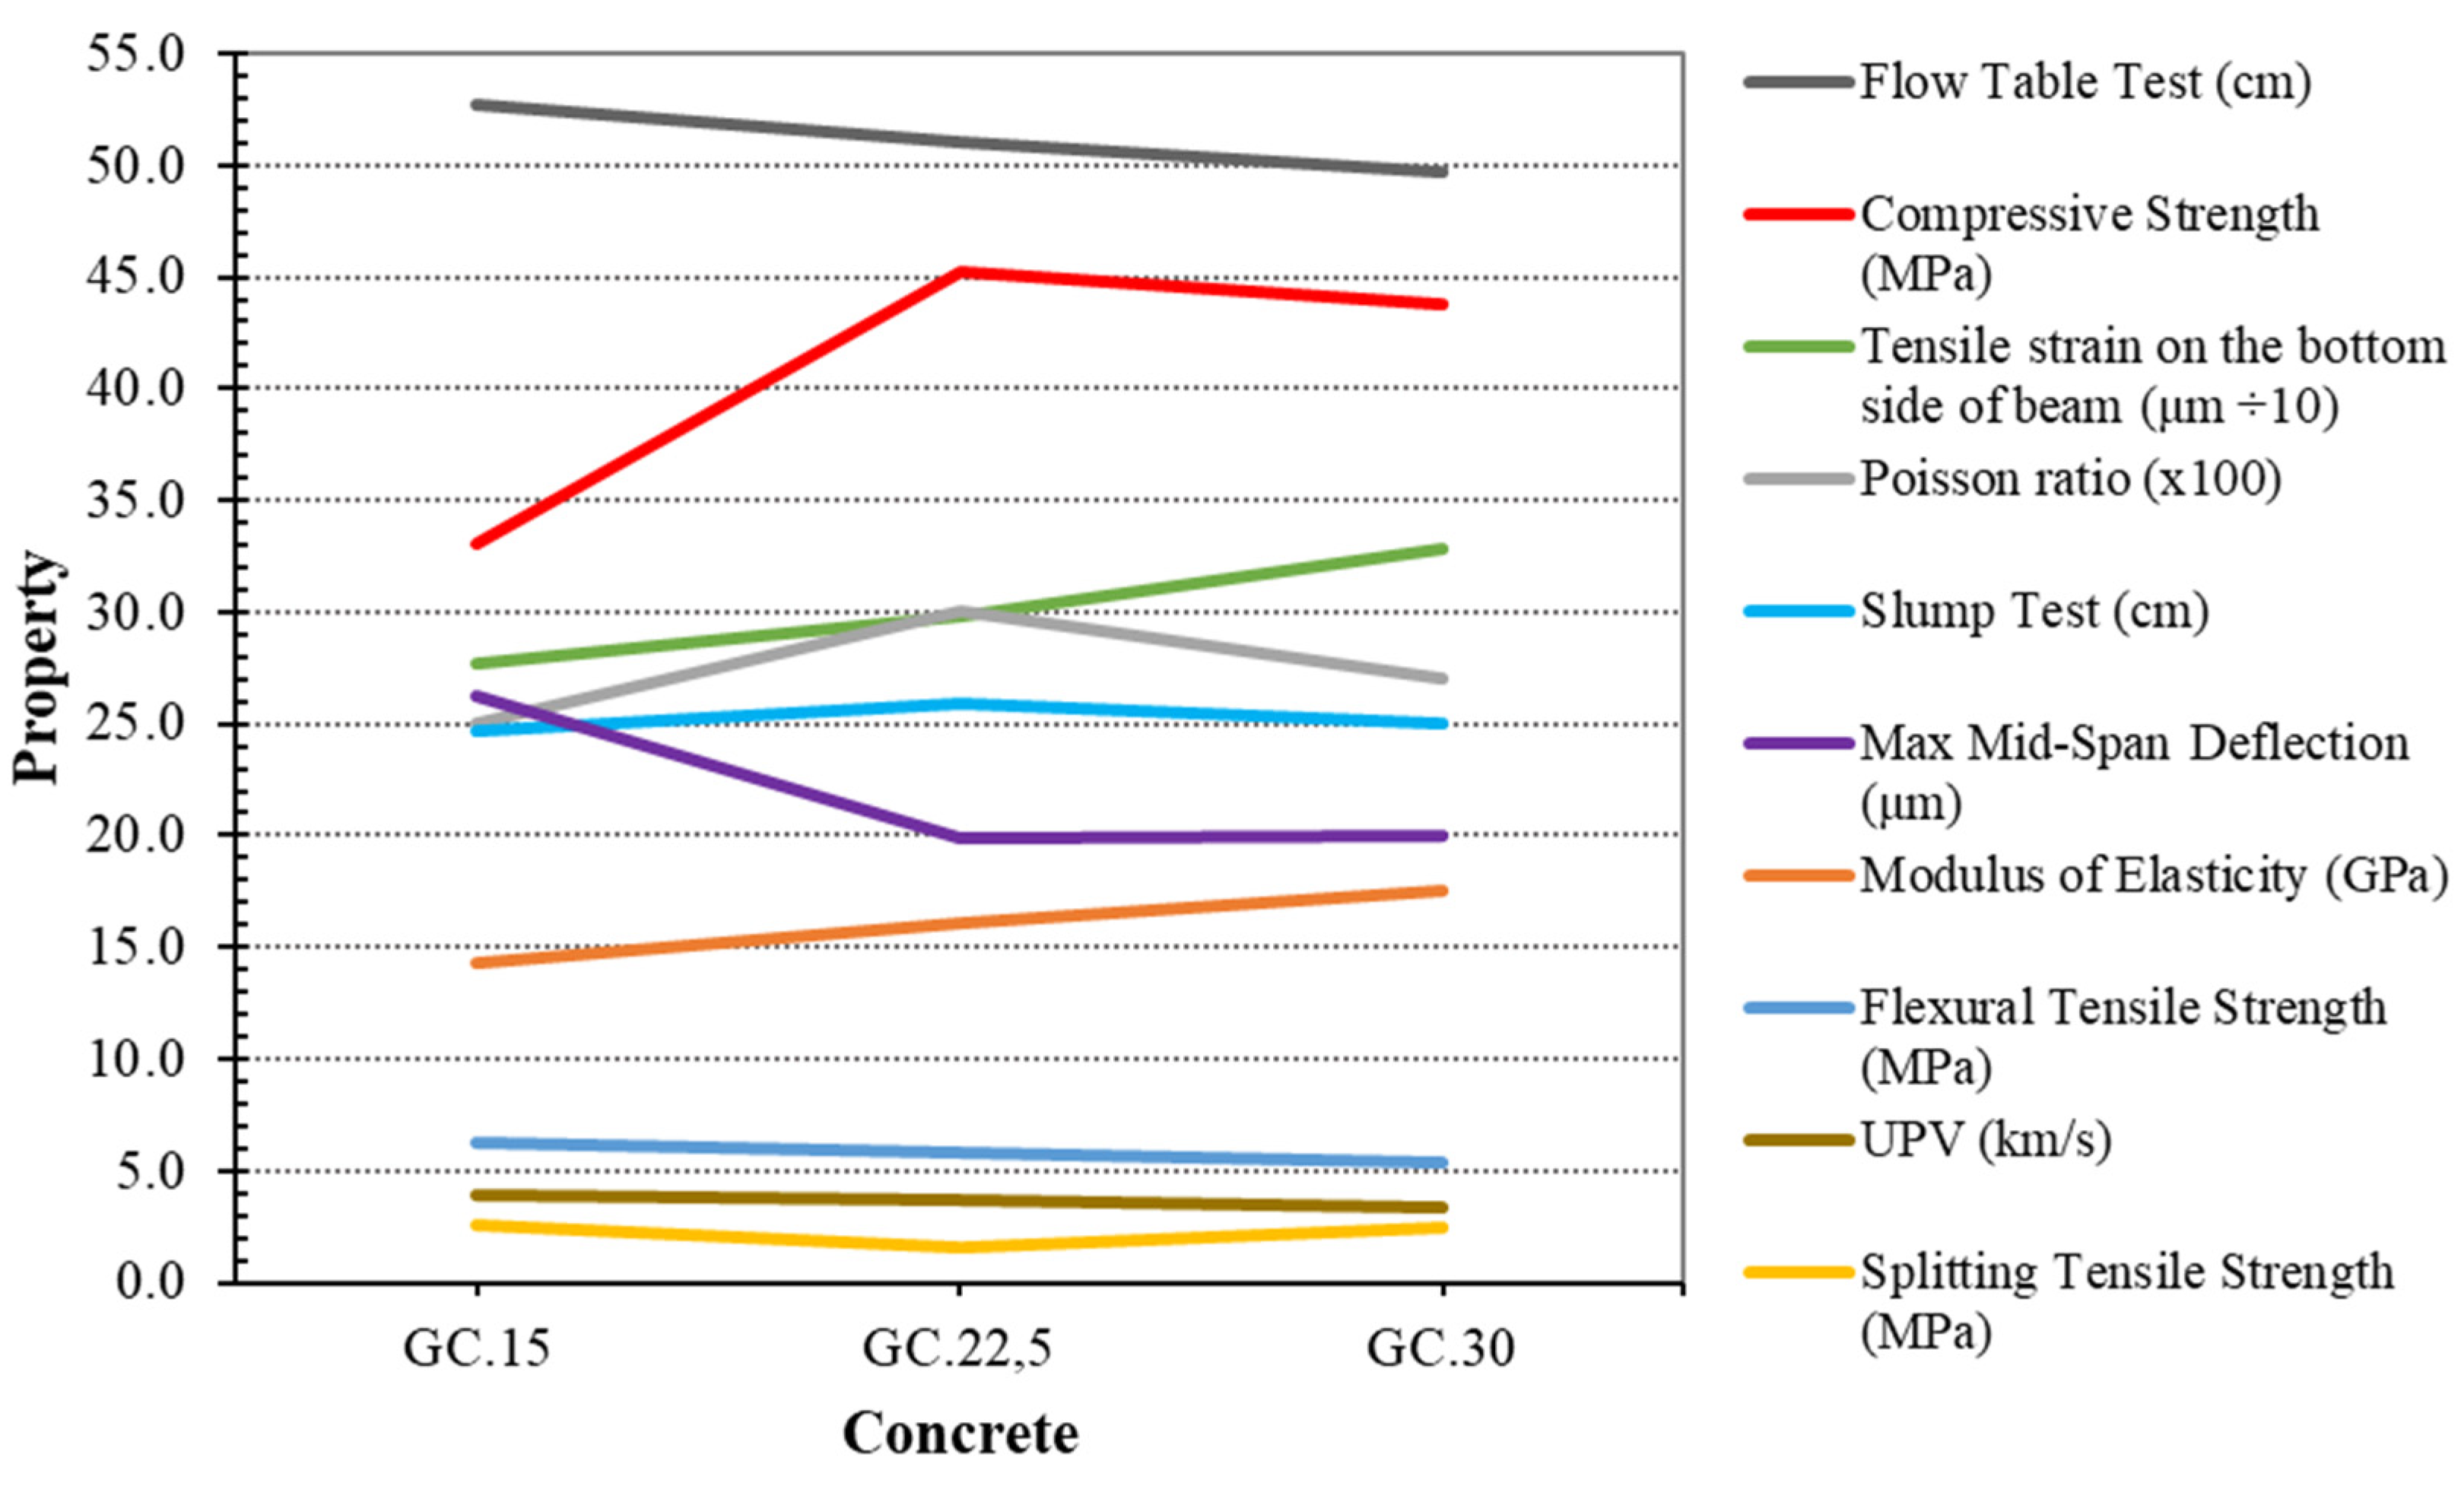
Figure 12 shows the measured properties of the geopolymer concretes GC.15, GC.22,5 and GC.30 containing 15.0%, 22.5% and 30% (
v/
v) FA, respectively. The workability is almost equal for all mixes. The GC belongs to class F4 (flow test) and class S5 (slump test), satisfying the goals of the mix design. GC.22.5 and GC.30 show a similar compressive strength development and exhibit about 35% greater strength than GC.15. Both splitting and flexural tensile strength are almost equal in all tested concretes. The modulus of elasticity of the GC increases with the fly ash content, as it becomes more brittle in accordance with the literature [
35,
36]. This is confirmed by mid-span deflection values because GC.15 (concrete with the lowest strength) has the highest deformation. The tensile strain distortion on the bottom of prismatic specimen increases with the fly ash content because it is affected by the upper side of the beam, which is under compression. GC.22,5 shows the maximum Poisson ratio, while ultrasonic pulse velocity is similar in all concretes. Based on the above results, it seems that the ratio of binder (fly ash) to aggregates has a significant effect on the properties of the concrete. This ratio is 0.24, 0.46 and 0.87 (calculated from the data of
Table 2) for GC.15, GC.22,5 and GC.30, respectively. The GCs with the higher ratios (GC.22,5 and GC.30) showed the best properties. The optimization of this ratio is currently under examination, taking into account the durability of concretes which is also expected to be affected by the ratio of binder to aggregates.
Based on the above measurements, it is seen that GC.22,5 and GC.30 showed the best performance. However, taking into consideration the environmental impact, GC.30 is proposed because it has the maximum content of FA (750 kg/m3) accompanied by the minimum content of aggregates (natural resources). In any case, the final decision will take into account the durability of concrete. Durability tests are in progress.
4. Conclusions
The physical and mechanical properties of fly ash (FA)-based geopolymer concrete (GC), compared to those of Portland cement concrete (CC), were studied. For this purpose three GCs and three CCs were designed, prepared, tested and evaluated. The following conclusions can be drawn from the present study:
The ACI method of concrete mix design can be efficiently applied in GC.
GC can be prepared with controlled workability, according to the requirements of each project.
The air content of GC mixes was lower than that of CC mixes, and it decreases as the FA content increases.
GC exhibits competitive compressive strength compared to CC. GC achieved its maximum compressive strength at three days, which remained constant even after two years. GC satisfies the EN 206-1 requirements and has a compressive strength of 33.1, 45.3 and 43.8 MPa for fly ash content 375, 563 and 750 kg/m3, respectively.
The tensile strength of GC is within the limits of each class specified by Eurocode 2 for CC and is not significantly affected by the FA content. The relationship between compressive and tensile strength for CC (Eurocode 2) seems to be effective for GC, too.
GC shows a higher deformation capacity than CC because its mid-span deflection during the flexural test was up to 35% greater than the CC one.
The modulus of elasticity of GC was found to be about half of the corresponding CC classes defined in Eurocode 2, while its Poisson ratio appeared to be above the upper limit stated by the same regulation.
Ultrasonic pulse velocity of GC is quite different from that of CC, even for the same strength level. Thus, the quality of GC cannot be evaluated according to the CC classification table.
Concerning the compliance of GC with EN 206-1 and EN 1992-1-1, it is shown that in some cases, minor adjustments of the regulations are needed, while in other cases, complete revision is required.
The GC with the maximum content of FA (750 kg/m3) seems to be the best choice taking into consideration both engineering and environmental criteria.
A study on the durability of geopolymer concrete will be the next stage of this research. The completion of the research project will contribute to the incorporation of fly ash into concrete technology not as an additive of mineral origin but as the exclusive binder.
Author Contributions
Conceptualization, N.N., A.S., G.K. and S.T.; methodology, N.N.; resources, S.T.; writing—original draft preparation, N.N.; writing—review and editing, A.S., G.K. and S.T.; project administration, S.T. and G.K. All authors have read and agreed to the published version of the manuscript.
Funding
This research received no external funding.
Institutional Review Board Statement
Not applicable.
Informed Consent Statement
Not applicable.
Data Availability Statement
Additional data will be available upon request.
Acknowledgments
This work is part of the PhD thesis of the author N. Nikoloutsopoulos, who has received a scholarship from the Special Account for Research Funding (ELKE) of National Technical University of Athens (NTUA). The authors would like to thank Sika Hellas A.B.E.E., Heracles General Cement Co. (member of Lafargeholcim group) and Titan Cement Group for sponsoring the materials for this research.
Conflicts of Interest
The authors declare no conflict of interest.
References
- Shehab, H.K.; Eisa, A.S.; Wahba, A.M. Mechanical properties of fly ash based geopolymer concrete with full and partial cement replacement. Constr. Build. Mater. 2016, 126, 560–565. [Google Scholar] [CrossRef]
- Olivia, M.; Kamaldi, A.; Sitompul, I.R.; Diyanto, I.; Saputra, E.; Monita, O. Properties of Geopolymer Concrete from Local Fly Ash (FA) and Palm Oil Fuel Ash (POFA). Mater. Sci. Forum 2014, 803, 110–114. [Google Scholar] [CrossRef]
- Hung, T.V.; Dong, D.V.; Long, N.N.; Hien, T.D. Study on the mechanical properties of the fly ash geopolymer concrete. Int. J. Civ. Eng. Tech. 2017, 8, 950–957. [Google Scholar]
- Ma, C.-K.; Awang, A.Z.; Omar, W. Structural and material performance of geopolymer concrete: A review. Constr. Build. Mater. 2018, 186, 90–102. [Google Scholar] [CrossRef]
- Hadi, M.N.; Al-Azzawi, M.; Yu, T. Effects of fly ash characteristics and alkaline activator components on compressive strength of fly ash-based geopolymer mortar. Constr. Build. Mater. 2018, 175, 41–54. [Google Scholar] [CrossRef]
- Panagiotopoulou, C.; Perraki, T.; Tsivili, S.; Skordaki, N.; Kakali, G. A Study on Alkaline Dissolution and Geopolymerlsation of Hellenic Fly Ash. Ceram. Eng. Sci. Proc. 2009, 29, 165–173. [Google Scholar] [CrossRef]
- Davidovits, J. Geopolymers. J. Therm. Anal. Calorim. 1991, 37, 1633–1656. [Google Scholar] [CrossRef]
- Panagiotopoulou, C.; Tsivilis, S.; Kakali, G. Application of the Taguchi approach for the composition optimization of alkali activated fly ash binders. Constr. Build. Mater. 2015, 91, 17–22. [Google Scholar] [CrossRef]
- Davidovits, J. Geopolymer Cement a review. Geopolymer Sci. Tech. 2013, 21, 1–11. [Google Scholar]
- Komnitsas, K.; Zaharaki, D.; Vlachou, A.; Bartzas, G.; Galetakis, M. Effect of synthesis parameters on the quality of construction and demolition wastes (CDW) geopolymers. Adv. Powder Technol. 2015, 26, 368–376. [Google Scholar] [CrossRef] [Green Version]
- Ding, Y.; Shi, C.-J.; Li, N. Fracture properties of slag/fly ash-based geopolymer concrete cured in ambient temperature. Constr. Build. Mater. 2018, 190, 787–795. [Google Scholar] [CrossRef]
- Zhang, H.Y.; Qiu, G.H.; Kodur, V.; Yuan, Z.S. Spalling behavior of metakaolin-fly ash based geopolymer concrete under elevated temperature exposure. Cem. Concr. Compos. 2020, 106, 103483. [Google Scholar] [CrossRef]
- Triwulan; Ekaputri, J.J.; Priyanka, N.F. The Effect of Temperature Curing on Geopolymer Concrete. MATEC Web Conf. 2017, 97, 01005. [Google Scholar] [CrossRef] [Green Version]
- Xu, H.; Van Deventer, J. The geopolymerisation of alumino-silicate minerals. Int. J. Miner. Process. 2000, 59, 247–266. [Google Scholar] [CrossRef] [Green Version]
- Wijaya, A.L.; Ekaputri, J.J. Triwulan Factors influencing strength and setting time of fly ash based-geopolymer paste. MATEC Web Conf. 2017, 138, 01010. [Google Scholar] [CrossRef] [Green Version]
- Nikoloutsopoulos, N.; Sotiropoulou, A.; Kakali, G.; Tsivilis, S. The effect of Solid/Liquid ratio on setting time, workability and compressive strength of fly ash based geopolymers. Mater. Today Proc. 2018, 5, 27441–27445. [Google Scholar] [CrossRef]
- Wu, W.; Luo, S.; Ye, S.; Zhu, Y.; Zheng, J. Characterization of optimum fluidized bed combustion ash-based geopolymer concrete. IOP Conf. Ser. Mater. Sci. Eng. 2018, 431, 092004. [Google Scholar] [CrossRef]
- Panagiotopoulou, C.; Asprogerakas, A.; Kakali, G.; Tsivilis, S.G. Synthesis and Thermal Properties of Fly-Ash Based Geopolymer Pastes and Mortars. Dev. Strateg. Ceram. Mater. 2011, 32, 17–28. [Google Scholar] [CrossRef]
- Kioupis, D.; Skaropoulou, A.; Tsivilis, S.; Kakali, G. The application of experimental design models in order to optimize the synthesis of geopolymers. MATEC Web Conf. 2018, 149, 01029. [Google Scholar] [CrossRef]
- Singh, B.; Ishwarya, G.; Gupta, M.; Bhattacharyya, S. Geopolymer concrete: A review of some recent developments. Constr. Build. Mater. 2015, 85, 78–90. [Google Scholar] [CrossRef]
- Ryu, G.S.; Lee, Y.B.; Koh, K.T.; Chung, Y.S. The mechanical properties of fly ash-based geopolymer concrete with alkaline activators. Constr. Build. Mater. 2013, 47, 409–418. [Google Scholar] [CrossRef]
- Kakali, G.; Kioupis, D.; Skaropoulou, A.; Tsivilis, S. Lightweight geopolymer composites as structural elements with improved insulation capacity. MATEC Web Conf. 2018, 149, 01042. [Google Scholar] [CrossRef]
- Motorwala, A.; Shah, V.; Kammula, R.; Nannapaneni, P.; Raijiwala, D.B. Alkali activated fly-ash based geopolymer concrete. Int. J. Emerg. Tech. Adv. Eng. 2013, 3, 159–166. [Google Scholar]
- Lăzărescu, A.V.; Szilagyi, H.; Baeră, C.; Ioani, A. The Effect of Alkaline Activator Ratio on the Compressive Strength of Fly Ash-Based Geopolymer Paste. IOP Conf. Ser. Mater. Sci. Eng. 2017, 209, 012064. [Google Scholar] [CrossRef] [Green Version]
- Huang, Y.; Han, M. The influence of α-Al2O3 addition on microstructure, mechanical and formaldehyde adsorption properties of fly ash-based geopolymer products. J. Hazard. Mater. 2011, 193, 90–94. [Google Scholar] [CrossRef]
- Jena, S.; Panigrahi, R.; Sahu, P. Mechanical and Durability Properties of Fly Ash Geopolymer Concrete with Silica Fume. J. Inst. Eng. Ser. A 2019, 100, 697–705. [Google Scholar] [CrossRef]
- Noushini, A.; Hastings, M.; Castel, A.; Aslani, F. Mechanical and flexural performance of synthetic fibre reinforced geopolymer concrete. Constr. Build. Mater. 2018, 186, 454–475. [Google Scholar] [CrossRef]
- EN 206-1. Concrete-Specification, Performance, Production and Conformity; The Committee for Standarization: Brussels, Belgium, 2016. [Google Scholar]
- Memon, F.A.; Nuruddin, M.F.; Demie, S.; Shafiq, N. Effect of curing conditions on strength of fly ash-based self-compacting geopolymer concrete. Int. J. Civ. Environ. Eng. 2011, 5, 860–863. [Google Scholar]
- Patil, A.A.; Chore, H.; Dodeb, P. Effect of curing condition on strength of geopolymer concrete. Adv. Concr. Constr. 2014, 2, 29–37. [Google Scholar] [CrossRef] [Green Version]
- Nath, P.; Sarker, P.K.; Rangan, V.B. Early Age Properties of Low-calcium Fly Ash Geopolymer Concrete Suitable for Ambient Curing. Procedia Eng. 2015, 125, 601–607. [Google Scholar] [CrossRef] [Green Version]
- Noushini, A.; Aslani, F.; Castel, A.; Gilbert, R.I.; Uy, B.; Foster, S. Compressive stress-strain model for low-calcium fly ash-based geopolymer and heat-cured Portland cement concrete. Cem. Concr. Compos. 2016, 73, 136–146. [Google Scholar] [CrossRef]
- Nath, P.; Sarker, P.K. Flexural strength and elastic modulus of ambient-cured blended low-calcium fly ash geopolymer concrete. Constr. Build. Mater. 2017, 130, 22–31. [Google Scholar] [CrossRef] [Green Version]
- Ghosh, R.; Sagar, S.P.; Kumar, A.; Gupta, S.K.; Kumar, S. Estimation of geopolymer concrete strength from ultrasonic pulse velocity (UPV) using high power pulser. J. Build. Eng. 2018, 16, 39–44. [Google Scholar] [CrossRef]
- Neville, A.M. Properties of Concrete, 5th ed.; Prentice Hal: Essex, UK, 2011. [Google Scholar]
- Mehta, P.K.; Monteiro, P.J.M. Concrete: Microstructure, Properties, and Materials, 3rd ed.; McGraw-Hill Professional: New York, NY, USA, 2005. [Google Scholar]
- Lederle, R.; Shepard, T.; Meza, V.D.L.V. Comparison of methods for measuring infiltration rate of pervious concrete. Constr. Build. Mater. 2020, 244, 118339. [Google Scholar] [CrossRef]
- Secrieru, E.; Mohamed, W.; Fataei, S.; Mechtcherine, V. Assessment and prediction of concrete flow and pumping pressure in pipeline. Cem. Concr. Compos. 2020, 107, 103495. [Google Scholar] [CrossRef]
- Zhang, C.; Hou, Z.; Chen, C.; Zhang, Y.; Mechtcherine, V.; Sun, Z. Design of 3D printable concrete based on the relationship between flowability of cement paste and optimum aggregate content. Cem. Concr. Compos. 2019, 104, 103406. [Google Scholar] [CrossRef]
- Mahmood, A.H.; Foster, S.J.; Castel, A.; Modra, B.; Heidrich, C.; Tory, G.; Genrich, R.; Engelen, P. Development of high-density geopolymer concrete for breakwater armour units for Port Kembla harbor. Concr. Aust. 2018, 44, 34–39. [Google Scholar]
- Parveen; Singhal, D.; Junaid, M.T.; Jindal, B.B.; Mehta, A. Mechanical and microstructural properties of fly ash based geopolymer concrete incorporating alccofine at ambient curing. Constr. Build. Mater. 2018, 180, 298–307. [Google Scholar] [CrossRef]
- Junaid, M.T.; Khennane, A.; Kayali, O. Performance of fly ash based geopolymer concrete made using non-pelletized fly ash aggregates after exposure to high temperatures. Mater. Struct. 2014, 48, 3357–3365. [Google Scholar] [CrossRef]
- EN 1992-1-1. Eurocode 2: Design of Concrete Structures–Part 1-1: General Rules and Rules for Buildings; European Committee for Standarization: Brussels, Belgium, 2004. [Google Scholar]
- Nguyen, K.T.; Ahn, N.; Le, T.A.; Lee, K. Theoretical and experimental study on mechanical properties and flexural strength of fly ash-geopolymer concrete. Constr. Build. Mater. 2016, 106, 65–77. [Google Scholar] [CrossRef]
- Chitrala, S.; Jadaprolu, G.J.; Chundupalli, S. Study and predicting the stress-strain characteristics of geopolymer concrete under compression. Case Stud. Constr. Mater. 2018, 8, 172–192. [Google Scholar] [CrossRef]
- Soulioti, D.V.; Barkoula, N.M.; Paipetis, A.; Matikas, T.E. Effects of Fibre Geometry and Volume Fraction on the Flexural Behaviour of Steel-Fibre Reinforced Concrete. Strain 2009, 47, e535–e541. [Google Scholar] [CrossRef]
- Farhan, N.A.; Sheikh, M.N.; Hadi, M.N. Investigation of engineering properties of normal and high strength fly ash based geopolymer and alkali-activated slag concrete compared to ordinary Portland cement concrete. Constr. Build. Mater. 2019, 196, 26–42. [Google Scholar] [CrossRef]
- Gavela, S.; Nikoloutsopoulos, N.; Papadakos, G.; Sotiropoulou, A. Combination of compressive strength test and ultrasonic pulse velocity test with acceptable uncertainty. Mater. Des. Process. Commun. 2020, 171, 1–6. [Google Scholar] [CrossRef] [Green Version]
- Pandermarakis, Z.G.; Sotiropoulou, A.B.; Nikoloutsopoulos, N.D. Ultrasonic Inspection of Fiber Reinforced Cement Based Composites after their Exposure to Fire Conditions. Adv. Mater. Res. 2010, 123–125, 915–918. [Google Scholar] [CrossRef]
- Kim, J.S.; Kim, T.H. An Ultrasonic Pulse Velocity Test on Fly-Ash Based Geopolymer Concrete in Frequency Domains. Appl. Mech. Mater. 2014, 700, 310–313. [Google Scholar] [CrossRef]
Figure 1.
Powder X-ray diffraction patterns of fly ash.
Figure 1.
Powder X-ray diffraction patterns of fly ash.
Figure 2.
Particle size analysis of fly ash.
Figure 2.
Particle size analysis of fly ash.
Figure 3.
GC specimen with strain gauges before (left) and after (right) compression test.
Figure 3.
GC specimen with strain gauges before (left) and after (right) compression test.
Figure 4.
GC beam during the two-point bending test.
Figure 4.
GC beam during the two-point bending test.
Figure 5.
Workability (flow table test) of the mixes.
Figure 5.
Workability (flow table test) of the mixes.
Figure 6.
Workability (slump test) of the mixes.
Figure 6.
Workability (slump test) of the mixes.
Figure 7.
Air content of the mixes.
Figure 7.
Air content of the mixes.
Figure 8.
Experimental (EN 12350-6) and calculated (ACI 211.1) density of the mixes.
Figure 8.
Experimental (EN 12350-6) and calculated (ACI 211.1) density of the mixes.
Figure 9.
Compressive strength development of concretes.
Figure 9.
Compressive strength development of concretes.
Figure 10.
Correlation between UPV and compressive strength of concretes.
Figure 10.
Correlation between UPV and compressive strength of concretes.
Figure 11.
Comparison of the properties of all CC mixtures.
Figure 11.
Comparison of the properties of all CC mixtures.
Figure 12.
Comparison of the properties of all GC mixtures.
Figure 12.
Comparison of the properties of all GC mixtures.
Table 1.
Chemical analysis of fly ash (wt%).
Table 1.
Chemical analysis of fly ash (wt%).
| SiO2 | Al2O3 | Fe2O3 | CaO | MgO | Na2Oeq | SO3 | L.O.I. |
|---|
| 46.60 | 17.30 | 8.16 | 11.73 | 2.66 | 0.60 | 2.87 | 5.10 |
Table 2.
Composition of GC mix (per 1 m3 of concrete).
Table 2.
Composition of GC mix (per 1 m3 of concrete).
| | GC.15 | GC.22,5 | GC.30 |
|---|
| Fly Ash (kg) | 375 | 563 | 750 |
| Fly Ash (v/v%) | 15.0 | 22.5 | 30.0 |
| Water glass (kg) | 168 | 252 | 336 |
| Sodium hydroxide (kg) | 32.1 | 48.2 | 64.3 |
| Water (kg) | 100 | 90 | 80 |
| Coarse aggregates (kg) | 632 | 490 | 349 |
| Fine aggregates (kg) | 930 | 721 | 513 |
| L/S | 0.42 1 | 0.35 | 0.31 |
Table 3.
Composition of CC mix (per 1 m3 of concrete).
Table 3.
Composition of CC mix (per 1 m3 of concrete).
| | CC.32,5 | CC.42,5-A | CC.42,5-B |
|---|
Cement Type
(according to EN 197-1) | CEM II/B-M (W-L) 32.5 R | CEM II/B-M (P-W-L) 42.5 N | CEM II/B-M (P-W-L) 42.5 N |
| Cement (kg) | 300 | 300 | 330 |
| Water (kg) | 180 | 174 | 181 |
| Coarse aggregates (kg) | 757 | 763 | 744 |
| Fine aggregates (kg) | 1111 | 1120 | 1092 |
| Superplasticizer (kg) | 1.20 | 1.80 | 1.65 |
| W/C 1 | 0.57 2 | 0.55 | 0.52 |
Table 4.
Classification of concretes (EN 206-1) with respect to their compressive strength at 28 days (CC) and 7 days (GC). Experimental modulus of elasticity (Ecm) and Poisson ratio (v) of concretes.
Table 4.
Classification of concretes (EN 206-1) with respect to their compressive strength at 28 days (CC) and 7 days (GC). Experimental modulus of elasticity (Ecm) and Poisson ratio (v) of concretes.
| | CC.32,5 | CC.42,5-A | CC.42,5-B | GC.15 | GC.22,5 | GC.30 |
|---|
| fck Cube (MPa) | 28.5 | 36.6 | 47.9 | 33.1 | 45.3 | 43.8 |
| Compressive strength class EN 206-1 | C20/25 | C25/30 | C35/45 | C25/30 | C35/45 | C30/37 |
| Modulus of Elasticity—Ecm (GPa) | 29.6 | 30.2 | 38.2 | 14.3 | 16.1 | 17.5 |
| Poisson ratio—v | 0.20 | 0.16 | 0.18 | 0.25 | 0.30 | 0.27 |
Table 5.
Maximum mid-span deflection and bending load.
Table 5.
Maximum mid-span deflection and bending load.
| Property | CC.32,5 | CC.42,5-A | CC.42,5-B | GC.15 | GC.22,5 | GC.30 |
|---|
| Max Bending Load (kΝ) | 341.7 | 373.0 | 414.4 | 249.1 | 259.4 | 238.7 |
| Max Mid-Span Deflection (μm) | 22.4 | 15.0 | 15.0 | 26.2 | 19.9 | 20.0 |
Table 6.
Maximum flexural tensile strength and tensile strain distortion on the bottom of prismatic specimens.
Table 6.
Maximum flexural tensile strength and tensile strain distortion on the bottom of prismatic specimens.
| Property | CC.32,5 | CC.42,5-A | CC.42,5-B | GC.15 | GC.22,5 | GC.30 |
|---|
| fct,fl Flexural Tensile Strength (MPa) | 8.0 | 9.0 | 9.7 | 6.2 | 5.8 | 5.4 |
| Tensile strain (ε) on the bottom side (μm) | 190.3 | 180.7 | 183.5 | 276.6 | 298.0 | 327.9 |
Table 7.
Maximum splitting tensile strength.
Table 7.
Maximum splitting tensile strength.
| Property | CC.32,5 | CC.42,5-A | CC.42,5-B | GC.15 | GC.22,5 | GC.30 |
|---|
| fct,sp Splitting Tensile Strength (MPa) | 2.1 | 3.2 | 4.1 | 2.6 | 2.2 | 2.5 |
Table 8.
Tensile strength (MPa) of CC and GC. Classification limits (Eurocode 2).
Table 8.
Tensile strength (MPa) of CC and GC. Classification limits (Eurocode 2).
| Calculation Method | CC.32,5 | CC.42,5-A | CC.42,5-B | GC.15 | GC.22,5 | GC.30 |
|---|
| Equation (4) | 4.0 | 4.5 | 4.9 | 3.1 | 2.9 | 2.7 |
| Equation (5) | 1.9 | 2.9 | 3.7 | 2.4 | 2.0 | 2.3 |
| Equation (7) | 2.4 | 2.9 | 3.4 | 2.7 | 3.3 | 3.2 |
| Classification Limits (Eurocode 2) | 1.5–2.9 | 1.8–3.3 | 2.2–4.2 | 1.8–3.3 | 2.2–4.2 | 2.0–3.8 |
Table 9.
Classification of the quality of concrete based on the UPV [
47].
Table 9.
Classification of the quality of concrete based on the UPV [
47].
| Quality Classification | Very Poor | Poor | Medium | Good | Excellent |
|---|
| UPV Limits (103 m/s) | <2.00 | 2.00–2.50 | 2.50–3.50 | 3.50–4.00 | >4.00 |
| Publisher’s Note: MDPI stays neutral with regard to jurisdictional claims in published maps and institutional affiliations. |
© 2021 by the authors. Licensee MDPI, Basel, Switzerland. This article is an open access article distributed under the terms and conditions of the Creative Commons Attribution (CC BY) license (https://creativecommons.org/licenses/by/4.0/).

 ,
, 


