
Mechanisms of Sustained Increases in γ Power Post-Ketamine in a Computational Model of the Hippocampal CA3: Implications for Ketamine’s Antidepressant Mechanism of Action


Abstract
:1. Introduction
2. Methods
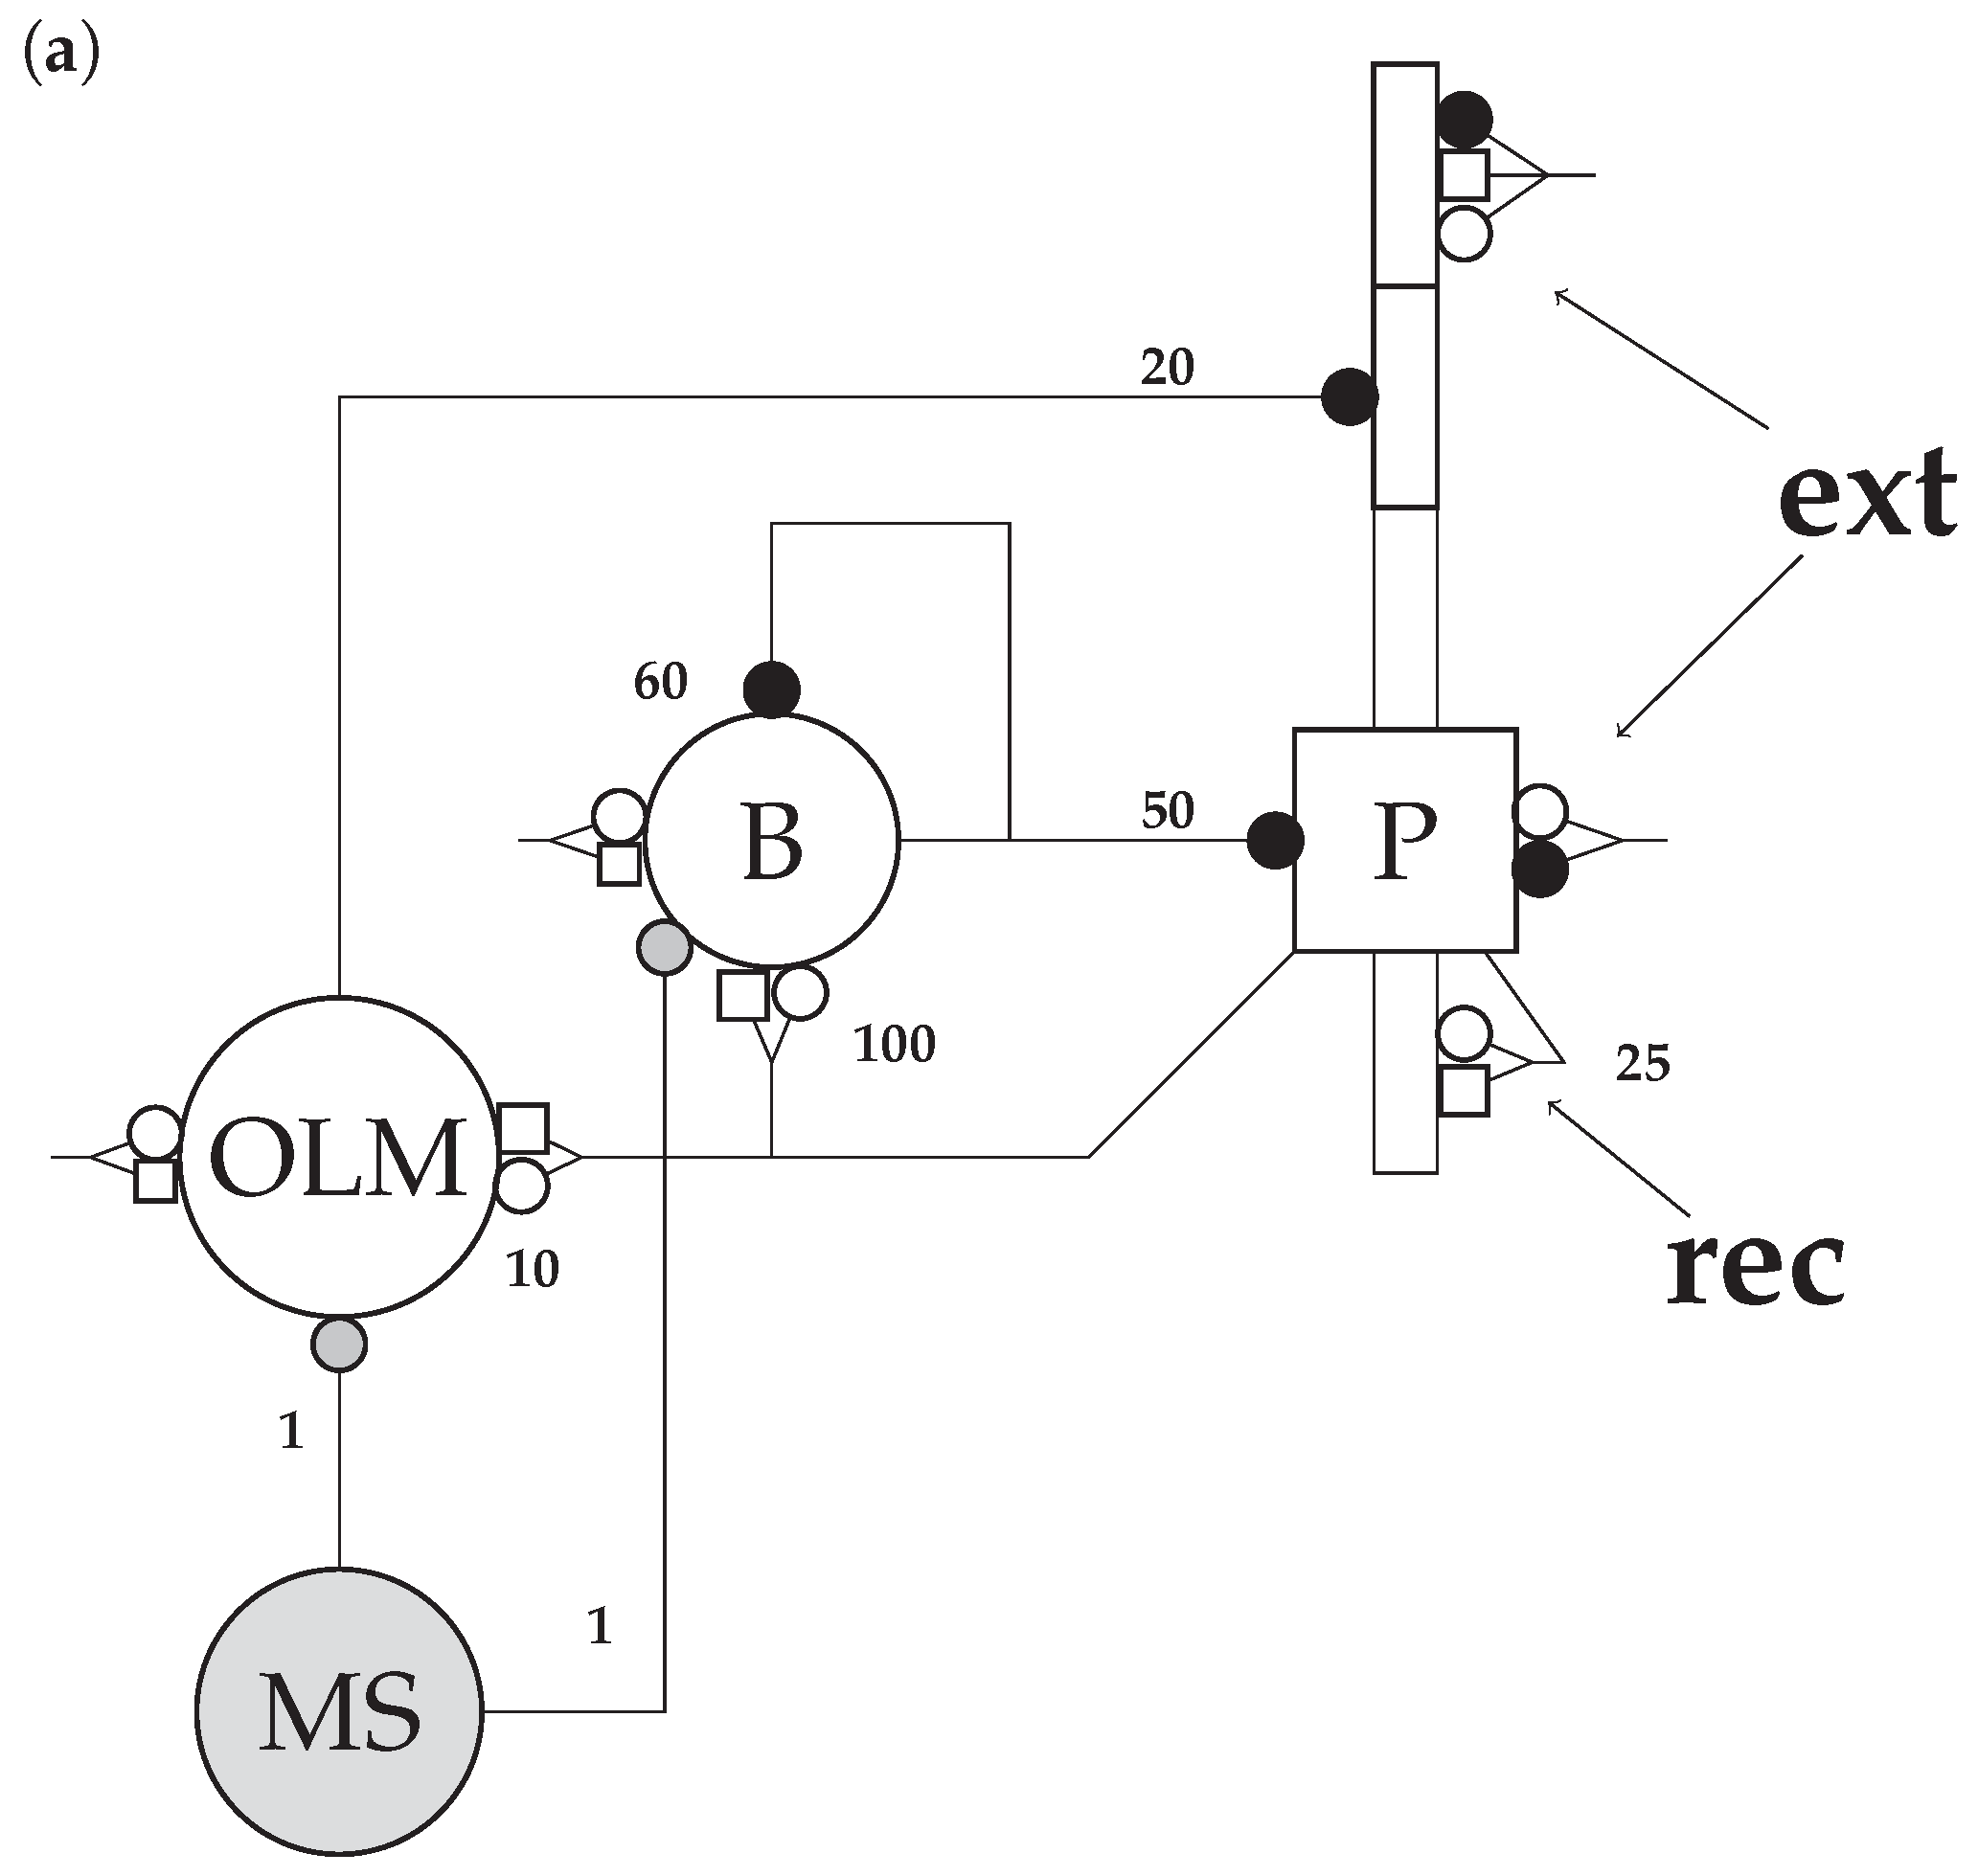
2.1. Network Model
2.2. Cells
2.2.1. Pyramidal Cells
2.2.2. Oriens–Lacunosum Moleculare (OLM) Cells
2.2.3. Basket Cells
2.3. Connectivity
2.3.1. Connections
2.3.2. Synapses
2.3.3. Background Activity
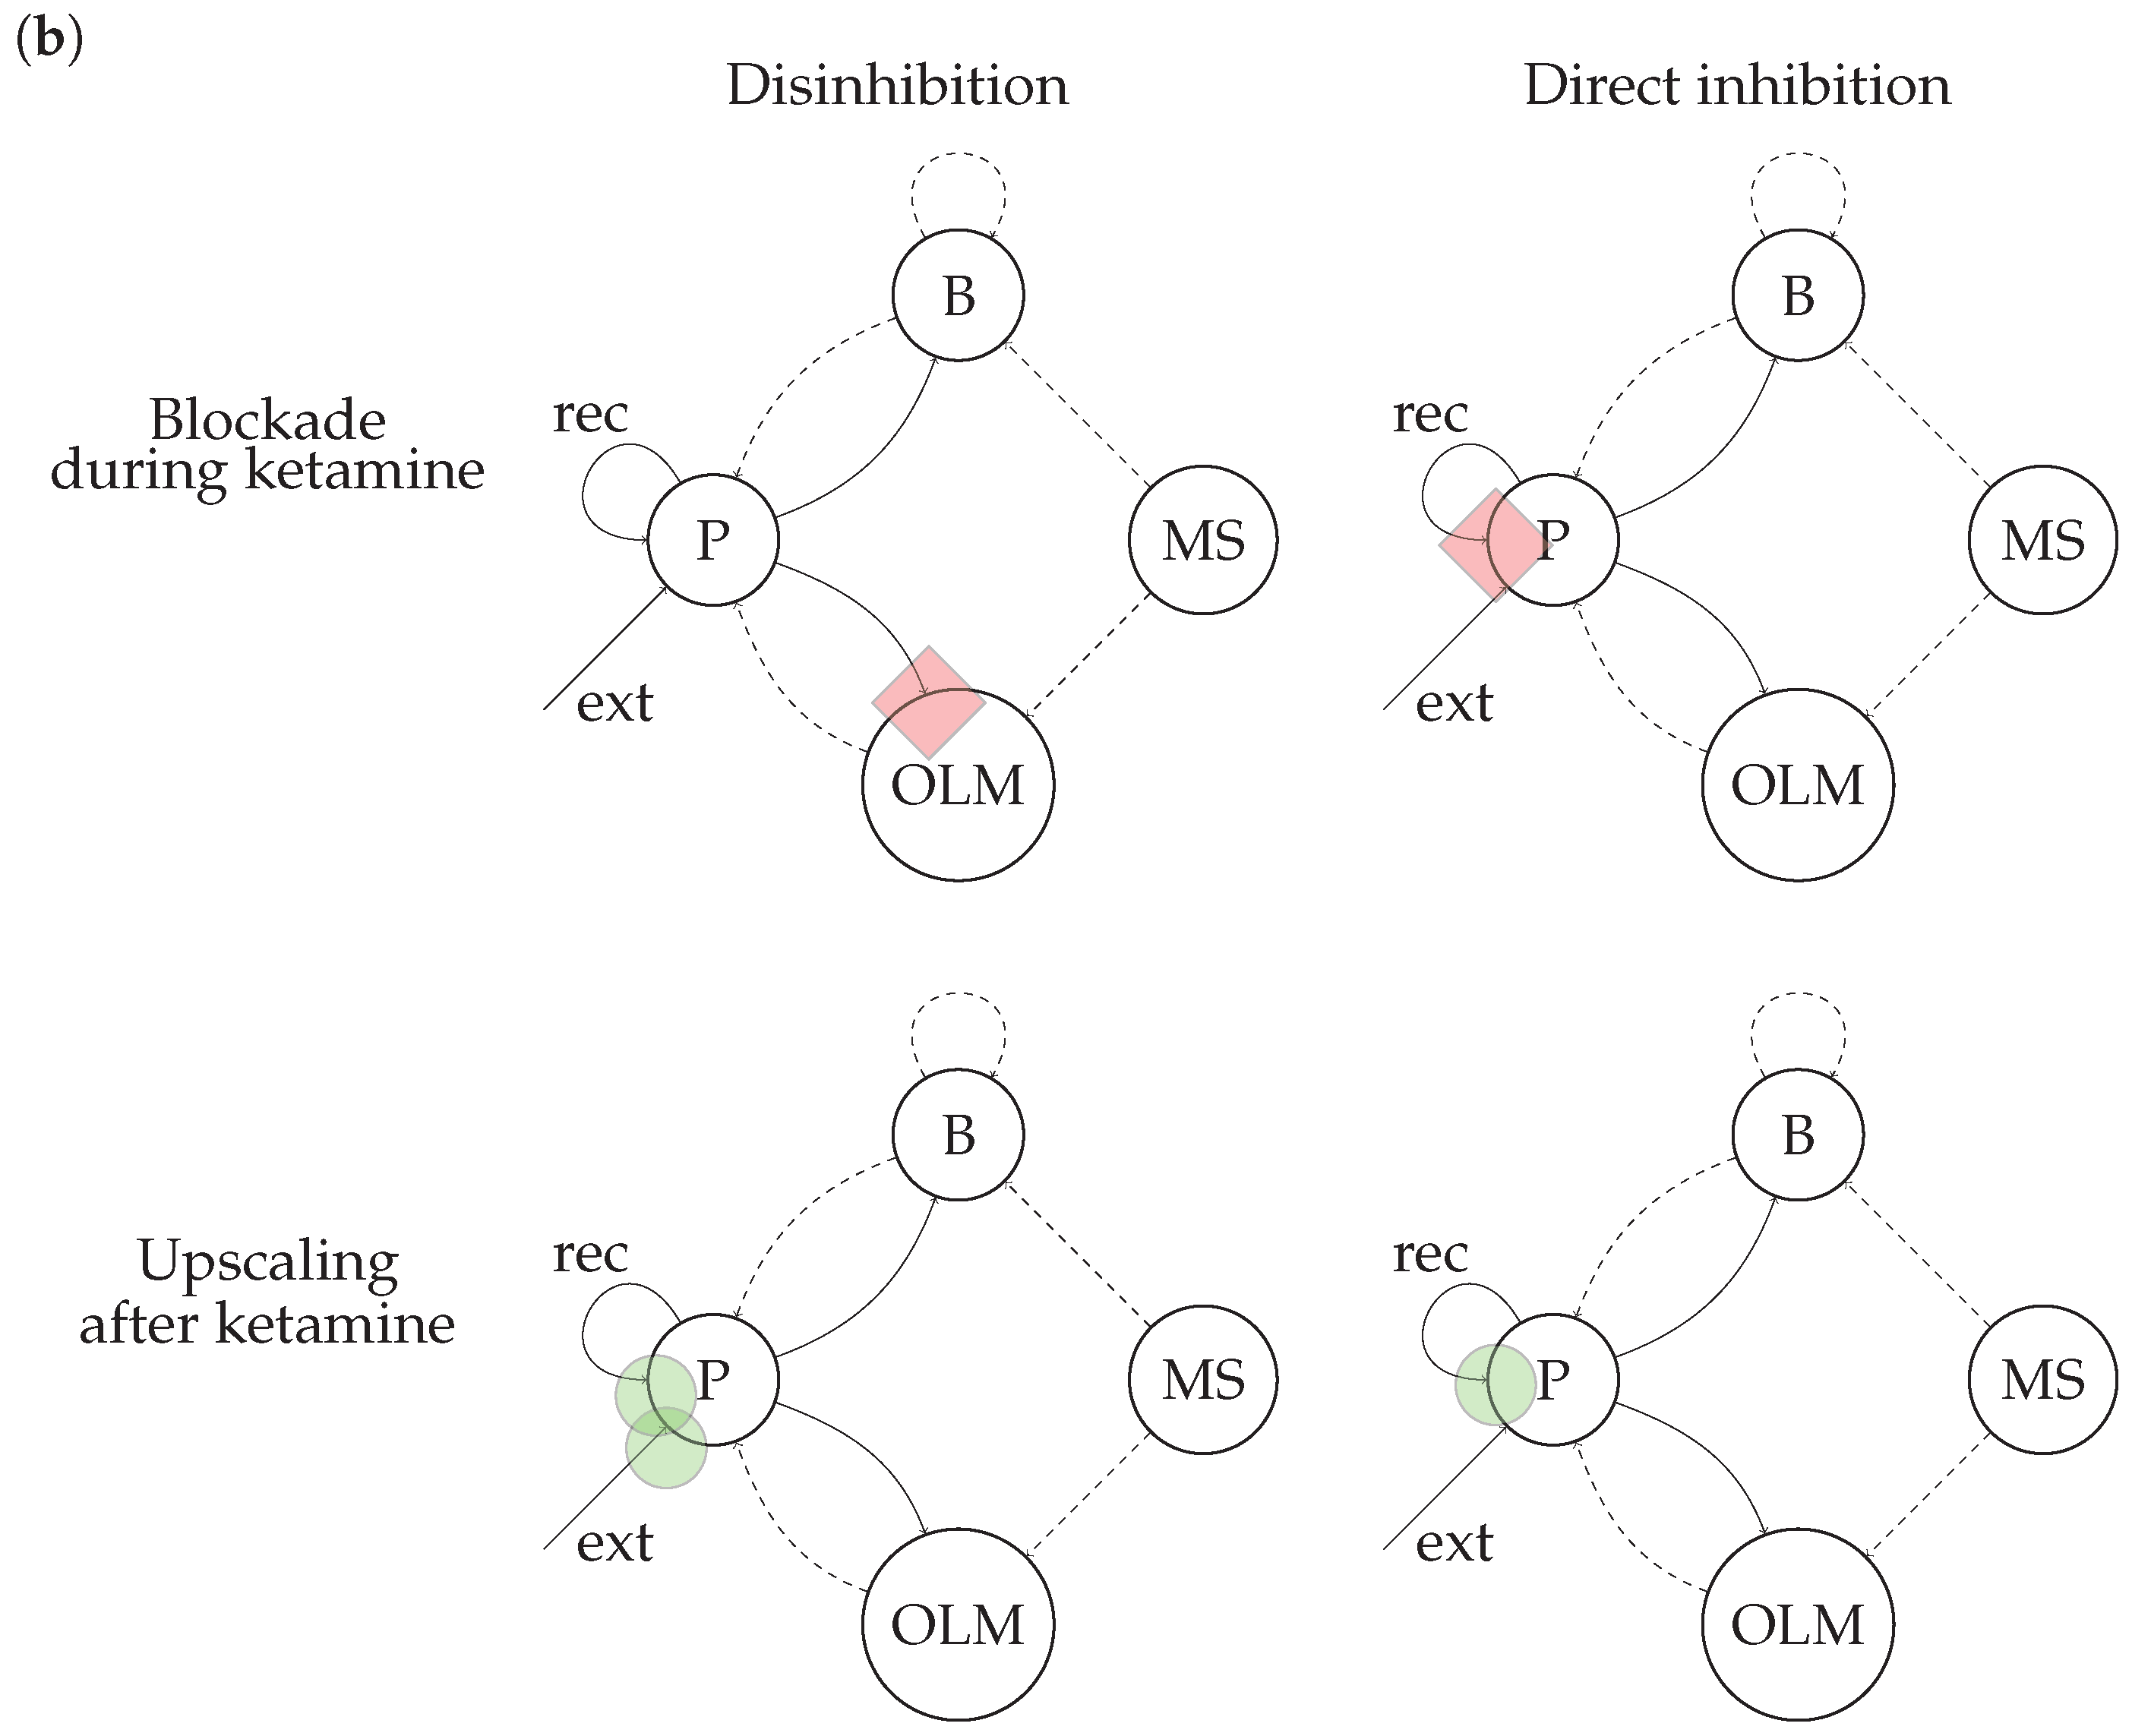
2.4. Experimental Conditions
Comparison of Effects of Direct Inhibition and Indirect Disinhibition on Power
3. Results
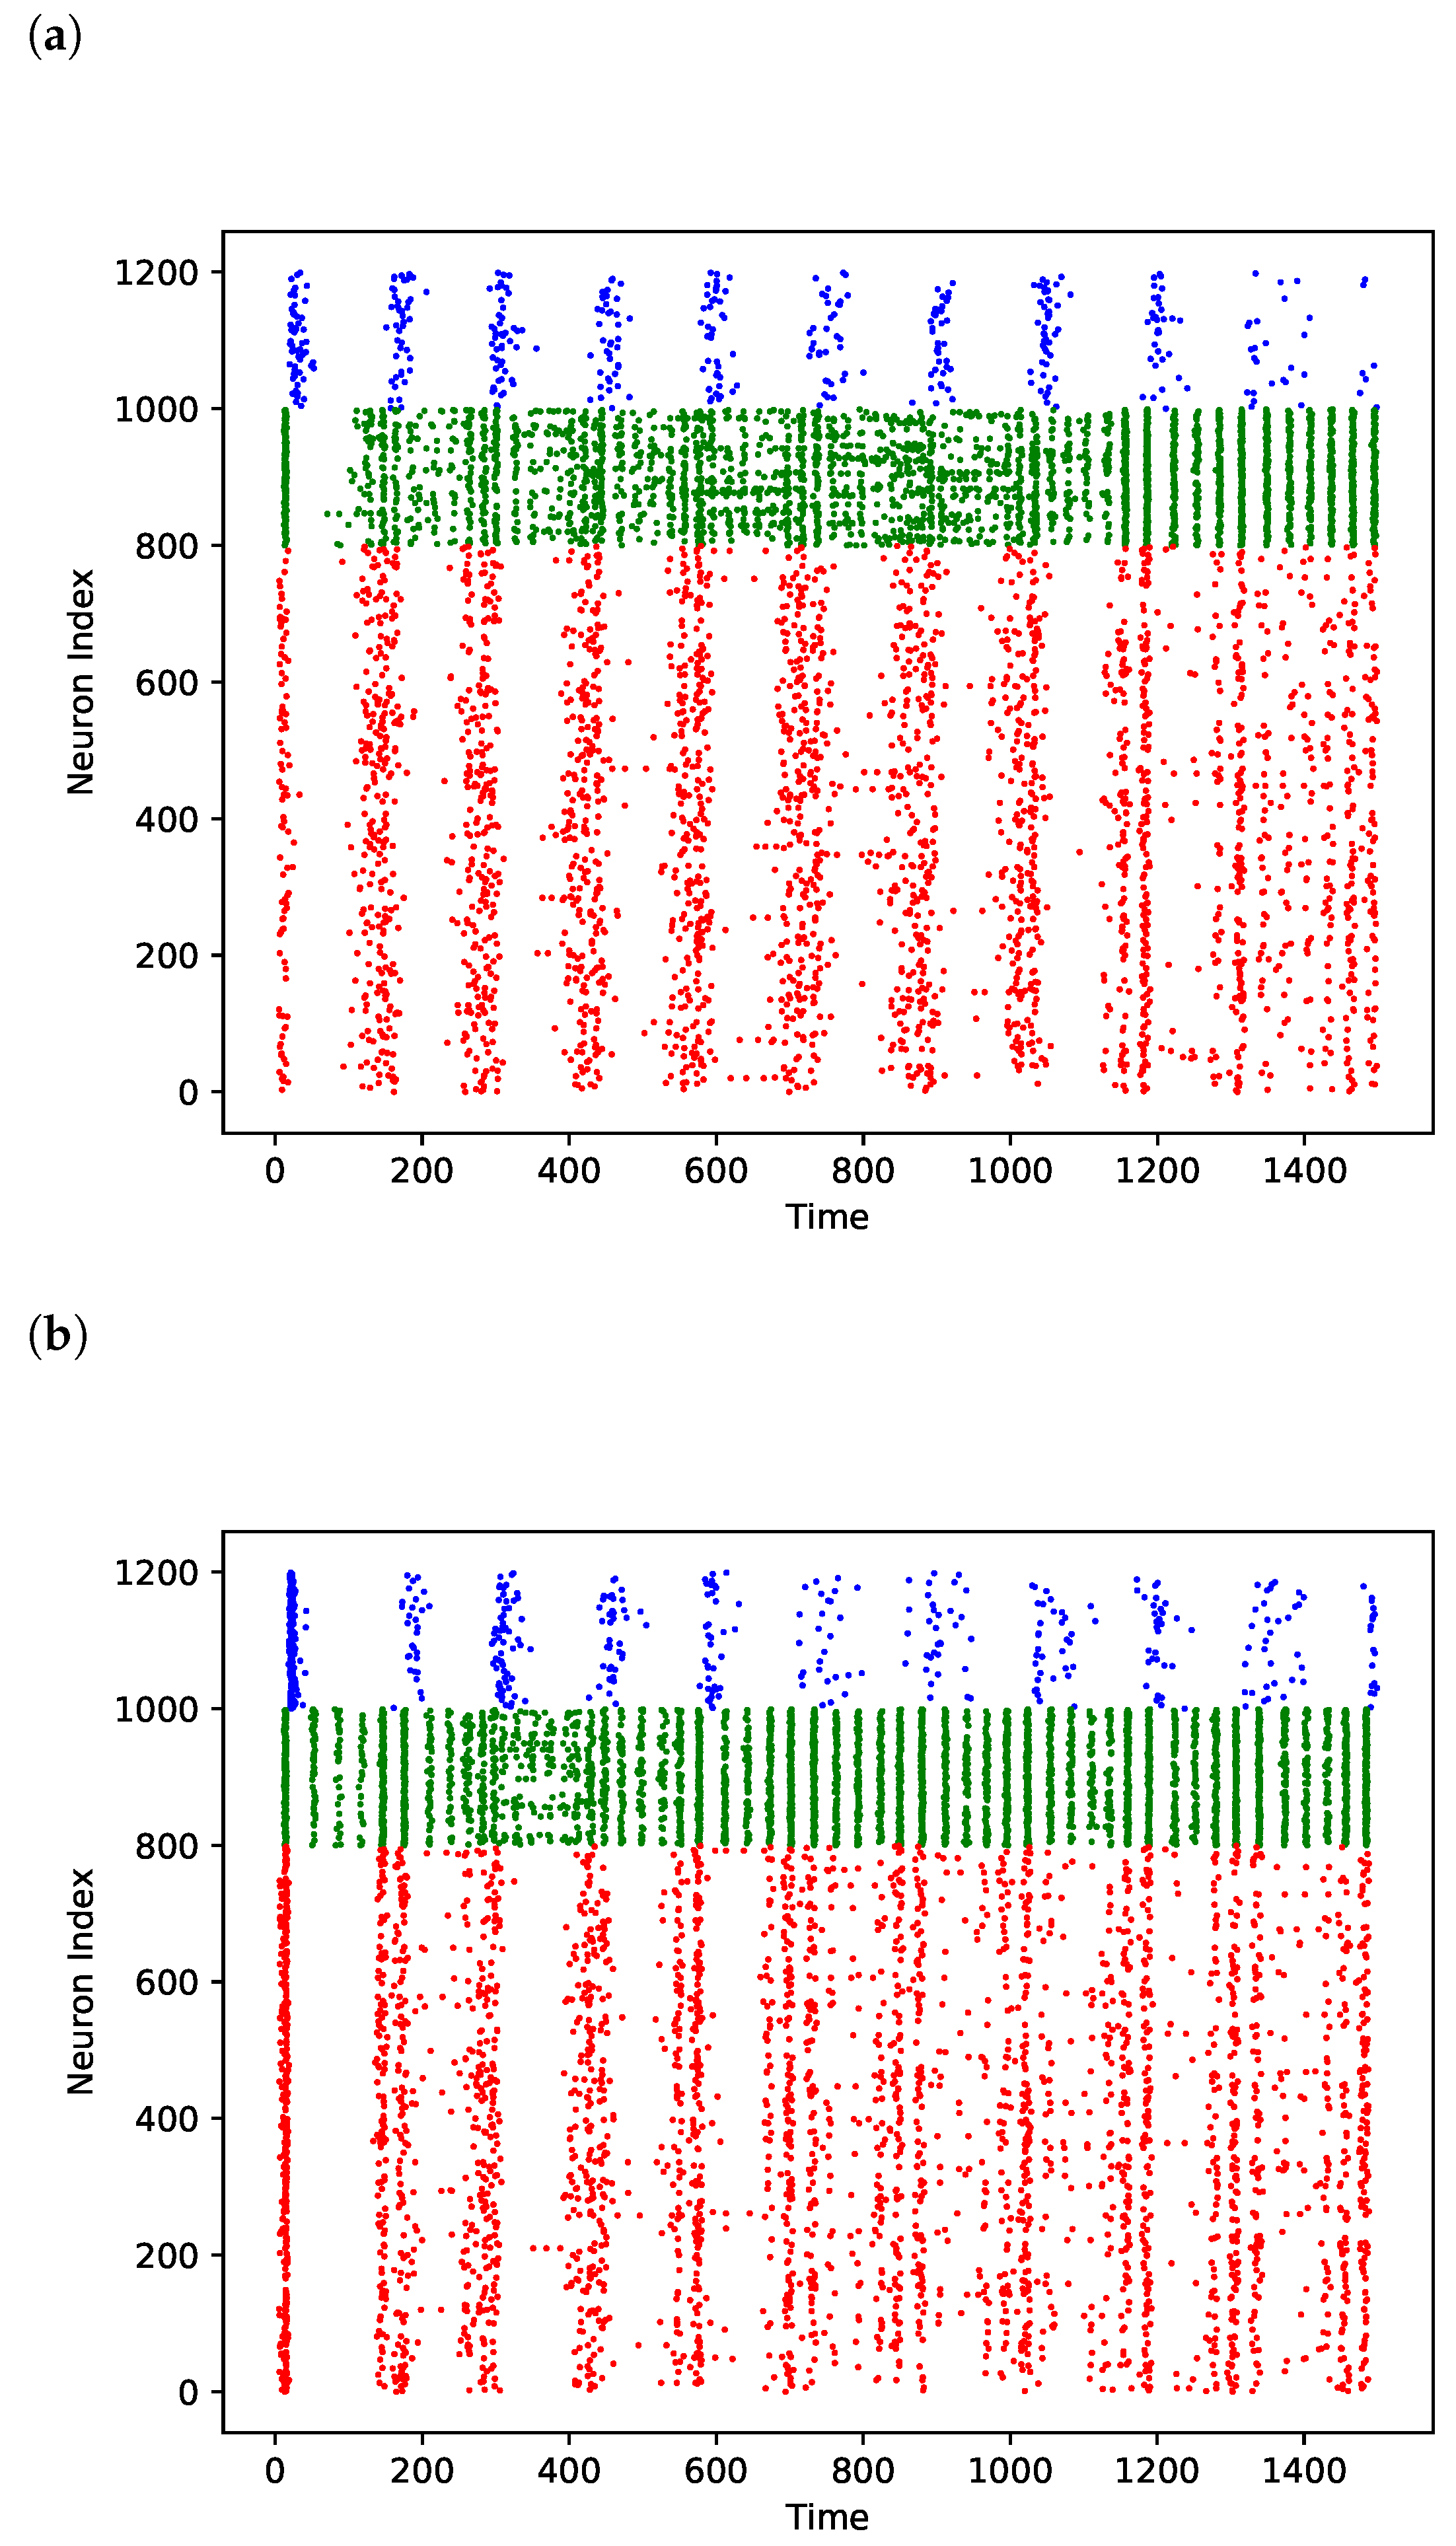
3.1. Comparison of Power Effects in Models of Direct Inhibition and Indirect Disinhibition
3.2. Explanation for Why Upscaling Does Not Impact
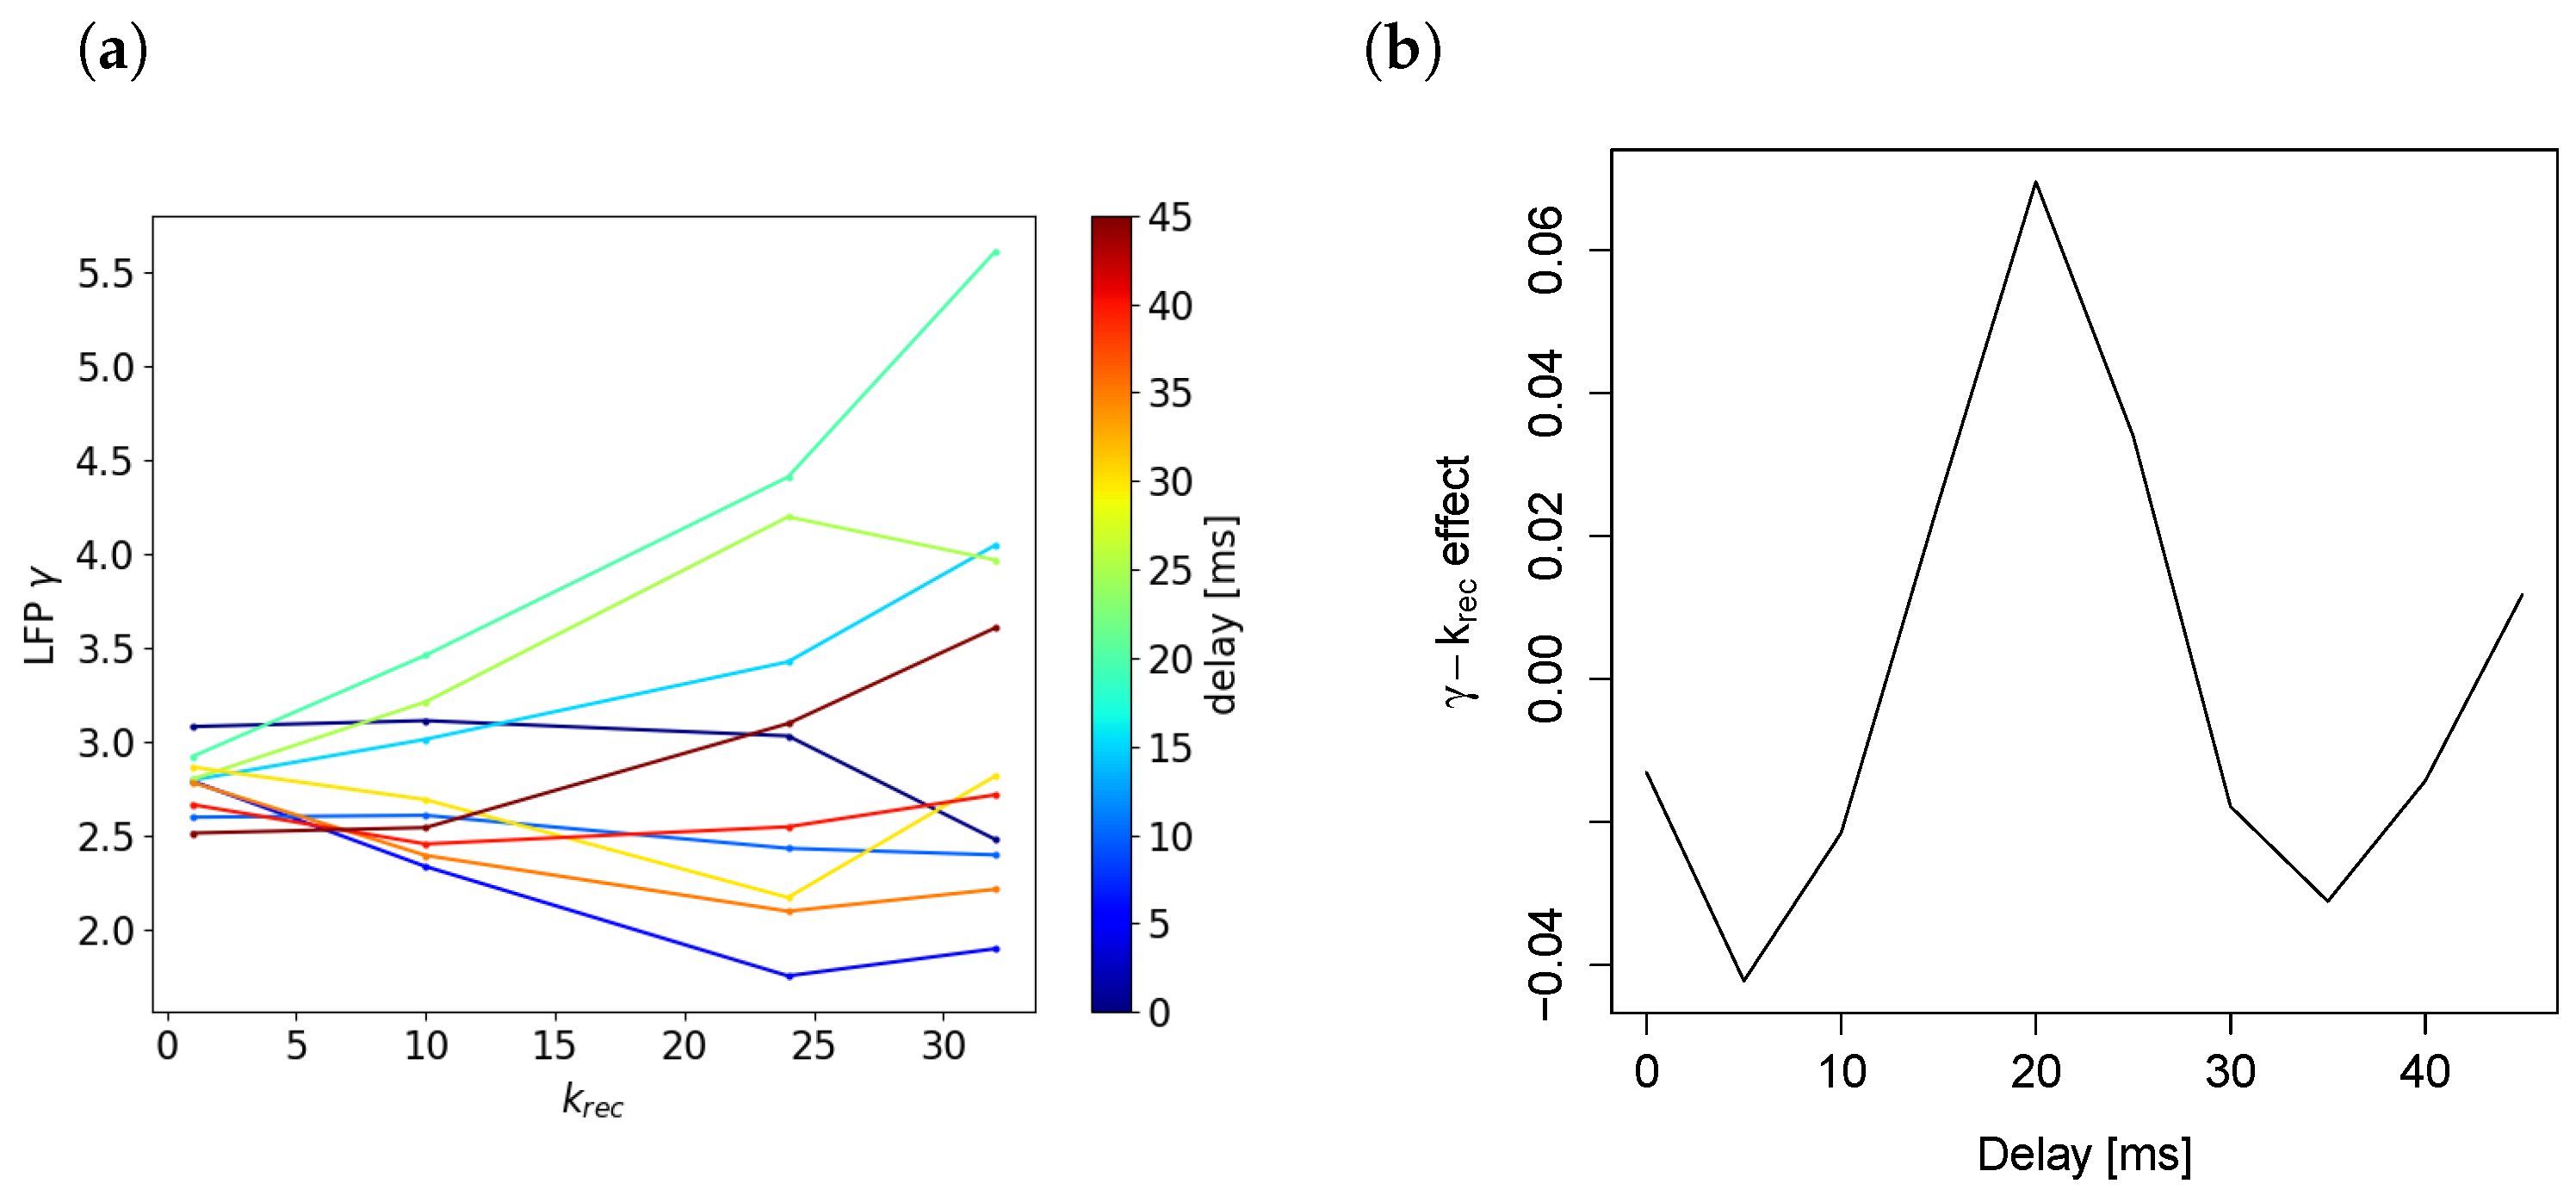
Relationship Depends on Timing of Population Spike Arriving through Recurrent Connections
4. Discussion
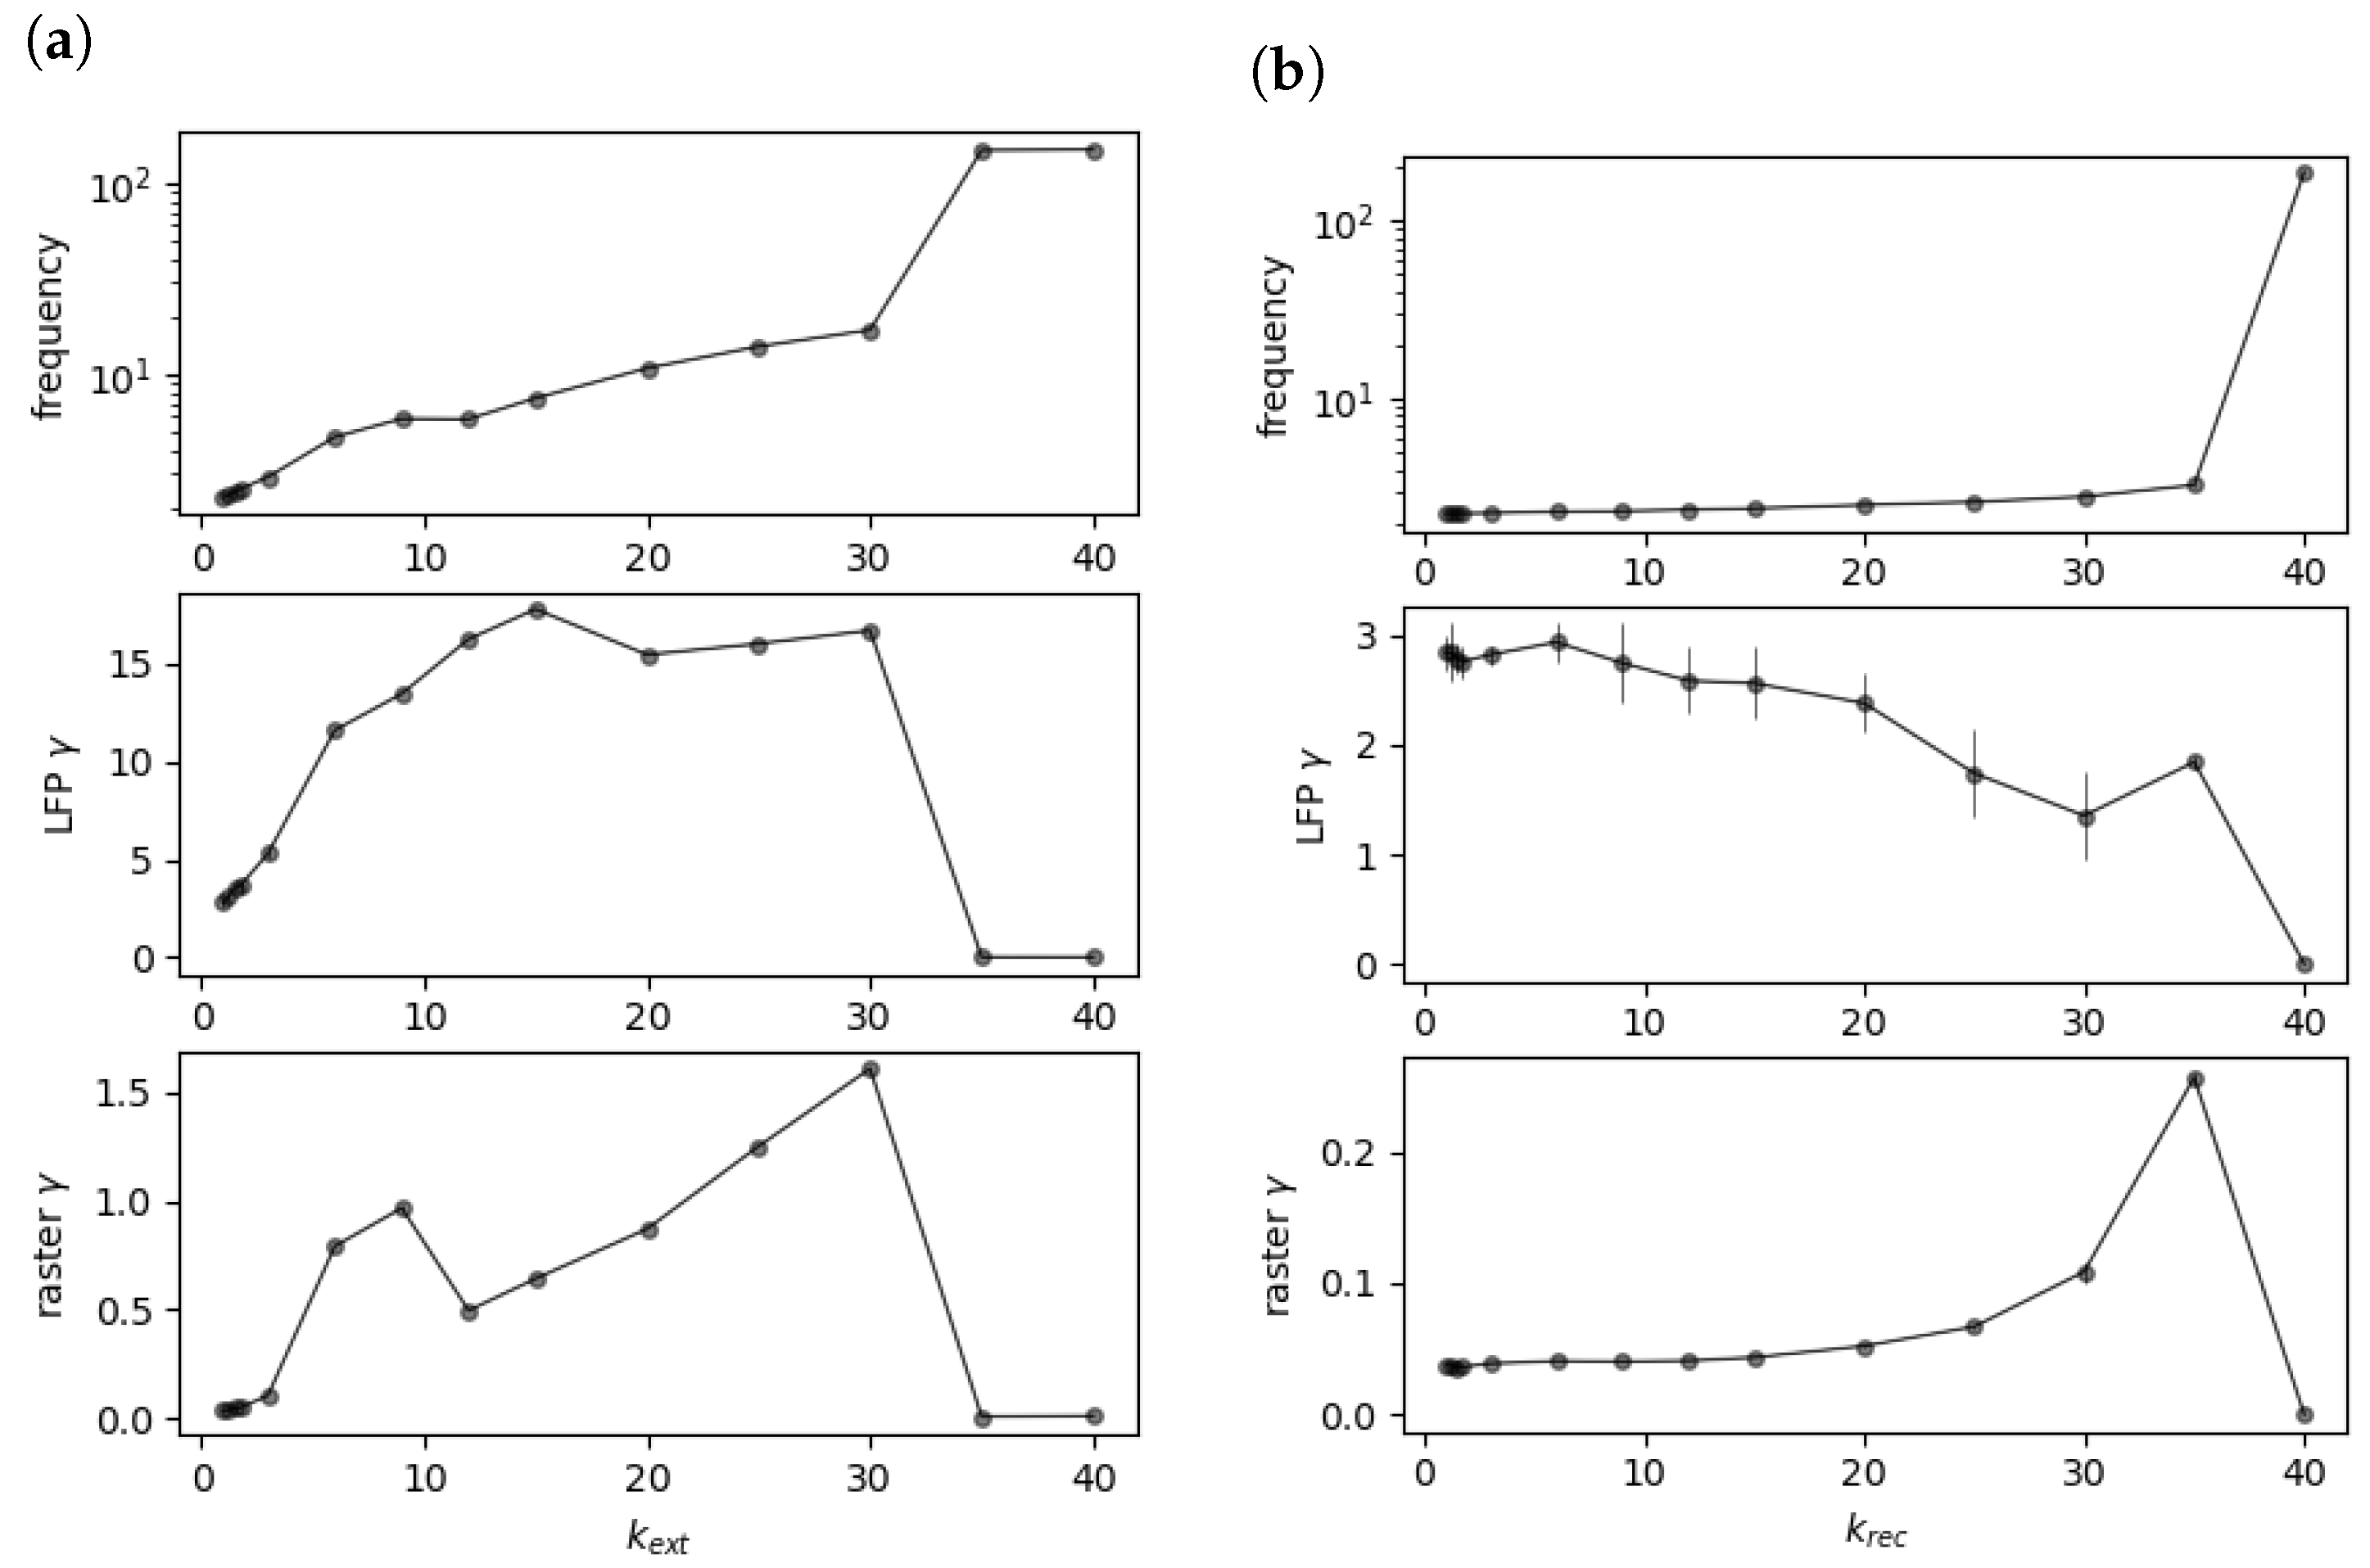
- The stimulation of excitatory pathways targeting the CA3 increases pyramidal firing frequency and power. This is testable with hippocampal slice recordings;
- The lesions of external inputs to the CA3 should decrease power and firing frequency directly, as well as diminish power increases post-ketamine;
- An increase in pyramidal cell activity caused by ketamine is enough to cause LTP of pyramidal cells targeting synapses. This would be testable with optogenetic stimulation of parts of the CA3 and by comparing the results of population excitatory postsynaptic potential slope recordings before and after stimulation, similar to previous LTP experiments [40];
- Ketamine increases the connection strength from external areas to the CA3. This would be indirectly testable through LFP recordings in the CA3 and afferent areas, as well as directly via slice stimulation/recording paradigms;
- Any external stimulation of the CA3 increases firing frequency and power in the long term. This should be testable with optogenetic stimulation, as well as recordings of LFPs and single units.
5. Conclusions
Author Contributions
Funding
Institutional Review Board Statement
Informed Consent Statement
Data Availability Statement
Conflicts of Interest
Abbreviations
| EEG | Electroencephalography |
| CA3 | Cornu ammonis 3 |
| NMDAR | N-methyl-D-aspartate receptor |
| GABA | Gamma-aminobutyric 16 acid |
| TRD | Treatment-resistant major depressive disorder |
| OLM | Oriens–lacunosum moleculare |
| BDNF | Brain-derived neurotrophic factor |
| LTP | Long-term potentiation |
| AMPAR | -amino-3-hydroxy-5-methyl-4-isoxazolepropionic acid receptor |
| eEF2 | Eukaryotic elongation factor 2 |
| CaMKII | Ca2+/calmodulin-dependent protein kinase II |
| S421 | Serine 421 |
References
- Phillips, J.L.; Norris, S.; Talbot, J.; Birmingham, M.; Hatchard, T.; Ortiz, A.; Owoeye, O.; Batten, L.A.; Blier, P. Single, Repeated, and Maintenance Ketamine Infusions for Treatment-Resistant Depression: A Randomized Controlled Trial. Am. J. Psychiatry 2019, 176, 401–409. [Google Scholar] [CrossRef]
- Maksimow, A.; Särkelä, M.; Långsjö, J.W.; Salmi, E.; Kaisti, K.K.; Yli-Hankala, A.; Hinkka-Yli-Salomäki, S.; Scheinin, H.; Jääskeläinen, S.K. Increase in High Frequency EEG Activity Explains the Poor Performance of EEG Spectral Entropy Monitor during S-ketamine Anesthesia. Clin. Neurophysiol. 2006, 117, 1660–1668. [Google Scholar] [CrossRef] [PubMed]
- Muthukumaraswamy, S.D.; Shaw, A.D.; Jackson, L.E.; Hall, J.; Moran, R.; Saxena, N. Evidence That Subanesthetic Doses of Ketamine Cause Sustained Disruptions of NMDA and AMPA-Mediated Frontoparietal Connectivity in Humans. J. Neurosci. 2015, 35, 11694–11706. [Google Scholar] [CrossRef] [PubMed]
- Zacharias, N.; Musso, F.; Müller, F.; Lammers, F.; Saleh, A.; London, M.; de Boer, P.; Winterer, G. Ketamine Effects on Default Mode Network Activity and Vigilance: A Randomized, Placebo-Controlled Crossover Simultaneous fMRI/EEG Study. Hum. Brain Mapp. 2020, 41, 107–119. [Google Scholar] [CrossRef]
- de la Salle, S.; Choueiry, J.; Shah, D.; Bowers, H.; McIntosh, J.; Ilivitsky, V.; Knott, V. Effects of Ketamine on Resting-State EEG Activity and Their Relationship to Perceptual/Dissociative Symptoms in Healthy Humans. Front. Pharmacol. 2016, 7, 348. [Google Scholar] [CrossRef] [PubMed]
- Hong, L.E.; Summerfelt, A.; Buchanan, R.W.; O’donnell, P.; Thaker, G.K.; Weiler, M.A.; Lahti, A.C. Gamma and Delta Neural Oscillations and Association with Clinical Symptoms under Subanesthetic Ketamine. Neuropsychopharmacology 2010, 35, 632–640. [Google Scholar] [CrossRef] [PubMed]
- Shaw, A.D.; Saxena, N.; Jackson, L.E.; Hall, J.E.; Singh, K.D.; Muthukumaraswamy, S.D. Ketamine Amplifies Induced Gamma Frequency Oscillations in the Human Cerebral Cortex. Eur. Neuropsychopharmacol. 2015, 25, 1136–1146. [Google Scholar] [CrossRef]
- Neymotin, S.A.; Lazarewicz, M.T.; Sherif, M.; Contreras, D.; Finkel, L.H.; Lytton, W.W. Ketamine Disrupts Theta Modulation of Gamma in a Computer Model of Hippocampus. J. Neurosci. 2011, 31, 11733–11743. [Google Scholar] [CrossRef]
- Nugent, A.C.; Ballard, E.D.; Gould, T.D.; Park, L.T.; Moaddel, R.; Brutsche, N.E.; Zarate, C.A. Ketamine Has Distinct Electrophysiological and Behavioral Effects in Depressed and Healthy Subjects. Mol. Psychiatry 2019, 24, 1040–1052. [Google Scholar] [CrossRef]
- Cornwell, B.R.; Salvadore, G.; Furey, M.; Marquardt, C.A.; Brutsche, N.E.; Grillon, C.; Zarate, C.A. Synaptic Potentiation Is Critical for Rapid Antidepressant Response to Ketamine in Treatment-Resistant Major Depression. Biol. Psychiatry 2012, 72, 555–561. [Google Scholar] [CrossRef]
- Gilbert, J.R.; Yarrington, J.S.; Wills, K.E.; Nugent, A.C.; Zarate, C.A. Glutamatergic Signaling Drives Ketamine-Mediated Response in Depression: Evidence from Dynamic Causal Modeling. Int. J. Neuropsychopharmacol. 2018, 21, 740–747. [Google Scholar] [CrossRef] [PubMed]
- Nugent, A.C.; Wills, K.E.; Gilbert, J.R.; Zarate, C.A. Synaptic Potentiation and Rapid Antidepressant Response to Ketamine in Treatment-Resistant Major Depression: A Replication Study. Psychiatry Res. Neuroimaging 2019, 283, 64–66. [Google Scholar] [CrossRef]
- Fitzgerald, P.J.; Watson, B.O. Gamma Oscillations as a Biomarker for Major Depression: An Emerging Topic. Transl. Psychiatry 2018, 8, 177. [Google Scholar] [CrossRef] [PubMed]
- de la Salle, S.; Phillips, J.L.; Blier, P.; Knott, V. Electrophysiological Correlates and Predictors of the Antidepressant Response to Repeated Ketamine Infusions in Treatment-Resistant Depression. Prog. Neuro-Psychopharmacol. Biol. Psychiatry 2022, 115, 110507. [Google Scholar] [CrossRef]
- Medeiros, G.C.; Matheson, M.; Demo, I.; Reid, M.J.; Matheson, S.; Twose, C.; Smith, G.S.; Gould, T.D.; Zarate, C.A.; Barrett, F.S.; et al. Brain-Based Correlates of Antidepressant Response to Ketamine: A Comprehensive Systematic Review of Neuroimaging Studies. Lancet Psychiatry 2023, 10, 790–800. [Google Scholar] [CrossRef]
- Arikan, M.K.; Gunver, M.G.; Tarhan, N.; Metin, B. High-Gamma: A Biological Marker for Suicide Attempt in Patients with Depression. J. Affect. Disord. 2019, 254, 1–6. [Google Scholar] [CrossRef]
- Gilbert, J.R.; Zarate, C.A. Electrophysiological Biomarkers of Antidepressant Response to Ketamine in Treatment-Resistant Depression: Gamma Power and Long-Term Potentiation. Pharmacol. Biochem. Behav. 2020, 189, 172856. [Google Scholar] [CrossRef]
- Price, R.B.; Duman, R. Neuroplasticity in Cognitive and Psychological Mechanisms of Depression: An Integrative Model. Mol. Psychiatry 2020, 25, 530–543. [Google Scholar] [CrossRef]
- Wang, Y.B.; Song, N.N.; Ding, Y.Q.; Zhang, L. Neural Plasticity and Depression Treatment. Ibro Neurosci. Rep. 2023, 14, 160–184. [Google Scholar] [CrossRef]
- Pirnia, T.; Joshi, S.H.; Leaver, A.M.; Vasavada, M.; Njau, S.; Woods, R.P.; Espinoza, R.; Narr, K.L. Electroconvulsive Therapy and Structural Neuroplasticity in Neocortical, Limbic and Paralimbic Cortex. Transl. Psychiatry 2016, 6, e832. [Google Scholar] [CrossRef]
- Galuske, R.A.W.; Munk, M.H.J.; Singer, W. Relation between Gamma Oscillations and Neuronal Plasticity in the Visual Cortex. Proc. Natl. Acad. Sci. USA 2019, 116, 23317–23325. [Google Scholar] [CrossRef] [PubMed]
- Suzuki, K.; Kim, J.W.; Nosyreva, E.; Kavalali, E.T.; Monteggia, L.M. Convergence of Distinct Signaling Pathways on Synaptic Scaling to Trigger Rapid Antidepressant Action. Cell Rep. 2021, 37, 109918. [Google Scholar] [CrossRef] [PubMed]
- Miller, O.H.; Moran, J.T.; Hall, B.J. Two Cellular Hypotheses Explaining the Initiation of Ketamine’s Antidepressant Actions: Direct Inhibition and Disinhibition. Neuropharmacology 2016, 100, 17–26. [Google Scholar] [CrossRef] [PubMed]
- Aleksandrova, L.R.; Phillips, A.G. Neuroplasticity as a Convergent Mechanism of Ketamine and Classical Psychedelics. Trends Pharmacol. Sci. 2021, 42, 929–942. [Google Scholar] [CrossRef] [PubMed]
- Zanos, P.; Gould, T.D. Mechanisms of Ketamine Action as an Antidepressant. Mol. Psychiatry 2018, 23, 801–811. [Google Scholar] [CrossRef] [PubMed]
- Sutton, M.A.; Taylor, A.M.; Ito, H.T.; Pham, A.; Schuman, E.M. Postsynaptic Decoding of Neural Activity: eEF2 as a Biochemical Sensor Coupling Miniature Synaptic Transmission to Local Protein Synthesis. Neuron 2007, 55, 648–661. [Google Scholar] [CrossRef]
- Kavalali, E.T.; Monteggia, L.M. Rapid Homeostatic Plasticity and Neuropsychiatric Therapeutics. Neuropsychopharmacology 2023, 48, 54–60. [Google Scholar] [CrossRef]
- Dayan, P. Theoretical Neuroscience: Computational and Mathematical Modeling of Neural Systems; Computational Neuroscience, MIT Press: Cambridge, MA, USA, 2001. [Google Scholar]
- Rebola, N.; Carta, M.; Mulle, C. Operation and Plasticity of Hippocampal CA3 Circuits: Implications for Memory Encoding. Nat. Rev. Neurosci. 2017, 18, 208–220. [Google Scholar] [CrossRef]
- Buzsáki, G.; Wang, X.J. Mechanisms of Gamma Oscillations. Annu. Rev. Neurosci. 2012, 35, 203–225. [Google Scholar] [CrossRef]
- Hemond, P.; Epstein, D.; Boley, A.; Migliore, M.; Ascoli, G.A.; Jaffe, D.B. Distinct Classes of Pyramidal Cells Exhibit Mutually Exclusive Firing Patterns in Hippocampal Area CA3b. Hippocampus 2008, 18, 411–424. [Google Scholar] [CrossRef]
- Aradi, I.; Holmes, W.R. Role of Multiple Calcium and Calcium-Dependent Conductances in Regulation of Hippocampal Dentate Granule Cell Excitability. J. Comput. Neurosci. 1999, 6, 215–235. [Google Scholar] [CrossRef]
- Destexhe, A.; Rudolph, M.; Paré, D. The High-Conductance State of Neocortical Neurons in Vivo. Nat. Rev. Neurosci. 2003, 4, 739–751. [Google Scholar] [CrossRef] [PubMed]
- Siegelbaum, S.A.; Kandel, E.R. Learning-Related Synaptic Plasticity: LTP and LTD. Curr. Opin. Neurobiol. 1991, 1, 113–120. [Google Scholar] [CrossRef] [PubMed]
- Petsche, H.; Stumpf, C.; Gogolak, G. The Significance of the Rabbit’s Septum as a Relay Station between the Midbrain and the Hippocampus I. The Control of Hippocampus Arousal Activity by the Septum Cells. Electroencephalogr. Clin. Neurophysiol. 1962, 14, 202–211. [Google Scholar] [CrossRef]
- Buzsáki, G.; Anastassiou, C.A.; Koch, C. The Origin of Extracellular Fields and Currents—EEG, ECoG, LFP and Spikes. Nat. Rev. Neurosci. 2012, 13, 407–420. [Google Scholar] [CrossRef] [PubMed]
- Autry, A.E.; Adachi, M.; Nosyreva, E.; Na, E.S.; Los, M.F.; Cheng, P.F.; Kavalali, E.T.; Monteggia, L.M. NMDA Receptor Blockade at Rest Triggers Rapid Behavioural Antidepressant Responses. Nature 2011, 475, 91–95. [Google Scholar] [CrossRef]
- McIntyre, R.S.; Rosenblat, J.D.; Nemeroff, C.B.; Sanacora, G.; Murrough, J.W.; Berk, M.; Brietzke, E.; Dodd, S.; Gorwood, P.; Ho, R.; et al. Synthesizing the Evidence for Ketamine and Esketamine in Treatment-Resistant Depression: An International Expert Opinion on the Available Evidence and Implementation. Am. J. Psychiatry 2021, 178, 383–399. [Google Scholar] [CrossRef]
- Fitzgerald, P.B.; Fountain, S.; Daskalakis, Z.J. A Comprehensive Review of the Effects of rTMS on Motor Cortical Excitability and Inhibition. Clin. Neurophysiol. 2006, 117, 2584–2596. [Google Scholar] [CrossRef]
- Namgung, U.; Valcourt, E.; Routtenberg, A. Long-Term Potentiation in Vivo in the Intact Mouse Hippocampus. Brain Res. 1995, 689, 85–92. [Google Scholar] [CrossRef]
- Liu, K.Y.; Gould, R.L.; Coulson, M.C.; Ward, E.V.; Howard, R.J. Tests of Pattern Separation and Pattern Completion in Humans—A Systematic Review. Hippocampus 2016, 26, 705–717. [Google Scholar] [CrossRef]
- Marr, D. Simple Memory: A Theory for Archicortex. Philos. Trans. R. Soc. Lond. Ser. B Biol. Sci. 1971, 262, 23–81. [Google Scholar] [CrossRef]
- McClelland, J.L.; McNaughton, B.L.; O’Reilly, R.C. Why There Are Complementary Learning Systems in the Hippocampus and Neocortex: Insights from the Successes and Failures of Connectionist Models of Learning and Memory. Psychol. Rev. 1995, 102, 419–457. [Google Scholar] [CrossRef] [PubMed]
- Rolls, E.T. Pattern Separation, Completion, and Categorisation in the Hippocampus and Neocortex. Neurobiol. Learn. Mem. 2016, 129, 4–28. [Google Scholar] [CrossRef]
- Videbech, P.; Ravnkilde, B. Hippocampal Volume and Depression: A Meta-Analysis of MRI Studies. Am. J. Psychiatry 2004, 161, 1957–1966. [Google Scholar] [CrossRef]
- Sun, Y.; Hu, N.; Wang, M.; Lu, L.; Luo, C.; Tang, B.; Yao, C.; Sweeney, J.A.; Gong, Q.; Qiu, C.; et al. Hippocampal Subfield Alterations in Schizophrenia and Major Depressive Disorder: A Systematic Review and Network Meta-Analysis of Anatomic MRI Studies. J. Psychiatry Neurosci. 2023, 48, E34–E49. [Google Scholar] [CrossRef] [PubMed]
- Ma, X.; Liu, J.; Liu, T.; Ma, L.; Wang, W.; Shi, S.; Wang, Y.; Gong, Q.; Wang, M. Altered Resting-State Functional Activity in Medication-Naive Patients with First-Episode Major Depression Disorder vs. Healthy Control: A Quantitative Meta-Analysis. Front. Behav. Neurosci. 2019, 13, 89. [Google Scholar] [CrossRef]
- Stern, S.; Sarkar, A.; Stern, T.; Mei, A.; Mendes, A.P.D.; Stern, Y.; Goldberg, G.; Galor, D.; Nguyen, T.; Randolph-Moore, L.; et al. Mechanisms Underlying the Hyperexcitability of CA3 and Dentate Gyrus Hippocampal Neurons Derived from Patients with Bipolar Disorder. Biol. Psychiatry 2020, 88, 139–149. [Google Scholar] [CrossRef]
- Stern, S.; Sarkar, A.; Galor, D.; Stern, T.; Mei, A.; Stern, Y.; Mendes, A.P.D.; Randolph-Moore, L.; Rouleau, G.; Bang, A.G.; et al. A Physiological Instability Displayed in Hippocampal Neurons Derived From Lithium-Nonresponsive Bipolar Disorder Patients. Biol. Psychiatry 2020, 88, 150–158. [Google Scholar] [CrossRef]
- Mertens, J.; Wang, Q.W.; Kim, Y.; Yu, D.X.; Pham, S.; Yang, B.; Zheng, Y.; Diffenderfer, K.E.; Zhang, J.; Soltani, S.; et al. Differential Responses to Lithium in Hyperexcitable Neurons from Patients with Bipolar Disorder. Nature 2015, 527, 95–99. [Google Scholar] [CrossRef]
- Santos, R.; Linker, S.B.; Stern, S.; Mendes, A.P.D.; Shokhirev, M.N.; Erikson, G.; Randolph-Moore, L.; Racha, V.; Kim, Y.; Kelsoe, J.R.; et al. Deficient LEF1 Expression Is Associated with Lithium Resistance and Hyperexcitability in Neurons Derived from Bipolar Disorder Patients. Mol. Psychiatry 2021, 26, 2440–2456. [Google Scholar] [CrossRef]
- Lopes-Aguiar, C.; Ruggiero, R.N.; Rossignoli, M.T.; Esteves, I.d.M.; Peixoto-Santos, J.E.; Romcy-Pereira, R.N.; Leite, J.P. Long-Term Potentiation Prevents Ketamine-Induced Aberrant Neurophysiological Dynamics in the Hippocampus-Prefrontal Cortex Pathway in Vivo. Sci. Rep. 2020, 10, 7167. [Google Scholar] [CrossRef] [PubMed]
- Li, C.; Li, Z.; Xu, S.; Jiang, S.; Ye, Z.; Yu, B.; Gong, S.; Li, J.; Hu, Q.; Feng, B.; et al. Exogenous AMPA Downregulates Gamma-Frequency Network Oscillation in CA3 of Rat Hippocampal Slices. Sci. Rep. 2023, 13, 10548. [Google Scholar] [CrossRef] [PubMed]
- Routley, B.C.; Singh, K.D.; Hamandi, K.; Muthukumaraswamy, S.D. The Effects of AMPA Receptor Blockade on Resting Magnetoencephalography Recordings. J. Psychopharmacol. 2017, 31, 1527–1536. [Google Scholar] [CrossRef] [PubMed]
- Fuchs, E.C.; Doheny, H.; Faulkner, H.; Caputi, A.; Traub, R.D.; Bibbig, A.; Kopell, N.; Whittington, M.A.; Monyer, H. Genetically Altered AMPA-type Glutamate Receptor Kinetics in Interneurons Disrupt Long-Range Synchrony of Gamma Oscillation. Proc. Natl. Acad. Sci. USA 2001, 98, 3571–3576. [Google Scholar] [CrossRef]
- Klemz, A.; Wildner, F.; Tütüncü, E.; Gerevich, Z. Regulation of Hippocampal Gamma Oscillations by Modulation of Intrinsic Neuronal Excitability. Front. Neural Circuits 2022, 15, 778022. [Google Scholar] [CrossRef]
- Zanos, P.; Moaddel, R.; Morris, P.J.; Georgiou, P.; Fischell, J.; Elmer, G.I.; Alkondon, M.; Yuan, P.; Pribut, H.J.; Singh, N.S.; et al. NMDAR Inhibition-Independent Antidepressant Actions of Ketamine Metabolites. Nature 2016, 533, 481–486. [Google Scholar] [CrossRef]
- Nikkheslat, N. Targeting Inflammation in Depression: Ketamine as an Anti-Inflammatory Antidepressant in Psychiatric Emergency. Brain Behav. Immun.-Health 2021, 18, 100383. [Google Scholar] [CrossRef]


| Presynaptic | Postsynaptic | Receptor | [ms] | [ms] | g [nS] |
|---|---|---|---|---|---|
| Pyramidal | Pyramidal | AMPA | 0.05 | 5.3 | 0.02 |
| Pyramidal | Pyramidal | NMDA | 15 | 150 | 0.004 |
| Pyramidal | Basket | AMPA | 0.05 | 5.3 | 0.36 |
| Pyramidal | Basket | NMDA | 15 | 150 | 1.38 |
| Pyramidal | OLM | AMPA | 0.05 | 5.3 | 0.36 |
| Pyramidal | OLM | NMDA | 15 | 150 | 0.7 |
| Basket | Pyramidal | 0.07 | 9.1 | 0.72 | |
| Basket | Basket | 0.07 | 9.1 | 4.5 | |
| OLM | Pyramidal | 0.2 | 20 | 72 | |
| MS | Basket | 20 | 40 | 1.6 | |
| MS | OLM | 20 | 40 | 1.6 |
| Cell | Section | Synapse | [ms] | [ms] | g [nS] |
|---|---|---|---|---|---|
| Pyramidal | Soma | AMPA | 0.05 | 5.3 | 0.05 |
| Pyramidal | Soma | 0.07 | 9.1 | 0.012 | |
| Pyramidal | Adend3 | AMPA | 0.05 | 5.3 | 0.05 |
| Pyramidal | Adend3 | NMDA | 15 | 150 | 6.5 |
| Pyramidal | Adend3 | 0.07 | 9.1 | 0.012 | |
| Basket | Soma | AMPA | 0.05 | 5.3 | 0.02 |
| Basket | Soma | 0.07 | 9.1 | 0.2 | |
| OLM | Soma | AMPA | 0.05 | 5.3 | 0.0625 |
| OLM | Soma | 0.07 | 9.1 | 0.2 |
| Predictors | Estimates () | CI | p |
|---|---|---|---|
| (Intercept) | −1.30 | −1.86–−0.74 | <0.001 |
| 0.13 | −0.15–0.42 | 0.362 | |
| 1.17 | 0.89–1.46 | <0.001 | |
| Observations | 256 | ||
| / adjusted | 0.209/0.203 | ||
| Variable | Estimate | CI | p-Value |
|---|---|---|---|
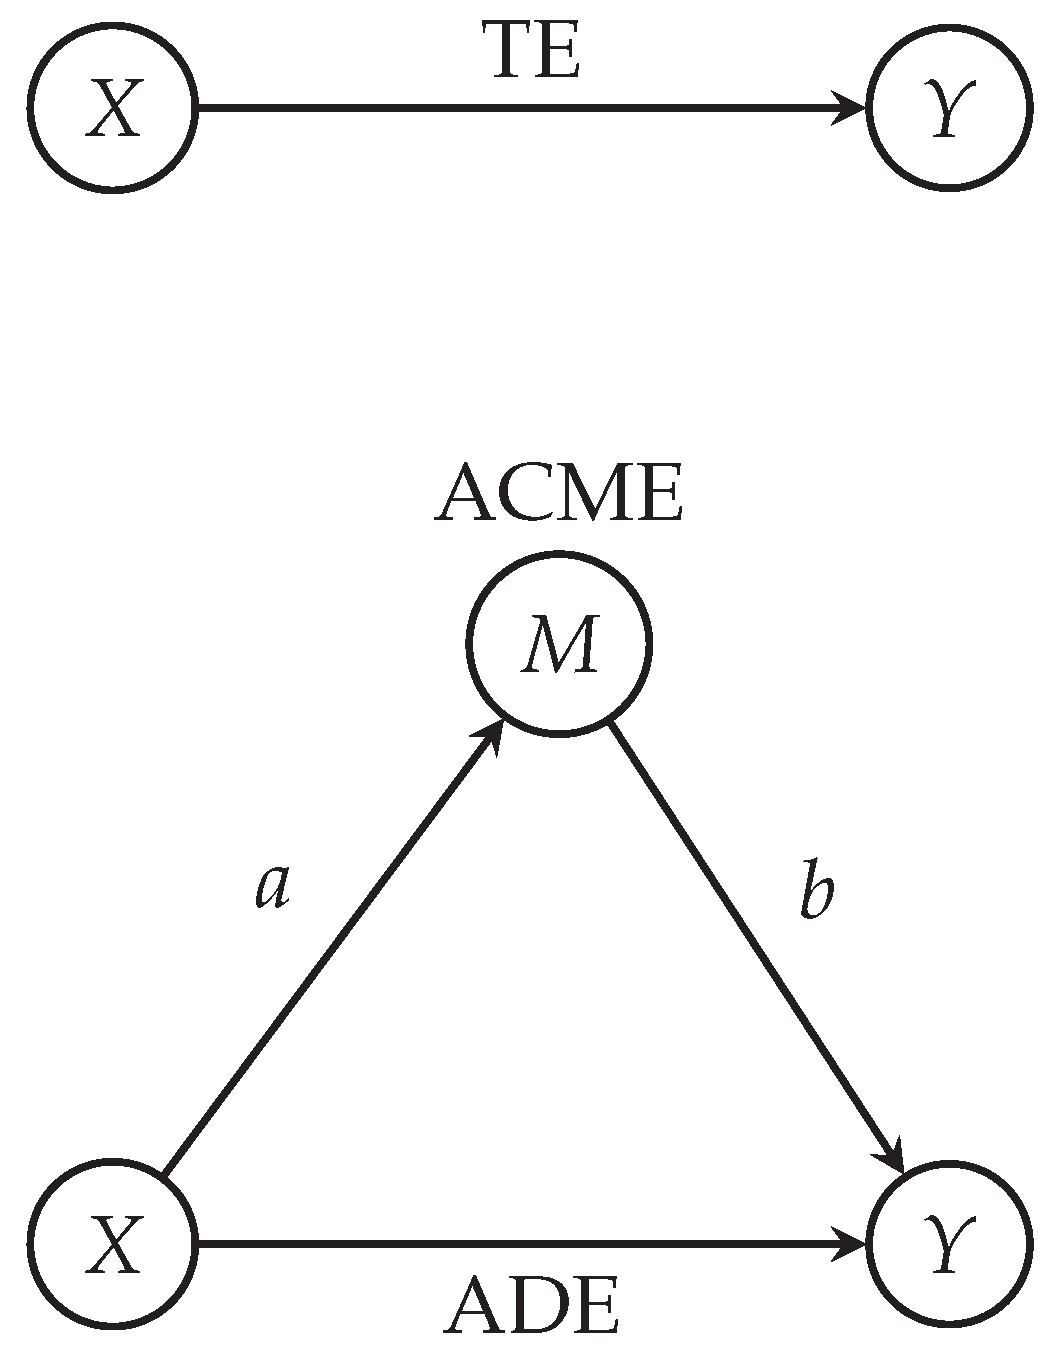
| ACME | 0.608 | 0.416–0.81 | < |
| ADE | 0.105 | −0.104–0.30 | 0.32 |
| Total Effect | 0.713 | 0.645–0.77 | < |
| Prop. Mediated | 0.850 | 0.582–1.15 | < |
Disclaimer/Publisher’s Note: The statements, opinions and data contained in all publications are solely those of the individual author(s) and contributor(s) and not of MDPI and/or the editor(s). MDPI and/or the editor(s) disclaim responsibility for any injury to people or property resulting from any ideas, methods, instructions or products referred to in the content. |
© 2023 by the authors. Licensee MDPI, Basel, Switzerland. This article is an open access article distributed under the terms and conditions of the Creative Commons Attribution (CC BY) license (https://creativecommons.org/licenses/by/4.0/).
Share and Cite
Petzi, M.; Singh, S.; Trappenberg, T.; Nunes, A. Mechanisms of Sustained Increases in γ Power Post-Ketamine in a Computational Model of the Hippocampal CA3: Implications for Ketamine’s Antidepressant Mechanism of Action. Brain Sci. 2023, 13, 1562. https://doi.org/10.3390/brainsci13111562
Petzi M, Singh S, Trappenberg T, Nunes A. Mechanisms of Sustained Increases in γ Power Post-Ketamine in a Computational Model of the Hippocampal CA3: Implications for Ketamine’s Antidepressant Mechanism of Action. Brain Sciences. 2023; 13(11):1562. https://doi.org/10.3390/brainsci13111562
Chicago/Turabian StylePetzi, Maximilian, Selena Singh, Thomas Trappenberg, and Abraham Nunes. 2023. "Mechanisms of Sustained Increases in γ Power Post-Ketamine in a Computational Model of the Hippocampal CA3: Implications for Ketamine’s Antidepressant Mechanism of Action" Brain Sciences 13, no. 11: 1562. https://doi.org/10.3390/brainsci13111562