
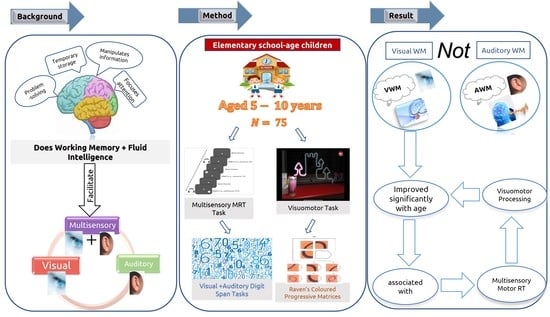
The Contribution of Visual and Auditory Working Memory and Non-Verbal IQ to Motor Multisensory Processing in Elementary School Children

Abstract
:
1. Introduction
- (i)
- to investigate the apparent concurrent developmental changes in classical measures of WM, such as visual and auditory digit span, and nonverbal IQ (RCPM);
- (ii)
- to investigate developmental changes in the associations between age, nonverbal IQ (RCPM), visual and auditory STM and WM, and multisensory processing when measured by MRTs; and
- (iii)
- to determine how visual and auditory STM and WM and nonverbal IQ contribute to MRTs for multisensory processing.
2. Method
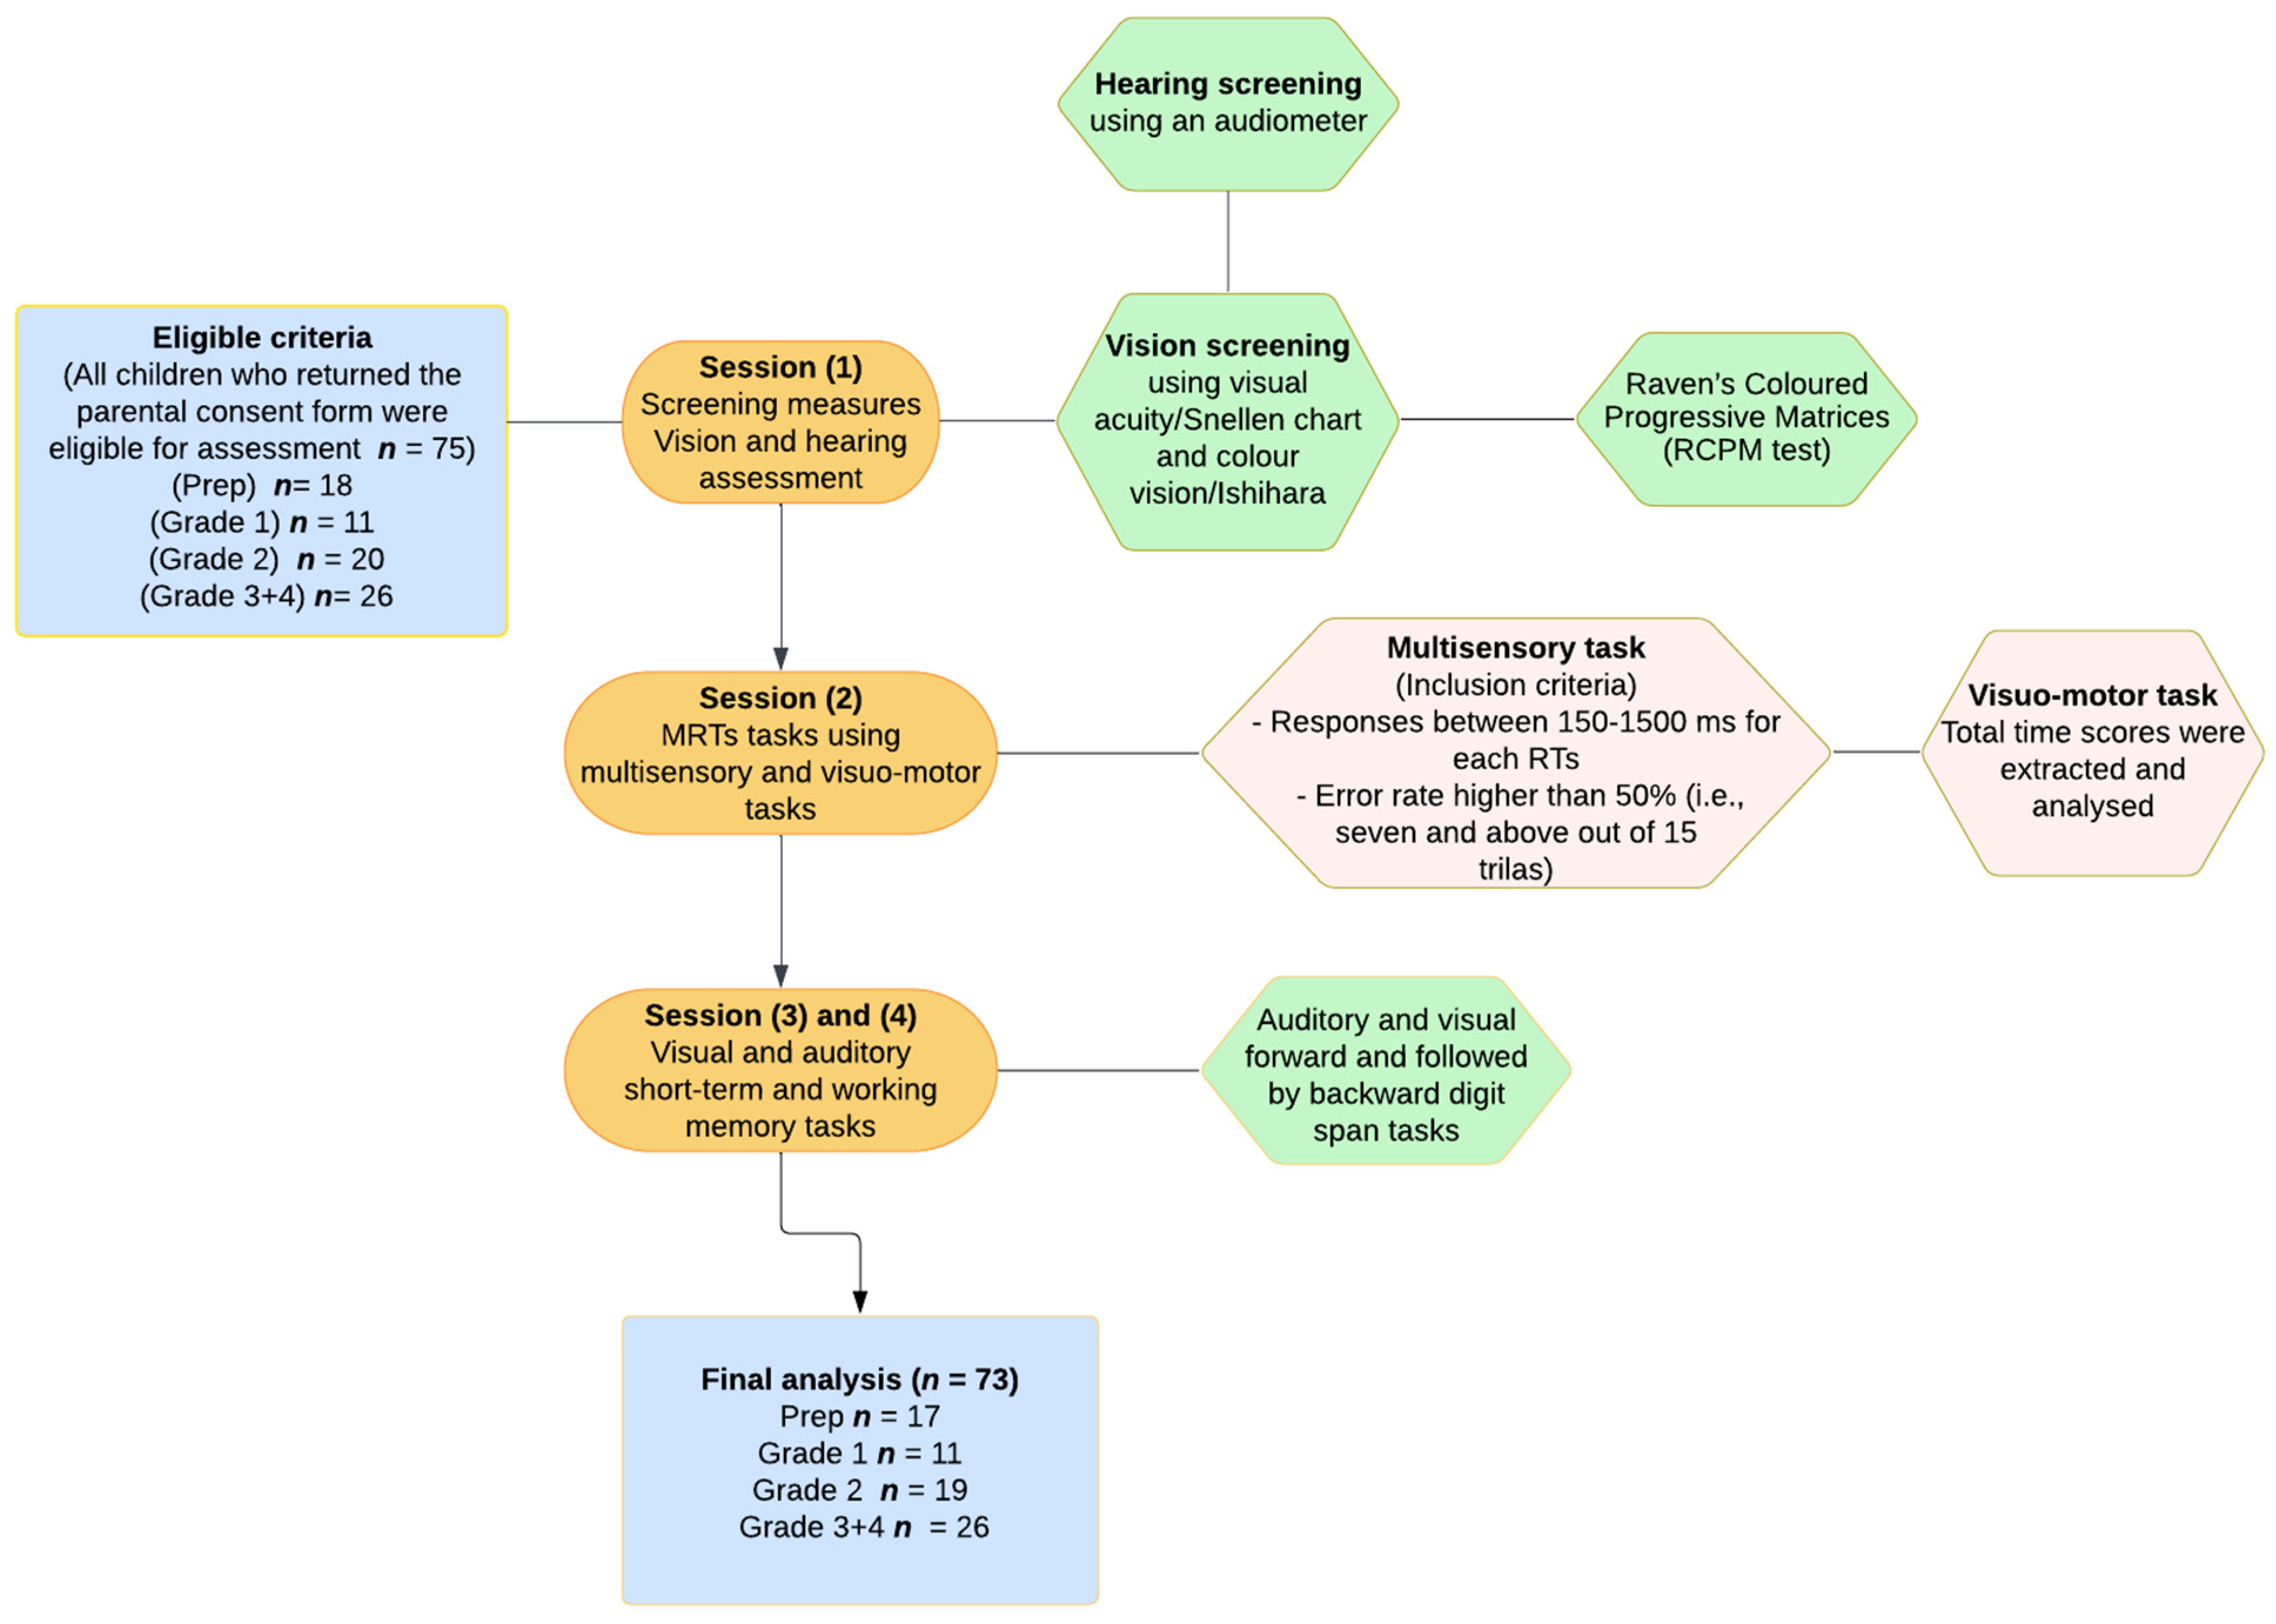
2.1. Participants
2.2. Screening and Psychometric Measures
2.2.1. Vision and Hearing Screening
2.2.2. Nonverbal Intelligence (RCPM)
2.3. Experimental Measures
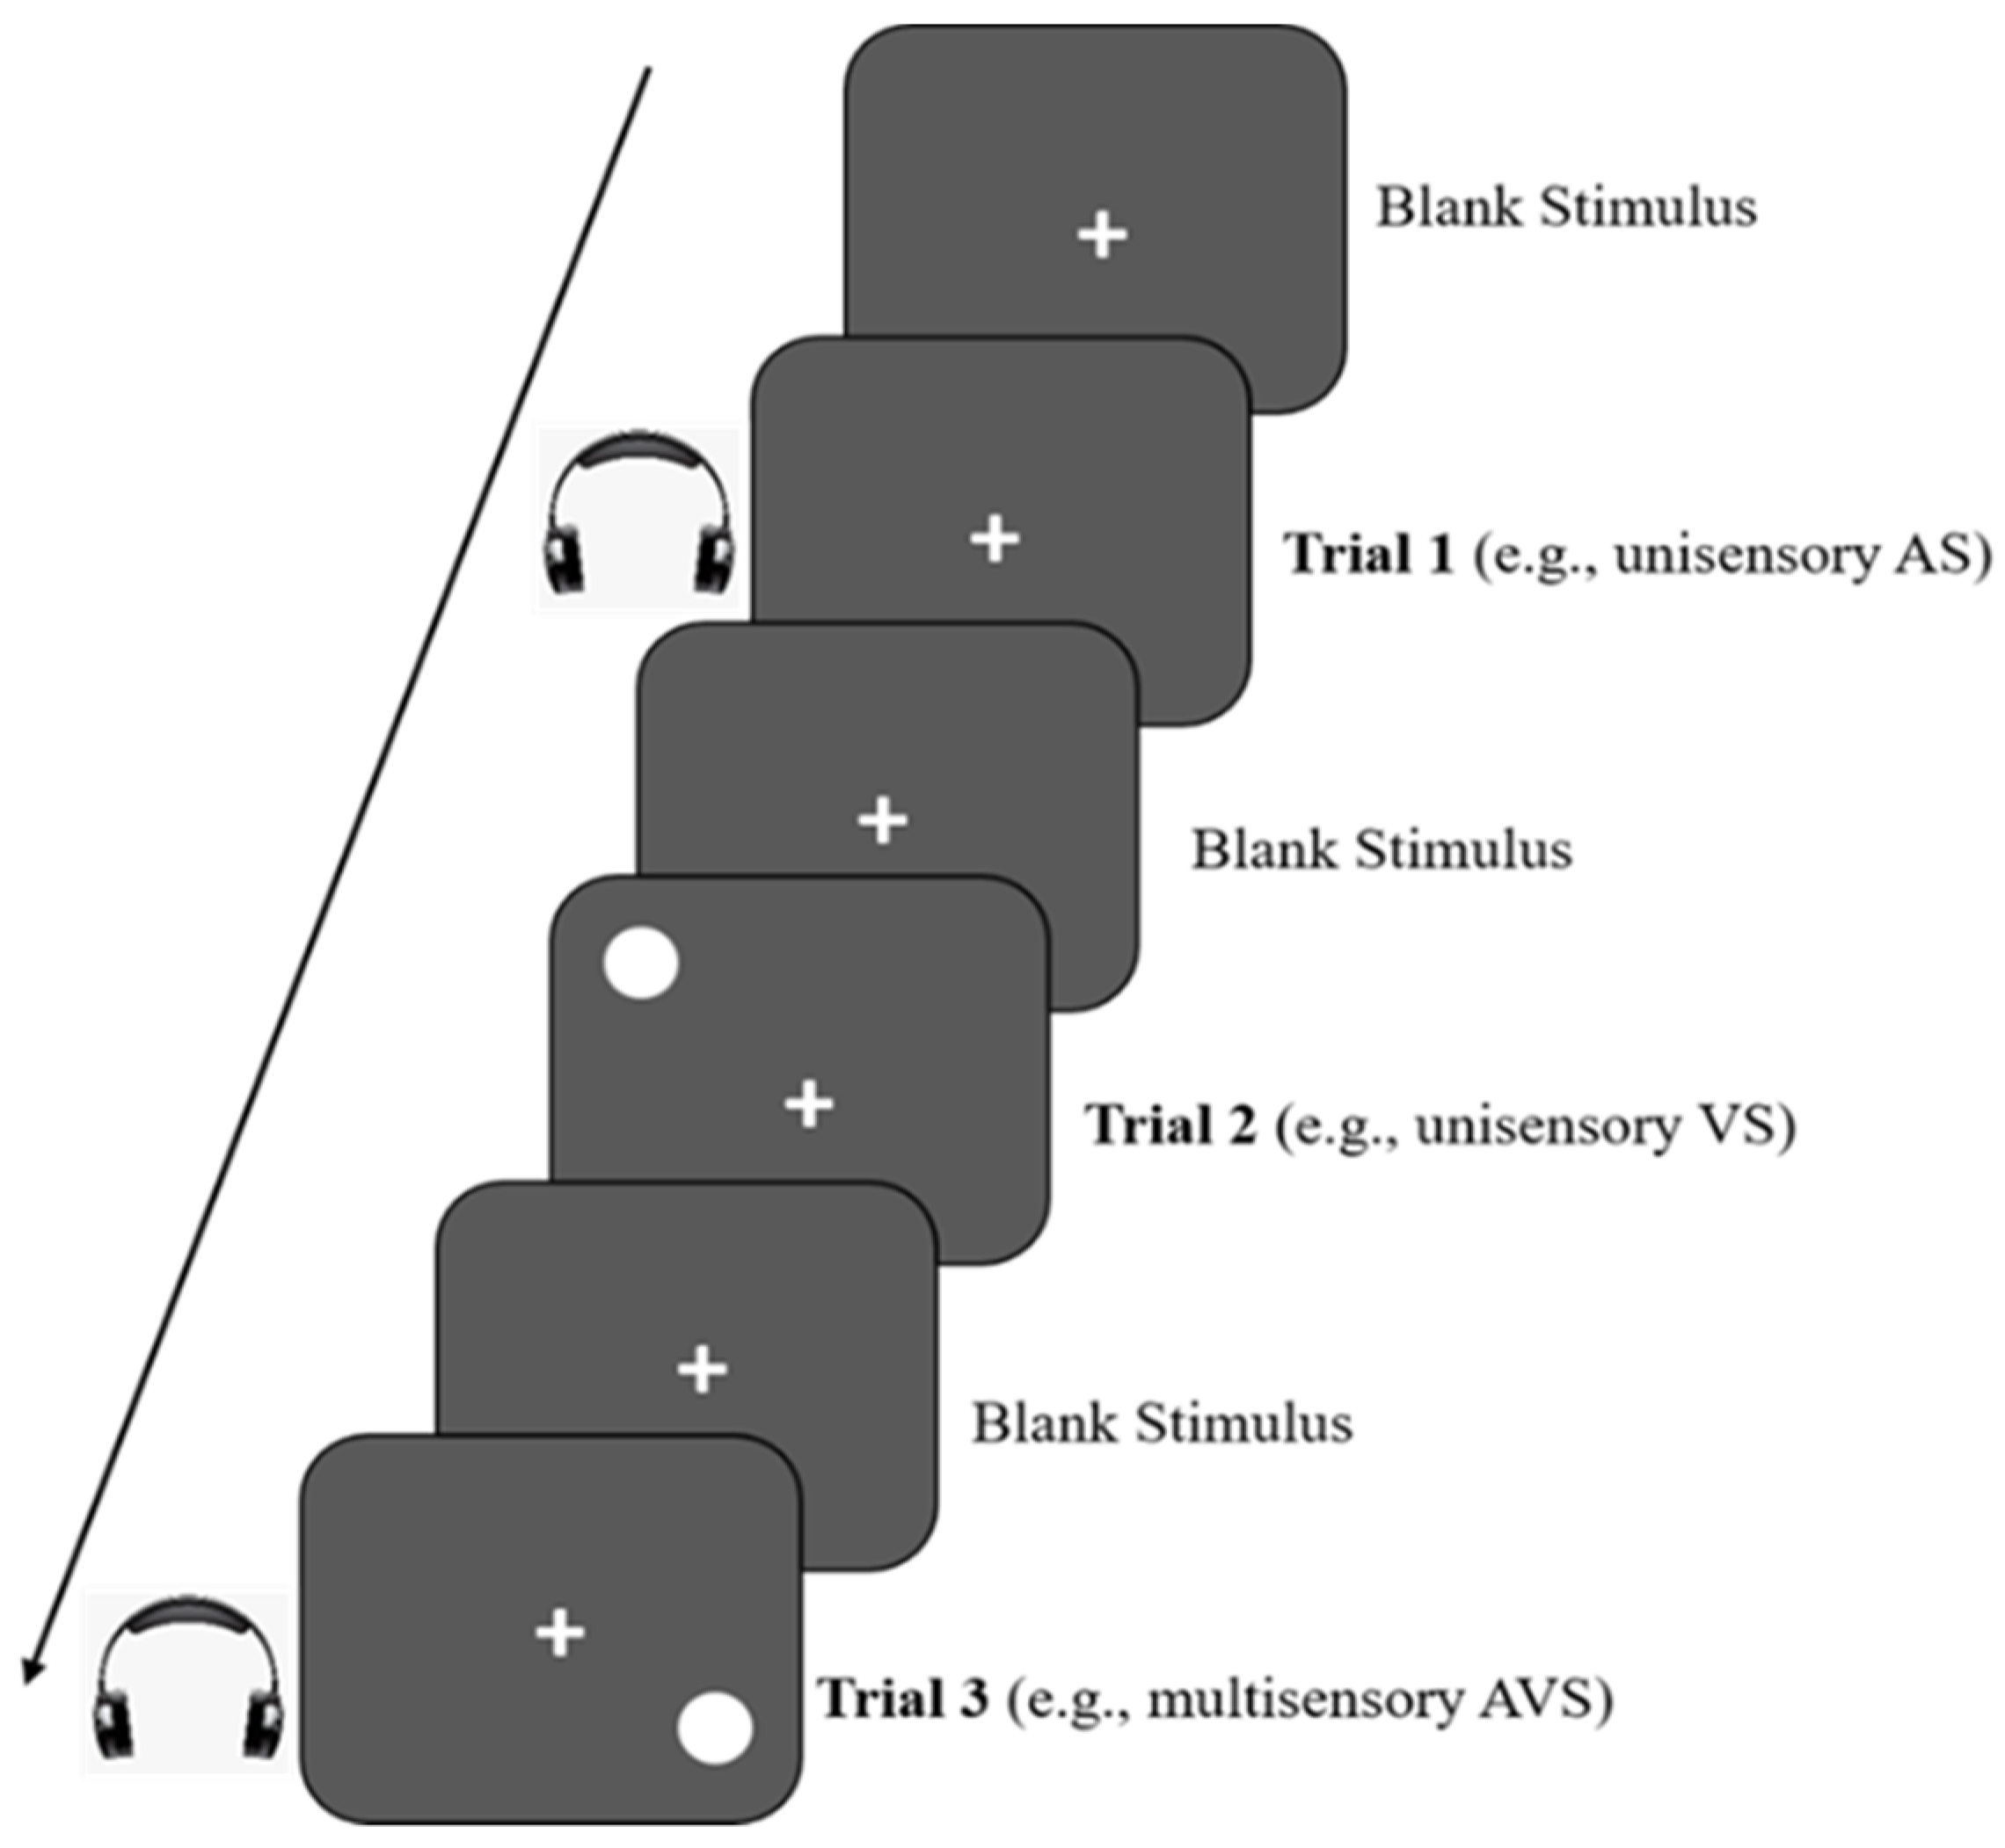
2.3.1. Multisensory Task
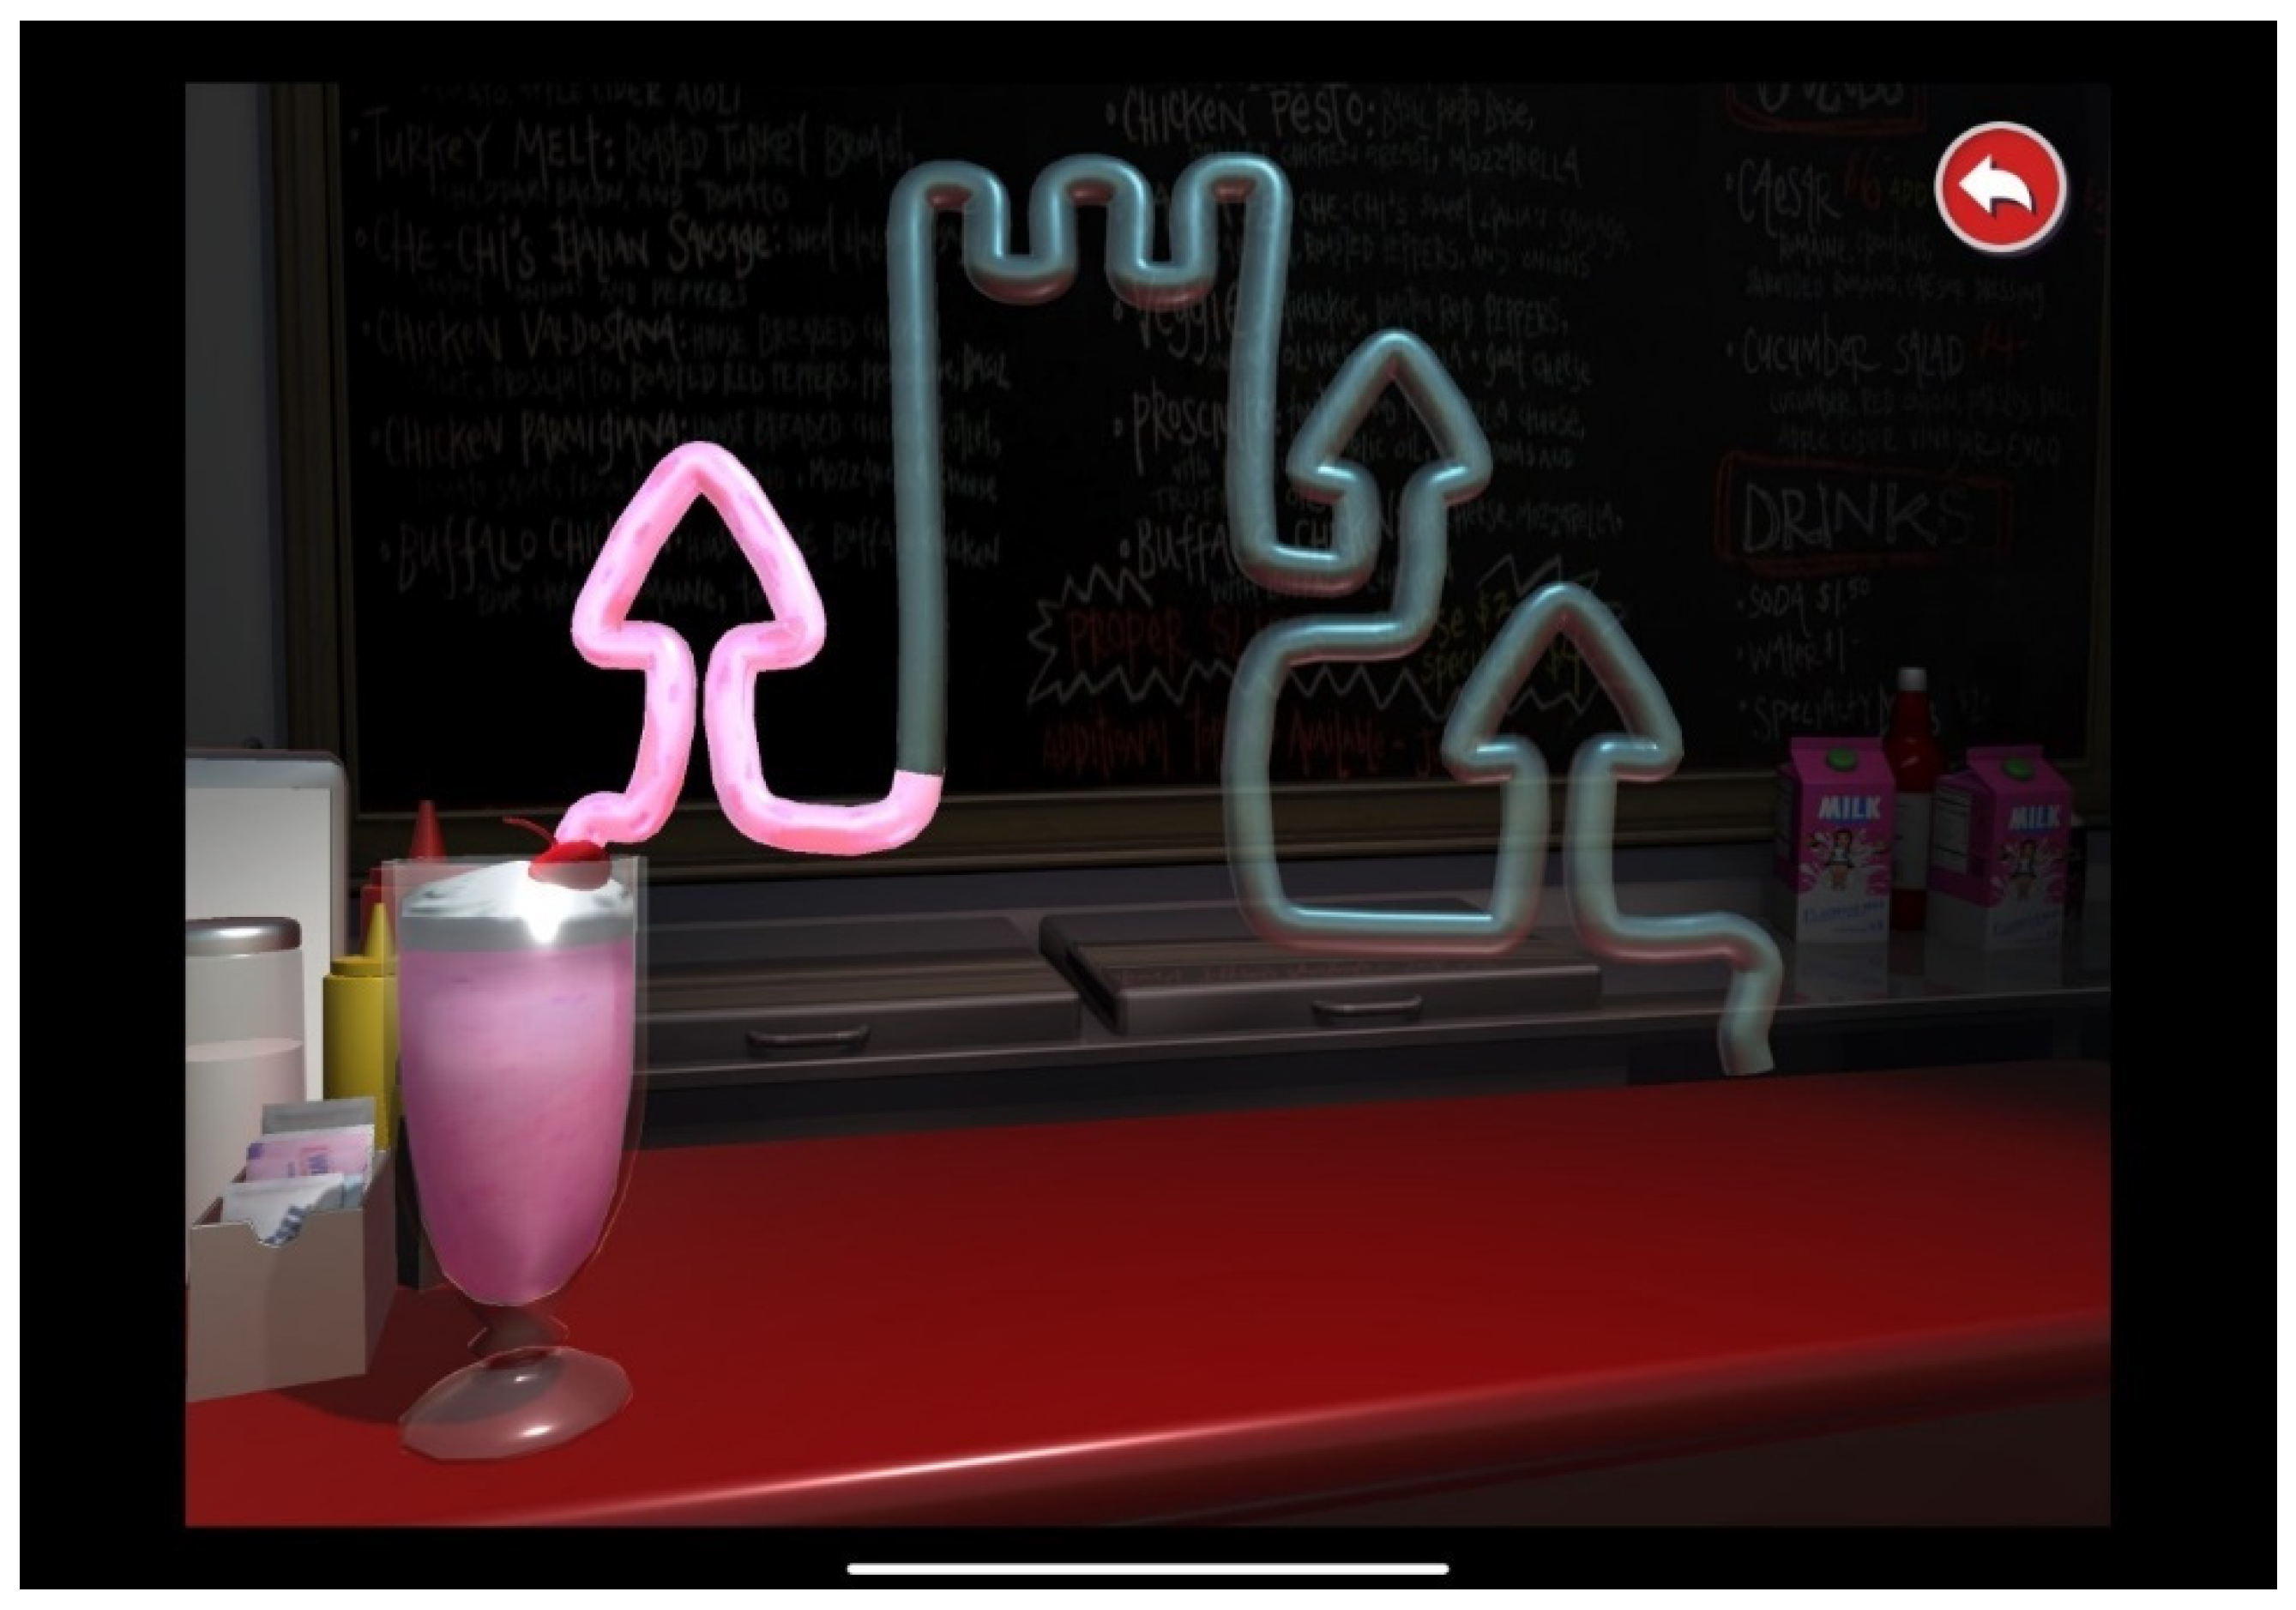
2.3.2. Visuomotor Processing using the SLURP Eye-Hand Coordination App
2.3.3. Visual and Auditory Digit Span (Forward and Backward)
2.4. Procedure
2.5. Data Analysis
3. Results
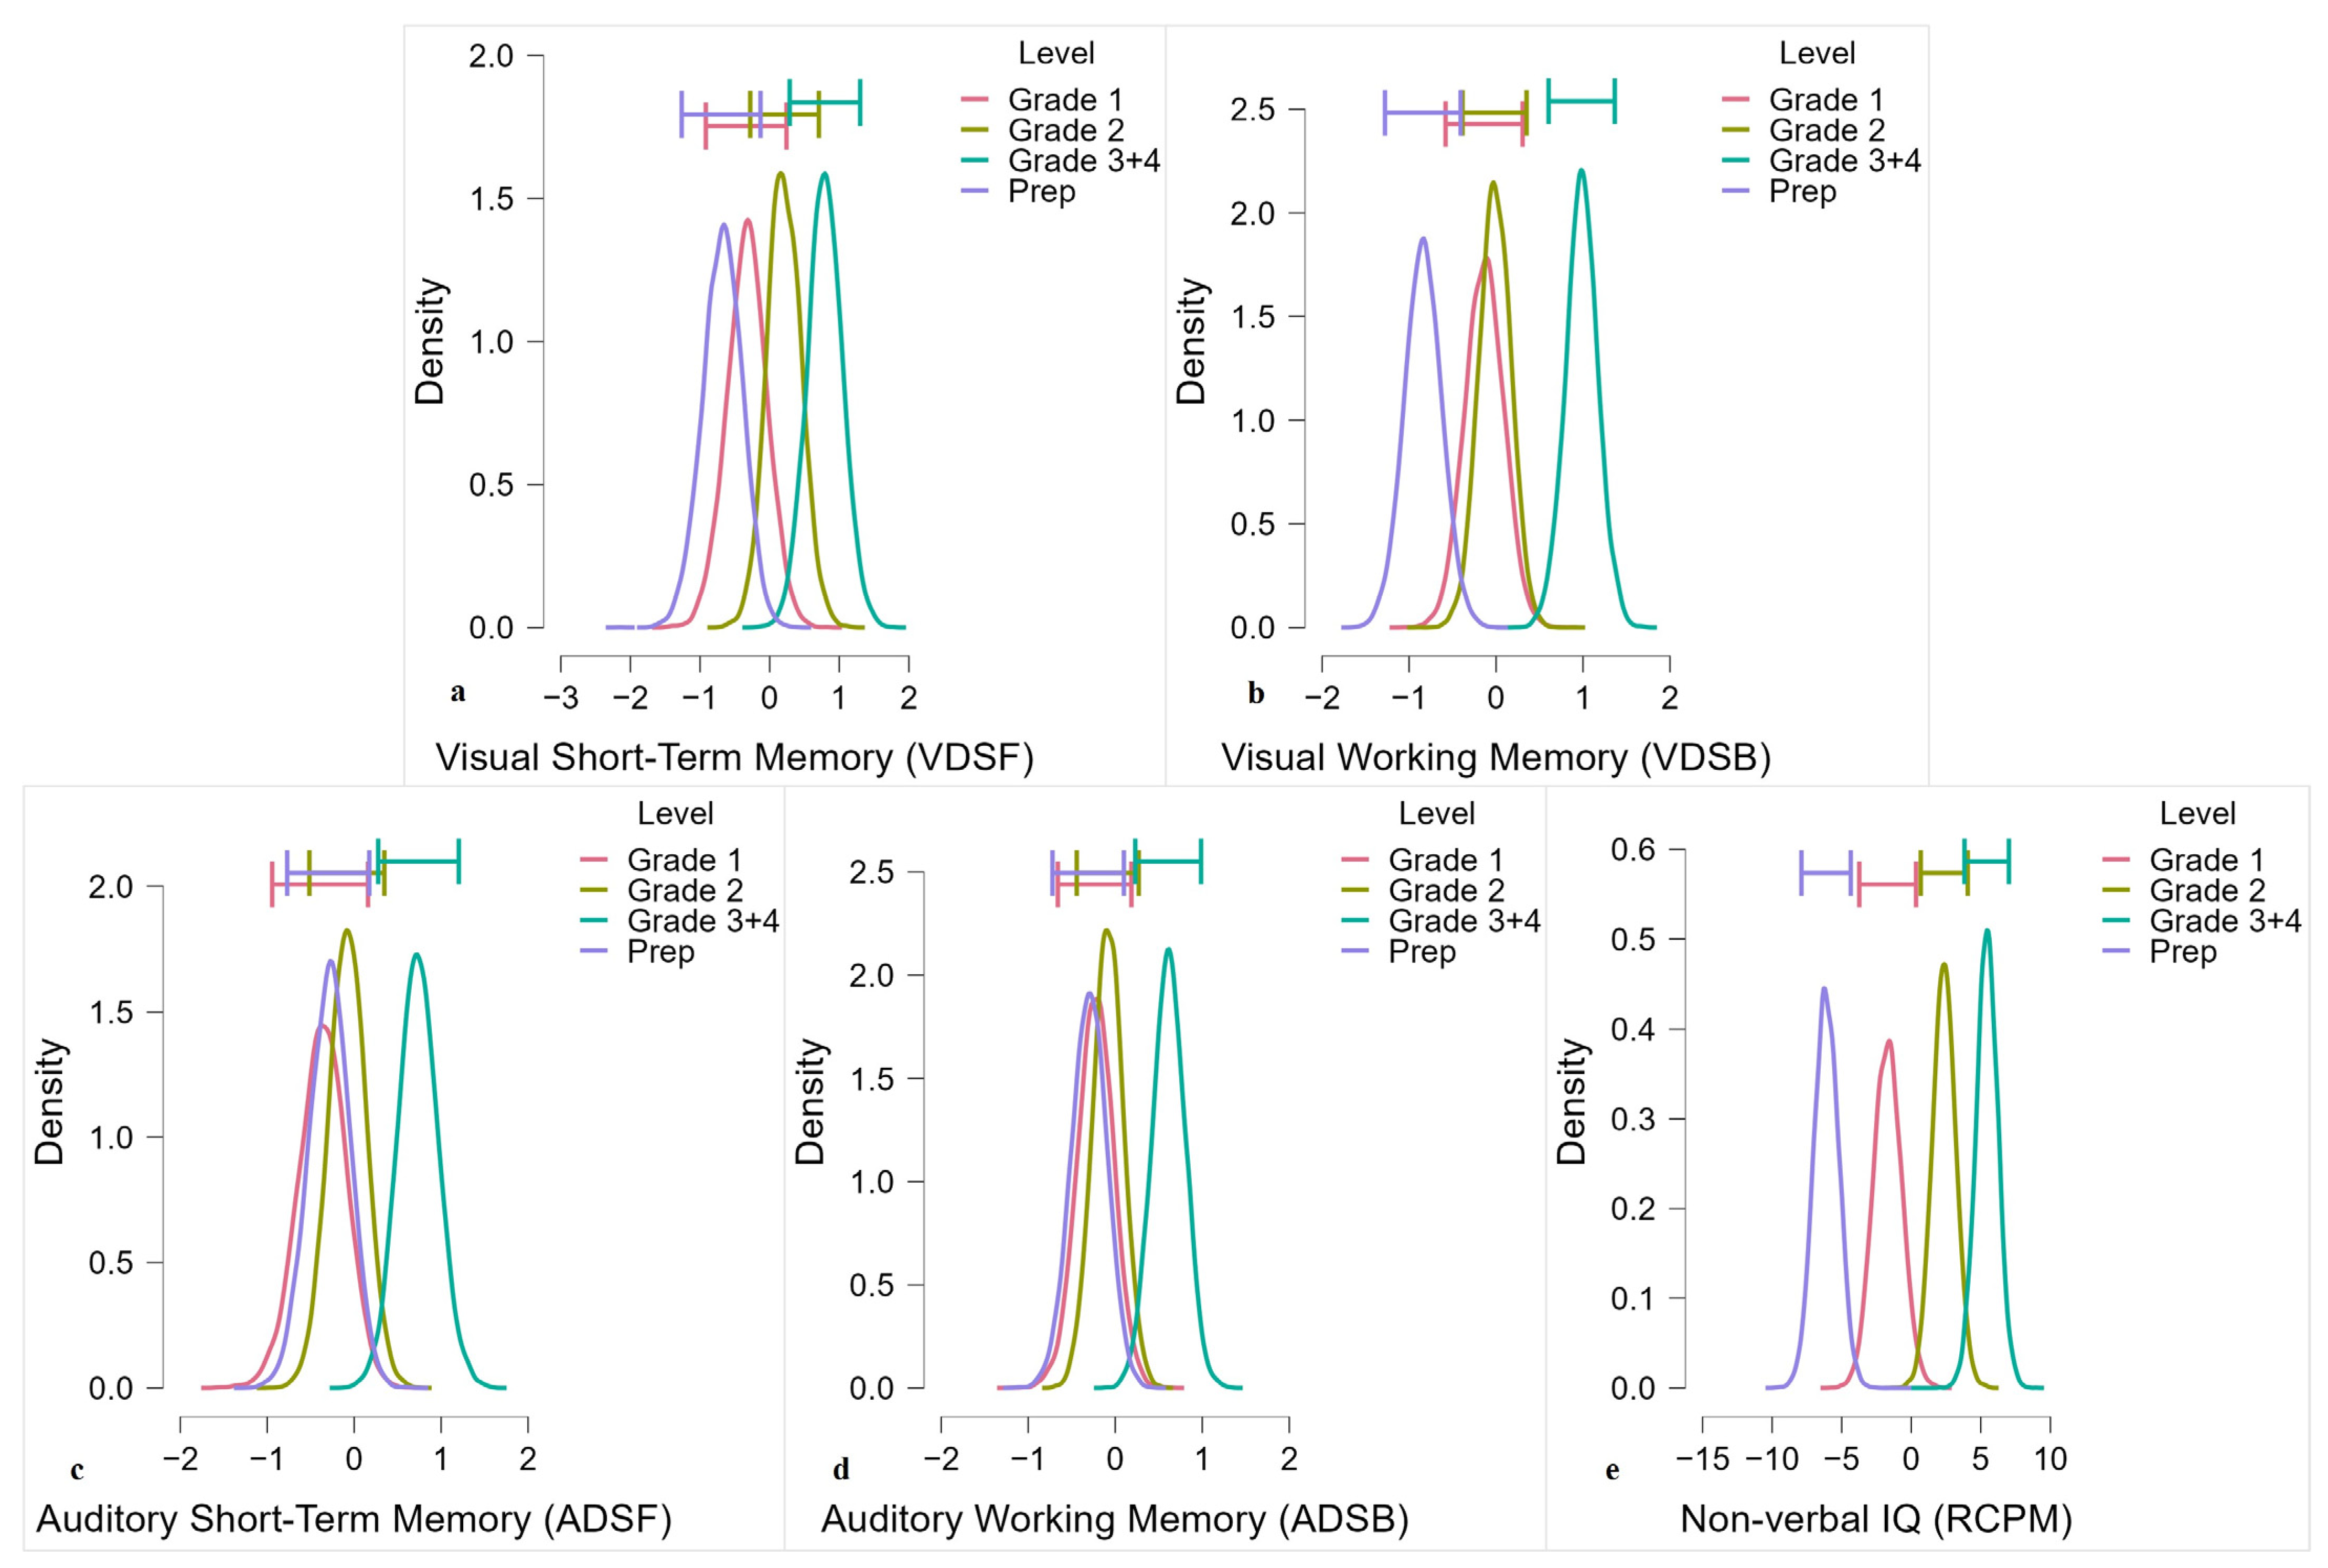
3.1. Results 1: Differences in Visual and Auditory Short-Term and Working Memory Tasks and Nonverbal IQ across Grades
3.2. Results 2: Relationships among Age, Nonverbal IQ, MRTs and Visual and Auditory Short-Term and Working Memory Tasks
3.3. Results 3: Contribution of Visual and Auditory Working Memory and Nonverbal IQ to MRTs to Auditory, Visual and Audiovisual, and Visuo-Motor Stimuli
4. Discussion
4.1. Age Group Differences in Visual and Auditory Memory and Nonverbal IQ
4.2. Relationships among Age, Nonverbal IQ, Visual and Auditory Working Memory, and MRT Multisensory Measures
4.3. Contributions of Visual and Auditory Working Memory and Nonverbal IQ to MRT Multisensory Measures
5. Limitations
6. Conclusions and Future Directions
Supplementary Materials
Author Contributions
Funding
Institutional Review Board Statement
Informed Consent Statement
Data Availability Statement
Acknowledgments
Conflicts of Interest
References
- Ross-Sheehy, S.; Newman, R.S. Infant auditory short-term memory for non-linguistic sounds. J. Exp. Child Psychol. 2015, 132, 51–64. [Google Scholar] [CrossRef]
- Bo, J.; Jennett, S.; Seidler, R. Working memory capacity correlates with implicit serial reaction time task performance. Exp. Brain Res. 2011, 214, 73–81. [Google Scholar] [CrossRef]
- Barutchu, A.; Fifer, J.M.; Shivdasani, M.N.; Crewther, S.G.; Paolini, A.G. The interplay between multisensory associative learning and IQ in children. Child Dev. 2020, 91, 620–637. [Google Scholar] [CrossRef] [PubMed]
- Ramezani, F.; Saemi, E.; Doustan, M. Children’s Motor Learning and Working Memory: The Role of Visual and Verbal Analogy Learning. Pol. J. Sport Tour. 2022, 29, 3–10. [Google Scholar] [CrossRef]
- Rigoli, D.; Piek, J.P.; Kane, R.; Whillier, A.; Baxter, C.; Wilson, P. An 18-month follow-up investigation of motor coordination and working memory in primary school children. Hum. Mov. Sci. 2013, 32, 1116–1126. [Google Scholar] [CrossRef]
- Haier, R.J.; Siegel, B.V.; Nuechterlein, K.H.; Hazlett, E.; Wu, J.C.; Paek, J.; Browning, H.L.; Buchsbaum, M.S. Cortical glucose metabolic rate correlates of abstract reasoning and attention studied with positron emission tomography. Intelligence 1988, 12, 199–217. [Google Scholar] [CrossRef]
- Diamond, A. Close Interrelation of Motor Development and Cognitive Development and of the Cerebellum and Prefrontal Cortex. Child Dev. 2000, 71, 44–56. [Google Scholar] [CrossRef]
- Habas, C. Functional connectivity of the cognitive cerebellum. Front. Syst. Neurosci. 2021, 15, 642225. [Google Scholar] [CrossRef] [PubMed]
- Stuhr, C.; Hughes, C.M.L.; Stöckel, T. Task-specific and variability-driven activation of cognitive control processes during motor performance. Sci. Rep. 2018, 8, 10811. [Google Scholar] [CrossRef]
- Alhamdan, A.; Murphy, M.; Crewther, S. Age-related decrease in motor contribution to multisensory reaction times in primary school children. Front. Hum. Neurosci. 2022, 16, 967081. [Google Scholar] [CrossRef]
- Magimairaj, B. Montgo10 to children’s complex span performance. Int. J. Behav. Dev. 2009, 33, 460–469. [Google Scholar] [CrossRef]
- Barutchu, A.; Crewther, S.G.; Fifer, J.; Shivdasani, M.N.; Innes-Brown, H.; Toohey, S.; Danaher, J.; Paolini, A.G. The relationship between multisensory integration and IQ in children [Empirical Study; Quantitative Study]. Dev. Psychol. 2011, 47, 877–885. [Google Scholar] [CrossRef]
- Stauffer, C.C.; Troche, S.J.; Schweizer, K.; Rammsayer, T.H. Intelligence is related to specific processes in visual change detection: Fixed-links modeling of hit rate and reaction time. Intelligence 2014, 43, 8–20. [Google Scholar] [CrossRef]
- Dang, C.-P.; Braeken, J.; Colom, R.; Ferrer, E.; Liu, C. Why is working memory related to intelligence? Different contributions from storage and processing. Memory 2014, 22, 426–441. [Google Scholar] [CrossRef] [PubMed]
- Giofrè, D.; Mammarella, I.C.; Cornoldi, C. The structure of working memory and how it relates to intelligence in children. Intelligence 2013, 41, 396–406. [Google Scholar] [CrossRef]
- Little, D.; Lewandowsky, S.; Craig, S. Working memory capacity and fluid abilities: The more difficult the item, the more more is better [Original Research]. Front. Psychol. 2014, 5, 239. [Google Scholar] [CrossRef] [PubMed]
- Barutchu, A.; Crewther, D.P.; Crewther, S.G. The race that precedes coactivation: Development of multisensory facilitation in children. Dev. Sci. 2009, 12, 464–473. [Google Scholar] [CrossRef]
- Junghans, B.M.; Khuu, S.K. Populations Norms for “SLURP”—An iPad App for Quantification of Visuomotor Coordination Testing [Original Research]. Front. Neurosci. 2019, 13, 711. [Google Scholar] [CrossRef] [PubMed]
- Nardini, M.; Bales, J.; Mareschal, D. Integration of audio-visual information for spatial decisions in children and adults. Dev. Sci. 2016, 19, 803–816. [Google Scholar] [CrossRef]
- Adams, E.; Nguyen, A.; Cowan, N. Theories of Working Memory: Differences in Definition, Degree of Modularity, Role of Attention, and Purpose. Lang. Speech Hear. Serv. Sch. 2018, 49, 340–355. [Google Scholar] [CrossRef]
- Baddeley, A. Working Memory, Thought, and Action; Oxford University Press: Oxford, UK, 2007; Volume 45. [Google Scholar]
- Baddeley, A.; Hitch, G.; Bower, G.H. The Psychology of Learning and Motivation; Academic Press: New York, NY, USA, 1974. [Google Scholar]
- Baddeley, A. Working Memory: Theories, Models, and Controversies. Annu. Rev. Psychol. 2012, 63, 1–29. [Google Scholar] [CrossRef]
- Burgoyne, A.P.; Hambrick, D.Z.; Altmann, E.M. Is working memory capacity a causal factor in fluid intelligence? Psychon. Bull. Rev. 2019, 26, 1333–1339. [Google Scholar] [CrossRef]
- Kyllonen, P.C.; Christal, R.E. Reasoning ability is (little more than) working-memory capacity?! Intelligence 1990, 14, 389–433. [Google Scholar] [CrossRef]
- Conway, A.R.A.; Kovacs, K. Chapter Seven—Individual Differences in Intelligence and Working Memory: A Review of Latent Variable Models. In Psychology of Learning and Motivation; Ross, B.H., Ed.; Academic Press: Cambridge, MA, USA, 2013; Volume 58, pp. 233–270. [Google Scholar] [CrossRef]
- Raven, J.C. Guide to Using the Coloured Progressive Matrices; H. K. Lewis & Co.: London, UK, 1958. [Google Scholar]
- Corman, L.; Budoff, M. Factor structures of retarded and nonretarded children on Raven’s Progressive Matrices. Educ. Psychol. Meas. 1974, 34, 407–412. [Google Scholar] [CrossRef]
- Holyoak, K.J. Analogy and relational reasoning. In The Oxford Handbook of Thinking and Reasoning; Holyoak, K.J., Morrison, R.G., Eds.; Oxford University Press: Oxford, UK, 2012; pp. 234–259. [Google Scholar] [CrossRef]
- Schear, J.M.; Sato, S.D. Effects of visual acuity and visual motor speed and dexterity on cognitive test performance. Arch. Clin. Neuropsychol. 1989, 4, 25–32. [Google Scholar] [CrossRef]
- Jung, R.E.; Haier, R.J. The Parieto-Frontal Integration Theory (P-FIT) of intelligence: Converging neuroimaging evidence. Behav. Brain Sci. 2007, 30, 135–154. [Google Scholar] [CrossRef]
- Denervaud, S.; Gentaz, E.; Matusz, P.J.; Murray, M.M. Multisensory Gains in Simple Detection Predict Global Cognition in Schoolchildren. Sci. Rep. 2020, 10, 1394. [Google Scholar] [CrossRef]
- Buss, A.T.; Ross-Sheehy, S.; Reynolds, G.D. Visual working memory in early development: A developmental cognitive neuroscience perspective. J. Neurophysiol. 2018, 120, 1472–1483. [Google Scholar] [CrossRef] [PubMed] [Green Version]
- Pickering, H.E.; Peters, J.L.; Crewther, S.G. A Role for Visual Memory in Vocabulary Development: A Systematic Review and Meta-Analysis. Neuropsychol. Rev. 2022, 1–31. [Google Scholar] [CrossRef] [PubMed]
- Alghamdi, R.J.; Murphy, M.J.; Crewther, S.G. The contribution of visual processing speed to visual and auditory working memory in early school years. Psychol. Neurosci. 2021, 14, 454–467. [Google Scholar] [CrossRef]
- Cleary, M.; Pisoni, D.B.; Geers, A.E. Some measures of verbal and spatial working memory in eight-and nine-year-old hearing-impaired children with cochlear implants. Ear Hear. 2001, 22, 395. [Google Scholar] [CrossRef] [PubMed]
- Raven, J.C.; Court, J.H. Coloured Progressive Matrices; Oxford Psychologists Press: Oxford, UK, 1990. [Google Scholar]
- Cotton, S.M.; Kiely, P.M.; Crewther, D.P.; Thomson, B.; Laycock, R.; Crewther, S.G. A normative and reliability study for the Raven’s Coloured Progressive Matrices for primary school aged children from Victoria, Australia. Personal. Individ. Differ. 2005, 39, 647–659. [Google Scholar] [CrossRef]
- Raven, J.C.; Court, J.H.; Raven, J.C. Manual for Raven’s Progressive Matrices and Vocabulary Scales; H. K. Lewis & Co.: London, UK, 1988. [Google Scholar]
- Goharpey, N.; Crewther, D.P.; Crewther, S.G. Problem solving ability in children with intellectual disability as measured by the Raven’s Colored Progressive Matrices. Res. Dev. Disabil. 2013, 34, 4366–4374. [Google Scholar] [CrossRef] [PubMed]
- Lee, K.; Junghans, B.M.; Ryan, M.; Khuu, S.; Suttle, C.M. Development of a novel approach to the assessment of eye–hand coordination. J. Neurosci. Methods 2014, 228, 50–56. [Google Scholar] [CrossRef] [PubMed]
- Lichtenberger, E.O.; Kaufman, A.S. Essentials of WAIS-IV Assessment; John Wiley & Sons: Hoboken, NJ, USA, 2012; Volume 96. [Google Scholar]
- Crewther, S.G.; Thomson, B.; Laycock, R.; Crewther, D.P. I RAN Fast and I Remembered What I Read: The Relationship between Reading, Rapid Automatic Naming, and Auditory and Visual Short-Term Memory. i-Percept. 2011, 2, 264. [Google Scholar] [CrossRef]
- Ebaid, D.; Crewther, S.G. Temporal Aspects of Memory: A Comparison of Memory Performance, Processing Speed and Time Estimation Between Young and Older Adults [Original Research]. Front. Aging Neurosci. 2018, 10, 352. [Google Scholar] [CrossRef]
- Mungkhetklang, C.; Bavin, E.L.; Crewther, S.G.; Goharpey, N.; Parsons, C. The contributions of memory and vocabulary to non-verbal ability scores in adolescents with intellectual disability. Front. Psychiatry 2016, 7, 204. [Google Scholar] [CrossRef]
- Faul, F.; Erdfelder, E.; Lang, A.-G.; Buchner, A. G* Power 3: A flexible statistical power analysis program for the social, behavioral, and biomedical sciences. Behav. Res. Methods 2007, 39, 175–191. [Google Scholar] [CrossRef]
- Cohen, J. A power primer. Psychol. Bull. 1992, 112, 155. [Google Scholar] [CrossRef]
- JASP Team. JASP (Version 0.16.3) [Computer Software]. 2022. Available online: https://jasp-stats.org/ (accessed on 1 July 2022).
- Morey, R.D.; Rouder, J.N. Bayes factor approaches for testing interval null hypotheses. Psychol. Methods 2011, 16, 406. [Google Scholar] [CrossRef]
- Wagenmakers, E.-J.; Lee, M.; Lodewyckx, T.; Iverson, G.J. Bayesian versus frequentist inference. In Bayesian Evaluation of Informative Hypotheses; Springer: Berlin/Heidelberg, Germany, 2008; pp. 181–207. [Google Scholar] [CrossRef]
- Kelter, R. Analysis of Bayesian posterior significance and effect size indices for the two-sample t-test to support reproducible medical research. BMC Med. Res. Methodol. 2020, 20, 88. [Google Scholar] [CrossRef] [PubMed]
- Wetzels, R.; Wagenmakers, E.-J. A default Bayesian hypothesis test for correlations and partial correlations. Psychon. Bull. Rev. 2012, 19, 1057–1064. [Google Scholar] [CrossRef] [PubMed]
- Kruschke, J.K. Bayesian Analysis Reporting Guidelines. Nat. Hum. Behav. 2021, 5, 1282–1291. [Google Scholar] [CrossRef] [PubMed]
- van Doorn, J.; van den Bergh, D.; Böhm, U.; Dablander, F.; Derks, K.; Draws, T.; Etz, A.; Evans, N.J.; Gronau, Q.F.; Haaf, J.M.; et al. The JASP guidelines for conducting and reporting a Bayesian analysis. Psychon. Bull. Rev. 2021, 28, 813–826. [Google Scholar] [CrossRef] [PubMed]
- Wagenmakers, E.-J.; Love, J.; Marsman, M.; Jamil, T.; Ly, A.; Verhagen, J.; Selker, R.; Gronau, Q.F.; Dropmann, D.; Boutin, B.; et al. Bayesian inference for psychology. Part II: Example applications with JASP. Psychon. Bull. Rev. 2018, 25, 58–76. [Google Scholar] [CrossRef]
- Albers, C.; Lakens, D. When power analyses based on pilot data are biased: Inaccurate effect size estimators and follow-up bias. J. Exp. Soc. Psychol. 2018, 74, 187–195. [Google Scholar] [CrossRef]
- Lakens, D. Calculating and reporting effect sizes to facilitate cumulative science: A practical primer for t-tests and ANOVAs. Front. Psychol. 2013, 4, 863. [Google Scholar] [CrossRef] [Green Version]
- Field, A. Discovering Statistics Using IBM SPSS Statistics; SAGE: Thousand Oaks, CA, USA, 2013. [Google Scholar]
- Goss-Sampson, M. Statistical Analysis in JASP: A Guide for Students; JASP: Amsterdam, The Netherlands, 2019; Available online: https://jasp-stats.org/jasp-materials/ (accessed on 1 July 2022).
- Westfall, P.H.; Johnson, W.O.; Utts, J.M. A Bayesian perspective on the Bonferroni adjustment. Biometrika 1997, 84, 419–427. [Google Scholar] [CrossRef]
- Alloway, T.P.; Gathercole, S.E.; Pickering, S.J. Verbal and Visuospatial Short-Term and Working Memory in Children: Are They Separable? Child Dev. 2006, 77, 1698–1716. [Google Scholar] [CrossRef]
- Anderson, V.A.; Lajoie, G. Development of memory and learning skills in school-aged children: A neuropsychological perspective. Appl. Neuropsychol. 1996, 3, 128–139. [Google Scholar] [CrossRef]
- Ernst, M.O. Multisensory Integration: A Late Bloomer. Curr. Biol. 2008, 18, R519–R521. [Google Scholar] [CrossRef]
- Gathercole, S.E.; Pickering, S.J.; Ambridge, B.; Wearing, H. The structure of working memory from 4 to 15 years of age. Dev. Psychol. 2004, 40, 177. [Google Scholar] [CrossRef] [PubMed]
- Barnard, N.; Crewther, S.G.; Crewther, D.P. Development of a magnocellular function in good and poor primary school-age readers. Optom. Vis. Sci. 1998, 75, 62–68. [Google Scholar] [CrossRef] [PubMed]
- Mundinano, I.-C.; Kwan, W.C.; Bourne, J.A. Retinotopic specializations of cortical and thalamic inputs to area MT. Proc. Natl. Acad. Sci. USA 2019, 116, 23326–23331. [Google Scholar] [CrossRef] [PubMed]
- Buss, A.T.; Fox, N.; Boas, D.A.; Spencer, J.P. Probing the early development of visual working memory capacity with functional near-infrared spectroscopy. NeuroImage 2014, 85, 314–325. [Google Scholar] [CrossRef] [PubMed]
- Corbetta, M.; Shulman, G.L. Control of goal-directed and stimulus-driven attention in the brain. Nat. Rev. Neurosci. 2002, 3, 201–215. [Google Scholar] [CrossRef]
- Ionta, S. Visual Neuropsychology in Development: Anatomo-Functional Brain Mechanisms of Action/Perception Binding in Health and Disease [Review]. Front. Hum. Neurosci. 2021, 15, 689912. [Google Scholar] [CrossRef]
- Kravitz, D.J.; Saleem, K.S.; Baker, C.I.; Ungerleider, L.G.; Mishkin, M. The ventral visual pathway: An expanded neural framework for the processing of object quality. Trends Cogn. Sci. 2013, 17, 26–49. [Google Scholar] [CrossRef]
- Thiebaut de Schotten, M.; Dell’Acqua, F.; Forkel, S.; Simmons, A.; Vergani, F.; Murphy, D.G.M.; Catani, M. A Lateralized Brain Network for Visuo-Spatial Attention. Nat. Preced. 2011, 14, 1245–1246. [Google Scholar] [CrossRef]
- Rizzolatti, G.; Matelli, M. Two different streams form the dorsal visual system: Anatomy and functions. Exp. Brain Res. 2003, 153, 146–157. [Google Scholar] [CrossRef]
- Perlman, S.B.; Huppert, T.J.; Luna, B. Functional Near-Infrared Spectroscopy Evidence for Development of Prefrontal Engagement in Working Memory in Early Through Middle Childhood. Cereb. Cortex 2015, 26, 2790–2799. [Google Scholar] [CrossRef]
- Pickering, S.J. The development of visuo-spatial working memory. Memory 2001, 9, 423–432. [Google Scholar] [CrossRef] [PubMed]
- Ang, S.Y.; Lee, K. Exploring developmental differences in visual short-term memory and working memory. Dev. Psychol. 2010, 46, 279. [Google Scholar] [CrossRef] [PubMed]
- Carpenter, P.A.; Just, M.A.; Shell, P. What one intelligence test measures: A theoretical account of the processing in the Raven Progressive Matrices Test. Psychol. Rev. 1990, 97, 404. [Google Scholar] [CrossRef] [PubMed]
- Brandwein, A.B.; Foxe, J.J.; Russo, N.N.; Altschuler, T.S.; Gomes, H.; Molholm, S. The development of audiovisual multisensory integration across childhood and early adolescence: A high-density electrical mapping study. Cereb. Cortex 2011, 21, 1042–1055. [Google Scholar] [CrossRef] [PubMed]
- Jensen, A.R. The suppressed relationship between IQ and the reaction time slope parameter of the Hick function. Intelligence 1998, 26, 43–52. [Google Scholar] [CrossRef]
- Schmiedek, F.; Oberauer, K.; Wilhelm, O.; Sub, H.-M.; Wittmann, W.W. Individual differences in components of reaction time distributions and their relations to working memory and intelligence. J. Exp. Psychol. Gen. 2007, 136, 414. [Google Scholar] [CrossRef] [Green Version]
- Vernon, P.A. Speed of information processing and general intelligence. Intelligence 1983, 7, 53–70. [Google Scholar] [CrossRef]
- Botta, F.; Santangelo, V.; Raffone, A.; Sanabria, D.; Lupiáñez, J.; Belardinelli, M.O. Multisensory integration affects visuo-spatial working memory. J. Exp. Psychol. Hum. Percept. Perform. 2011, 37, 1099. [Google Scholar] [CrossRef]
- He, Y.; Guo, Z.; Wang, X.; Sun, K.; Lin, X.; Wang, X.; Li, F.; Guo, Y.; Feng, T.; Zhang, J.; et al. Effects of Audiovisual Interactions on Working Memory Task Performance—Interference or Facilitation. Brain Sci. 2022, 12, 886. [Google Scholar] [CrossRef]
- Cuppini, C.; Ursino, M.; Magosso, E.; Ross, L.A.; Foxe, J.J.; Molholm, S. A Computational Analysis of Neural Mechanisms Underlying the Maturation of Multisensory Speech Integration in Neurotypical Children and Those on the Autism Spectrum [Original Research]. Front. Hum. Neurosci. 2017, 11, 518. [Google Scholar] [CrossRef]
- Farah, R.; Ionta, S.; Horowitz-Kraus, T. Neuro-Behavioral Correlates of Executive Dysfunctions in Dyslexia Over Development From Childhood to Adulthood [Review]. Front. Psychol. 2021, 12, 708863. [Google Scholar] [CrossRef]
- Bo, J.; Seidler, R.D. Visuospatial working memory capacity predicts the organization of acquired explicit motor sequences. J. Neurophysiol. 2009, 101, 3116–3125. [Google Scholar] [CrossRef]
- Voelke, A.E.; Troche, S.J.; Rammsayer, T.H.; Wagner, F.L.; Roebers, C.M. Relations among fluid intelligence, sensory discrimination and working memory in middle to late childhood—A latent variable approach. Cogn. Dev. 2014, 32, 58–73. [Google Scholar] [CrossRef]
- Engle, R.W. Working Memory Capacity as Executive Attention. Curr. Dir. Psychol. Sci. 2002, 11, 19–23. [Google Scholar] [CrossRef]
- Jensen, A.R. The importance of intraindividual variation in reaction time. Personal. Individ. Differ. 1992, 13, 869–881. [Google Scholar] [CrossRef]
- Larson, G.E.; Alderton, D.L. Reaction time variability and intelligence: A “worst performance” analysis of individual differences. Intelligence 1990, 14, 309–325. [Google Scholar] [CrossRef]
- Benjamin, D.J.; Berger, J.O.; Johannesson, M.; Nosek, B.A.; Wagenmakers, E.J.; Berk, R.; Bollen, K.A.; Brembs, B.; Brown, L.; Camerer, C.; et al. Redefine statistical significance. Nat. Hum. Behav. 2018, 2, 6–10. [Google Scholar] [CrossRef] [PubMed]
- Derks, K.; Wagenmakers, E.-J. The Bayesian Approach to Audit Evidence: Quantifying Statistical Evidence using the Bayes Factor. PsyArXiv 2021. [Google Scholar] [CrossRef]
- Keysers, C.; Gazzola, V.; Wagenmakers, E.-J. Using Bayes factor hypothesis testing in neuroscience to establish evidence of absence. Nat. Neurosci. 2020, 23, 788–799. [Google Scholar] [CrossRef] [PubMed]
- Heuer, A.; Rolfs, M. Incidental encoding of visual information in temporal reference frames in working memory. Cognition 2021, 207, 104526. [Google Scholar] [CrossRef] [PubMed]


| Grades N | AGE RANGE | Nonverbal IQ | |||||
|---|---|---|---|---|---|---|---|
| Min. | Max. | M ± SD | Min. | Max. | M ± SD | ||
| Prep | 17 | 5 | 6.71 | 5.71 ± 0.43 | 11 | 29 | 17.52 ± 5.58 |
| Grade 1 | 11 | 6.4 | 7.47 | 6.85 ± 0.29 | 17 | 28 | 22.09 ± 3.64 |
| Grade 2 | 19 | 7.56 | 8.77 | 8.01 ± 0.31 | 20 | 34 | 26.42 ± 3.83 |
| Grade 3+4 | 26 | 8.58 | 10.9 | 9.84 ± 0.72 | 19 | 34 | 29.75 ± 3.47 |
| Total | 73 | ||||||
| 95% Credible Interval | ||||||
|---|---|---|---|---|---|---|
| Measure | Grade | M | SD | Lower | Upper | |
| Visual and Auditory WM Tasks | Visual Short-Term Memory (VDSF) | Prep | 3.857 | 1.657 | 2.9 | 4.814 |
| Grade 1 | 4.273 | 1.009 | 3.595 | 4.951 | ||
| Grade 2 | 4.95 | 0.887 | 4.535 | 5.365 | ||
| Grade 3+4 | 5.625 | 1.439 | 5.017 | 6.233 | ||
| Visual Working Memory (VDSB) | Prep | 2.571 | 0.646 | 2.198 | 2.945 | |
| Grade 1 | 3.364 | 0.505 | 3.025 | 3.703 | ||
| Grade 2 | 3.5 | 0.761 | 3.144 | 3.856 | ||
| Grade 3+4 | 4.583 | 1.283 | 4.042 | 5.125 | ||
| Auditory Short-Term Memory (ADSF) | Prep | 4.929 | 1.141 | 4.27 | 5.587 | |
| Grade 1 | 4.778 | 0.441 | 4.439 | 5.117 | ||
| Grade 2 | 5.2 | 1.056 | 4.706 | 5.694 | ||
| Grade 3+4 | 6.174 | 1.37 | 5.581 | 6.766 | ||
| Auditory Working Memory (ADSB) | Prep | 3 | 0.577 | 2.651 | 3.349 | |
| Grade 1 | 3.091 | 0.302 | 2.888 | 3.293 | ||
| Grade 2 | 3.3 | 0.801 | 2.925 | 3.675 | ||
| Grade 3+4 | 4.13 | 1.359 | 3.543 | 4.718 | ||
| Non-verbal IQ | (RCPM) | Prep | 17.529 | 5.580 | 14.660 | 20.399 |
| Grade 1 | 22.091 | 3.646 | 19.642 | 24.540 | ||
| Grade 2 | 26.421 | 3.834 | 24.573 | 28.269 | ||
| Grade 3+4 | 29.577 | 3.478 | 28.172 | 30.982 | ||
| Prior Odds | Posterior Odds | BF10, U | Error % | ||
|---|---|---|---|---|---|
| a. VDSF | |||||
| Grade 1 | Grade 2 | 0.414 | 0.571 | 1.378 | 0.004 |
| Grade 3+4 | 0.414 | 2.381 | 5.748 | 7.92 × 10⁻⁶ | |
| Prep | 0.414 | 0.186 | 0.449 | 0.002 | |
| Grade 2 | Grade 3+4 | 0.414 | 0.462 | 1.115 | 0.007 |
| Prep | 0.414 | 1.342 | 3.241 | 0.009 | |
| Grade 3+4 | Prep | 0.414 | 9.567 | 23.096 | 1.61 × 10⁻⁶ |
| b. VDSB | |||||
| Grade 1 | Grade 2 | 0.414 | 0.162 | 0.391 | 0.003 |
| Grade 3+4 | 0.414 | 3.663 | 8.844 | 6.05 × 10⁻⁶ | |
| Prep | 0.414 | 5.52 | 13.326 | 7.78 × 10⁻⁶ | |
| Grade 2 | Grade 3+4 | 0.414 | 7.698 | 18.585 | 9.73 × 10⁻⁷ |
| Prep | 0.414 | 15.919 | 38.431 | 4.94 × 10⁻⁷ | |
| Grade 3+4 | Prep | 0.414 | 1561.507 | 3769.812 | 4.54 × 10⁻⁹ |
| c. ADSF | |||||
| Grade 1 | Grade 2 | 0.414 | 0.246 | 0.594 | 0.002 |
| Grade 3+4 | 0.414 | 3.129 | 7.555 | 1.35 × 10⁻⁵ | |
| Prep | 0.414 | 0.168 | 0.405 | 0.002 | |
| Grade 2 | Grade 3+4 | 0.414 | 1.615 | 3.898 | 1.11 × 10⁻⁶ |
| Prep | 0.414 | 0.168 | 0.405 | 0.003 | |
| Grade 3+4 | Prep | 0.414 | 2.632 | 6.355 | 3.43 × 10⁻⁶ |
| d. ADSB | |||||
| Grade 1 | Grade 2 | 0.414 | 0.188 | 0.454 | 0.003 |
| Grade 3+4 | 0.414 | 1.339 | 3.234 | 0.008 | |
| Prep | 0.414 | 0.168 | 0.406 | 0.002 | |
| Grade 2 | Grade 3+4 | 0.414 | 1.146 | 2.766 | 0.009 |
| Prep | 0.414 | 0.234 | 0.566 | 0.004 | |
| Grade 3+4 | Prep | 0.414 | 2.589 | 6.250 | 4.57 × 10⁻⁶ |
| e. Non-verbal IQ (RCPM) | |||||
| Grade 1 | Grade 2 | 0.414 | 3.459 | 8.352 | 8.81 × 10⁻⁶ |
| Grade 3+4 | 0.414 | 4638.691 | 11,198.791 | 1.19 × 10⁻⁹ | |
| Prep | 0.414 | 1.109 | 2.677 | 0.007 | |
| Grade 2 | Grade 3+4 | 0.414 | 2.957 | 7.139 | 8.63 × 10⁻⁷ |
| Prep | 0.414 | 2116.608 | 5109.943 | 1.96 × 10⁻⁹ | |
| Grade 3+4 | Prep | 0.414 | 3.83e+07 | 9.24e+07 | 1.66 × 10⁻¹² |
| Variable | Age | RCPM | AS | VS | AVS | SLURP | VDSF | VDSB | ADSF | ADSB | |
|---|---|---|---|---|---|---|---|---|---|---|---|
| 1. Age | Pearson’s r | — | |||||||||
| BF₁₀ | — | ||||||||||
| 2. RCPM | Pearson’s r | 0.747 *** | — | ||||||||
| BF₁₀ | 1.142 × 10⁶ | — | |||||||||
| 3. AS | Pearson’s r | −0.714 *** | −0.484 ** | — | |||||||
| BF₁₀ | 159,221.512 | 31.340 | — | ||||||||
| 4. VS | Pearson’s r | −0.798 *** | −0.596 *** | 0.844 *** | — | ||||||
| BF₁₀ | 4.764 × 10⁷ | 834.519 | 4.072 × 10⁹ | — | |||||||
| 5. AVS | Pearson’s r | −0.785 *** | −0.556 *** | 0.864 *** | 0.883 *** | — | |||||
| BF₁₀ | 1.623 × 10⁷ | 221.043 | 4.201 × 10¹⁰ | 5.906 × 10¹¹ | — | ||||||
| 6. SLURP | Pearson’s r | −0.670 *** | −0.498 ** | 0.497 ** | 0.434 * | 0.516 ** | — | ||||
| BF₁₀ | 16,670.147 | 44.659 | 43.176 | 10.279 | 71.011 | — | |||||
| 7. VDSF | Pearson’s r | 0.493 ** | 0.497 ** | −0.409 | −0.363 | −0.322 | −0.524 ** | — | |||
| BF₁₀ | 39.077 | 43.677 | 6.384 | 2.859 | 1.557 | 87.322 | — | ||||
| 8. VDSB | Pearson’s r | 0.779 *** | 0.699 *** | −0.486 ** | −0.561 *** | −0.537 *** | −0.587 *** | 0.574 *** | — | ||
| BF₁₀ | 1.011 × 10⁷ | 67,790.264 | 33.189 | 257.850 | 128.710 | 619.187 | 389.869 | — | |||
| 9. ADSF | Pearson’s r | 0.545 *** | 0.576 *** | −0.292 | −0.474 * | −0.339 | −0.428 | 0.575 *** | 0.697 *** | — | |
| BF₁₀ | 160.052 | 419.254 | 1.058 | 24.885 | 1.968 | 9.183 | 407.956 | 63,555.120 | — | ||
| 10. ADSB | Pearson’s r | 0.603 *** | 0.616 *** | −0.411 | −0.435 * | −0.392 | −0.480 * | 0.567 *** | 0.724 *** | 0.609 *** | — |
| BF₁₀ | 1070.937 | 1710.254 | 6.535 | 10.454 | 4.658 | 28.584 | 313.522 | 269,457.545 | 1315.143 | — | |
| Variable | Age | AS | VS | AVS | SLURP | VDSF | VDSB | ADSF | ADSB | |
|---|---|---|---|---|---|---|---|---|---|---|
| 1. Factor1 (SPC) | Pearson’s r | 0.325 | −0.48 * | −0.379 | −0.418 | −0.182 | 0.241 | 0.124 | 0.128 | 0.118 |
| BF₁₀ | 1.619 | 28.49 | 3.695 | 7.49 | 0.367 | 0.603 | 0.258 | 0.263 | 0.251 | |
| 2. Factor2 (DPC) | Pearson’s r | 0.448 * | −0.231 | −0.325 | -0.213 | -0.19 | 0.216 | 0.251 | 0.308 | 0.253 |
| BF₁₀ | 13.893 | 0.547 | 1.619 | 0.467 | 0.389 | 0.478 | 0.666 | 1.290 | 0.677 | |
| 3. Factor3 (ContRecon) | Pearson’s r | 0.681 *** | −0.445 * | −0.508 ** | −0.469 * | −0.521 ** | 0.502 ** | 0.65 *** | 0.525 ** | 0.500 ** |
| BF₁₀ | 28,678.991 | 13.098 | 57.718 | 22.031 | 80.786 | 49.631 | 6880.081 | 90.378 | 46.727 | |
| 4. Factor4 (Reasoning) | Pearson’s r | 0.610 *** | −0.364 | −0.549 *** | −0.544 *** | −0.333 | 0.330 | 0.635 *** | 0.631 *** | 0.564 *** |
| BF₁₀ | 1381.063 | 2.884 | 179.303 | 154.63 | 1.809 | 1.731 | 3629.421 | 3160.303 | 290.963 | |
| Model Predictors | P(M) | P(M|Data) | BFM | BF10 | R2 |
|---|---|---|---|---|---|
| a. Auditory RT | |||||
| VDSF + VDSB | 0.031 | 0.138 | 4.952 | 1.000 | 0.304 |
| VDSF + RCPM | 0.031 | 0.103 | 3.544 | 0.745 | 0.296 |
| VDSF | 0.031 | 0.078 | 2.641 | 0.570 | 0.251 |
| VDSF + VDSB + RCPM | 0.031 | 0.074 | 2.493 | 0.540 | 0.321 |
| VDSF + ADSB | 0.031 | 0.073 | 2.455 | 0.533 | 0.288 |
| VDSF + ADSB + RCPM | 0.031 | 0.057 | 1.857 | 0.410 | 0.314 |
| VDSF + VDSB + ADSB | 0.031 | 0.050 | 1.645 | 0.366 | 0.311 |
| VDSB | 0.031 | 0.046 | 1.498 | 0.335 | 0.237 |
| VDSF + VDSB + ADSF | 0.031 | 0.042 | 1.364 | 0.306 | 0.307 |
| VDSB + RCPM | 0.031 | 0.034 | 1.106 | 0.250 | 0.267 |
| b. Visual RT | |||||
| VDSB + RCPM | 0.031 | 0.296 | 13.011 | 1.000 | 0.436 |
| VDSB + ADSF + RCPM | 0.031 | 0.113 | 3.957 | 0.383 | 0.448 |
| VDSB + ADSB + RCPM | 0.031 | 0.088 | 3.000 | 0.298 | 0.442 |
| VDSF + VDSB + RCPM | 0.031 | 0.088 | 2.996 | 0.298 | 0.442 |
| ADSF + RCPM | 0.031 | 0.059 | 1.947 | 0.200 | 0.403 |
| ADSB + RCPM | 0.031 | 0.048 | 1.568 | 0.163 | 0.399 |
| ADSF + ADSB + RCPM | 0.031 | 0.035 | 1.139 | 0.120 | 0.423 |
| VDSB + ADSF + ADSB + RCPM | 0.031 | 0.034 | 1.086 | 0.114 | 0.451 |
| VDSF + VDSB + ADSF + RCPM | 0.031 | 0.033 | 1.072 | 0.113 | 0.450 |
| VDSF + RCPM | 0.031 | 0.030 | 0.943 | 0.100 | 0.388 |
| c. Audiovisual RT | |||||
| VDSB + RCPM | 0.031 | 0.260 | 10.914 | 1.000 | 0.380 |
| RCPM | 0.031 | 0.142 | 5.118 | 0.544 | 0.329 |
| ADSB + RCPM | 0.031 | 0.100 | 3.450 | 0.385 | 0.358 |
| VDSB + ADSB + RCPM | 0.031 | 0.072 | 2.392 | 0.275 | 0.383 |
| VDSF + RCPM | 0.031 | 0.068 | 2.264 | 0.261 | 0.349 |
| VDSF + VDSB + RCPM | 0.031 | 0.068 | 2.263 | 0.261 | 0.382 |
| VDSB + ADSF + RCPM | 0.031 | 0.064 | 2.115 | 0.245 | 0.380 |
| ADSF + RCPM | 0.031 | 0.049 | 1.587 | 0.187 | 0.341 |
| VDSF + ADSB + RCPM | 0.031 | 0.032 | 1.021 | 0.122 | 0.364 |
| ADSF + ADSB + RCPM | 0.031 | 0.027 | 0.858 | 0.103 | 0.360 |
| d. SLURP | |||||
| VDSF + VDSB | 0.031 | 0.142 | 5.137 | 1.000 | 0.390 |
| VDSB + RCPM | 0.031 | 0.132 | 4.720 | 0.930 | 0.388 |
| VDSB | 0.031 | 0.115 | 4.044 | 0.812 | 0.342 |
| VDSF + VDSB + RCPM | 0.031 | 0.087 | 2.940 | 0.609 | 0.413 |
| VDSF + RCPM | 0.031 | 0.053 | 1.725 | 0.371 | 0.362 |
| VDSF + VDSB + ADSB | 0.031 | 0.039 | 1.252 | 0.273 | 0.391 |
| VDSF + VDSB + ADSF | 0.031 | 0.038 | 1.228 | 0.268 | 0.390 |
| VDSB + ADSB + RCPM | 0.031 | 0.038 | 1.210 | 0.264 | 0.390 |
| VDSB + ADSF + RCPM | 0.031 | 0.035 | 1.140 | 0.250 | 0.388 |
| VDSB + ADSB | 0.031 | 0.034 | 1.081 | 0.237 | 0.349 |
| Coefficient | P(incl) | P(incl|data) | BFinclusion | Mean | SD | 95% Credible Interval | |
|---|---|---|---|---|---|---|---|
| Lower | Upper | ||||||
| a. Auditory RT | |||||||
| Intercept | 1.000 | 1.000 | 1.000 | 872.411 | 15.869 | 839.149 | 903.814 |
| VDSF | 0.500 | 0.796 | 3.897 | −25.81 | 18.169 | −55.13 | 0.000 |
| VDSB | 0.500 | 0.552 | 1.233 | −17.648 | 21.373 | −61.011 | 1.293 |
| ADSF | 0.500 | 0.242 | 0.319 | 0.827 | 8.372 | −18.649 | 24.115 |
| ADSB | 0.500 | 0.375 | 0.599 | −8.698 | 16.764 | −52.398 | 8.372 |
| RCPM | 0.500 | 0.451 | 0.823 | −2.000 | 3.027 | −8.933 | 0.627 |
| b. Visual RT | |||||||
| Intercept | 1.000 | 1.000 | 1.000 | 905.492 | 13.232 | 880.261 | 932.099 |
| VDSF | 0.500 | 0.268 | 0.366 | −2.786 | 7.790 | −24.684 | 7.327 |
| VDSB | 0.500 | 0.743 | 2.890 | −26.288 | 20.480 | −60.510 | 0.826 |
| ADSF | 0.500 | 0.347 | 0.532 | −6.067 | 11.848 | −40.842 | 1.069 |
| ADSB | 0.500 | 0.296 | 0.420 | −5.115 | 12.490 | −46.959 | 1.706 |
| RCPM | 0.500 | 0.944 | 16.95 | −7.623 | 3.230 | −12.585 | 0.000 |
| c. Audiovisual RT | |||||||
| Intercept | 1.000 | 1.000 | 1.000 | 821.221 | 13.209 | 794.332 | 846.998 |
| VDSF | 0.500 | 0.251 | 0.335 | −1.893 | 6.667 | −23.855 | 6.914 |
| VDSB | 0.500 | 0.551 | 1.230 | −14.275 | 16.775 | −49.499 | 0.304 |
| ADSF | 0.500 | 0.221 | 0.284 | −0.709 | 6.666 | −23.327 | 10.434 |
| ADSB | 0.500 | 0.296 | 0.420 | −4.360 | 11.174 | −33.149 | 8.531 |
| RCPM | 0.500 | 0.980 | 47.980 | −8.881 | 2.996 | −15.301 | −3.594 |
| d. SLURP | |||||||
| Intercept | 1.000 | 1.000 | 1.000 | 66.385 | 2.142 | 62.335 | 70.476 |
| VDSF | 0.500 | 0.510 | 1.042 | −1.521 | 1.983 | −5.794 | 0.400 |
| VDSB | 0.500 | 0.789 | 3.745 | −4.553 | 3.226 | −9.835 | 0.000 |
| ADSF | 0.500 | 0.235 | 0.307 | −0.100 | 1.245 | −3.044 | 3.128 |
| ADSB | 0.500 | 0.259 | 0.350 | −0.403 | 1.621 | −4.913 | 2.314 |
| RCPM | 0.500 | 0.541 | 1.180 | −0.460 | 0.565 | −1.747 | 0.000 |
Disclaimer/Publisher’s Note: The statements, opinions and data contained in all publications are solely those of the individual author(s) and contributor(s) and not of MDPI and/or the editor(s). MDPI and/or the editor(s) disclaim responsibility for any injury to people or property resulting from any ideas, methods, instructions or products referred to in the content. |
© 2023 by the authors. Licensee MDPI, Basel, Switzerland. This article is an open access article distributed under the terms and conditions of the Creative Commons Attribution (CC BY) license (https://creativecommons.org/licenses/by/4.0/).
Share and Cite
Alhamdan, A.A.; Murphy, M.J.; Pickering, H.E.; Crewther, S.G. The Contribution of Visual and Auditory Working Memory and Non-Verbal IQ to Motor Multisensory Processing in Elementary School Children. Brain Sci. 2023, 13, 270. https://doi.org/10.3390/brainsci13020270
Alhamdan AA, Murphy MJ, Pickering HE, Crewther SG. The Contribution of Visual and Auditory Working Memory and Non-Verbal IQ to Motor Multisensory Processing in Elementary School Children. Brain Sciences. 2023; 13(2):270. https://doi.org/10.3390/brainsci13020270
Chicago/Turabian StyleAlhamdan, Areej A., Melanie J. Murphy, Hayley E. Pickering, and Sheila G. Crewther. 2023. "The Contribution of Visual and Auditory Working Memory and Non-Verbal IQ to Motor Multisensory Processing in Elementary School Children" Brain Sciences 13, no. 2: 270. https://doi.org/10.3390/brainsci13020270