
Central EEG Beta/Alpha Ratio Predicts the Population-Wide Efficiency of Advertisements

 , , ,
, , ,
Abstract
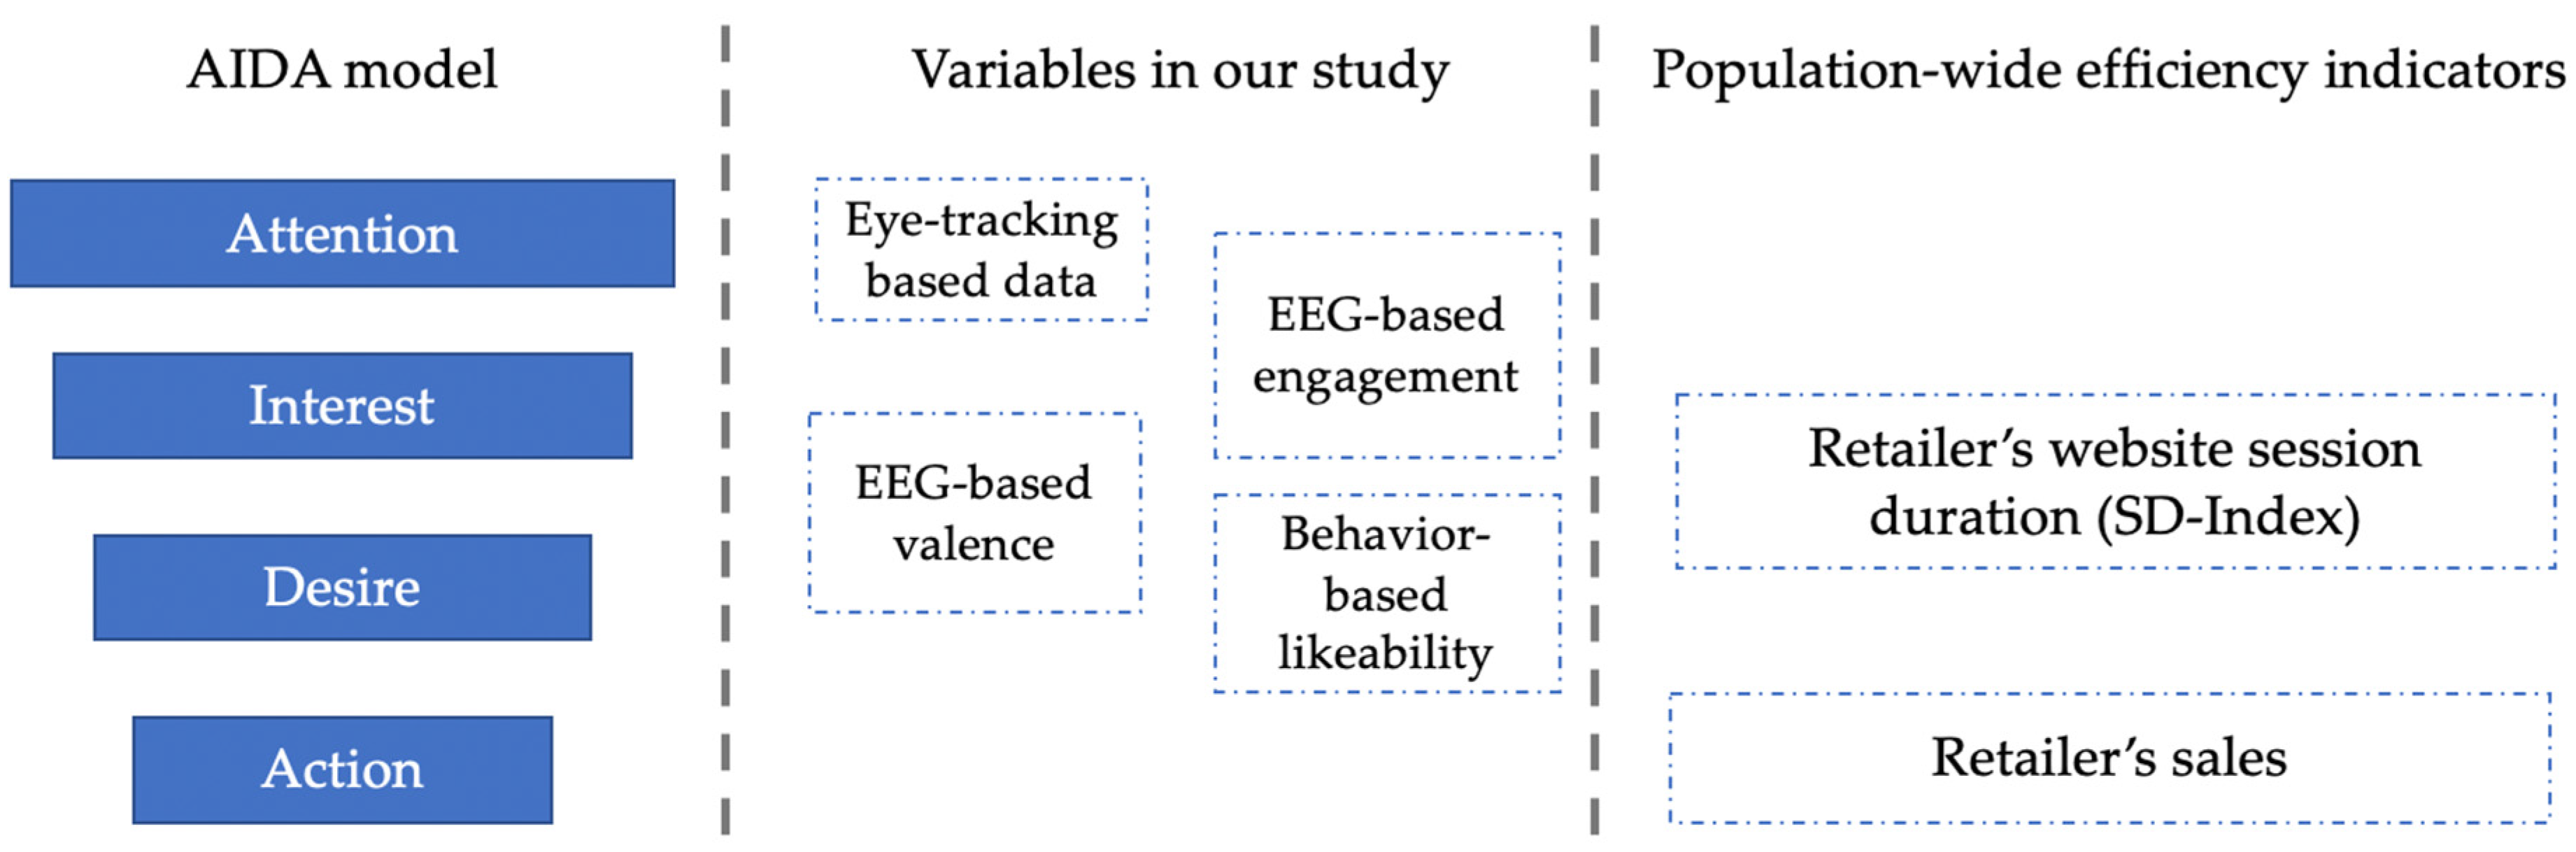
:1. Introduction
2. Materials and Methods
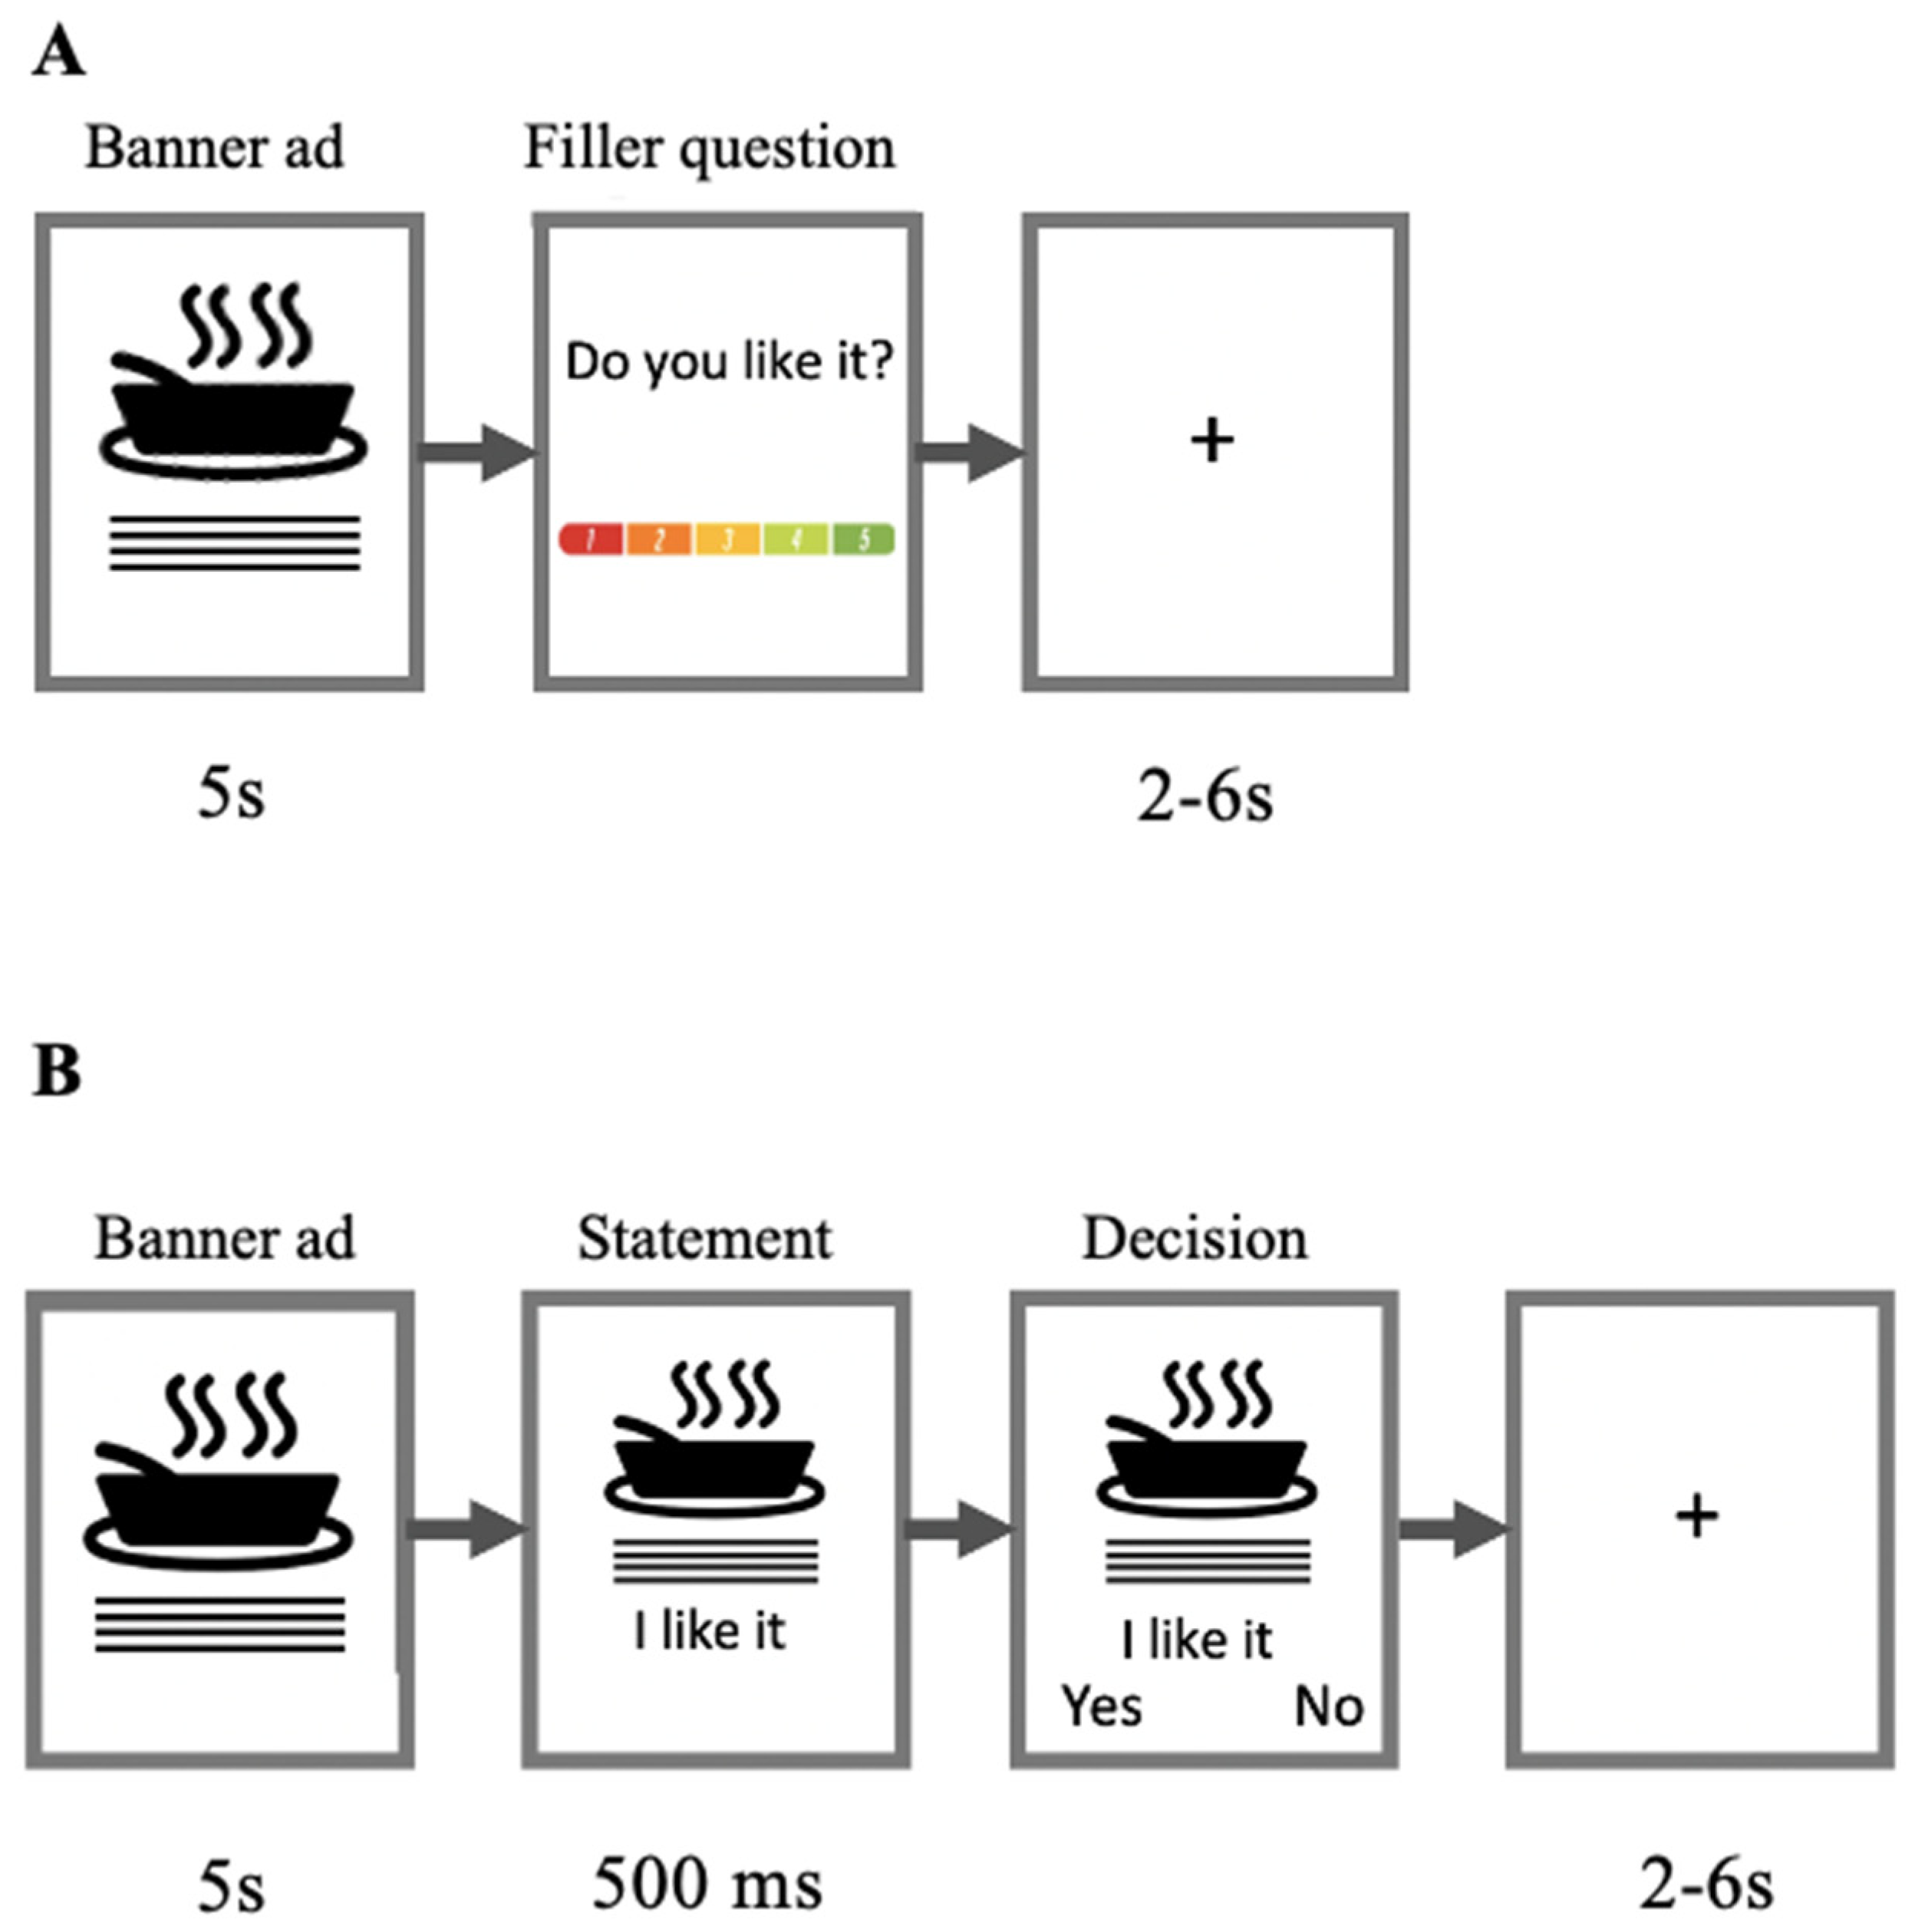
2.1. Study 1: EEG and Eye-Tracking Study
2.1.1. Participants
2.1.2. Stimuli
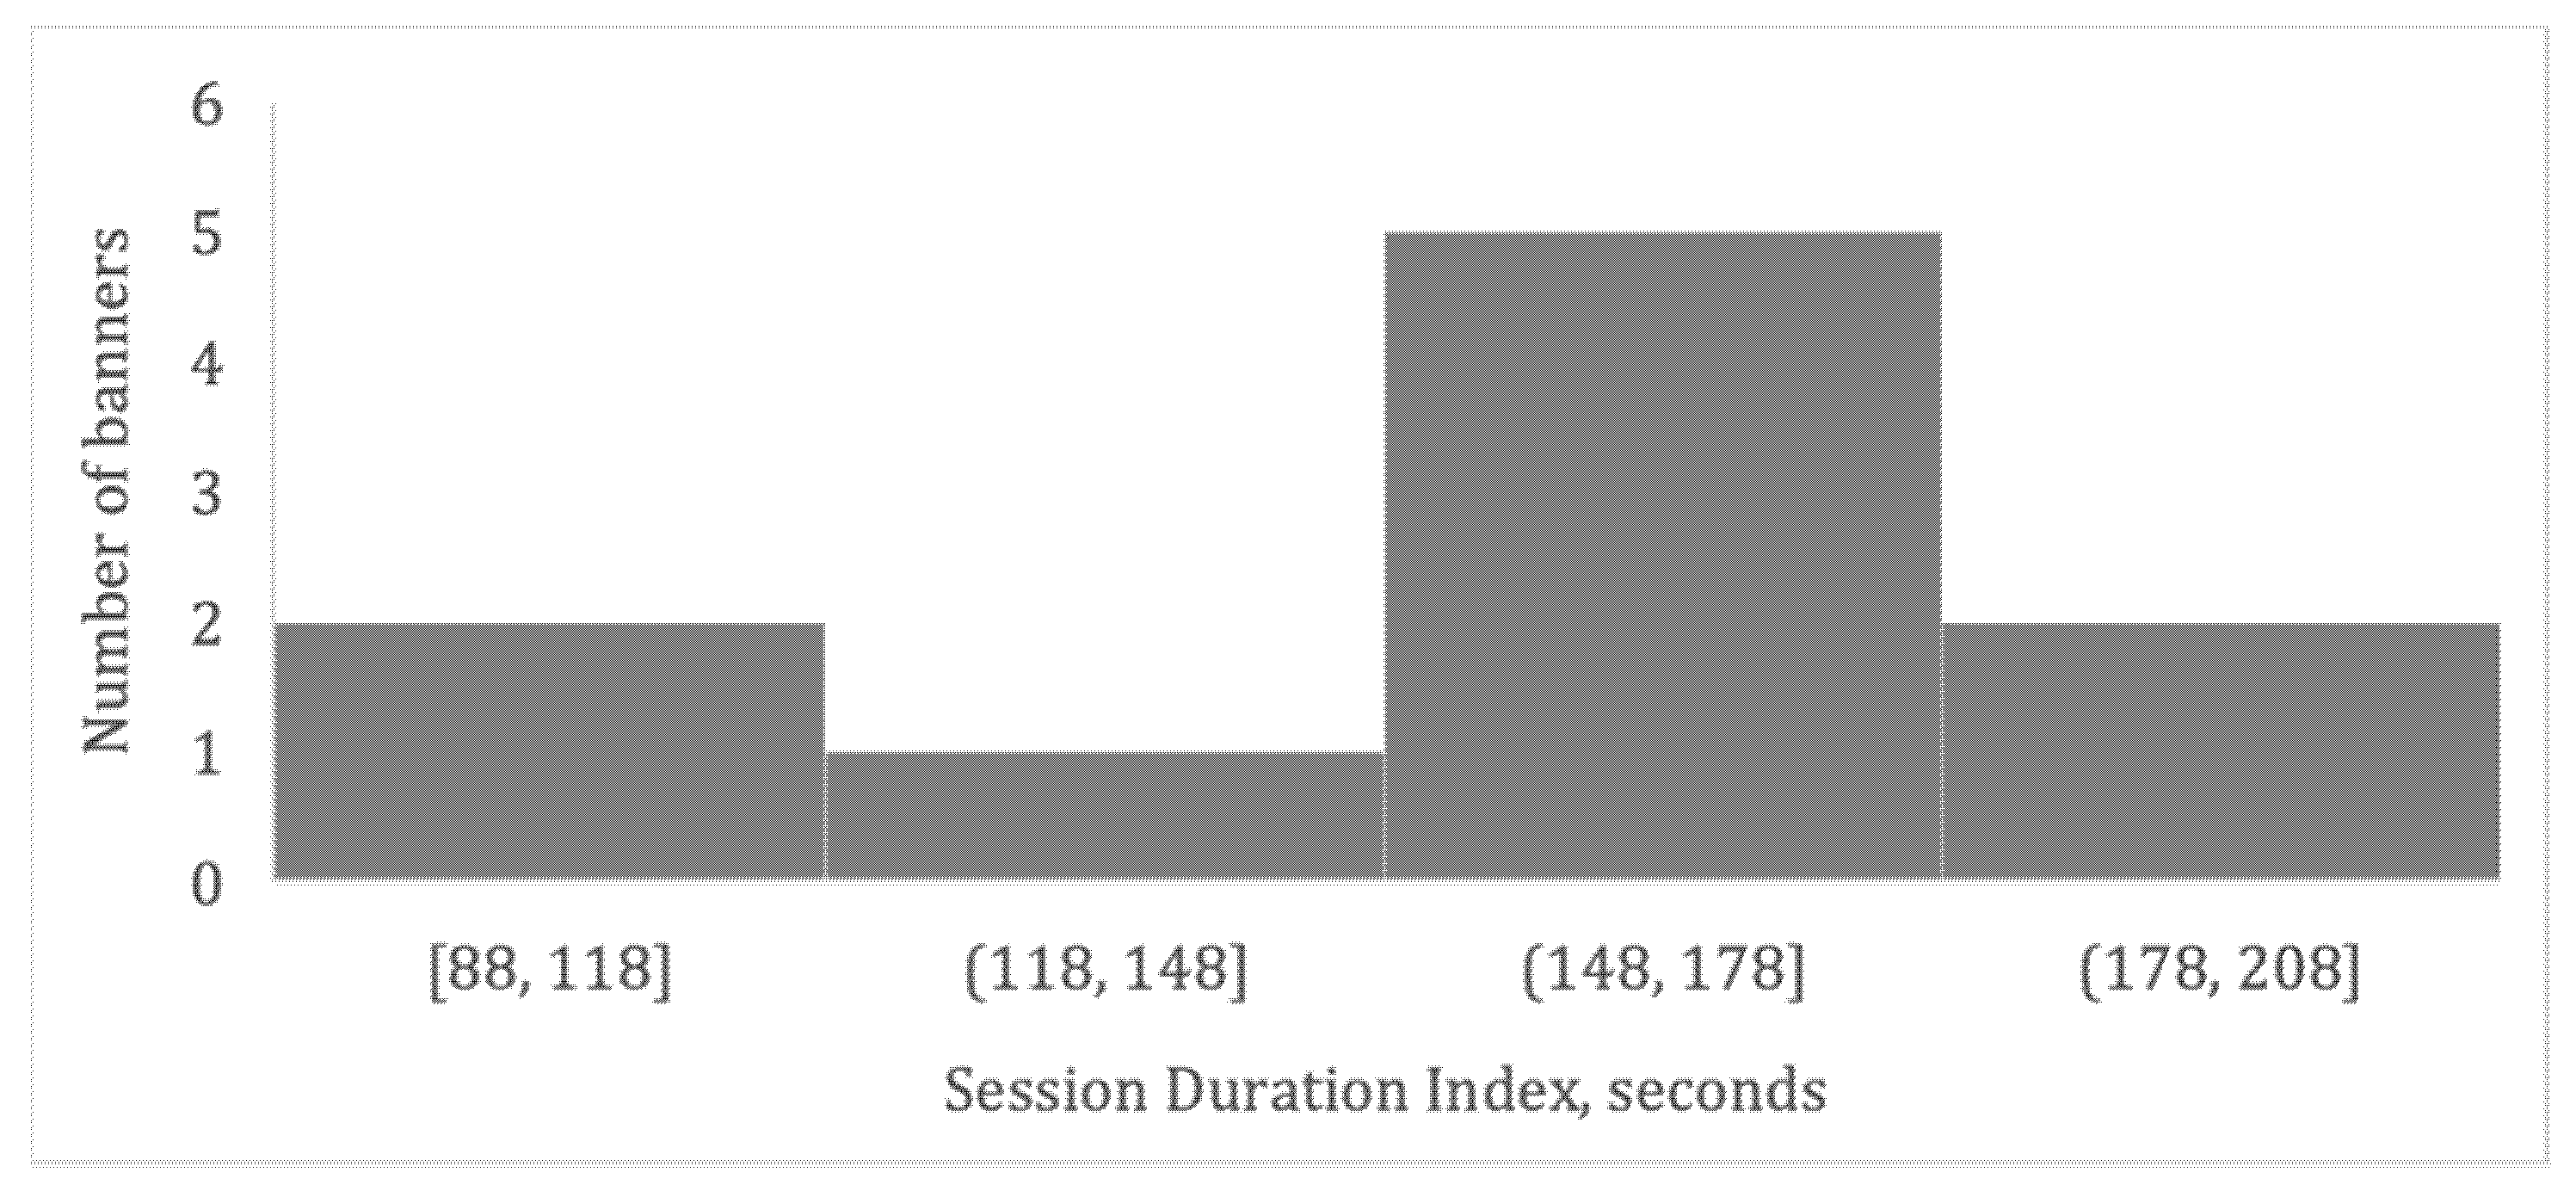
2.1.3. Aggregated Market-Level Effects of Ads
2.1.4. Eye-Tracking Recordings and Analysis
2.1.5. EEG Recording
2.1.6. EEG Analysis
2.2. Study 2: Behavioral Study
2.2.1. Participants
2.2.2. Study Design
2.2.3. Behavioral Data Analysis
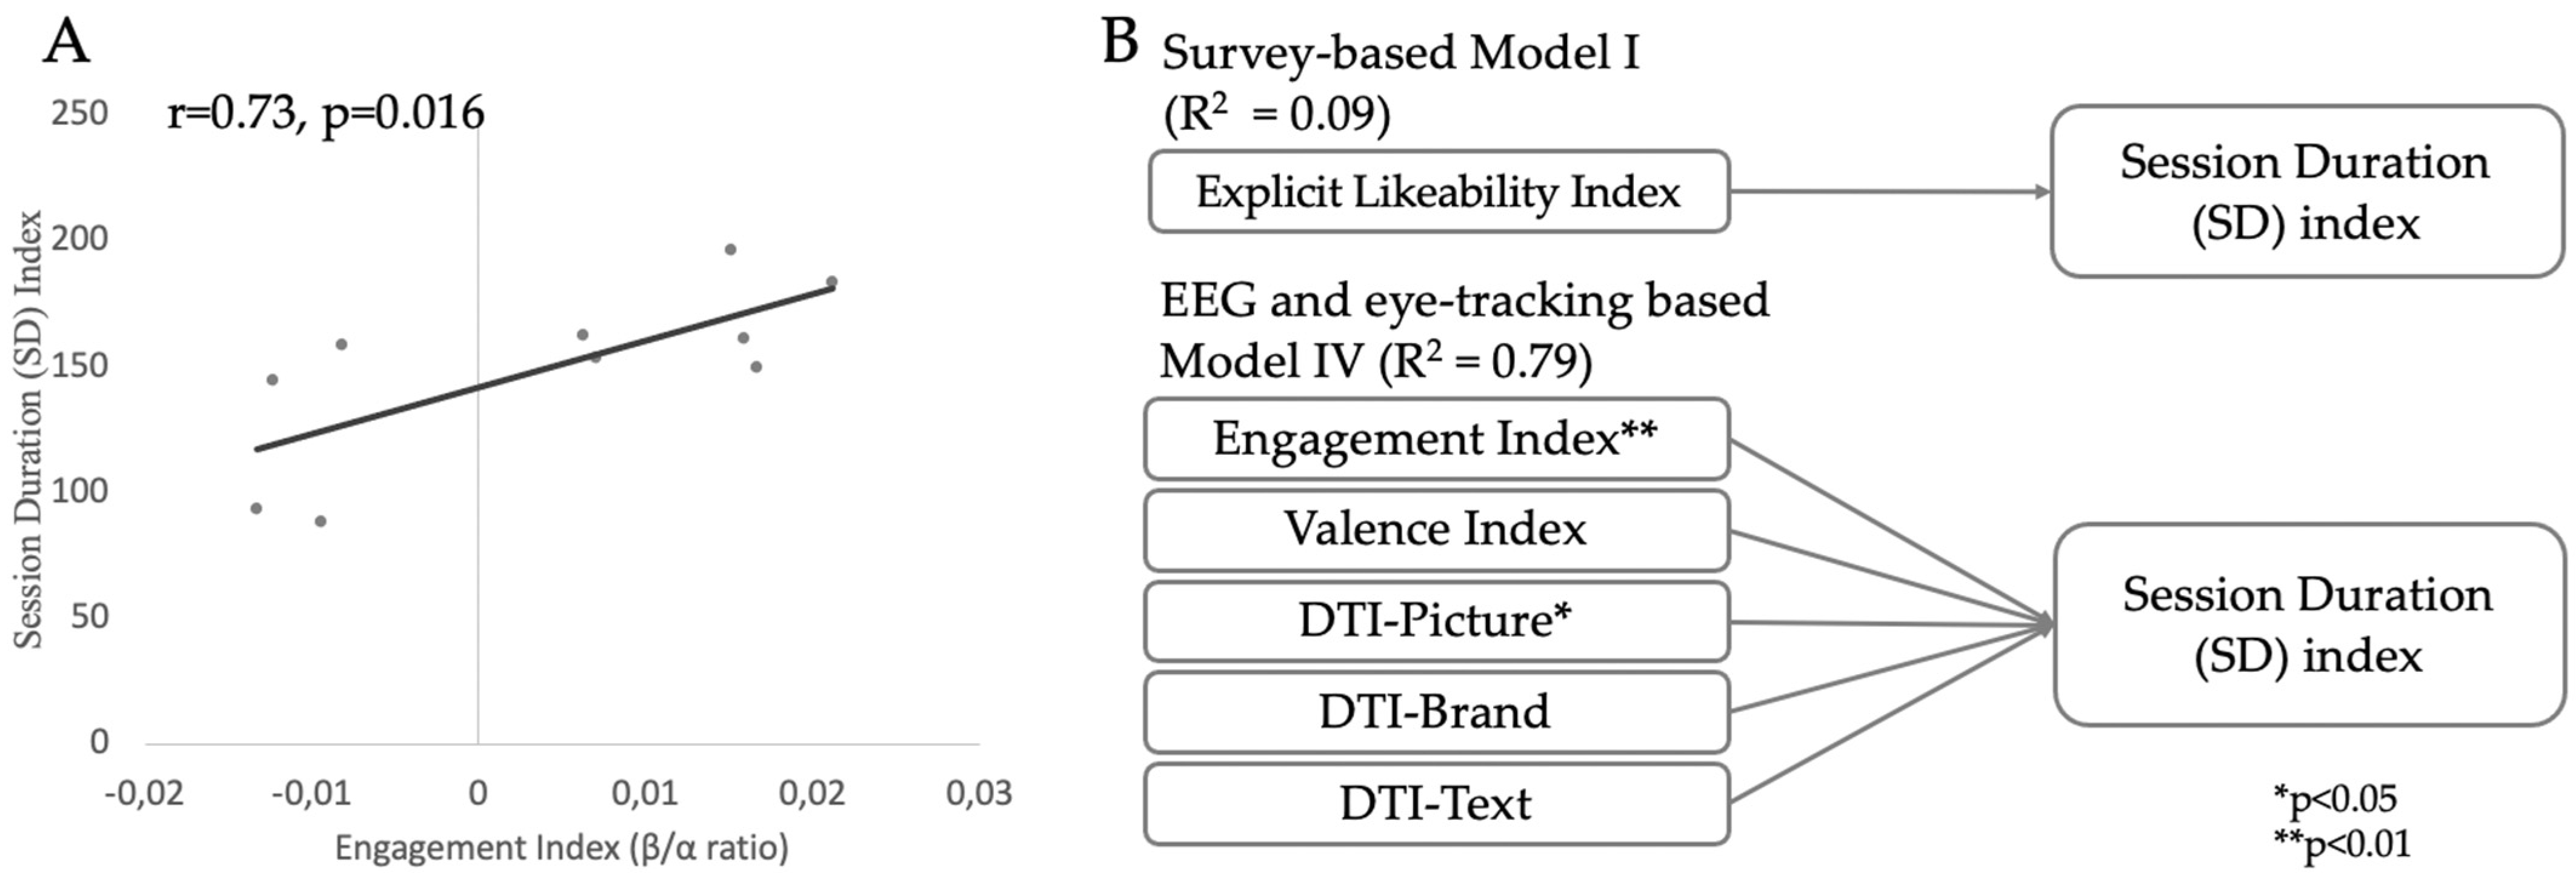
2.2.4. Multiple Regression Models
- (1)
- Model I (null model) included only the behavioral likeability index as a predictor.
- (2)
- Model II included the EEG-based valence index and engagement index as predictors.
- (3)
- Model III included eye-tracking-based DT picture index, DT text index, and DT brand index as predictors.
- (4)
- Model IV included all psychophysiological independent variables (valence index, engagement index, DT-picture index, DT-text index, DT-brand index) as predictors.
3. Results
4. Discussion
Author Contributions
Funding
Institutional Review Board Statement
Informed Consent Statement
Data Availability Statement
Conflicts of Interest
Appendix A

| Index | R | p-Value | |
|---|---|---|---|
| Study 1 | |||
| EEG-based | Engagement index | 0.73 | 0.016 * |
| EEG-based | Valence index | −0.16 | 0.65 |
| Eye-tracker-based | DTI text index | −0.46 | 0.19 |
| Eye-tracker-based | DTI picture index | 0.54 | 0.1 |
| Eye-tracker-based | DTI brand index | −0.19 | 0.59 |
| Study 2 | |||
| Behavior-based | Likeability index | 0.41 | 0.23 |

References
- Berns, G.S.; Moore, S.E. A neural predictor of cultural popularity. J. Consum. Psychol. 2012, 22, 154–160. [Google Scholar] [CrossRef]
- Boksem, M.A.S.; Smidts, A. Brain responses to movie trailers predict individual preferences for movies and their population-wide commercial success. J. Mark. Res. 2015, 52, 482–492. [Google Scholar] [CrossRef] [Green Version]
- Eijlers, E.; Boksem, M.A.S.; Smidts, A. Measuring Neural Arousal for Advertisements and Its Relationship with Advertising Success. Front. Neurosci. 2020, 14, 736. [Google Scholar] [CrossRef] [PubMed]
- Dmochowski, J.P.; Bezdek, M.A.; Abelson, B.P.; Johnson, J.S.; Schumacher, E.H.; Parra, L.C. Audience preferences are predicted by temporal reliability of neural processing. Nat. Commun. 2014, 5, 4567. [Google Scholar] [CrossRef] [PubMed] [Green Version]
- Falk, E.B.; Berkman, E.T.; Lieberman, M.D. From Neural Responses to Population Behavior: Neural Focus Group Predicts Population-Level Media Effects. Psychol. Sci. 2012, 23, 439–445. [Google Scholar] [CrossRef] [PubMed]
- Genevsky, A.; Knutson, B. Neural affective mechanisms predict market-level microlending. Psychol. Sci. 2015, 26, 1411–1422. [Google Scholar] [CrossRef] [PubMed]
- Guixeres, J.; Bigné, E.; Ausin Azofra, J.M.; Alcaniz Raya, M.; Colomer Granero, A.; Fuentes Hurtado, F.; Naranjo Ornedo, V. Consumer neuroscience-based metrics predict recall, liking and viewing rates in online advertising. Front. Psychol. 2017, 8, 1808. [Google Scholar] [CrossRef] [PubMed] [Green Version]
- Kühn, S.; Strelow, E.; Gallinat, J. Multiple “buy buttons” in the brain: Forecasting chocolate sales at point-of-sale based on functional brain activation using fMRI. Neuroimage 2016, 136, 122–128. [Google Scholar] [CrossRef]
- Tong, L.C.; Acikalin, M.Y.; Genevsky, A.; Shiv, B.; Knutson, B. Brain activity forecasts video engagement in an internet attention market. Proc. Natl. Acad. Sci. USA 2020, 117, 6936–6941. [Google Scholar] [CrossRef] [Green Version]
- Knutson, B.; Genevsky, A. Neuroforecasting Aggregate Choice. Curr. Dir. Psychol. Sci. 2018, 27, 110–115. [Google Scholar] [CrossRef]
- Venkatraman, V.; Dimoka, A.; Pavlou, P.A.; Vo, K.; Hampton, W.; Bollinger, B.; Hershfield, H.E.; Ishihara, M.; Winer, R.S. Predicting advertising success beyond traditional measures: New insights from neurophysiological methods and market response modeling. J. Mark. Res. 2015, 52, 436–452. [Google Scholar] [CrossRef] [Green Version]
- Motoki, K.; Suzuki, S.; Kawashima, R.; Sugiura, M. A Combination of Self-Reported Data and Social-Related Neural Measures Forecasts Viral Marketing Success on Social Media. J. Interact. Mark. 2020, 52, 99–117. [Google Scholar] [CrossRef]
- Scholz, C.; Baek, E.C.; O’Donnell, M.B.; Kim, H.S.; Cappella, J.N.; Falk, E.B. A neural model of valuation and information virality. Proc. Natl. Acad. Sci. USA 2017, 114, 2881–2886. [Google Scholar] [CrossRef] [PubMed] [Green Version]
- Genevsky, A.; Yoon, C.; Knutson, B. When brain beats behavior: Neuroforecasting crowdfunding outcomes. J. Neurosci. 2017, 37, 8625–8863. [Google Scholar] [CrossRef] [Green Version]
- Hakim, A.; Levy, D.J. A gateway to consumers’ minds: Achievements, caveats, and prospects of electroencephalography-based prediction in neuromarketing. Wiley Interdiscip. Rev. Cogn. Sci. 2019, 10, e1485. [Google Scholar] [CrossRef]
- Deitz, G.D.; Royne, M.B.; Peasley, M.C.; Coleman, J.T. EEG-based measures versus panel ratings: Predicting social media-based behavioral response to Super Bowl ads. J. Advert. Res. 2016, 56, 217–227. [Google Scholar] [CrossRef]
- Machouche, H.; Gharbi, A.; Elfidha, C. Implicit effects of online advertising on consumer cognitive processes. Acad. Mark. Stud. J. 2017, 21, 1–17. [Google Scholar]
- Friese, M.; Hofmann, W.; Wänke, M. The impulsive consumer: Predicting consumer behavior with implicit reaction time measures. In Social Psychology of Consumer Behavior; Psychology Press: New York, NY, USA, 2009; pp. 335–364. [Google Scholar]
- Greenwald, A.G.; Poehlman, T.A.; Uhlmann, E.L.; Banaji, M.R. Understanding and Using the Implicit Association Test: III. Meta-Analysis of Predictive Validity. J. Pers. Soc. Psychol. 2009, 97, 17–41. [Google Scholar] [CrossRef] [Green Version]
- Suurkivi, L. Relationship between ad Elements, Recall and Likeability in Short. 2019. Master’s Thesis, University of Tartu, Tartu, Estonia, 2019. [Google Scholar]
- Cardoso, L.; Chen, M.M.; Araújo, A.; de Almeida, G.G.F.; Dias, F.; Moutinho, L. Accessing Neuromarketing Scientific Performance: Research Gaps and Emerging Topics. Behav. Sci. 2022, 12, 55. [Google Scholar] [CrossRef]
- Statista. Advertising Worldwide. 2019. Available online: https://www.statista.com/study/12264/global-advertising-market-statista-dossier/ (accessed on 20 February 2021).
- Pope, A.T.; Bogartb, E.H.; Bartolomeb, D.S. Biocybernetic system evaluates indices of operator engagement in automated task. Biol. Psychol. 1995, 40, 187–195. [Google Scholar] [CrossRef]
- Kamiński, J.; Brzezicka, A.; Gola, M.; Wróbel, A. Beta band oscillations engagement in human alertness process. Int. J. Psychophysiol. 2012, 85, 125–128. [Google Scholar] [CrossRef] [PubMed]
- Molteni, E.; Bianchi, A.M.; Butti, M.; Reni, G.; Zucca, C. Analysis of the dynamical behaviour of the EEG rhythms during a test of sustained attention. In Proceedings of the 2007 29th Annual International Conference of the IEEE Engineering in Medicine and Biology Society, Lyon, France, 22–26 August 2007; pp. 1298–1301. [Google Scholar]
- HajiHosseini, A.; Rodríguez-Fornells, A.; Marco-Pallarés, J. The role of beta-gamma oscillations in unexpected rewards processing. Neuroimage 2012, 60, 1678–1685. [Google Scholar] [CrossRef] [PubMed]
- Lucchiari, C.; Pravettoni, G. The Effect of Brand on EEG Modulation. Swiss J. Psychol. 2012, 71, 199–204. [Google Scholar] [CrossRef]
- Mantini. Electrophysiological signature of brain resting state networks. Proc. Natl. Acad. Sci. USA 2007, 104, 13170–13175. [Google Scholar] [CrossRef] [PubMed] [Green Version]
- Marco-Pallares, J.; Cucurell, D.; Cunillera, T.; García, R.; Andrés-Pueyo, A.; Münte, T.F.; Rodríguez-Fornells, A. Human oscillatory activity associated to reward processing in a gambling task. Neuropsychologia 2008, 46, 241–248. [Google Scholar] [CrossRef] [PubMed] [Green Version]
- Jann, K.; Kottlow, M.; Dierks, T.; Boesch, C.; Koenig, T. Topographic electrophysiological signatures of fMRI resting state networks. PLoS ONE 2010, 5, e12945. [Google Scholar] [CrossRef] [Green Version]
- Feng, W.; Störmer, V.S.; Martinez, A.; McDonald, J.J.; Hillyard, S.A. Involuntary orienting of attention to a sound desynchronizes the occipital alpha rhythm and improves visual perception. Neuroimage 2017, 150, 318–328. [Google Scholar] [CrossRef] [Green Version]
- Smith, M.E.; Gevins, A. Attention and brain activity while watching television: Components of viewer engagement. Media Psychol. 2004, 6, 285–305. [Google Scholar] [CrossRef]
- McMahan, T.; Parberry, I.; Parsons, T.D. Evaluating Player Task Engagement and Arousal Using Electroencephalography. Procedia Manuf. 2015, 3, 2303–2310. [Google Scholar] [CrossRef] [Green Version]
- Coelli, S.; Sclocco, R.; Barbieri, R.; Reni, G.; Zucca, C.; Bianchi, A.M. EEG-based index for engagement level monitoring during sustained attention. In Proceedings of the 2015 37th Annual International Conference of the IEEE Engineering in Medicine and Biology Society (EMBC), Milan, Italy, 25–29 August 2015; pp. 1512–1515. [Google Scholar]
- Dehais, F.; Dupres, A.; Di Flumeri, G.; Verdiere, K.; Borghini, G.; Babiloni, F.; Roy, R. Monitoring Pilot’s Cognitive Fatigue with Engagement Features in Simulated and Actual Flight Conditions Using an Hybrid fNIRS-EEG Passive BCI. In Proceedings of the 2018 IEEE International Conference on Systems, Man, and Cybernetics (SMC), Miyazaki, Japan, 7–10 October 2018; pp. 544–549. [Google Scholar]
- Davidson, R.J. What does the prefrontal cortex “do” in affect: Perspectives on frontal EEG asymmetry research. Biol. Psychol. 2004, 67, 219–234. [Google Scholar] [CrossRef]
- Davidson, R.J.; Ekman, P.; Saron, C.D.; Senulis, J.A.; Friesen, W.V. Approach-withdrawal and cerebral asymmetry Emotional expression and brain physiology I. J. Personal. Soc. Psychol. 1990, 58, 330–341. [Google Scholar] [CrossRef]
- Bazzani, A.; Ravaioli, S.; Trieste, L.; Faraguna, U.; Turchetti, G. Is EEG Suitable for Marketing Research? A Systematic Review. Front. Neurosci. 2020, 14, 594566. [Google Scholar] [CrossRef] [PubMed]
- Ariely, D.; Berns, G.S. Neuromarketing: The hope and hype of neuroimaging in business. Nat. Rev. Neurosci. 2010, 11, 284–292. [Google Scholar] [CrossRef] [PubMed] [Green Version]
- Carter, B.T.; Luke, S.G. Best practices in eye tracking research. Int. J. Psychophysiol. 2020, 155, 49–62. [Google Scholar] [CrossRef]
- Tadel, F.; Baillet, S.; Mosher, J.C.; Pantazis, D.; Leahy, R.M. Brainstorm: A user-friendly application for MEG/EEG analysis. Comput. Intell. Neurosci. 2011, 2011, 879716. [Google Scholar] [CrossRef] [Green Version]
- Greenwald, A.G.; Nosek, B.A.; Banaji, M.R. Understanding and Using the Implicit Association Test: I. An Improved Scoring Algorithm. J. Pers. Soc. Psychol. 2003, 85, 197–216. [Google Scholar] [CrossRef] [Green Version]
- Lavidge, R.J.; Steiner, G.A. Evaluation of Advertising Effectiveness. J. Mark. 1961, 25, 59–62. [Google Scholar] [CrossRef]
- Vakratsas, D.; Ambler, T. How Advertising Works: What Do We Really Know? J. Mark. 1999, 63, 26–43. [Google Scholar] [CrossRef]
- Chai Lee Goi A review of marketing mix: 4Ps or more? Int. J. Mark. Stud. 2009, 1, 2–16.
- Segijn, C.M.; Eisend, M. A Meta-Analysis into Multiscreening and Advertising Effectiveness: Direct Effects, Moderators, and Underlying Mechanisms. J. Advert. 2019, 48, 313–332. [Google Scholar] [CrossRef]
- Weng, L.; Flammini, A.; Vespignani, A.; Menczer, F. Competition among memes in a world with limited attention. Sci. Rep. 2012, 2, 335. [Google Scholar] [CrossRef] [PubMed] [Green Version]
- Pieters, R.; Warlop, L.; Wedel, M. Breaking through the clutter: Benefits of advertisement originality and familiarity for brand attention and memory. Manag. Sci. 2002, 48, 765–781. [Google Scholar] [CrossRef]
- Brynjolfsson, E.; Oh, J.H. The attention economy: Measuring the value of free digital services on the internet. Int. Conf. Inf. Syst. ICIS 2012, 4, 3243–3261. [Google Scholar]
- Christoforou, C.; Papadopoulos, T.C.; Constantinidou, F.; Theodorou, M. Your brain on the movies: A computational approach for predicting box-office performance from viewer’s brain responses to movie trailers. Front. Neuroinform. 2017, 11, 72. [Google Scholar] [CrossRef] [Green Version]
- Plassmann, H.; Ramsøy, T.Z.; Milosavljevic, M. Branding the brain: A critical review and outlook. J. Consum. Psychol. Soc. Consum. Psychol. 2012, 22, 18–36. [Google Scholar] [CrossRef]
- Eijlers, E. Emotional Experience and Advertising Effectiveness: On the Use of EEG in Marketing. Ph.D. Thesis, Erasmus University, Rotterdam, The Netherlands, 2020. [Google Scholar]
- Olney, T.J.; Holbrook, M.B.; Batra, R. Consumer Responses to Advertising: The Effects of Ad Content, Emotions, and Attitude toward the Ad on Viewing Time. J. Consum. Res. 1991, 17, 440–453. [Google Scholar] [CrossRef]
- Cohen, M.X.; Elger, C.E.; Ranganath, C. Reward expectation modulates feedback-related negativity and EEG spectra. Neuroimage 2007, 35, 968–978. [Google Scholar] [CrossRef] [Green Version]
- Samanez-Larkin, G.R.; Knutson, B. Decision making in the ageing brain: Changes in affective and motivational circuits. Nat. Rev. Neurosci. 2015, 16, 278–289. [Google Scholar] [CrossRef] [Green Version]
- Bartra, O.; McGuire, J.T.; Kable, J.W. The valuation system: A coordinate-based meta-analysis of BOLD fMRI experiments examining neural correlates of subjective value. Neuroimage 2013, 76, 412–427. [Google Scholar] [CrossRef] [Green Version]
- Zhang, X.; Yuan, S.M. An eye tracking analysis for video advertising: Relationship between advertisement elements and effectiveness. IEEE Access 2018, 6, 10699–10707. [Google Scholar] [CrossRef]
- Casado-Aranda, L.A.; Sánchez-Fernández, J.; Ibáñez-Zapata, J.Á. Evaluating Communication Effectiveness Through Eye Tracking: Benefits, State of the Art, and Unresolved Questions. Int. J. Bus. Commun. 2020, 2329488419893746. [Google Scholar] [CrossRef]


| Model I | Model II | Model III | Model IV | |
|---|---|---|---|---|
| Likeability index (behavioral) | 15 (−10 40) | |||
| Engagement index (EEG) | 25 * (5 45) | 30 ** (13 47) | ||
| Valence index (EEG) | −6 (−26 13) | −3.5 (−20 13) | ||
| DT picture index (eye-tracking) | 17 (−38 72) | 34 * (4 65) | ||
| DT text index (eye-tracking) | −2 (−52 48) | 20 (−10 51) | ||
| DT brand index (eye-tracking) | 1 (−33 36) | 3 (−15 21) | ||
| Adjusted R2 | 0.09 | 0.45 | −0.05 | 0.79 |
| AIC | 99 | 95 | 102 | 86 |
| p-value | 0.2 | 0.04 | 0.5 | 0.03 |
Disclaimer/Publisher’s Note: The statements, opinions and data contained in all publications are solely those of the individual author(s) and contributor(s) and not of MDPI and/or the editor(s). MDPI and/or the editor(s) disclaim responsibility for any injury to people or property resulting from any ideas, methods, instructions or products referred to in the content. |
© 2022 by the authors. Licensee MDPI, Basel, Switzerland. This article is an open access article distributed under the terms and conditions of the Creative Commons Attribution (CC BY) license (https://creativecommons.org/licenses/by/4.0/).
Share and Cite
Kislov, A.; Gorin, A.; Konstantinovsky, N.; Klyuchnikov, V.; Bazanov, B.; Klucharev, V. Central EEG Beta/Alpha Ratio Predicts the Population-Wide Efficiency of Advertisements. Brain Sci. 2023, 13, 57. https://doi.org/10.3390/brainsci13010057
Kislov A, Gorin A, Konstantinovsky N, Klyuchnikov V, Bazanov B, Klucharev V. Central EEG Beta/Alpha Ratio Predicts the Population-Wide Efficiency of Advertisements. Brain Sciences. 2023; 13(1):57. https://doi.org/10.3390/brainsci13010057
Chicago/Turabian StyleKislov, Andrew, Alexei Gorin, Nikita Konstantinovsky, Valery Klyuchnikov, Boris Bazanov, and Vasily Klucharev. 2023. "Central EEG Beta/Alpha Ratio Predicts the Population-Wide Efficiency of Advertisements" Brain Sciences 13, no. 1: 57. https://doi.org/10.3390/brainsci13010057