
An Investigation of the Neurotoxic Effects of Malathion, Chlorpyrifos, and Paraquat to Different Brain Regions

 , , , and
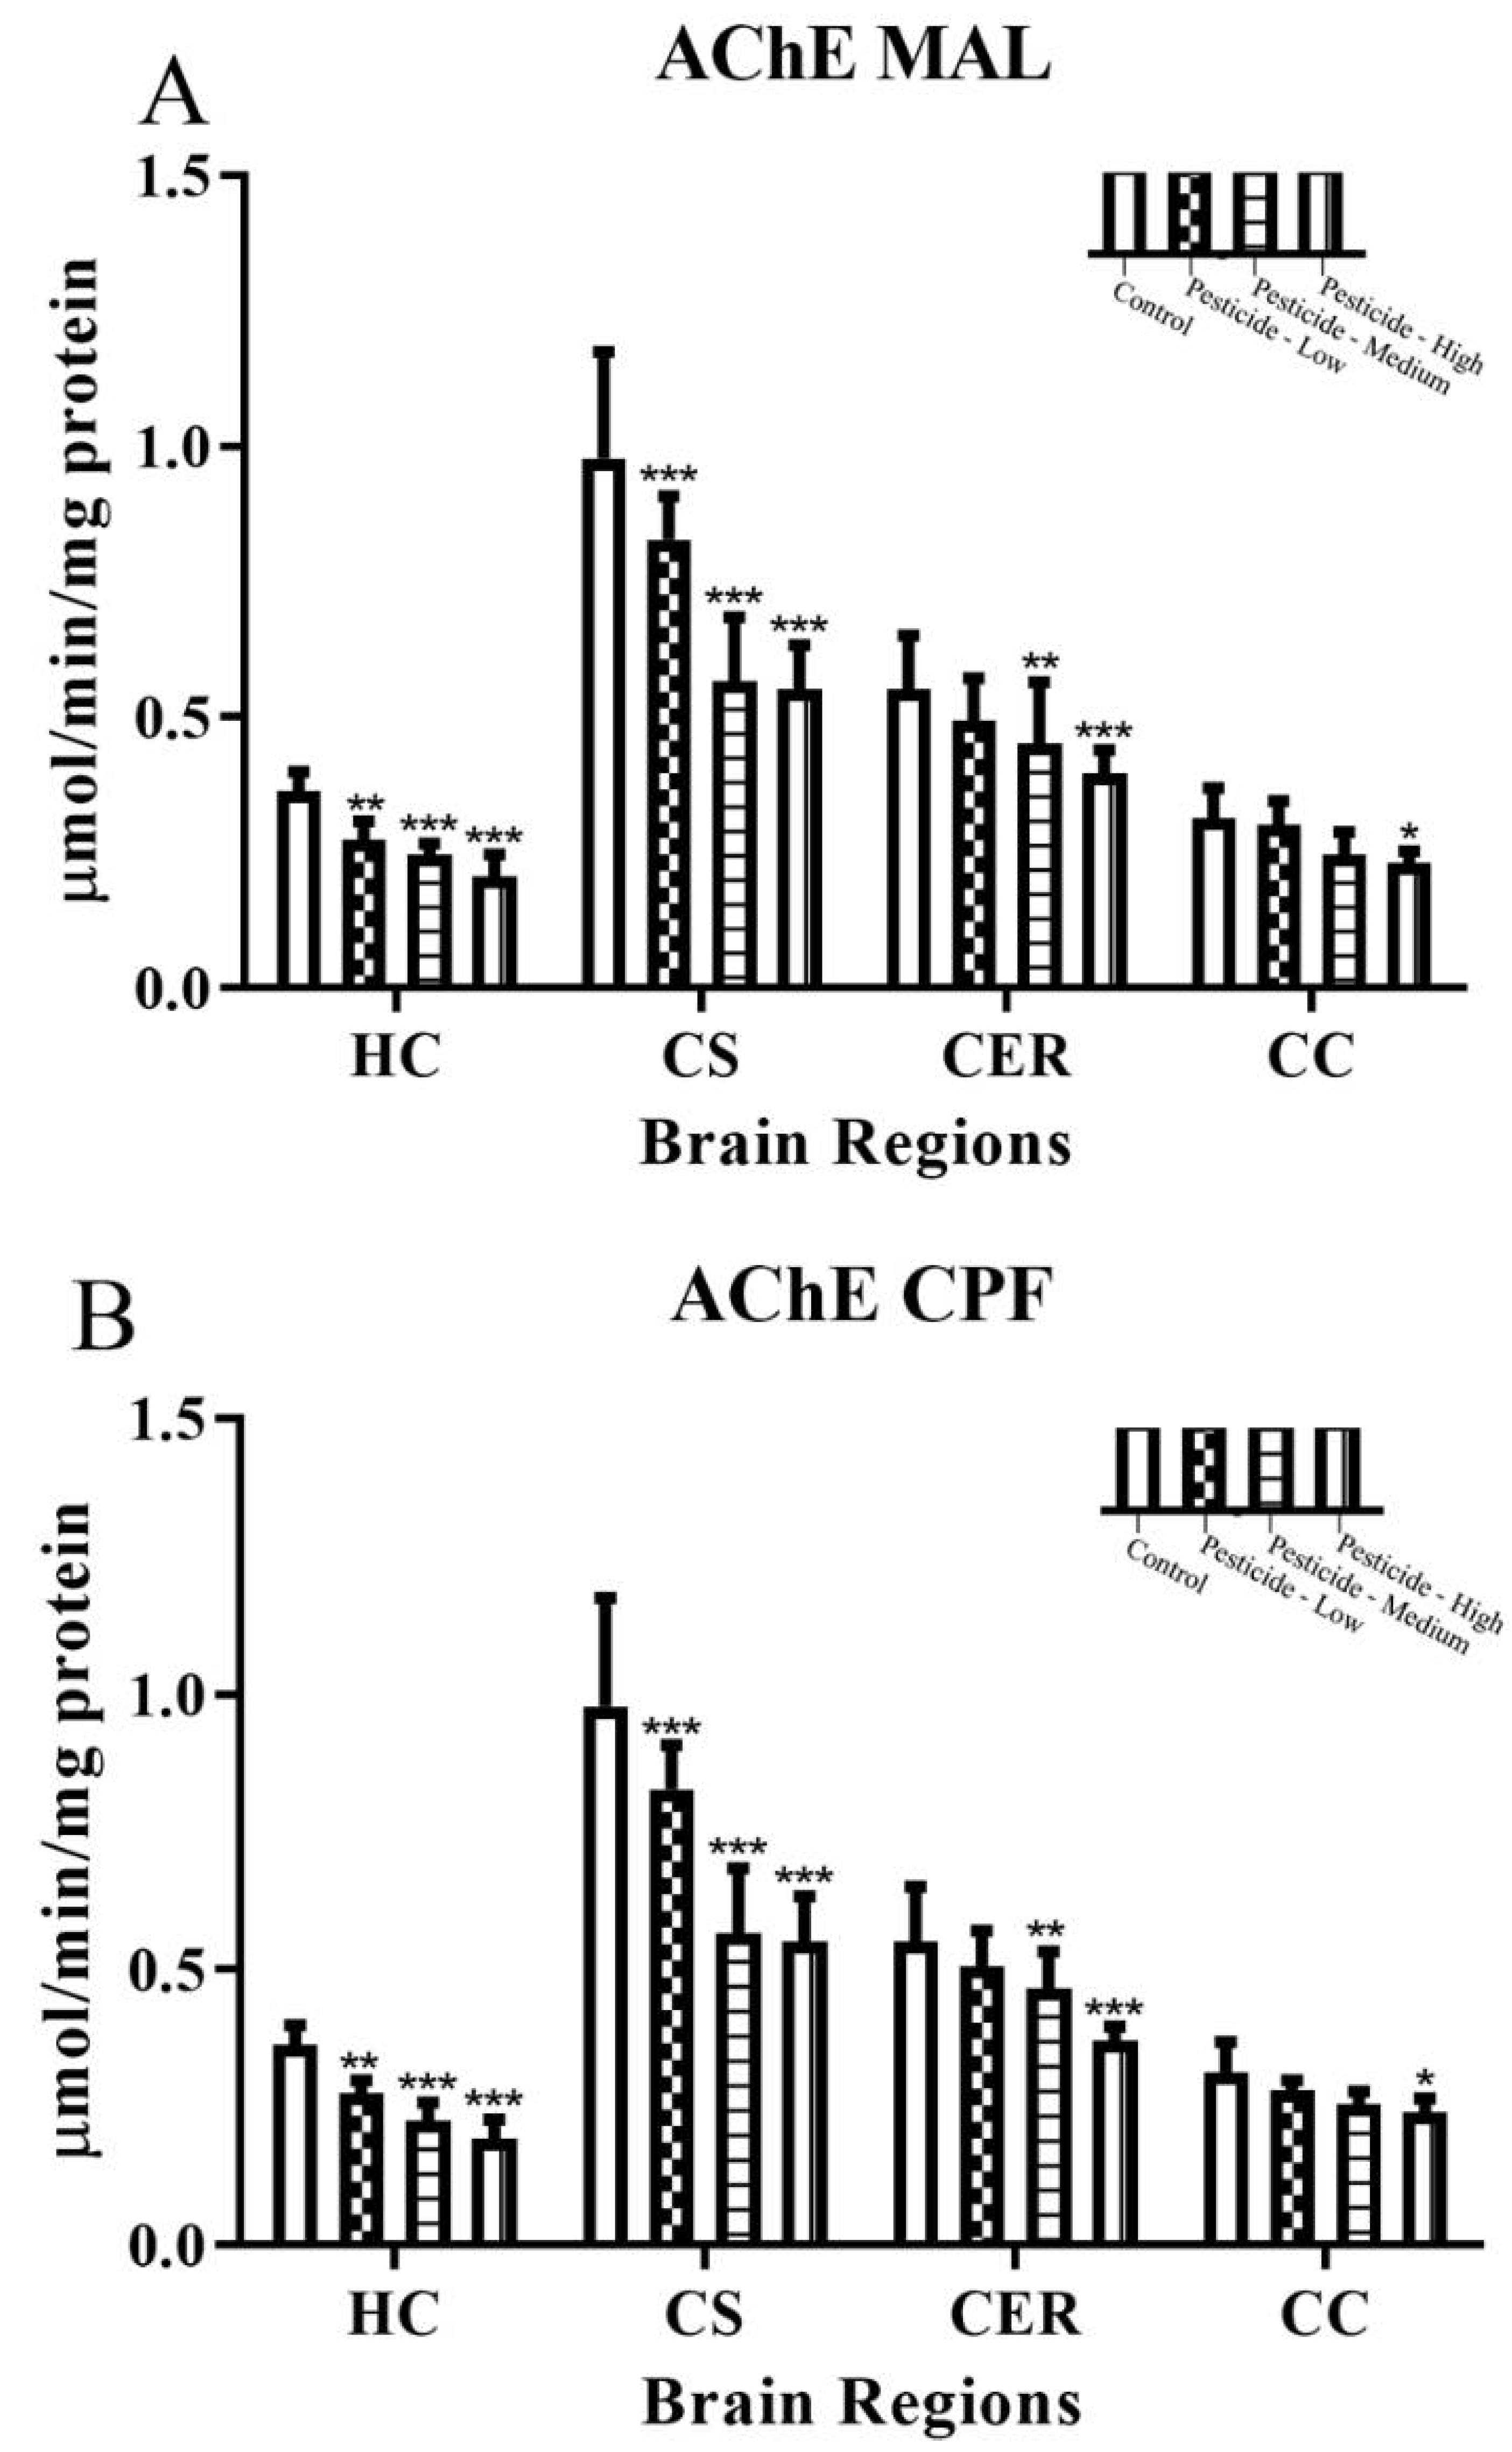
Abstract
:1. Introduction
2. Materials and Methods
2.1. Chemicals
2.2. Animal Protocols
2.3. Acetylcholinesterase Assays
2.4. Neuropathy Target Esterase (NTE) Assays
2.5. Mitochondrial Complex I and III Assays
2.6. ATP Assays
2.7. Lactate Assays
2.8. Catalase Activity Assay
2.9. Superoxide Dismutase Activity Assay
2.10. Quantitation of Lipid Peroxidation Products
2.11. Nuclear Factor E2-Related Factor 2 (Nrf2) Quantitation
2.12. Statistical Analyses
3. Results
3.1. Pesticides Differentially Inhibit Brain AChE and NTE
3.2. Pesticides Differentially Inhibit Cellular Bioenergetics
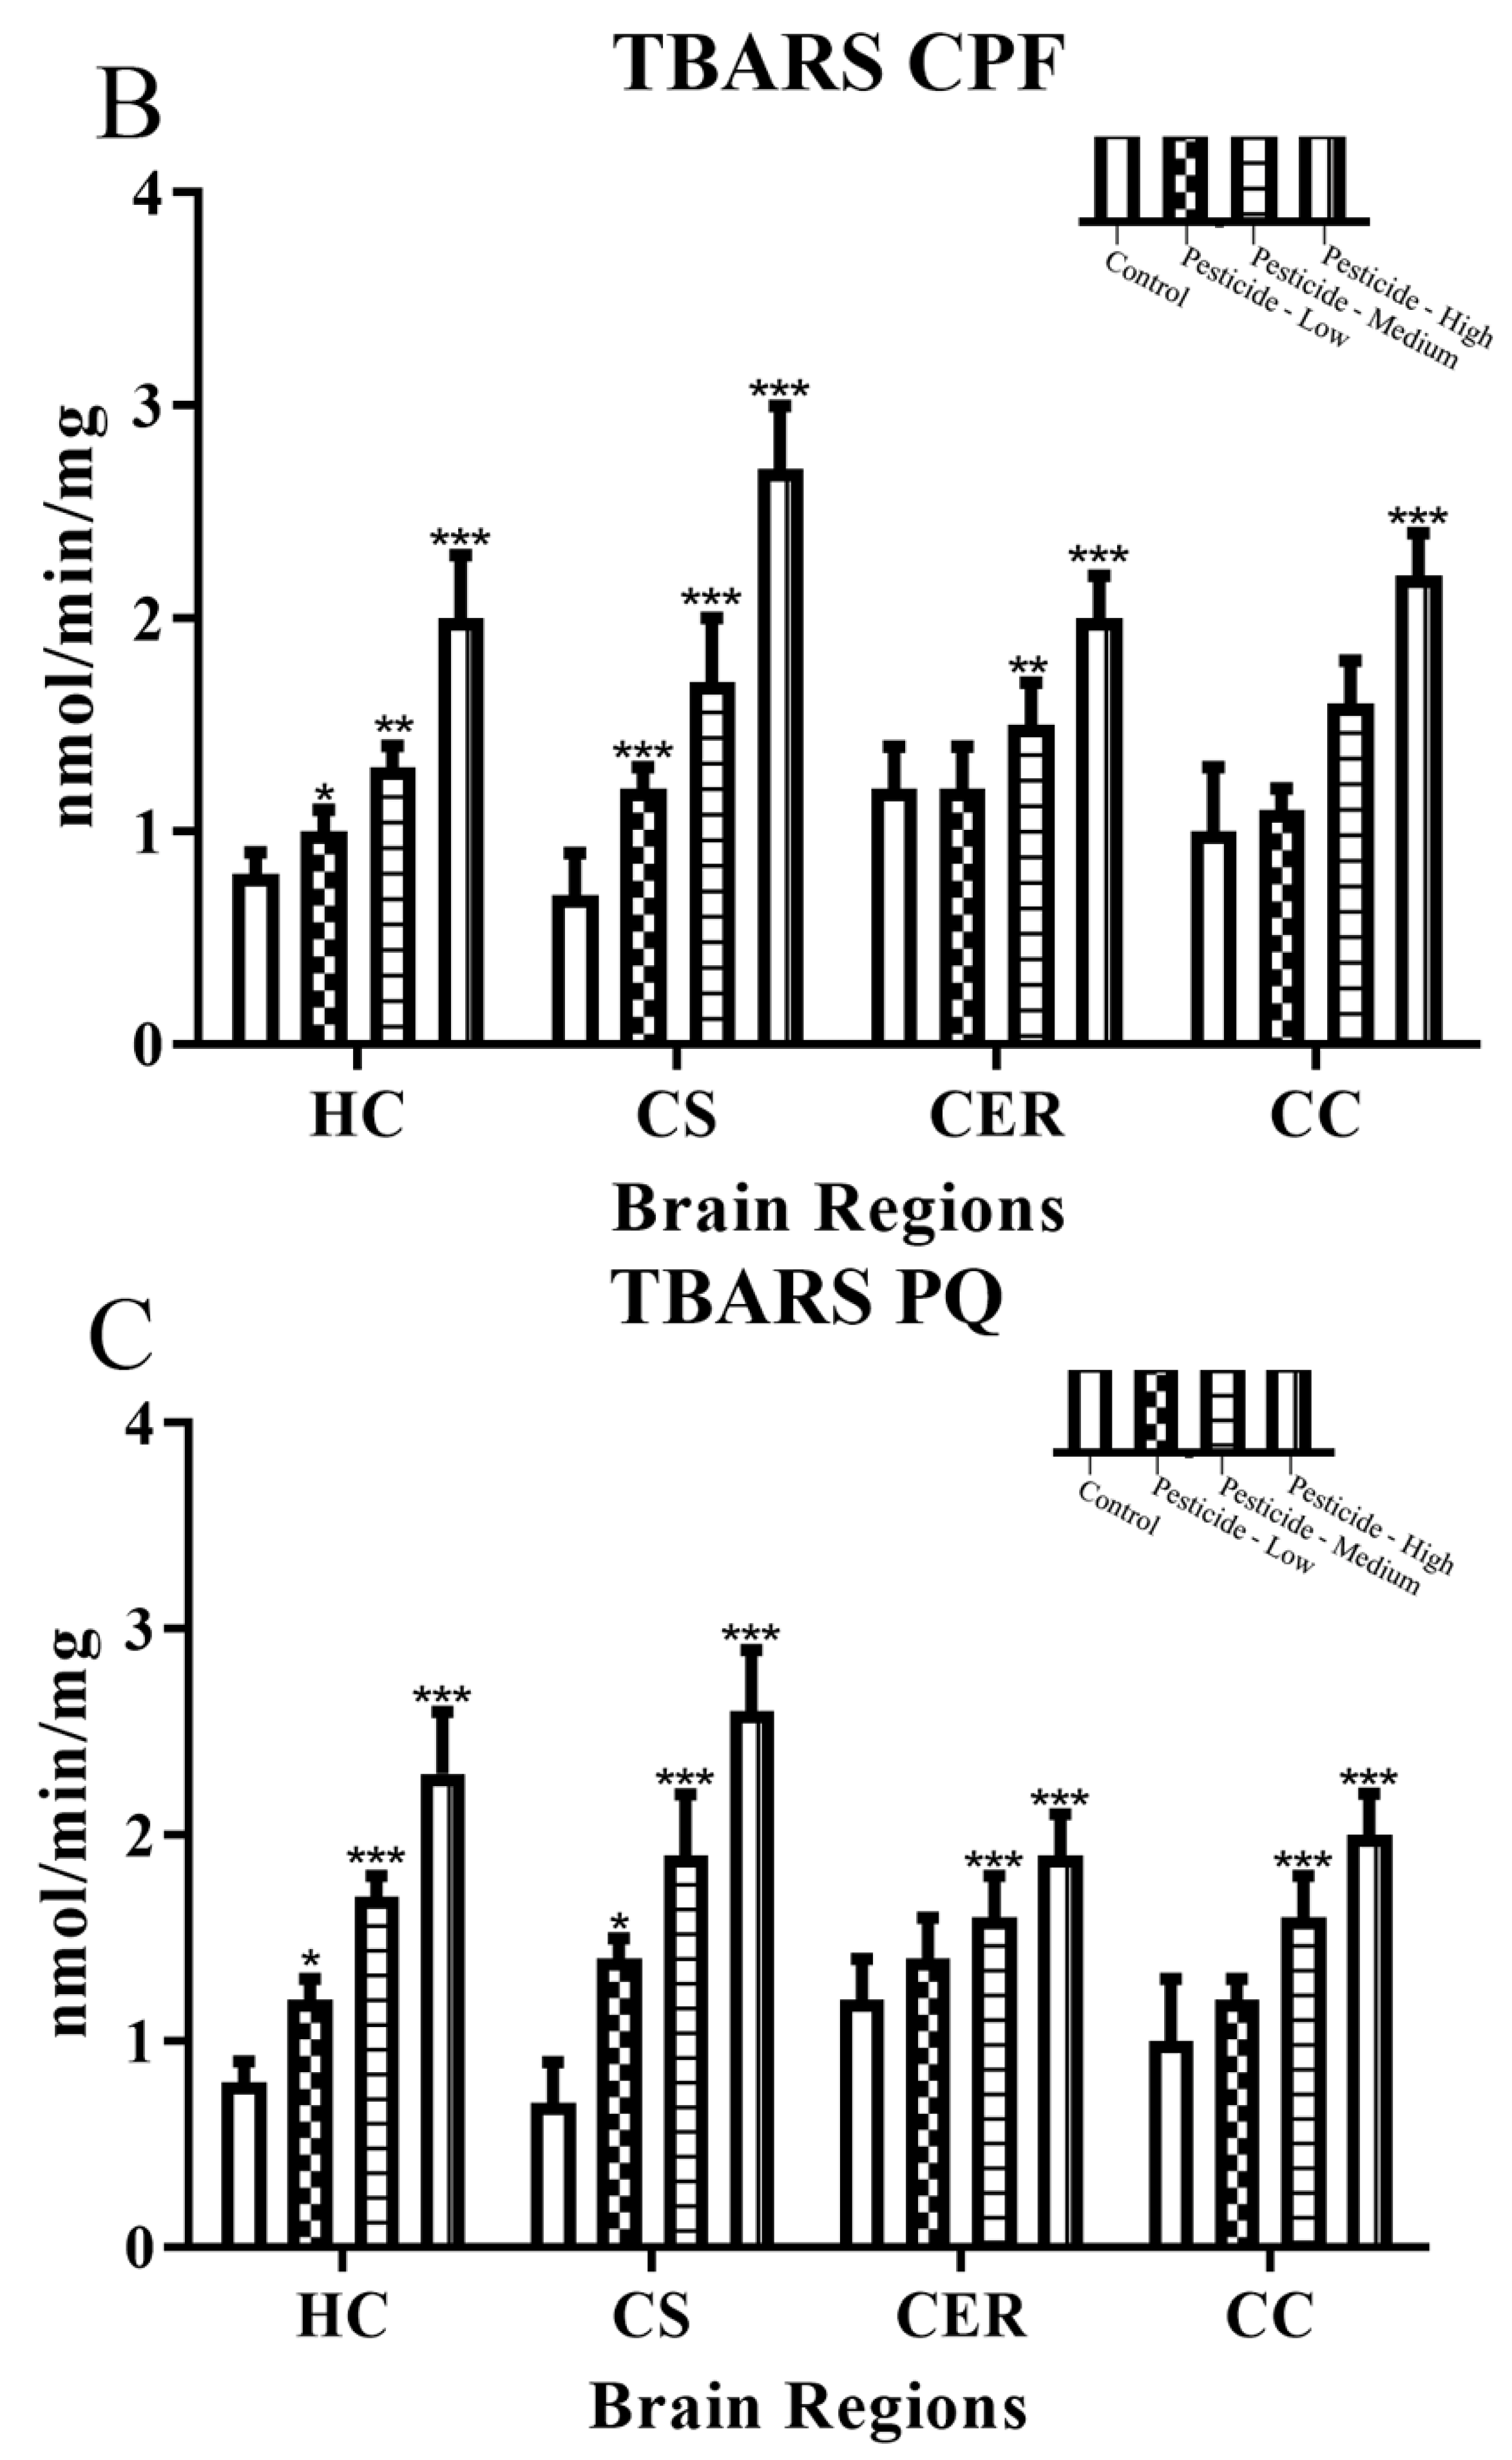
3.3. Pesticides Induce Cellular Redox Status
4. Discussion
Supplementary Materials
Author Contributions
Funding
Institutional Review Board Statement
Data Availability Statement
Conflicts of Interest
References
- Europa.eu. 2021. Available online: https://ec.europa.eu/eurostat/statistics-explained/index.php?title=Agri-environmental_indicator_-_consumption_of_pesticides (accessed on 4 June 2022).
- Tchounwou, P.B.; Patlolla, A.K.; Yedjou, C.G.; Moore, P.D. Environmental exposure and health effects associated with malathion toxicity. Toxic. Hazard Agrochem. 2015, 51, 2145–2149. [Google Scholar] [CrossRef] [Green Version]
- WHO. 2019. Available online: https://apps.who.int/iris/bitstream/handle/10665/332193/9789240005662-eng.pdf (accessed on 4 June 2022).
- Tarhoni, M.H.; Lister, T.; Ray, D.E.; Carter, W.G. Albumin binding as a potential biomarker of exposure to moderately low levels of organophosphorus pesticides. Biomarkers 2008, 13, 343–363. [Google Scholar] [CrossRef]
- Krstić, D.Z.; Čolović, M.; Kralj, M.B.; Franko, M.; Krinulović, K.; Trebše, P.; Vasić, V. Inhibition of AChE by malathion and some structurally similar compounds. J. Enzym. Inhib. Med. Chem. 2008, 23, 562–573. [Google Scholar] [CrossRef] [Green Version]
- Fortunato, J.J.; Feier, G.; Vitali, A.M.; Petronilho, F.C.; Dal-Pizzol, F.; Quevedo, J. Malathion-induced oxidative stress in rat brain regions. Neurochem. Res. 2006, 31, 671–678. [Google Scholar] [CrossRef]
- dos Santos, A.A.; Naime, A.A.; de Oliveira, J.; Colle, D.; Dos Santos, D.B.; Hort, M.A.; Moreira, E.L.; Suñol, C.; de Bem, A.F.; Farina, M. Long-term and low-dose malathion exposure causes cognitive impairment in adult mice: Evidence of hippocampal mito-chondrial dysfunction, astrogliosis and apoptotic events. Arch. Toxicol. 2016, 90, 647–660. [Google Scholar] [CrossRef]
- El-Harouny, M.A.; El Zalabany, L.M.; Abdel-Rahman, R.H.; Salama, M.; Ahmed, D. Neurotoxic Effects of Chronic Malathion Ex-posure in BALB/c Mice. Mansoura J. Forensic Med. Clin. Toxicol. 2017, 25, 93–103. [Google Scholar] [CrossRef]
- Akbel, E.; Arslan-Acaroz, D.; Demirel, H.H.; Kucukkurt, I.; Ince, S. The subchronic exposure to malathion, an organophosphate pesticide, causes lipid peroxidation, oxidative stress, and tissue damage in rats: The protective role of resveratrol. Toxicol. Res. 2018, 7, 503–512. [Google Scholar] [CrossRef] [Green Version]
- Richardson, R. Assessment of the neurotoxic potential of chlorpyrifos relative to other organophosphorus compounds: A critical review of the literature. J. Toxicol. Environ. Health Part A 1995, 44, 135–165. [Google Scholar] [CrossRef]
- Richardson, J.R.; Fitsanakis, V.; Westerink, R.H.S.; Kanthasamy, A.G. Neurotoxicity of pesticides. Acta Neuropathol. 2019, 138, 343–362. [Google Scholar] [CrossRef]
- Burke, R.D.; Todd, S.W.; Lumsden, E.; Mullins, R.; Mamczarz, J.; Fawcett, W.P.; Gullapalli, R.P.; Randall, W.R.; Pereira, E.F.R.; Albuquerque, E.X. Developmental neurotoxicity of the organophosphorus insecticide chlorpyrifos: From clinical findings to preclinical models and potential mechanisms. J. Neurochem. 2017, 142, 162–177. [Google Scholar] [CrossRef]
- Nicklas, W.J.; Vyas, I.; Heikkila, R.E. Inhibition of NADH-linked oxidation in brain mitochondria by 1-methyl-4-phenyl-pyridine, a metabolite of the neurotoxin, 1-methyl-4-phenyl-1,2,5,6-tetrahydropyridine. Life Sci. 1985, 36, 2503–2508. [Google Scholar] [CrossRef]
- Cleeter, M.W.J.; Cooper, J.M.; Schapira, A.H.V. Irreversible inhibition of mitochondrial complex I by 1-methyl-4-phenylpyridinium: Evidence for free radical involvement. J. Neurochem. 1992, 58, 786–789. [Google Scholar] [CrossRef] [PubMed]
- Kalivendi, S.V.; Kotamraju, S.; Cunningham, S.; Shang, T.; Hillard, C.J.; Kalyanaraman, B. 1-Methyl-4-phenylpyridinium (MPP+)-induced apoptosis and mitochondrial oxidant generation: Role of transferrin-receptor-dependent iron and hydrogen peroxide. Biochem. J. 2003, 371, 151–164. [Google Scholar] [CrossRef]
- Langston, J.W.; Forno, L.S.; Tetrud, J.; Reeves, A.G.; Kaplan, J.A.; Karluk, D. Evidence of active nerve cell degeneration in the sub-stantia nigra of humans years after 1-methyl-4-phenyl-1,2,3,6-tetrahydropyridine exposure. Ann. Neurol. 1999, 46, 598–605. [Google Scholar] [CrossRef]
- El-Gamal, M.; Salama, M.; Collins-Praino, L.E.; Baetu, I.; Fathalla, A.M.; Soliman, A.M.; Mohamed, W.; Moustafa, A.A. Neurotoxin-Induced Rodent Models of Parkinson’s Disease: Benefits and Drawbacks. Neurotox. Res. 2021, 39, 897–923. [Google Scholar] [CrossRef]
- Prakash, S.; Carter, W.G. The Neuroprotective Effects of Cannabis-Derived Phytocannabinoids and Resveratrol in Parkinson’s Disease: A Systematic Literature Review of Pre-Clinical Studies. Brain Sci. 2021, 11, 1573. [Google Scholar] [CrossRef]
- Castello, P.R.; Drechsel, D.A.; Patel, M. Mitochondria are a major source of paraquat-induced reactive oxygen species production in the brain. J. Biol. Chem. 2007, 282, 14186–14193. [Google Scholar] [CrossRef] [Green Version]
- Franco, R.; Li, S.; Rodriguez-Rocha, H.; Burns, M.; Panayiotidis, M.I. Molecular mechanisms of pesticide-induced neurotoxicity: Relevance to Parkinson’s disease. Chem. Interact. 2010, 188, 289–300. [Google Scholar] [CrossRef] [Green Version]
- Zhao, Y.; Zhao, B. Oxidative stress and the pathogenesis of Alzheimer’s disease. Oxidative Med. Cell. Longev. 2013, 2013, 316523. [Google Scholar] [CrossRef] [Green Version]
- Kim, G.H.; Kim, J.E.; Rhie, S.J.; Yoon, S. The Role of Oxidative Stress in Neurodegenerative Diseases. Exp. Neurobiol. 2015, 24, 325–340. [Google Scholar] [CrossRef]
- Costa, L.G. Organophosphorus Compounds at 80: Some Old and New Issues. Toxicol. Sci. 2017, 162, 24–35. [Google Scholar] [CrossRef] [Green Version]
- Casida, J.E.; Quistad, G.B. Organophosphate toxicology: Safety aspects of nonacetylcholinesterase secondary targets. Chem. Res. Toxicol. 2004, 17, 983–998. [Google Scholar] [CrossRef]
- Carter, W.G.; Tarhoni, M.; Rathbone, A.J.; E Ray, D. Differential protein adduction by seven organophosphorus pesticides in both brain and thymus. Hum. Exp. Toxicol. 2007, 26, 347–354. [Google Scholar] [CrossRef]
- Carter, W.G.; Tarhoni, M.H.; Ray, D.E. Analytical approaches to investigate protein–pesticide adducts. J. Chromatogr. B 2010, 878, 1312–1319. [Google Scholar] [CrossRef]
- Naughton, S.X.; Terry, A.V. Neurotoxicity in acute and repeated organophosphate exposure. Toxicology 2018, 408, 101–112. [Google Scholar] [CrossRef]
- Richardson, R.J.; Fink, J.K.; Glynn, P.; Hufnagel, R.B.; Makhaeva, G.F.; Wijeyesakere, S.J. Neuropathy target esterase (NTE/PNPLA6) and organophosphorus compound-induced delayed neurotoxicity (OPIDN). Adv. Neurotoxicol. 2020, 4, 1–78. [Google Scholar] [CrossRef]
- Yan, D.; Zhang, Y.; Liu, L.; Yan, H. Pesticide exposure and risk of Alzheimer’s disease: A systematic review and meta-analysis. Sci. Rep. 2016, 6, 32222. [Google Scholar] [CrossRef] [Green Version]
- Mostafalou, S.; Abdollahi, M. The link of organophosphorus pesticides with neurodegenerative and neurodevelopmental diseases based on evidence and mechanisms. Toxicology 2018, 409, 44–52. [Google Scholar] [CrossRef]
- Vaccari, C.; El Dib, R.; Gomaa, H.; Lopes, L.C.; de Camargo, J.L. Paraquat and Parkinson’s disease: A systematic review and me-ta-analysis of observational studies. J. Toxicol. Environ. Health Part B. 2019, 22, 172–202. [Google Scholar] [CrossRef]
- Tangamornsuksan, W.; Lohitnavy, O.; Sruamsiri, R.; Chaiyakunapruk, N.; Scholfield, C.N.; Reisfeld, B.; Lohitnavy, M. Paraquat exposure and Parkinson’s disease: A systematic review and meta-analysis. Arch. Environ. Occup. Health 2018, 74, 225–238. [Google Scholar] [CrossRef]
- Gunnarsson, L.-G.; Bodin, L. Occupational Exposures and Neurodegenerative Diseases—A Systematic Literature Review and Meta-Analyses. Int. J. Environ. Res. Public Health 2019, 16, 337. [Google Scholar] [CrossRef] [Green Version]
- Jokanović, M. Neurotoxic effects of organophosphorus pesticides and possible association with neurodegenerative diseases in man: A review. Toxicology 2018, 410, 125–131. [Google Scholar] [CrossRef]
- Frisoni, G.B.; Laakso, M.P.; Beltramello, A.; Geroldi, C.; Bianchetti, A.; Soininen, H.; Trabucchi, M. Hippocampal and en-torhinal cortex atrophy in frontotemporal dementia and Alzheimer’s disease. Neurology 1999, 52, 91–100. [Google Scholar] [CrossRef]
- Dugger, B.N.; Dickson, D.W. Pathology of neurodegenerative diseases. Cold Spring Harb. Perspect. Biol. 2017, 9, a028035. [Google Scholar] [CrossRef] [Green Version]
- Bird, C.M.; Burgess, N. The hippocampus and memory: Insights from spatial processing. Nat. Rev. Neurosci. 2008, 9, 182–194. [Google Scholar] [CrossRef]
- Bloem, B.R.; Okun, M.S.; Klein, C. Parkinson’s disease. Lancet 2021, 397, 2284–2303. [Google Scholar] [CrossRef]
- Surmeier, D.J.; Graves, S.M.; Shen, W. Dopaminergic modulation of striatal networks in health and Parkinson’s disease. Curr. Opin. Neurobiol. 2014, 29, 109–117. [Google Scholar] [CrossRef] [Green Version]
- Zhai, S.; Tanimura, A.; Graves, S.M.; Shen, W.; Surmeier, D.J. Striatal synapses, circuits, and Parkinson’s disease. Curr. Opin. Neurobiol. 2017, 48, 9–16. [Google Scholar] [CrossRef]
- Available online: https://pubchem.ncbi.nlm.nih.gov/compound/Malathion#section=Acute-Effects (accessed on 16 July 2022).
- Available online: https://pubchem.ncbi.nlm.nih.gov/compound/2730#section=NIOSH-Toxicity-Data (accessed on 16 July 2022).
- Available online: https://pubchem.ncbi.nlm.nih.gov/compound/15938#section=NIOSH-Toxicity-Data (accessed on 16 July 2022).
- Ellman, G.L.; Courtney, K.D.; Andres, V., Jr.; Featherstone, R.M. A new and rapid colorimetric determination of acetylcholinesterase activity. Biochem. Pharmacol. 1961, 7, 88–95. [Google Scholar] [CrossRef]
- Johnson, M.K. Improved assay of neurotoxic esterase for screening organophosphates for delayed neurotoxicity potential. Arch. Toxicol. 1977, 37, 113–115. [Google Scholar] [CrossRef]
- He, F. Bradford protein assay. Bio-protocol 2011, 101, e45. [Google Scholar] [CrossRef]
- Spinazzi, M.; Casarin, A.; Pertegato, V.; Salviati, L.; Angelini, C. Assessment of mitochondrial respiratory chain enzymatic activi-ties on tissues and cultured cells. Nat. Protoc. 2012, 7, 1235–1246. [Google Scholar] [CrossRef]
- Singh, R.; Wiseman, B.; Deemagarn, T.; Jha, V.; Switala, J.; Loewen, P.C. Comparative study of catalase-peroxidases (KatGs). Arch. Biochem. Biophys. 2008, 471, 207–214. [Google Scholar] [CrossRef] [Green Version]
- Beauchamp, C.; Fridovich, I. Superoxide Dismutase: Improved Assays and an Assay Applicable to Acrylamide Gels. Anal. Biochem. 1971, 44, 276–287. [Google Scholar] [CrossRef]
- Niehaus, W.G., Jr.; Samuelsson, B. Formation of malonaldehyde from phospholipid arachidonate during microsomal lipid pe-roxidation. Eur. J. Biochem. 1968, 6, 126–130. [Google Scholar] [CrossRef]
- Picciotto, M.R.; Higley, M.J.; Mineur, Y.S. Acetylcholine as a neuromodulator: Cholinergic signaling shapes nervous system function and behavior. Neuron 2012, 76, 116–129. [Google Scholar] [CrossRef] [Green Version]
- Luchicchi, A.; Bloem, B.; Viaã±A, J.N.M.; Mansvelder, H.D.; Role, L.W. Illuminating the Role of Cholinergic Signaling in Circuits of Attention and Emotionally Salient Beh aviors. Front. Synaptic Neurosci. 2014, 6, 24. [Google Scholar] [CrossRef]
- Shinohara, T.; Seto, Y. In VitroInhibition of Acetylcholinesterase by Paraquat. Agric. Biol. Chem. 1986, 50, 255–256. [Google Scholar] [CrossRef]
- Alcaro, S.; Arcone, R.; Vecchio, I.; Ortuso, F.; Gallelli, A.; Pasceri, R.; Procopio, A.; Iannone, M. Molecular modelling and enzymatic studies of acetylcholinesterase and butyrylcholinesterase recognition with paraquat and related compounds. SAR QSAR Environ. Res. 2007, 18, 595–602. [Google Scholar] [CrossRef]
- Namba, T. Cholinesterase inhibition by organophosphorus compounds and its clinical effects. Bull. World Health Organ. 1971, 44, 289–307. [Google Scholar]
- Krejci, E.; Valenzuela, I.M.-P.Y.; Ameziane, R.; Akaaboune, M. Acetylcholinesterase dynamics at the neuromuscular junction of live animals. J. Biol. Chem. 2006, 281, 10347–10354. [Google Scholar] [CrossRef] [Green Version]
- Salama, M.; El-Morsy, D.; El-Gamal, M.; Shabka, O.; Mohamed, W.M. Mitochondrial complex I inhibition as a possible mechanism of chlorpyrifos induced neurotoxicity. Ann. Neurosci. 2014, 21, 85. [Google Scholar] [CrossRef] [PubMed] [Green Version]
- Glynn, P.; Holton, J.; Nolan, C.; Read, D.; Brown, L.; Hubbard, A.; Cavanagh, J. Neuropathy target esterase: Immunolocalization to neuronal cell bodies and axons. Neuroscience 1998, 83, 295–302. [Google Scholar] [CrossRef]
- Lotti, M.; Moretto, A. Organophosphate-Induced Delayed Polyneuropathy. Toxicol. Rev. 2005, 24, 37–49. [Google Scholar] [CrossRef]
- Richardson, R.J.; Makhaeva, G.F. Encyclopedia of Toxicology, 3rd ed.; Elsevier: Amsterdam, The Netherlands, 2014. [Google Scholar]
- Jianmongkola, S.; Berkman, C.E.; Thompson, C.M.; Richardson, R. Relative potencies of the four stereoisomers of isomalathion for inhibition of hen brain acetylcholinesterase and neurotoxic esterasein vitro. Toxicol. Appl. Pharmacol. 1996, 139, 342–348. [Google Scholar] [CrossRef]
- Richardson, R.J.; Moore, T.B.; Kayyali, U.S.; Randall, J.C. Chlorpyrifos: Assessment of Potential for Delayed Neurotoxicity by Repeated Dosing in Adult Hens with Monitoring of Brain Acetylcholinesterase, Brain and Lymphocyte Neurotoxic Esterase, and Plasma Butyrylcholinesterase Activities. Toxicol. Sci. 1993, 21, 89–96. [Google Scholar] [CrossRef]
- Tawara, T.; Fukushima, T.; Hojo, N.; Isobe, A.; Shiwaku, K.; Setogawa, T.; Yamane, Y. Effects of paraquat on mitochondrial electron transport system and catecholamine contents in rat brain. Arch. Toxicol. 1996, 70, 585–589. [Google Scholar] [CrossRef]
- Turton, N.; Heaton, R.A.; Ismail, F.; Roberts, S.; Nelder, S.; Phillips, S.; Hargreaves, I.P. The Effect of Organophosphate Exposure on Neuronal Cell Coenzyme Q10 Status. Neurochem. Res. 2020, 46, 131–139. [Google Scholar] [CrossRef] [PubMed] [Green Version]
- Ranjbar, A.; Ghahremani, M.H.; Sharifzadeh, M.; Golestani, A.; Ghazi-Khansari, M.; Baeeri, M.; Abdollahi, M. Protection by pentoxifylline of malathion-induced toxic stress and mitochondrial damage in rat brain. Hum. Exp. Toxicol. 2010, 29, 851–864. [Google Scholar] [CrossRef]
- Mehta, A.; Verma, R.S.; Srivastava, N. Chlorpyrifos-induced alterations in rat brain acetylcholinesterase, lipid peroxidation and ATPases. Indian J. Biochem. Biophys. 2005, 42, 54–58. [Google Scholar]
- Giordano, G.; Afsharinejad, Z.; Guizzetti, M.; Vitalone, A.; Kavanagh, T.J.; Costa, L.G. Organophosphorus insecticides chlorpyrifos and diazinon and oxidative stress in neuronal cells in a genetic model of glutathione deficiency. Toxicol. Appl. Pharmacol. 2007, 219, 181–189. [Google Scholar] [CrossRef] [PubMed]
- Hara, S.; Endo, T.; Kuriiwa, F.; Kano, S. Different effects of paraquat on microsomal lipid peroxidation in mouse brain, lung and liver. Pharmacol. Toxicol. 1991, 68, 260–265. [Google Scholar] [CrossRef] [PubMed]
- Ma, Q. Role of Nrf2 in Oxidative Stress and Toxicity. Annu. Rev. Pharmacol. Toxicol. 2013, 53, 401–426. [Google Scholar] [CrossRef] [PubMed] [Green Version]
- Tonelli, C.; Chio, I.I.C.; Tuveson, D.A. Transcriptional Regulation by Nrf2. Antioxid. Redox Signal. 2018, 29, 1727–1745. [Google Scholar] [CrossRef] [Green Version]
- Meek, E.C.; Carr, R.L.; Chambers, J.E. In vitro age-related differences in rats to organophosphates. Toxicol. Vitr. 2021, 72, 105102. [Google Scholar] [CrossRef]
- Tarhoni, M.H.; Vigneswara, V.; Smith, M.; Anderson, S.; Wigmore, P.; Lees, J.E.; Ray, D.E.; Carter, W.G. Detection, Quantification, and Microlocalisation of Targets of Pesticides Using Microchannel Plate Autoradiographic Imagers. Molecules 2011, 16, 8535–8551. [Google Scholar] [CrossRef] [Green Version]
- Sule, R.O.; Condon, L.; Gomes, A.V. A Common Feature of Pesticides: Oxidative Stress—The Role of Oxidative Stress in Pesticide-Induced Toxicity. Oxidative Med. Cell. Longev. 2022, 2022, 5563759. [Google Scholar] [CrossRef]


Publisher’s Note: MDPI stays neutral with regard to jurisdictional claims in published maps and institutional affiliations. |
© 2022 by the authors. Licensee MDPI, Basel, Switzerland. This article is an open access article distributed under the terms and conditions of the Creative Commons Attribution (CC BY) license (https://creativecommons.org/licenses/by/4.0/).
Share and Cite
Elmorsy, E.; Al-Ghafari, A.; Al Doghaither, H.; Salama, M.; Carter, W.G. An Investigation of the Neurotoxic Effects of Malathion, Chlorpyrifos, and Paraquat to Different Brain Regions. Brain Sci. 2022, 12, 975. https://doi.org/10.3390/brainsci12080975
Elmorsy E, Al-Ghafari A, Al Doghaither H, Salama M, Carter WG. An Investigation of the Neurotoxic Effects of Malathion, Chlorpyrifos, and Paraquat to Different Brain Regions. Brain Sciences. 2022; 12(8):975. https://doi.org/10.3390/brainsci12080975
Chicago/Turabian StyleElmorsy, Ekramy, Ayat Al-Ghafari, Huda Al Doghaither, Mohamed Salama, and Wayne G. Carter. 2022. "An Investigation of the Neurotoxic Effects of Malathion, Chlorpyrifos, and Paraquat to Different Brain Regions" Brain Sciences 12, no. 8: 975. https://doi.org/10.3390/brainsci12080975