
Predicting Post-Stroke Somatosensory Function from Resting-State Functional Connectivity: A Feasibility Study

 , , ,
, , ,
Abstract
:1. Introduction
2. Materials and Methods
2.1. Participants
2.2. Tactile Discrimination
2.3. MRI Data Acquisition
2.4. Lesion Mask Creation
2.5. Data Analysis
2.6. Construction of Functional Connectomes
2.7. Regression Predictive Modelling
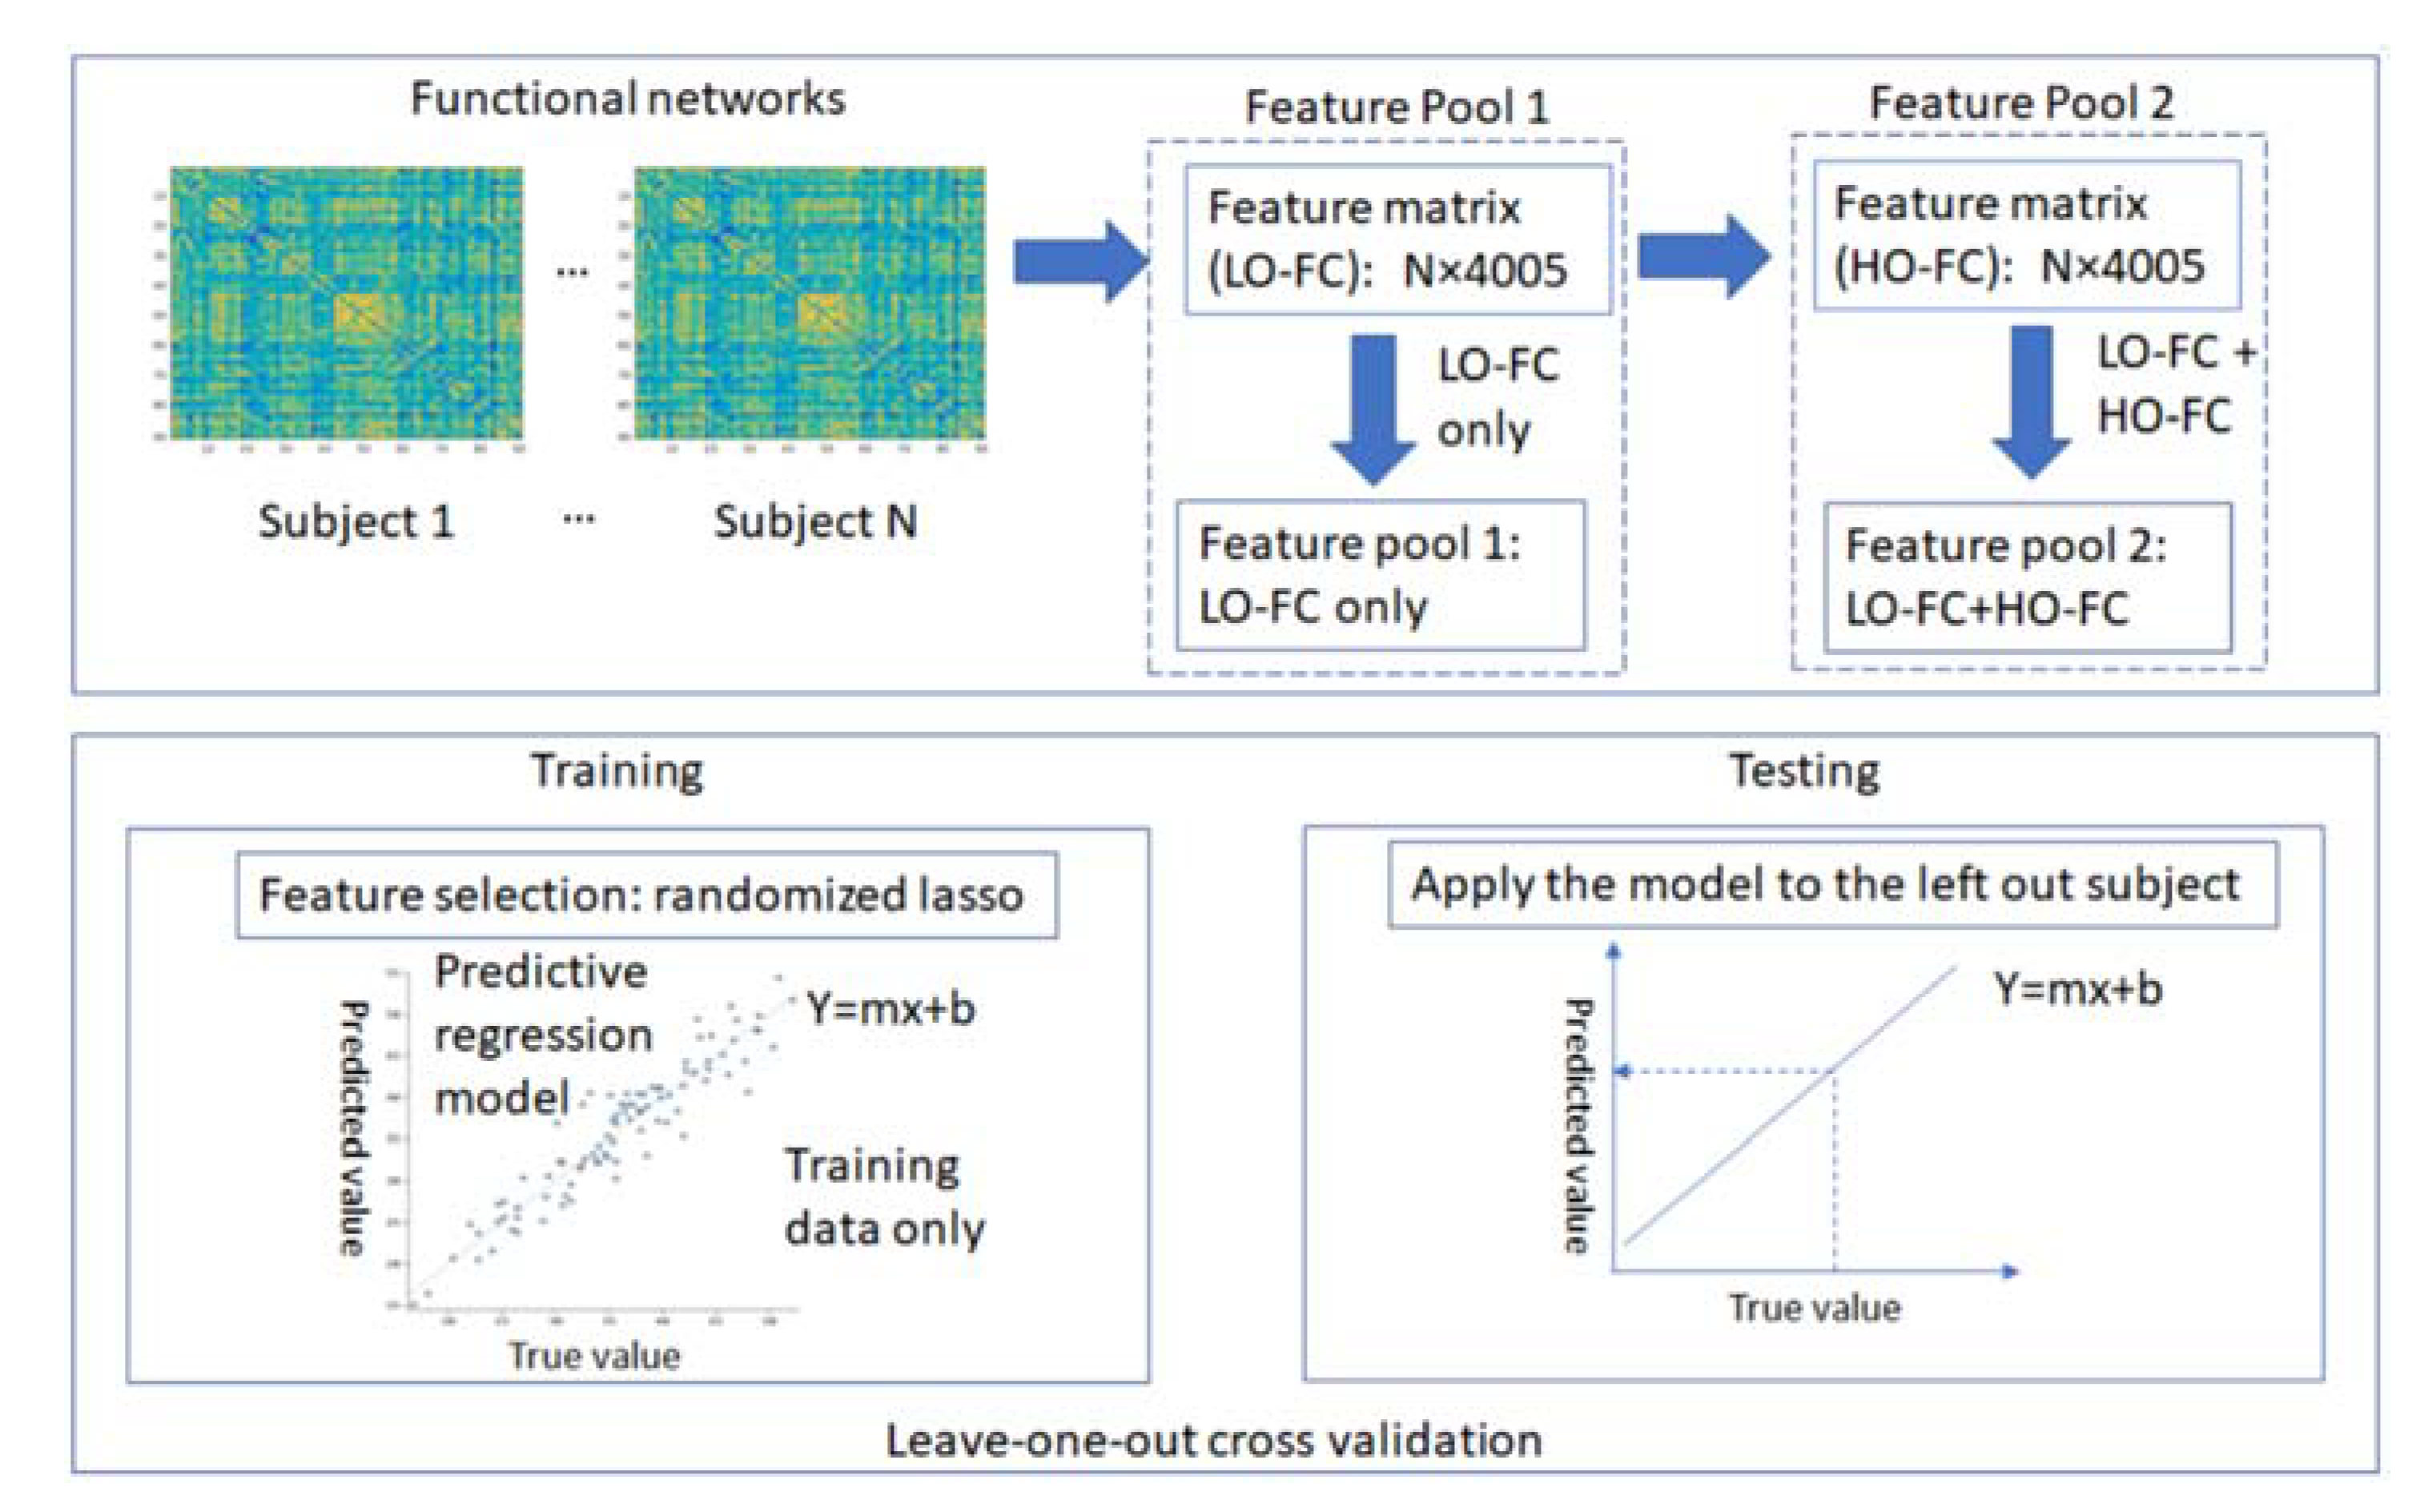
2.7.1. Feature Engineering
2.7.2. Model Validation: Leave-One-Out Cross-Validation
2.7.3. Final Model Building
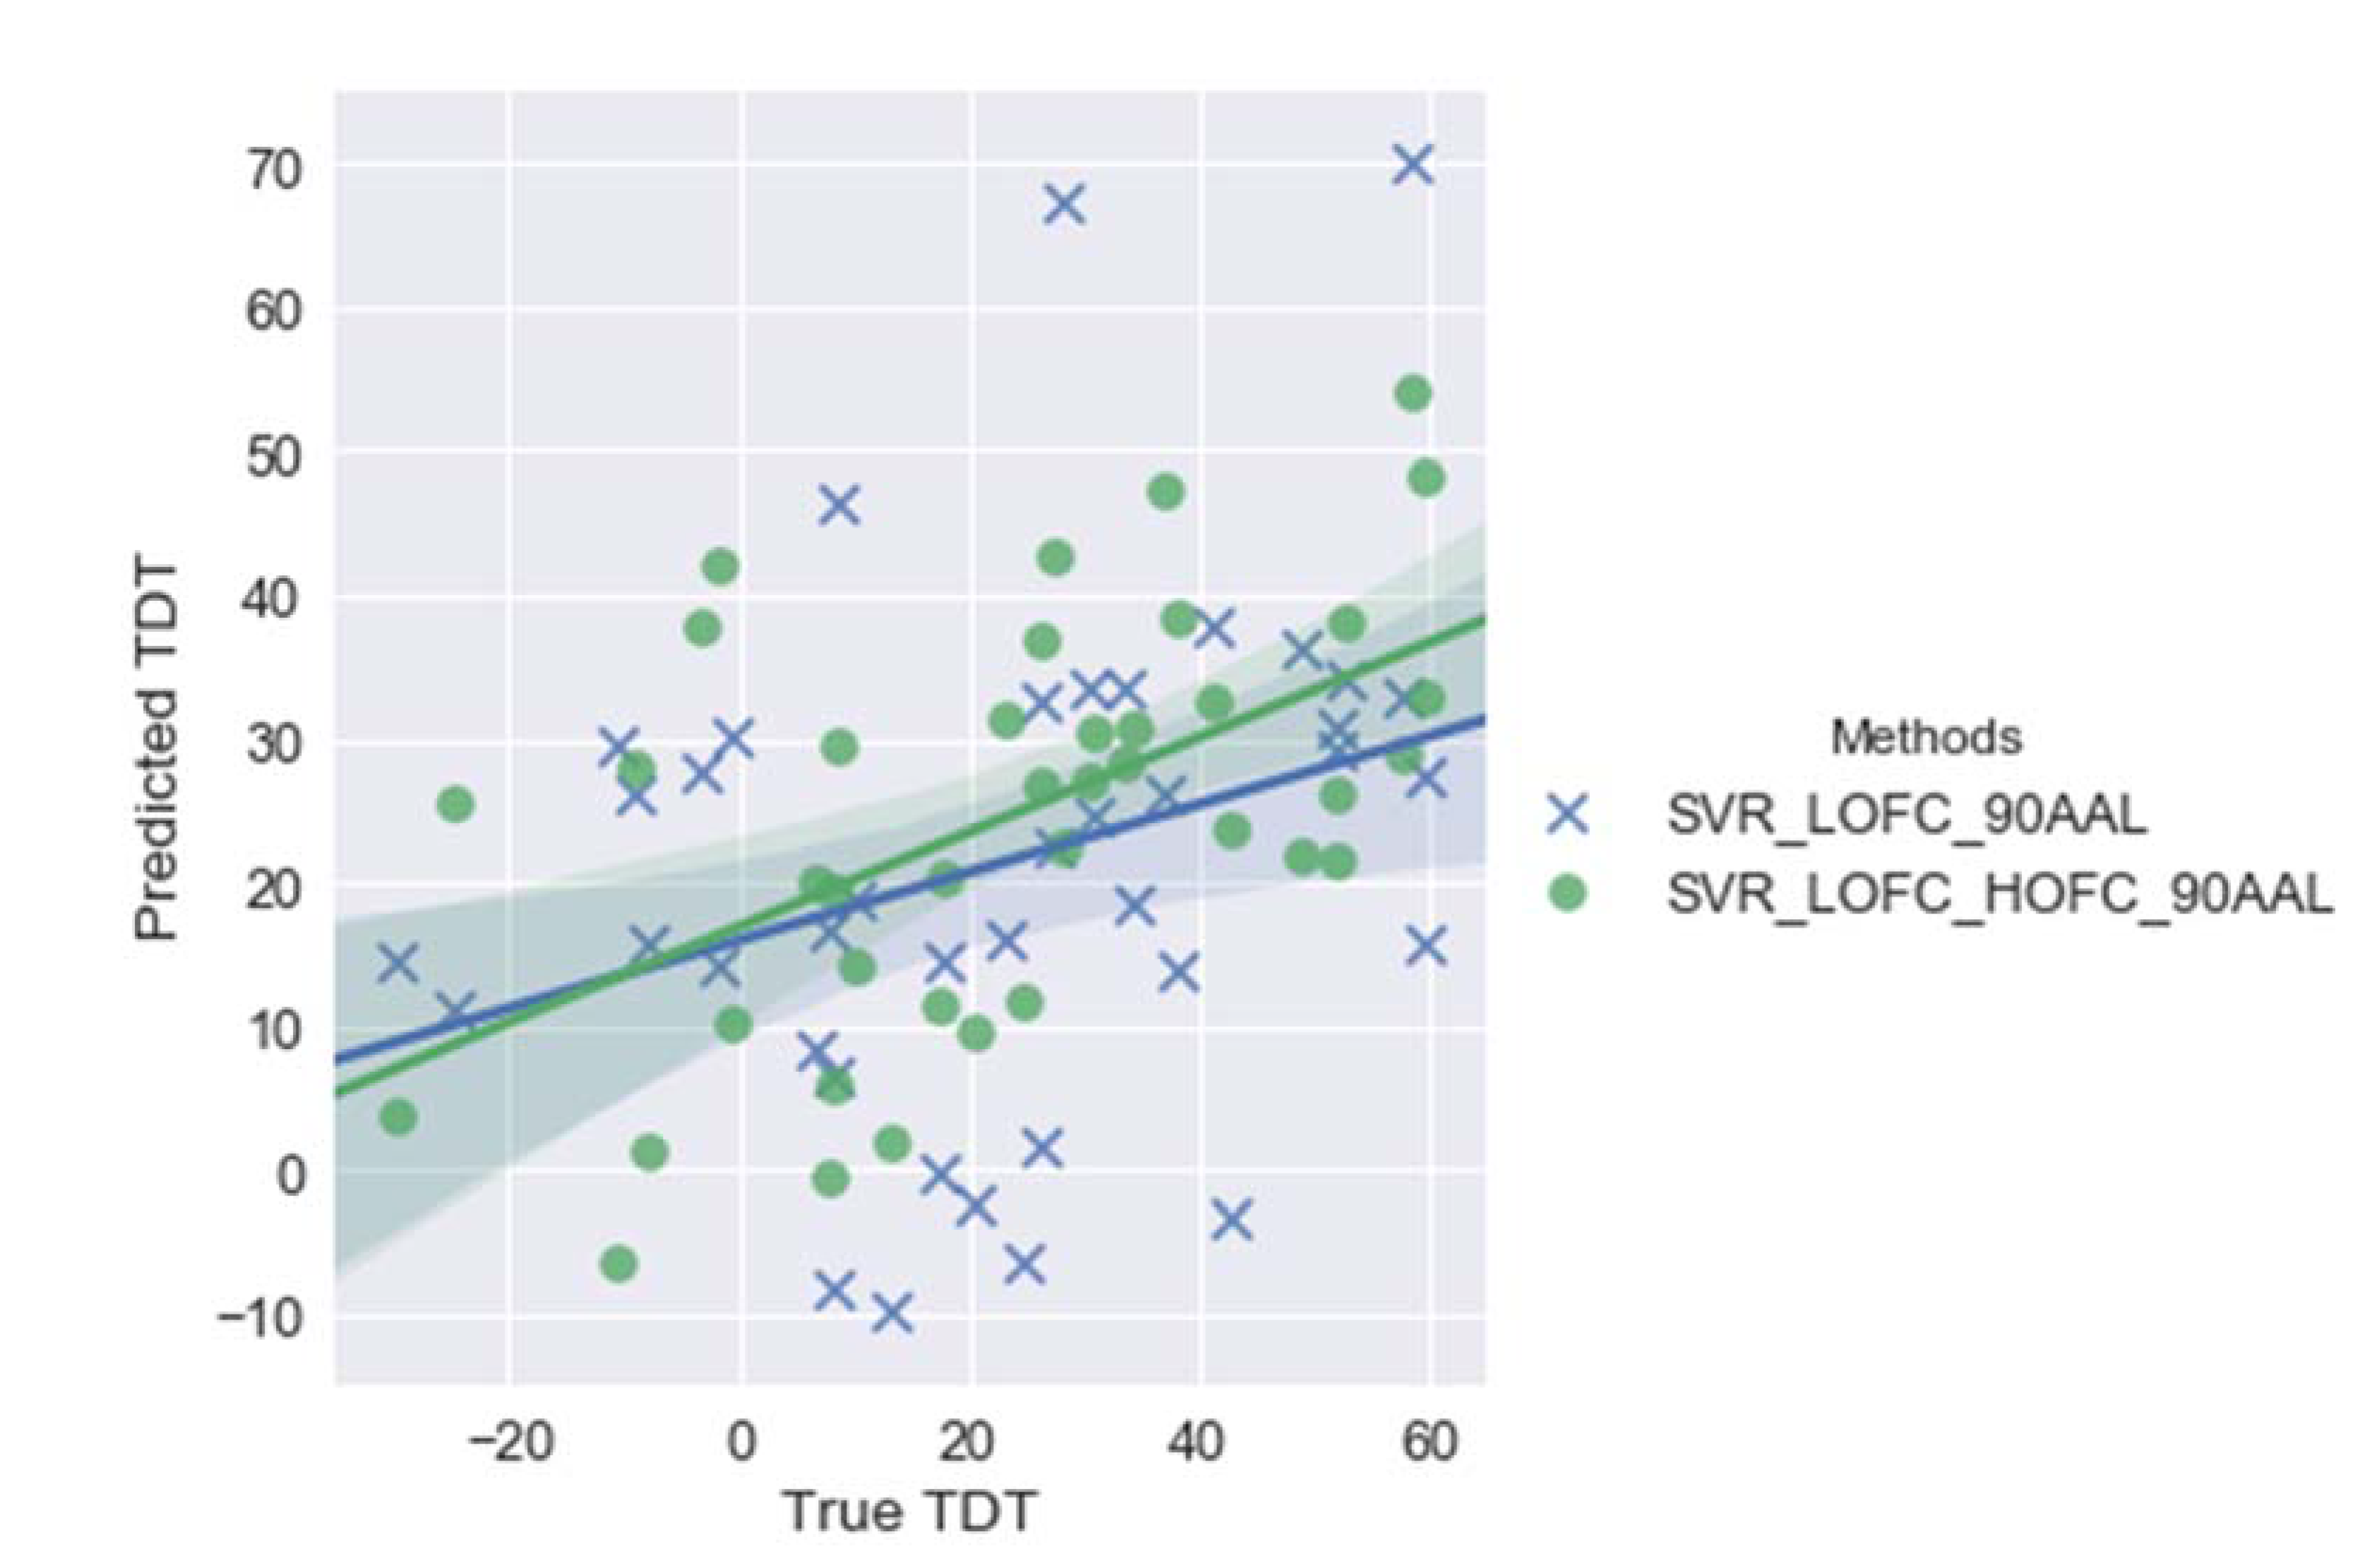
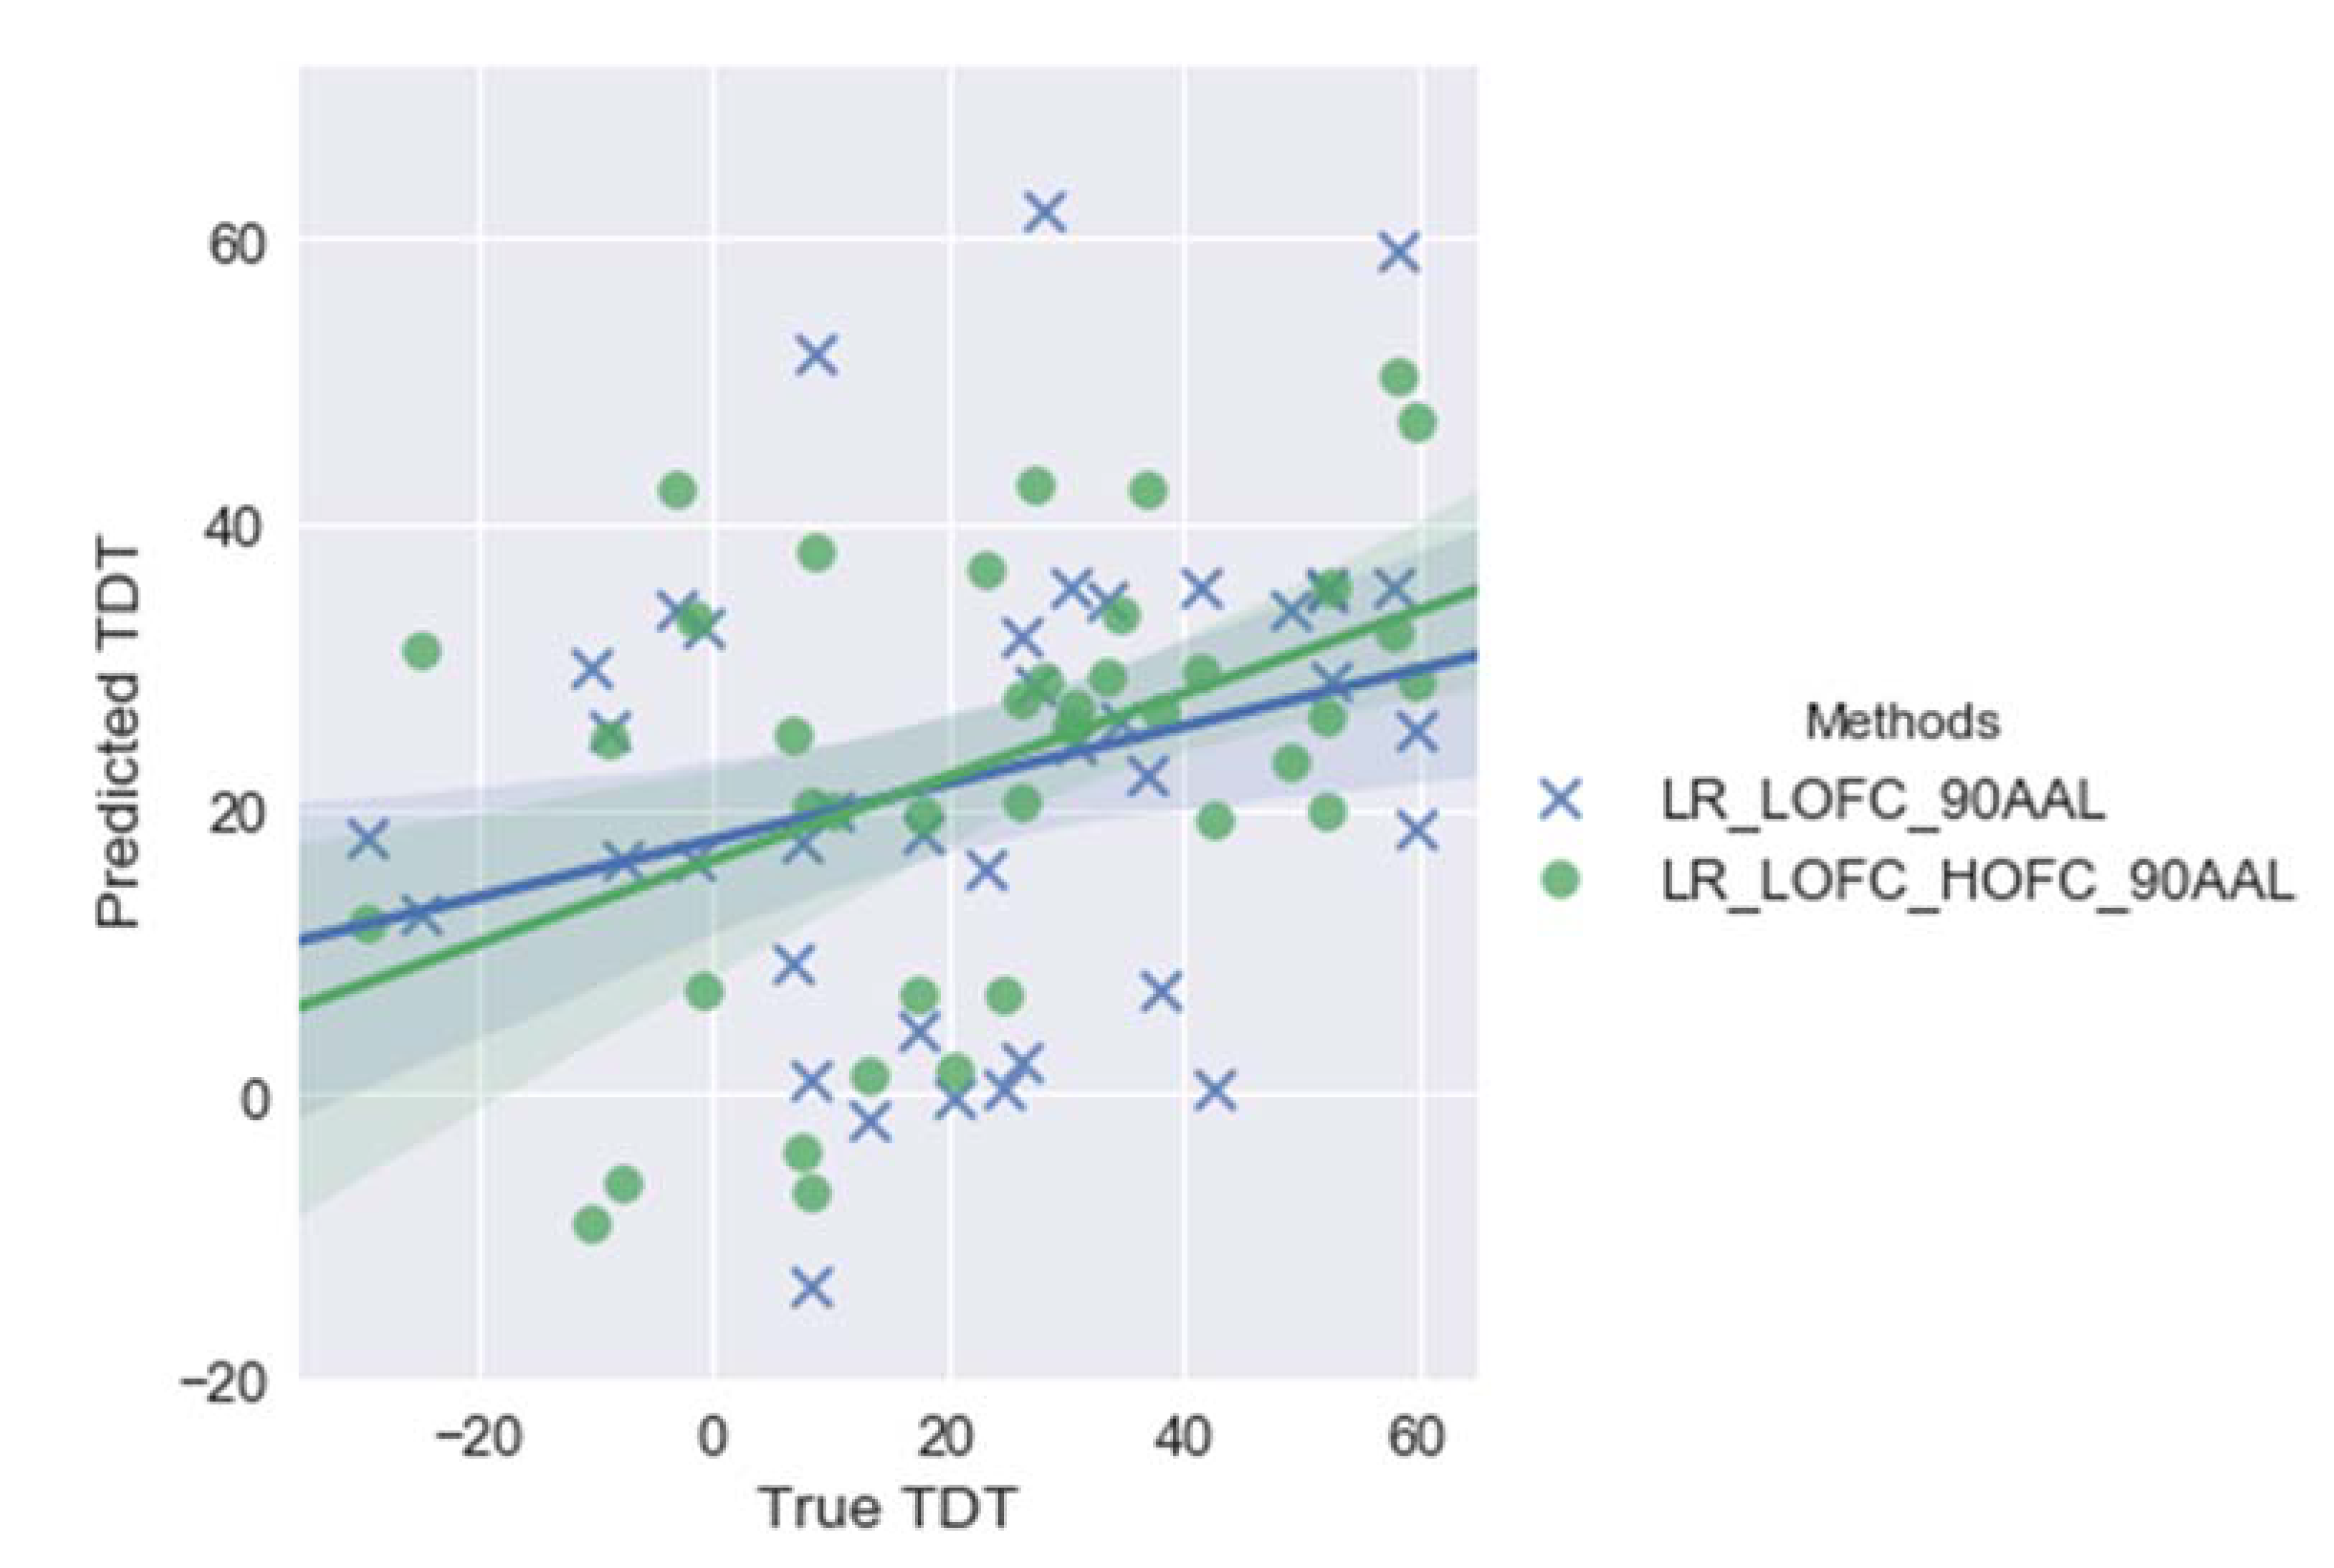
3. Results
4. Discussion
Limitations and Future Work
5. Conclusions
Author Contributions
Funding
Institutional Review Board Statement
Informed Consent Statement
Data Availability Statement
Acknowledgments
Conflicts of Interest
Appendix A
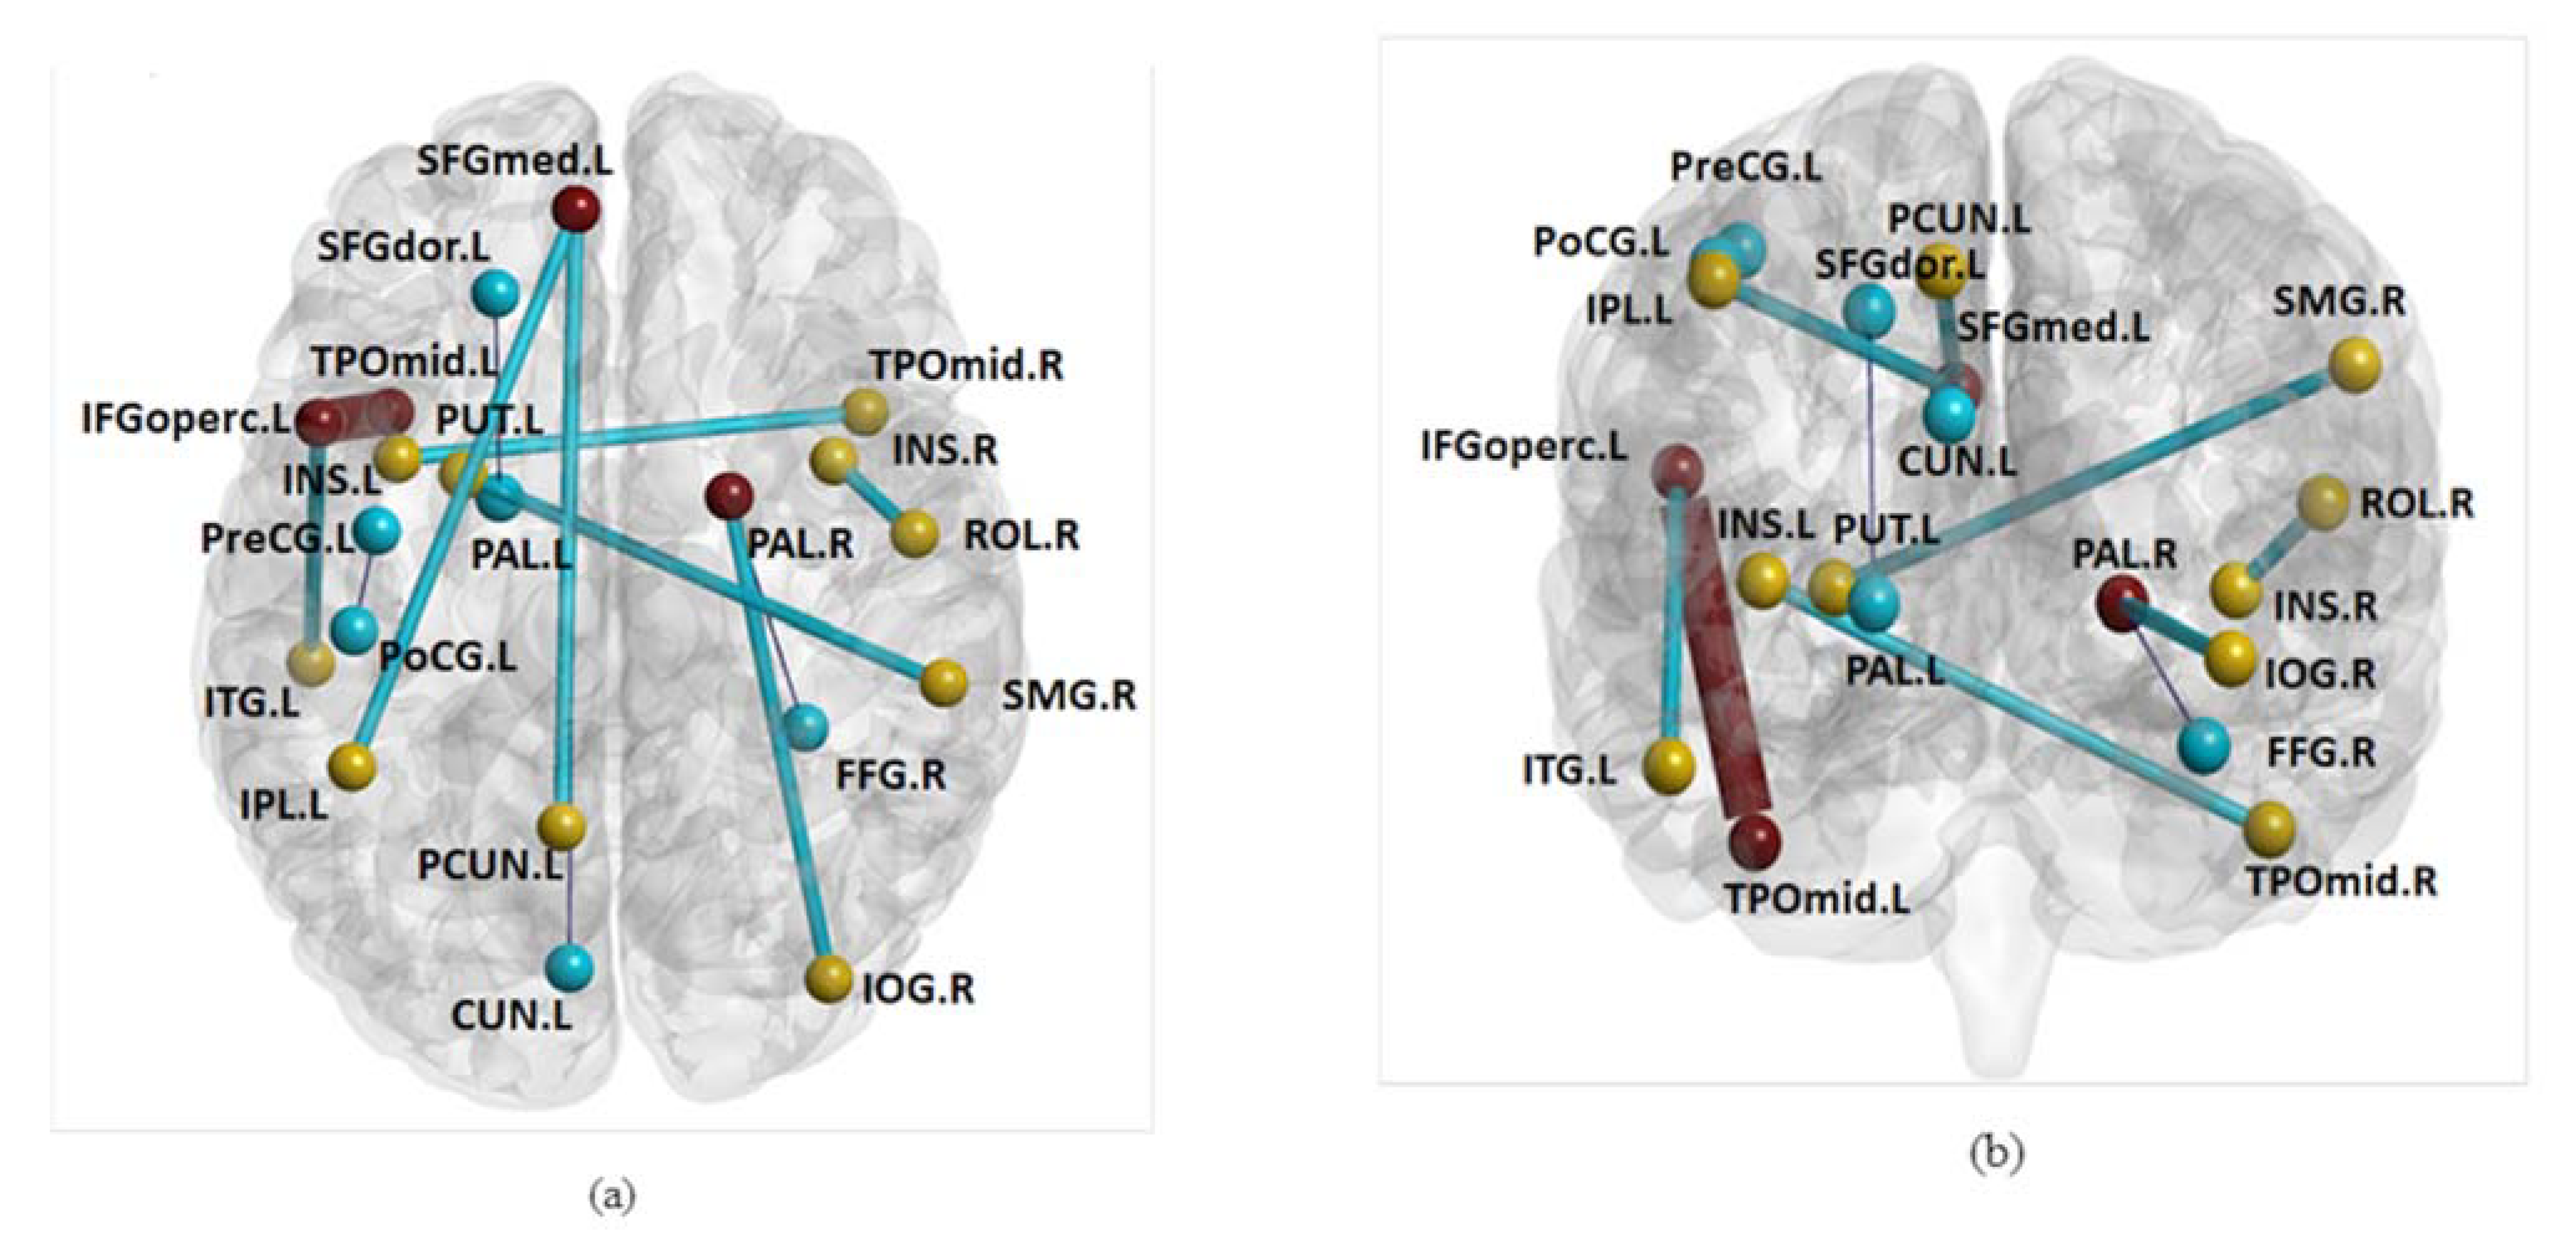
| Abbr. | Brain Region | Abbr. | Brain Region |
| CUN | Cuneus | PreCG | Precentral gyrus |
| FFG | Fusiform gyrus | PoCG | Postcentral gyrus |
| IFGoperc | Inferior frontal gyrus-opercular | PUT | Putamen |
| INS | Insula | ROL | Rolandic operculum |
| IOG | Inferior occipital gyrus | SFGdor | Superior frontal gyrus-dorsal part |
| IPL | Inferior parietal lobule | SFGmed | Superior frontal gyrus-medial part |
| ITG | Inferior temporal gyrus | SMG | SupraMarginal gyrus |
| PAL | Pallidum | TPOmid | Temporal pole-middle |
| PCUN | Precuneus |
References
- The GBD 2016 Lifetime Risk of Stroke Collaborators. Global, Regional, and Country-Specific Lifetime Risks of Stroke, 1990 and 2016. N. Engl. J. Med. 2018, 379, 2429–2437. [Google Scholar] [CrossRef] [PubMed]
- Carey, L.M. Stroke Rehabilitation: Insights from Neuroscience and Imaging; Oxford University Press: New York, NY, USA, 2012. [Google Scholar]
- Maranesi, E.; Riccardi, G.R.; Di Donna, V.; Di Rosa, M.; Fabbietti, P.; Luzi, R.; Pranno, L.; Lattanzio, F.; Bevilacqua, R. Effectiveness of intervention based on end-effector gait trainer in older patients with stroke: A systematic review. J. Am. Med. Dir. Assoc. 2020, 21, 1036–1044. [Google Scholar] [CrossRef]
- van der Vliet, R.; Selles, R.W.; Andrianopoulou, E.R.; Nijland, R.; Ribbers, G.M.; Frens, M.A.; Meskers, C.; Kwakkel, G. Predicting upper limb motor impairment recovery after stroke: A mixture model. Ann. Neurol. 2020, 87, 383–393. [Google Scholar] [CrossRef] [Green Version]
- Coupar, F.; Pollock, A.; Rowe, P.; Weir, C.; Langhorne, P. Predictors of upper limb recovery after stroke: A systematic review and meta-analysis. Clin. Rehabil. 2012, 26, 291–313. [Google Scholar] [CrossRef]
- Boyd, L.A.; Hayward, K.; Ward, N.; Stinear, C.M.; Rosso, C.; Fisher, R.; Carter, A.R.; Leff, A.; Copland, D.A.; Carey, L.M.; et al. Biomarkers of stroke recovery: Consensus-based core recommendations from the Stroke Recovery and Rehabilitation Roundtable. Int. J. Stroke 2017, 12, 480–493. [Google Scholar] [CrossRef] [PubMed]
- Carey, L.M.; Seitz, R.J.; Parsons, M.; Levi, C.; Farquharson, S.; Tournier, J.-D.; Palmer, S.; Connelly, A. Beyond the lesion: Neuroimaging foundations for post-stroke recovery. Future Neurol. 2013, 8, 507–527. [Google Scholar] [CrossRef] [Green Version]
- Koh, C.-L.; Yeh, C.-H.; Liang, X.; Vidyasagar, R.; Seitz, R.J.; Nilsson, M.; Connelly, A.; Carey, L.M. Structural connectivity remote from lesions correlates with somatosensory outcome poststroke. Stroke 2021, 52, 2910–2920. [Google Scholar] [CrossRef]
- Yeh, C.H.; Jones, D.K.; Liang, X.; Descoteaux, M.; Connelly, A. Mapping structural connectivity using diffusion MRI: Challenges and opportunities. J. Magn. Reson. Imaging 2021, 53, 1666–1682. [Google Scholar] [CrossRef] [PubMed]
- Carter, A.R.; Astafiev, S.V.; Lang, C.E.; Connor, L.T.; Rengachary, J.; Strube, M.J.; Pope, D.L.W.; Shulman, G.L.S.; Corbetta, M. Resting interhemispheric functional magnetic resonance imaging connectivity predicts performance after stroke. Ann. Neurol. 2010, 67, 365–375. [Google Scholar]
- Carter, A.R.; Shulman, G.L.; Corbetta, M. Why use a connectivity-based approach to study stroke and recovery of function? Neuroimage 2012, 62, 2271–2280. [Google Scholar] [CrossRef] [Green Version]
- Urbin, M.A.; Hong, X.; Lang, C.E.; Carter, A.R. Resting-state functional connectivity and its association with multiple domains of upper-extremity function in chronic stroke. Neurorehabil. Neural Repair 2014, 28, 761–769. [Google Scholar] [CrossRef] [Green Version]
- Goodin, P.; Lamp, G.; Vidyasagar, R.; McArdle, D.; Seitz, R.J.; Carey, L.M. Altered functional connectivity differs in stroke survivors with impaired touch sensation following left and right hemisphere lesions. Neuroimage-Clin. 2018, 18, 342–355. [Google Scholar] [CrossRef]
- Lee, M.H.; Smyser, C.D.; Shimony, J.S. Resting-state fMRI: A review of methods and clinical applications. AJNR Am. J. Neuroradiol. 2013, 34, 1866–1872. [Google Scholar] [CrossRef] [Green Version]
- Liang, X.; Connelly, A.; Calamante, F. Graph analysis of resting-state ASL perfusion MRI data: Nonlinear correlations among CBF and network metrics. Neuroimage 2014, 87, 265–275. [Google Scholar] [CrossRef] [PubMed]
- Liang, X.; Connelly, A.; Calamante, F. Voxel-wise functional connectomics using arterial spin labeling functional magnetic resonance imaging: The role of denoising. Brain Connect. 2015, 5, 543–553. [Google Scholar] [CrossRef]
- Lamp, G.; Goodin, P.; Palmer, S.; Low, E.; Barutchu, A.; Carey, L.M. Activation of bilateral secondary somatosensory cortex with right hand touch stimulation: A meta-analysis of functional neuroimaging studies. Front. Neurol. 2018, 9, 1129. [Google Scholar] [CrossRef]
- Siegel, J.S.; Ramsey, L.; Snyder, A.Z.; Metcalf, N.V.; Chacko, R.V.; Weinberger, K.; Baldassarre, A.; Hacker, C.D.; Shulman, G.L.; Corbetta, M. Disruptions of network connectivity predict impairment in multiple behavioral domains after stroke. Proc. Natl. Acad. Sci. USA 2016, 113, E4367–E4376. [Google Scholar] [CrossRef] [Green Version]
- Carey, L.M.; Oke, L.E.; Matyas, T.A. Impaired touch discrimination after stroke: A quantitative test. J. Neurol. Rehabil. 1997, 11, 219–232. [Google Scholar] [CrossRef] [Green Version]
- Carey, L.M.; Abbott, D.F.; Harvey, M.R.; Puce, A.; Seitz, R.J.; Donnan, G.A. Relationship between touch impairment and brain activation after lesions of subcortical and cortical somatosensory regions. Neurorehabil. Neural Repair 2011, 25, 443–457. [Google Scholar] [CrossRef] [PubMed]
- Carey, L.M.; Abbott, D.F.; Egan, G.F.; Donnan, G.A. Reproducible activation in BA2, 1 and 3b associated with texture discrimination in healthy volunteers over time. Neuroimage 2008, 39, 40–51. [Google Scholar] [CrossRef] [PubMed]
- Bannister, L.C.; Crewther, S.G.; Gavrilescu, M.; Carey, L.M. Improvement in touch sensation after stroke is associated with resting functional connectivity changes. Front. Neurol. 2015, 6, 165. [Google Scholar] [CrossRef] [Green Version]
- Zhang, H.; Chen, X.; Shi, F.; Li, G.; Kim, M.; Giannakopoulos, P.; Haller, S.; Shen, D. Topographical information-based high-order functional connectivity and its application in abnormality detection for mild cognitive impairment. J. Alzheimer’s Dis. 2016, 54, 1095–1112. [Google Scholar] [CrossRef] [PubMed] [Green Version]
- Zhang, Y.; Zhang, H.; Chen, X.; Lee, S.W.; Shen, D. Hybrid high-order functional connectivity networks using resting-state functional MRI for mild cognitive impairment diagnosis. Sci. Rep. 2017, 7, 6530. [Google Scholar] [CrossRef] [PubMed] [Green Version]
- Zhou, Y.; Qiao, L.; Li, W.; Zhang, L.; Shen, D. Simultaneous estimation of low- and high-order functional connectivity for identifying mild cognitive impairment. Front. Neuroinform. 2018, 12, 3. [Google Scholar] [CrossRef] [Green Version]
- Misic, B.; Sporns, O. From regions to connections and networks: New bridges between brain and behavior. Curr. Opin. Neurobiol. 2016, 40, 1–7. [Google Scholar] [CrossRef] [Green Version]
- Mazoyera, N.; Landeau, B.; Papathanassiou, D.; Crivello, F.; Etard, O.; Delcroix, N.; Tzourio-Mazoyer, N.; Joliot, M. Automated anatomical labeling of activations in SPM using a macroscopic anatomical parcellation of the MNI MRI single-subject brain. Neuroimage 2002, 15, 273–289. [Google Scholar] [CrossRef]
- Marek, S.; Siegel, J.S.; Gordon, E.M.; Raut, R.; Gratton, C.; Newbold, D.J.; Ortega, M.; Laumann, T.O.; Adeyemo, B.; Miller, D.B.; et al. Spatial and temporal organization of the individual human cerebellum. Neuron 2018, 100, 977–993.e7. [Google Scholar] [CrossRef] [Green Version]
- Tibshirani, R. Regression shrinkage and selection via the lasso. J. R. Stat. Soc. B Methodol. 1996, 58, 267–288. [Google Scholar] [CrossRef]
- Liang, X.; Connelly, A.; Calamante, F. A novel joint sparse partial correlation method for estimating group functional networks. Hum. Brain Mapp. 2016, 37, 1162–1177. [Google Scholar] [CrossRef]
- Liang, X.; Vaughan, D.N.; Connelly, A.; Calamante, F. A novel group-fused sparse partial correlation method for simultaneous estimation of functional networks in group comparison studies. Brain Topogr. 2018, 31, 364–379. [Google Scholar] [CrossRef] [PubMed]
- Fregnac, Y.; Bathellier, B. Cortical correlates of low-level perception: From neural circuits to percepts. Neuron 2015, 88, 110–126. [Google Scholar] [CrossRef] [PubMed] [Green Version]
- Regenbogen, C.; Seubert, J.; Johansson, E.; Finkelmeyer, A.; Andersson, P.; Lundstrom, J.N. The intraparietal sulcus governs multisensory integration of audiovisual information based on task difficulty. Hum. Brain Mapp. 2018, 39, 1313–1326. [Google Scholar] [CrossRef] [PubMed] [Green Version]
- Liberati, G.; Klöcker, A.; Safronova, M.M.; Santos, S.F.; Vaz, J.G.R.; Raftopoulos, C.; Mouraux, A. Nociceptive local field potentials recorded from the human insula are not specific for nociception. PLoS Biol. 2016, 14, e1002345. [Google Scholar] [CrossRef] [PubMed]
- Talsma, D. Predictive coding and multisensory integration: An attentional account of the multisensory mind. Front. Integr. Neurosci. 2015, 9, 19. [Google Scholar] [CrossRef] [Green Version]
- du Boisgueheneuc, F.; Levy, R.; Volle, E.; Seassau, M.; Duffau, H.; Kinkingnehun, S.; Samson, Y.; Zhang, S.; Dubois, B. Functions of the left superior frontal gyrus in humans: A lesion study. Brain 2006, 129 Pt 12, 3315–3328. [Google Scholar] [CrossRef] [Green Version]
- Bekrater-Bodmann, R.; Foell, J.; Diers, M.; Kamping, S.; Rance, M.; Kirsch, P.; Trojan, J.; Fuchs, X.; Bach, F.; Cakmak, H.K.; et al. The importance of synchrony and temporal order of visual and tactile input for illusory limb ownership experiences—An FMRI study applying virtual reality. PLoS ONE 2014, 9, e87013. [Google Scholar] [CrossRef]
- Parise, M.; Kubo, T.T.; Doring, T.M.; Tukamoto, G.; Vincent, M.; Gasparetto, E.L. Cuneus and fusiform cortices thickness is reduced in trigeminal neuralgia. J. Headache Pain 2014, 15, 17. [Google Scholar] [CrossRef] [PubMed] [Green Version]
- Williams, J.T.; Darcy, I.; Newman, S.D. Bimodal bilingualism as multisensory training?: Evidence for improved audiovisual speech perception after sign language exposure. Brain Res. 2016, 1633, 101–110. [Google Scholar] [CrossRef] [Green Version]
- Kheradmand, A.; Lasker, A.; Zee, D.S. Transcranial magnetic stimulation (TMS) of the supramarginal gyrus: A window to perception of upright. Cereb. Cortex 2015, 25, 765–771. [Google Scholar] [CrossRef] [Green Version]
- Sato, W.; Kubota, Y.; Kochiyama, T.; Uono, S.; Yoshimura, S.; Sawada, R.; Sakihama, M.; Toichi, M. Increased putamen volume in adults with autism spectrum disorder. Front. Hum. Neurosci. 2014, 8, 957. [Google Scholar] [CrossRef] [Green Version]
- Smith, K.S.; Tindell, A.J.; Aldridge, J.W.; Berridge, K.C. Ventral pallidum roles in reward and motivation. Behav. Brain Res. 2009, 196, 155–167. [Google Scholar] [CrossRef] [Green Version]
- Kiefer, M.; Pulvermuller, F. Conceptual representations in mind and brain: Theoretical developments, current evidence and future directions. Cortex 2012, 48, 805–825. [Google Scholar] [CrossRef]
- Mur, M.C. High-Level Visual Object Representations in Inferior Temporal Cortex. Ph.D. Thesis, University Maastricht, Maastricht, The Netherlands, 2011. [Google Scholar]
- Derntl, A.; Plant, C. Clustering techniques for neuroimaging applications. Wires Data Min. Knowl. 2016, 6, 22–36. [Google Scholar] [CrossRef]
- Wodeyar, A.; Cassidy, J.M.; Cramer, S.C.; Srinivasan, R. Damage to the structural connectome reflected in resting-state fMRI functional connectivity. Netw. Neurosci. 2020, 4, 1197–1218. [Google Scholar] [CrossRef] [PubMed]
- Calamante, F.; Smith, R.E.; Liang, X.; Zalesky, A.; Connelly, A. Track-weighted dynamic functional connectivity (TW-dFC): A new method to study time-resolved functional connectivity. Brain Struct. Funct. 2017, 222, 3761–3774. [Google Scholar] [CrossRef] [PubMed]


| Stroke (n = 40) | |
|---|---|
| Sex, F/M | 11/29 |
| Mean age, years (SD) | 51.8 (13.2) |
| Stroke type, I/H | 32/8 |
| Stroke chronicity, mean months (SD) | 18.6 (22.1) |
| Side of lesion, L/R | 20/20 |
| Lesion location, C/S/M | 19/12/9 |
| Lesion size (c.c.) [Q1, Q3] | [12.5, 70.1] |
| TDT contralesional affected hand, mean (SD) * | 22.6 (23.2) |
| TDT ipsilesional hand, mean (SD) | 65.9 (18.6) |
| Number of Brain Regions | Features | Regression Method | Correlation Coefficient (r) | p Value |
|---|---|---|---|---|
| 90 | LOFC | LR | 0.28 | 0.038 |
| SVR | 0.31 | 0.024 | ||
| LOFC + HOFC | LR | 0.45 | 0.002 | |
| SVR | 0.54 | 0.0002 |
Publisher’s Note: MDPI stays neutral with regard to jurisdictional claims in published maps and institutional affiliations. |
© 2021 by the authors. Licensee MDPI, Basel, Switzerland. This article is an open access article distributed under the terms and conditions of the Creative Commons Attribution (CC BY) license (https://creativecommons.org/licenses/by/4.0/).
Share and Cite
Liang, X.; Koh, C.-L.; Yeh, C.-H.; Goodin, P.; Lamp, G.; Connelly, A.; Carey, L.M. Predicting Post-Stroke Somatosensory Function from Resting-State Functional Connectivity: A Feasibility Study. Brain Sci. 2021, 11, 1388. https://doi.org/10.3390/brainsci11111388
Liang X, Koh C-L, Yeh C-H, Goodin P, Lamp G, Connelly A, Carey LM. Predicting Post-Stroke Somatosensory Function from Resting-State Functional Connectivity: A Feasibility Study. Brain Sciences. 2021; 11(11):1388. https://doi.org/10.3390/brainsci11111388
Chicago/Turabian StyleLiang, Xiaoyun, Chia-Lin Koh, Chun-Hung Yeh, Peter Goodin, Gemma Lamp, Alan Connelly, and Leeanne M. Carey. 2021. "Predicting Post-Stroke Somatosensory Function from Resting-State Functional Connectivity: A Feasibility Study" Brain Sciences 11, no. 11: 1388. https://doi.org/10.3390/brainsci11111388