
Resting-State Functional Connectivity in Mathematical Expertise


1
Department of Electronics and Information Engineering, Korea University, Sejong 30019, Korea
2
Interdisciplinary Graduate Program for Artificial Intelligence Smart Convergence Technology, Korea University, Sejong 30019, Korea
3
Research Institute for Cognition and Robotics (CoR-Lab), Machine Learning Group Bielefeld University, 33615 Bielefeld, Germany
4
Department of Brain and Cognitive Sciences, Daegu Gyeongbuk Institute of Science and Technology (DGIST), Daegu 42988, Korea
5
Partner Group of the Max Planck Institute for Human Cognitive and Brain Sciences at the Department for Brain and Cognitive Sciences, DGIST, Daegu 42988, Korea
*
Author to whom correspondence should be addressed.
†
These two authors contributed equally.
Brain Sci. 2021, 11(4), 430; https://doi.org/10.3390/brainsci11040430
Submission received: 11 March 2021
/
Revised: 25 March 2021
/
Accepted: 26 March 2021
/
Published: 28 March 2021
(This article belongs to the Special Issue Neurofunctional and Neurochemical Signatures of Emotional and Cognitive Processes and Competencies)
Abstract
:To what extent are different levels of expertise reflected in the functional connectivity of the brain? We addressed this question by using resting-state functional magnetic resonance imaging (fMRI) in mathematicians versus non-mathematicians. To this end, we investigated how the two groups of participants differ in the correlation of their spontaneous blood oxygen level-dependent fluctuations across the whole brain regions during resting state. Moreover, by using the classification algorithm in machine learning, we investigated whether the resting-state fMRI networks between mathematicians and non-mathematicians were distinguished depending on features of functional connectivity. We showed diverging involvement of the frontal–thalamic–temporal connections for mathematicians and the medial–frontal areas to precuneus and the lateral orbital gyrus to thalamus connections for non-mathematicians. Moreover, mathematicians who had higher scores in mathematical knowledge showed a weaker connection strength between the left and right caudate nucleus, demonstrating the connections’ characteristics related to mathematical expertise. Separate functional networks between the two groups were validated with a maximum classification accuracy of 91.19% using the distinct resting-state fMRI-based functional connectivity features. We suggest the advantageous role of preconfigured resting-state functional connectivity, as well as the neural efficiency for experts’ successful performance.
1. Introduction
Recently, the differences between professional mathematicians and non-mathematicians have been investigated with respect to functional specificity and structural connectivity with functional magnetic resonance imaging (fMRI) and diffusion MRI [1,2]. Mathematicians’ high level of expertise in mathematics yielded a focal activation in the dorsolateral prefrontal cortex, whereas non-mathematicians recruited a broadly distributed brain network, including the left inferior frontal gyrus, frontal sulcus, intraparietal sulcus, and right inferior parietal lobule. Different levels of expertise were also reflected in the psychophysiological interaction, showing divergent connectivity among the precentral gyrus–putamen–caudate nucleus and the superior parietal lobule–precentral gyrus between the two groups. With respect to the architecture of white matter tracts, dorsal and cortico-thalamic structures were modulated by the level of mathematical expertise. The structural integrity of the arcuate fasciculus and superior longitudinal fasciculus was higher in mathematicians, whereas stronger cortico-thalamic connectivity was observed in non-mathematicians. These previous studies demonstrated expertise-dependent modulation on the functional specificity and anatomical connectivity using task-related fMRI and diffusion MRI, respectively.
Experts’ functional connectivity in large-scale brain networks, associated with high-level mathematical skill, is still called into question. Considering the pivotal roles of mathematical ability in learning and education [3], as well as in the prediction of academic achievement of children [4], a thorough investigation on the brain connectivity in association with mathematical expertise should not go unheeded. However, previous neuroimaging studies showed varying results because of their different task demands or diverse study designs, and this makes it difficult to compare those findings across studies. To avoid this problem, in the present study, we used resting-state fMRI, in which no specific tasks are needed.
Resting-state fMRI is known to play a pivotal role in understanding the functional connectivity of brain regions. It detects low-frequency blood oxygenation level-dependent (BOLD) signal fluctuations during rest, demonstrating connectivity between anatomically distinct but functionally related regions [5,6,7,8]. These spontaneous BOLD activities unveil intrinsic functional architectures such as visual networks, auditory networks, sensorimotor networks, default mode networks (DMNs), basal ganglia networks, language networks, executive control networks, and dorsal/ventral attention networks [7,9,10,11,12,13,14,15,16,17,18,19,20,21,22,23,24,25]. Interestingly, these intrinsic connectivity networks have been constantly observed within and across people [26].
Regions that activate together during specific functional tasks are known to be correlated among themselves during resting state as well, maintaining their traits of functional specificity. Many studies have suggested that spontaneous BOLD activities in resting state provide useful information on the human brain that is organized into multiple distinct yet inherently interactive regions that have specific functions [27]. Using this approach, researchers have elucidated how functional connectivity in resting state is related to large-scale brain networks that are allocated to specific cognitive functions [28]. Moreover, resting-state fMRI has been used to demonstrate group-specific features such as early adolescents’ network maturation [29], highly intelligent individuals’ functional connectivity and global efficiency [30,31], and individuals with better set-shifting functions showing positive resting-state connectivity between frontoparietal and visual networks [32]. Therefore, using resting-state fMRI enables us to understand the linked functions of anatomically separate areas through the correlation of resting BOLD activities with individual differences.
It should be noted that various factors such as types of methods (parametric or non-parametric), types of variables (discrete or continuous), or the sample size yield varying statistical results, even with identical fMRI data [33,34,35]. Therefore, the significance of the result, as well as its interpretation and generalizability to the population at large, should be examined carefully. With respect to this issue, previous studies suggested to use another type of analysis, that is, the machine learning approach, which can provide supporting information for the data interpretation and generalizability of fMRI-based results by classifying and predicting significant neuroimaging features [36,37,38]. For example, the difference between musical experts and non-experts was investigated using the machine learning approach, and the results showed a classification accuracy of 77%, implying that the significant features from fMRI data not only provide psychophysiological interpretation, but also grasp functional or structural differences between groups [38].
In the present study, we investigated how mathematicians and non-mathematicians differ in the correlation of their spontaneous BOLD fluctuations across brain regions during resting state, with the aim of delineating the functional network structures modulated by varying levels of mathematical expertise. To this end, we recruited two groups of participants, that is, mathematicians with a high-level of mathematical expertise and non-mathematicians as a control group, and we performed a group comparison using resting-state fMRI data. Most of the previous studies postulated specific regions of interests (ROIs), examined with which areas or networks the ROIs are correlated, and interpreted the results with respect to cognitive processes in which the ROIs are known to be involved. Therefore, interpreting these results is usually dependent on the functions of the predetermined ROIs. However, in the present study, we explored the resting-state functional connectivity in the whole brain network instead of selective ROIs, and thus we did not limit our investigation to subjectively selected areas. We hypothesized that the functional connectivity of mathematicians and non-mathematicians would be characterized by a set of brain regions reflecting the different levels of expertise in each group. In particular, mathematicians’ resting-state fMRI networks would be similar to task-based fMRI networks, which pertains to experts’ preconfigured connectivity and a neural efficiency. Finally, we expected that the functional networks would identify the mathematicians and non-mathematicians by the classification performances based on machine learning algorithms, which provides a vital piece of information about the different functional connectivity between the groups.
2. Materials and Methods
2.1. Participants
We analyzed the resting-state fMRI data of the participants, which were collected from a previous study in 2017 [1]. Two groups of participants were recruited—mathematicians and non-mathematicians, depending on their levels of expertise in mathematics. Participants in the mathematician group were first chosen on the basis of their occupations (i.e., mathematicians or mathematics teachers) from a pool of 53 adults and screened for mathematical competence via a standardized mathematics test (Mathematik-Test: Grundkenntnisse für Ausbildung und Beruf) [39]. Participants in the non-mathematician group were first recruited from a pool of 34 adults whose occupations were not related to the use of professional mathematics. They were also screened via the mathematics test, such that we could eliminate people whose level of mathematical expertise was similar to mathematicians’ level. In addition, we measured all of the participants’ general intelligence and verbal working memory using the Berlin Intelligence Structure Test [40] and the German version of the Wechsler subtest [41], respectively. Details are provided in Table 1, demonstrating that the two groups showed a significant difference only in the mathematical test. All of these behavioral data were obtained on separate days consecutively (Day 1 for the mathematics test, Day 2 for the general intelligence and verbal working memory tests, and Day 3 for resting-state fMRI scanning), such that we were able to minimize the participants’ fatigue and remove possible unwanted influence of the behavioral tests on resting-state fMRI data. All of the participants gave written, informed consent to participate in the study. The Research Ethics Committee of the University of Leipzig (approval number 953) approved the study in accordance with the Declaration of Helsinki.
2.2. Resting-State fMRI Acquisition
Resting-state fMRI data were acquired on a human whole-body 3 Tesla Siemens TIM TRIO (Siemens Healthcare, Erlangen, Germany) with a 32-channel head coil. 3D T1-weighted structural images were previously obtained (MP-RAGE sequence, non-selective inversion pulse, inversion time (TI) = 650 ms, repetition time (TR) = 1.3 s, time to echo (TE) = 3.93 ms, flip angle = 10°, bandwidth = 67 kHz/px, matrix = 256 × 240 m2, 128 sagittal slices, spatial resolution = 1 × 1 × 1.5 m3, two acquisitions). A T2*-weighted gradient-echo echo-planar imaging (EPI) sequence was used (TR = 2000 ms, TE = 30 ms, flip angle = 90°, field of view (FOV) = 64 × 64 m2, 30 slices, resolution: 3 × 3 × 4 m3, interslice gap = 0.8 mm, 420 volumes). The scanning time was 14 min, and participants were required to watch a fixation lying still in the scanner.
2.3. Resting-State fMRI Data Analysis
Resting-state fMRI data were preprocessed using FSL v5.0, Matlab R2017b and AFNI Version 17.2.17 (https://afni.nimh.nih.gov/ 27/03/2021). After removal of the first four volumes of each scan, the data were slice time-corrected. Head motion was quantified by frame-wise displacement (the sum of rotational and translational rigid body realignment parameters from one volume to the next) [42]. We first evaluated the number of volumes with a frame-wise displacement >0.5 mm for each participant individually. Then, the dataset that required the most elimination served as a standard for determining the number of volumes to be discarded for all the participants’ datasets, resulting in removing 37 volumes. Therefore, each participant had 379 volumes. Through this way, we were able to keep the amount of information added by each person identical, avoiding potential confounding effects from different degree of movement.
Subsequently, the individual T1-weighted magnetization-prepared rapid gradient-echo (MP-RAGE) images were used to generate partial volume maps for grey matter (GM), white matter (WM), and cerebrospinal fluid (CSF). To this end, the T1 data images were skull-stripped, aligned to Montreal Neurological Institute (MNI) standard space, and segmented using FSL’s fast [43]. Next, WM and CSF segmentations were thresholded at 80% tissue probability, and affinely aligned to individual space. To control for motion, as well as scanner-related and physiological noise, five principal components from WM and CSF were extracted from the functional data and regressed out together with the six linearly detrended motion parameters previously determined [44]. Finally, residual data were bandpass-filtered at 0.01–0.1 Hz, spatially smoothed with a 6 mm FWHM kernel, and affinely aligned to a T1-weighted MRI template derived from a normative adult population [45], as provided in SPM12 (Wellcome Imaging Department, University College, London, U.K., http://www.fil.ion.ucl.ac.uk/spm/).
Next, the resting-state fMRI time series samples were extracted using SPM12 (SPM12, http://www.fil.ion.ucl.ac.uk/spm/, Wellcome Trust Centre for Neuroimaging, London, U.K.) [46]. GM was segmented into 112 ROIs based on the Anatomical Automated Labeling (AAL) atlas [47] implemented in SPM12. The representative BOLD signals of each ROI were extracted using principal component analysis (PCA), where the first component only was used [48]. The functional connectivity between all possible pairs of ROIs was evaluated using Pearson correlation coefficient. A Fisher r-to-z transform was computed to normalize r values for group comparison (mathematicians vs. non-mathematicians) [49,50]. The difference of functional connectivity between the mathematician and non-mathematician groups was estimated using the independent permutation t-test (10,000 replicates, p < 0.01) to avoid type I error [51,52]. Moreover, we computed the correlation coefficients between functional connectivity and the mathematics scores in each group using Pearson’s correlation to investigate if there is a region-to-region connectivity depending on the knowledge of mathematics (i.e., mathematics scores).
In order to further investigate different neural substrates between the two groups from a machine learning point of view, we performed the classification using 46 pairs of normalized r values as feature candidates, which showed statistically significant differences between the groups from the independent permutation t-test. In spite of the statistical significance in these pairs of features, they do not always guarantee the best classification performance [53]. Therefore, we estimated classification performance by selecting most discriminative features, for which another independent t-test was applied to each of the 46 features. The feature vector showing the smallest p-value between the two groups was first used for differentiating the groups, and the feature vector that had the next smallest p-value was added to the first feature vector for classification. This procedure was repeated until all 46 feature vectors were tested for classification. The classification accuracy was independently evaluated for each feature set (1 to 46 features) using a support vector machine (SVM) classifier with leave-one-out cross-validation (LOOCV) to avoid the overfitting of the SVM classifier [53,54]. In the LOOCV, one sample (mathematician or non-mathematician) was used as the test the data, whereas the other samples were used as the training data, which was iterated until every sample was used as the test data. The raw brain data and analysis scripts will be made available on request.
3. Results
3.1. Functional Connectivity between Mathematicians and Non-Mathematicians
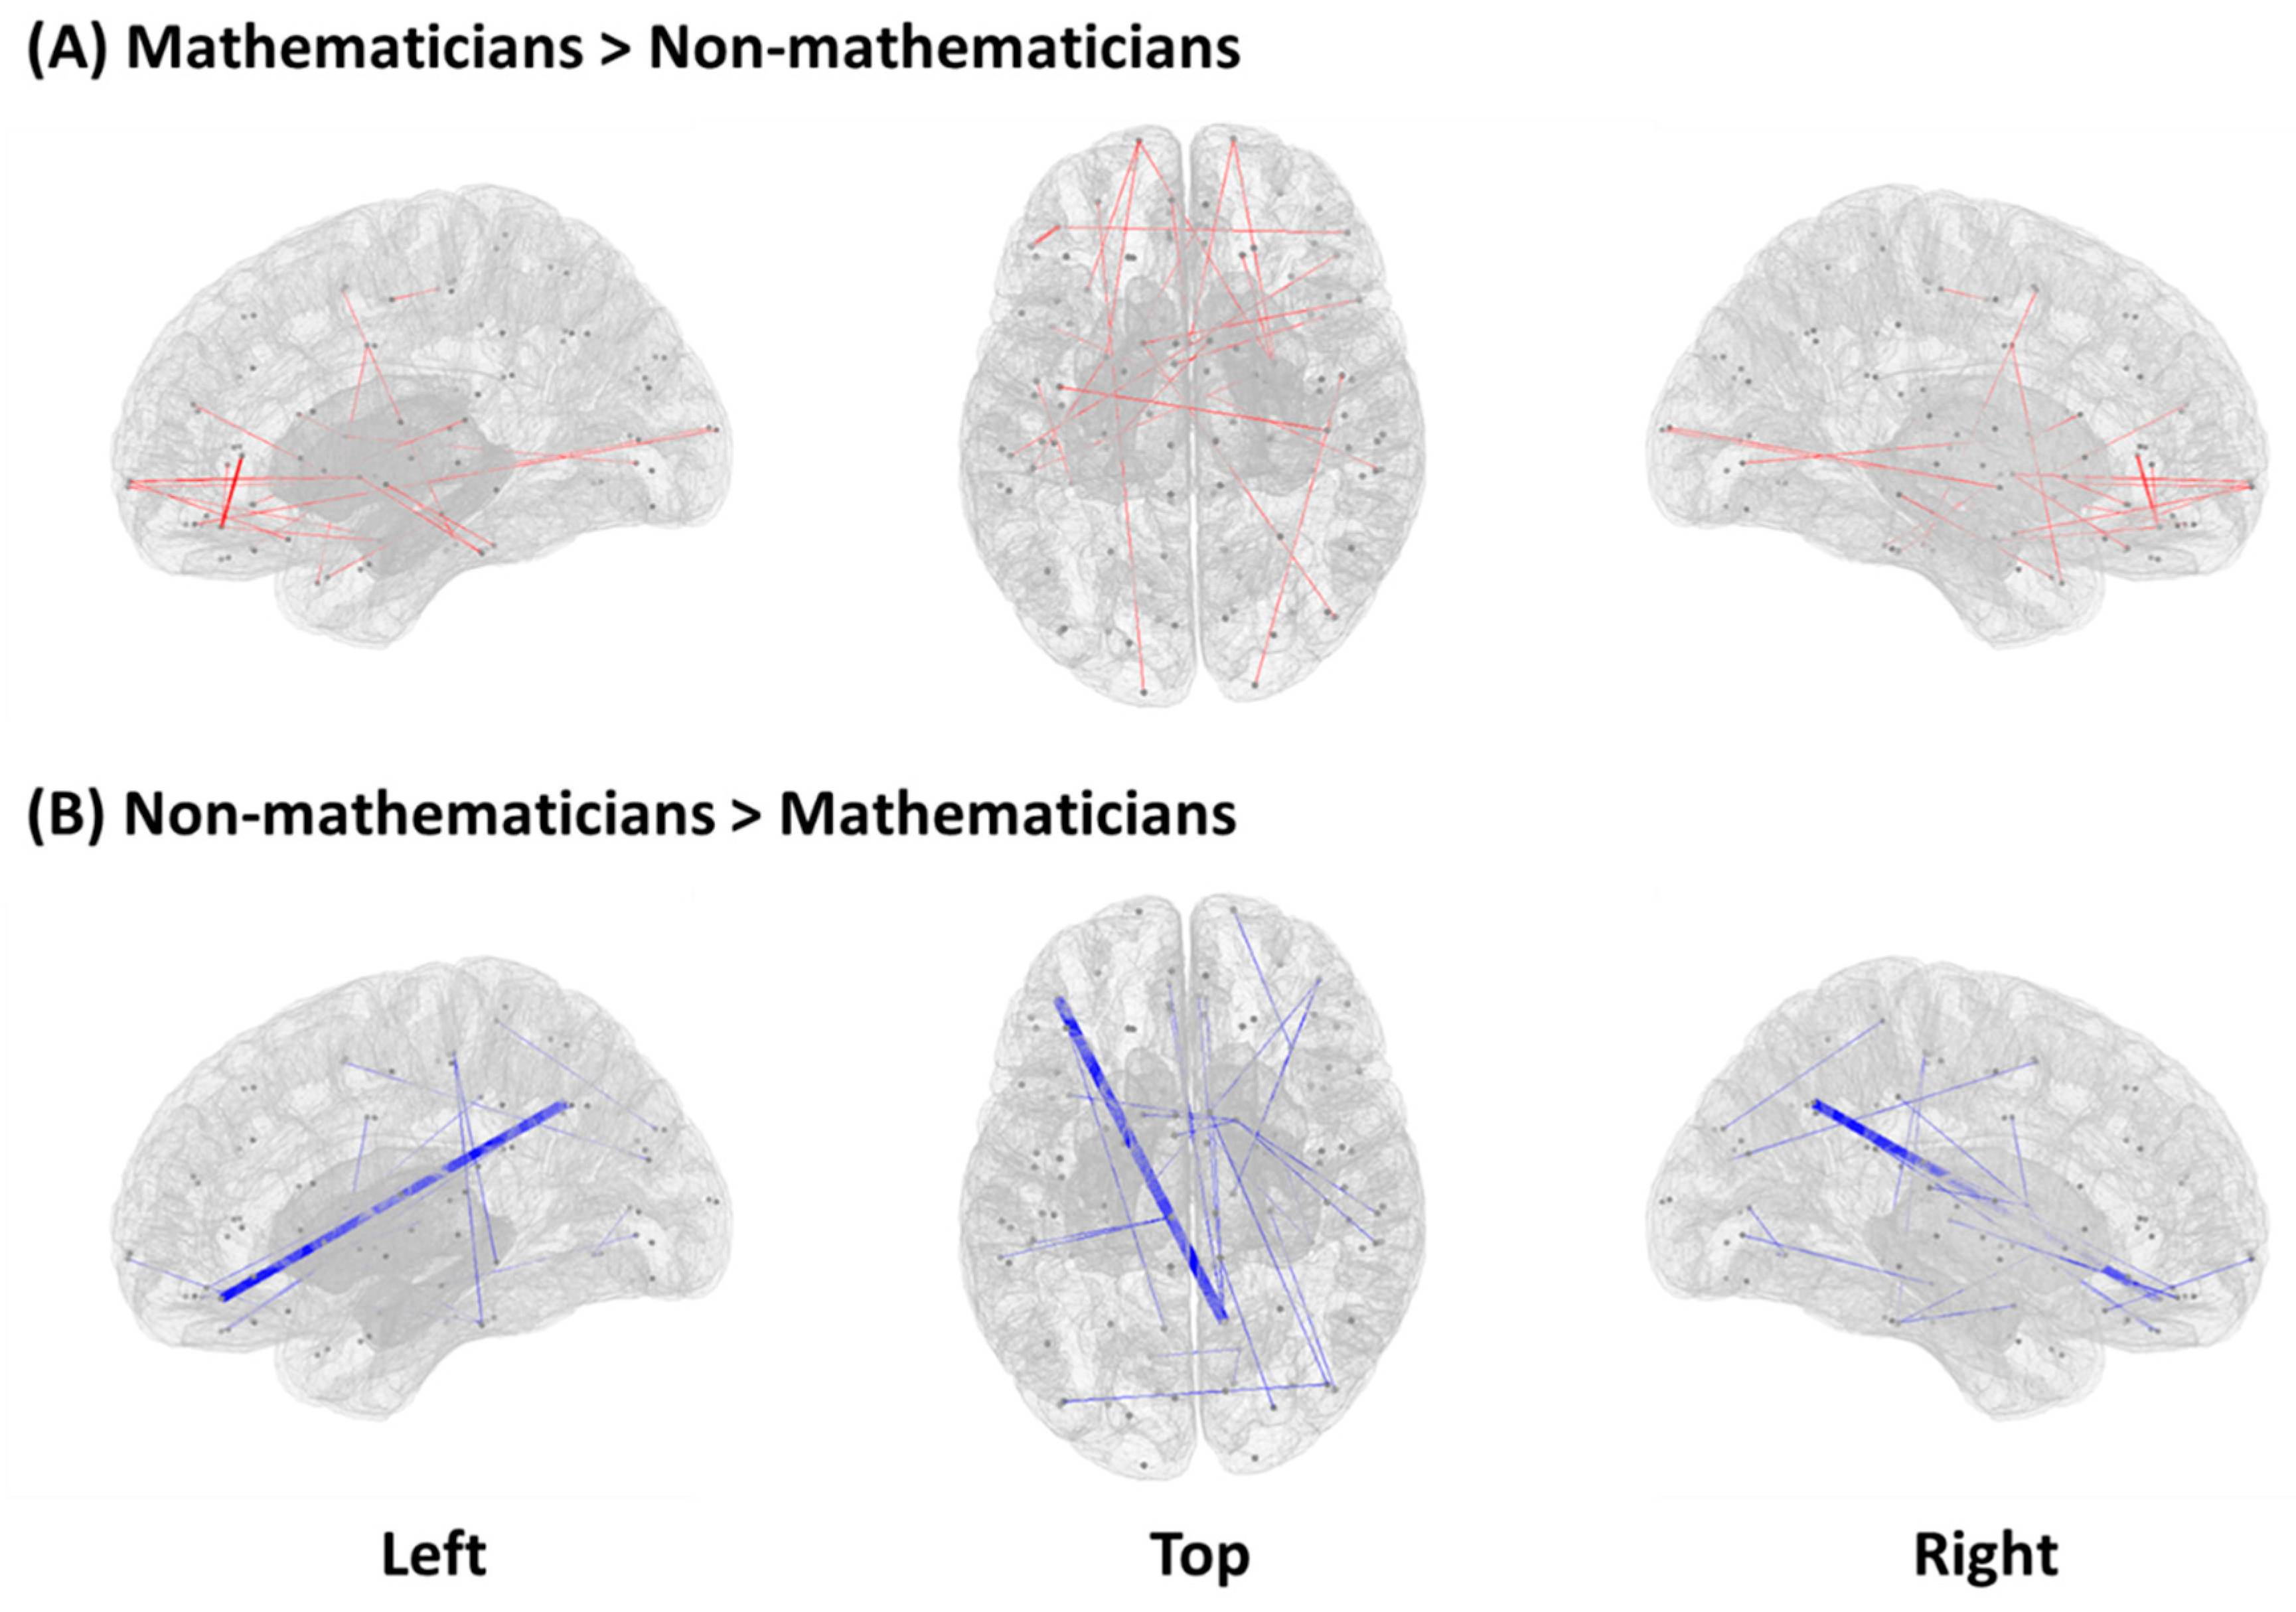
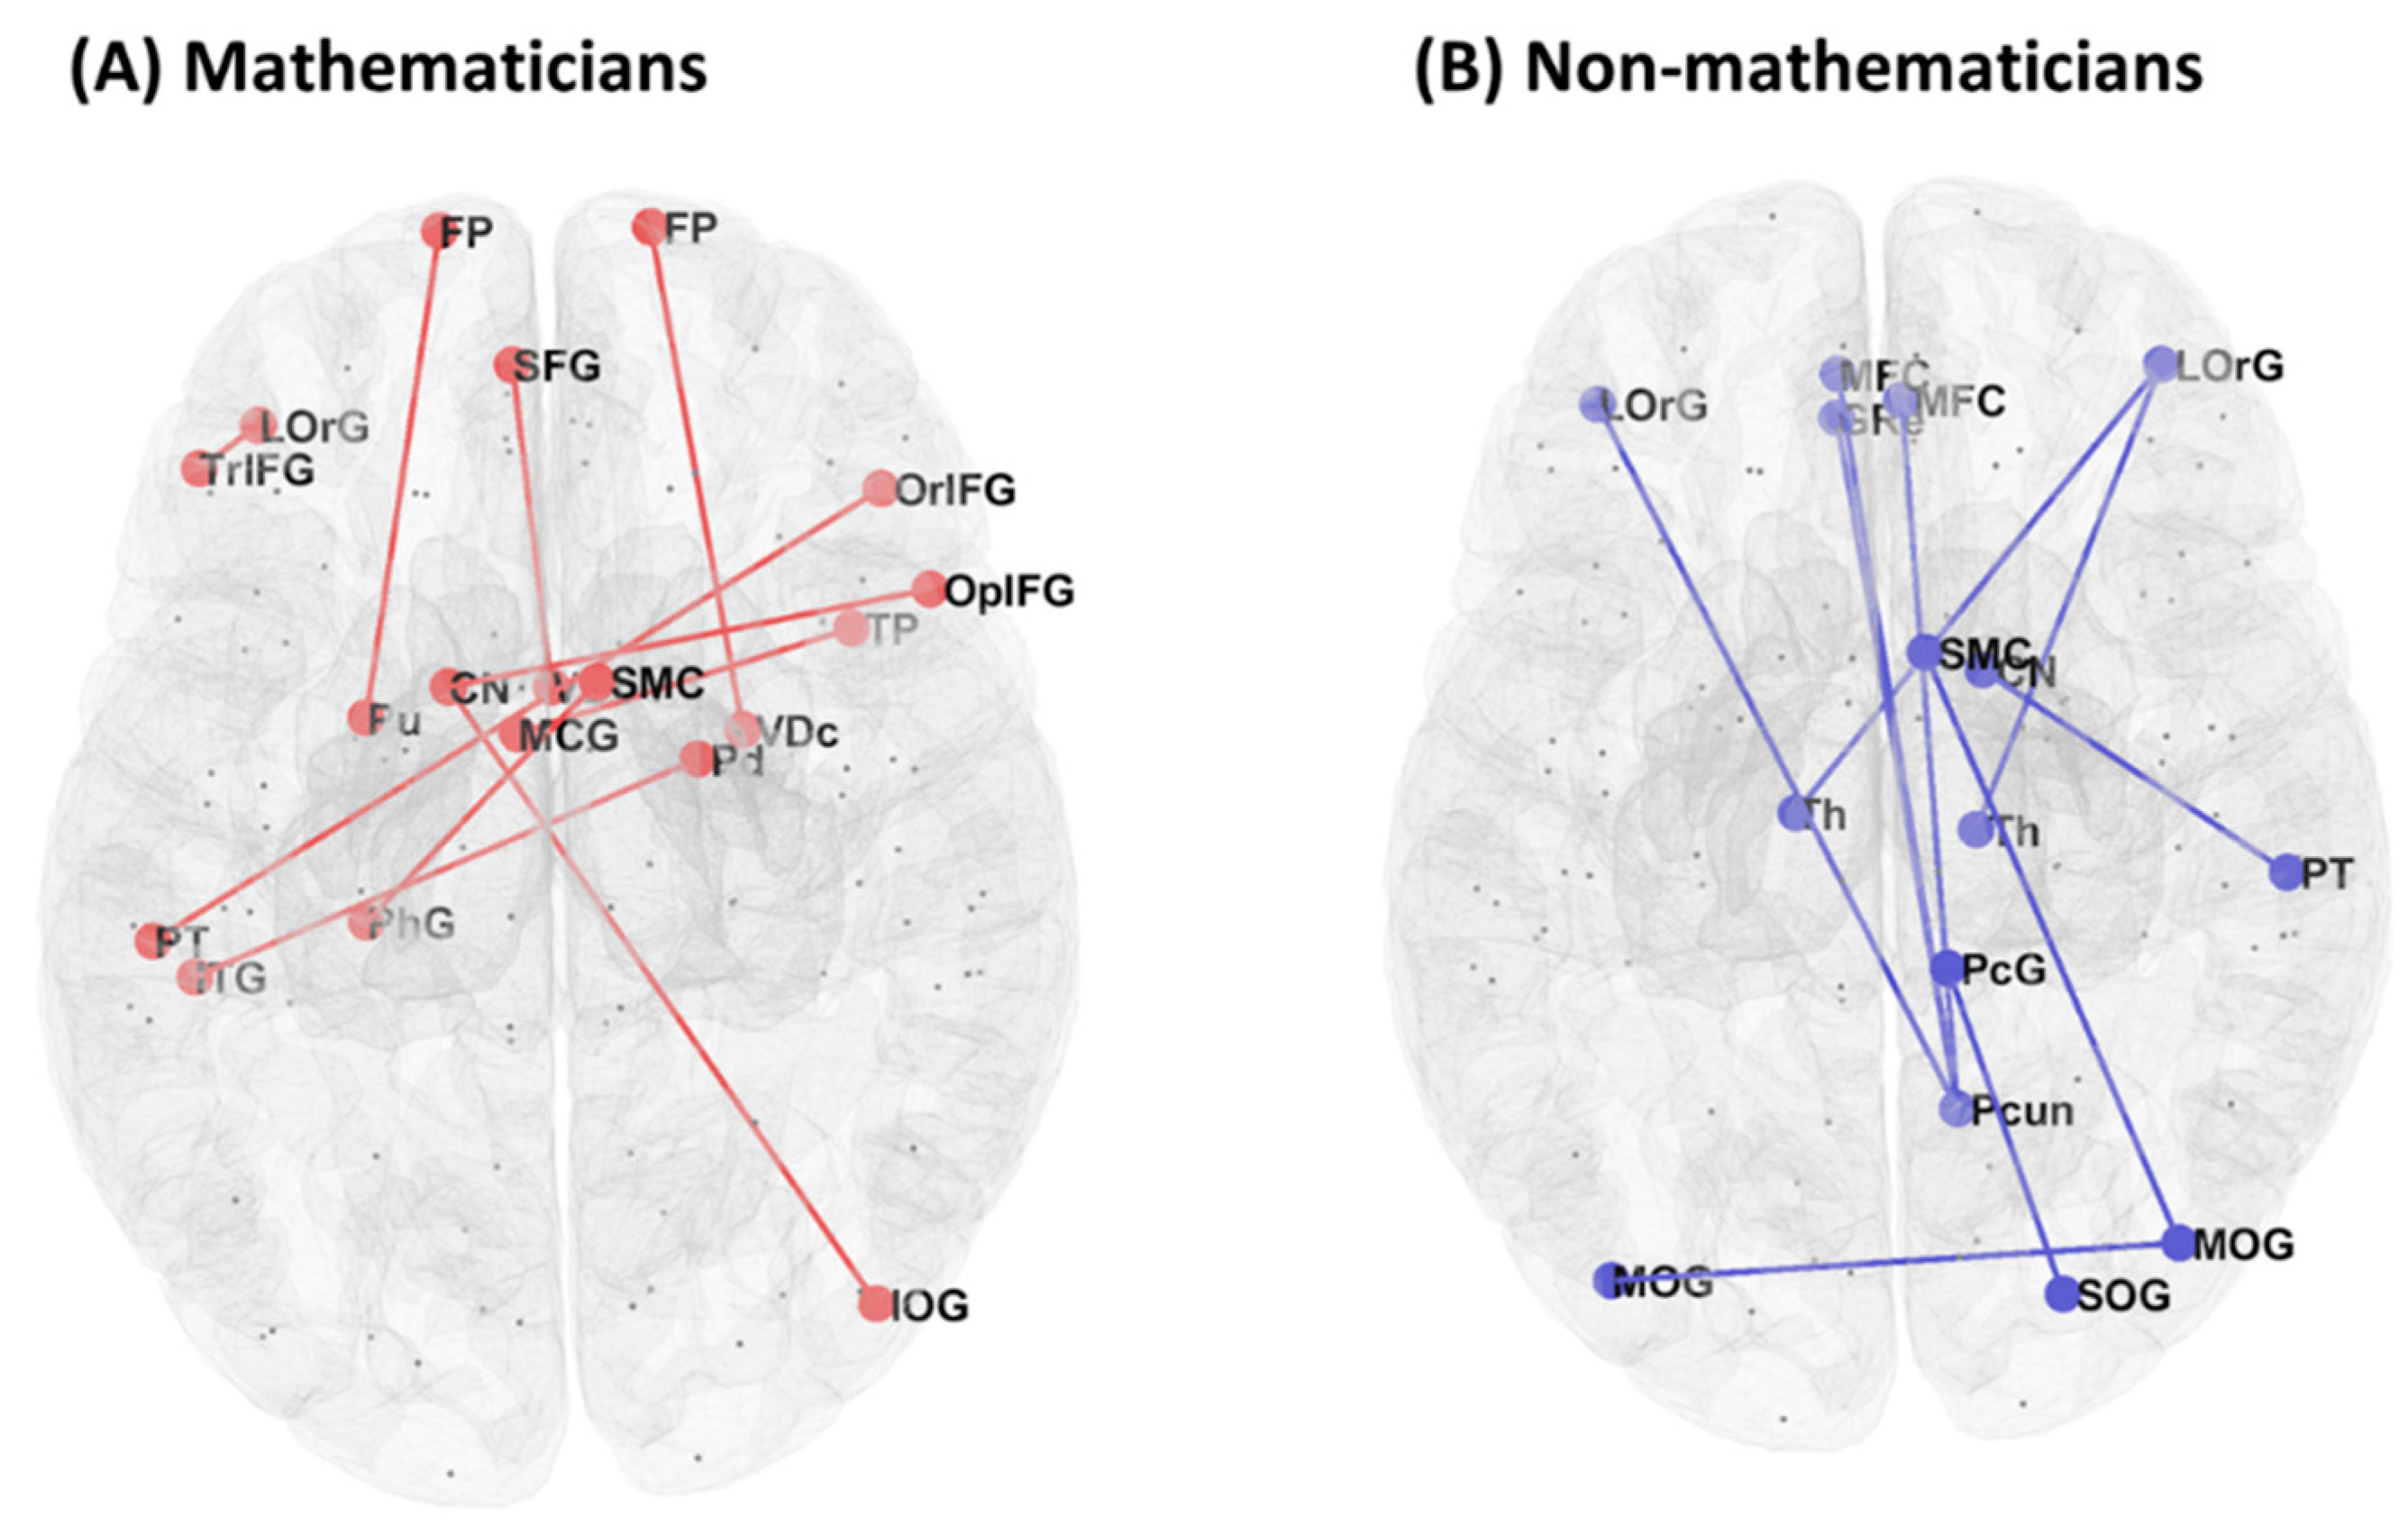
Resting-state functional connectivity showed a significant group difference (mathematicians vs. non-mathematicians) in 46 pairs of ROIs (Table 2). The mathematician group, compared to the non-mathematician group, showed higher functional connectivity in 22 pairs of ROIs, while the non-mathematician group demonstrated higher functional connectivity in the other 24 pairs of ROIs. In Figure 1, we present a graphical illustration of all the functional connections in each group, where red and blue lines represent significantly higher functional connectivity in the mathematicians and non-mathematicians, respectively. Among these connections, we selected the top-ten connections and rendered them on the brain, demonstrating conspicuous differences in the connectivity patterns between the groups (Figure 2).
3.2. Linking Functional Connectivity to Mathematics Scores
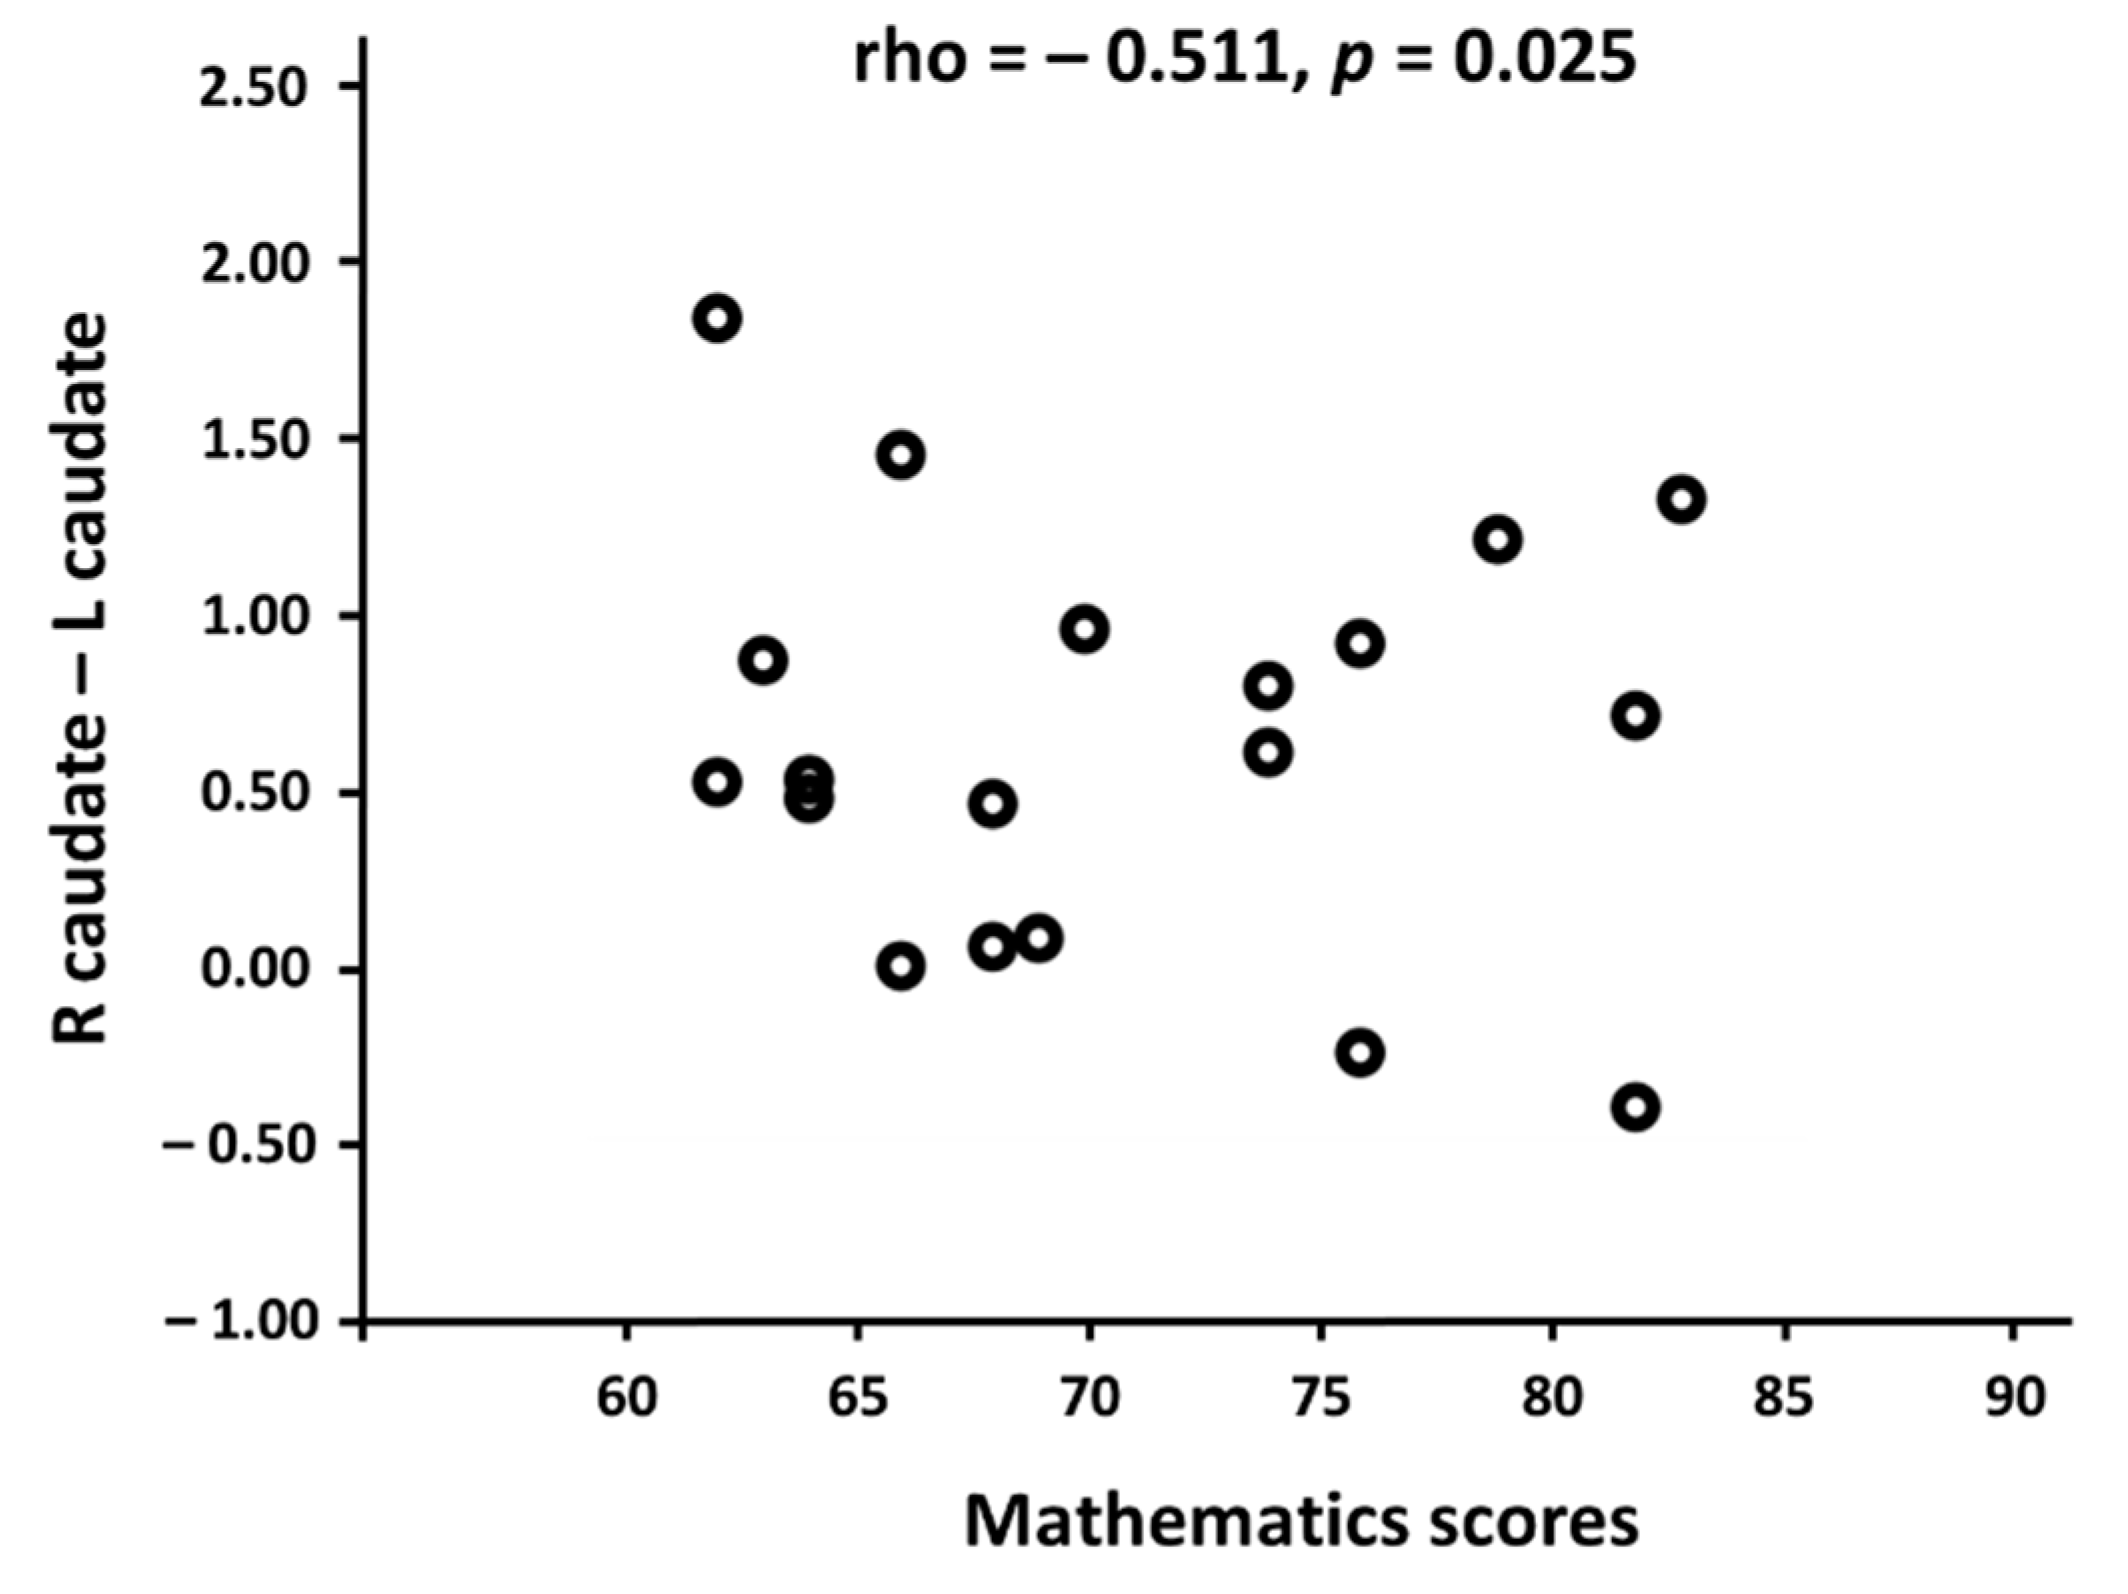
To investigate a crucial relationship between the brain’s functional network and mathematical competence, we performed Pearson’s correlation analysis between each of the 46 functional connectivities (Table 2) and the mathematics scores in mathematicians and non-mathematicians. As a result, the functional connectivity between the left and right caudate nucleus was negatively correlated with the mathematics scores in the mathematician group (r = −0.511, p = 0.025; Figure 3). In non-mathematicians, we could not find any significant results. This indicates that only mathematicians showed stronger functional connectivity between the left and right caudate nucleus as their mathematics scores became lower.
3.3. Classification Performance
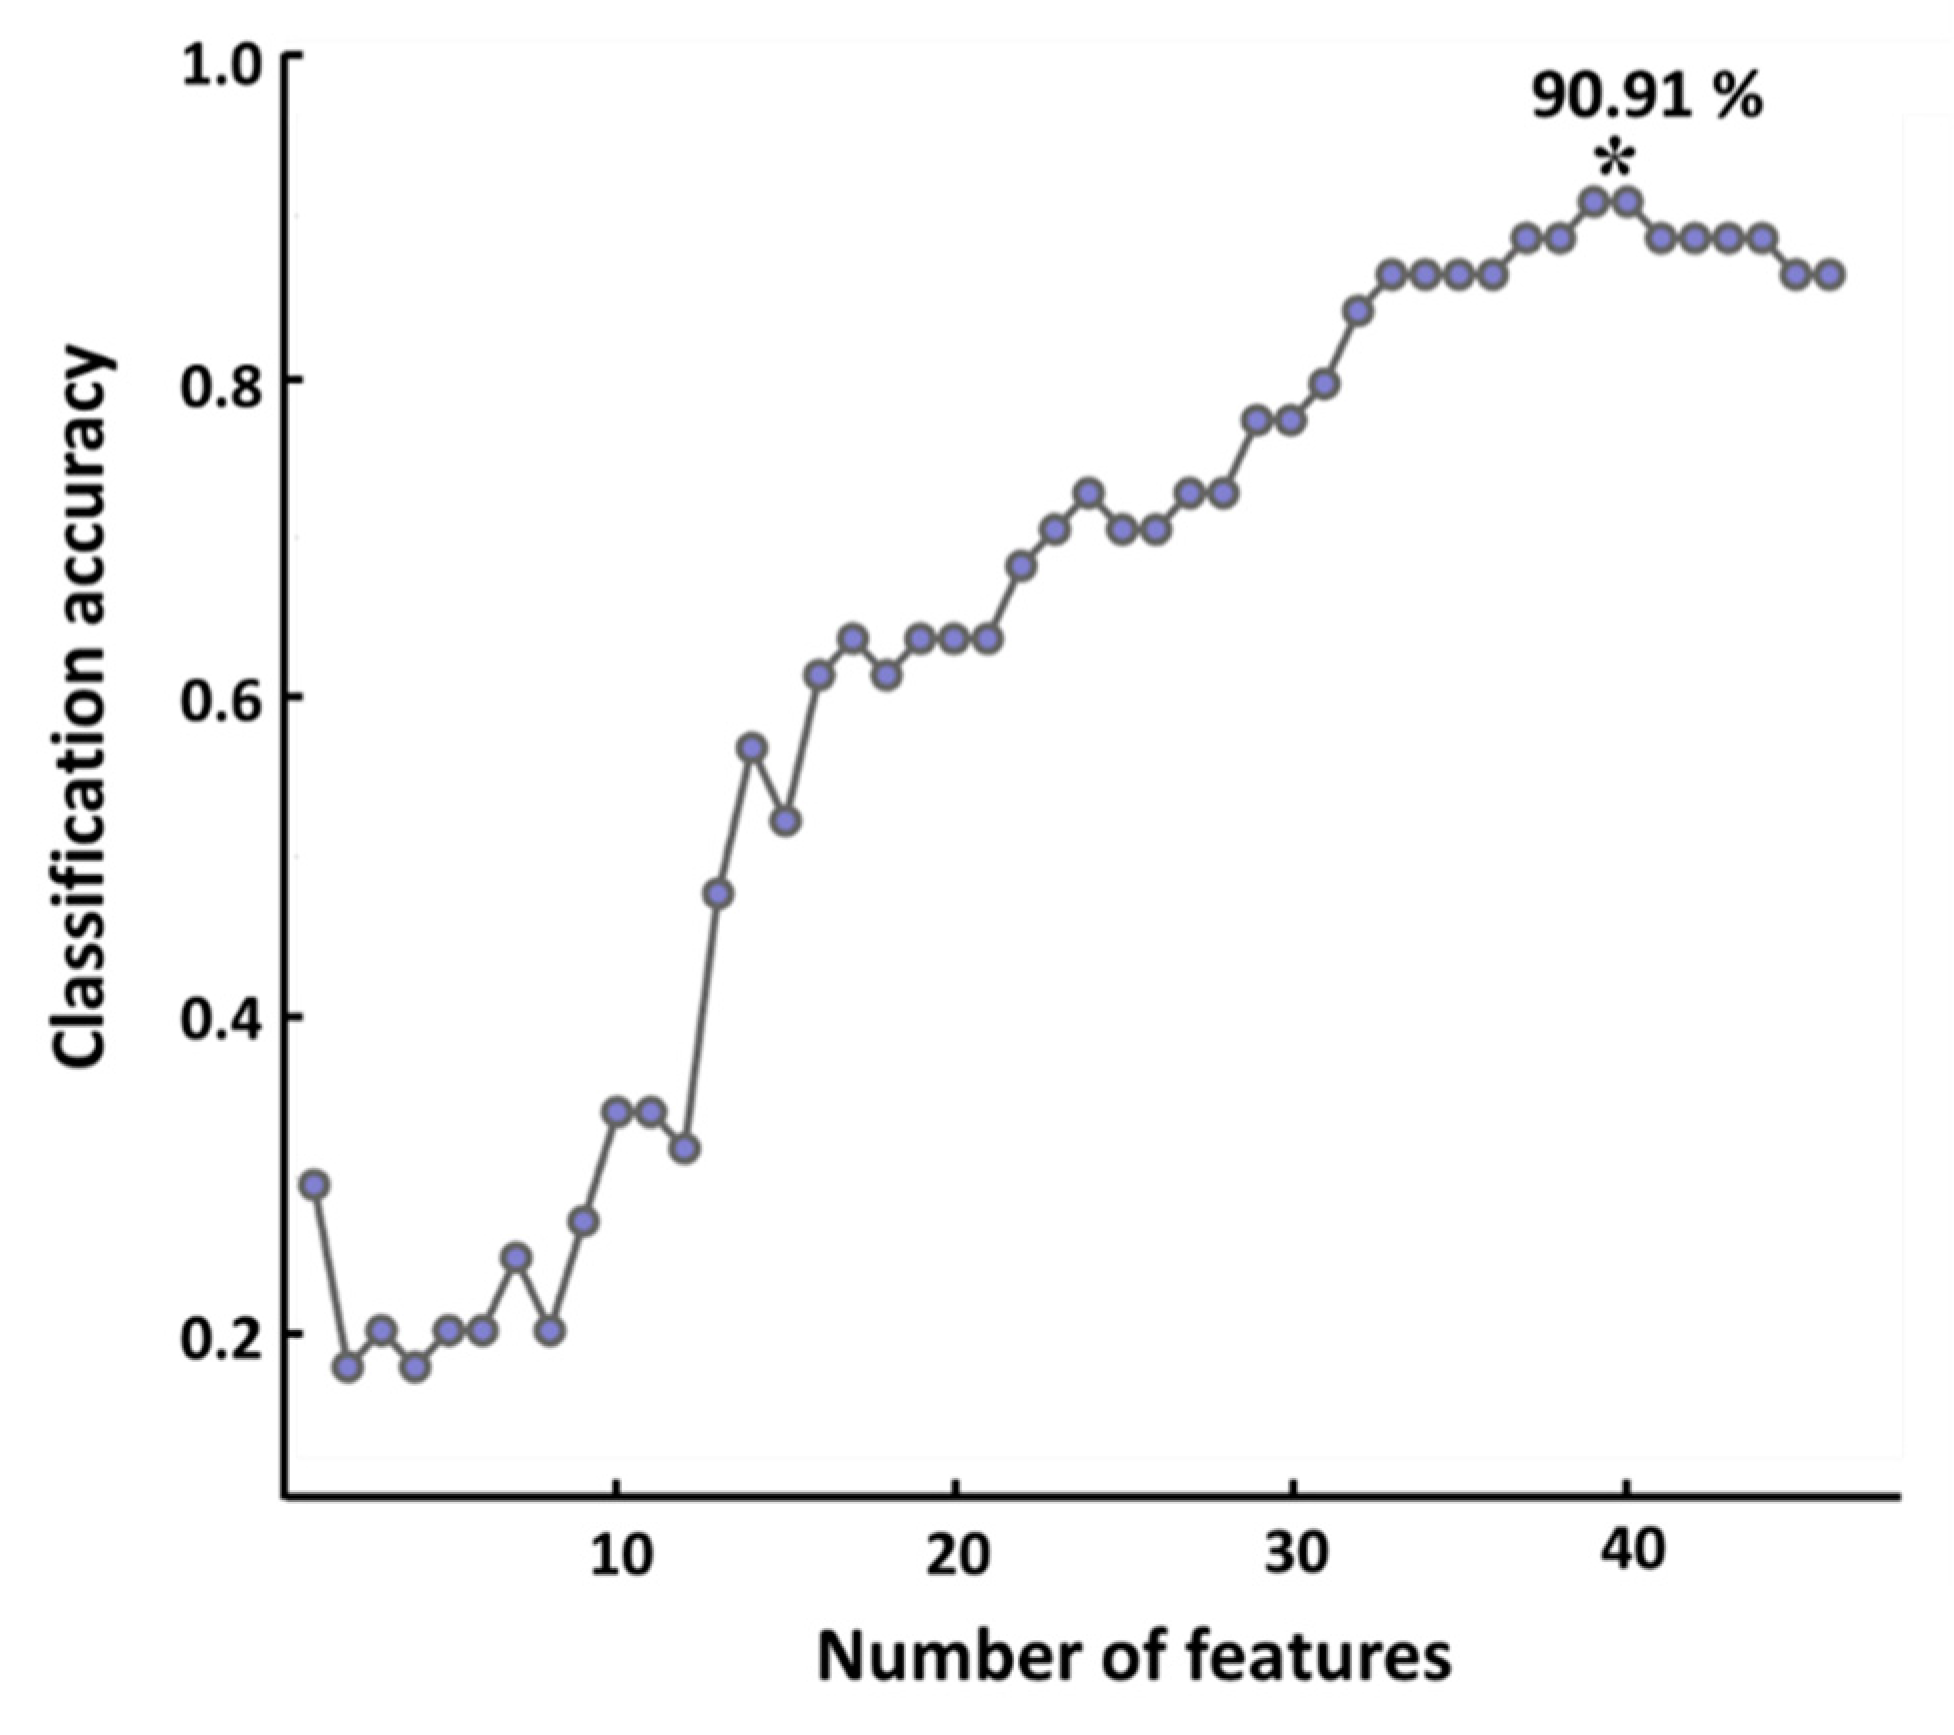
Figure 4 shows the changes in classification accuracy with respect to the number of features (pairs of ROIs). An increasing trend in classification accuracy was observed as the number of features used for classification increased, and the highest classification of 90.91% was obtained when most features (n = 39) were used.
4. Discussion
In the present study, the evidence of an expertise-dependent brain network was garnered from the disparate functional connectivity between mathematicians and non-mathematicians. The level of integration among brain regions at resting state, in other words, the resting-state functional connectivity, is deeply intertwined with neural architectures that support fundamental aspects of human behavior [14,55,56]. Much has been studied about changes to neural networks using resting-state fMRI and task-related fMRI, emphasizing which brain regions establish functionally specialized networks, how functional connectivity changes its strength, and how these changes link to alterations in cognitive functions, emotion, and behavior [26,57,58]. Indeed, researchers have suggested that intrinsic connectivity networks acquired from resting-state data are closely linked to individual characteristics such as IQ, personality, and cognitive functions [57]. In line with this, we demonstrated diverging involvements of the frontal–thalamic–temporal connections for mathematicians and the medial–frontal areas to precuneus and the lateral orbital gyrus to thalamus connections for non-mathematicians. Among mathematicians, those who had higher scores in mathematical knowledge showed a weaker connection strength between the left and right caudate nucleus, demonstrating the connections’ characteristics associated with mathematical expertise. Moreover, we achieved a maximum classification accuracy of 91.19% when differentiating mathematicians and non-mathematicians using the distinct resting-state functional connectivity features.
4.1. Resting-State Functional Connectivity for Detecting Group-Specific Features
Resting-state fMRI has been widely used to detect differences between specific participant groups or to depict group-specific features in their cognitive functions. For example, network maturation was observed in early adolescence not only in the DMN, but also in the central executive network, and with a significant positive correlation between intelligence quotient and the central executive network [29]. Adults with superior and average intelligence exhibited a significant group difference in the functional connectivity and global efficiency of the DMN [30]. Individuals with better set-shifting functions showed positive resting-state connectivity between frontoparietal and visual networks, whereas individuals with higher performance in general executive functions showed increased resting-state connectivity between sensory network and DMN [32]. Individuals’ ability in creative thinking was also reflected in the connectivity pattern of resting-state fMRI, showing that participants’ creativity scores were positively correlated with the strength of the network, including the DMN, as well as salience and executive brain networks [59]. In other words, resting-state fMRI unveils the related functions of anatomically distinct areas through the correlation of resting BOLD activities with behavior-specific traits, representing individuals’ differences in cognitive functions. In line with this, we conducted a detailed investigation into mathematical expertise using resting-state fMRI, making great strides toward the understanding of mathematicians’ functional architecture in the brain and the neural underpinnings of their exceptional performances.
4.2. Functional Connectivity in Mathematicians
The intrinsic connectivity of resting-state data has functional significance by encoding and supporting the consolidation of experiences, and thus, it even facilitates behavior performance [60]. This indicates that the connectivity observed from the resting-state data may implicate the possible roles of the involved networks. The mathematicians’ group revealed significantly enhanced resting-state connectivity between the frontal and subcortical regions compared to non-mathematicians. Among this constellation of brain areas, we found that the frontal and temporal areas were significantly linked to the caudate nucleus, putamen, and ventral diencephalon that have been known to be closely intertwined with expertise-dependent network [1,61,62].
Much evidence has described the role of the caudate nucleus as the formation of a stimulus–response association in the pursuit of moderating goal-directed behavior [63,64]. The stimulus–response association is one of the features that distinguishes experts from novices. It has been suggested that experts retrieve chunks, patterns, or templates that are made of stimulus–response associations stored in the long-term memory and apply them for their professional performance [65,66,67]. Therefore, the involvement of the caudate nucleus in our mathematician group may be pertinent to its supporting role of expert-specific operation with arithmetical knowledge structures stored in the long-term memory. The occipital gyrus that was connected to the caudate nucleus in the mathematician group is also construed as aiding expertise-related behaviors. Professional mathematicians are likely to retrieve arithmetical facts from stimulus–response associations instead of getting involved in actual calculation, and as a result, mathematicians compile mathematical chunks in the occipito-temporal visual cortex [68]. In line with this, the present study also showed the significant connection between the caudate nucleus and the right inferior occipital gyrus only in mathematicians.
The frontostriatal network, including the caudate nucleus, putamen, and thalamus (vental diencephalon), in mathematicians was another major finding in the present study. The caudate nucleus and putamen, together with the ventral precentral gyrus, were the key connections modulated by mathematical competence according to the functional connectivity measured by psychophysiological interactions (PPIs) [1]. In terms of the thalamus, the spontaneous thalamic activity obtained by resting-state functional connectivity supports the key role of the fronto-thalamic connections in expertise, showing that the connections between the thalamus and inferior/middle frontal gyrus were positively correlated with experts’ training time [69]. The thalamus, in association with the prefrontal cortex and caudate nucleus/putamen, have been adduced not only as a hub for integrating information across cortical networks [70], but also as a mediation of many cognitive functions, such as spatial visual processing, attention, memory, and decision making [71,72,73,74]. Therefore, the involvement of the thalamus in the form of fronto-thalamic connections among mathematicians may be indicative of its active involvement in mathematics, which resultingly expedites information processing within the network and facilitates mathematicians’ professional performance in mathematics.
Another noteworthy connection in mathematicians was observed in the medial temporal lobe linked to the basal ganglia and inferior frontal gyrus (pars orbitalis). The inferior temporal regions and inferior frontal gyrus were found to be sensitively activated to quantity- and mathematics-related concepts [75]. When professional mathematicians were involved in the processing of mathematical statements (e.g., algebra, analysis, topology, or geometry), they showed activation in the inferior temporal region, along with the bilateral intraparietal sulci and bilateral sites in the dorsolateral, superior, and mesial prefrontal cortex [76]. Therefore, we suggest that the resting-state functional connectivity in the medial temporal lobe demonstrates its supporting role of processing mathematics-relevant information that is substantiated by the active involvement of the temporal regions observed in task-evoked BOLD signals in previous studies.
4.3. Mathematicians’ Preconfigured Functional Connectivity for Their Expertise
How efficiently the functional connectivity of resting-state fMRI updates to that of task-related fMRI is known to be closely associated with individuals’ level of performance, suggesting that the brain’s functional networks at rest need to be reconfigured when they are given specific tasks, getting ready for the successful performance of the tasks [77]. The fast and efficient reconfiguration and update of the functional network from rest to task is strongly interwoven with individuals’ task performances. Moreover, the degree of similarity between resting-state functional connectivity and task-related functional connectivity exerts on task performance [77,78]. For example, in high-performing individuals, their functional connectivity of resting state did not change much compared to that of task-related fMRI [77]. This reconfiguration efficiency or preconfigured functional connectivity during resting state, specifically with the similarity to a task-related configuration, has been known to aid in updates in task-related networks and predictions of individuals’ better task performance. Conforming to this, we also found that the resting-state functional connectivity in mathematicians was similar to the task-related functional connectivity when the same group of mathematicians had been involved in the processing of arithmetic calculation [1]. Mathematicians’ task-based functional patterns were observed in the areas composed of the inferior, middle, and superior frontal gyrus and the inferior occipital gyrus, which were also found in the resting-state networks in the present study. On the contrary, non-mathematicians showed substantially different functional networks between resting-state and task-related fMRI. Their functional activations were observed mostly in the inferior parietal lobule, bilateral occipital gyrus, superior frontal gyrus, and superior medial gyrus [1], whereas the resting-state functional connectivity in the present study was composed of the connections largely in the medial frontal gyrus to precuneus and lateral orbital gyrus to thalamus. Therefore, our findings reconcile with the argument that experts’ preconfigured resting-state functional connectivity, which is already similar to task-related functional connectivity even at rest, enables individuals to update their mental states for task performance more efficiently, leading to better behavioral performances compared to non-experts.
4.4. Neural Efficiency Correlated with the Functional Connectivity in the Caudate Nucleus
Neural efficiency, that is, “brighter individuals use their brains more efficiently when engaged in the performance of cognitively demanding tasks than less intelligent people do” [79], has been represented as having less brain activation and a shorter-range connectivity. Experts have been known to conserve mental resources that may have usually been served in non-experts for compensating their lack of proficiency, resulting in less neural activity in experts compared with non-experts. In the present study, mathematicians showed the negative correlation between mathematics scores and the strength of functional connectivity in the bilateral caudate nuclei (Figure 3), which indicates that the higher scores mathematicians achieved, the weaker functional connectivity they showed between the left and right caudate nucleus. This finding was also substantiated in several neuroimaging studies investigating the roles of the caudate nucleus in terms of the level of task performance or expertise. For example, the activity in the caudate nucleus increases when one is involved in effortful and complex tasks, whereas the caudate nucleus responds less in relatively easy and non-effortful tasks [80]. Pilots with a high level of expertise, compared to those with a moderate level of expertise, demonstrated less activity in the bilateral caudate nucleus with better performance in a simulated landing-decision task [62]. To summarize, the weaker functional connectivity is adduced to explaining the higher levels of expertise among our mathematicians, demonstrating how the connectivity in caudate nucleus changes with respect to ones’ expertise.
4.5. Classification Accuracy
Statistical analyses of functional or structural group differences have been widely used to investigate fMRI-based neuroimaging features, thereby revealing psychophysiological traits of specific population groups [1,2,81]. In the present study, together with this approach, we employed the machine learning technique to discriminate between professional mathematicians and non-mathematicians in their functional connectivity, using significant features extracted from resting-state fMRI data. We obtained a high classification accuracy of 91.19%, thereby cross-validating our statistical results from the aspect of machine learning. Particularly, we suggest that using resting-state functional connectivity features would play an important role in obtaining a relatively high classification accuracy. Indeed, several previous studies reported that functional connectivity features, compared to BOLD activities, showed better classification performances [82,83,84]. Therefore, it is necessary to look into functional connectivity from the resting-state fMRI data, as well as the various patterns of BOLD activations to understand the brain’s complex processes [85,86,87].
The machine learning approach can be used to develop practical fMRI-based applications. For example, as mathematical ability is closely linked to learning ability [3], discriminating between different levels of mathematical proficiency with a high classification accuracy may be an appropriate way to evaluate individuals’ learning capability and to provide educational feedback depending on their performances over the course of learning. To develop such an educational application, it would be better to use a large sample size in each group in the future study.
4.6. Limitations
There are a few caveats in our study. One could bring about the issue of several measurements of resting-state fMRI instead of a single measurement (as we did in the present study). Unless there are specific aims (e.g., comparing changes in resting state over several days or over various sessions before/after a certain experimental condition), researchers normally measure a single session for resting-state fMRI. However, it would also be possible to obtain several sessions of resting-state data and compare their results with the data from a single session, to see if there are any interesting differences between them for a future study. Another limitation was that, even though the mathematics test showed statistical significance between the two groups (mathematicians vs. non-mathematicians), some of the demographic factors such as age, years of education, and intelligence test (Table 1) showed a non-significant but still marginal difference, which might have influenced our results. Therefore, this should be considered more carefully in future studies to reveal group differences more precisely.
5. Conclusions
We elucidated how varying levels of expertise were reflected in the functional connectivity among various brain regions, by comparing mathematicians and non-mathematicians using resting-state fMRI. Moreover, with the help of the classification algorithm in machine learning, we also found that the resting-state fMRI networks between the two groups were different depending on features of functional connectivity. Our results showed diverging involvement of the expertise-specific functional connections in mathematicians, suggesting the advantageous role of preconfigured resting-state functional connectivity, as well as the neural efficiency for experts’ successful performance.
Author Contributions
Conceptualization, H.-A.J.; formal analysis, M.S., H.-J.H., U.K., and H.-A.J.; funding acquisition, H.-J.H. and H.-A.J.; investigation, M.S., H.-J.H., U.K., and H.-A.J.; methodology, M.S., H.-J.H., U.K., and H.-A.J.; supervision, H.-A.J.; visualization, M.S. and H.-J.H.; writing—original draft, M.S., H.-J.H., U.K., and H.-A.J. All authors read and agreed to the published version of the manuscript.
Funding
This research was supported by the Basic Science Research Program through the National Research Foundation of Korea (NRF) funded by the Ministry of Education (NRF-2019M3C7A1031995 and NRF-2020R1A2C2099568), the Bio and Medical Technology Development Program of the NRF funded by MSIT (2017M3A9G8084463 and 2020R1A4A1017775), and an Institute for Information and Communications Technology Planning and Evaluation (IITP) grant funded by the Korea government (no. 2017-0-00451; Development of BCI based Brain and Cognitive Computing Technology for Recognizing User’s Intentions using Deep Learning).
Institutional Review Board Statement
This study was conducted according to the guidelines of the Declaration of Helsinki and approved by the Research Ethics Committee of the University of Leipzig (ethical approval number 953).
Informed Consent Statement
Informed consent was obtained from all subjects involved in the study.
Data Availability Statement
The datasets used and analyzed during this study are available from the corresponding author on reasonable request.
Conflicts of Interest
The authors declare no conflict of interest.
Abbreviations
CN—caudate nucleus; FP—frontal pole; GRe—gyrus rectus; IOG—inferior occipital gyrus; ITG—inferior temporal gyrus; LOrG—lateral orbital gyrus; MCG—middle cingulate gyrus; MFC—medial frontal cortex; MOG—middle occipital gyrus; OpIFG—opercula part of the inferior frontal gyrus; OrIFG—orbital part of the inferior frontal gyrus; Pcun—precuneus; PcG—postcentral gyrus; Pd—pallidum; PhG—para hippocampal gyrus; Pt—putamen; PT—planum temporale; Th—thalamus; TP—temporal pole; TrIFG—triangular part of the inferior frontal gyrus; SFG—superior frontal gyrus; SMC—supplementary motor cortex; SOG—superior occipital gyrus; VDc—ventral diencephalon.
References
- Jeon, H.-A.; Friederici, A.D. What Does “Being an Expert” Mean to the Brain? Functional Specificity and Connectivity in Expertise. Cereb. Cortex 2017, 27, 5603–5615. [Google Scholar] [CrossRef] [Green Version]
- Jeon, H.-A.; Kuhl, U.; Friederici, A.D. Mathematical expertise modulates the architecture of dorsal and cortico-thalamic white matter tracts. Sci. Rep. 2019, 9, 6825. [Google Scholar] [CrossRef]
- Menon, V. Developmental cognitive neuroscience of arithmetic: Implications for learning and education. ZDM 2010, 42, 515–525. [Google Scholar] [CrossRef] [Green Version]
- Duncan, G.J.; Dowsett, C.J.; Claessens, A.; Magnuson, K.; Huston, A.C.; Klebanov, P.; Pagani, L.S.; Feinstein, L.; Engel, M.; Brooks-Gunn, J. School readiness and later achievement. Dev. Psychol. 2007, 43, 1428. [Google Scholar] [CrossRef] [PubMed] [Green Version]
- Biswal, B.; Yetkin, F.Z.; Haughton, V.M.; Hyde, J.S. Functional connectivity in the motor cortex of resting human brain using echo-planar MRI. Magn. Reason. Med. 1995, 34, 537–541. [Google Scholar] [CrossRef]
- Fair, D.A.; Schlaggar, B.L.; Cohen, A.L.; Miezin, F.M.; Dosenbach, N.U.; Wenger, K.K.; Fox, M.D.; Snyder, A.Z.; Raichle, M.E.; Petersen, S.E. A method for using blocked and event-related fMRI data to study “resting state” functional connectivity. Neuroimage 2007, 35, 396–405. [Google Scholar] [CrossRef] [Green Version]
- Fox, M.D.; Raichle, M.E. Spontaneous fluctuations in brain activity observed with functional magnetic resonance imaging. Nat. Rev. Neurosci. 2007, 8, 700–711. [Google Scholar] [CrossRef] [PubMed]
- Yang, J.; Gohel, S.; Vachha, B. Current methods and new directions in resting state fMRI. Clin. Imaging 2020, 65, 47–53. [Google Scholar] [CrossRef] [PubMed]
- Damaraju, E.; Phillips, J.; Lowe, J.R.; Ohls, R.; Calhoun, V.D.; Caprihan, A. Resting-state functional connectivity differences in premature children. Front. Syst. Neurosci. 2010, 4. [Google Scholar] [CrossRef] [PubMed] [Green Version]
- Smitha, K.; Akhil Raja, K.; Arun, K.; Rajesh, P.; Thomas, B.; Kapilamoorthy, T.; Kesavadas, C. Resting state fMRI: A review on methods in resting state connectivity analysis and resting state networks. Neuroradiol. J. 2017, 30, 305–317. [Google Scholar] [CrossRef]
- Cordes, D.; Haughton, V.; Arfanakis, K.; Wendt, G.; Turski, P.A.; Moritz, C.; Quigley, M.A.; Meyerand, M. Mapping functionally related regions of brain with functional connectivity MRI (fcMRI). Am. J. Neuroradiol. 2000, 21, 1636–1644. [Google Scholar] [PubMed]
- Lowe, M.J.; Mock, B.J.; Sorenson, J.A. Functional connectivity in single and multislice echoplanar imaging using resting-state fluctuations. Neuroimage 1998, 7, 119–132. [Google Scholar] [CrossRef]
- Fox, M.; Snyder, A.; Vincent, J.; Corbetta, M.; Van Essen, D.; Raichle, M. From The Cover: The human brain is intrinsically organized into dynamic, anticorrelated functional networks. Proc. Natl. Acad. Sci. USA 2005, 102, 9673–9678. [Google Scholar] [CrossRef] [Green Version]
- Greicius, M.D.; Krasnow, B.; Reiss, A.L.; Menon, V. Functional connectivity in the resting brain: A network analysis of the default mode hypothesis. Proc. Natl. Acad. Sci. USA 2003, 100, 253–258. [Google Scholar] [CrossRef] [Green Version]
- Fransson, P. Spontaneous low-frequency BOLD signal fluctuations: An fMRI investigation of the resting-state default mode of brain function hypothesis. Hum. Brain. Mapp. 2005, 26, 15–29. [Google Scholar] [CrossRef] [PubMed]
- Laufs, H.; Krakow, K.; Sterzer, P.; Eger, E.; Beyerle, A.; Salek-Haddadi, A.; Kleinschmidt, A. Electroencephalographic signatures of attentional and cognitive default modes in spontaneous brain activity fluctuations at rest. Proc. Natl. Acad. Sci. USA 2003, 100, 11053–11058. [Google Scholar] [CrossRef] [PubMed] [Green Version]
- Rombouts, S.A.; Stam, C.J.; Kuijer, J.P.; Scheltens, P.; Barkhof, F. Identifying confounds to increase specificity during a “no task condition”. Evidence for hippocampal connectivity using fMRI. Neuroimage 2003, 20, 1236–1245. [Google Scholar] [CrossRef]
- Vincent, J.; Snyder, A.; Fox, M.; Shannon, B.; Andrews-Hanna, J.; Raichle, M.; Buckner, R. Coherent spontaneous activity identifies a hippocampal-parietal memory network. J. Neurophysiol. 2007, 96, 3517–3531. [Google Scholar] [CrossRef]
- Hampson, M.; Peterson, B.S.; Skudlarski, P.; Gatenby, J.C.; Gore, J.C. Detection of functional connectivity using temporal correlations in MR images. Hum. Brain. Mapp. 2002, 15, 247–262. [Google Scholar] [CrossRef]
- Fox, M.D.; Corbetta, M.; Snyder, A.Z.; Vincent, J.L.; Raichle, M.E. Spontaneous neuronal activity distinguishes human dorsal and ventral attention systems. Proc. Natl. Acad. Sci. USA 2006, 103, 10046–10051. [Google Scholar] [CrossRef] [Green Version]
- Sridharan, D.; Levitin, D.J.; Menon, V. A critical role for the right fronto-insular cortex in switching between central-executive and default-mode networks. Proc. Natl. Acad. Sci. USA 2008, 105, 12569–12574. [Google Scholar] [CrossRef] [Green Version]
- Christoff, K.; Gordon, A.M.; Smallwood, J.; Smith, R.; Schooler, J.W. Experience sampling during fMRI reveals default network and executive system contributions to mind wandering. Proc. Natl. Acad. Sci. USA 2009, 106, 8719–8724. [Google Scholar] [CrossRef] [PubMed] [Green Version]
- Taylor, K.S.; Seminowicz, D.A.; Davis, K.D. Two systems of resting state connectivity between the insula and cingulate cortex. Hum. Brain. Mapp. 2009, 30, 2731–2745. [Google Scholar] [CrossRef]
- Seeley, W.W.; Menon, V.; Schatzberg, A.F.; Keller, J.; Glover, G.H.; Kenna, H.; Reiss, A.L.; Greicius, M.D. Dissociable intrinsic connectivity networks for salience processing and executive control. J. Neurosci. 2007, 27, 2349–2356. [Google Scholar] [CrossRef] [PubMed]
- Yeo, B.T.; Krienen, F.M.; Sepulcre, J.; Sabuncu, M.R.; Lashkari, D.; Hollinshead, M.; Roffman, J.L.; Smoller, J.W.; Zollei, L.; Polimeni, J.R.; et al. The organization of the human cerebral cortex estimated by intrinsic functional connectivity. J. Neurophysiol. 2011, 106, 1125–1165. [Google Scholar] [CrossRef]
- Chen, B.; Xu, T.; Zhou, C.; Wang, L.; Yang, N.; Wang, Z.; Dong, H.-M.; Yang, Z.; Zang, Y.-F.; Zuo, X.-N.; et al. Individual variability and test-retest reliability revealed by ten repeated resting-state brain scans over one month. PLoS ONE 2015, 10, e0144963. [Google Scholar] [CrossRef] [PubMed]
- Shen, H.H. Core Concept: Resting-state connectivity. Proc. Natl. Acad. Sci. USA 2015, 112, 14115–14116. [Google Scholar] [CrossRef] [Green Version]
- Wang, X.; Wang, R.; Li, F.; Lin, Q.; Zhao, X.; Hu, Z. Large-scale granger causal brain network based on resting-state fMRI data. Neuroscience 2020, 425, 169–180. [Google Scholar] [CrossRef]
- Sherman, L.E.; Rudie, J.D.; Pfeifer, J.H.; Masten, C.L.; McNealy, K.; Dapretto, M. Development of the default mode and central executive networks across early adolescence: A longitudinal study. Dev. Cogn. Neurosci. 2014, 10, 148–159. [Google Scholar] [CrossRef] [Green Version]
- Ming, S.; Yong, L.; Yuan, Z.; Kun, W.; Chunshui, Y.; Tianzi, J. Default network and intelligence difference. IEEE Trans. Auton. Ment. Dev. 2009, 1, 101–109. [Google Scholar] [CrossRef]
- Suprano, I.; Delon-Martin, C.; Kocevar, G.; Stamile, C.; Hannoun, S.; Achard, S.; Badhwar, A.; Fourneret, P.; Revol, O.; Nusbaum, F.; et al. Topological modification of brain networks organization in children with high intelligence quotient: A resting-state fMRI study. Front. Hum. Neurosci. 2019, 13, 450. [Google Scholar] [CrossRef] [PubMed]
- Reineberg, A.E.; Gustavson, D.E.; Benca, C.; Banich, M.T.; Friedman, N.P. The relationship between resting state network connectivity and individual differences in executive functions. Front. Psychol. 2018, 9. [Google Scholar] [CrossRef] [PubMed] [Green Version]
- Desmond, J.E.; Glover, G.H. Estimating sample size in functional MRI (fMRI) neuroimaging studies: Statistical power analyses. J. Neurosci. Methods 2002, 118, 115–128. [Google Scholar] [CrossRef] [Green Version]
- Yeung, A.W. An updated survey on statistical thresholding and sample size of fMRI studies. Front. Hum. Neurosci. 2018, 12, 16. [Google Scholar] [CrossRef] [Green Version]
- Yeung, A.W.; Wong, N.S.; Eickhoff, S.B. Empirical assessment of changing sample-characteristics in task-fMRI over two decades: An example from gustatory and food studies. Hum. Brain. Mapp. 2020, 41, 2460–2473. [Google Scholar] [CrossRef] [PubMed]
- Orru, G.; Pettersson-Yeo, W.; Marquand, A.F.; Sartori, G.; Mechelli, A. Using support vector machine to identify imaging biomarkers of neurological and psychiatric disease: A critical review. Neurosci. Biobehav. Rev. 2012, 36, 1140–1152. [Google Scholar] [CrossRef]
- Rosa, M.J.; Portugal, L.; Hahn, T.; Fallgatter, A.J.; Garrido, M.I.; Shawe-Taylor, J.; Mourao-Miranda, J. Sparse network-based models for patient classification using fMRI. Neuroimage 2015, 105, 493–506. [Google Scholar] [CrossRef] [Green Version]
- Saari, P.; Burunat, I.; Brattico, E.; Toiviainen, P. Decoding musical training from dynamic processing of musical features in the brain. Sci. Rep. 2018, 8, 1–12. [Google Scholar] [CrossRef] [Green Version]
- Ibrahimović, N.; Bulheller, S. Mathematik-Test: Grundkenntnisse für Ausbildung und Beruf; Harcourt Test Services: Frankfurt, Germany, 2005. [Google Scholar]
- Jäger, A.O.; Süß, H.-M.; Beauducel, A. Berliner Intelligenzstruktur-Test: [BIS-Test]; Hogrefe, Verlag für Psychologie: Göttingen, Germany, 1997. [Google Scholar]
- Tewes, U. Hamburg-Wechsler-Intelligenztest für Erwachsene, Revision 1991: HAWIE-R; [Testmaterial Ohne Handanweisung]; Huber: Berching, Germany, 1994. [Google Scholar]
- Power, J.D.; Barnes, K.A.; Snyder, A.Z.; Schlaggar, B.L.; Petersen, S.E. Spurious but systematic correlations in functional connectivity MRI networks arise from subject motion. Neuroimage 2012, 59, 2142–2154. [Google Scholar] [CrossRef] [PubMed] [Green Version]
- Zhang, Y.; Brady, M.; Smith, S. Segmentation of brain MR images through a hidden Markov random field model and the expectation-maximization algorithm. IEEE Trans. Med. Imag. 2001, 20, 45–57. [Google Scholar] [CrossRef]
- Muschelli, J.; Nebel, M.B.; Caffo, B.S.; Barber, A.D.; Pekar, J.J.; Mostofsky, S.H. Reduction of motion-related artifacts in resting state fMRI using aCompCor. Neuroimage 2014, 96, 22–35. [Google Scholar] [CrossRef] [Green Version]
- Mazziotta, J.; Toga, A.; Evans, A.; Fox, P.; Lancaster, J.; Zilles, K.; Woods, R.; Paus, T.; Simpson, G.; Pike, B.; et al. A probabilistic atlas and reference system for the human brain: International Consortium for Brain Mapping (ICBM). Philos. Trans. R. Soc. Lond. B Biol. Sci. 2001, 356, 1293–1322. [Google Scholar] [CrossRef] [PubMed]
- Friston, K.J.; Holmes, A.P.; Worsley, K.J.; Poline, J.P.; Frith, C.D.; Frackowiak, R.S. Statistical parametric maps in functional imaging: A general linear approach. Hum. Brain. Mapp. 1994, 2, 189–210. [Google Scholar] [CrossRef]
- Tzourio-Mazoyer, N.; Landeau, B.; Papathanassiou, D.; Crivello, F.; Etard, O.; Delcroix, N.; Mazoyer, B.; Joliot, M. Automated anatomical labeling of activations in SPM using a macroscopic anatomical parcellation of the MNI MRI single-subject brain. NeuroImage 2002, 15, 273–289. [Google Scholar] [CrossRef]
- Koh, M.J.; Seol, J.; Kang, J.I.; Kim, B.S.; Namkoong, K.; Chang, J.W.; Kim, S.J. Altered resting-state functional connectivity in patients with obsessive-compulsive disorder: A magnetoencephalography study. Int. J. Psychophysiol. 2018, 123, 80–87. [Google Scholar] [CrossRef]
- Zar, J.H. Biostatistical Analysis; Pearson Education India: Chennai, India, 1999. [Google Scholar]
- Zhou, Y.; Liang, M.; Tian, L.; Wang, K.; Hao, Y.; Liu, H.; Liu, Z.; Jiang, T. Functional disintegration in paranoid schizophrenia using resting-state fMRI. Schizophr. Res. 2007, 97, 194–205. [Google Scholar] [CrossRef]
- Wu, X.; Li, R.; Fleisher, A.S.; Reiman, E.M.; Guan, X.; Zhang, Y.; Chen, K.; Yao, L. Altered default mode network connectivity in Alzheimer’s disease—A resting functional MRI and Bayesian network study. Hum. Brain. Mapp. 2011, 32, 1868–1881. [Google Scholar] [CrossRef] [Green Version]
- Gentle, J.E.; Härdle, W.K.; Mori, Y. Handbook of Computational Statistics: Concepts and Methods; Springer Science & Business Media: Berlin, Germany, 2012. [Google Scholar]
- Alimardani, F.; Cho, J.; Boostani, R.; Hwang, H. Classification of bipolar disorder and schizophrenia using steady-state visual evoked potential based features. IEEE Access 2018, 6, 40379–40388. [Google Scholar] [CrossRef]
- Shim, M.; Hwang, H.-J.; Kim, D.-W.; Lee, S.-H.; Im, C.-H. Machine-learning-based diagnosis of schizophrenia using combined sensor-level and source-level EEG features. Schizophr. Res. 2016, 176, 314–319. [Google Scholar] [CrossRef]
- Raichle, M.E.; Macleod, A.M.; Snyder, A.Z.; Powers, W.J.; Gusnard, D.A.; Shulman, G.L. A default mode of brain function. Proc. Natl. Acad. Sci. USA 2001, 98, 676–682. [Google Scholar] [CrossRef] [Green Version]
- Raichle, M.E.; Mintun, M.A. Brain work and brain imaging. Annu. Rev. Neurosci. 2006, 29, 449–476. [Google Scholar] [CrossRef]
- Stevens, M.C. The contributions of resting state and task-based functional connectivity studies to our understanding of adolescent brain network maturation. Neurosci. Biobehav. Rev. 2016, 70, 13–32. [Google Scholar] [CrossRef]
- Jiang, L.; Qiao, K.; Li, C. Distance-based functional criticality in the human brain: Intelligence and emotional intelligence. BMC Bioinform. 2021, 22, 32. [Google Scholar] [CrossRef]
- Beaty, R.E.; Kenett, Y.N.; Christensen, A.P.; Rosenberg, M.D.; Benedek, M.; Chen, Q.; Fink, A.; Qiu, J.; Kwapil, T.R.; Kane, M.J.; et al. Robust prediction of individual creative ability from brain functional connectivity. Proc. Natl. Acad. Sci. USA 2018, 115, 1087–1092. [Google Scholar] [CrossRef] [PubMed] [Green Version]
- Lewis, C.M.; Baldassarre, A.; Committeri, G.; Romani, G.L.; Corbetta, M. Learning sculpts the spontaneous activity of the resting human brain. Proc. Natl. Acad. Sci. USA 2009, 106, 17558–17563. [Google Scholar] [CrossRef] [PubMed] [Green Version]
- Duan, X.; He, S.; Liao, W.; Liang, D.; Qiu, L.; Wei, L.; Li, Y.; Liu, C.; Gong, Q.; Chen, H. Reduced caudate volume and enhanced striatal-DMN integration in chess experts. NeuroImage 2012, 60, 1280–1286. [Google Scholar] [CrossRef]
- Adamson, M.M.; Taylor, J.L.; Heraldez, D.; Khorasani, A.; Noda, A.; Hernandez, B.; Yesavage, J.A. Higher landing accuracy in expert pilots is associated with lower activity in the caudate nucleus. PLoS ONE 2014, 9, e112607. [Google Scholar] [CrossRef] [PubMed]
- Balleine, B.W.; Liljeholm, M.; Ostlund, S.B. The integrative function of the basal ganglia in instrumental conditioning. Behav. Brain Res. 2009, 199, 43–52. [Google Scholar] [CrossRef]
- Graybiel, A.M.; Grafton, S.T. The striatum: Where skills and habits meet. Cold. Spring. Harb. Perspect. Biol. 2015, 7, a021691. [Google Scholar] [CrossRef]
- Chase, W.G.; Simon, H.A. Perception in chess. Cogn. Psychol. 1973, 4, 55–81. [Google Scholar] [CrossRef]
- Ericsson, K.A.; Kintsch, W. Long-term working memory. Psychol. Rev. 1995, 102, 211–245. [Google Scholar] [CrossRef]
- Gobet, F.; Simon, H.A. Templates in chess memory: A mechanism for recalling several boards. Cogn. Psychol. 1996, 31, 1–40. [Google Scholar] [CrossRef] [Green Version]
- Maruyama, M.; Pallier, C.; Jobert, A.; Sigman, M.; Dehaene, S. The cortical representation of simple mathematical expressions. Neuroimage 2012, 61, 1444–1460. [Google Scholar] [CrossRef]
- Wang, Y.; Zuo, C.; Wang, D.; Tao, S.; Hao, L. Reduced thalamus volume and enhanced thalamus and fronto-parietal network integration in the chess experts. Cereb. Cortex. 2020, 30, 5560–5569. [Google Scholar] [CrossRef] [PubMed]
- Hwang, K.; Bertolero, M.A.; Liu, W.B.; D’Esposito, M. The human thalamus is an integrative hub for functional brain networks. J. Neurosci. 2017, 37, 5594–5607. [Google Scholar] [CrossRef] [Green Version]
- Browning, P.G.; Chakraborty, S.; Mitchell, A.S. Evidence for mediodorsal thalamus and prefrontal cortex interactions during cognition in macaques. Cereb. Cortex 2015, 25, 4519–4534. [Google Scholar] [CrossRef] [Green Version]
- Fama, R.; Sullivan, E.V. Thalamic structures and associated cognitive functions: Relations with age and aging. Neurosci. Biobehav. Rev. 2015, 54, 29–37. [Google Scholar] [CrossRef] [Green Version]
- Sommer, M.A.; Wurtz, R.H. Influence of the thalamus on spatial visual processing in frontal cortex. Nature 2006, 444, 374–377. [Google Scholar] [CrossRef] [PubMed] [Green Version]
- Pergola, G.; Danet, L.; Pitel, A.L.; Carlesimo, G.A.; Segobin, S.; Pariente, J.; Suchan, B.; Mitchell, A.S.; Barbeau, E.J. The regulatory role of the human mediodorsal thalamus. Trends Cogn. Sci. 2018, 22, 1011–1025. [Google Scholar] [CrossRef] [Green Version]
- Huth, A.G.; de Heer, W.A.; Griffiths, T.L.; Theunissen, F.E.; Gallant, J.L. Natural speech reveals the semantic maps that tile human cerebral cortex. Nature 2016, 532, 453–458. [Google Scholar] [CrossRef] [PubMed] [Green Version]
- Amalric, M.; Dehaene, S. Origins of the brain networks for advanced mathematics in expert mathematicians. Proc. Natl. Acad. Sci. USA 2016, 113, 4909–4917. [Google Scholar] [CrossRef] [Green Version]
- Schultz, D.H.; Cole, M.W. Higher intelligence is associated with less task-related brain network reconfiguration. J. Neurosci. 2016, 36, 8551–8561. [Google Scholar] [CrossRef]
- Cole, M.W.; Bassett, D.S.; Power, J.D.; Braver, T.S.; Petersen, S.E. Intrinsic and task-evoked network architectures of the human brain. Neuron 2014, 83, 238–251. [Google Scholar] [CrossRef] [Green Version]
- Neubauer, A.C.; Fink, A. Intelligence and neural efficiency: Measures of brain activation versus measures of functional connectivity in the brain. Intelligence 2009, 37, 223–229. [Google Scholar] [CrossRef]
- Grahn, J.A.; Parkinson, J.A.; Owen, A.M. The cognitive functions of the caudate nucleus. Prog. Neurobiol. 2008, 86, 141–155. [Google Scholar] [CrossRef]
- Schlaug, G.; Jäncke, L.; Huang, Y.; Staiger, J.F.; Steinmetz, H. Increased corpus callosum size in musicians. Neuropsychologia 1995, 33, 1047–1055. [Google Scholar] [CrossRef] [Green Version]
- Du, Y.; Fu, Z.; Calhoun, V.D. Classification and prediction of brain disorders using functional connectivity: Promising but challenging. Front. Neurosci. 2018, 12, 525. [Google Scholar] [CrossRef] [PubMed]
- Zhou, Y.; Yu, F.; Duong, T. Multiparametric MRI characterization and prediction in autism spectrum disorder using graph theory and machine learning. PLoS ONE 2014, 9, e90405. [Google Scholar] [CrossRef]
- Wee, C.Y.; Yap, P.T.; Zhang, D.; Denny, K.; Browndyke, J.N.; Potter, G.G.; Welsh-Bohmer, K.A.; Wang, L.; Shen, D. Identification of MCI individuals using structural and functional connectivity networks. Neuroimage 2012, 59, 2045–2056. [Google Scholar] [CrossRef] [Green Version]
- McDonough, I.M.; Nashiro, K. Network complexity as a measure of information processing across resting-state networks: Evidence from the Human Connectome Project. Front. Hum. Neurosci. 2014, 8, 409. [Google Scholar] [CrossRef] [Green Version]
- Shim, M.; Kim, D.-W.; Lee, S.-H.; Im, C.-H. Disruptions in small-world cortical functional connectivity network during an auditory oddball paradigm task in patients with schizophrenia. Schizophr. Res. 2014, 156, 197–203. [Google Scholar] [CrossRef]
- Mohanty, R.; Sethares, W.A.; Nair, V.A.; Prabhakaran, V. Rethinking measures of functional connectivity via feature extraction. Sci. Rep. 2020, 10, 1–17. [Google Scholar] [CrossRef] [PubMed] [Green Version]
Figure 1.
Significant differences between mathematicians and non-mathematicians in terms of functional connectivity (independent permutation t-test, p < 0.01). (A) Increased functional connectivity in mathematicians compared to non-mathematicians. (B) Increased functional connectivity in non-mathematicians compared to mathematicians. Line width is defined based on inverted p-values (1/p). Dots indicate 22 pairs of ROIs for mathematicians (A) and 24 pairs of ROIs for non-mathematicians (B). Left and right views of ROI pairs show sagittal images and top view demonstrates an axial image.

Figure 2.
Connectivity of the top-ten ROI pairs selected from Table 2. ROI pairs are denoted with circles connected to one another for (A) the mathematician group and (B) the non-mathematician group.
Figure 2.
Connectivity of the top-ten ROI pairs selected from Table 2. ROI pairs are denoted with circles connected to one another for (A) the mathematician group and (B) the non-mathematician group.

Figure 3.
The relationship between the mathematics scores and the functional connectivity (normalized r values) between the bilateral caudate nucleus in the mathematicians. X-axis indicates the mathematicians’ scores in the standardized mathematics test and the Y-axis indicates the functional connectivity values between the left and right caudate nucleus using Pearson’s correlation coefficients. A significant negative correlation was found only in the mathematician group.

Figure 4.
Classification accuracy with respect to the number of features. The maximum classification accuracy of 90.91% was obtained when using 39 features, which is denoted by an asterisk.
Figure 4.
Classification accuracy with respect to the number of features. The maximum classification accuracy of 90.91% was obtained when using 39 features, which is denoted by an asterisk.


Table 1.
Demographic and cognitive profiles of the mathematicians and non-mathematicians.
| Mathematicians | Non-Mathematicians | Statistics | |
|---|---|---|---|
| Age | 33.42 (5.62) | 27.23 (8.21) | p = 0.081 |
| Gender, M/F | 16/5 | 14/9 | p = 0.276 |
| Handedness, LQ | 92.45 (3.65) | 90.28 (8.25) | p = 0.269 |
| Years of education | 19.5 (2.7) | 16.21 (6.28) | p = 0.079 |
| Mathematics test | 70.95 (7.13) | 40.71 (7.69) | p < 0.001 |
| Intelligence test | 115.91 (12.35) | 124.27 (15.23) | p = 0.072 |
| WM (forward) | 8.9 (3.12) | 9.12 (4.2) | p = 0.319 |
| WM (backward) | 7.3 (1.9) | 7.62 (1.59) | p = 0.273 |
Values depict mean (and standard deviation); statistics were obtained from independent t-tests, except for gender (Pearson’s chi-square test). LQ, laterality quotient); WM, working memory.
Table 2.
List of region of interest (ROI) pairs showing statistically significant differences between mathematicians and non-mathematicians in terms of functional connectivity.
Table 2.
List of region of interest (ROI) pairs showing statistically significant differences between mathematicians and non-mathematicians in terms of functional connectivity.
| 1st ROI | 2nd ROI | p-Value |
|---|---|---|
| Mathematicians > Non-mathematicians | ||
| Left lateral orbital gyrus (LOrG) | Left triangular part of the inferior frontal gyrus (TrIFG) | 0.0003 |
| Right ventral diencephalon (VDc) | Right frontal pole (FP) | 0.0011 |
| Left ventral diencephalon (VDc) | Left superior frontal gyrus (SFG) | 0.0019 |
| Left caudate nucleus (CN) | Right opercular part of the inferior frontal gyrus (OpIFG) | 0.0021 |
| Left parahippocampal gyrus (PhG) | Right supplementary motor cortex (SMC) | 0.0031 |
| Left caudate nucleus (CN) | Right inferior occipital gyrus (IOG) | 0.0039 |
| Right pallidum (Pd) | Left inferior temporal gyrus (ITG) | 0.0039 |
| Left middle cingulate gyrus (MCG) | Right temporal pole (TP) | 0.0039 |
| Left putamen (Pu) | Left frontal pole (FP) | 0.0041 |
| Right orbital part of the inferior frontal gyrus (OrIFG) | Left planum temporale (PT) | 0.0041 |
| Left putamen | Left inferior temporal gyrus | 0.0051 |
| Left ventral diencephalon | Right frontal pole | 0.0051 |
| Right postcentral gyrus | Left precentral gyrus | 0.0059 |
| Left fusiform gyrus | Left planum temporale | 0.0061 |
| Left anterior orbital gyrus | Left occipital pole | 0.0061 |
| Right putamen | Left frontal pole | 0.0063 |
| Left lateral orbital gyrus | Right triangular part of the inferior frontal gyrus | 0.0065 |
| Left frontal pole | Left posterior orbital gyrus | 0.0065 |
| Right occipital pole | Right planum temporale | 0.0069 |
| Right putamen | Right medial orbital gyrus | 0.0073 |
| Left amygdala | Right medial frontal cortex | 0.0079 |
| Right middle temporal gyrus | Left temporal pole | 0.0081 |
| Non-Mathematicians > Mathematicians | ||
| Left lateral orbital gyrus (LOrG) | Right precuneus (Pcun) | 0.000 |
| Right thalamus (Th) | Right lateral orbital gyrus (LOrG) | 0.0007 |
| Left thalamus (Th) | Right lateral orbital gyrus (LOrG) | 0.0011 |
| Right middle occipital gyrus (MOG) | Right supplementary motor cortex (SMC) | 0.0017 |
| Right middle occipital gyrus (MOG) | Left middle occipital gyrus (MOG) | 0.0021 |
| Left gyrus rectus (GRe) | Right precuneus (Pcun) | 0.0027 |
| Right postcentral gyrus (PcG) | Right superior occipital gyrus (SOG) | 0.0031 |
| Right medial frontal cortex (MFC) | Right precuneus (Pcun) | 0.0033 |
| Right caudate nucleus (CN) | Right planum temporale (PT) | 0.0037 |
| Left medial frontal cortex (MFC) | Right precuneus (Pcun) | 0.0041 |
| Right ventral diencephalon | Right fusiform gyrus | 0.0050 |
| Right caudate nucleus | Left middle cingulate gyrus | 0.0053 |
| Left lateral orbital gyrus | Left precuneus | 0.0061 |
| Right caudate nucleus | Left anterior insula | 0.0067 |
| Right lingual gyrus | Left lingual gyrus | 0.0067 |
| Left precentral gyrus | Left middle temporal gyrus | 0.0069 |
| Left inferior temporal gyrus | Left precentral gyrus | 0.0069 |
| Left ventral diencephalon | Right fusiform gyrus | 0.0075 |
| Right gyrus rectus | Right precuneus | 0.0081 |
| Right hippocampus | Right inferior occipital gyrus | 0.0089 |
| Right caudate nucleus | Right supramarginal gyrus | 0.0091 |
| Right caudate nucleus | Left caudate nucleus | 0.0093 |
| Right calcarine cortex | Right lingual gyrus | 0.0099 |
| Right frontal pole | Right posterior orbital gyrus | 0.0099 |
Publisher’s Note: MDPI stays neutral with regard to jurisdictional claims in published maps and institutional affiliations. |
© 2021 by the authors. Licensee MDPI, Basel, Switzerland. This article is an open access article distributed under the terms and conditions of the Creative Commons Attribution (CC BY) license (http://creativecommons.org/licenses/by/4.0/).
Share and Cite
MDPI and ACS Style
Shim, M.; Hwang, H.-J.; Kuhl, U.; Jeon, H.-A. Resting-State Functional Connectivity in Mathematical Expertise. Brain Sci. 2021, 11, 430. https://doi.org/10.3390/brainsci11040430
AMA Style
Shim M, Hwang H-J, Kuhl U, Jeon H-A. Resting-State Functional Connectivity in Mathematical Expertise. Brain Sciences. 2021; 11(4):430. https://doi.org/10.3390/brainsci11040430
Chicago/Turabian StyleShim, Miseon, Han-Jeong Hwang, Ulrike Kuhl, and Hyeon-Ae Jeon. 2021. "Resting-State Functional Connectivity in Mathematical Expertise" Brain Sciences 11, no. 4: 430. https://doi.org/10.3390/brainsci11040430
Note that from the first issue of 2016, this journal uses article numbers instead of page numbers. See further details here.