The Increased Densities, But Different Distributions, of Both C3 and S100A10 Immunopositive Astrocyte-Like Cells in Alzheimer’s Disease Brains Suggest Possible Roles for Both A1 and A2 Astrocytes in the Disease Pathogenesis

 ,
, 
Abstract
:1. Introduction
2. Materials and Methods
2.1. Immunohistochemistry
2.2. Immunofluorescence
3. Results
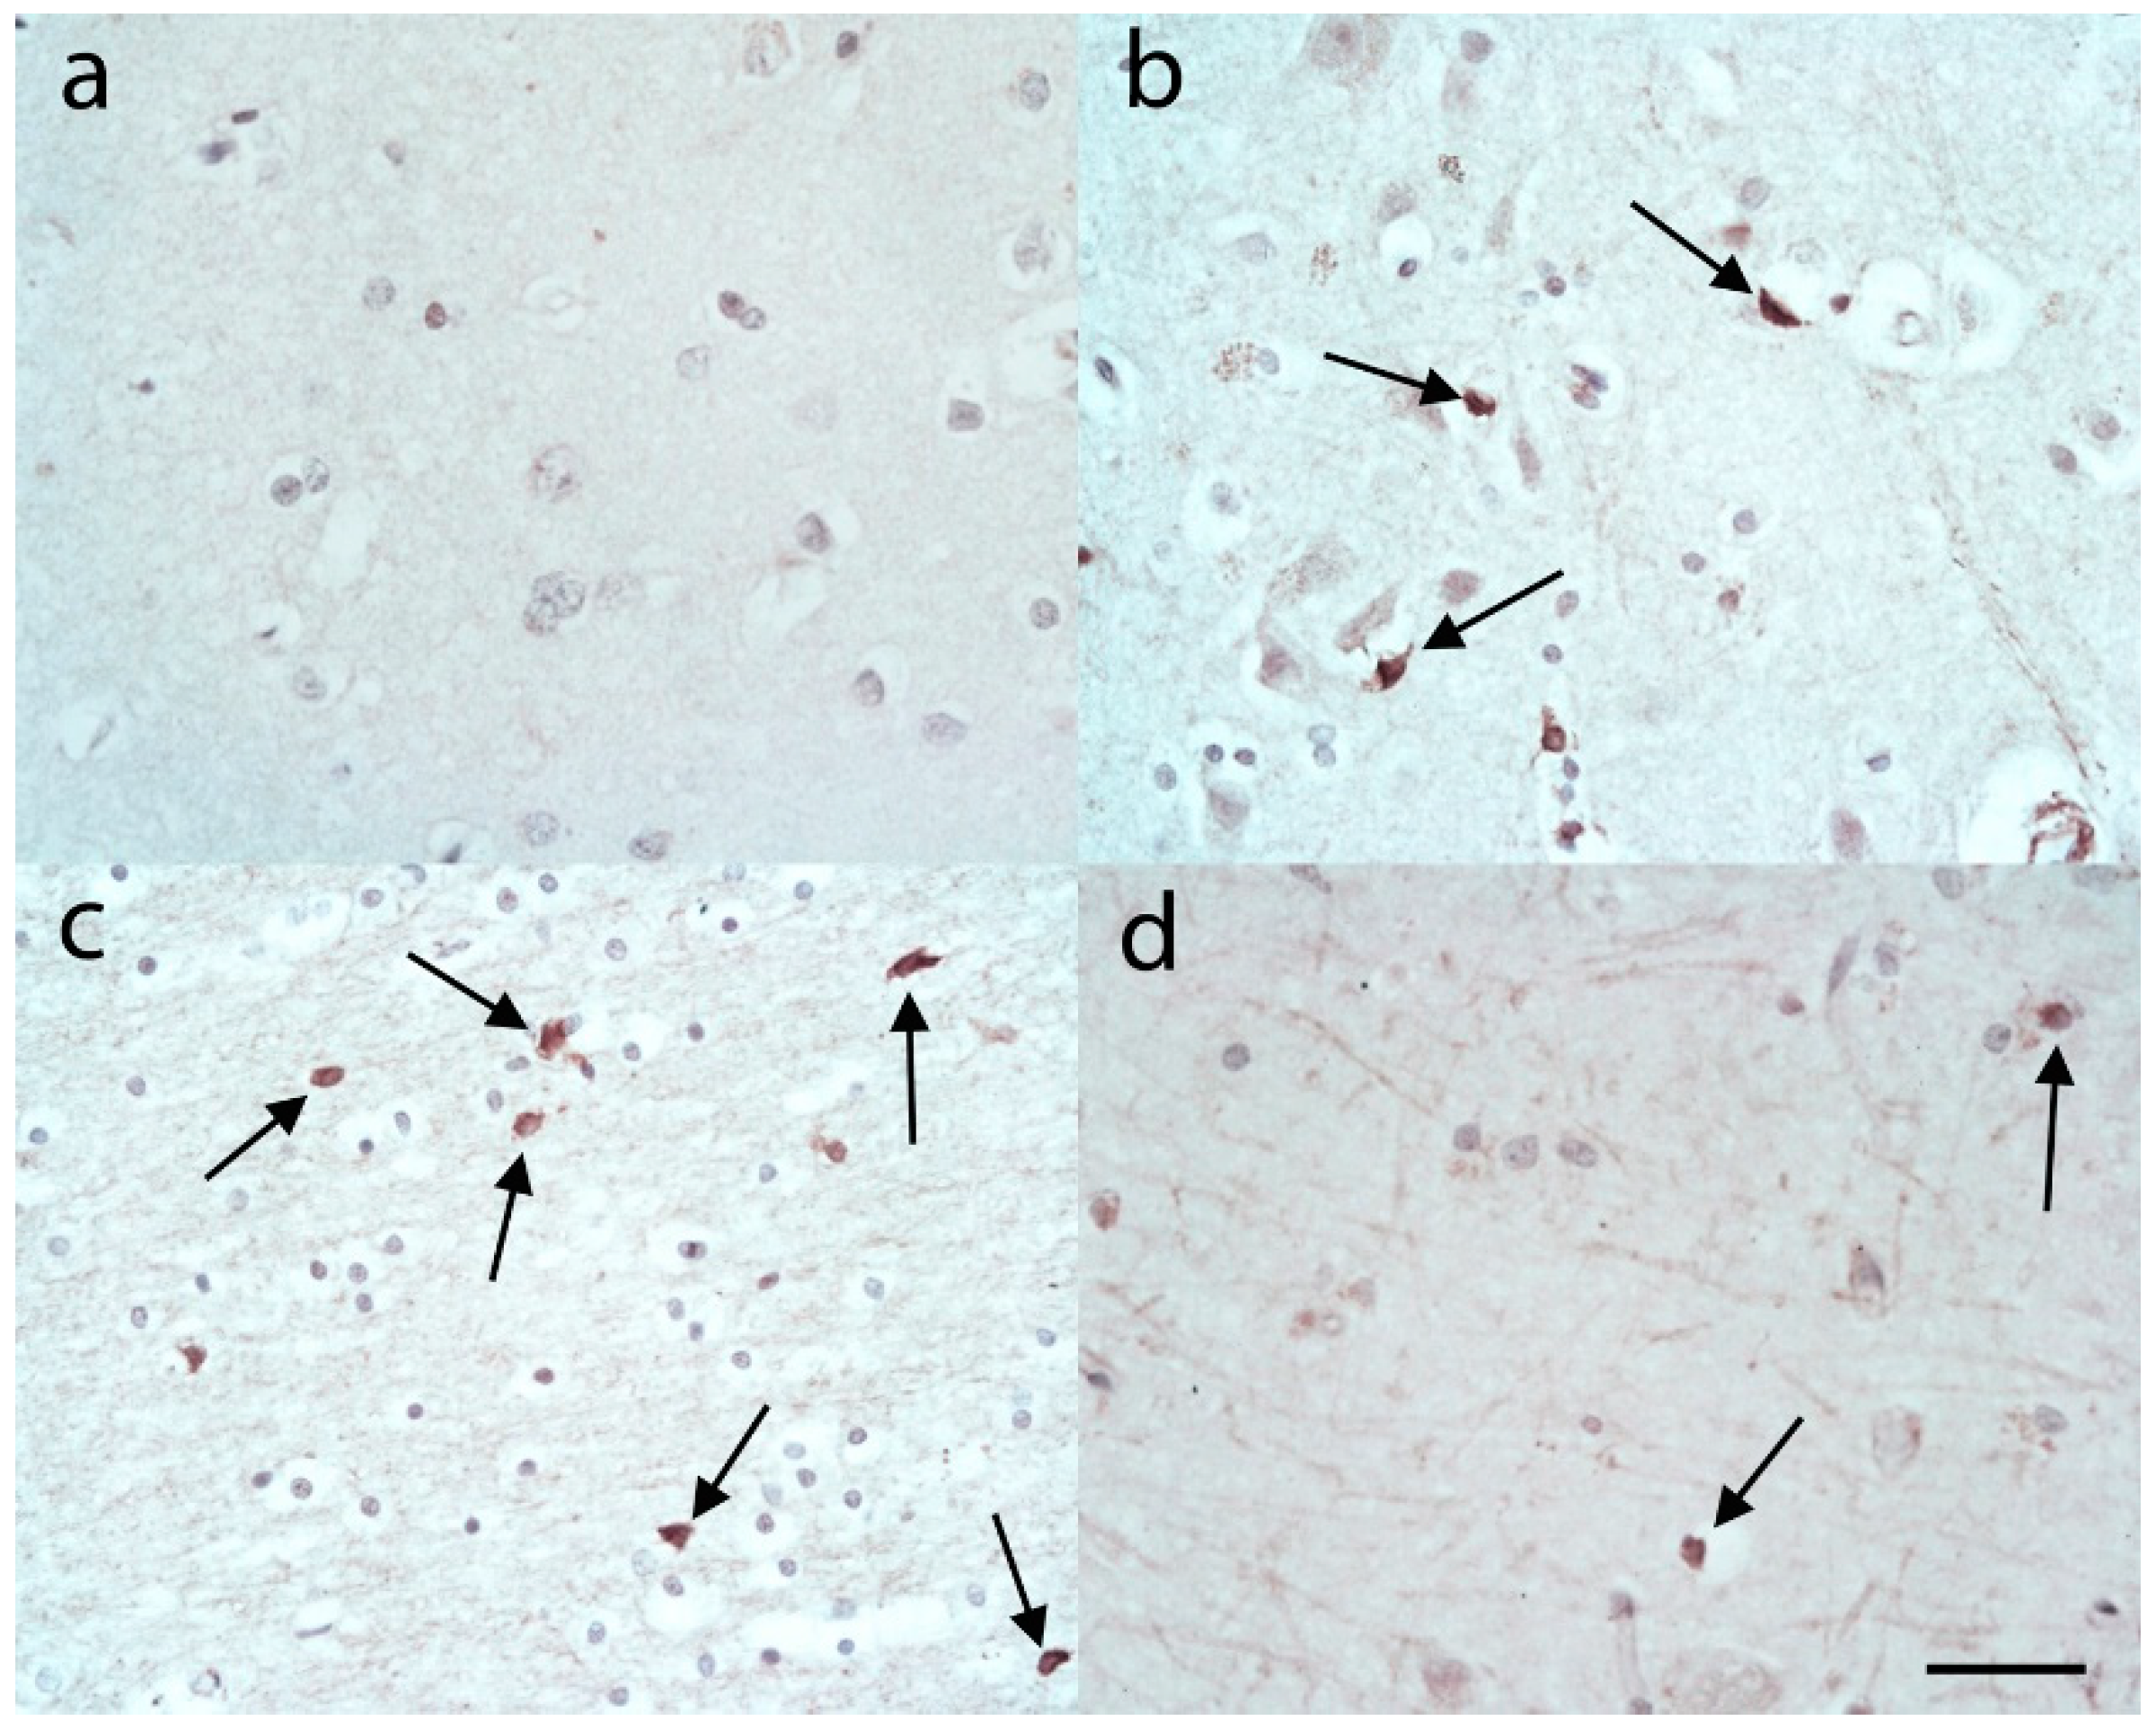
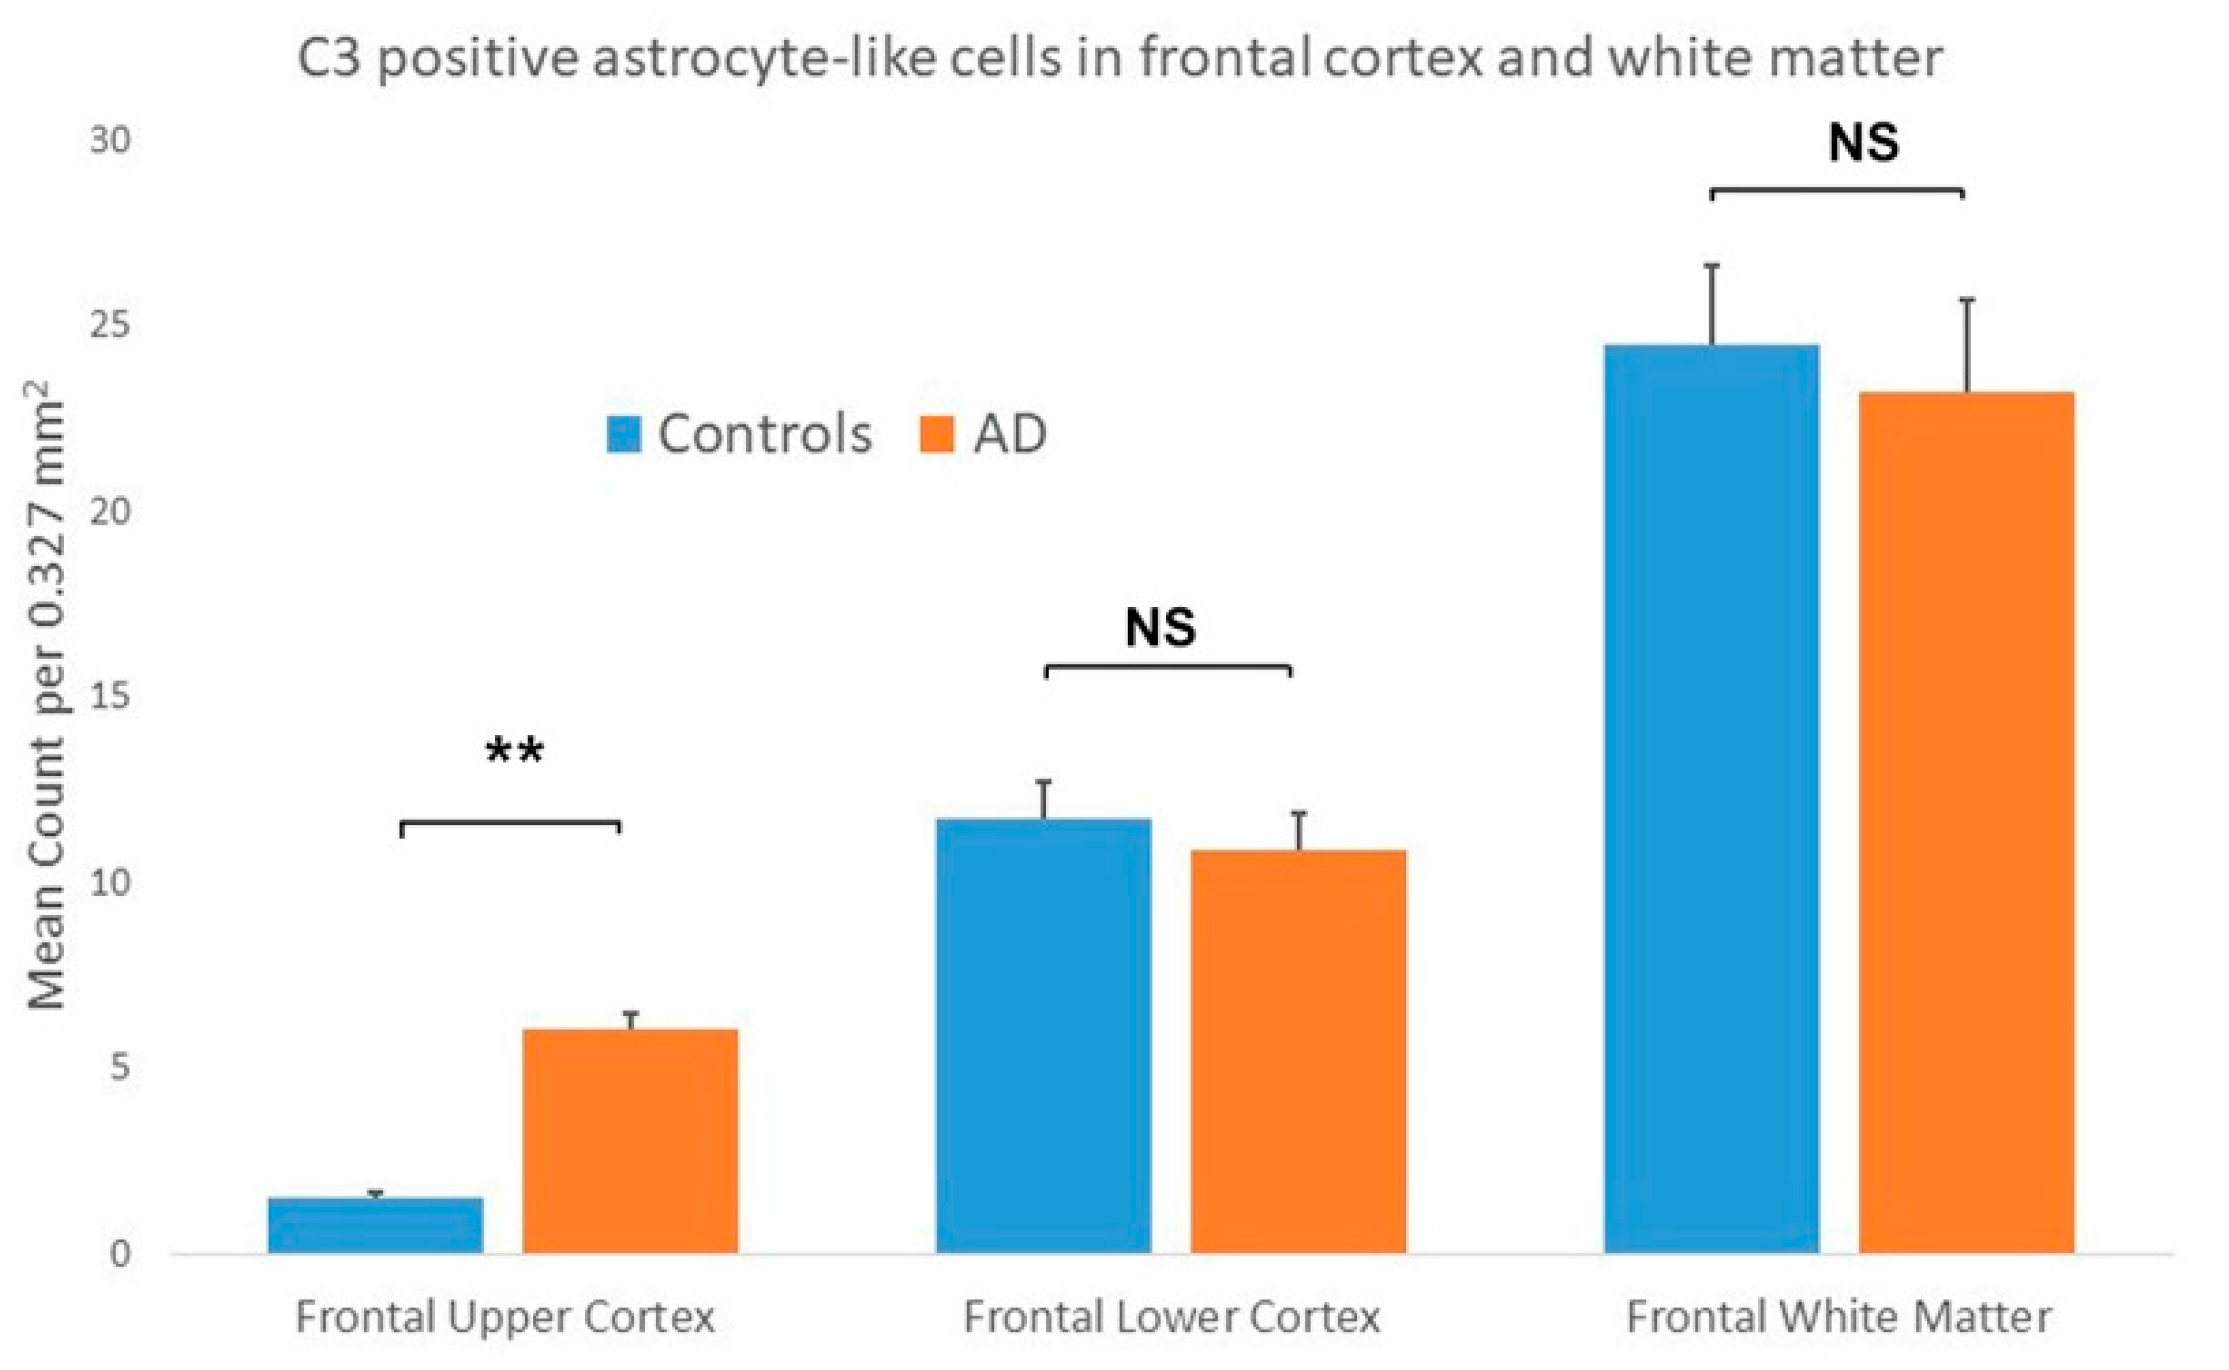
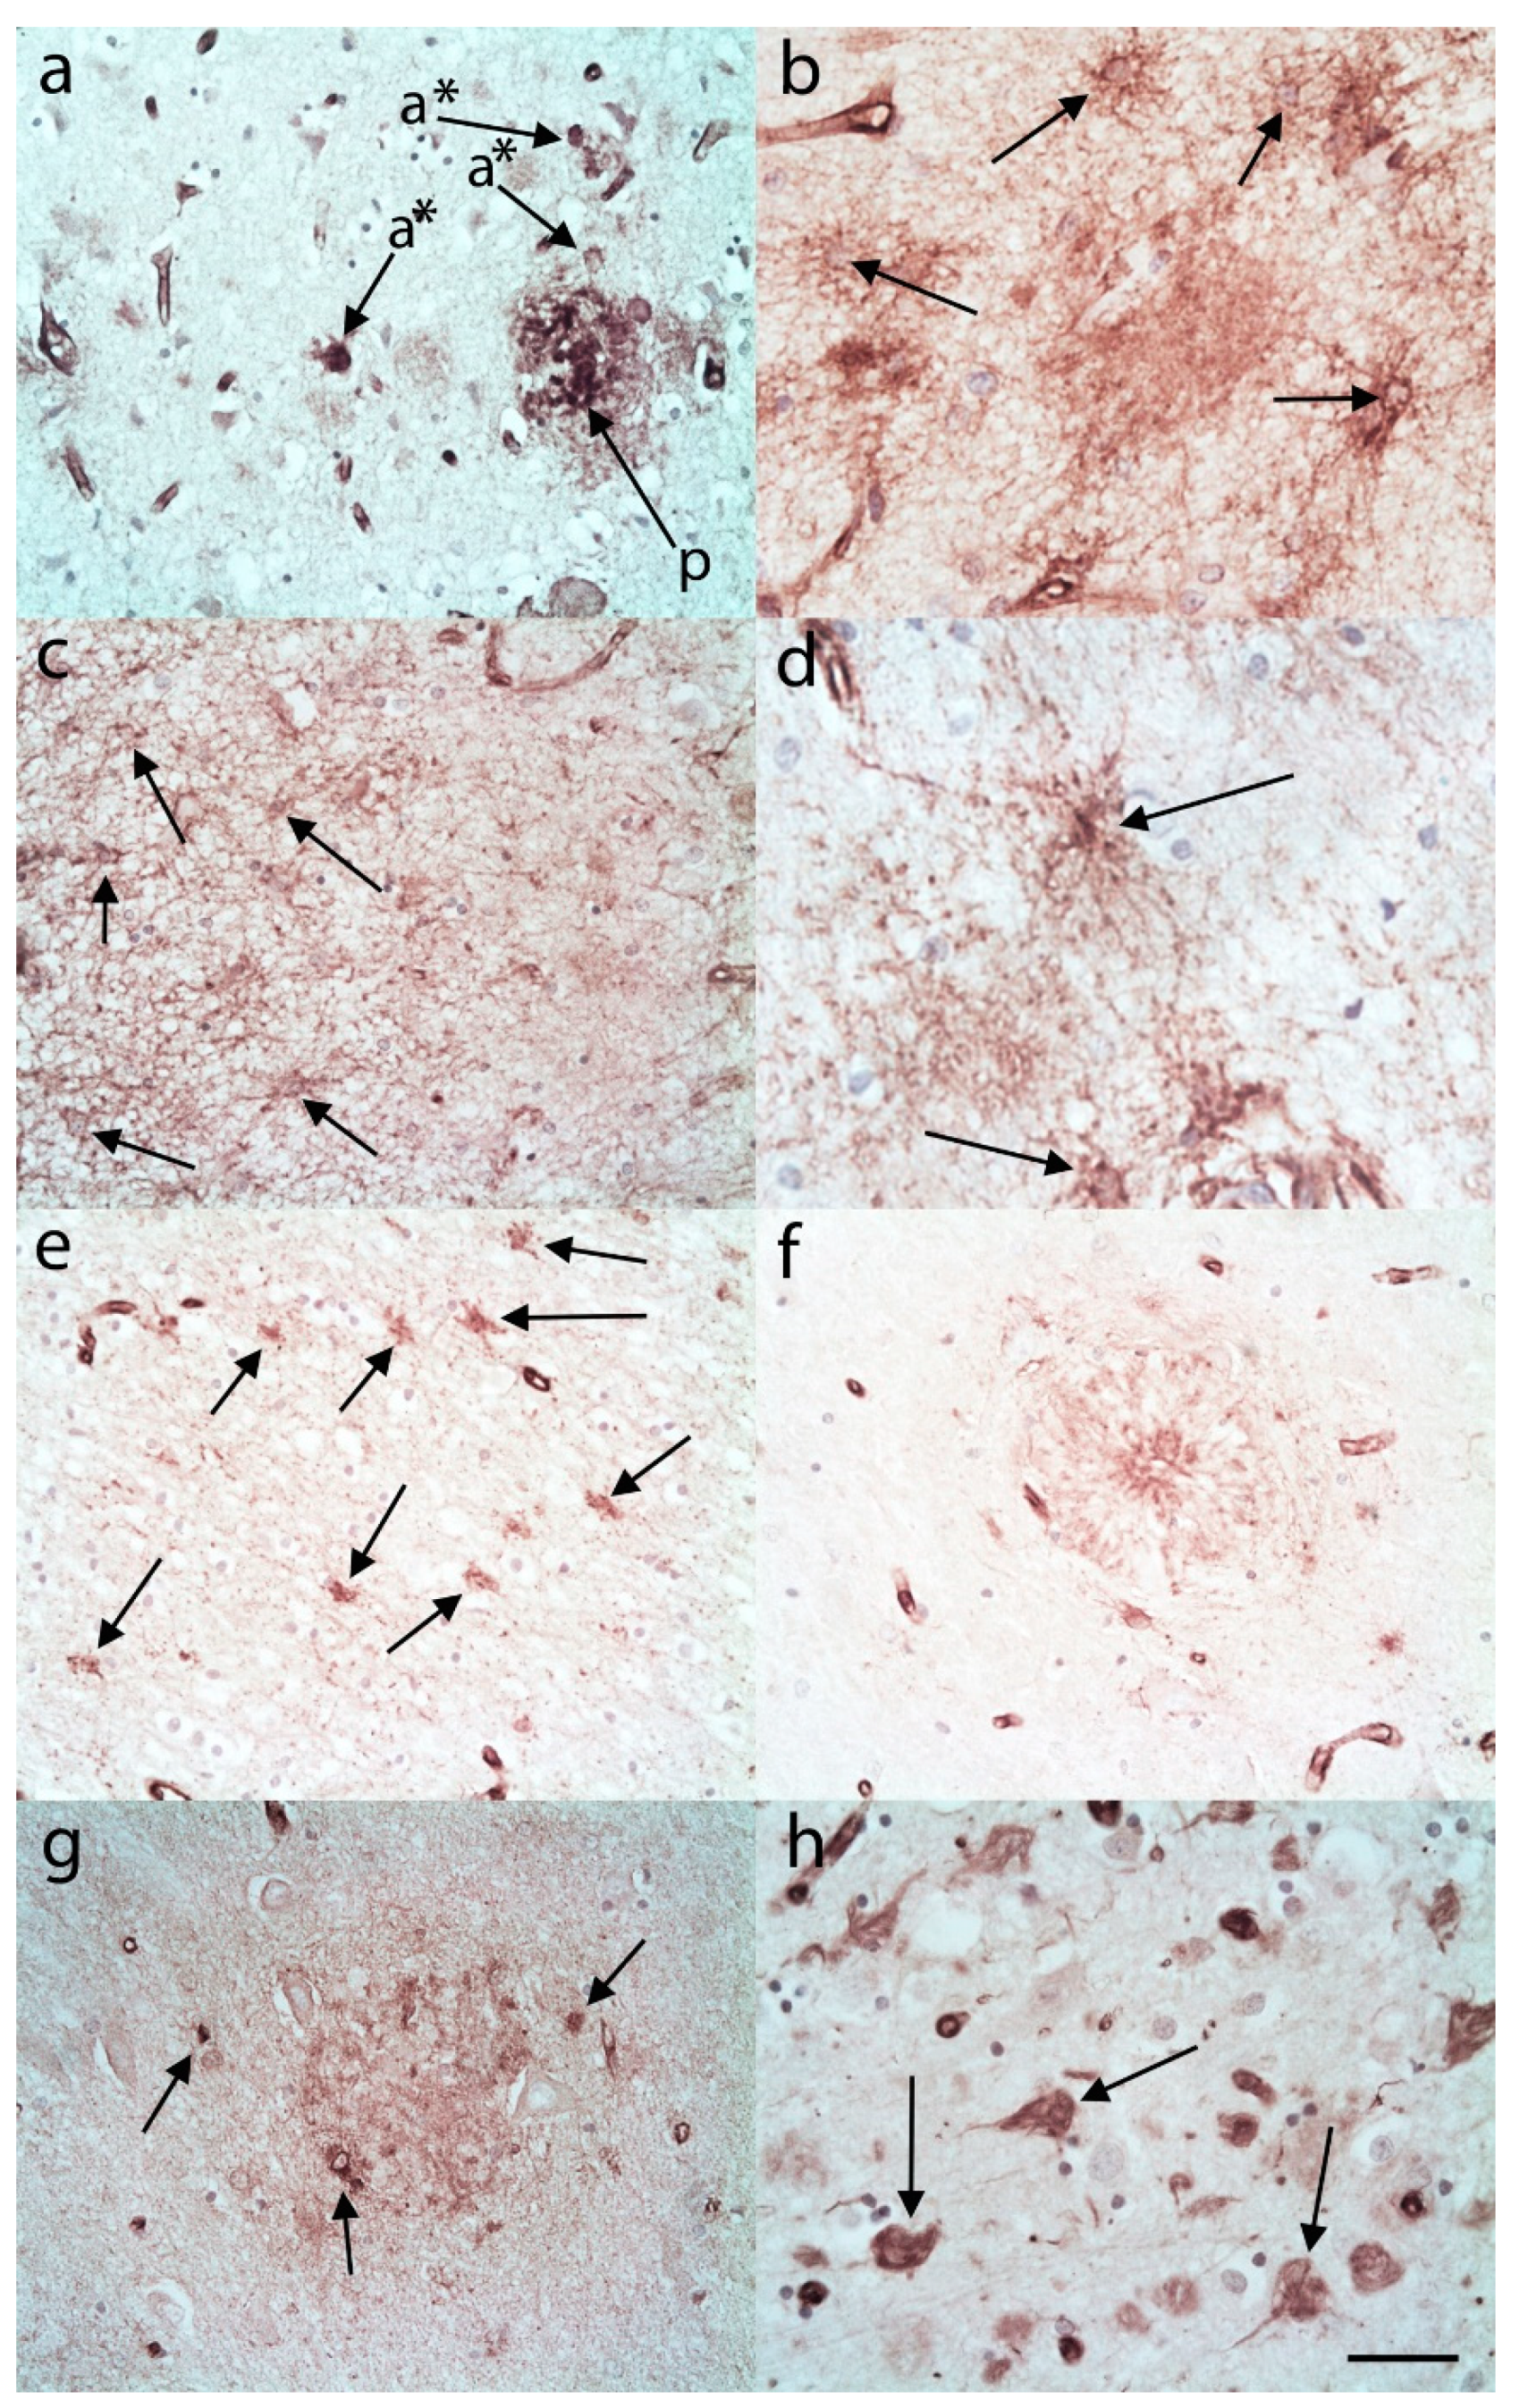
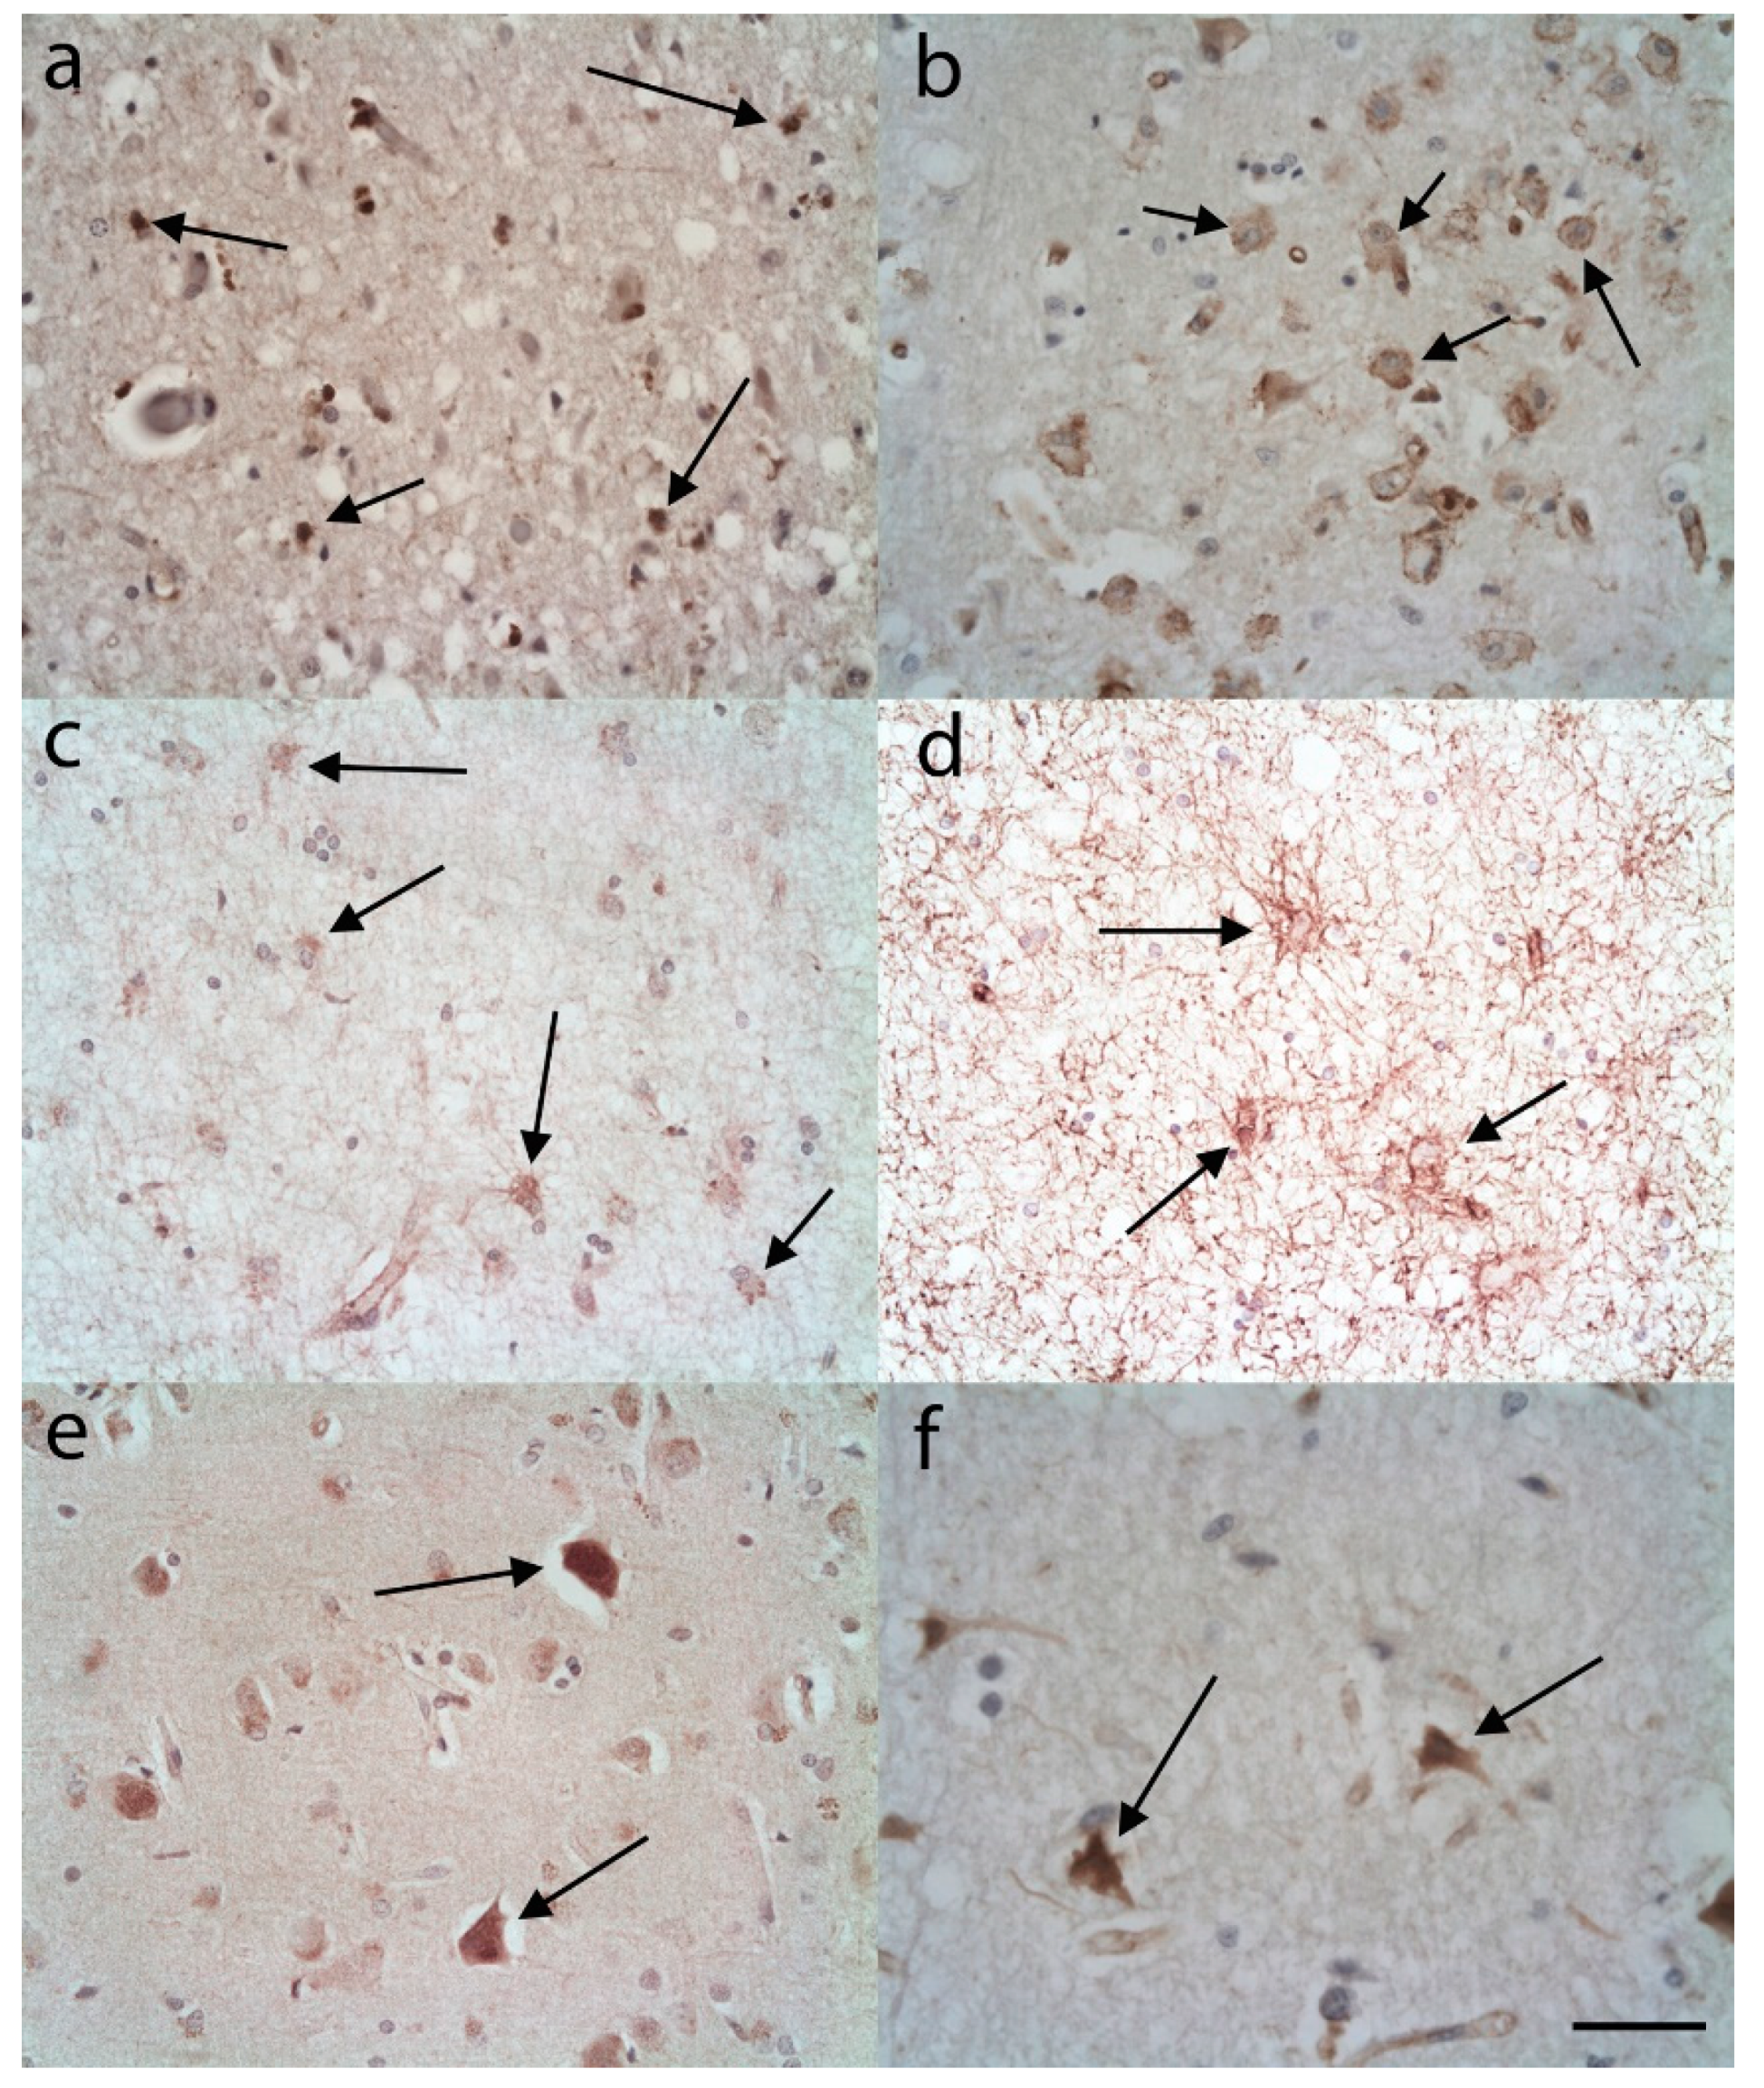
3.1. C3 Immunostaining
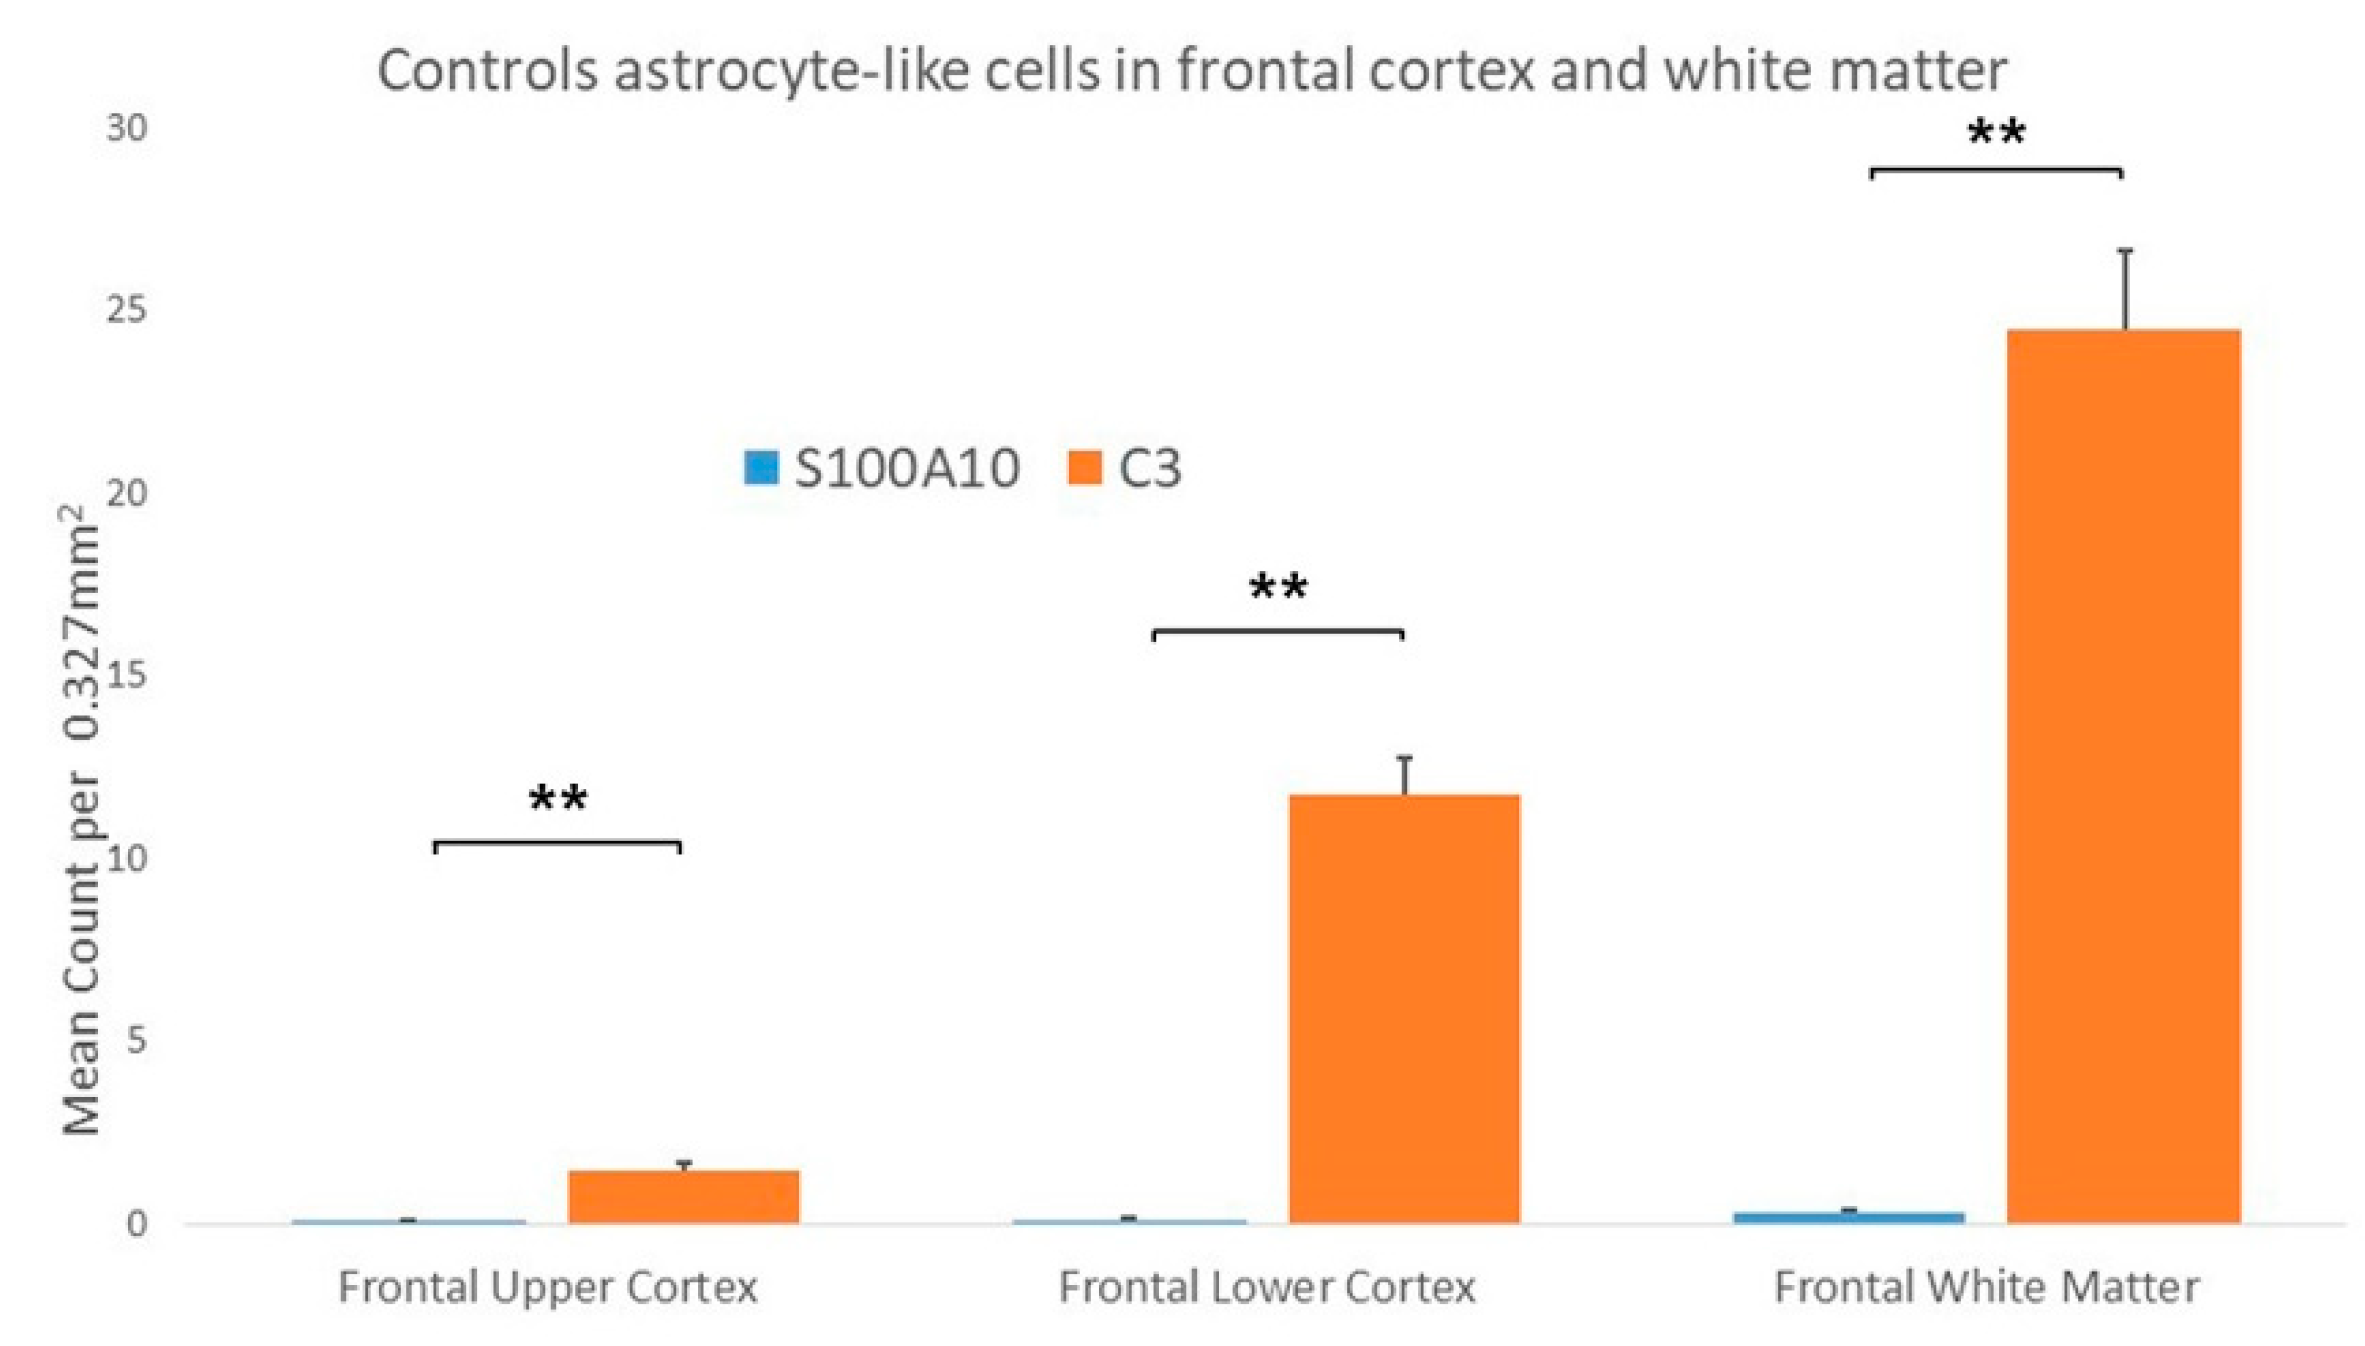
3.1.1. Controls
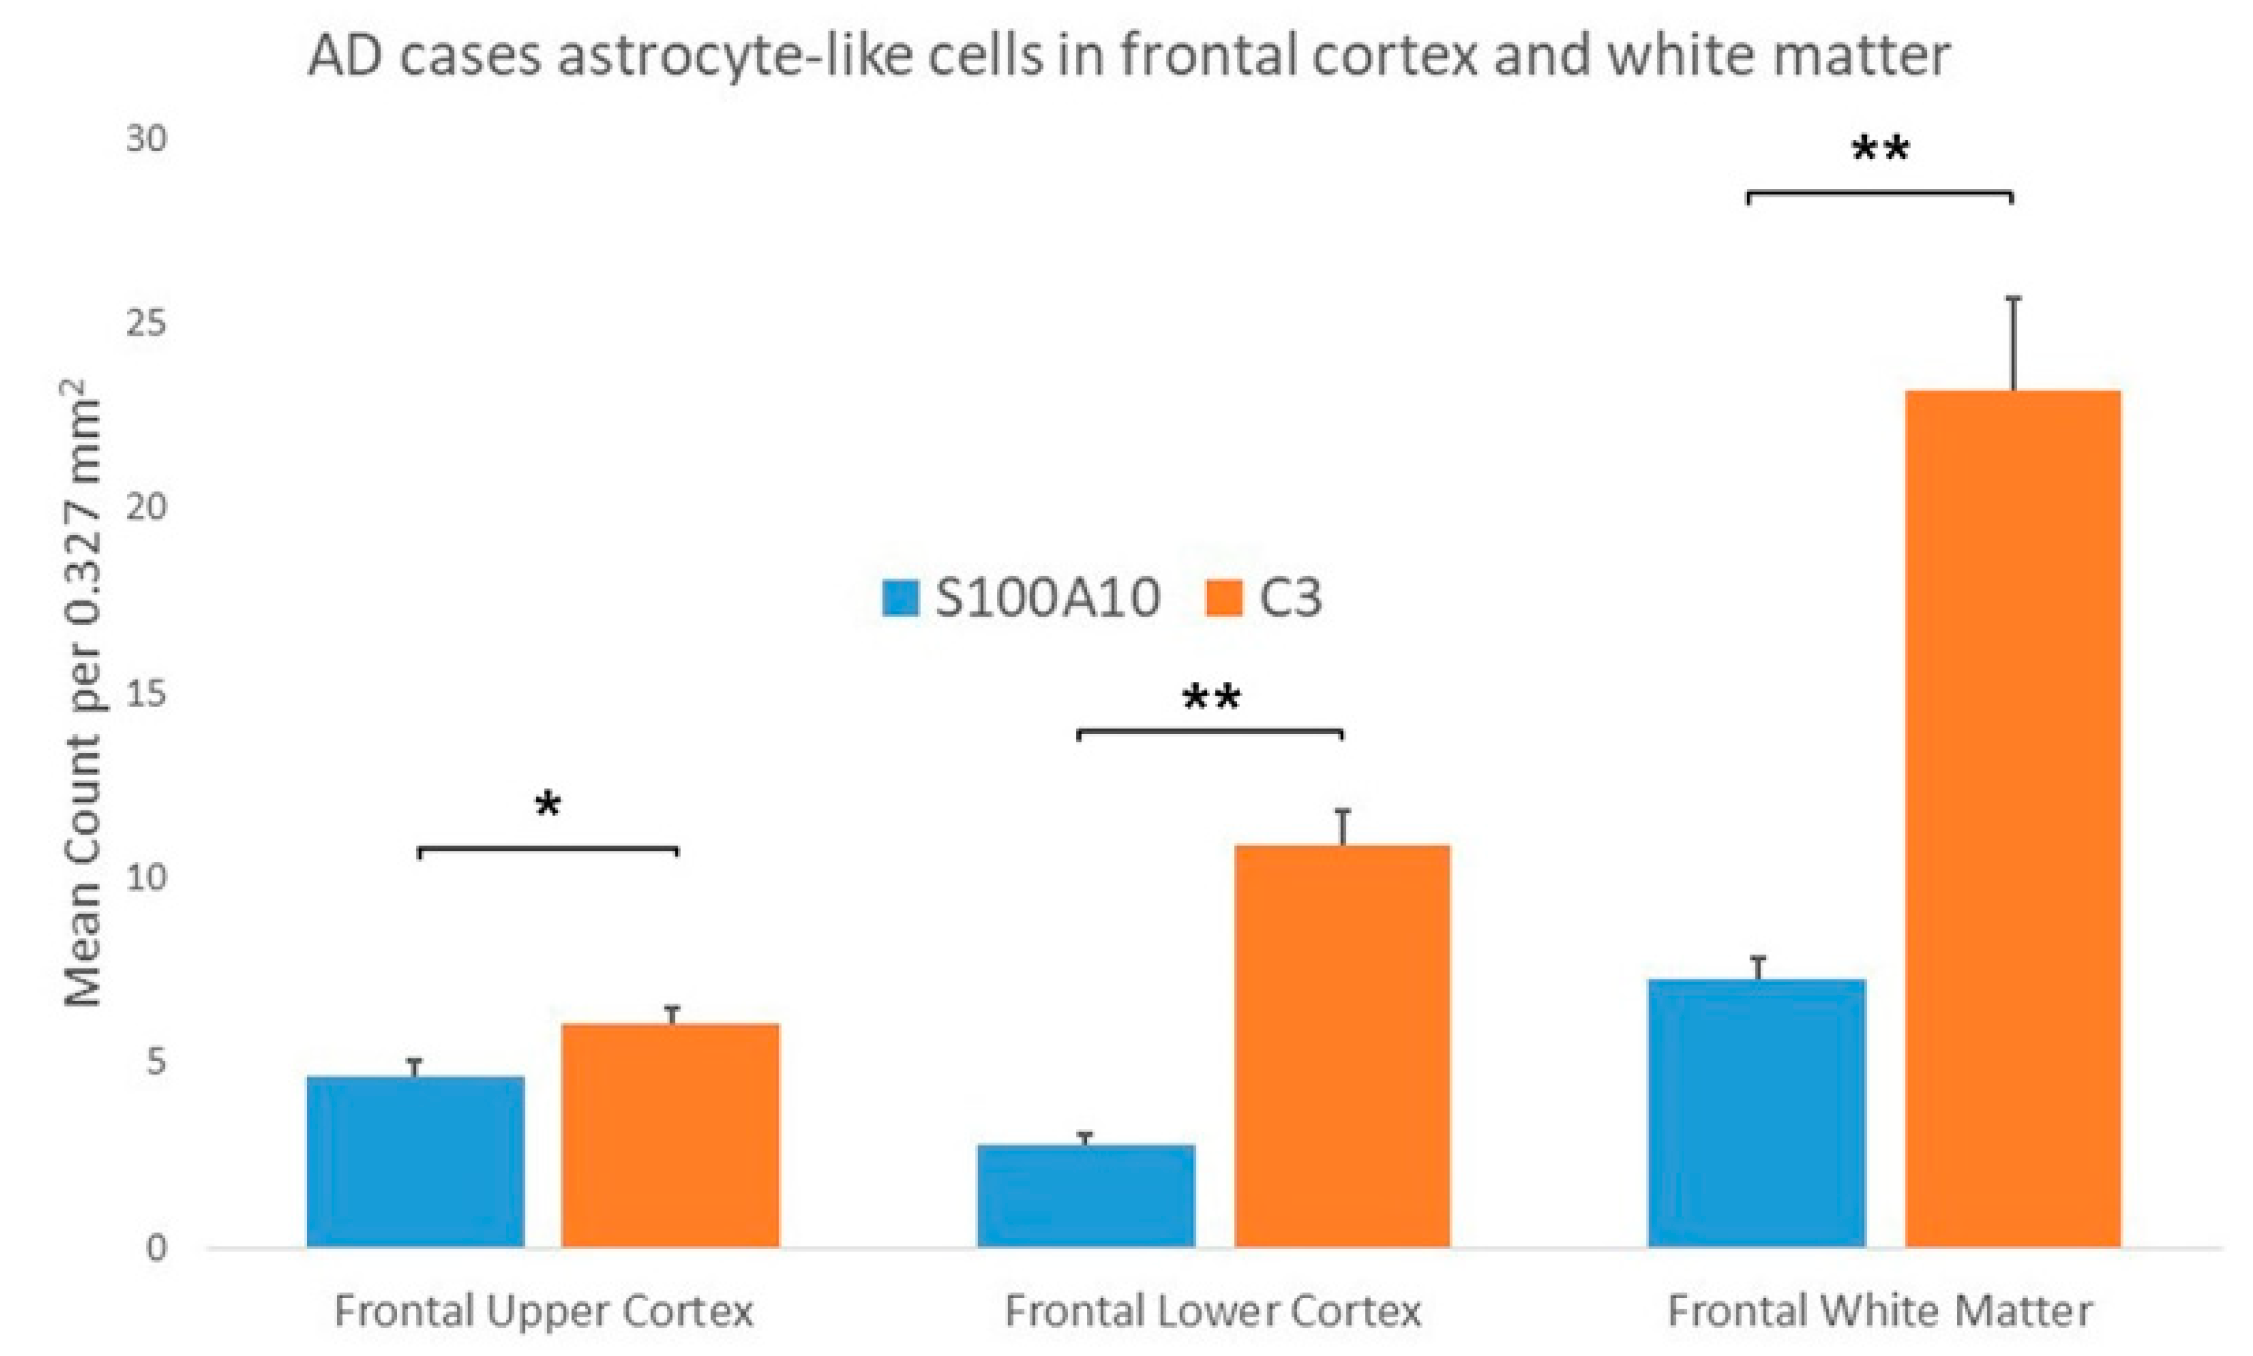
3.1.2. AD Cases
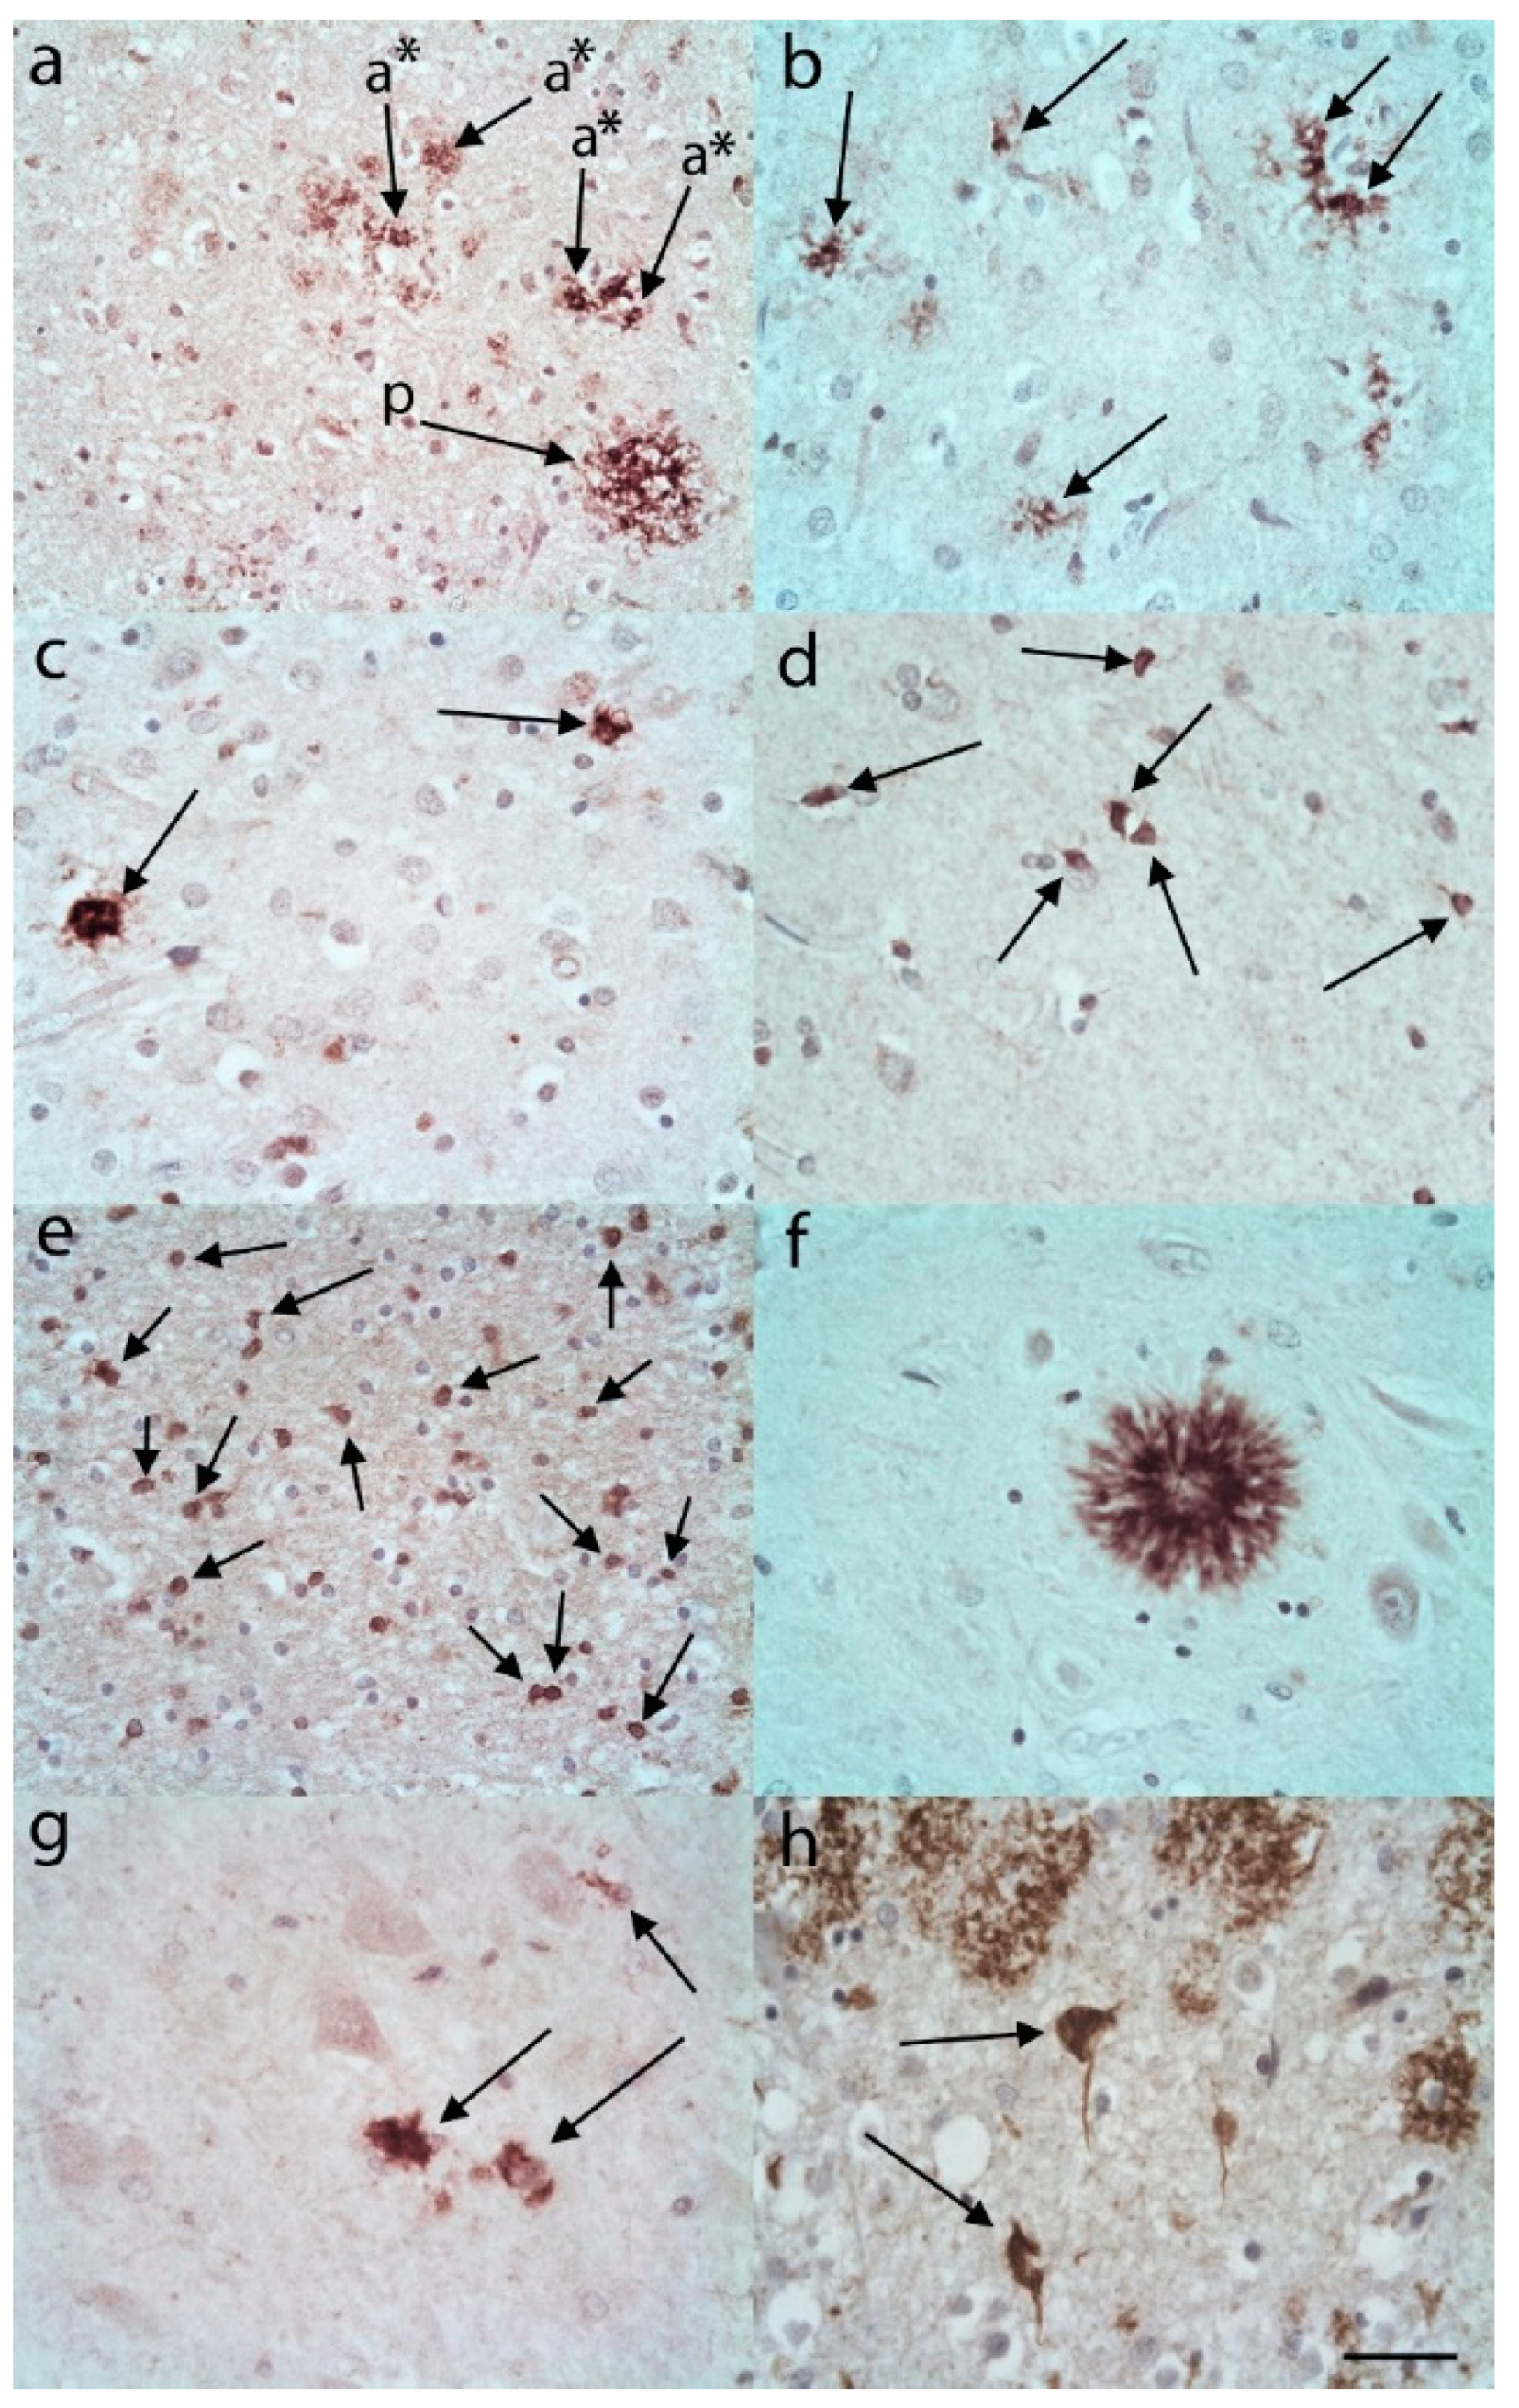
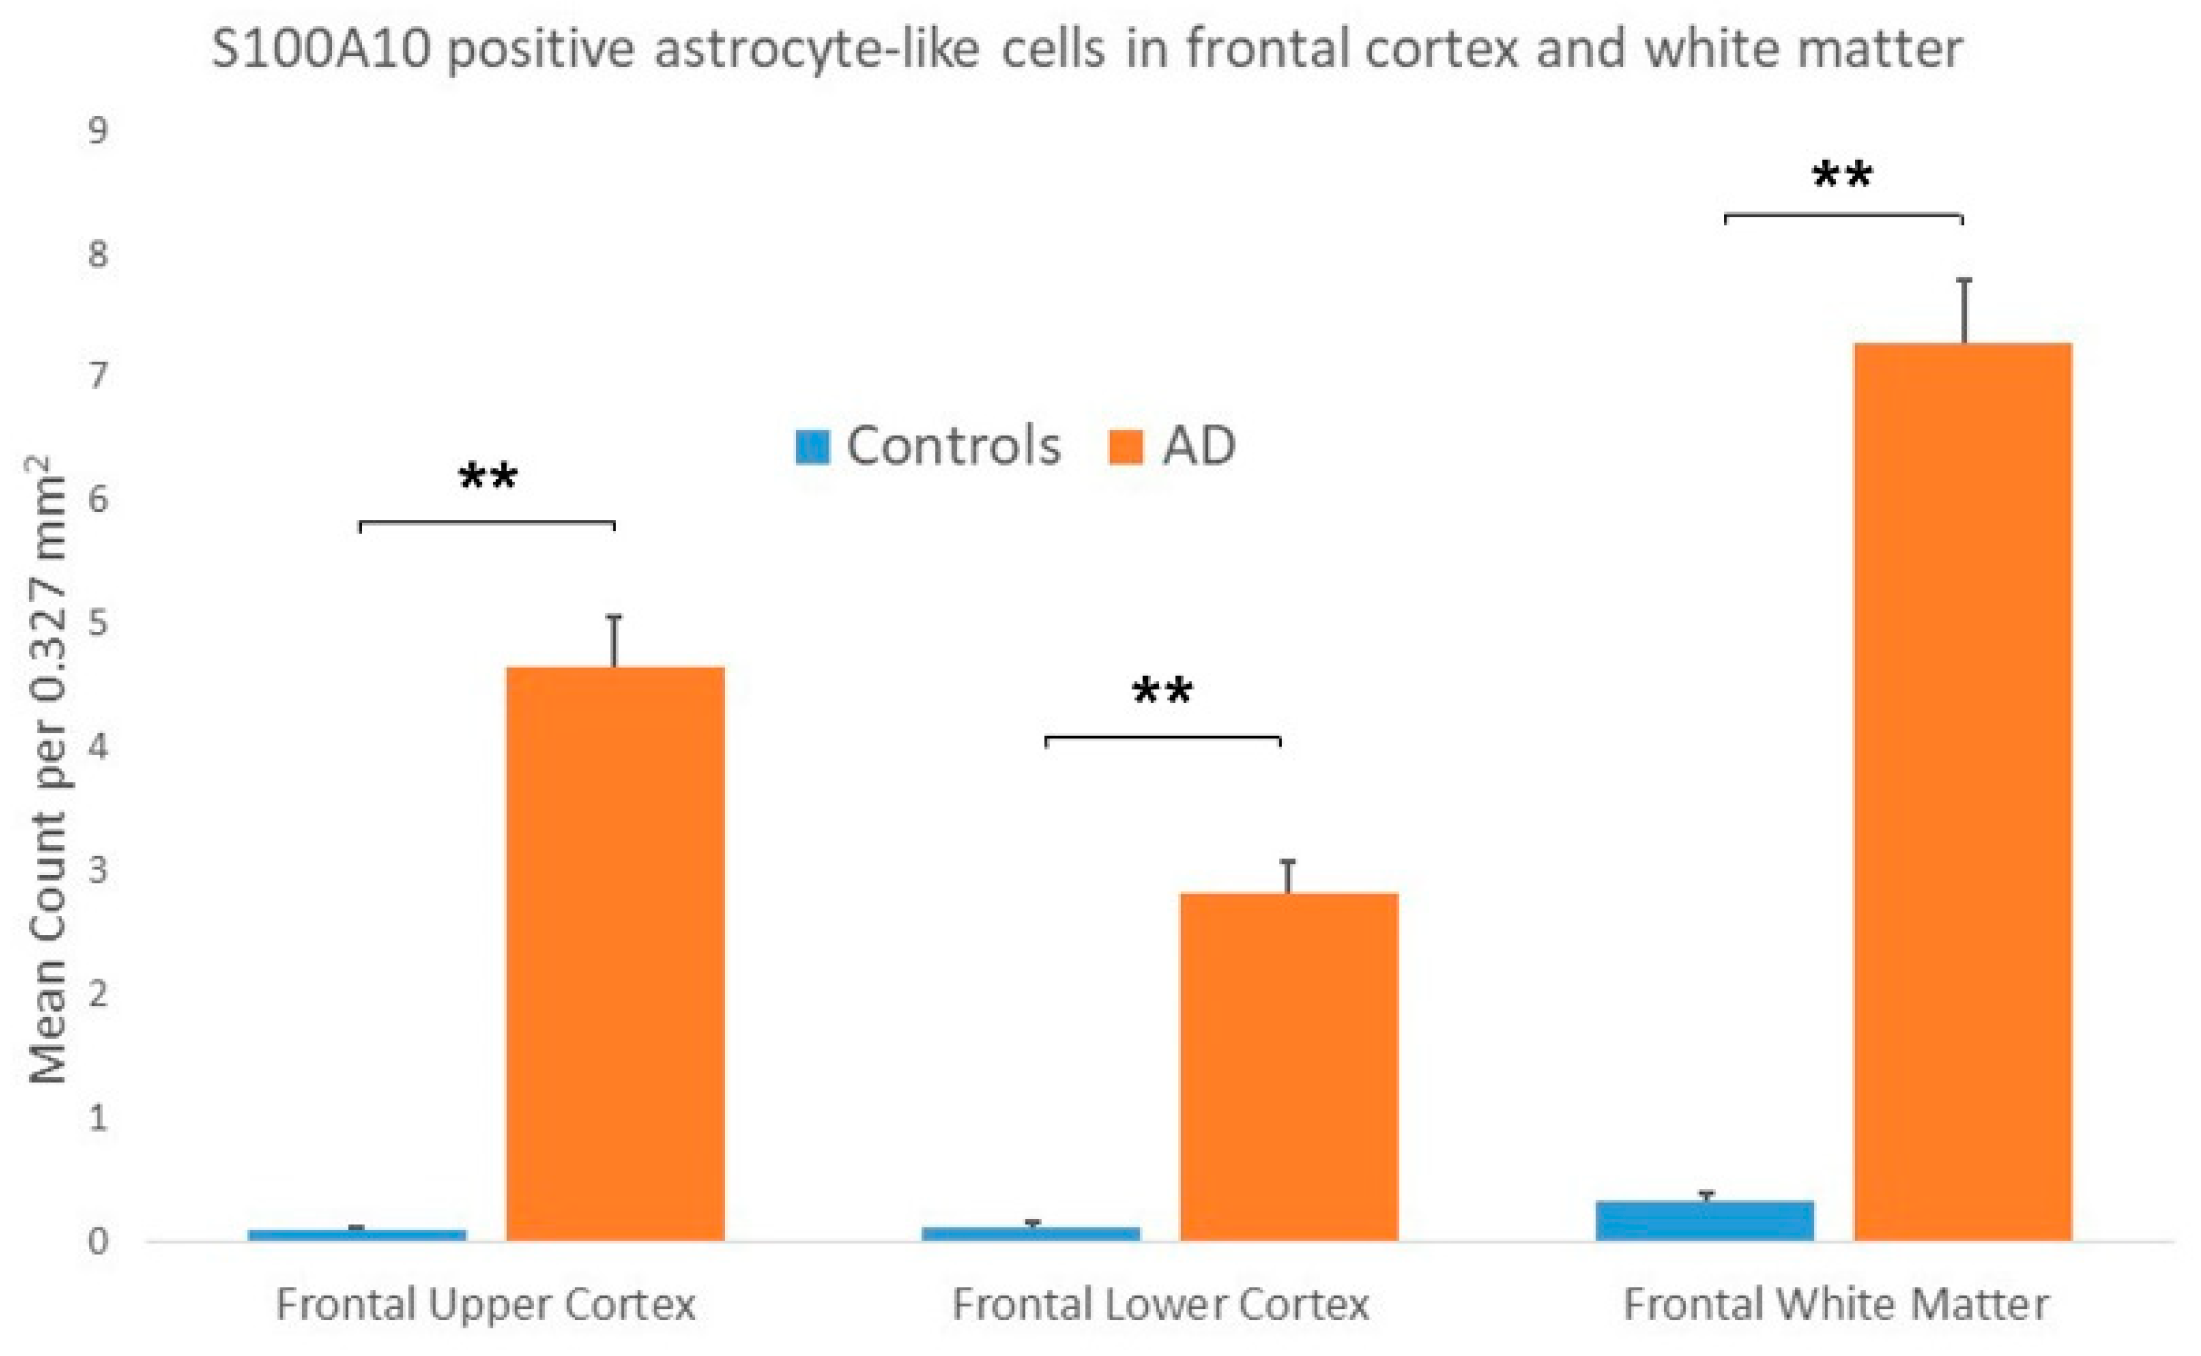
3.2. S100A10 Immunostaining
3.2.1. Controls
3.2.2. AD Cases
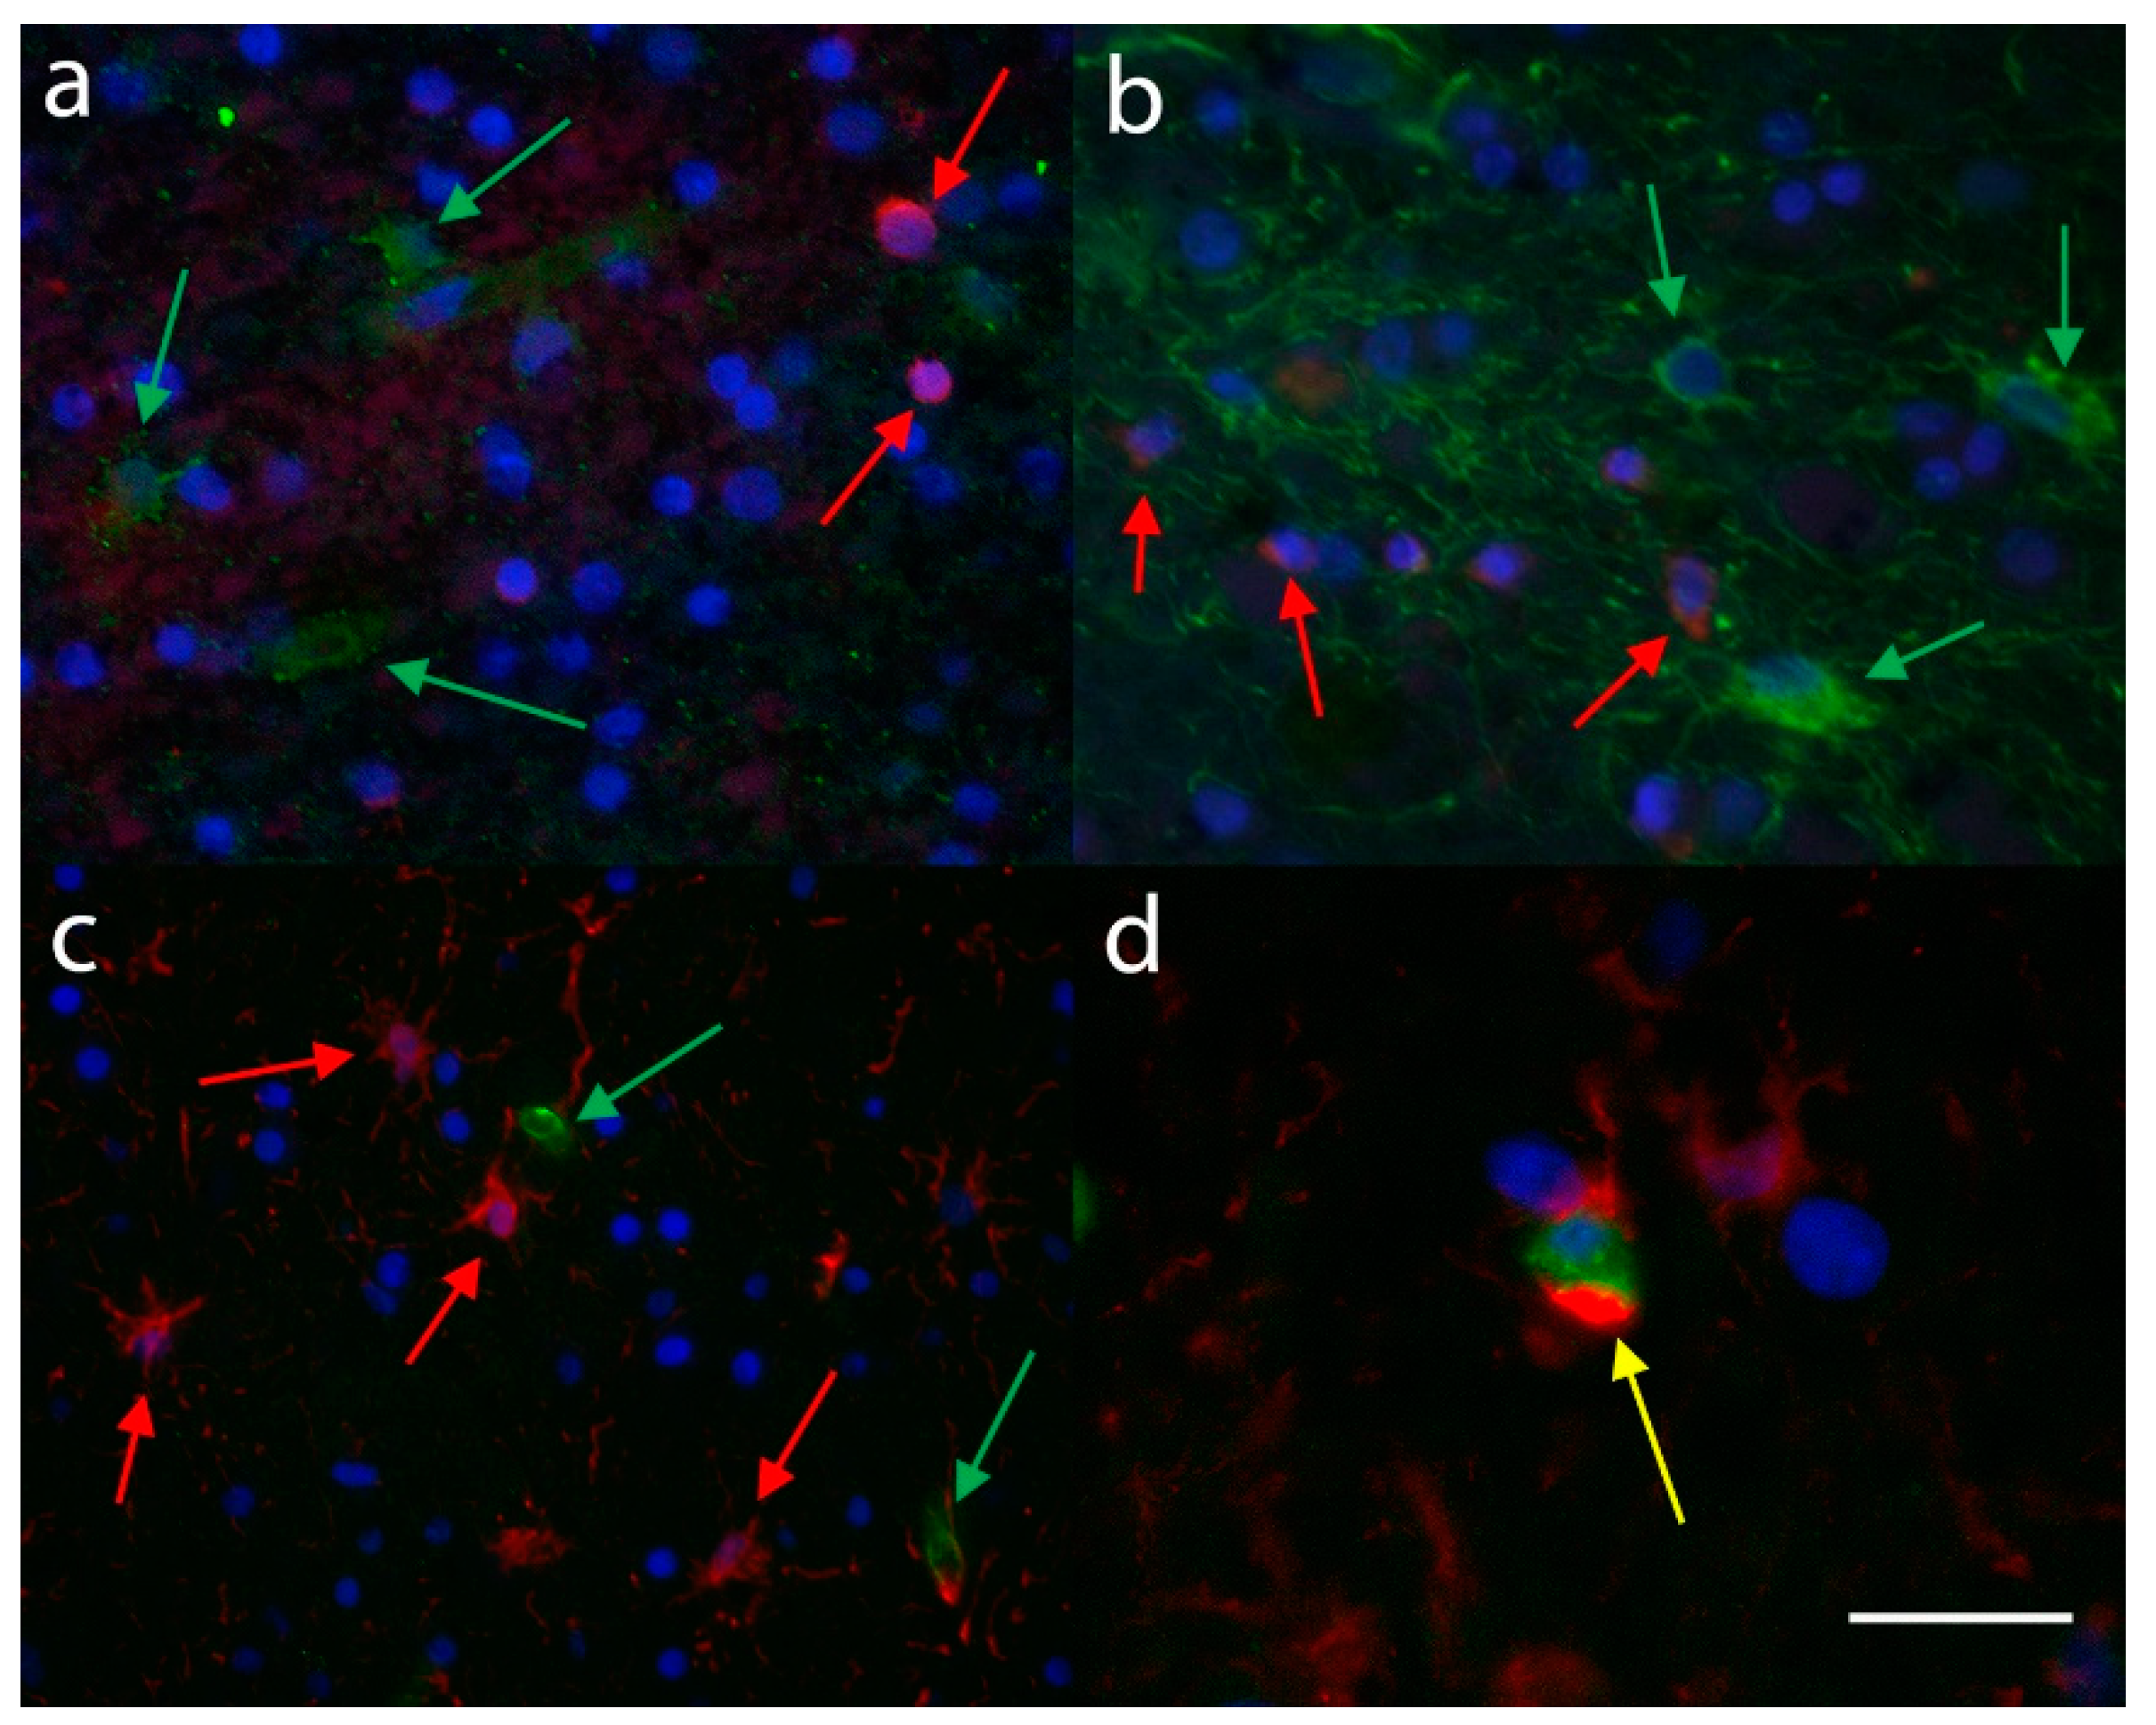
3.3. Immunofluorescence
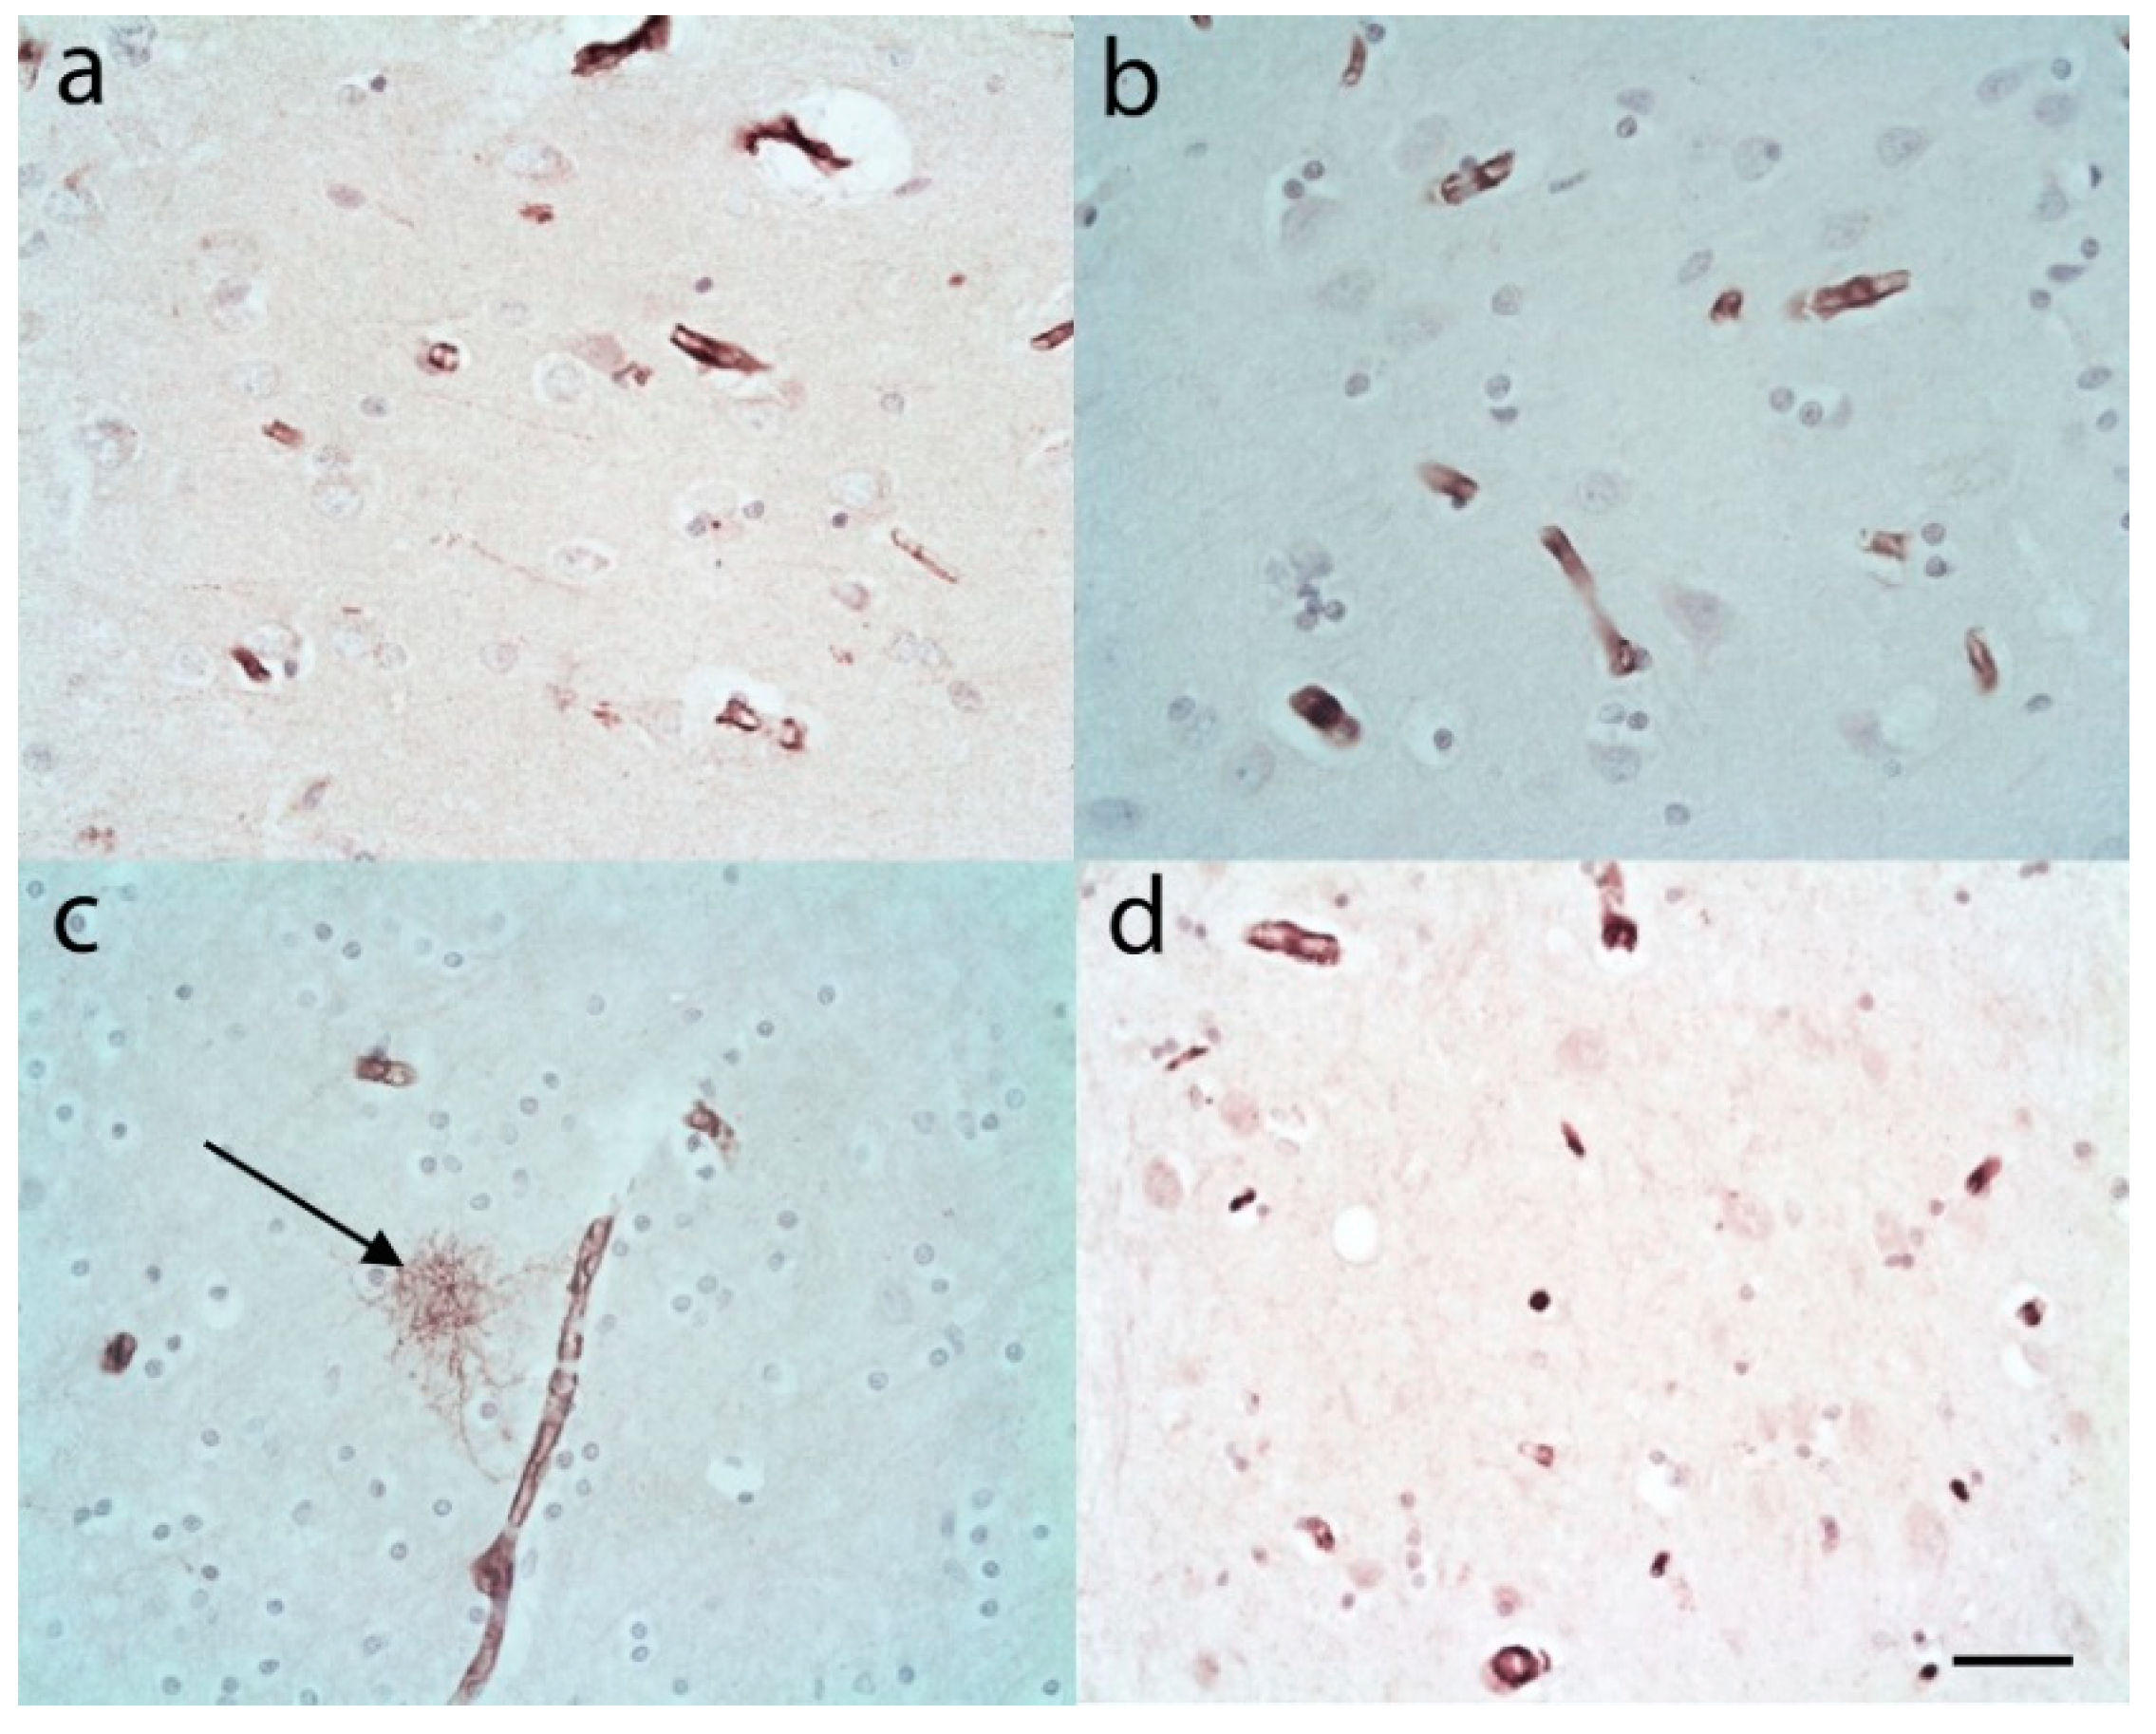
3.4. Infarction Cases
4. Discussion
5. Conclusions
Supplementary Materials
Author Contributions
Funding
Acknowledgments
Conflicts of Interest
References
- Alzheimer’s Disease International. World Alzheimer Report 2016; The London School of Economics and Political Sciences: London, UK, 2016. [Google Scholar]
- Henderson, A.S. The risk factors for Alzheimer’s disease: A review and a hypothesis. Acta Psychiatr. Scand. 1988, 78, 257–275. [Google Scholar] [CrossRef] [PubMed]
- Silva, M.V.F.; Loures, C.M.G.; Alves, L.C.V.; de Souza, L.C.; Borges, K.B.G.; Carvalho, M.D.G. Alzheimer’s disease: Risk factors and potentially protective measures. J. Biomed. Sci. 2019, 26, 33. [Google Scholar] [CrossRef] [PubMed] [Green Version]
- Armstrong, R. Risk factors for Alzheimer’s disease. Folia Neuropathol. 2019, 57, 87–105. [Google Scholar] [CrossRef] [PubMed] [Green Version]
- De Strooper, B.; Karran, E. The cellular phase of Alzheimer’s disease. Cell 2016, 164, 603–615. [Google Scholar] [CrossRef] [Green Version]
- Liddelow, S.A.; Barres, B.A. Reactive astrocytes: Production, function, and therapeutic potential. Immunity 2017, 46, 957–967. [Google Scholar] [CrossRef] [Green Version]
- Sofroniew, M.V.; Vinters, H.V. Astrocytes: Biology and pathology. Acta Neuropathol. 2010, 119, 7–35. [Google Scholar] [CrossRef] [Green Version]
- Perez-Nievas, B.G.; Serrano-Pozo, A. Deciphering the astrocyte reaction in Alzheimer’s disease. Front. Aging Neurosci. 2018, 10, 114. [Google Scholar] [CrossRef] [Green Version]
- Pra, I.; Armato, U.; Chiriani, A. Astrocytes’ role in Alzheimer’s disease neurodegeneration. In Astrocyte-Physiology and Pathology; Gentile, M., Ed.; IntechOpen: London, UK, 2018; pp. 119–137. [Google Scholar]
- Lent, R.; Azevedo, F.A.; Andrade-Moraes, C.H.; Pinto, A.V. How many neurons do you have? Some dogmas of quantitative neuroscience under revision. Eur. J. Neurosci. 2012, 35, 1–9. [Google Scholar] [CrossRef]
- Volterra, A.; Meldolesi, J. Astrocytes, from brain glue to communication elements: The revolution continues. Nat. Rev. Neurosci. 2005, 6, 626–640. [Google Scholar] [CrossRef]
- Frost, G.R.; Li, Y.M. The role of astrocytes in amyloid production and Alzheimer’s disease. Open Biol. 2017, 7. [Google Scholar] [CrossRef] [Green Version]
- Ugbode, C.; Hu, Y.; Whalley, B.; Peers, C.; Rattray, M.; Dallas, M.L. Astrocytic transporters in Alzheimer’s disease. Biochem. J. 2017, 474, 333–355. [Google Scholar] [CrossRef] [PubMed] [Green Version]
- Heneka, M.T.; Sastre, M.; Dumitrescu-Ozimek, L.; Dewachter, I.; Walter, J.; Klockgether, T.; Van Leuven, F. Focal glial activation coincides with increased BACE1 activation and precedes amyloid plaque deposition in APP[V717I] transgenic mice. J. Neuroinflammation 2005, 2, 22. [Google Scholar] [CrossRef] [PubMed] [Green Version]
- Simpson, J.E.; Ince, P.G.; Lace, G.; Forster, G.; Shaw, P.J.; Matthews, F.; Savva, G.; Brayne, C.; Wharton, S.B. Astrocyte phenotype in relation to Alzheimer-type pathology in the ageing brain. Neurobiol. Aging 2010, 31, 578–590. [Google Scholar] [CrossRef]
- Orre, M.; Kamphuis, W.; Osborn, L.M.; Jansen, A.H.P.; Kooijman, L.; Bossers, K.; Hol, E.M. Isolation of glia from Alzheimer’s mice reveals inflammation and dysfunction. Neurobiol. Aging 2014, 35, 2746–2760. [Google Scholar] [CrossRef]
- Mantovani, A.; Locati, M. Orchestration of macrophage polarization. Blood 2009, 114, 3135–3136. [Google Scholar] [CrossRef] [PubMed]
- Martinez, F.O.; Gordon, S. The M1 and M2 paradigm of macrophage activation: Time for reassessment. F1000Prime Rep. 2014, 6, 13. [Google Scholar] [CrossRef] [Green Version]
- Liddelow, S.A.; Guttenplan, K.A.; Clarke, L.E.; Bennett, F.C.; Bohlen, C.J.; Schirmer, L.; Bennett, M.L.; Munch, A.E.; Chung, W.S.; Peterson, T.C.; et al. Neurotoxic reactive astrocytes are induced by activated microglia. Nature 2017, 541, 481–487. [Google Scholar] [CrossRef]
- Alafuzoff, I.; Arzberger, T.; Al-Sarraj, S.; Bodi, I.; Bogdanovic, N.; Braak, H.; Bugiani, O.; Del-Tredici, K.; Ferrer, I.; Gelpi, E.; et al. Staging of neurofibrillary pathology in Alzheimer’s disease: A study of the BrainNet Europe Consortium. Brain Pathol. 2008, 18, 484–496. [Google Scholar] [CrossRef] [Green Version]
- Braak, H.; Braak, E. Neuropathological stageing of Alzheimer-related changes. Acta Neuropathol. 1991, 82, 239–259. [Google Scholar] [CrossRef]
- McKeith, I.G.; Dickson, D.W.; Lowe, J.; Emre, M.; O’Brien, J.T.; Feldman, H.; Cummings, J.; Duda, J.E.; Lippa, C.; Perry, E.K.; et al. Diagnosis and management of dementia with Lewy bodies: Third report of the DLB Consortium. Neurology 2005, 65, 1863–1872. [Google Scholar] [CrossRef] [Green Version]
- Bélanger, M.; Allaman, I.; Magistretti, P.J. Brain energy metabolism: Focus on astrocyte-neuron metabolic cooperation. Cell Metab. 2011, 14, 724–738. [Google Scholar] [CrossRef] [PubMed] [Green Version]
- Bordone, M.P.; Salman, M.M.; Titus, H.E.; Amini, E.; Andersen, J.V.; Chakraborti, B.; Diuba, A.V.; Dubouskaya, T.G.; Ehrke, E.; Espindola de Freitas, A.; et al. The energetic brain—A review from students to students. J. Neurochem. 2019, 151, 139–165. [Google Scholar] [CrossRef] [PubMed]
- Hardy, J.; Allsop, D. Amyloid deposition as the central event in the aetiology of Alzheimer’s disease. Trends Pharmacol. Sci. 1991, 12, 383–388. [Google Scholar] [CrossRef]
- Ransohoff, R.M. A polarizing question: Do M1 and M2 microglia exist? Nat. Neurosci. 2016, 19, 987–991. [Google Scholar] [CrossRef]
- Clark, D.P.Q.; Perreau, V.M.; Shultz, S.R.; Brady, R.D.; Lei, E.; Dixit, S.; Taylor, J.M.; Beart, P.M.; Boon, W.C. Inflammation in traumatic brain injury: Roles for toxic A1 astrocytes and microglial-astrocytic crosstalk. Neurochem. Res. 2019, 44, 1410–1424. [Google Scholar] [CrossRef]
- Clarke, L.E.; Liddelow, S.A.; Chakraborty, C.; Munch, A.E.; Heiman, M.; Barres, B.A. Normal aging induces A1-like astrocyte reactivity. Proc. Natl. Acad. Sci. USA 2018, 115, E1896–E1905. [Google Scholar] [CrossRef] [PubMed] [Green Version]
- Yun, S.P.; Kam, T.I.; Panicker, N.; Kim, S.; Oh, Y.; Park, J.S.; Kwon, S.H.; Park, Y.J.; Karuppagounder, S.S.; Park, H.; et al. Block of A1 astrocyte conversion by microglia is neuroprotective in models of Parkinson’s disease. Nat. Med. 2018, 24, 931–938. [Google Scholar] [CrossRef]
- Hartmann, K.; Sepulveda-Falla, D.; Rose, I.V.L.; Madore, C.; Muth, C.; Matschke, J.; Butovsky, O.; Liddelow, S.; Glatzel, M.; Krasemann, S. Complement 3(+)-astrocytes are highly abundant in prion diseases, but their abolishment led to an accelerated disease course and early dysregulation of microglia. Acta Neuropathol. Commun. 2019, 7, 83. [Google Scholar] [CrossRef]
- Bertrand, E.; Lewandowska, E.; Szpak, G.M.; Hoogenraad, T.; Blaauwgers, H.G.; Czlonkowska, A.; Dymecki, J. Neuropathological analysis of pathological forms of astroglia in Wilson’s disease. Folia Neuropathol. 2001, 39, 73–79. [Google Scholar]
- Tatsumi, K.; Isonishi, A.; Yamasaki, M.; Kawabe, Y.; Morita-Takemura, S.; Nakahara, K.; Terada, Y.; Shinjo, T.; Okuda, H.; Tanaka, T.; et al. Olig2-Lineage astrocytes: A distinct subtype of astrocytes that differs from GFAP astrocytes. Front. Neuroanat. 2018, 12, 8. [Google Scholar] [CrossRef] [Green Version]
- Xu, J. New insights into GFAP negative astrocytes in calbindin D28k Immunoreactive astrocytes. Brain Sci. 2018, 8, 143. [Google Scholar] [CrossRef] [PubMed] [Green Version]
- Nishiyama, A.; Yang, Z.; Butt, A. Astrocytes and NG2-glia: What’s in a name? J. Anat. 2005, 207, 687–693. [Google Scholar] [CrossRef] [PubMed]
- Zhang, Z.; Ma, Z.; Zou, W.; Guo, H.; Liu, M.; Ma, Y.; Zhang, L. The appropriate marker for astrocytes: Comparing the distribution and expression of three astrocytic markers in different mouse cerebral regions. Biomed. Res. Int. 2019, 2019, 9605265. [Google Scholar] [CrossRef]
- Ikeshima-Kataoka, H. Neuroimmunological implications of AQP4 in astrocytes. Int. J. Mol. Sci. 2016, 17, 1306. [Google Scholar] [CrossRef] [PubMed]
- Kitchen, P.; Salman, M.M.; Halsey, A.M.; Clarke-Bland, C.; MacDonald, J.A.; Ishida, H.; Vogel, H.J.; Almutiri, S.; Logan, A.; Kreida, S.; et al. Targeting aquaporin-4 subcellular localization to treat central nervous system edema. Cell 2020, 181, 784–799.e719. [Google Scholar] [CrossRef] [PubMed]
- Bayraktar, O.A.; Bartels, T.; Holmqvist, S.; Kleshchevnikov, V.; Martirosyan, A.; Polioudakis, D.; Ben Haim, L.; Young, A.M.H.; Batiuk, M.Y.; Prakash, K.; et al. Astrocyte layers in the mammalian cerebral cortex revealed by a single-cell in situ transcriptomic map. Nat. Neurosci. 2020, 23, 500–509. [Google Scholar] [CrossRef] [PubMed]
- Vigano, F.; Dimou, L. The heterogeneous nature of NG2-glia. Brain Res. 2016, 1638, 129–137. [Google Scholar] [CrossRef] [Green Version]
- Neal, M.; Luo, J.; Harischandra, D.S.; Gordon, R.; Sarkar, S.; Jin, H.; Anantharam, V.; Desaubry, L.; Kanthasamy, A.; Kanthasamy, A. Prokineticin-2 promotes chemotaxis and alternative A2 reactivity of astrocytes. Glia 2018, 66, 2137–2157. [Google Scholar] [CrossRef]
- Fujita, A.; Yamaguchi, H.; Yamasaki, R.; Cui, Y.; Matsuoka, Y.; Yamada, K.I.; Kira, J.I. Connexin 30 deficiency attenuates A2 astrocyte responses and induces severe neurodegeneration in a 1-methyl-4-phenyl-1,2,3,6-tetrahydropyridine hydrochloride Parkinson’s disease animal model. J. Neuroinflammation 2018, 15, 227. [Google Scholar] [CrossRef] [Green Version]
- Zhou, Y.; Shao, A.; Yao, Y.; Tu, S.; Deng, Y.; Zhang, J. Dual roles of astrocytes in plasticity and reconstruction after traumatic brain injury. Cell Commun. Signal. 2020, 18, 62. [Google Scholar] [CrossRef] [Green Version]


© 2020 by the authors. Licensee MDPI, Basel, Switzerland. This article is an open access article distributed under the terms and conditions of the Creative Commons Attribution (CC BY) license (http://creativecommons.org/licenses/by/4.0/).
Share and Cite
King, A.; Szekely, B.; Calapkulu, E.; Ali, H.; Rios, F.; Jones, S.; Troakes, C. The Increased Densities, But Different Distributions, of Both C3 and S100A10 Immunopositive Astrocyte-Like Cells in Alzheimer’s Disease Brains Suggest Possible Roles for Both A1 and A2 Astrocytes in the Disease Pathogenesis. Brain Sci. 2020, 10, 503. https://doi.org/10.3390/brainsci10080503
King A, Szekely B, Calapkulu E, Ali H, Rios F, Jones S, Troakes C. The Increased Densities, But Different Distributions, of Both C3 and S100A10 Immunopositive Astrocyte-Like Cells in Alzheimer’s Disease Brains Suggest Possible Roles for Both A1 and A2 Astrocytes in the Disease Pathogenesis. Brain Sciences. 2020; 10(8):503. https://doi.org/10.3390/brainsci10080503
Chicago/Turabian StyleKing, Andrew, Boglarka Szekely, Eda Calapkulu, Hanan Ali, Francesca Rios, Shalmai Jones, and Claire Troakes. 2020. "The Increased Densities, But Different Distributions, of Both C3 and S100A10 Immunopositive Astrocyte-Like Cells in Alzheimer’s Disease Brains Suggest Possible Roles for Both A1 and A2 Astrocytes in the Disease Pathogenesis" Brain Sciences 10, no. 8: 503. https://doi.org/10.3390/brainsci10080503