Hyperarousal Is Associated with Socioemotional Processing in Individuals with Insomnia Symptoms and Good Sleepers


Abstract
:1. Introduction
2. Method
2.1. Participants
2.2. Materials
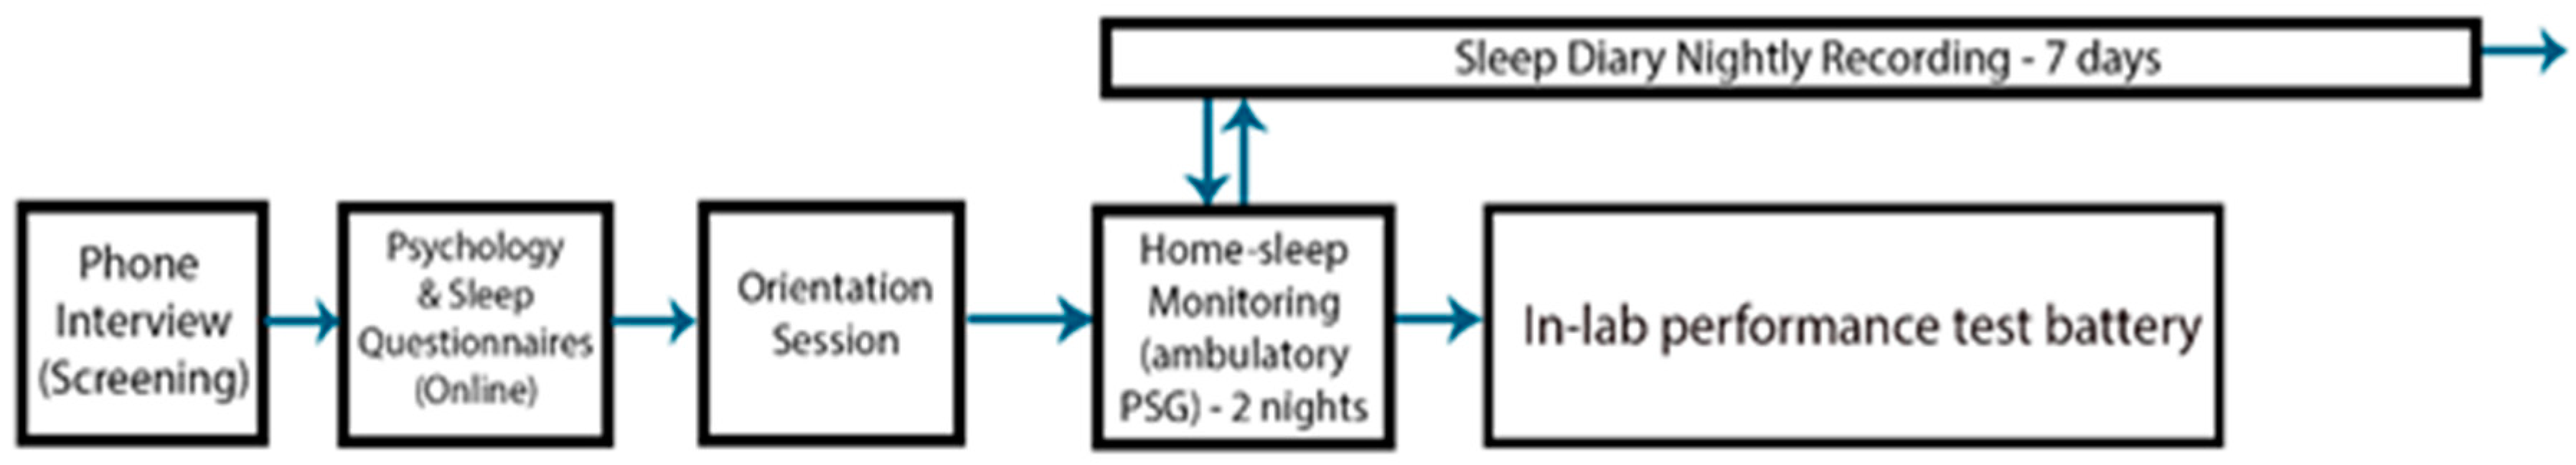
2.3. Procedure
2.4. Data Analysis
Post-hoc Analysis of Poor Sleepers
3. Results
3.1. Participant Characteristics
3.2. Sleep Comparisons by Group
3.3. State and Psychomotor Vigilance Comparisons by Group
3.4. Emotion Processing Performance: Face-Emotion Categorization and Intensity Rating Task
3.5. Emotion Processing Performance: Face-Word Emotion Stroop
3.6. Post-hoc Analysis of Insomnia Subgroup with a Night of Objectively Poor Sleep
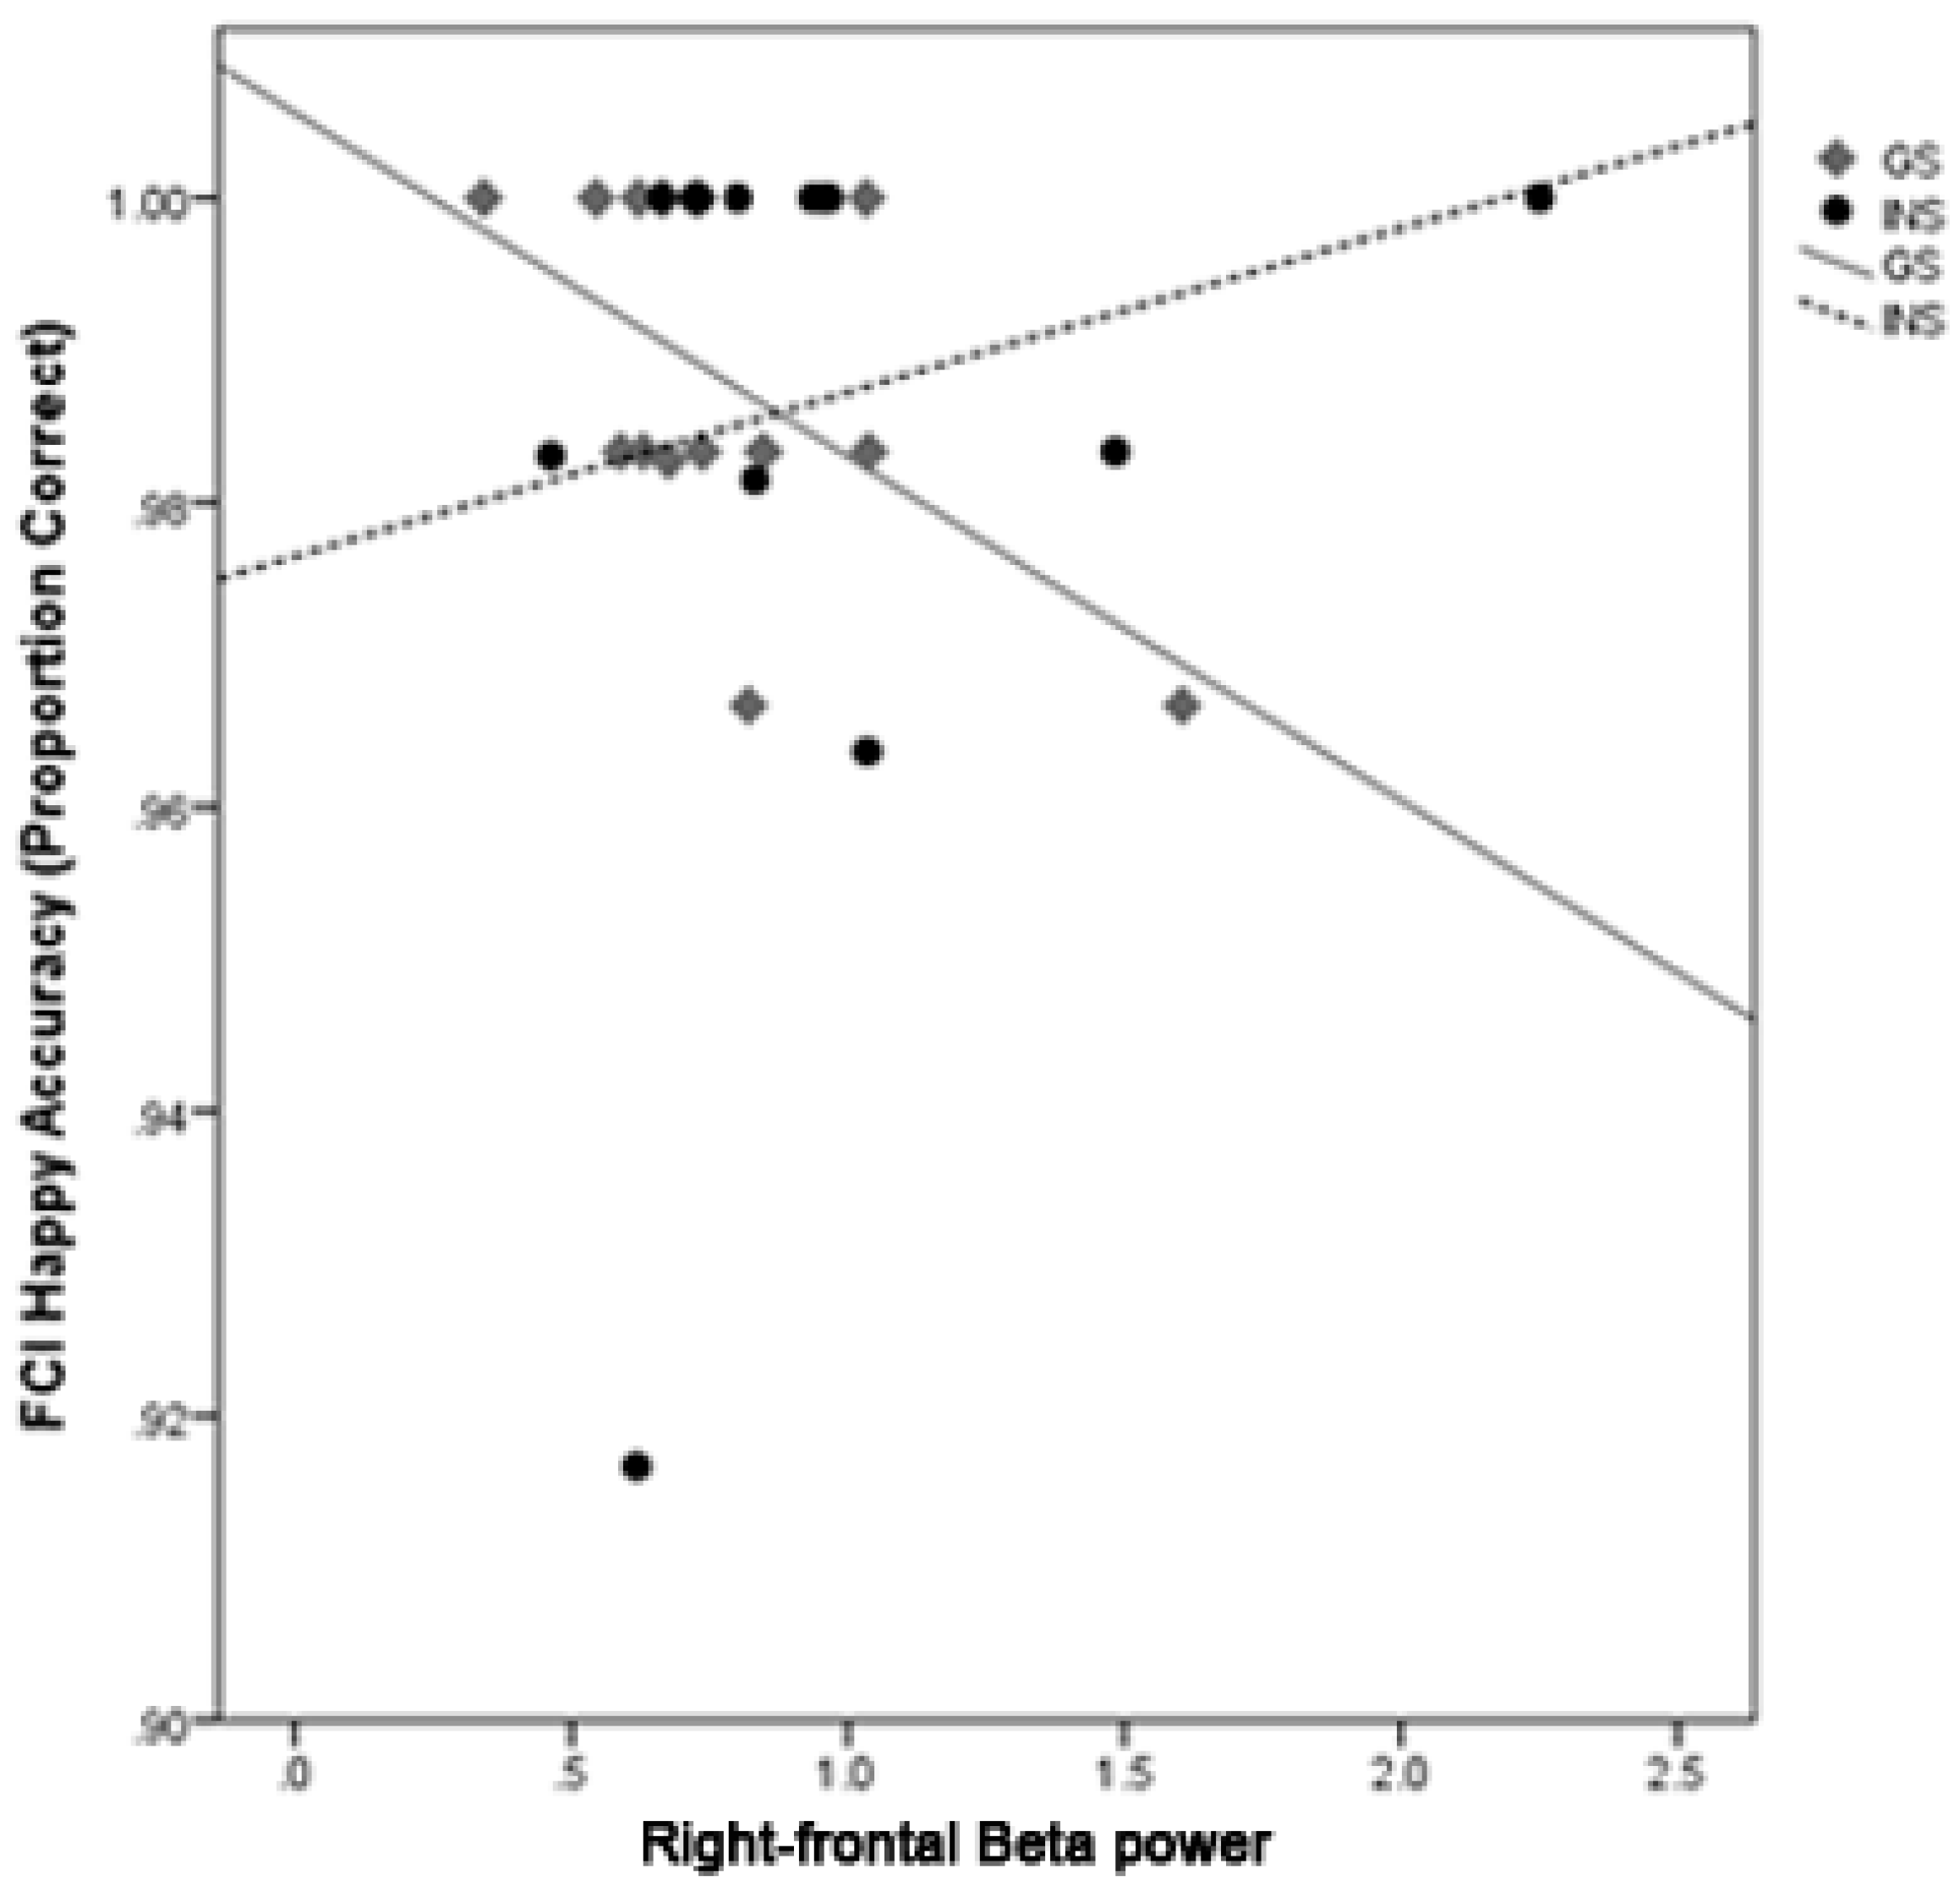
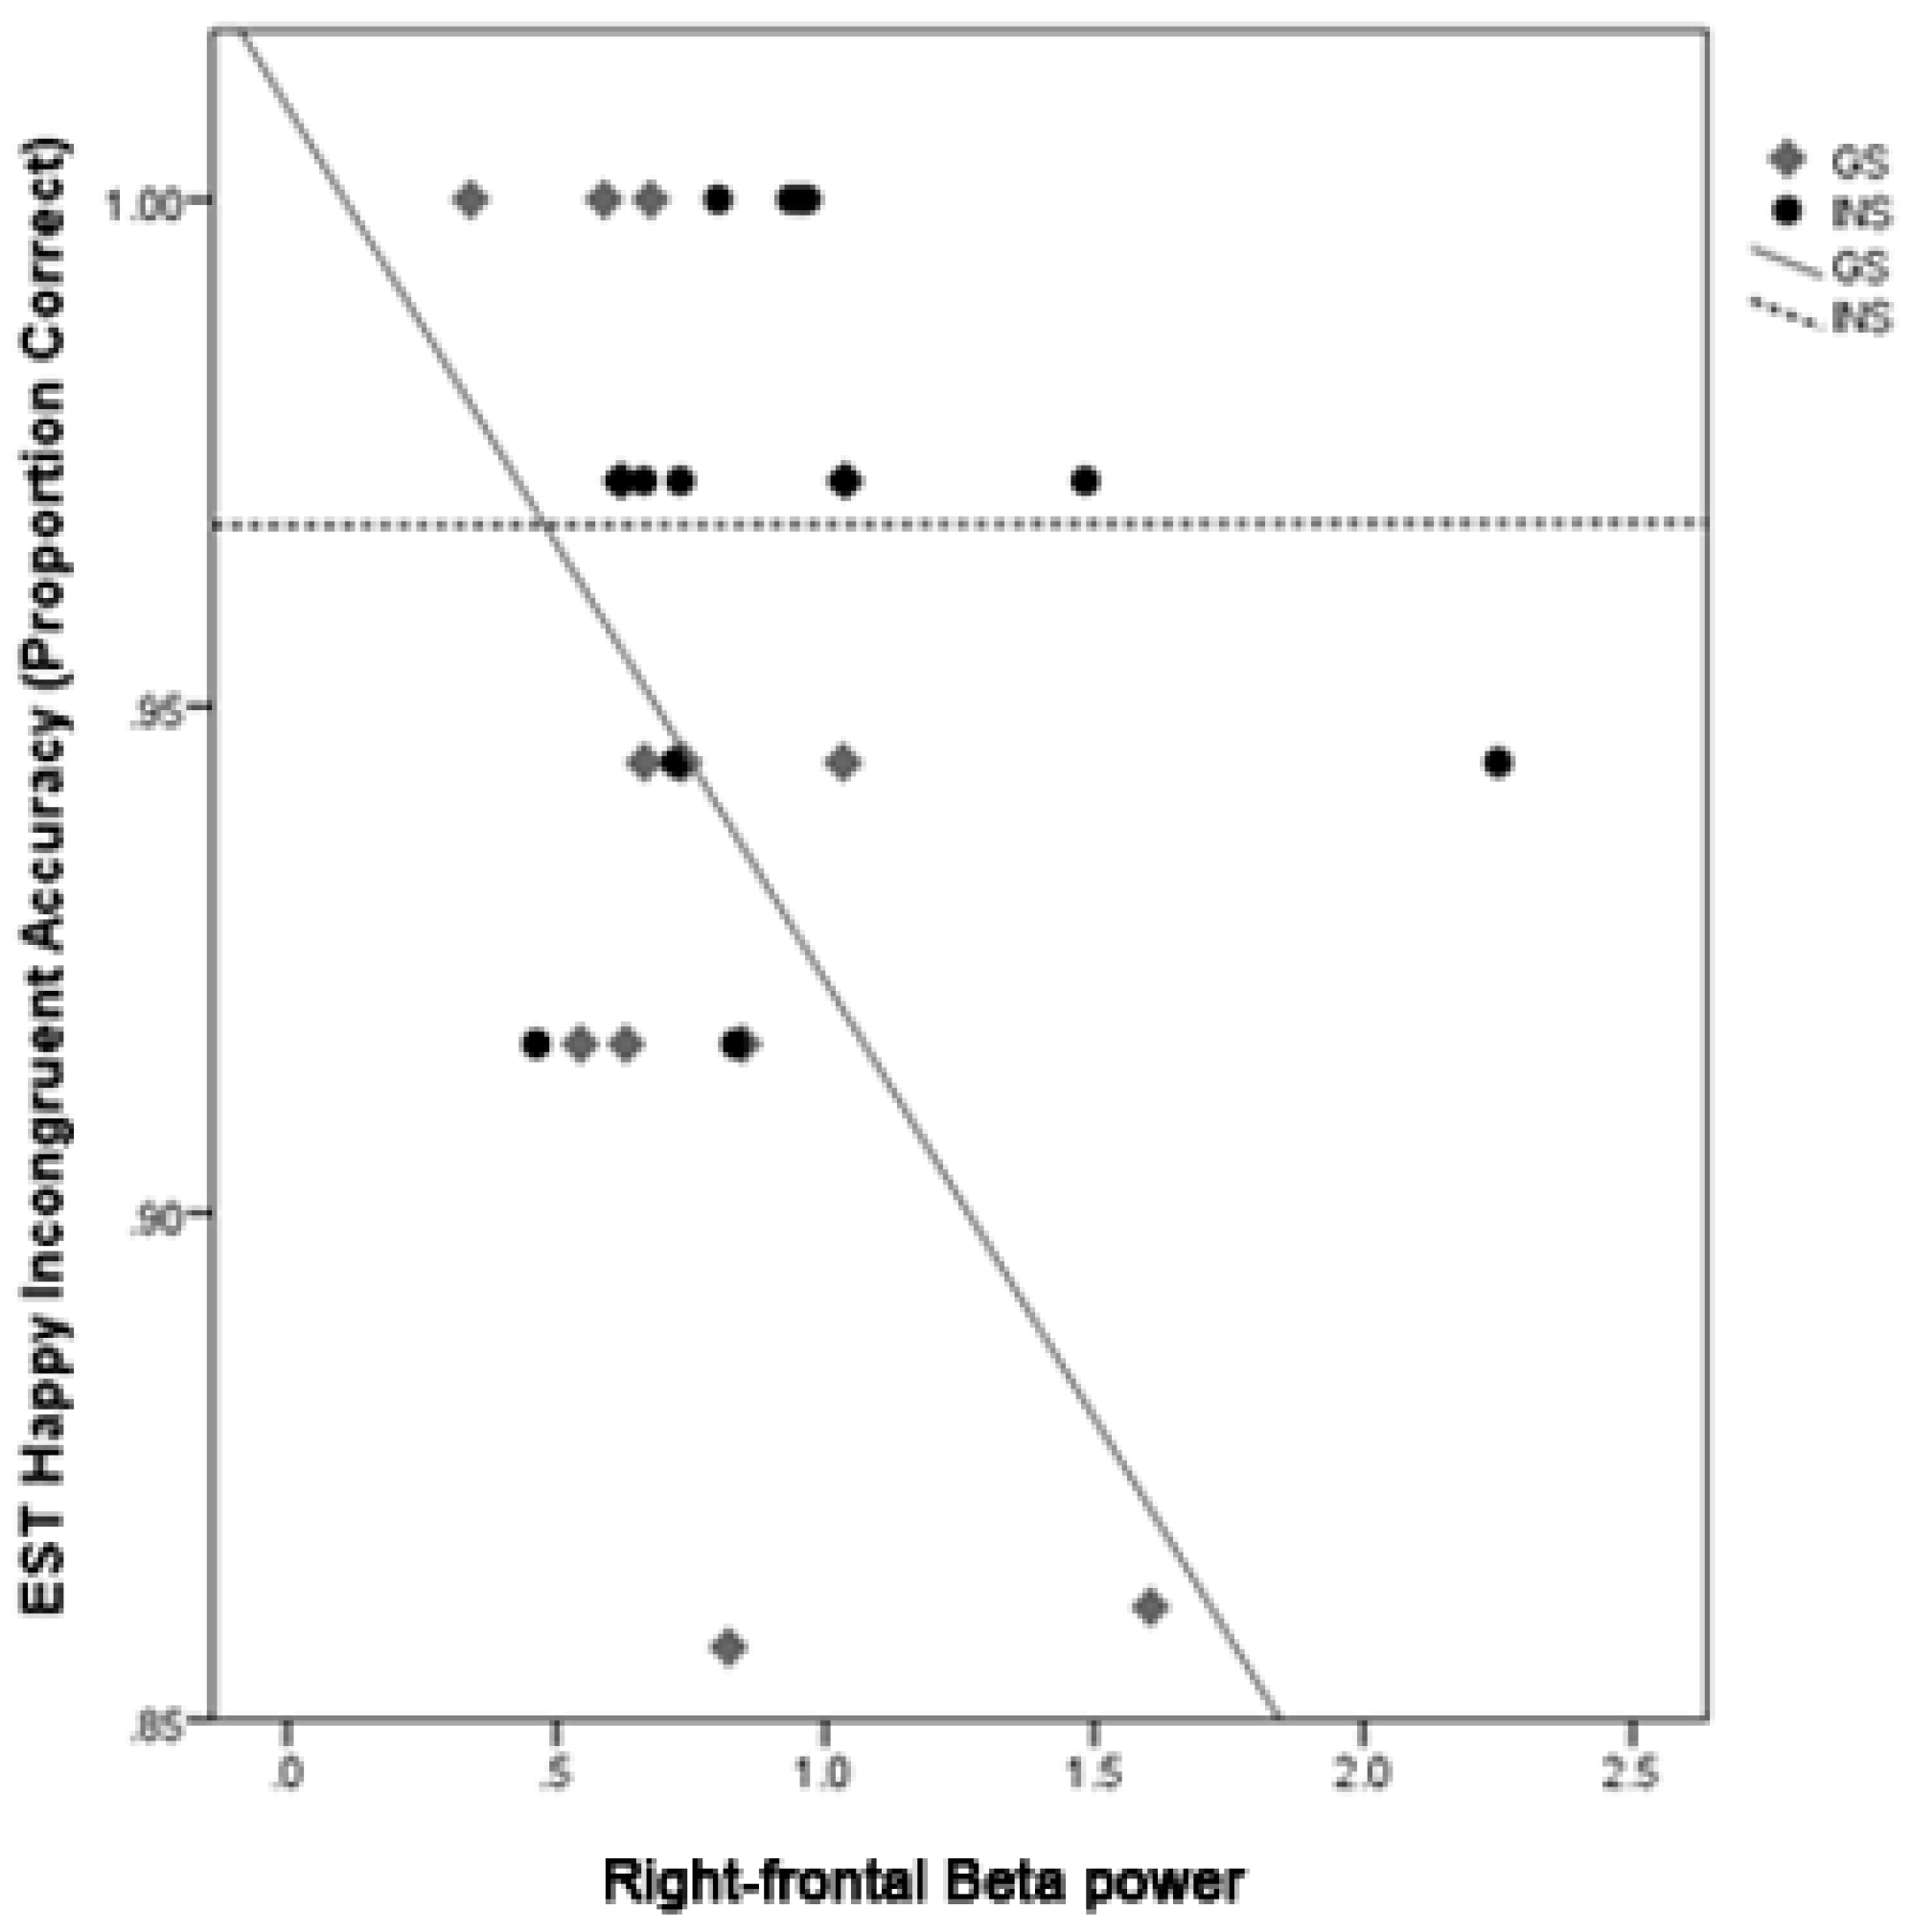
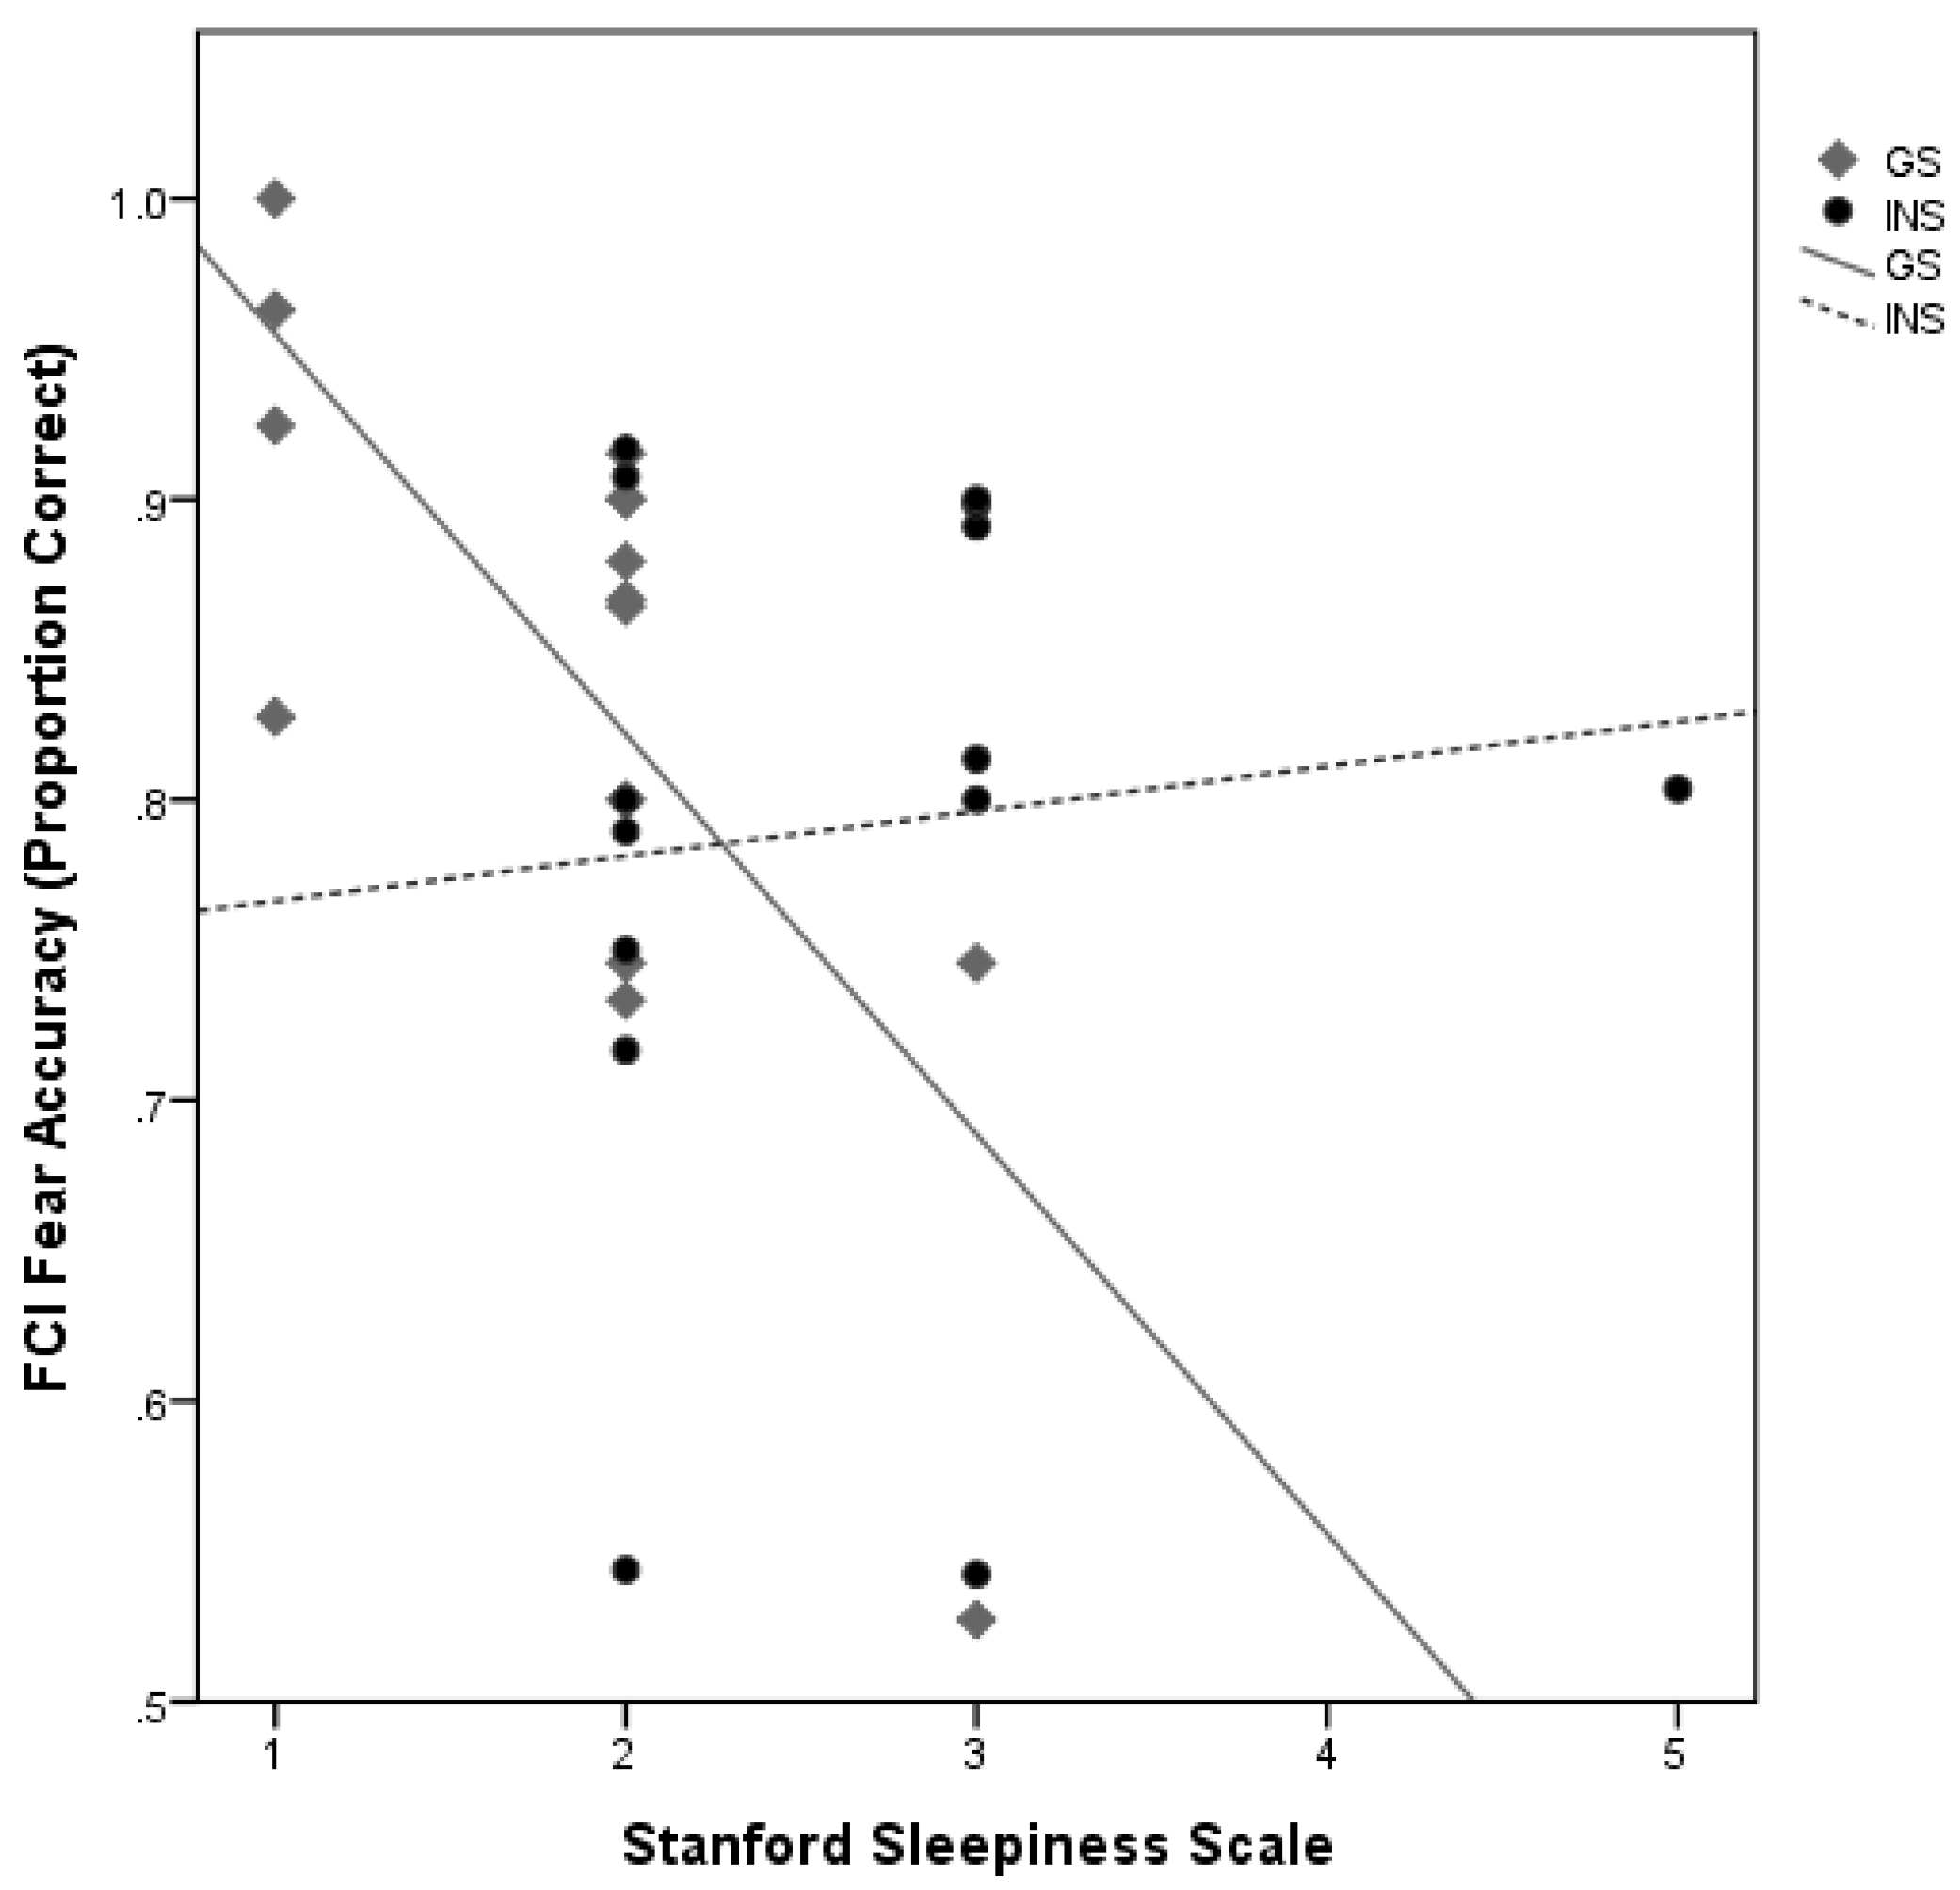
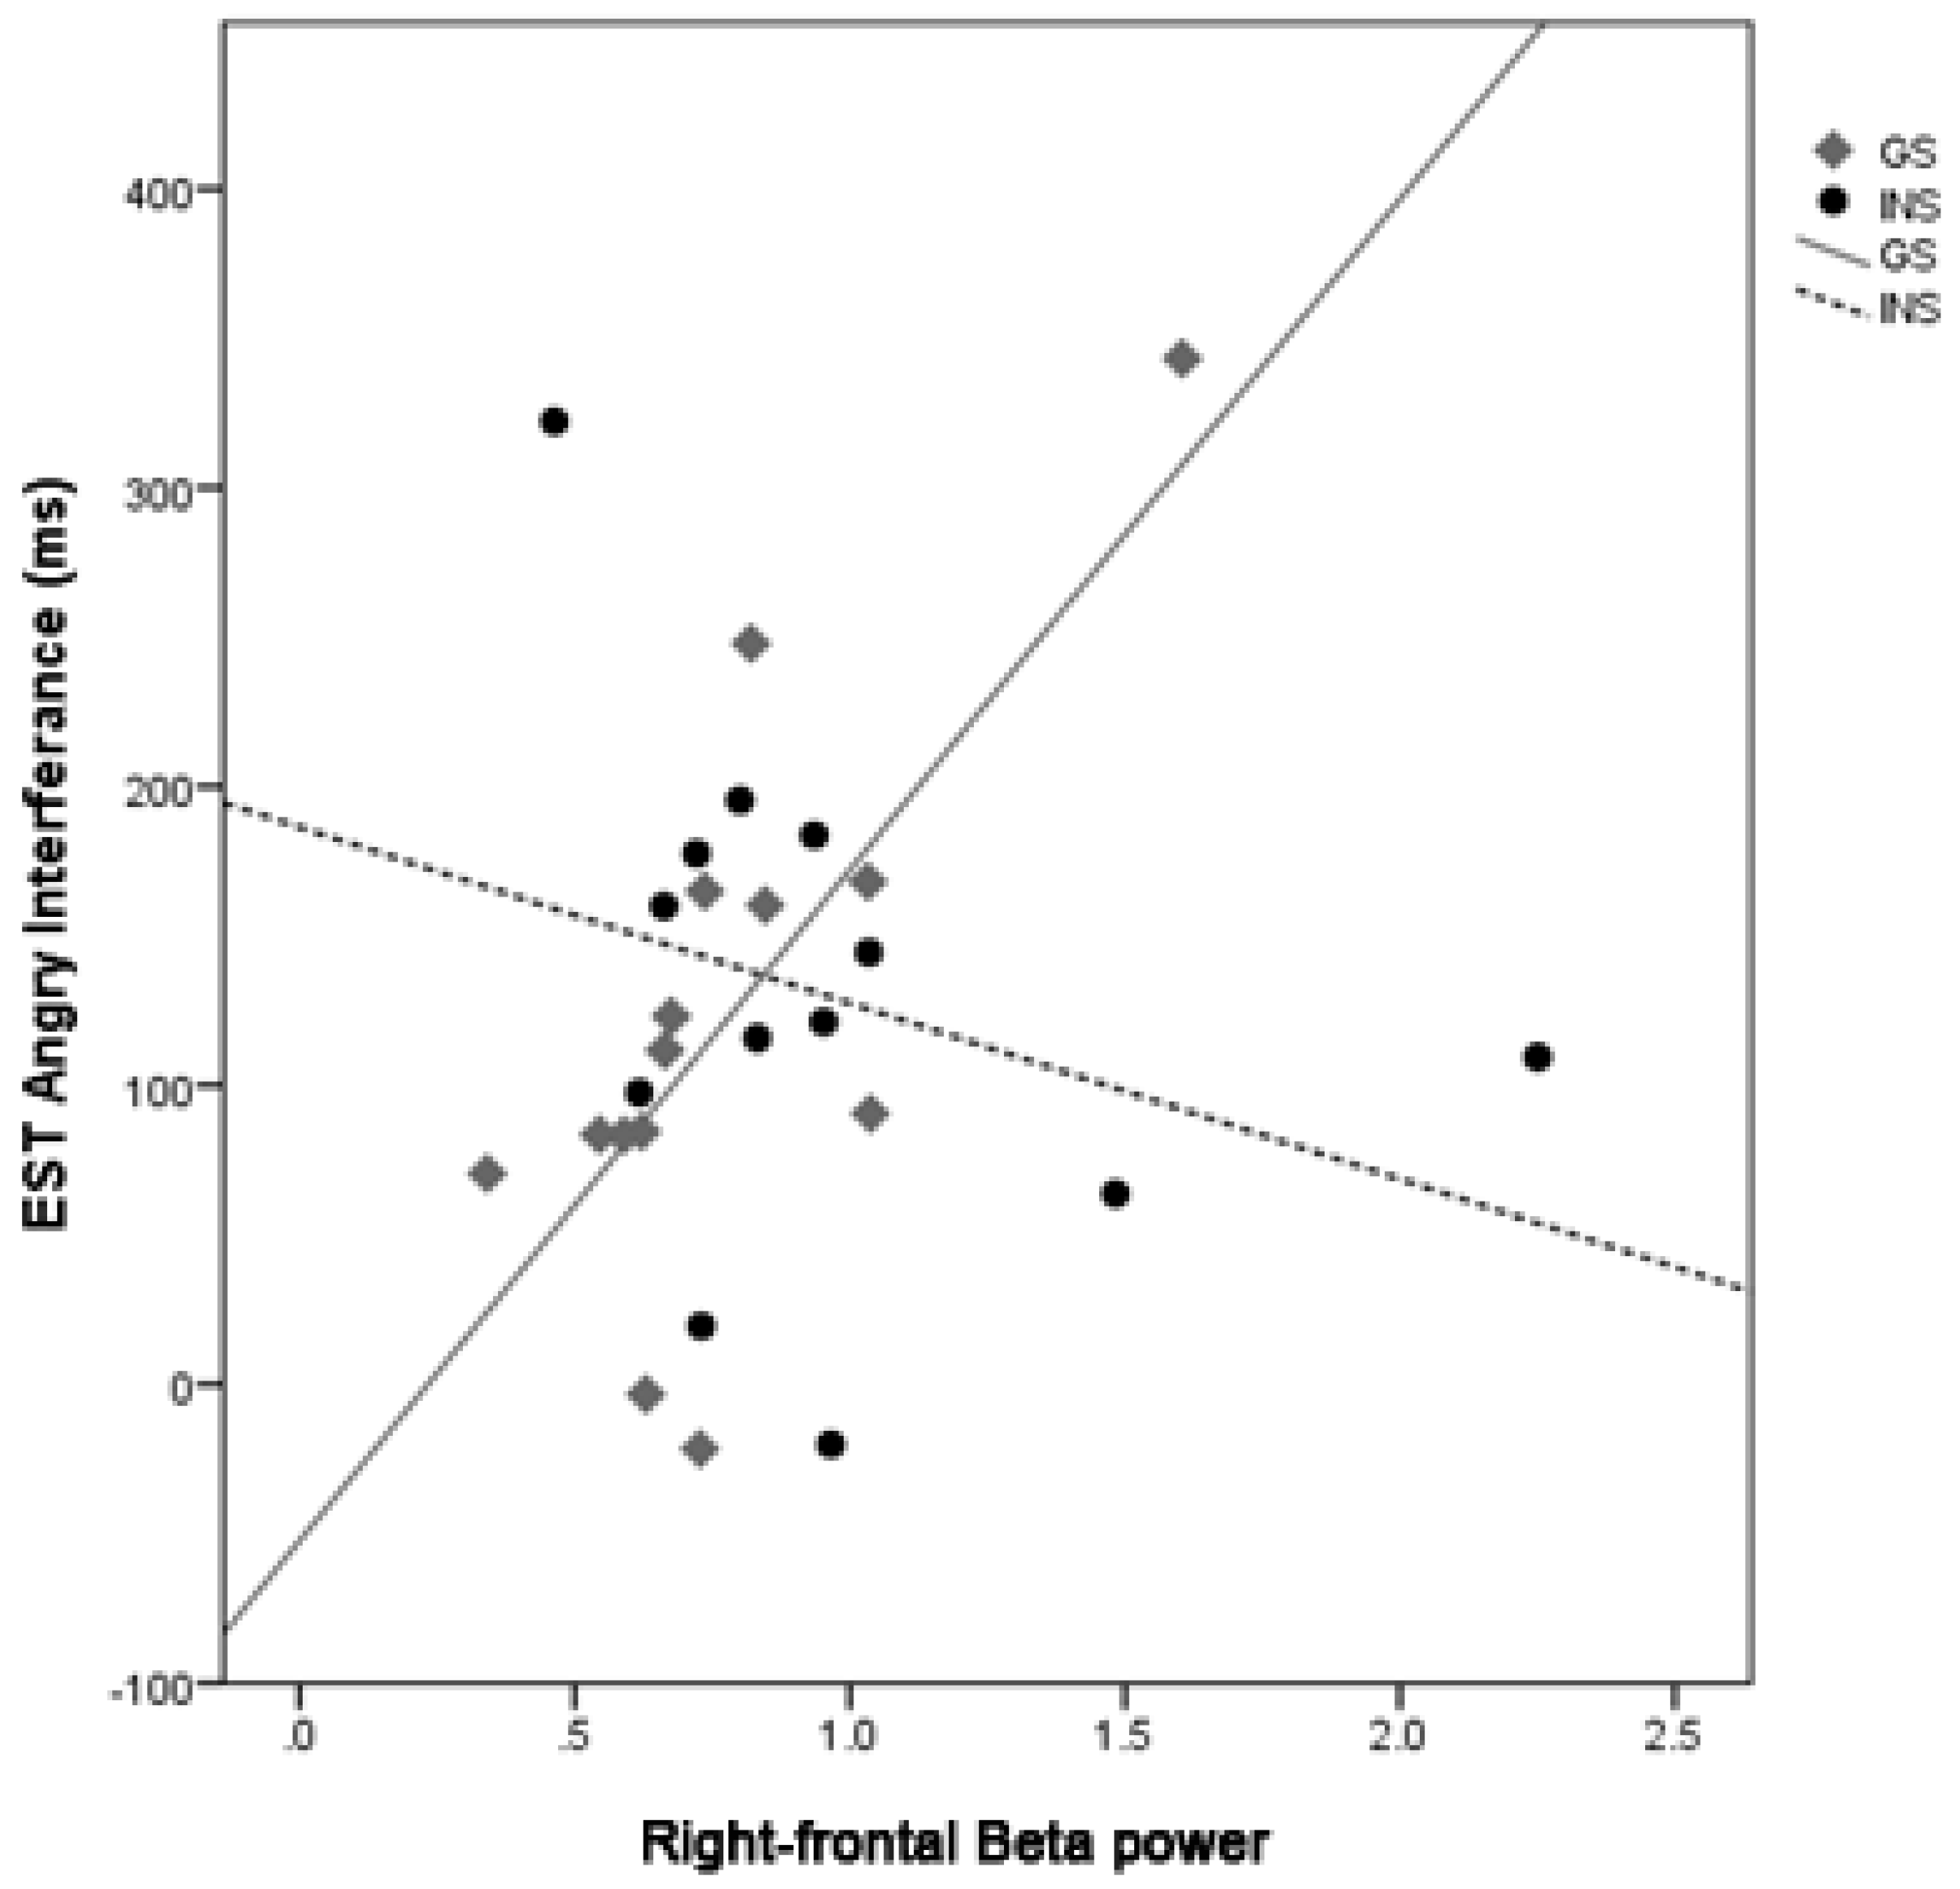
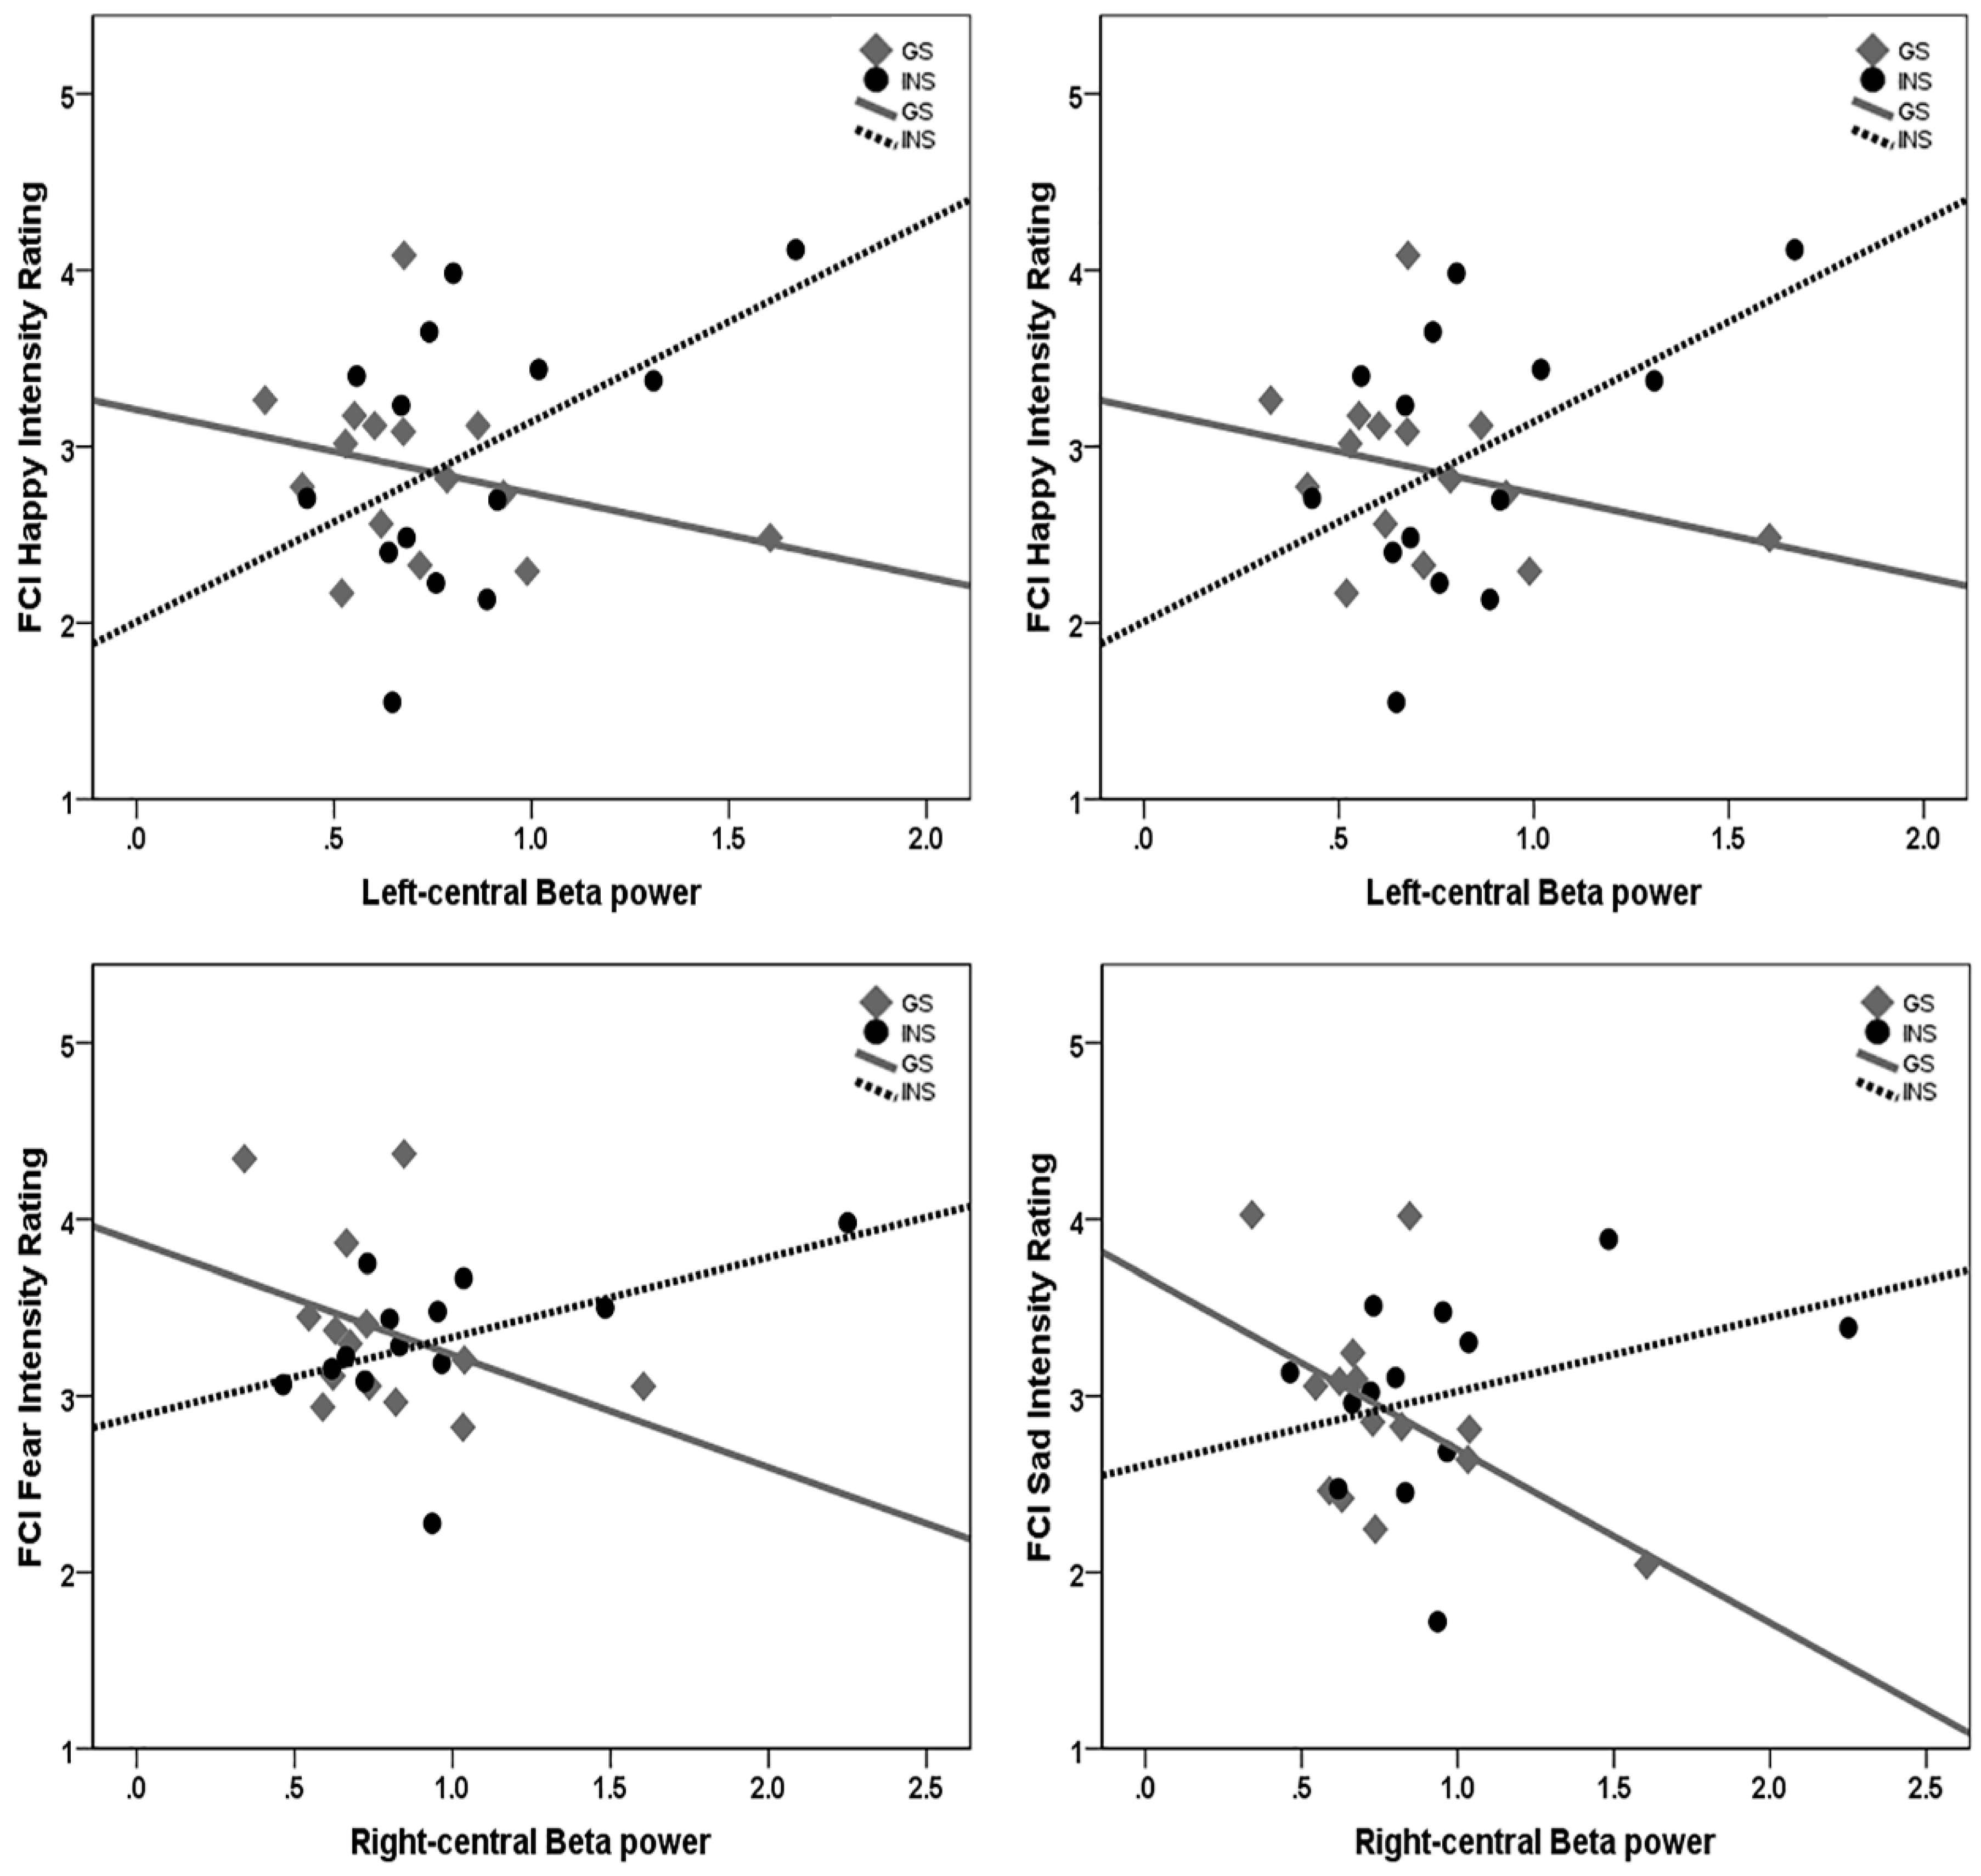
3.7. Moderation Analysis of Sleep Quality and Emotion Processing by Group
4. Discussion
4.1. Hyperarousal Differentially Affects Emotion Processing in Good Sleepers and Insomnia
4.2. Sleep and Emotion Processing Group Differences
4.3. Limitations, Conclusions and Future Directions
Author Contributions
Funding
Acknowledgments
Conflicts of Interest
References
- Morin, C.M.; Leblanc, M.; Bélanger, L.; Ivers, H.; Mérette, C.; Savard, J. Prevalence of insomnia and its treatment in Canada. Can. J. Psychiatry 2011, 56, 540–548. [Google Scholar] [CrossRef] [PubMed] [Green Version]
- Morin, C.M.; LeBlanc, M.; Daley, M.; Gregoire, J.P.; Mérette, C. Epidemiology of insomnia: Prevalence, self-help treatments, consultations, and determinants of help-seeking behaviors. Sleep Med. 2006, 7, 123–130. [Google Scholar] [CrossRef] [PubMed]
- Pallesen, S.; Sivertsen, B.; Nordhus, I.H.; Bjorvatn, B. A 10-year trend of insomnia prevalence in the adult Norwegian population. Sleep Med. 2014, 15, 173–179. [Google Scholar] [CrossRef] [PubMed]
- Perlis, M.L.; Ellis, J.G.; Kloss, J.D.; Riemann, D.W. Etiology and pathophysiology of insomnia. In Principles and Practice of Sleep Medicine, 6th ed.; Kryger, M., Roth, T., Dement, W., Eds.; Elesvier: Amsterdam, The Netherlands, 2017; pp. 769–784. [Google Scholar]
- Bastien, C.H.; Fortier-Brochu, É.; Rioux, I.; LeBlanc, M.; Daley, M.; Morin, C.M. Cognitive performance and sleep quality in the elderly suffering from chronic insomnia: Relationship between objective and subjective measures. J. Psychosom. Res. 2003, 54, 39–49. [Google Scholar] [CrossRef]
- Fernandez-Mendoza, J.; Calhoun, S.; Bixler, E.O.; Pejovic, S.; Karataraki, M.; Liao, D.; Vela-Bueno, A.; Ramos-Platon, M.J.; Sauder, K.A.; Vgontzas, A.N. Insomnia with objective short sleep duration is associated with deficits in neuropsychological performance: A general population study. Sleep 2010, 33, 459–465. [Google Scholar] [CrossRef] [Green Version]
- Ferrie, J.E.; Shipley, M.J.; Akbaraly, T.N.; Marmot, M.G.; Kivimäki, M.; Singh-Manoux, A. Change in sleep duration and cognitive function: Findings from the Whitehall II Study. Sleep 2011, 34, 565–573. [Google Scholar]
- Fortier-Brochu, E.; Morin, C.M. Cognitive impairment in individuals with insomnia: Clinical significance and correlates. Sleep 2014, 37, 1787–1798. [Google Scholar] [CrossRef]
- Li, Y.; Liu, H.; Weed, J.G.; Ren, R.; Sun, Y.; Tan, L.; Tang, X. Deficits in attention performance are associated with insufficiency of slow-wave sleep in insomnia. Sleep Med. 2016, 24, 124–130. [Google Scholar] [CrossRef]
- Shekleton, J.A.; Flynn-Evans, E.E.; Miller, B.; Epstein, L.J.; Kirsch, D.; Brogna, L.A.; Burke, L.M.; Bremer, E.; Murray, J.M.; Gehrman, P.; et al. Neurobehavioral performance impairment in insomnia: Relationships with self-reported sleep and daytime functioning. Sleep 2014, 37, 107–116. [Google Scholar] [CrossRef] [Green Version]
- Wardle-Pinkston, S.; Slavish, D.C.; Taylor, D.J. Insomnia and cognitive performance: A systematic review and meta-analysis. Sleep Med. Rev. 2019, 48, 101205. [Google Scholar] [CrossRef]
- Carey, T.J.; Moul, D.E.; Pilkonis, P.; Germain, A.; Buysse, D.J. Focusing on the experience of insomnia. Behav. Sleep Med. 2005, 3, 73–86. [Google Scholar] [CrossRef] [PubMed]
- Endeshaw, Y.W.; Yoo, W. Association between social and physical activities and insomnia symptoms among community-dwelling older adults. J. Aging Health 2016, 28, 1073–1089. [Google Scholar] [PubMed] [Green Version]
- Silva, J.A.; Chase, M.; Sartorius, N.; Roth, T. Special report from a symposium held by the world health organization and the world federation of sleep research societies. Overview Insomnias Rel. Disord.—Recog. 1996, 19, 412–416. [Google Scholar]
- Kyle, S.D.; Crawford, M.R.; Morgan, K.; Spiegelhalder, K.; Clark, A.A.; Espie, C.A. The Glasgow Sleep Impact Index (GSII): A novel patient-centred measure for assessing sleep-related quality of life impairment in Insomnia Disorder. Sleep Med. 2013, 14, 493–501. [Google Scholar] [CrossRef]
- Cote, K.; Lustig, K.; MacDonald, K. The role of sleep in processing emotional information. In Handbook of Sleep Research; Dringenberg, H., Ed.; Academic Press: Cambridge, MA, USA, 2019; Volume 30. [Google Scholar]
- Beattie, L.; Kyle, S.D.; Espie, C.A.; Biello, S.M. Social interactions, emotion and sleep: A systematic review and research agenda. Sleep Med. Rev. 2015, 24, 83–100. [Google Scholar]
- Baglioni, C.; Spiegelhalder, K.; Regen, W.; Feige, B.; Nissen, C.; Lombardo, C.; Violani, C.; Hennig, J.; Riemann, D. Insomnia disorder is associated with increased amygdala reactivity to insomnia-related stimuli. Sleep 2014, 37, 1907–1917. [Google Scholar]
- Li, C.; Ma, X.; Dong, M.; Yin, Y.; Hua, K.; Li, M.; Li, C.; Zhan, W.; Li, C.; Jiang, G. Abnormal spontaneous regional brain activity in primary insomnia: A resting-state functional magnetic resonance imaging study. Neuropsychiatr. Dis. Treat. 2016, 12, 1371–1378. [Google Scholar]
- Dai, X.J.; Peng, D.C.; Gong, H.H.; Wan, A.L.; Nie, X.; Li, H.J.; Wang, Y.X. Altered intrinsic regional brain spontaneous activity and subjective sleep quality in patients with chronic primary insomnia: A resting-state fMRI study. Neuropsychiatr. Dis. Treat. 2014, 10, 2163–2175. [Google Scholar] [CrossRef] [Green Version]
- Kay, D.B.; Karim, H.T.; Soehner, A.M.; Hasler, B.P.; James, J.A.; Germain, A.; Hall, M.H.; Franzen, P.L.; Price, J.C.; Nofzinger, E.A.; et al. Subjective–Objective sleep discrepancy is associated with alterations in regional glucose metabolism in patients with insomnia and good sleeper controls. Sleep 2017, 40, zsx155. [Google Scholar]
- Kay, D.B.; Karim, H.T.; Soehner, A.M.; Hasler, B.P.; Wilckens, K.A.; James, J.A.; Aizenstein, H.J.; Price, J.C.; Rosario, B.L.; Kupfer, D.J.; et al. Sleep-wake differences in relative regional cerebral metabolic rate for glucose among patients with insomnia compared with good sleepers. Sleep 2016, 39, 1779–1794. [Google Scholar]
- Baglioni, C.; Lombardo, C.; Bux, E.; Hansen, S.; Salveta, C.; Biello, S.; Violani, C.; Espie, C.A. Psychophysiological reactivity to sleep-related emotional stimuli in primary insomnia. Behav. Res. Ther. 2010, 48, 467–475. [Google Scholar] [CrossRef] [PubMed]
- Kyle, S.D.; Beattie, L.; Spiegelhalder, K.; Rogers, Z.; Espie, C.A. Altered emotion perception in insomnia disorder. Sleep 2014, 37, 775–783. [Google Scholar] [CrossRef] [PubMed]
- Crönlein, T.; Langguth, B.; Eichhammer, P.; Busch, V. Impaired recognition of facially expressed emotions in different groups of patients with sleep disorders. PLoS ONE 2016, 11, e0152754. [Google Scholar] [CrossRef] [PubMed] [Green Version]
- Blair, R.J. Facial expressions, their communicatory functions and neuro–cognitive substrates. Philos. Trans. R. Soc. Lond. Ser. B Biol. Sci. 2003, 358, 561–572. [Google Scholar] [CrossRef] [PubMed] [Green Version]
- Hess, U.; Fischer, A. Emotional mimicry as social regulation. Personal. Soc. Psychol. Rev. 2013, 17, 142–157. [Google Scholar] [CrossRef] [PubMed]
- Marsh, A.A.; Blair, R.J. Deficits in facial affect recognition among antisocial populations: A meta-analysis. Neurosci. Biobehav. Rev. 2007, 32, 454–465. [Google Scholar] [CrossRef] [Green Version]
- Kushida, C.A.; Littner, M.R.; Morgenthaler, T.; Alessi, C.A.; Bailey, D.; Coleman, J., Jr.; Friedman, L.; Hirshkowitz, M.; Kapen, S.; Kramer, M.; et al. Practice parameters for the indications for polysomnography and related procedures: An update for 2005. Sleep 2005, 28, 499–523. [Google Scholar] [CrossRef] [Green Version]
- Edinger, J.D.; Ulmer, C.S.; Means, M.K. Sensitivity and specificity of polysomnographic criteria for defining insomnia. J. Clin. Sleep Med. 2013, 9, 481–491. [Google Scholar] [CrossRef] [Green Version]
- Baglioni, C.; Regen, W.; Teghen, A.; Spiegelhalder, K.; Feige, B.; Nissen, C.; Riemann, D. Sleep changes in the disorder of insomnia: A meta-analysis of polysomnographic studies. Sleep Med. Rev. 2014, 18, 195–213. [Google Scholar] [CrossRef]
- Buysse, D.J.; Germain, A.; Hall, M.L.; Moul, D.E.; Nofzinger, E.A.; Begley, A.; Ehlers, C.L.; Thompson, W.; Kupfer, D.J. EEG spectral analysis in primary insomnia: NREM period effects and sex differences. Sleep 2008, 31, 1673–1682. [Google Scholar] [CrossRef] [Green Version]
- Bastien, C.H.; Turcotte, I.; St-Jean, G.; Morin, C.M.; Carrier, J. Information processing varies between insomnia types: Measures of N1 and P2 during the night. Behav. Sleep Med. 2013, 11, 56–72. [Google Scholar] [CrossRef] [PubMed]
- Ceklic, T.; Bastien, C.H. Information processing during NREM sleep and sleep quality in insomnia. Int. J. Psychophysiol. 2015, 98, 460–469. [Google Scholar] [CrossRef] [PubMed]
- Fernandez-Mendoza, J.; Li, Y.; Vgontzas, A.N.; Fang, J.; Gaines, J.; Calhoun, S.L.; Liao, D.; Bixler, E.O. Insomnia is associated with cortical hyperarousal as early as adolescence. Sleep 2016, 39, 1029–1036. [Google Scholar] [CrossRef] [PubMed] [Green Version]
- Krystal, A.D.; Edinger, J.D.; Wohlgemuth, W.K.; Marsh, G.R. NREM sleep EEG frequency spectral correlates of sleep complaints in primary insomnia subtypes. Sleep 2002, 25, 626–636. [Google Scholar]
- Merica, H.; Blois, R.; Gaillard, J.M. Spectral characteristics of sleep EEG in chronic insomnia. Eur. J. Neurosci. 1998, 10, 1826–1834. [Google Scholar] [CrossRef]
- Perlis, M.L.; Smith, M.T.; Andrews, P.J.; Orff, H.; Giles, D.E. Beta/Gamma EEG activity in patients with primary and secondary insomnia and good sleeper controls. Sleep 2001, 24, 110–117. [Google Scholar] [CrossRef] [Green Version]
- Perlis, M.L.; Giles, D.E.; Mendelson, W.B.; Bootzin, R.R.; Wyatt, J.K. Psychophysiological insomnia: The behavioural model and a neurocognitive perspective. J. Sleep Res. 1997, 6, 179–188. [Google Scholar] [CrossRef]
- Riedner, B.A.; Goldstein, M.R.; Plante, D.T.; Rumble, M.E.; Ferrarelli, F.; Tononi, G.; Benca, R.M. Regional patterns of elevated alpha and high-frequency electroencephalographic activity during nonrapid eye movement sleep in chronic insomnia: A pilot study. Sleep 2016, 39, 801–812. [Google Scholar] [CrossRef] [Green Version]
- Spiegelhalder, K.; Regen, W.; Feige, B.; Holz, J.; Piosczyk, H.; Baglioni, C.; Riemann, D.; Nissen, C. Increased EEG sigma and beta power during NREM sleep in primary insomnia. Biol. Psychol. 2012, 91, 329–333. [Google Scholar] [CrossRef]
- Freedman, R.R. EEG power spectra in sleep-onset insomnia. Electroencephalogr. Clin. Neurophysiol. 1986, 63, 408–413. [Google Scholar] [CrossRef]
- Schomer, D.L.; Lopes da Silva, F.H. Nidermeyer’s Electroencephalography: Basic Principles, Clinical Applications, and Related Fields, 7th ed.; Oxford University Press: Oxford, UK, 2017. [Google Scholar]
- Bonnet, M.H.; Arand, D.L. Hyperarousal and insomnia: State of the science. Sleep Med. Rev. 2010, 14, 9–15. [Google Scholar] [CrossRef] [PubMed]
- Kay, D.B.; Buysse, D.J. Hyperarousal and beyond: New insights to the pathophysiology of insomnia disorder through functional neuroimaging studies. Brain Sci. 2017, 7, 23. [Google Scholar] [CrossRef] [PubMed] [Green Version]
- Riemann, D.; Spiegelhalder, K.; Feige, B.; Voderholzer, U.; Berger, M.; Perlis, M.; Nissen, C. The hyperarousal model of insomnia: A review of the concept and its evidence. Sleep Med. Rev. 2010, 14, 19–31. [Google Scholar] [CrossRef] [PubMed]
- Wilckens, K.A.; Woo, S.G.; Kirk, A.R.; Erickson, K.I.; Wheeler, M.E. Role of sleep continuity and total sleep time in executive function across the adult lifespan. Psychol. Aging 2014, 29, 658–665. [Google Scholar] [CrossRef] [Green Version]
- Younes, M.; Ostrowski, M.; Soiferman, M.; Younes, H.; Younes, M.; Raneri, J.; Hanly, P. Odds ratio product of sleep EEG as a continuous measure of sleep state. Sleep 2015, 38, 641–654. [Google Scholar] [CrossRef]
- American Psychiatric Association. Diagnostic and Statistical Manual of Mental Disorders, 5th ed.; Author: Arlington, VA, USA, 2013. [Google Scholar]
- Morin, C.M.; Belleville, G.; Bélanger, L.; Ivers, H. The insomnia severity index: Psychometric indicators to detect insomnia cases and evaluate treatment response. Sleep 2011, 34, 601–608. [Google Scholar] [CrossRef] [Green Version]
- Morin, C.M. Relief from Insomnia; Doubleday/Dell: New York, NY, USA, 1996. [Google Scholar]
- Tottenham, N.; Tanaka, J.W.; Leon, A.C.; McCarry, T.; Nurse, M.; Hare, T.A.; Marcus, D.J.; Westerlund, A.; Casey, B.J.; Nelson, C. The NimStim set of facial expressions: Judgments from untrained research participants. Psychiatry Res. 2009, 168, 242–249. [Google Scholar] [CrossRef] [Green Version]
- Preston, S.D.; Stansfield, R.B. I know how you feel: Task-irrelevant facial expressions are spontaneously processed at a semantic level. Cogn. Affect. Behav. Neurosci. 2008, 8, 54–64. [Google Scholar] [CrossRef] [Green Version]
- Stroop, J.R. Studies of interference in serial verbal reactions. J. Exp. Psychol. 1935, 18, 643–662. [Google Scholar] [CrossRef]
- Lundwist, D.; Flykt, A.; Ohman, A. The Karolinska Directed Emotional Faces-KDEF; Department of Clinical Neuro-science, Psychology section, Karolinska Institutet: Stockholm, Sweden, 1998. [Google Scholar]
- Buysse, D.J.; Reynolds, C.F.; Monk, T.H.; Berman, S.R.; Kupfer, D.J. The Pittsburgh sleep quality index: A new instrument for psychiatric practice and research. Psychiatry Res. 1989, 28, 193–213. [Google Scholar] [CrossRef]
- Lovibond, S.H.; Lovibond, P.F. Manual for the Depression Anxiety & Stress Scales, 2nd ed.; Psychology Foundation: Sydney, Australia, 1995. [Google Scholar]
- Spielberger, C.D. State-Trait anxiety inventory. In The Corsini Encyclopedia of Psychology; John Wiley & Sons, Inc.: Hoboken, NJ, USA, 2010. [Google Scholar]
- Hoddes, E.; Zarcone, V.; Dement, W. Stanford Sleepiness Scale. In Enzyklopädie der Schlafmedizin; Springer: Berlin/Heidelberg, Germany, 2007; p. 1184. [Google Scholar]
- Watson, D.; Clark, L.A.; Tellegen, A. Development and validation of brief measures of positive and negative affect: The PANAS scales. J. Personal. Soc. Psychol. 1988, 54, 1063–1070. [Google Scholar] [CrossRef]
- Malhotra, A.; Younes, M.; Kuna, S.T.; Benca, R.; Kushida, C.A.; Walsh, J.; Hanlon, A.; Staley, B.; Pack, A.I.; Pien, G.W. Performance of an automated polysomnography scoring system versus computer-assisted manual scoring. Sleep 2013, 36, 573–582. [Google Scholar] [CrossRef]
- Berry, R.B.; Brooks, R.; Gamaldo, C.E.; Harding, S.M.; Marcus, C.L.; Vaughn, B.V. The AASM Manual for the Scoring of Sleep and Associated Events; American Academy of Sleep Medicine: Darien, IL, USA, 2012. [Google Scholar]
- Hayes, A.F. PROCESS: A Versatile Computational Tool for Observed Variable Mediation, Moderation, and Conditional Process modeling. Available online: https://www.afhayes.com/public/process2012.pdf (accessed on 15 June 2019).
- Hinkley, D.V. Jackknifing in unbalanced situations. Technometrics 1977, 19, 285–292. [Google Scholar] [CrossRef]
- Hayes, A.F.; Cai, L. Using heteroskedasticity-consistent standard error estimators in OLS regression: An introduction and software implementation. Behav. Res. Methods 2007, 39, 709–722. [Google Scholar] [CrossRef] [PubMed] [Green Version]
- Hansen, D.A.; Layton, M.E.; Riedy, S.M.; Van Dongen, H.P. Psychomotor vigilance impairment during total sleep deprivation is exacerbated in sleep-onset insomnia. Nat. Sci. Sleep 2019, 11, 401–410. [Google Scholar] [CrossRef] [PubMed] [Green Version]
- Gottesmann, C. GABA mechanisms and sleep. Neuroscience 2002, 111, 231–239. [Google Scholar] [CrossRef]
- Winkelman, J.W.; Buxton, O.M.; Jensen, J.E.; Benson, K.L.; O’Connor, S.P.; Wang, W.; Renshaw, P.F. Reduced brain GABA in primary insomnia: Preliminary data from 4T proton magnetic resonance spectroscopy (1H-MRS). Sleep 2008, 31, 1499–1506. [Google Scholar] [CrossRef] [Green Version]
- Klumpp, H.; Post, D.; Angstadt, M.; Fitzgerald, D.A.; Phan, K.L. Anterior cingulate cortex and insula response during indirect and direct processing of emotional faces in generalized social anxiety disorder. Biol. Mood Anxiety Disord. 2013, 3, 7. [Google Scholar] [CrossRef] [Green Version]
- Plante, D.T.; Jensen, J.E.; Schoerning, L.; Winkelman, J.W. Reduced γ-aminobutyric acid in occipital and anterior cingulate cortices in primary insomnia: A link to major depressive disorder? Neuropsychopharmacology 2012, 37, 1548–1557. [Google Scholar] [CrossRef] [Green Version]
- Nofzinger, E.A.; Nissen, C.; Germain, A.; Moul, D.; Hall, M.; Price, J.C.; Buysse, D.J. Regional cerebral metabolic correlates of WASO during NREM sleep in insomnia. J. Clin. Sleep Med. 2006, 2, 316–322. [Google Scholar] [CrossRef] [Green Version]
- Kertesz, R.S.; Cote, K.A. Event-related potentials reveal failure to inhibit stimuli during the pre-sleep waking period for patients with sleep-onset insomnia. Behav. Sleep Med. 2011, 9, 68–85. [Google Scholar] [CrossRef] [PubMed]
- Kalmbach, D.A.; Anderson, J.R.; Drake, C.L. The impact of stress on sleep: Pathogenic sleep reactivity as a vulnerability to insomnia and circadian disorders. J. Sleep Res. 2018, 27, e12710. [Google Scholar] [CrossRef] [PubMed] [Green Version]
- Jacobs, G.D.; Benson, H.; Friedman, R. Home-based central nervous system assessment of a multifactor behavioral intervention for chronic sleep-onset insomnia. Behav. Ther. 1993, 24, 159–174. [Google Scholar] [CrossRef]
- Walker, M.P.; van Der Helm, E. Overnight therapy? The role of sleep in emotional brain processing. Psychol. Bull. 2009, 135, 731–748. [Google Scholar] [CrossRef] [Green Version]
- Zhao, L.; Wang, E.; Zhang, X.; Karama, S.; Khundrakpam, B.; Zhang, H.; Guan, M.; Wang, M.; Cheng, J.; Shi, D.; et al. Cortical structural connectivity alterations in primary insomnia: Insights from MRI-based morphometric correlation analysis. Biomed Res. Int. 2015. [Google Scholar] [CrossRef] [Green Version]
- Frankel, B.L.; Coursey, R.D.; Buchbinder, R.; Snyder, F. Recorded and reported sleep in chronic primary insomnia. Arch. Gen. Psychiatry 1976, 33, 615–623. [Google Scholar] [CrossRef]
- Reite, M.; Buysse, D.; Reynolds, C.; Mendelson, W. The use of polysomnography in the evaluation of insomnia. Sleep 1995, 18, 58–70. [Google Scholar] [CrossRef] [Green Version]
- Spinweber, C.L.; Johnson, L.C.; Chin, L.A. Disqualified and qualified poor sleepers: Subjective and objective variables. Health Psychol. 1985, 4, 569–578. [Google Scholar] [CrossRef]
- Edinger, J.D.; Fins, A.I.; Glenn, D.M.; Sullivan, R.J., Jr.; Bastian, L.A.; Marsh, G.R.; Dailey, D.; Hope, T.V.; Young, M.; Shaw, E.; et al. Insomnia and the eye of the beholder: Are there clinical markers of objective sleep disturbances among adults with and without insomnia complaints? J. Consult. Clin. Psychol. 2000, 68, 586. [Google Scholar] [CrossRef]
- Carskadon, M.A.; Dement, W.C. Normal Human Sleep: An Overview. In Principles and Practice of Sleep Medicine, 6th ed.; Kryger, M., Roth, T., Dement, W., Eds.; Elsevier: Amsterdam, The Netherlands, 2017; pp. 15–24. [Google Scholar]
- Cote, K.; Mondloch, C.; Sergeeva, V.; Taylor, M.; Semplonius, T. Impact of total sleep deprivation on behavioural neural processing of emotionally expressive faces. Exp. Brain Res. 2014, 232, 1429–1442. [Google Scholar] [CrossRef]
- Killgore, W.B.; Balkin, T.J.; Yarnell, A.M.; Capaldi, V.F. Sleep deprivation impairs recognition of specific emotions. Neurobiol. Sleep Circadian Rhythm. 2017, 3, 10–16. [Google Scholar] [CrossRef] [PubMed]
- Maccari, L.; Martella, D.; Marotta, A.; Sebastiani, M.; Banaj, N.; Fuentes, L.J.; Casagrande, M. Effects of sleep loss on emotion recognition: A dissociation between face and word stimuli. Exp. Brain Res. 2014, 232, 3147–3157. [Google Scholar] [CrossRef] [PubMed]
- Van Der Helm, E.; Gujar, N.; Walker, M.P. Sleep deprivation impairs the accurate recognition of human emotions. Sleep 2010, 33, 335–342. [Google Scholar] [CrossRef] [PubMed]
- Lamarche, C.H.; Ogilvie, R.D. Electrophysiological changes during the sleep onset period of psychophysiological insomniacs. Psychiatric insomniacs, and normal sleepers. Sleep 1997, 20, 726–733. [Google Scholar] [CrossRef]
- Staner, L.; Cornette, F.; Maurice, D.; Viardot, G.; Bon, O.L.; Haba, J.; Staner, C.; Luthringer, R.; Muzet, A.; Macher, J.P. Sleep microstructure around sleep onset differentiates major depressive insomnia from primary insomnia. J. Sleep Res. 2003, 12, 319–330. [Google Scholar] [CrossRef]


| Good Sleepers (n = 14) | Insomnia (n = 15) | ||||||
|---|---|---|---|---|---|---|---|
| M | SD | M | SD | t | df | Sig. (2-tailed) | |
| ISI | 3.60 | 2.56 | 14.21 | 5.44 | −6.65 | 18.20 | 0.001 ** |
| PSQI | 2.87 | 1.55 | 11.39 | 2.14 | −12.16 | 26 | 0.001 ** |
| DASS-Anxiety | 2.60 | 2.29 | 3.71 | 4.34 | −0.86 | 19.43 | 0.403 |
| DASS-Depression | 3.73 | 3.53 | 6.36 | 6.78 | −1.29 | 19.28 | 0.211 |
| DASS-Stress | 6.00 | 4.17 | 8.71 | 5.80 | −1.46 | 27 | 0.157 |
| STAI-Trait | 36.87 | 9.46 | 39.86 | 14.07 | −0.68 | 27 | 0.505 |
| Good Sleepers (n = 14) | Insomnia (n = 15) | ||||||
|---|---|---|---|---|---|---|---|
| M | SD | M | SD | t | df | Sig. (2-tailed) | |
| PSG Parameters | |||||||
| TST | 432.82 | 33.42 | 393.42 | 78.27 | 1.68 | 15.99 | 0.113 |
| SE | 93.39 | 2.65 | 89.74 | 10.28 | 1.24 | 13.48 | 0.236 |
| SOL | 12.39 | 7.70 | 16.69 | 14.79 | −0.96 | 25 | 0.347 |
| WASO | 19.43 | 10.18 | 28.08 | 36.89 | −0.82 | 13.69 | 0.428 |
| Wake Time | 29.83 | 21.07 | 40.28 | 39.20 | −0.87 | 25 | 0.392 |
| N1 Time | 46.94 | 19.74 | 42.92 | 17.84 | −0.10 | 24 | 0.923 |
| N2 Time | 232.90 | 47.52 | 203.01 | 45.81 | 1.66 | 25 | 0.109 |
| N3 Time | 80.48 | 33.76 | 88.69 | 30.30 | −0.66 | 25 | 0.514 |
| REM Time | 74.22 | 18.20 | 62.42 | 33.88 | 1.14 | 25 | 0.265 |
| NREM Time | 362.65 | 36.95 | 336.72 | 53.71 | 1.47 | 25 | 0.154 |
| Number of Awakenings | 16.07 | 6.04 | 14.69 | 7.86 | 0.51 | 25 | 0.612 |
| Total Stage Shifts | 129.21 | 24.95 | 126.31 | 35.12 | 0.25 | 25 | 0.805 |
| Number of Arousals in REM | 12.36 | 7.41 | 12.38 | 8.09 | −0.01 | 25 | 0.993 |
| Number of Arousals in Non-REM | 73.43 | 19.64 | 76.15 | 33.38 | −0.26 | 19.13 | 0.801 |
| Sleep Diary | |||||||
| TST | 475.85 | 50.67 | 389.23 | 70.14 | 3.61 | 24 | 0.001 * |
| SOL | 12.89 | 6.60 | 27.69 | 35.51 | −1.48 | 12.83 | 0.163 |
| WASO | 6.38 | 8.20 | 17.85 | 20.80 | −1.64 | 11.33 | 0.128 |
| Sleep Quality Rating (1–7) | 4.54 | 1.51 | 3.92 | 0.95 | 1.24 | 20.29 | 0.228 |
| Number of Awakenings | 1.92 | 1.88 | 3.42 | 4.42 | −1.08 | 22 | 0.291 |
| Subject-Objective Discrepancy | |||||||
| TST | 32.38 | 31.95 | −4.19 | 92.12 | 1.35 | 14.85 | 0.196 |
| SOL | 2.08 | 4.59 | 11.00 | 29.18 | −1.09 | 12.59 | 0.297 |
| WASO | −12.21 | 12.27 | −14.35 | 43.42 | 0.20 | 13.76 | 0.847 |
| Good Sleepers (n = 14) | Insomnia (n = 15) | ||||||
|---|---|---|---|---|---|---|---|
| Measure | M | SD | M | SD | t | df | Sig. (2-tailed) |
| Average EEG Power | |||||||
| LF delta | 227.26 | 132.69 | 208.15 | 85.48 | 0.45 | 26 | 0.660 |
| RF delta | 263.67 | 153.41 | 226.53 | 113.74 | 0.51 | 24 | 0.618 |
| LF theta | 13.87 | 4.78 | 13.82 | 3.78 | 0.03 | 26 | 0.975 |
| RF theta | 15.58 | 4.90 | 15.29 | 3.82 | 0.17 | 24 | 0.870 |
| LF alpha | 5.00 | 2.60 | 4.37 | 1.18 | 0.80 | 26 | 0.430 |
| RF alpha | 5.99 | 2.85 | 5.08 | 1.40 | 1.00 | 24 | 0.327 |
| LF sigma | 0.71 | 0.23 | 0.93 | 0.45 | −1.68 | 27 | 0.104 |
| RF sigma | 0.85 | 0.29 | 1.09 | 0.49 | −1.56 | 25 | 0.132 |
| LF beta-1 | 0.87 | 0.27 | 1.04 | 0.40 | −1.36 | 27 | 0.186 |
| RF beta-1 | 0.95 | 0.30 | 1.17 | 0.50 | 0.51 | 25 | 0.181 |
| LF beta-2 | 0.57 | 0.36 | 0.63 | 0.26 | −0.54 | 27 | 0.594 |
| RF beta-2 | 0.60 | 0.32 | 0.74 | 0.44 | −1.08 | 25 | 0.279 |
| LF beta Average | 0.71 | 0.31 | 0.84 | 0.32 | −1.10 | 27 | 0.277 |
| RF beta Average | 0.78 | 0.30 | 0.96 | 0.46 | −1.27 | 25 | 0.216 |
| ORP Measures | |||||||
| ORP Non-REM | 0.50 | 0.17 | 0.51 | 0.18 | −0.23 | 27 | 0.905 |
| ORP REM | 0.67 | 0.30 | 0.74 | 0.40 | −7.08 | 27 | 0.638 |
| ORP N1 | 0.84 | 0.26 | 0.89 | 0.25 | −1.06 | 27 | 0.609 |
| ORP N2 | 0.53 | 0.18 | 0.54 | 0.17 | −0.33 | 27 | 0.869 |
| ORP N3 | 0.24 | 0.11 | 0.25 | 0.13 | −0.18 | 26 | 0.883 |
| R/L ORP Correlation | 0.87 | 0.09 | 0.87 | 0.12 | 1.03 | 26 | 0.560 |
| ORP Max During Arousal | 1.99 | 0.21 | 2.00 | 0.18 | −0.38 | 27 | 0.925 |
| ORP Baseline Before Arousal | 0.63 | 0.22 | 0.61 | 0.21 | 0.01 | 27 | 0.786 |
| Number of Arousals with ORPMax -ORPBaseline > 0.5 | 45.27 | 16.95 | 48.50 | 26.92 | 0.66 | 27 | 0.886 |
| ORP-9 Post Arousal | 0.81 | 0.20 | 0.80 | 0.23 | 0.03 | 27 | 0.700 |
| Good Sleepers (n = 14) | Insomnia (n = 15) | All | ||||
|---|---|---|---|---|---|---|
| M | SD | M | SD | M | SD | |
| FCI Response Time | ||||||
| Happy | 402.46 | 113.92 | 367.48 | 92.97 | 385.57 | 104.01 |
| Angry | 480.93 | 120.49 | 448.98 | 103.10 | 465.51 | 103.10 |
| Fearful | 496.34 | 115.62 | 488.87 | 87.28 | 492.73 | 101.17 |
| Sad | 487.78 | 128.46 | 460.18 | 89.03 | 474.46 | 110.13 |
| FCI Accuracy | ||||||
| Happy | 0.99 | 0.01 | 0.98 | 0.03 | 0.98 | 0.02 |
| Angry | 0.90 | 0.08 | 0.90 | 0.08 | 0.90 | 0.08 |
| Fearful | 0.84 | 0.12 | 0.79 | 0.12 | 0.82 | 0.12 |
| Sad | 0.86 | 0.09 | 0.82 | 0.13 | 0.84 | 0.11 |
| FCI Intensity Ratings | ||||||
| Happy | 2.87 | 0.49 | 2.96 | 0.75 | 2.91 | 0.62 |
| Angry | 3.30 | 0.51 | 3.23 | 0.48 | 3.26 | 0.48 |
| Fearful | 3.39 | 0.48 | 3.29 | 0.41 | 3.34 | 0.44 |
| Sad | 2.92 | 0.56 | 2.99 | 0.55 | 2.95 | 0.55 |
| EST Interference (Faces) | ||||||
| Happy | 95.75 | 58.77 | 85.15 | 61.47 | 90.63 | 59.25 |
| Angry | 126.06 | 91.91 | 133.65 | 86.48 | 129.73 | 86.48 |
| Sad | 109.55 | 100.90 | 119.61 | 76.94 | 114.41 | 88.69 |
| Neutral | 137.52 | 95.87 | 122.94 | 101.22 | 130.48 | 96.99 |
| EST RT Incongruent Trials (Distractors) | ||||||
| Happy | 1048.60 | 178.36 | 1029.85 | 162.81 | 1039.55 | 168.24 |
| Angry | 994.90 | 144.24 | 977.89 | 158.19 | 986.69 | 148.15 |
| Sad | 1000.10 | 180.46 | 956.92 | 148.14 | 979.25 | 164.18 |
| Neutral | 997.75 | 207.40 | 951.96 | 161.64 | 975.13 | 184.82 |
© 2020 by the authors. Licensee MDPI, Basel, Switzerland. This article is an open access article distributed under the terms and conditions of the Creative Commons Attribution (CC BY) license (http://creativecommons.org/licenses/by/4.0/).
Share and Cite
Howlett, R.D.M.; Lustig, K.A.; MacDonald, K.J.; Cote, K.A. Hyperarousal Is Associated with Socioemotional Processing in Individuals with Insomnia Symptoms and Good Sleepers. Brain Sci. 2020, 10, 112. https://doi.org/10.3390/brainsci10020112
Howlett RDM, Lustig KA, MacDonald KJ, Cote KA. Hyperarousal Is Associated with Socioemotional Processing in Individuals with Insomnia Symptoms and Good Sleepers. Brain Sciences. 2020; 10(2):112. https://doi.org/10.3390/brainsci10020112
Chicago/Turabian StyleHowlett, Reuben D. M., Kari A. Lustig, Kevin J. MacDonald, and Kimberly A. Cote. 2020. "Hyperarousal Is Associated with Socioemotional Processing in Individuals with Insomnia Symptoms and Good Sleepers" Brain Sciences 10, no. 2: 112. https://doi.org/10.3390/brainsci10020112