Towards the Development of an Integrative, Evidence-Based Suite of Indicators for the Prediction of Outcome Following Mild Traumatic Brain Injury: Results from a Pilot Study

 , and
, and
Abstract
:1. Introduction
2. Methods
2.1. Participant Recruitment and Inclusion Criteria
2.2. General Data Collection Protocol
2.3. Measures
2.3.1. Neuropsychological Test Battery
2.3.2. Blood Collection and Blood-based Biomarker Quantification
2.3.3. MRI Data Collection
2.4. Diagnosis of PPCS
2.5. Statistical Analyses
Predictors of PPCS
2.6. MRI Data Analyses
2.6.1. Tract-Based Spatial Statistics
2.6.2. Region of Interest Analyses
3. Results
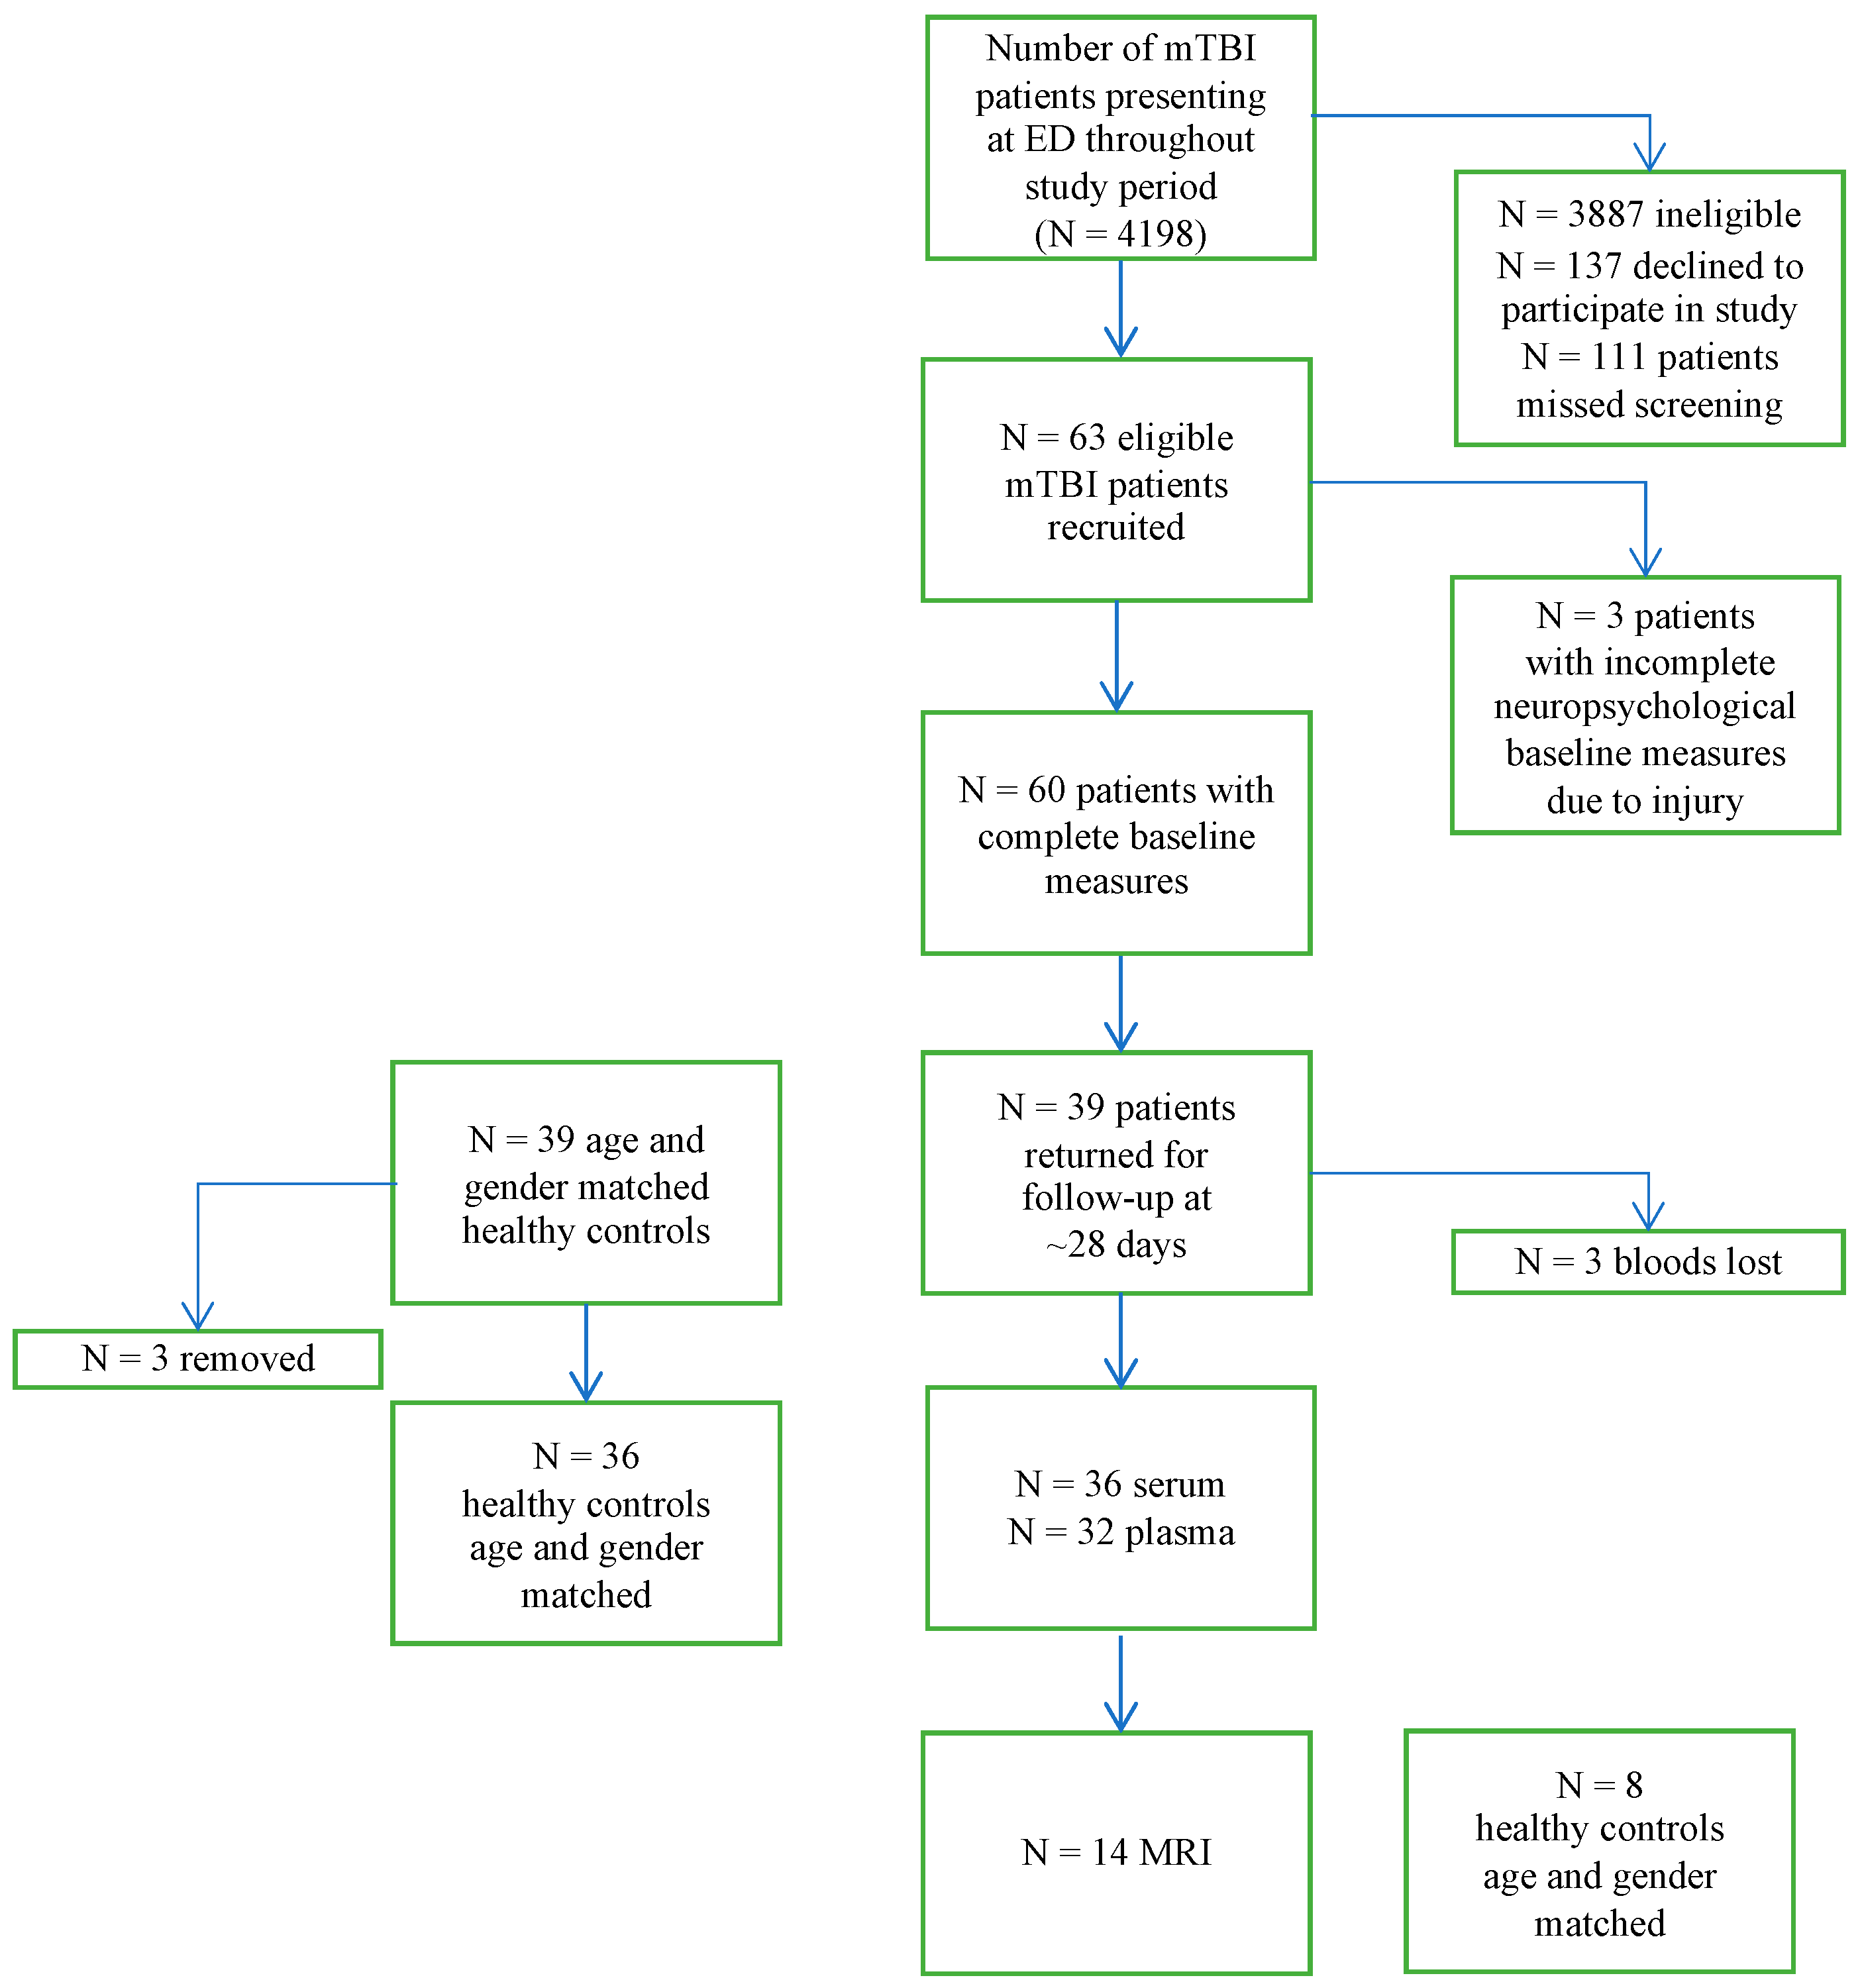
3.1. Study Sample
3.2. Characteristics of Participants Included in the Study and Participants Lost to Follow-Up
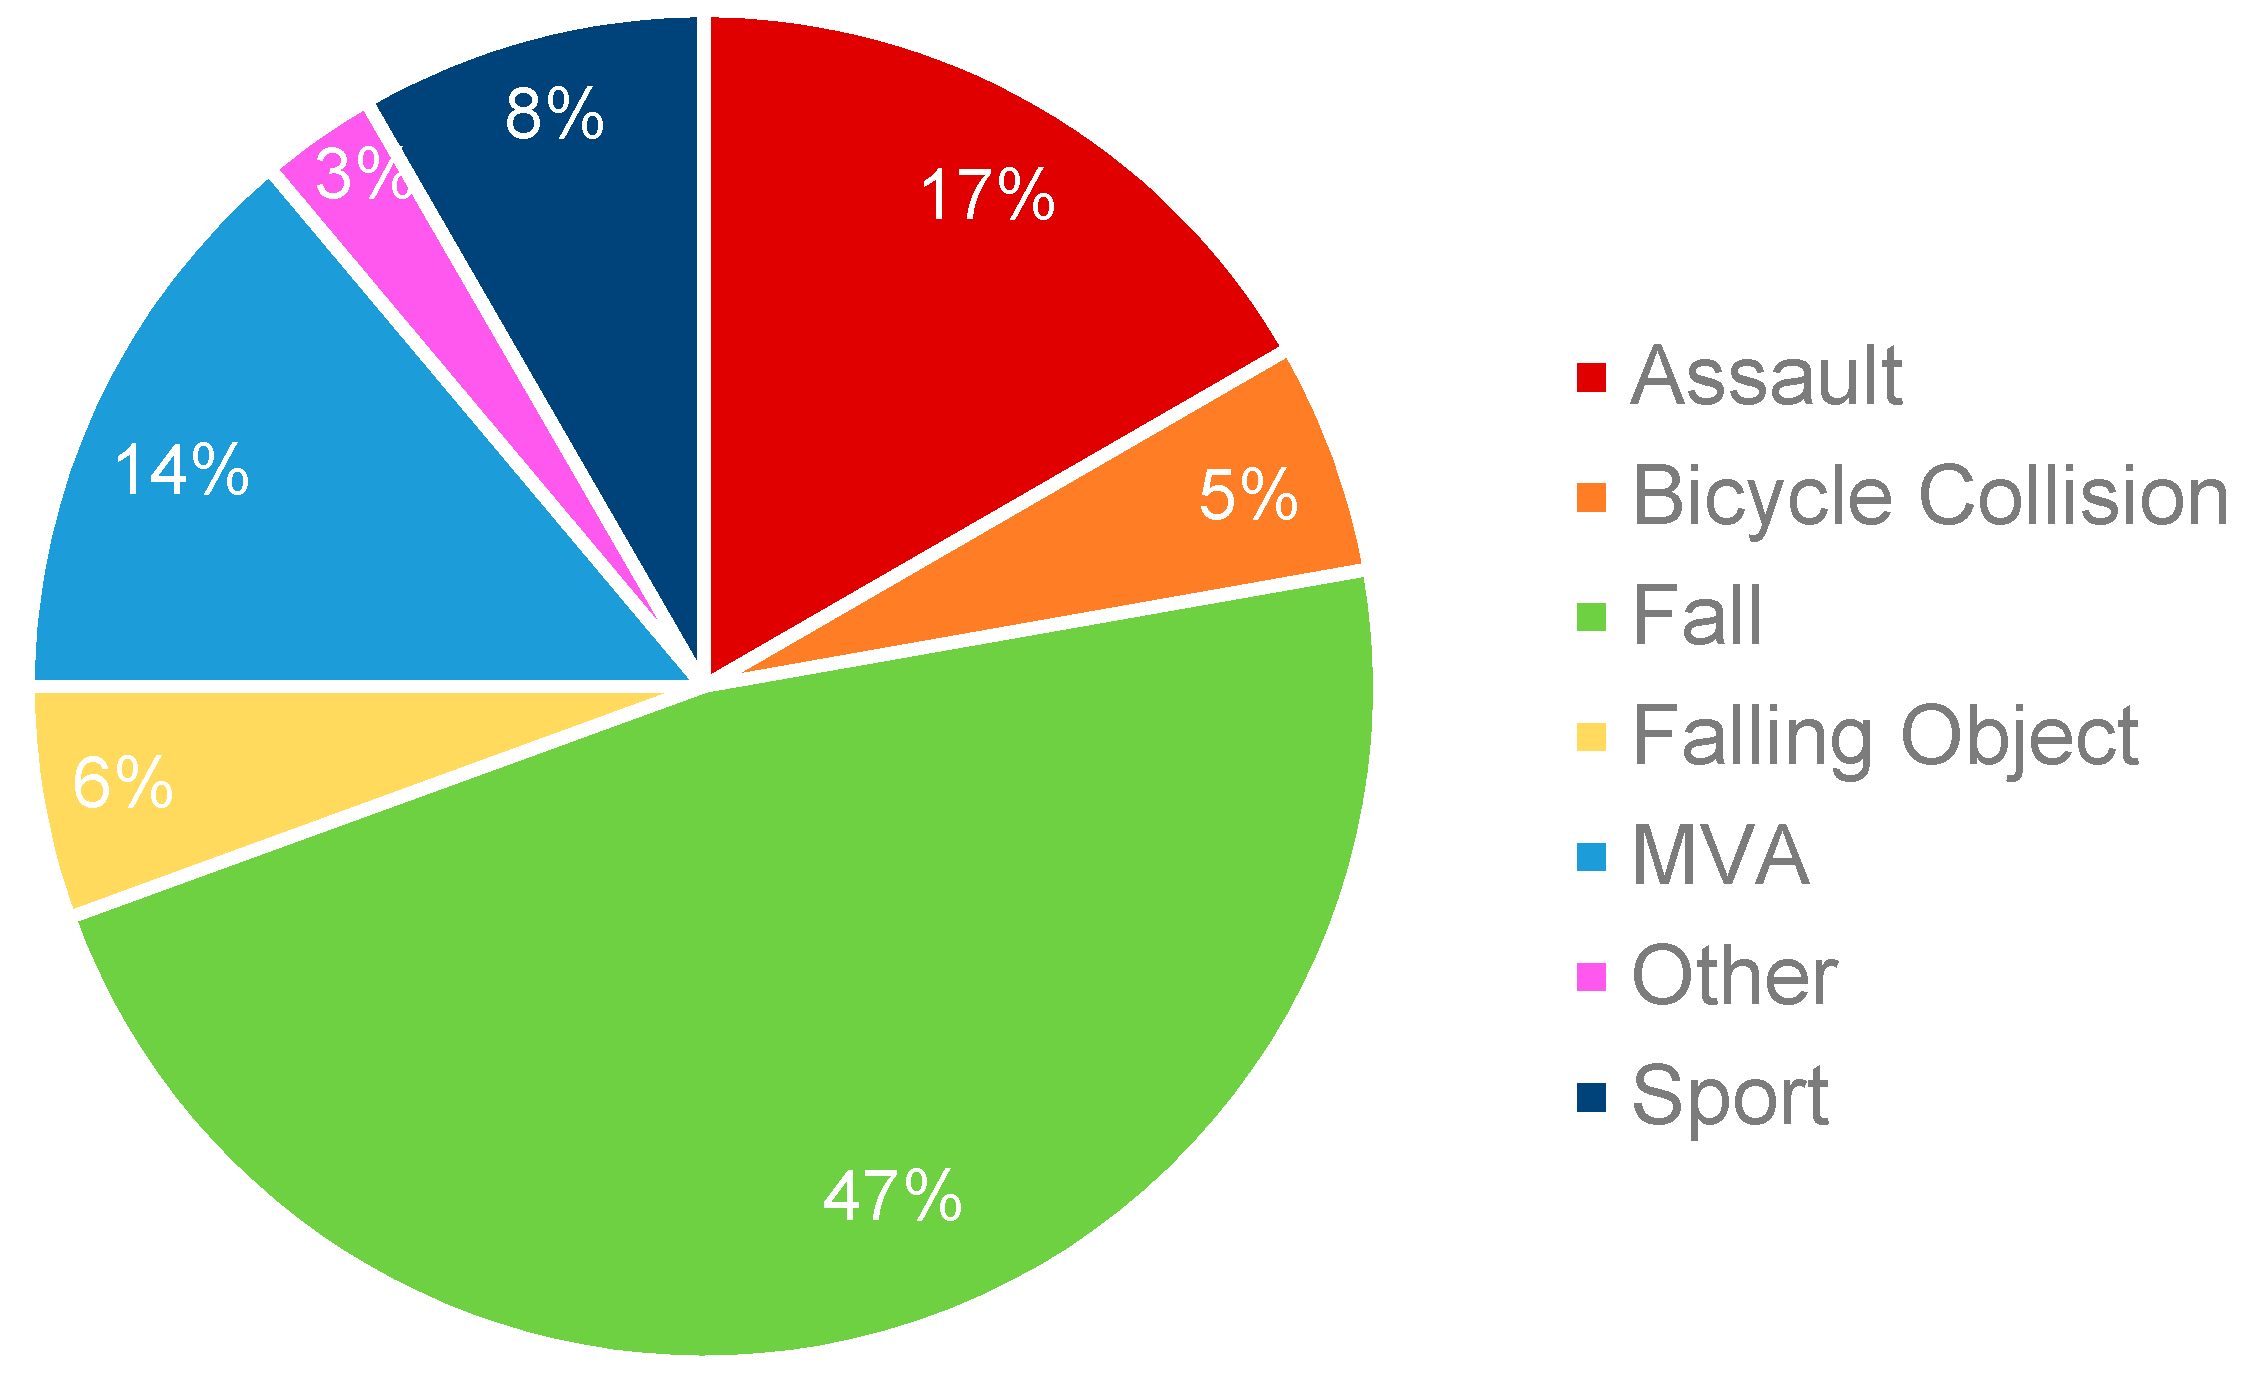
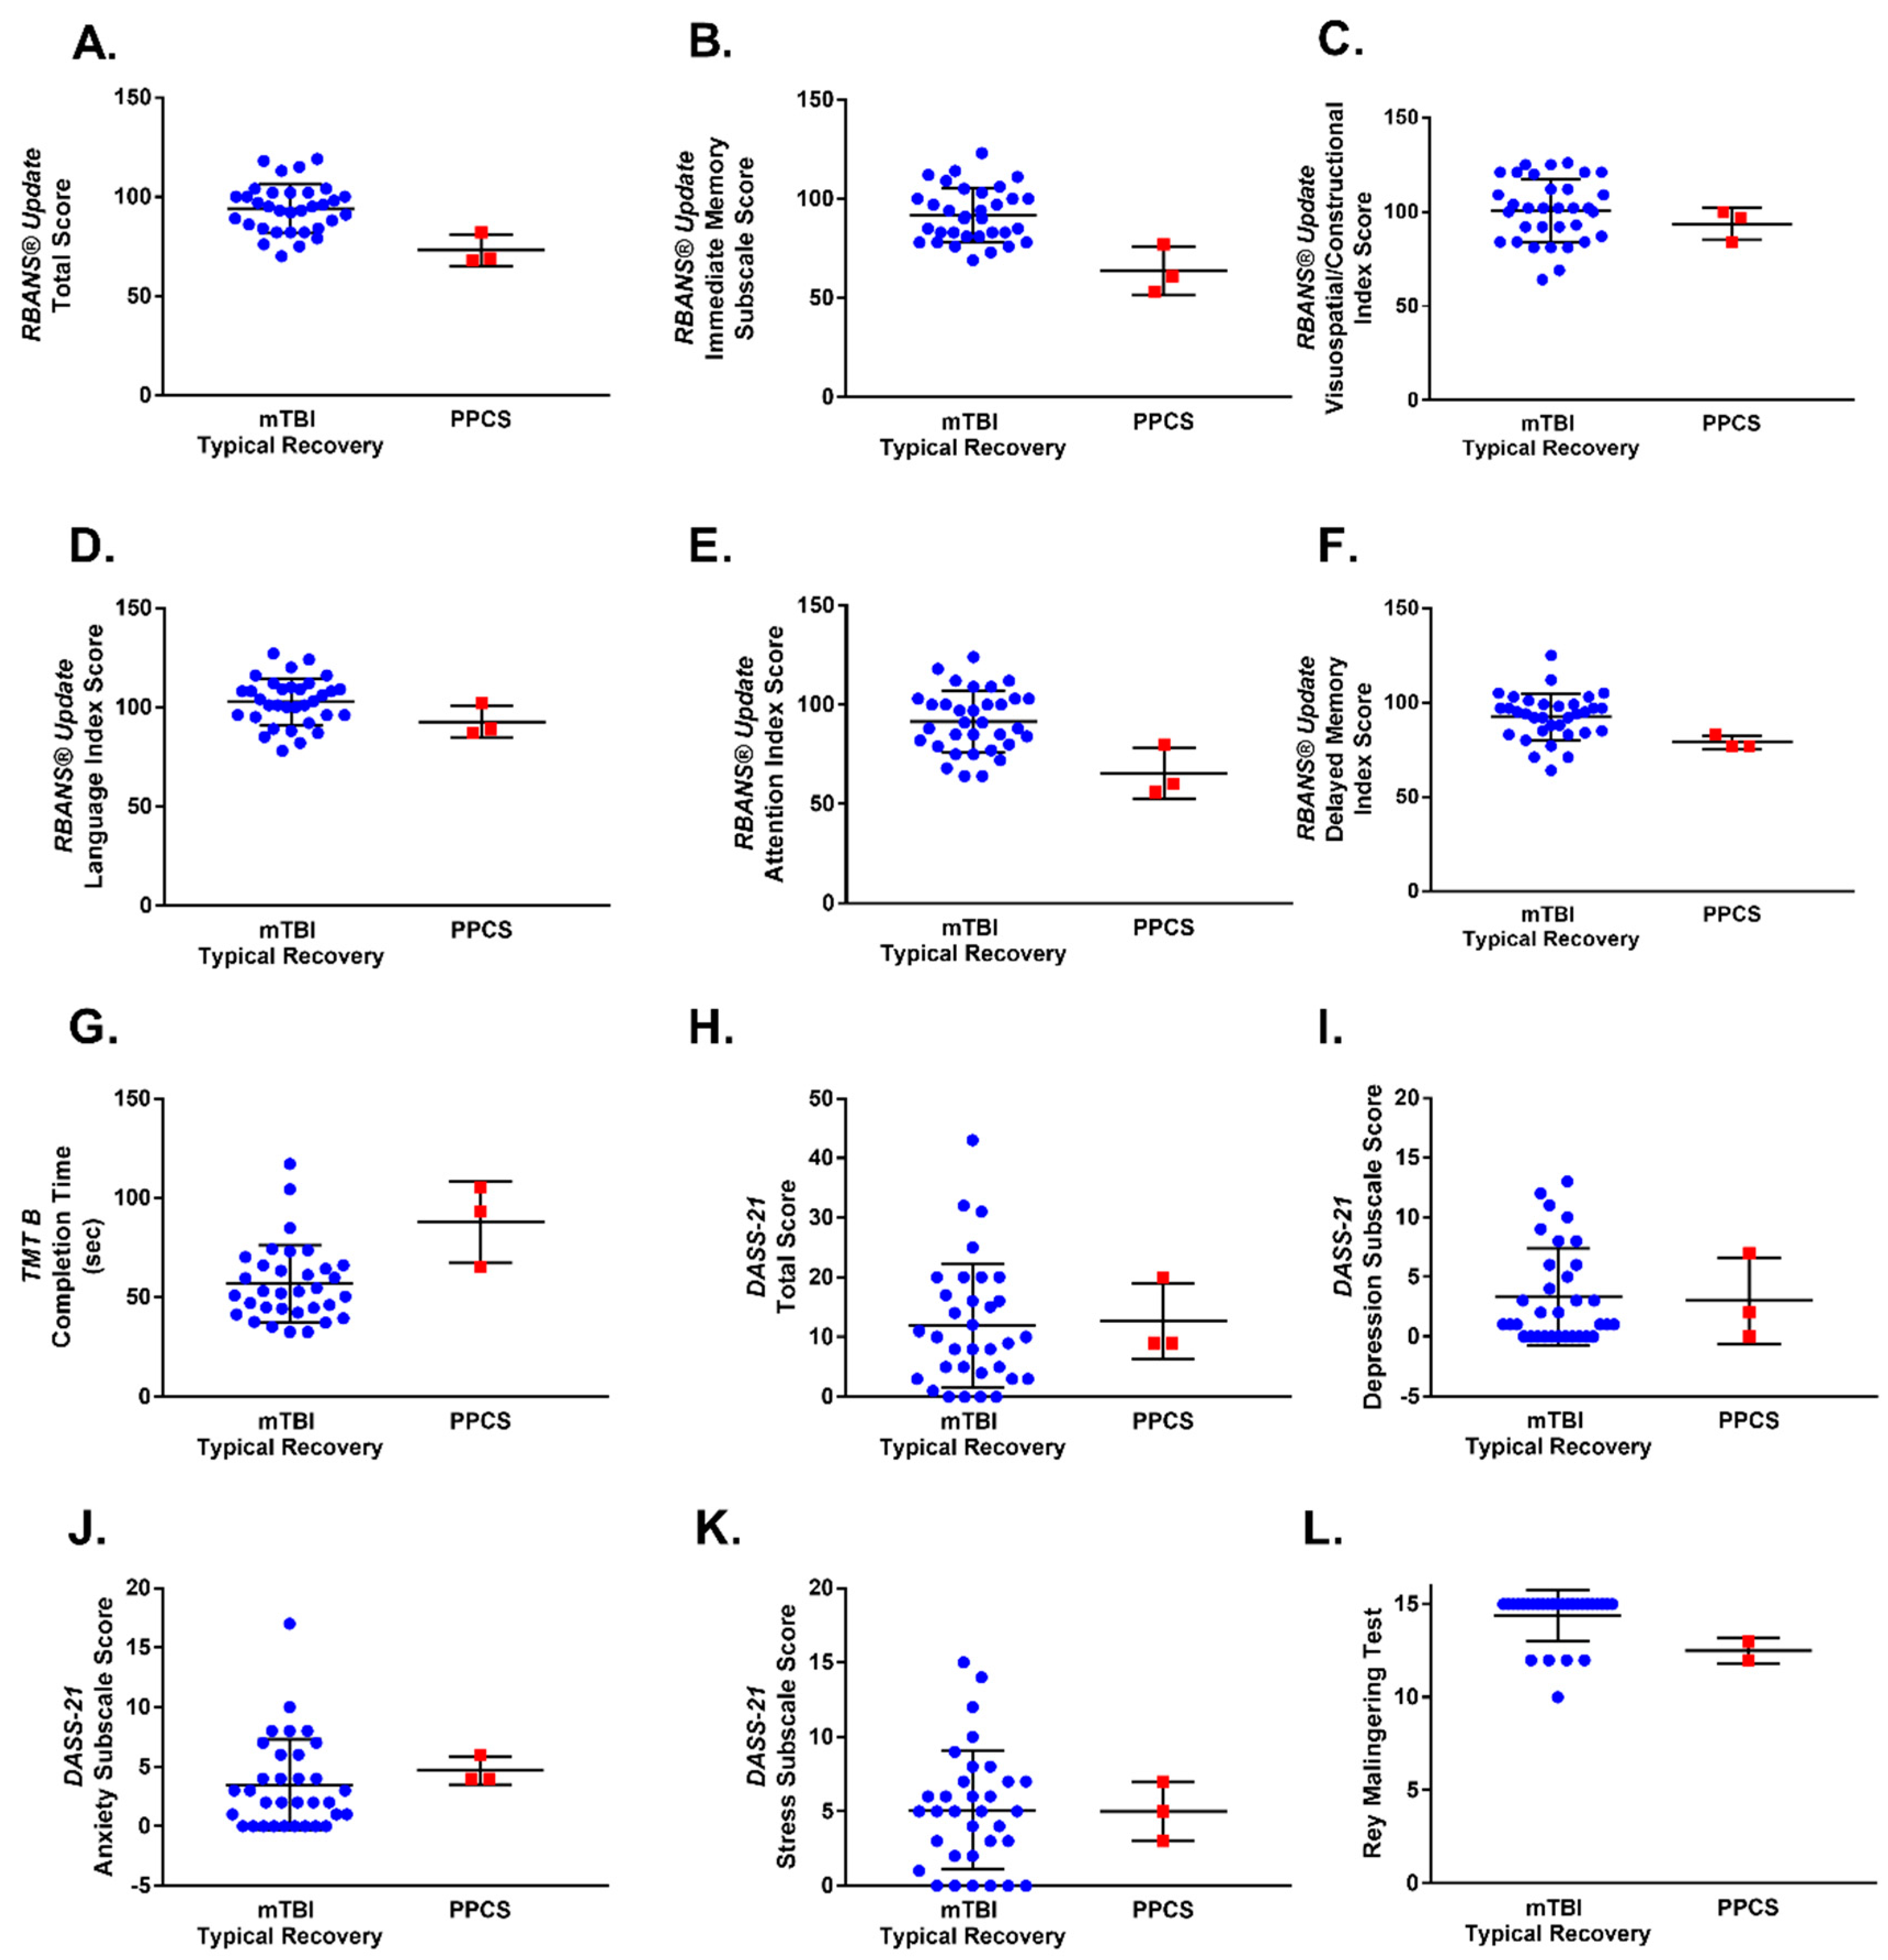
3.3. Characteristics of Patients with mTBI and PPCS
3.4. Predictors of PPCS
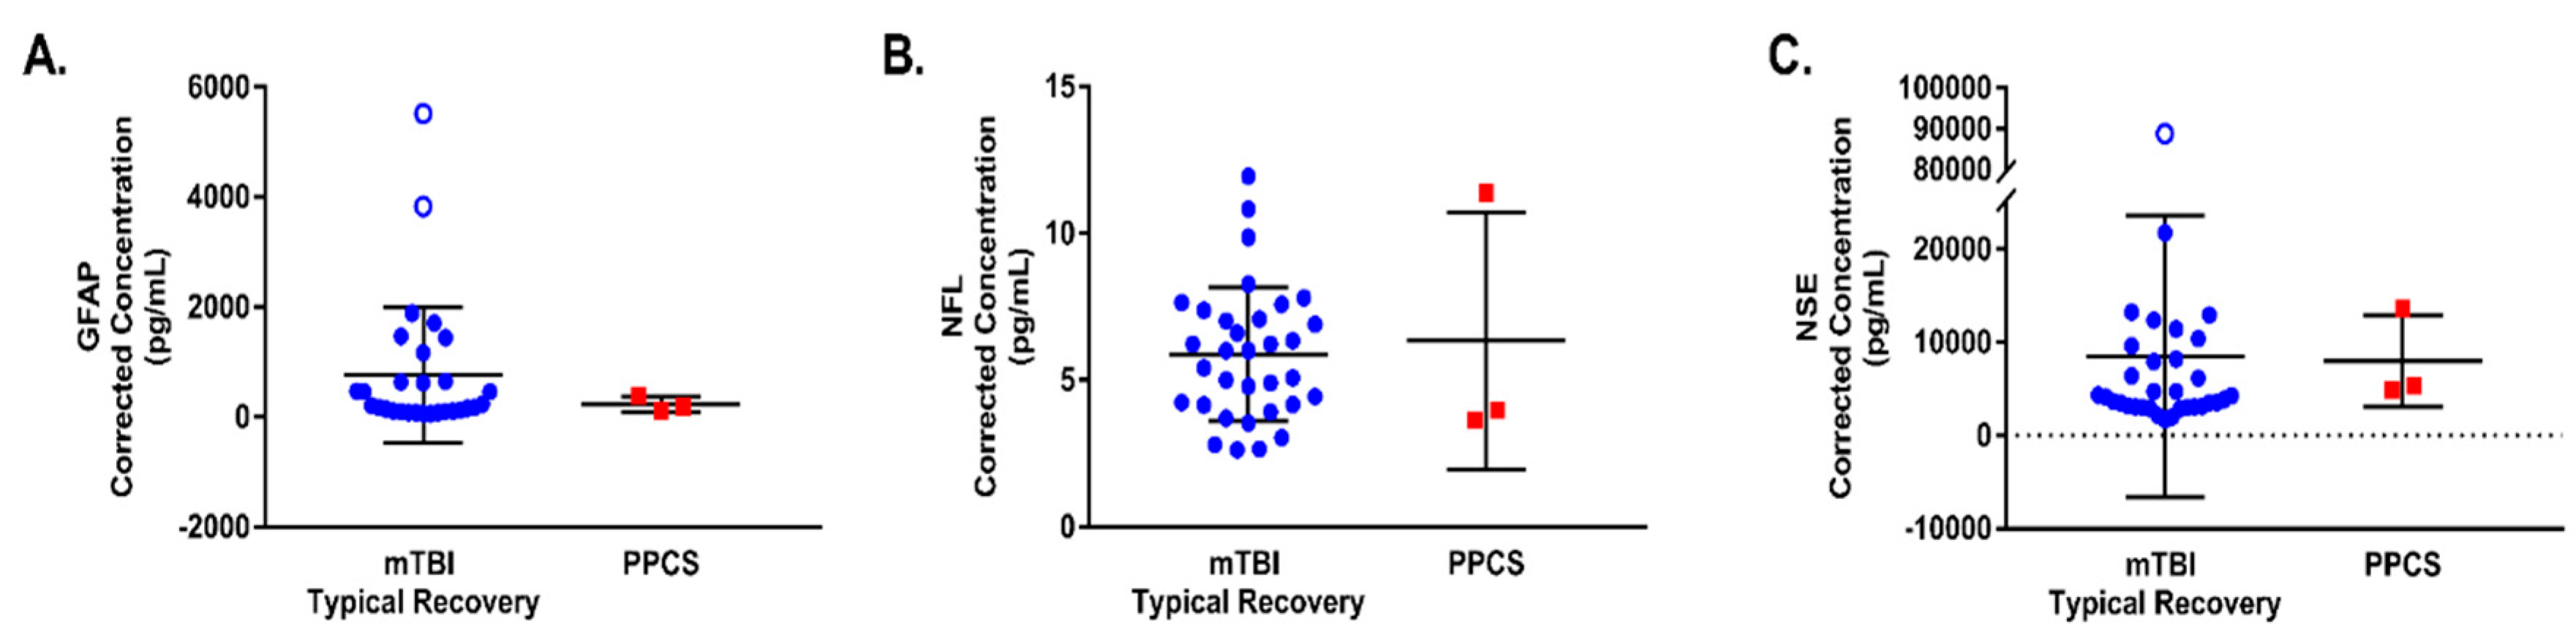
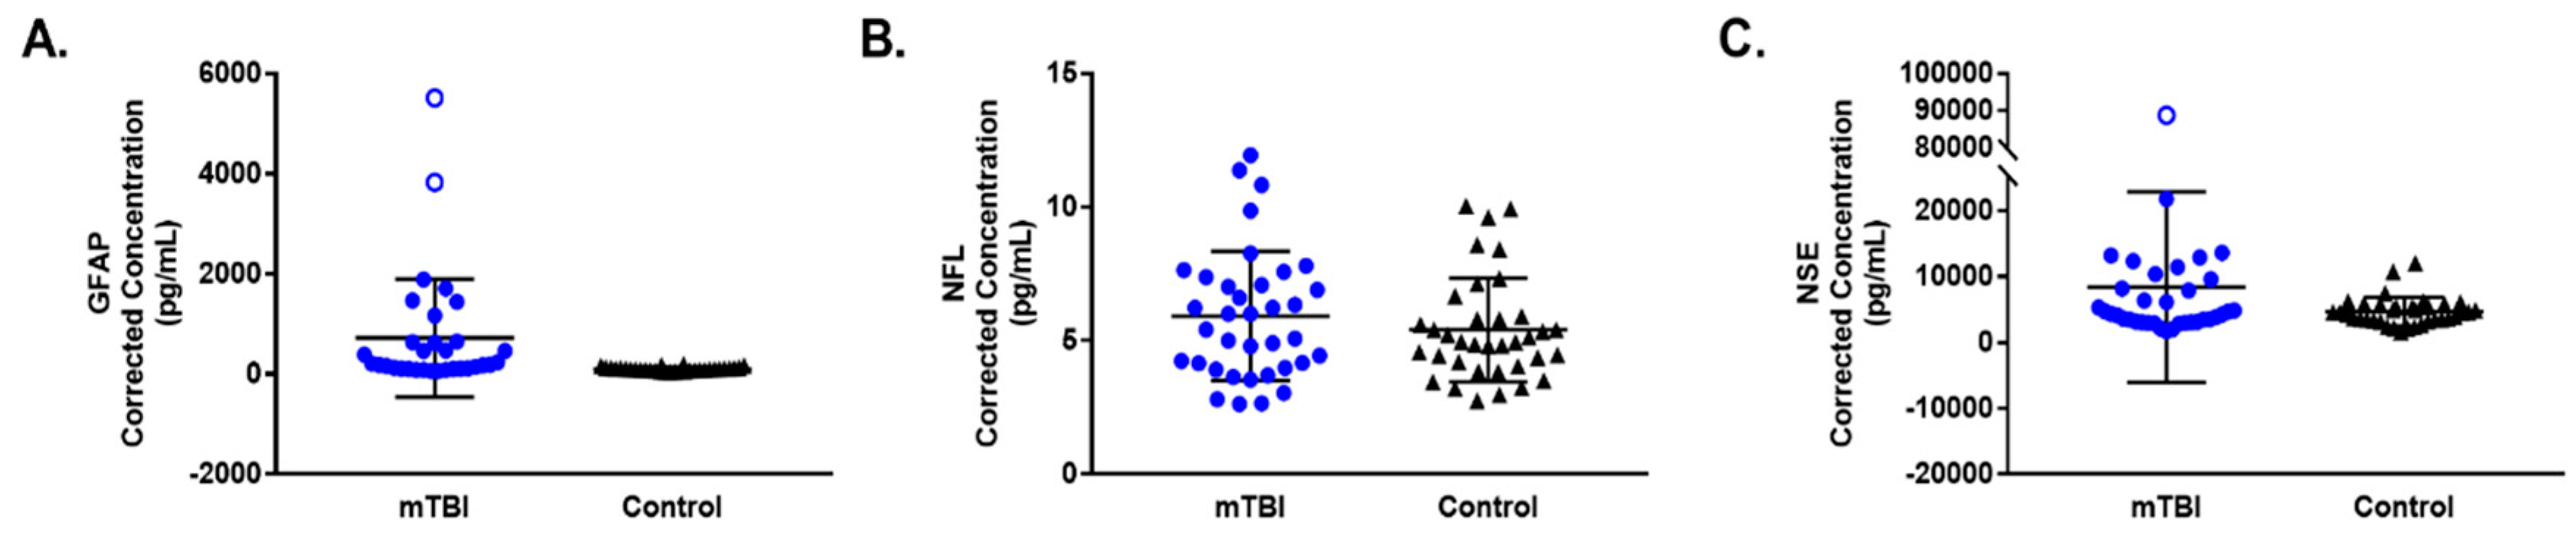
3.5. Differences in Biomarkers between mTBI and Healthy Controls
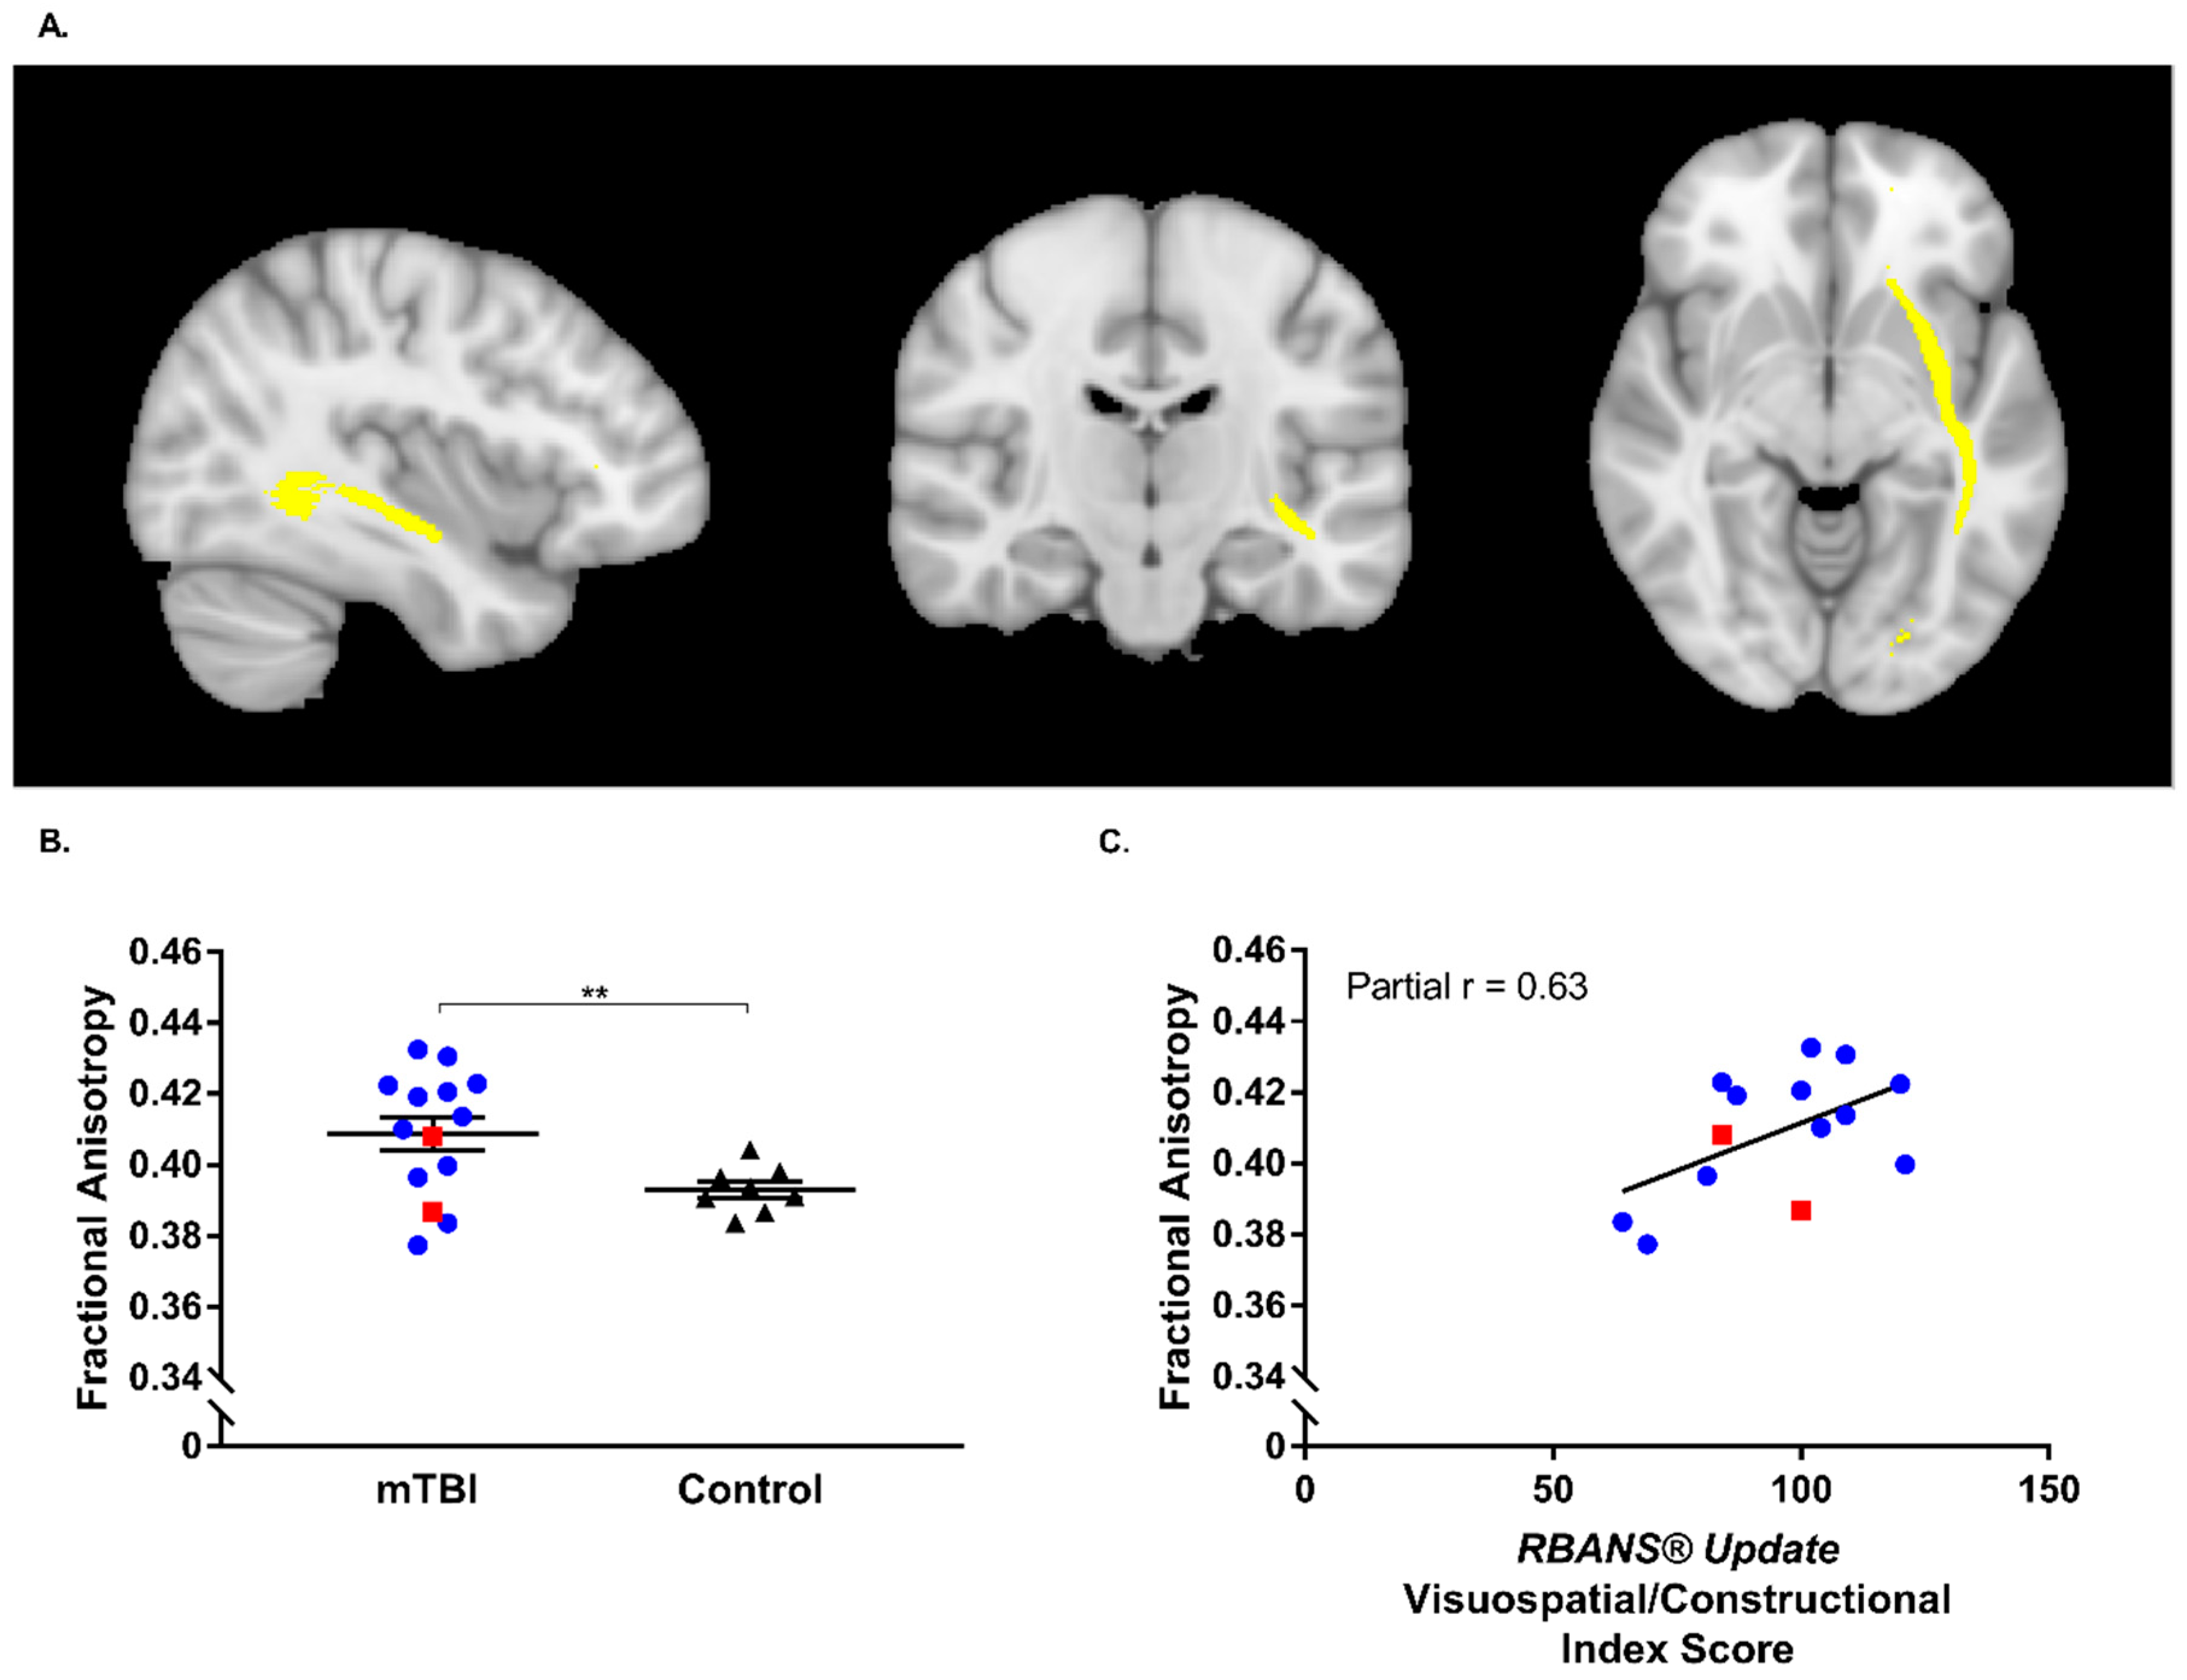
3.6. Neuroimaging Outcomes
4. Discussion
Author Contributions
Funding
Acknowledgments
Conflicts of Interest
References
- NSW Institute of Trauma and Injury Management. Ministry of Health Adult Trauma Clinical Practice Guidelines: Initial Management of Closed Head Injury in Adults; NSW Institute of Trauma and Injury Management: Sydney, Australia, 2011.
- American Congress of Rehabilitation Medicine. Definition of mild traumatic brain injury. J. Head Trauma Rehabil. 1993, 8, 86–87. [Google Scholar] [CrossRef]
- Pardini, D.; Stump, J.; Lovell, M.; Collins, M.; Moritz, K.; Fu, F. The Post-Concussion Symptom Scale (PCSS): A factor analysis. Br. J. Sports Med. 2004, 38, 654–664. [Google Scholar]
- Faul, M.; Xu, L.; Wald, M.M.; Coronado, V.G. Traumatic brain injury in the United States: Emergency department visits, hospitalizations and deaths 2002–2006. U.S. Dep. Heal. Hum. Serv. Centers Dis. Control Prev. Natl. Cent. Inj. Prev. Control 2010, 113, 399–400. [Google Scholar]
- King, N. Literature review Mild head injury: Neuropathology, sequelae, measurement and recovery. Br. J. Clin. Psychol. 1997, 36, 161–184. [Google Scholar] [CrossRef]
- Carroll, L.J.; Cassidy, J.D.; Cancelliere, C.; Côté, P.; Hincapié, C.A.; Kristman, V.L.; Holm, L.W.; Borg, J.; Nygren-De Boussard, C.; Hartvigsen, J. Systematic review of the prognosis after mild traumatic brain injury in adults: Cognitive, psychiatric, and mortality outcomes: Results of the international collaboration on mild traumatic brain injury prognosis. Arch. Phys. Med. Rehabil. 2014, 95, S152–S173. [Google Scholar] [CrossRef]
- Covassin, T.; Moran, R.; Wilhelm, K. Concussion symptoms and neurocognitive performance of high school and college athletes who incur multiple concussions. Am. J. Sports Med. 2013, 41, 2885–2889. [Google Scholar] [CrossRef]
- McCrea, M.; Guskiewicz, K.; Randolph, C.; Barr, W.B.; Hammeke, T.A.; Marshall, S.W.; Powell, M.R.; Ahn, K.W.; Wang, Y.; Kelly, J.P. Incidence, clinical course, and predictors of prolonged recovery time following sport-related concussion in high school and college athletes. J. Int. Neuropsychol. Soc. 2013, 19, 22–33. [Google Scholar] [CrossRef]
- Stålnacke, B.M.; Björnstig, U.; Karlsson, K.; Sojka, P. One-year follow-up of mild traumatic brain injury: Post-concussion symptoms, disabilities and life satisfaction in relation to serum levels of S-100B and neuron-specific enolase in acute phase. J. Rehabil. Med. 2005, 37, 300–305. [Google Scholar] [CrossRef] [Green Version]
- Willer, B.; Leddy, J.J. Management of concussion and post-concussion syndrome. Curr. Treat. Options Neurol. 2006, 8, 415–426. [Google Scholar] [CrossRef]
- Rivara, F.P.; Graham, R. Sports-Related Concussions in Youth: Report from the Institute of Medicine and National Reseach Council. J. Am. Med. Assoc. 2013, 311, 239–240. [Google Scholar] [CrossRef]
- Marshall, C.M. Sports-related concussion: A narrative review of the literature. J. Can. Chiropr. Assoc. 2012, 56, 299–310. [Google Scholar]
- Carroll, L.J.; Cassidy, J.D.; Peloso, P.M.; Borg, J.; Von Holst, H.; Holm, L.; Paniak, C.; Pépin, M. Prognosis for mild traumatic brain injury: Results of the WHO Collaborating Centre Task Force on mild traumatic brain injury. J. Rehabil. Med. 2004, 36, 84–105. [Google Scholar] [CrossRef] [Green Version]
- Kashluba, S.; Paniak, C.; Blake, T.; Reynolds, S.; Toller-Lobe, G.; Nagy, J. A longitudinal, controlled study of patient complaints following treated mild traumatic brain injury. Arch. Clin. Neuropsychol. 2004, 19, 805–816. [Google Scholar] [CrossRef] [Green Version]
- Reuben, A.; Sampson, P.; Harris, A.R.; Williams, H.; Yates, P. Postconcussion syndrome (PCS) in the emergency department: Predicting and pre-empting persistent symptoms following a mild traumatic brain injury. Emerg. Med. J. 2012, 31, 72–77. [Google Scholar] [CrossRef]
- Ponsford, J.; Willmott, C.; Rothwell, A.; Cameron, P.; Kelly, A.M.; Nelms, R.; Curran, C.; Kim, N.G. Factors influencing outcome following mild traumatic brain injury in adults. J. Int. Neuropsychol. Soc. 2000, 6, 568–579. [Google Scholar] [CrossRef]
- Kraus, J.F.; Nourjah, P. The epidemiology of mild, uncomplicated brain injury. J. Trauma Inj. Infect. Crit. Care 1988, 28, 1637–1643. [Google Scholar] [CrossRef]
- King, N.; Kirwilliam, S. Permanent post-concussion symptoms after mild head injury. Brain Inj. 2011, 25, 462–470. [Google Scholar] [CrossRef]
- Kirsch, N.L.; de Leon, M.B.; Maio, R.F.; Millis, S.R.; Tan-Schriner, C.U.; Frederiksen, S. Characteristics of a mild head injury subgroup with extreme, persisting distress on the Rivermead Postconcussion Symptoms Questionnaire. Arch. Phys. Med. Rehabil. 2010, 91, 35–42. [Google Scholar] [CrossRef]
- Ponsford, J.; Cameron, P.; Fitzgerald, M.; Grant, M.; Mikocka-Walus, A.; Schönberger, M. Predictors of postconcussive symptoms 3 months after mild traumatic brain injury. Neuropsychology 2012, 26, 304–313. [Google Scholar] [CrossRef]
- Nelson, L.D.; Furger, R.E.; Ranson, J.; Tarima, S.; Hammeke, T.A.; Randolph, C.; Barr, W.B.; Guskiewicz, K.K.; Olsen, C.M.; Lerner, E.B.; et al. Acute clinical predictors of symptom recovery in emergency department patients with uncomplicated mild traumatic brain injury (mTBI) or non-TBI Injuries. J. Neurotrauma 2018, 35, 249–259. [Google Scholar] [CrossRef]
- Graves, A.B.; White, E.; Koepsell, T.D.; Reifler, B.V.; Van Belle, G.; Larson, E.B.; Rasking, M. The association between head trauma and Alzheimer’s Disease. Am. J. Epidemiol. 1990, 131, 491–501. [Google Scholar] [CrossRef]
- Guskiewicz, K.M.; Marshall, S.W.; Bailes, J.; McCrea, M.; Cantu, R.C.; Randolph, C.; Jordan, B.D. Association between Recurrent Concussion and Late-Life Cognitive Impairment in Retired Professional Football Players. Neurosurgery 2005, 57, 719–726. [Google Scholar] [CrossRef]
- Mayeux, R.; Ottman, R.; Maestre, G.; Ngai, C.; Tang, M.X.; Ginsberg, H.; Chun, M.; Tycko, B.; Shelanski, M. Synergistic effects of traumatic head injury and apolipoprotein-epsilon4 in patients with alzheimer’s disease. Neurology 1995, 45, 555–557. [Google Scholar] [CrossRef]
- Baugh, C.M.; Stamm, J.M.; Riley, D.O.; Gavett, B.E.; Shenton, M.E.; Lin, A.; Nowinski, C.J.; Cantu, R.C.; McKee, A.C.; Stern, R.A. Chronic traumatic encephalopathy: Neurodegeneration following repetitive concussive and subconcussive brain trauma. Brain Imaging Behav. 2012, 6, 244–254. [Google Scholar] [CrossRef]
- Gavett, B.E.; Stern, R.A.; McKee, A.C. Chronic Traumatic Encephalopathy: A Potential Late Effect of Sport-Related Concussive and Subconcussive Head Trauma. Clin. Sports Med. 2011, 30, 179–188. [Google Scholar] [CrossRef] [Green Version]
- McKee, A.C.; Cantu, R.C.; Nowinski, C.J.; Hedley-Whyte, E.T.; Gavett, B.E.; Budson, A.E.; Santini, V.E.; Lee, H.S.; Kubilus, C.A.; Stern, R.A. Chronic traumatic encephalopathy in athletes: Progressive tauopathy after repetitive head injury. J. Neuropathol. Exp. Neurol. 2009, 68, 709–735. [Google Scholar] [CrossRef]
- McKee, A.C.; Stein, T.D.; Nowinski, C.J.; Stern, R.A.; Daneshvar, D.H.; Alvarez, V.E.; Lee, H.-S.; Hall, G.; Wojtowicz, S.M.; Baugh, C.M.; et al. The spectrum of disease in chronic traumatic encephalopathy. Brain 2013, 136, 43–64. [Google Scholar] [CrossRef]
- Omalu, B.I.; DeKosky, S.T.; Minster, R.L.; Kamboh, M.I.; Hamilton, R.L.; Wecht, C.H. Chronic traumatic encephalopathy in a National Football League Player. Neurosurgery 2005, 57, 128–134. [Google Scholar] [CrossRef]
- Stern, R.A.; Riley, D.O.; Daneshvar, D.H.; Nowinski, C.J.; Cantu, R.C.; McKee, A.C. Long-term Consequences of Repetitive Brain Trauma: Chronic Traumatic Encephalopathy. PM&R 2011, 3, S460–S467. [Google Scholar]
- Silverberg, N.D.; Gardner, A.J.; Brubacher, J.R.; Panenka, W.J.; Li, J.J.; Iverson, G.L. Systematic review of multivariable prognostic models for mild traumatic brain injury. J. Neurotrauma 2015, 32, 517–526. [Google Scholar] [CrossRef] [Green Version]
- Hou, R.; Moss-Morris, R.; Peveler, R.; Mogg, K.; Bradley, B.P.; Belli, A. When a minor head injury results in enduring symptoms: A prospective investigation of risk factors for postconcussional syndrome after mild traumatic brain injury. J. Neurol. Neurosurg. Psychiatry 2011, 83, 217–223. [Google Scholar] [CrossRef]
- Bazarian, J.J.; Wong, T.; Harris, M.; Leahey, N.; Mookerjee, S.; Dombovy, M. Epidemiology and predictors of post-concussive syndrome after minor head injury in an emergency population. Brain Inj. 1999, 13, 173–189. [Google Scholar] [CrossRef]
- Lannsjö, M.; Backheden, M.; Johansson, U.; af Geijerstam, J.L.; Borg, J. Does head CT scan pathology predict outcome after mild traumatic brain injury? Eur. J. Neurol. 2012, 20, 124–129. [Google Scholar] [CrossRef]
- McLean, S.A.; Kirsch, N.L.; Tan-Schriner, C.U.; Sen, A.; Frederiksen, S.; Harris, R.E.; Maixner, W.; Maio, R.F. Health status, not head injury, predicts concussion symptoms after minor injury. Am. J. Emerg. Med. 2009, 27, 182–190. [Google Scholar] [CrossRef]
- Meares, S.; Shores, E.A.; Taylor, A.J.; Batchelor, J.; Bryant, R.A.; Baguley, I.J.; Chapman, J.; Gurka, J.; Marosszeky, J.E. The prospective course of postconcussion syndrome: The role of mild traumatic brain injury. Neuropsychology 2011, 25, 454–465. [Google Scholar] [CrossRef] [Green Version]
- Cnossen, M.C.; Winkler, E.A.; Yue, J.K.; Okonkwo, D.O.; Valadka, A.B.; Steyerberg, E.W.; Lingsma, H.F.; Manley, G.T. Development of a Prediction Model for Post-Concussive Symptoms following Mild Traumatic Brain Injury: A TRACK-TBI Pilot Study. J. Neurotrauma 2017, 34, 2396–2409. [Google Scholar] [CrossRef]
- Meares, S.; Shores, E.A.; Taylor, A.J.; Batchelor, J.; Bryant, R.A.; Baguley, I.J.; Chapman, J.; Gurka, J.; Dawson, K.; Capon, L.; et al. Mild traumatic brain injury does not predict acute postconcussion syndrome. J. Neurol. Neurosurg. Psychiatry 2008, 79, 300–306. [Google Scholar] [CrossRef] [Green Version]
- Karr, J.E.; Areshenkoff, C.N.; Garcia-Barrera, M.A. The neuropsychological outcomes of concussion: A systematic review of meta-analyses on the cognitive sequelae of mild traumatic brain injury. Neuropsychology 2014, 28, 321–336. [Google Scholar] [CrossRef]
- Peterson, S.E.; Stull, M.J.; Collins, M.W.; Wang, H.E. Neurocognitive function of emergency department patients with mild traumatic brain injury. Ann. Emerg. Med. 2009, 53, 796–803. [Google Scholar] [CrossRef]
- Dean, P.J.A.; Sterr, A. Long-term effects of mild traumatic brain injury on cognitive performance. Front. Hum. Neurosci. 2013, 7, 30. [Google Scholar] [CrossRef] [Green Version]
- King, N. Emotional, neuropsychological, and organic factors: Their use in the prediction of persisting postconcussion symptoms after moderate and mild head injuries. J. Neurol. Neurosurg. Psychiatry 1996, 61, 75–81. [Google Scholar] [CrossRef] [Green Version]
- Sheedy, J.; Geffen, G.; Donnelly, J.; Faux, S. Emergency department assessment of mild traumatic brain injury and prediction of post-concussion symptoms at one month post injury. J. Clin. Exp. Neuropsychol. 2006, 28, 755–772. [Google Scholar] [CrossRef]
- Sheedy, J.; Harvey, E.; Faux, S.; Geffen, G.; Shores, E.A. Emergency department assessment of mild traumatic brain injury and the prediction of postconcussive symptoms: A 3-month prospective study. J. Head Trauma Rehabil. 2009, 24, 333–343. [Google Scholar] [CrossRef]
- Faux, S.; Sheedy, J.; Delaney, R.; Riopelle, R. Emergency department prediction of post-concussive syndrome following mild traumatic brain injury: An international cross-validation study. Brain Inj. 2011, 25, 14–22. [Google Scholar] [CrossRef]
- Binder, L.M.; Rohling, M.L.; Larrabee, G.J. A review of mild head trauma. Part I: Meta-analytic review of neuropsychological studies. J. Clin. Exp. Neuropsychol. 1997, 19, 421–431. [Google Scholar] [CrossRef]
- Reitan, R.M.; Wolfson, D. Emotional disturbances and their interaction with neuropsychological deficits. Neuropsychol. Rev. 1997, 7, 3–19. [Google Scholar] [CrossRef]
- Dikmen, S.; Machamer, J.; Temkin, N. Mild Head Injury: Facts and Artifacts. J. Clin. Exp. Neuropsychol. 2001, 23, 729–738. [Google Scholar] [CrossRef]
- Taylor, A.E.; Cox, C.A.; Mailis, A. Persistent neuropsychological deficits following whiplash: Evidence for chronic mild traumatic brain injury? Arch. Phys. Med. Rehabil. 1996, 77, 529–535. [Google Scholar] [CrossRef]
- Jeter, C.B.; Hergenroeder, G.W.; Hylin, M.J.; Redell, J.B.; Moore, A.N.; Dash, P.K. Biomarkers for the diagnosis and prognosis of mild traumatic brain injury/concussion. J. Neurotrauma 2013, 30, 657–670. [Google Scholar] [CrossRef]
- Al Nimer, F.; Thelin, E.; Nyström, H.; Dring, A.M.; Svenningsson, A.; Piehl, F.; Nelson, D.W.; Bellander, B.M. Comparative assessment of the prognostic value of biomarkers in traumatic brain injury reveals an independent role for serum levels of neurofilament light. PLoS ONE 2015, 10, e0132177. [Google Scholar] [CrossRef]
- Herrmann, M.; Jost, S.; Kutz, S.; Ebert, A.D.; Kratz, T.; Wunderlich, M.T.; Synowitz, H. Temporal profile of release of neurobiochemical markers of brain damage after traumatic brain injury is associated with intracranial pathology as demonstrated in cranial computerized tomography. J. Neurotrauma 2000, 17, 113–122. [Google Scholar] [CrossRef] [PubMed]
- Martínez-Morillo, E.; Childs, C.; García, B.P.; Álvarez Menéndez, F.V.; Romaschin, A.D.; Cervellin, G.; Lippi, G.; Diamandis, E.P. Neurofilament medium polypeptide (NFM) protein concentration is increased in CSF and serum samples from patients with brain injury. Clin. Chem. Lab. Med. 2015, 53, 1575–1584. [Google Scholar] [CrossRef] [PubMed]
- Merlo, L.; Cimino, F.; Angileri, F.F.; La Torre, D.; Conti, A.; Cardali, S.M.; Saija, A.; Germanò, A. Alteration in synaptic junction proteins following traumatic brain injury. J. Neurotrauma 2014, 31, 1375–1385. [Google Scholar] [CrossRef] [PubMed]
- Neselius, S.; Brisby, H.; Theodorsson, A.; Blennow, K.; Zetterberg, H.; Marcusson, J. Csf-biomarkers in olympic boxing: Diagnosis and effects of repetitive head trauma. PLoS ONE 2012, 7, e33606. [Google Scholar] [CrossRef] [PubMed]
- Neselius, S.; Zetterberg, H.; Blennow, K.; Marcusson, J.; Brisby, H. Increased CSF Levels of Phosphorylated Neurofilament Heavy Protein following Bout in Amateur Boxers. PLoS ONE 2013, 8, e81249. [Google Scholar] [CrossRef] [PubMed] [Green Version]
- Oliver, J.M.; Jones, M.T.; Kirk, K.M.; Gable, D.A.; Repshas, J.T.; Johnson, T.A.; Andréasson, U.; Norgren, N.; Blennow, K.; Zetterberg, H. Serum neurofilament light in American football athletes over the course of a season. J. Neurotrauma 2016, 33, 1784–1789. [Google Scholar] [CrossRef]
- Shahim, P.; Zetterberg, H.; Tegner, Y.; Blennow, K. Serum neurofilament light as a biomarker for mild traumatic brain injury in contact sports. Neurology 2017, 88, 1788–1794. [Google Scholar] [CrossRef] [Green Version]
- Yang, Z.; Wang, K.K.W. Glial fibrillary acidic protein: From intermediate filament assembly and gliosis to neurobiomarker. Trends Neurosci. 2015, 38, 364–374. [Google Scholar] [CrossRef] [Green Version]
- Zhang, Z.; Zoltewicz, J.S.; Mondello, S.; Newsom, K.J.; Yang, Z.; Yang, B.; Kobeissy, F.; Guingab, J.; Glushakova, O.; Robicsek, S.; et al. Human traumatic brain injury induces autoantibody response against glial fibrillary acidic protein and its breakdown products. PLoS ONE 2014, 9, e92698. [Google Scholar] [CrossRef] [Green Version]
- Geddes, D.M.; Cargill, R.S.; LaPlaca, M.C. Mechanical stretch to neurons results in a strain rate and magnitude-dependent increase in plasma membrane permeability. J. Neurotrauma 2003, 20, 1039–1049. [Google Scholar] [CrossRef]
- Di Battista, A.P.; Rhind, S.G.; Baker, A.J. Application of blood-based biomarkers in human mild traumatic brain injury. Front. Neurol. 2013, 4, 1–7. [Google Scholar] [CrossRef] [PubMed] [Green Version]
- Wang, K.K.; Yang, Z.; Zhu, T.; Shi, Y.; Rubenstein, R.; Tyndall, J.A.; Manley, G.T. An update on diagnostic and prognostic biomarkers for traumatic brain injury. Expert Rev. Mol. Diagn. 2018, 18, 165–180. [Google Scholar] [CrossRef] [PubMed]
- Messé, A.; Caplain, S.; Pélégrini-Issac, M.; Blancho, S.; Montreuil, M.; Lévy, R.; Lehéricy, S.; Benali, H. Structural integrity and postconcussion syndrome in mild traumatic brain injury patients. Brain Imaging Behav. 2012, 6, 283–292. [Google Scholar] [CrossRef] [PubMed]
- Shenton, M.E.; Hamoda, H.M.; Schneiderman, J.S.; Bouix, S.; Pasternak, O.; Rathi, Y.; Vu, M.-A.; Purohit, M.P.; Helmer, K.; Koerte, I.; et al. A review of magnetic resonance imaging and diffusion tensor imaging findings in mild traumatic brain injury. Brain Imaging Behav. 2012, 6, 137–192. [Google Scholar] [CrossRef] [PubMed]
- Niogi, S.; Mukherjee, P. Diffusion tensor imaging of mild traumatic brain injury. J. Head Trauma Rehabil. 2010, 25, 241–255. [Google Scholar] [CrossRef] [PubMed]
- Messé, A.; Caplain, S.; Paradot, G.; Garrigue, D.; Mineo, J.F.; Soto Ares, G.; Ducreux, D.; Vignaud, F.; Rozec, G.; Desal, H.; et al. Diffusion tensor imaging and white matter lesions at the subacute stage in mild traumatic brain injury with persistent neurobehavioral impairment. Hum. Brain Mapp. 2011, 32, 999–1011. [Google Scholar] [CrossRef]
- Johansen-Berg, H.; Rushworth, M.F.S. Using diffusion imaging to study human connectional anatomy. Annu. Rev. Neurosci. 2009, 32, 75–94. [Google Scholar] [CrossRef] [Green Version]
- Bigler, E.D.; Bazarian, J.J. Diffusion tensor imaging: A biomarker for mild traumatic brain injury? Neurology 2010, 74, 626–627. [Google Scholar] [CrossRef] [Green Version]
- Pierpaoli, C.; Jezzard, P.; Basser, P.J.; Barnett, A.; Di Chiro, G. Diffusion tensor MR imaging of the human brain. Radiology 1996, 201, 637–648. [Google Scholar] [CrossRef]
- Song, S.-K.; Sun, S.-W.; Ju, W.-K.; Lin, S.-J.; Cross, A.H.; Neufeld, A.H. Diffusion tensor imaging detects and differentiates axon and myelin degeneration in mouse optic nerve after retinal ischemia. Neuroimage 2003, 20, 1714–1722. [Google Scholar] [CrossRef]
- Budde, M.D.; Kim, J.H.; Liang, H.-F.; Schmidt, R.E.; Russell, J.H.; Cross, A.H.; Song, S.-K. Toward accurate diagnosis of white matter pathology using diffusion tensor imaging. Magn. Reson. Med. 2007, 57, 688–695. [Google Scholar] [CrossRef] [PubMed]
- Concha, L.; Livy, D.J.; Beaulieu, C.; Wheatley, B.M.; Gross, D.W. In vivo diffusion tensor imaging and histopathology of the fimbria-fornix in temporal lobe epilepsy. J. Neurosci. 2010, 30, 996–1002. [Google Scholar] [CrossRef] [PubMed]
- Clark, K.A.; Nuechterlein, K.H.; Asarnow, R.F.; Hamilton, L.S.; Phillips, O.R.; Hageman, N.S.; Woods, R.P.; Alger, J.R.; Toga, A.W.; Narr, K.L. Mean diffusivity and fractional anisotropy as indicators of disease and genetic liability to schizophrenia. J. Psychiatr. Res. 2011, 45, 980–988. [Google Scholar] [CrossRef] [PubMed] [Green Version]
- Miles, L.; Grossman, R.I.; Johnson, G.; Babb, J.S.; Diller, L.; Inglese, M. Short-term DTI predictors of cognitive dysfunction in mild traumatic brain injury. Brain Inj. 2008, 22, 115–122. [Google Scholar] [CrossRef] [PubMed]
- Bosch, B.; Arenaza-Urquijo, E.M.; Rami, L.; Sala-Llonch, R.; Junqué, C.; Solé-Padullés, C.; Peña-Gómez, C.; Bargalló, N.; Molinuevo, J.L.; Bartrés-Faz, D. Multiple DTI index analysis in normal aging, amnestic MCI and AD. Relationship with neuropsychological performance. Neurobiol. Aging 2012, 33, 61–74. [Google Scholar] [CrossRef]
- King, N.S.; Crawford, S.; Wenden, F.J.; Moss, N.E.G.; Wade, D.T. The Rivermead Post Concussion Symptoms Questionnaire: A measure of symptoms commonly experienced after head injury and its reliability. J. Neurol. 1995, 242, 587–592. [Google Scholar] [CrossRef]
- Babcock, L.; Byczkowski, T.; Wade, S.L.; Ho, M.; Mookerjee, S.; Bazarian, J.J. Predicting postconcussion syndrome after mild traumatic brain injury in children and adolescents who present to the emergency department. J. Am. Med. Assoc. Pediatr. 2013, 167, 156–161. [Google Scholar] [CrossRef] [Green Version]
- Barker-Collo, S.; Jones, K.; Theadom, A.; Starkey, N.; Dowell, A.; McPherson, K.; Ameratunga, S.; Dudley, M.; Te Ao, B.; Feigin, V. Neuropsychological outcome and its correlates in the first year after adult mild traumatic brain injury: A population-based New Zealand study. Brain Inj. 2015, 29, 1604–1616. [Google Scholar] [CrossRef]
- Bazarian, J.J.; Zemlan, F.P.; Mookerjee, S.; Stigbrand, T. Serum S-100B and cleaved-tau are poor predictors of long-term outcome after mild traumatic brain injury. Brain Inj. 2006, 20, 759–765. [Google Scholar] [CrossRef]
- Caplain, S.; Blancho, S.; Marque, S.; Montreuil, M.; Aghakhani, N. Early detection of poor outcome after mild traumatic brain injury: Predictive factors using a multidimensional approach a pilot study. Front. Neurol. 2017, 8, 1–12. [Google Scholar] [CrossRef] [Green Version]
- Nygren de Boussard, C.; Lundin, A.; Karlstedt, D.; Edman, G.; Bartfai, A.; Borg, J. S100 and cognitive impairment after mild traumatic brain injury. J. Rehabil. Med. 2005, 37, 53–57. [Google Scholar] [CrossRef] [PubMed] [Green Version]
- Randolph, C. Repeatable Battery for the Assessment of Neuropsychological Status: Update; PsychCorp: Bloomington, IN, USA, 2012. [Google Scholar]
- Randolph, C.; Tierney, M.; Mohr, E.; Chase, T. The Repeatable Battery for the Assessment of Neuropsychological Status (RBANS): Preliminary clinical validity. J. Clin. Exp. Neuropsychol. 2003, 20, 310–319. [Google Scholar] [CrossRef] [PubMed]
- Lezak, M.; Howieson, D.; Loring, D.; Hannay, H.; Fischer, J. Neuropsychological Assessment, 4th ed.; Oxford University Press: New York, NY, USA, 2004. [Google Scholar]
- Lovibond, S.H.; Lovibond, P.F. Manual for the Depression and Anxiety Stress Scales, 2nd ed.; Psychology Foundation NSW: Sydney, Australia, 1995. [Google Scholar]
- Rey, A. L’examen Clinique en Psychologie; Presses Universitaires de France: Paris, France, 1964. [Google Scholar]
- Reznek, L. The Rey 15-item memory test for malingering: A meta-analysis. Brain Inj. 2005, 19, 539–543. [Google Scholar] [CrossRef] [PubMed]
- Wilson, D.H.; Rissin, D.M.; Kan, C.W.; Fournier, D.R.; Piech, T.; Campbell, T.G.; Meyer, R.E.; Fishburn, M.W.; Cabrera, C.; Patel, P.P.; et al. The Simoa HD-1 Analyzer. J. Lab. Autom. 2016, 21, 533–547. [Google Scholar] [CrossRef] [Green Version]
- Potter, S.; Leigh, E.; Wade, D.; Fleminger, S. The Rivermead Post Concussion Symptoms Questionnaire. J. Neurol. 2006, 253, 1603–1614. [Google Scholar] [CrossRef]
- Smith, S.M.; Jenkinson, M.; Woolrich, M.W.; Beckmann, C.F.; Behrens, T.E.J.; Johansen-Berg, H.; Bannister, P.R.; De Luca, M.; Drobnjak, I.; Flitney, D.E.; et al. Advances in functional and structural MR image analysis and implementation as FSL. Neuroimage 2004, 23, S208–S219. [Google Scholar] [CrossRef] [Green Version]
- Smith, S.M.; Jenkinson, M.; Johansen-Berg, H.; Rueckert, D.; Nichols, T.E.; Mackay, C.E.; Watkins, K.E.; Ciccarelli, O.; Cader, M.Z.; Matthews, P.M.; et al. Tract-based spatial statistics: Voxelwise analysis of multi-subject diffusion data. Neuroimage 2006, 31, 1487–1505. [Google Scholar] [CrossRef]
- Smith, S.M. Fast robust automated brain extraction. Hum. Brain Mapp. 2002, 17, 143–155. [Google Scholar] [CrossRef]
- Andersson, J.L.; Jenkinson, M.; Smith, S. Non-Linear Optimisation; FMRIB Technical Report TR07JA1; FMRIB Centre: Oxford, UK, 2007. [Google Scholar]
- Andersson, J.; Jenkinson, M.; Smith, S. Non-Linear Registration, Aka Spatial Normalisation; FMRIB Technical Report TR07JA2; FMRIB Centre: Oxford, UK, 2007. [Google Scholar]
- Rueckert, D.; Sonoda, L.I.; Hayes, C.; Hill, D.L.G.; Leach, M.O.; Hawkes, D.J. Nonrigid registration using free-form deformations: Application to breast MR images. IEEE Trans. Med. Imaging 1999, 18, 712–721. [Google Scholar] [CrossRef]
- Dean, P.J.A.; Sato, J.R.; Vieira, G.; McNamara, A.; Sterr, A. Long-term structural changes after mTBI and their relation to post-concussion symptoms. Brain Inj. 2015, 29, 1211–1218. [Google Scholar] [CrossRef] [Green Version]
- Sullivan, E.V.; Zahr, N.M.; Rohlfing, T.; Pfefferbaum, A. Fiber tracking functionally distinct components of the internal capsule. Neuropsychologia 2010, 48, 4155–4163. [Google Scholar] [CrossRef] [PubMed] [Green Version]
- Bubb, E.J.; Metzler-Baddeley, C.; Aggleton, J.P. The cingulum bundle: Anatomy, function, and dysfunction. Neurosci. Biobehav. Rev. 2018, 92, 104–127. [Google Scholar] [CrossRef] [PubMed]
- Matsushita, M.; Hosoda, K.; Naitoh, Y.; Yamashita, H.; Kohmura, E. Utility of diffusion tensor imaging in the acute stage of mild to moderate traumatic brain injury for detecting white matter lesions and predicting long-term cognitive function in adults. J. Neurosurg. 2011, 115, 130–139. [Google Scholar] [CrossRef] [PubMed]
- Farbota, K.D.; Bendlin, B.B.; Alexander, A.L.; Rowley, H.A.; Dempsey, R.J.; Johnson, S.C. Longitudinal diffusion tensor imaging and neuropsychological correlates in traumatic brain injury patients. Front. Hum. Neurosci. 2012, 6, 160. [Google Scholar] [CrossRef] [PubMed] [Green Version]
- Schmahmann, J.D.; Pandya, D.N. Fiber Pathways of the Brain; Oxford University Press, Inc.: New York, NY, USA, 2006; ISBN 9780195104233. [Google Scholar]
- Makris, N.; Papadimitriou, G.M.; Sorg, S.; Kennedy, D.N.; Caviness, V.S.; Pandya, D.N. The occipitofrontal fascicle in humans: A quantitative, in vivo, DT-MRI study. Neuroimage 2007, 37, 1100–1111. [Google Scholar] [CrossRef] [PubMed] [Green Version]
- Walsh, M.; Montojo, C.A.; Sheu, Y.-S.; Marchette, S.A.; Harrison, D.M.; Newsome, S.D.; Zhou, F.; Shelton, A.L.; Courtney, S.M. Object Working Memory Performance Depends on Microstructure of the Frontal-Occipital Fasciculus. Brain Connect. 2011, 1, 317–329. [Google Scholar] [CrossRef]
- Krogsrud, S.K.; Fjell, A.M.; Tamnes, C.K.; Grydeland, H.; Due-Tønnessen, P.; Bjørnerud, A.; Sampaio-Baptista, C.; Andersson, J.; Johansen-Berg, H.; Walhovd, K.B. Development of white matter microstructure in relation to verbal and visuospatial working memory—A longitudinal study. PLoS ONE 2018, 13, e0195540. [Google Scholar] [CrossRef] [Green Version]
- Heitger, M.H.; Jones, R.D.; Dalrymple-Alford, J.C.; Frampton, C.M.; Ardagh, M.W.; Anderson, T.J. Mild head injury-a close relationship between motor function at 1 week post-injury and overall recovery at 3 and 6 months. J. Neurol. Sci. 2007, 253, 34–47. [Google Scholar] [CrossRef]
- Papa, L.; Lewis, L.M.; Falk, J.L.; Zhang, Z.; Silvestri, S.; Giordano, P.; Brophy, G.M.; Demery, J.A.; Dixit, N.K.; Ferguson, I.; et al. Elevated levels of serum glial fibrillary acidic protein breakdown products in mild and moderate traumatic brain injury are associated with intracranial lesions and neurosurgical intervention. Ann. Emerg. Med. 2012, 59, 471–483. [Google Scholar] [CrossRef] [Green Version]
- Papa, L.; Brophy, G.M.; Welch, R.D.; Lewis, L.M.; Braga, C.F.; Tan, C.N.; Ameli, N.J.; Lopez, M.A.; Haeussler, C.A.; Mendez Giordano, D.I.; et al. Time course and diagnostic accuracy of glial and neuronal blood biomarkers GFAP and UCH-L1 in a large cohort of trauma patients with and without mild traumatic brain injury. J. Am. Med. Assoc. Neurol. 2016, 73, 551–560. [Google Scholar] [CrossRef] [Green Version]
- Schiff, L.; Hadker, N.; Weiser, S.; Rausch, C. A literature review of the feasibility of glial fibrillary acidic protein as a biomarker for stroke and traumatic brain injury. Mol. Diagn. Ther. 2012, 16, 79–92. [Google Scholar] [CrossRef] [PubMed]
- Okonkwo, D.O.; Yue, J.K.; Puccio, A.M.; Panczykowski, D.M.; Inoue, T.; McMahon, P.J.; Sorani, M.D.; Yuh, E.L.; Lingsma, H.F.; Maas, A.I.R.; et al. GFAP-BDP as an acute diagnostic marker in traumatic brain injury: Results from the prospective Transforming Research and Clinical Knowledge in Traumatic Brain Injury Study. J. Neurotrauma 2013, 30, 1490–1497. [Google Scholar] [CrossRef] [PubMed]
- Pelinka, L.E.; Kroepfl, A.; Schmidhammer, R.; Krenn, M.; Buchinger, W.; Redl, H.; Raabe, A. Glial fibrillary acidic protein in serum after traumatic brain injury and multiple trauma. J. Trauma 2004, 57, 1006–1012. [Google Scholar] [CrossRef]
- Lumpkins, K.M.; Bochicchio, G.V.; Keledjian, K.; Simard, J.M.; McCunn, M.; Scalea, T. Glial fibrillary acidic protein is highly correlated with brain injury. J. Trauma Inj. Infect. Crit. Care 2008, 65, 778–784. [Google Scholar] [CrossRef] [PubMed]
- Nylén, K.; Öst, M.; Csajbok, L.Z.; Nilsson, I.; Blennow, K.; Nellgård, B.; Rosengren, L. Increased serum-GFAP in patients with severe traumatic brain injury is related to outcome. J. Neurol. Sci. 2006, 240, 85–91. [Google Scholar] [CrossRef] [PubMed]
- Vos, P.E.; Jacobs, B.; Andriessen, T.M.J.C.; Lamers, K.J.B.; Borm, G.F.; Beems, T.; Edwards, M.; Rosmalen, C.F.; Vissers, J.L.M. GFAP and S100B are biomarkers of traumatic brain injury: An observational cohort study. Neurology 2010, 75, 1786–1793. [Google Scholar] [CrossRef] [PubMed]
- Mercier, E.; Tardif, P.-A.; Cameron, P.A.; Émond, M.; Moore, L.; Mitra, B.; Ouellet, M.-C.; Frenette, J.; De Guise, E.; Le Sage, N.; et al. Prognostic value of neuron-specific enolase (NSE) for prediction of post-concussion symptoms following a mild traumatic brain injury: A systematic review. Brain Inj. 2017, 32, 29–40. [Google Scholar] [CrossRef]
- LaRocca, D.; Barns, S.; Hicks, S.D.; Brindle, A.; Williams, J.; Uhlig, R.; Johnson, P.; Neville, C.; Middleton, F.A. Comparison of serum and saliva miRNAs for identification and characterization of mTBI in adult mixed martial arts fighters. PLoS ONE 2019, 14, e0207785. [Google Scholar] [CrossRef] [Green Version]
- Bhomia, M.; Balakathiresan, N.S.; Wang, K.K.; Papa, L.; Maheshwari, R.K. A panel of serum miRNA biomarkers for the diagnosis of severe to mild traumatic brain injury in humans. Sci. Rep. 2016, 6, 28148. [Google Scholar] [CrossRef]
- Mitra, B.; Rau, T.F.; Surendran, N.; Brennan, J.H.; Thaveenthiran, P.; Sorich, E.; Fitzgerald, M.C.; Rosenfeld, J.V.; Patel, S.A. Plasma micro-RNA biomarkers for diagnosis and prognosis after traumatic brain injury: A pilot study. J. Clin. Neurosci. 2017, 38, 37–42. [Google Scholar] [CrossRef]
- Di Pietro, V.; Ragusa, M.; Davies, D.; Su, Z.; Hazeldine, J.; Lazzarino, G.; Hill, L.J.; Crombie, N.; Foster, M.; Purrello, M.; et al. MicroRNAs as novel biomarkers for the diagnosis and prognosis of mild and severe traumatic brain injury. J. Neurotrauma 2017, 34, 1948–1956. [Google Scholar] [CrossRef]
- Smits, M.; Houston, G.C.; Dippel, D.W.J.; Wielopolski, P.A.; Vernooij, M.W.; Koudstaal, P.J.; Hunink, M.G.M.; van der Lugt, A. Microstructural brain injury in post-concussion syndrome after minor head injury. Neuroradiology 2011, 53, 553–563. [Google Scholar] [CrossRef] [Green Version]
- Davenport, N.D.; Lim, K.O.; Armstrong, M.T.; Sponheim, S.R. Diffuse and spatially variable white matter disruptions are associated with blast-related mild traumatic brain injury. Neuroimage 2012, 59, 2017–2024. [Google Scholar] [CrossRef]
- Ellis, M.J.; Cordingley, D.; Vis, S.; Reimer, K.; Leiter, J.; Russell, K. Vestibulo-ocular dysfunction in pediatric sports-related concussion. J. Neurosurg. Pediatr. 2015, 16, 248–255. [Google Scholar] [CrossRef] [Green Version]
- Heitger, M.H.; Jones, R.D.; Macleod, A.D.; Snell, D.L.; Frampton, C.M.; Anderson, T.J. Impaired eye movements in post-concussion syndrome indicate suboptimal brain function beyond the influence of depression, malingering or intellectual ability. Brain 2009, 132, 2850–2870. [Google Scholar] [CrossRef]
- Lau, B.; Lovell, M.R.; Collins, M.W.; Pardini, J. Neurocognitive and symptom predictors of recovery in high school athletes. Clin. J. Sport Med. 2009, 19, 216–221. [Google Scholar] [CrossRef]
- Kristman, V.L.; Côté, P.; Yang, X.; Hogg-Johnson, S.; Vidmar, M.; Rezai, M. Health care utilization of workers’ compensation claimants associated with mild traumatic brain injury: A historical population-based cohort study of workers injured in 1997–1998. Arch. Phys. Med. Rehabil. 2014, 95, S295–S302. [Google Scholar] [CrossRef]
- Lundin, A.; de Boussard, C.; Edman, G.; Borg, J. Symptoms and disability until 3 months after mild TBI. Brain Inj. 2006, 20, 799–806. [Google Scholar] [CrossRef]
- Wojcik, S.M. Predicting mild traumatic brain injury patients at risk of persistent symptoms in the Emergency Department. Brain Inj. 2014, 28, 422–430. [Google Scholar] [CrossRef]
- Yang, C.-C.; Hua, M.-S.; Tu, Y.-K.; Huang, S.-J. Early clinical characteristics of patients with persistent post-concussion symptoms: A prospective study. Brain Inj. 2009, 23, 299–306. [Google Scholar] [CrossRef]
- Meehan, W.P.; Mannix, R.C.; Stracciolini, A.; Elbin, R.J.; Collins, M.W. Symptom severity predicts prolonged recovery after sport-related concussion, but age and amnesia do not. J. Pediatr. 2013, 163, 721–725. [Google Scholar] [CrossRef] [Green Version]
- Kahan, B.C.; Jairath, V.; Doré, C.J.; Morris, T.P. The risks and rewards of covariate adjustment in randomized trials: An assessment of 12 outcomes from 8 studies. Trials 2014, 15, 139. [Google Scholar] [CrossRef]
- Steyerberg, E.W.; Mushkudiani, N.; Perel, P.; Butcher, I.; Lu, J.; McHugh, G.S.; Murray, G.D.; Marmarou, A.; Roberts, I.; Habbema, J.D.F.; et al. Predicting outcome after traumatic brain injury: Development and international validation of prognostic scores based on admission characteristics. PLoS Med. 2008, 5, e165. [Google Scholar] [CrossRef] [Green Version]


| Participants Lost to Follow-Up (n = 21) | Participants Presenting at Follow-Up (n = 39) | |||||
|---|---|---|---|---|---|---|
| Demographic and Pre-Injury Characteristics | n | Missing (n) | n | Missing (n) | p | Test |
| Age: M ± SD | 30.62 (7.95) | - | 28 (8.89) | - | 0.264 | t-test |
| Sex: Female (%) | 9 (42.86) | - | 16 (41.03) | - | 0.883 | χ2 |
| Education (years; M, (SD)) | 12.68 (2.12) | 5 | 13.74 (1.83) | 5 | 0.089 | t-test |
| History of previous mTBI: Yes (%) | 12 (57.14) | - | 18 (46.15) | - | 0.417 | χ2 |
| History of any psychological disorder: Yes (%) | 9 (42.86) | - | 11 (28.95) | 1 | 0.274 | χ2 |
| History of neurological disorder: Yes (%) | 1 (4.76) | - | 6 (15.39) | - | 0.222 | χ2 |
| History of headaches/migraines: Yes (%) | 0 (0) | - | 3 (7.69) | - | 0.192 | χ2 |
| General co-morbidities: Yes (%) | 7 (33.33) | - | 12 (30.77) | - | 0.839 | χ2 |
| Currently on medication: Yes (%) | 6 (28.57) | - | 11 (28.21) | - | 0.976 | χ2 |
| Injury Characteristics | n | Missing (n) | n | Missing (n) | ||
| Loss of Consciousness: Yes (%) | 9 (60) | 6 | 22 (66.67) | 6 | 0.433 | χ2 |
| Δ time between injury and ED assessment (hours; M (SD)) | 10.48 (6.57) | 3 | 8.75 (7.20) | 2 | 0.409 | t-test |
| Performance on Neuropsychological Measures at Presentation to ED | Mean (SD) | Missing (n) | Mean (SD) | Missing (n) | ||
| RMPCQ | 22.57 (14.68) | - | 18.38 (10.82) | - | 0.213 | t-test |
| RBANS® Update Total Score | 80.78 (13.46) | 3 | 92.16 (13.13) | 2 | 0.004 | t-test |
| RBANS® Update Immediate Memory | 73 (14.57) | 3 | 88.28 (15.37) | 0 | 0.001 | t-test |
| RBANS® Update Visual Constructional | 94.35 (17.66) | 1 | 98.45 (17.40) | 1 | 0.400 | t-test |
| RBANS® Update Attention | 80.06 (18.55) | 1 | 89.46 (16.65) | 2 | 0.069 | t-test |
| RBANS® Update Language | 94.60 (10.56) | 1 | 99.59 (15.07) | 0 | 0.192 | t-test |
| RBANS® Update Delayed Memory | 86.47 (13.29) | 1 | 90.19 (10.89) | 2 | 0.282 | t-test |
| TMT B Completion time (sec) | 85.91 (47.37) | 4 | 54.87 (14.77) | 1 | 0.017 | t-test |
| DASS-21 Total Score | 17.05 (16.01) | - | 11.58 (8.73) | - | 0.159 | t-test |
| DASS-21 Depression Subscale | 5.62 (5.97) | - | 3.31 (3.89) | - | 0.120 | t-test |
| DASS-21 Anxiety Subscale | 5.05 (5.34) | - | 3.50 (3.00) | - | 0.231 | t-test |
| DASS-21 Stress Subscale | 6.24 (5.70) | - | 4.73 (3.31) | - | 0.276 | t-test |
| RMT | 13.38 (2.16) | 5 | 14.13 (1.48) | 7 | 0.163 | t-test |
| mTBI Typical Recovery (n = 33) | PPCS (n = 3) | ||||||
|---|---|---|---|---|---|---|---|
| Demographic Variable | n | Missing (n) | n | Missing (n) | OR | 95% CI | p |
| Age (years): M (SD) | 28.64 (9.09) | - | 21 (2.65) | - | 0.80 | 0.52–1.03 | 0.122 |
| Range | 18–49 | 18–23 | |||||
| Sex: Female (%) | 14 (42.40) | - | 1 (33.33) | - | 0.69 | 0.01–14.42 | 1.000 |
| Years of education: M (SD) | 13.89 (1.99) | 5 | 12.33 (1.53) | - | 0.85 | 0.14–7.85 | 1.000 |
| Range | 10–17 | 11–14 | |||||
| <12 years education (%) | 9 (27.30) | 5 | 2 (66.67) | - | 0.25 | 0–5.37 | 0.563 |
| History of previous mTBI: Yes (%) | 16 (48.50) | - | 3 (100) | - | 3.76 * | 0.38–† | 0.271 |
| Number of previous mTBI | 1 previous mTBI: n = 10 | 1 previous mTBI: n = 2 | 1.33 | 0.58–2.69 | 0.444 | ||
| ≥2 previous mTBI: n = 6 | ≥2 previous mTBI: n = 1 | ||||||
| History of any psychological disorder: Yes (%) | 9 (27.30) | 1 | 2 (66.67) | - | 4.84 | 0.23–314.29 | 0.454 |
| History of neurological disorder: Yes (%) | 5 (15.20) | - | 0 (0) | - | 1.58 | 0–16.86 | 1.000 |
| History of headaches/migraines: Yes (%) | 3 (9.10) | - | 0 (0) | - | 2.90 | 0–34.44 | 1.000 |
| General co-morbidities: Yes (%) | 9 (27.30) | - | 2 (66.67) | - | 5.05 | 0.24–327.39 | 0.431 |
| Currently on medication: Yes (%) | 9 (27.30) | - | 1 (33.33) | - | 1.32 | 0.02–28.44 | 1.000 |
| Smoker: Yes (%) | 7 (21.20) | 1 | 1 (33.33) | - | 1.75 | 0.03–38.57 | 1.000 |
| >10 cigarettes/day | 5 (15.20) | 1 | 0 (0) | - | 1.53 | 0–16.29 | 1.000 |
| Exercise each week: Yes (%) | 31 (93.90) | - | 2 (66.67) | - | 0.14 | 0.01–11.39 | 0.472 |
| Number of hours exercised/week: M (SD) | 14.67 (14.73) | - | 22.67 (20.53) | - | 1.03 | 0.96–1.11 | 0.398 |
| Alcohol consumer: Yes (%) | 23 (69.70) | 3 | 2 (66.67) | - | 0.62 | 0.03–40.99 | 1.000 |
| Number of standard drinks consumed per week: M (SD) | 4.38 (4.95) | 4 | 4.67 (5.03) | - | 1.01 | 0.76–1.27 | 0.870 |
| Injury-related Characteristics | Missing (n) | Missing (n) | OR | 95% CI | p | ||
| Loss of consciousness: Yes (%) | 20 (60.60) | 3 | 1 (50) | 1 | 0.51 | 0.01–43.14 | 1.000 |
| Δ time between injury and ED assessment (hours; M (SD)) | 10.84 (10.66) | 1 | 11.08 (10.47) | - | 1.00 | 0.88–1.11 | 0.810 |
| Performance on Neuropsychological Outcomes at ED Presentation | Mean (SD) | Missing (n) | Mean (SD) | Missing (n) | OR | 95% CI | p |
| RBANS® Update Total Score | 94.12 (12.38) | - | 73.00 (9.84) | - | 0.81 | 0.61–0.095 | 0.004 |
| RBANS® Update Immediate Memory | 91.76 (13.57) | - | 63.67 (12.22) | - | 0.79 | 0.55–0.94 | 0.001 |
| RBANS® Update Visual Constructional | 100.61 (16.85) | - | 93.67 (8.51) | - | 0.97 | 0.90–1.05 | 0.498 |
| RBANS® Update Language | 102.67 (11.82) | - | 92.67 (8.15) | - | 0.92 | 0.81–1.03 | 0.174 |
| RBANS® Update Attention | 91.52 (15.58) | - | 65.33 (12.86) | - | 0.86 | 0.71–0.97 | 0.007 |
| RBANS® Update Delayed Memory | 92.45 (12.24) | - | 79.00 (3.46) | - | 0.90 | 0.79–1.01 | 0.071 |
| TMT B Completion Time (sec) | 56.83 (19.34) | - | 87.70 (20.54) | - | 1.06 | 1.00–1.12 | 0.032 |
| DASS-21 Total Score | 11.94 (10.36) | - | 12.67 (6.35) | - | 1.01 | 0.88–1.12 | 0.838 |
| DASS-21 Depression | 3.36 (4.05) | - | 3.00 (3.61) | - | 0.98 | 0.65–1.31 | 1.000 |
| DASS-21 Anxiety | 3.48 (3.81) | - | 4.67 (1.16) | - | 1.08 | 0.77–1.42 | 0.562 |
| DASS-21 Stress | 5.09 (3.96) | - | 5.00 (2.00) | - | 0.99 | 0.69–1.35 | 1.000 |
| RMT | 14.39 (1.37) | 5 | 12.50 (0.71) | 1 | 0.52 | 0.17–1.37 | 0.202 |
| mTBI (n = 33) | PPCS (n = 3) | ||||||
|---|---|---|---|---|---|---|---|
| Blood-Based Biomarker | n | Mean (SD) | n | Mean (SD) | OR | 95% CI | p |
| GFAP (pg/mL) | 27 | 482.12 (553.95) | 3 | 231.00 (139.31) | 0.998 | 0.992–1.002 | 0.540 |
| GFAP (50 pg/mL) | 27 | 9.64 (11.08) | 3 | 4.62 (2.79) | 0.905 | 0.669–1.105 | 0.540 |
| NFL (pg/mL) | 32 | 5.89 (2.28) | 3 | 6.33 (4.38) | 1.075 | 0.650–1.688 | 0.706 |
| NFL (50 pg/mL) | 32 | 0.12 (0.04) | 3 | 0.13 (0.09) | 37.19 | 4.42 × 10⁻¹⁰–2.34 × 10¹¹ | 0.706 |
| NSE (pg/mL) | 32 | 5950.88 (4476.00) | 3 | 7939.33 (4921.24) | 1.00008 | 0.9998–1.0003 | 0.417 |
| NSE (50 pg/mL) | 32 | 119.02 (89.52) | 3 | 158.79 (98.43) | 1.004 | 0.9900–1.015 | 0.417 |
| mTBI (Total n = 36) | Healthy Controls (Total n = 36) | ||||||
|---|---|---|---|---|---|---|---|
| Blood-Based Biomarker | n | Mean (SD) | n | Mean (SD) | OR | 95% CI | p |
| GFAP (pg/mL) | 30 | 457.01 (531.35) | 30 | 96.68 (35.43) | 1.028 | 1.001–1.056 | 0.042 |
| GFAP (50 pg/mL) | 30 | 9.14 (10.63) | 30 | 1.94 (0.71) | 3.978 | 1.051–15.247 | 0.042 |
| NFL (pg/mL) | 36 | 5.92 (2.42) | 36 | 5.41 (1.93) | 1.125 | 0.90–1.41 | 0.310 |
| NFL (50 pg/mL) | 36 | 0.12 (0.05) | 36 | 0.11 (0.04) | 361.099 | 0.005–2.89 × 10⁷ | 0.310 |
| NSE (pg/mL) | 35 | 6121.31 (4473.30) | 35 | 4675.26 (2179.96) | 1.0001 | 1.0000–1.0002 | 0.144 |
| NSE (50 pg/mL) | 35 | 122.43 (89.47) | 35 | 93.51 (43.60) | 1.005 | 1–1.01 | 0.144 |
© 2020 by the authors. Licensee MDPI, Basel, Switzerland. This article is an open access article distributed under the terms and conditions of the Creative Commons Attribution (CC BY) license (http://creativecommons.org/licenses/by/4.0/).
Share and Cite
Gozt, A.; Licari, M.; Halstrom, A.; Milbourn, H.; Lydiard, S.; Black, A.; Arendts, G.; Macdonald, S.; Song, S.; MacDonald, E.; et al. Towards the Development of an Integrative, Evidence-Based Suite of Indicators for the Prediction of Outcome Following Mild Traumatic Brain Injury: Results from a Pilot Study. Brain Sci. 2020, 10, 23. https://doi.org/10.3390/brainsci10010023
Gozt A, Licari M, Halstrom A, Milbourn H, Lydiard S, Black A, Arendts G, Macdonald S, Song S, MacDonald E, et al. Towards the Development of an Integrative, Evidence-Based Suite of Indicators for the Prediction of Outcome Following Mild Traumatic Brain Injury: Results from a Pilot Study. Brain Sciences. 2020; 10(1):23. https://doi.org/10.3390/brainsci10010023
Chicago/Turabian StyleGozt, Aleksandra, Melissa Licari, Alison Halstrom, Hannah Milbourn, Stephen Lydiard, Anna Black, Glenn Arendts, Stephen Macdonald, Swithin Song, Ellen MacDonald, and et al. 2020. "Towards the Development of an Integrative, Evidence-Based Suite of Indicators for the Prediction of Outcome Following Mild Traumatic Brain Injury: Results from a Pilot Study" Brain Sciences 10, no. 1: 23. https://doi.org/10.3390/brainsci10010023