Pre-Stimulus Power but Not Phase Predicts Prefrontal Cortical Excitability in TMS-EEG

 , , ,
, , ,
Abstract
:1. Introduction
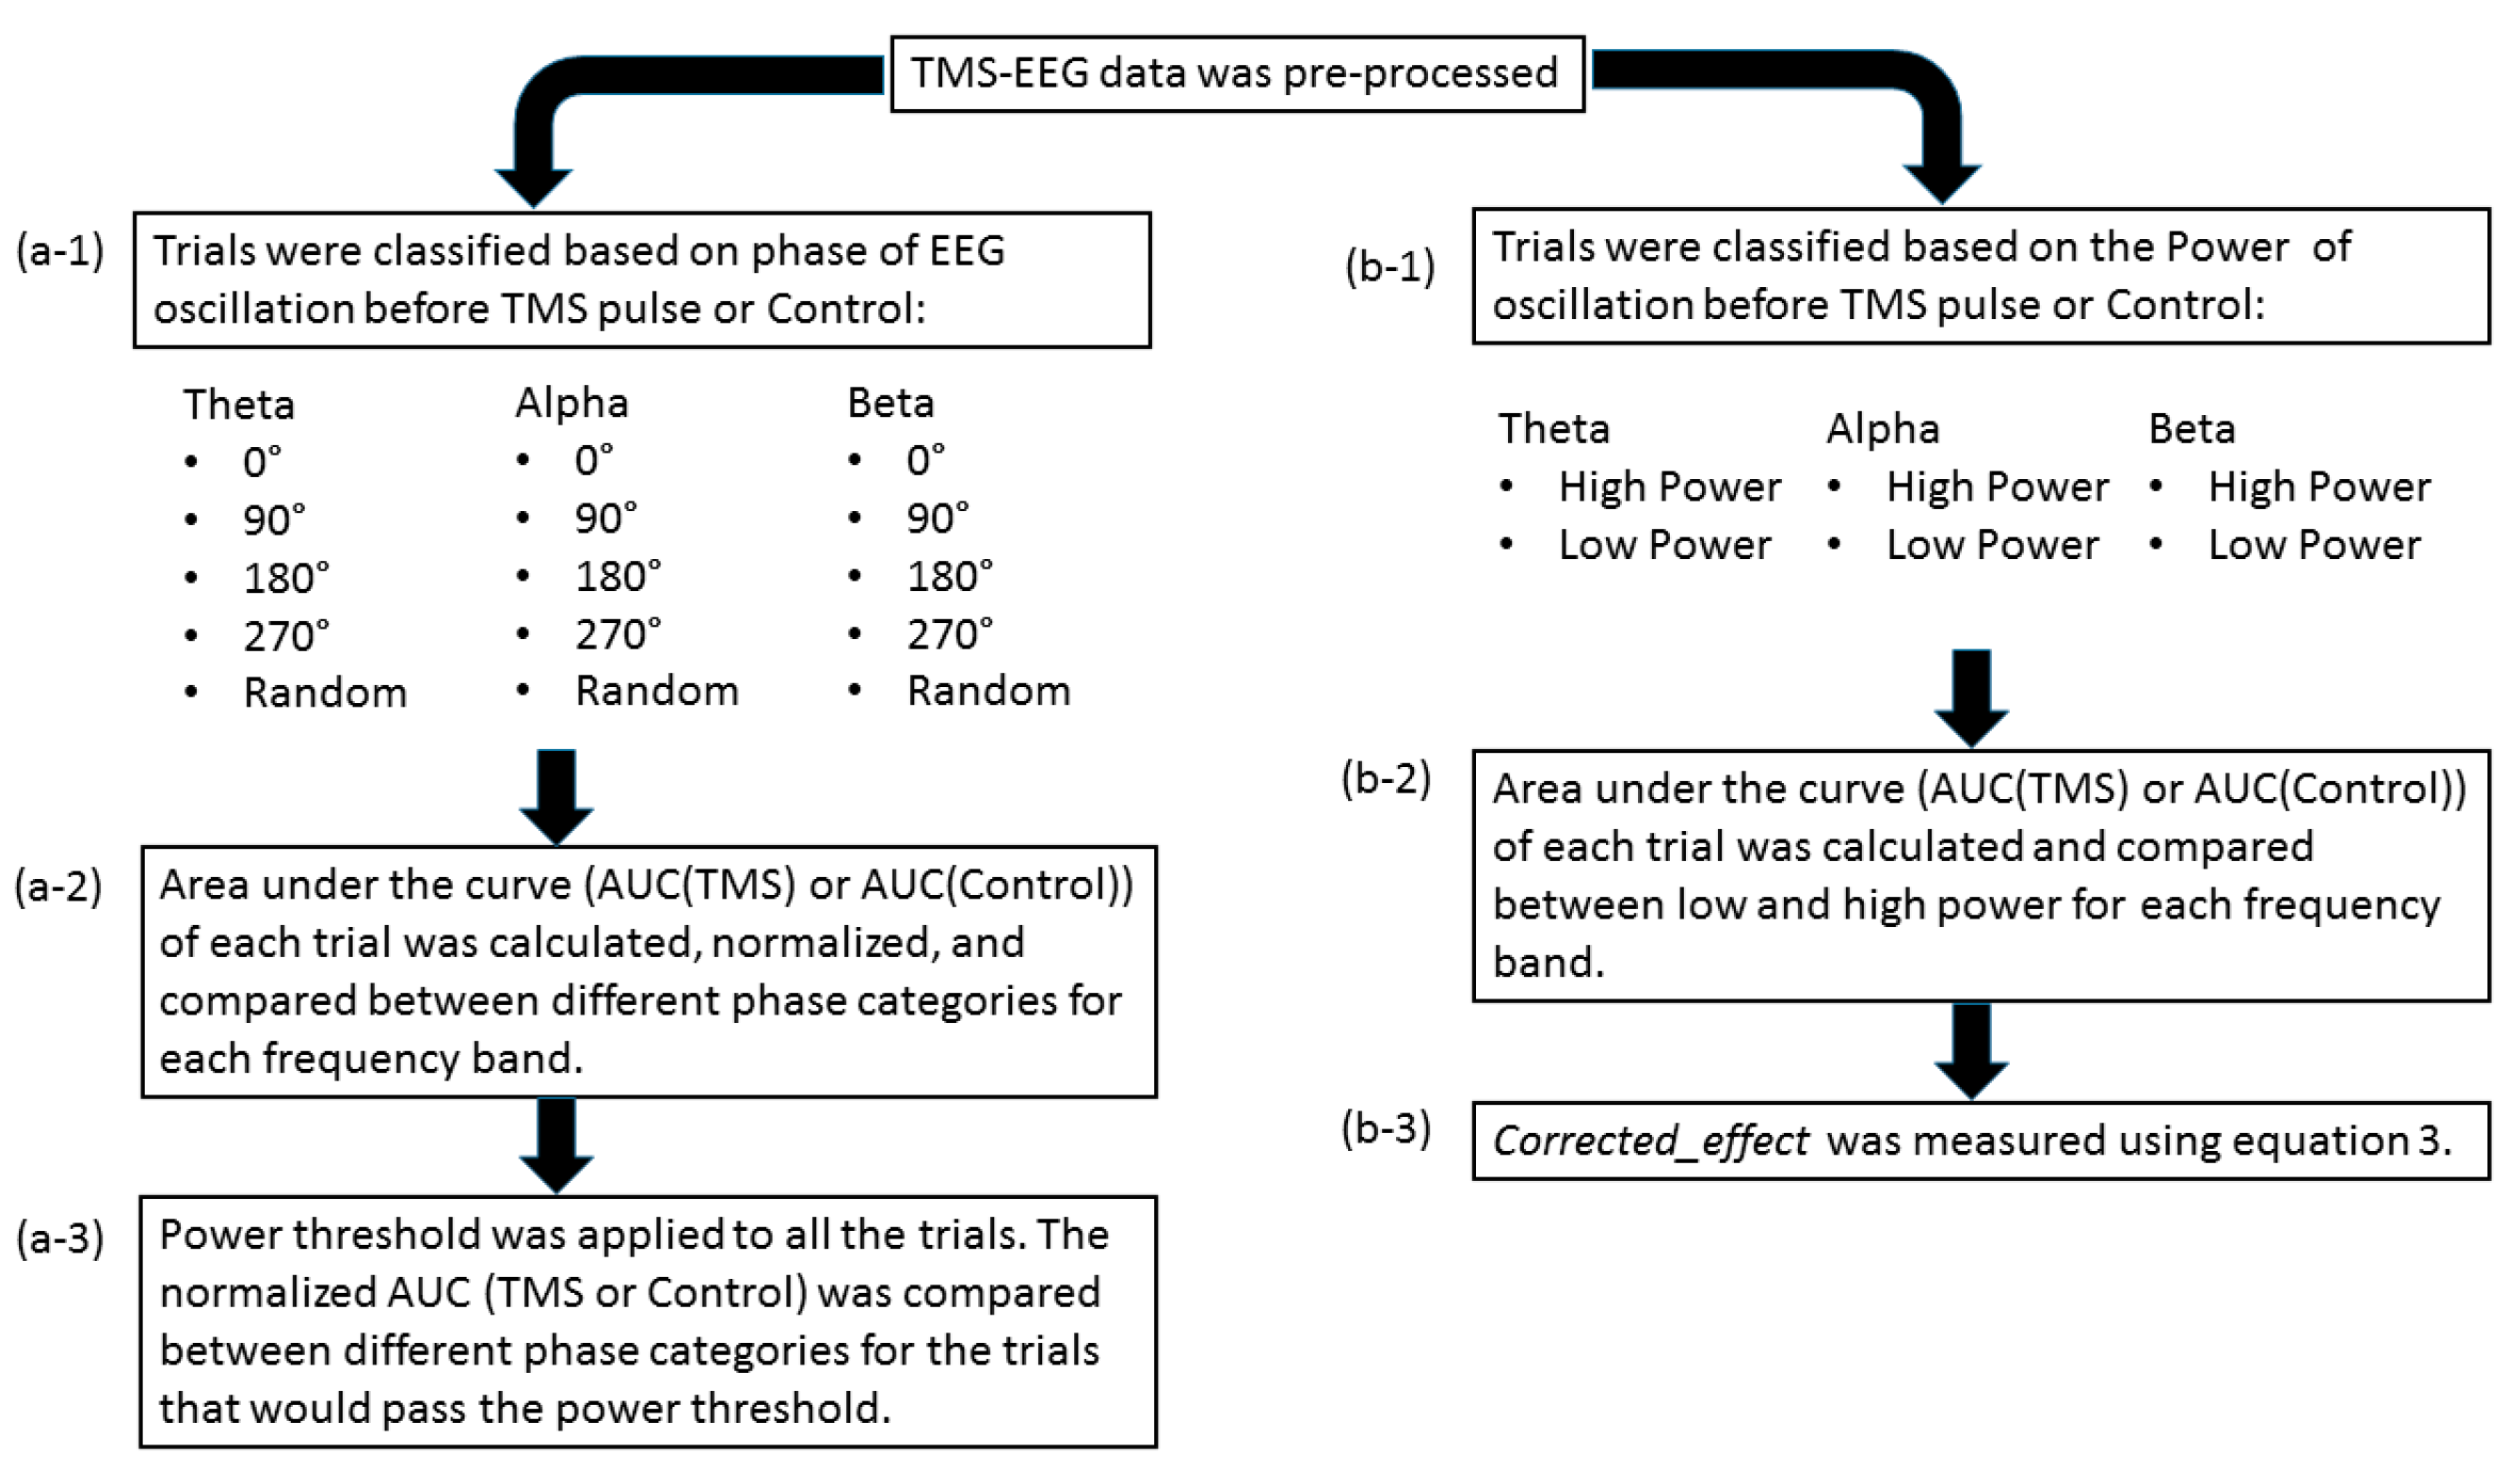
2. Methods
2.1. Participants
2.2. Transcranial Magnetic Stimulation
2.3. Electroencephalography
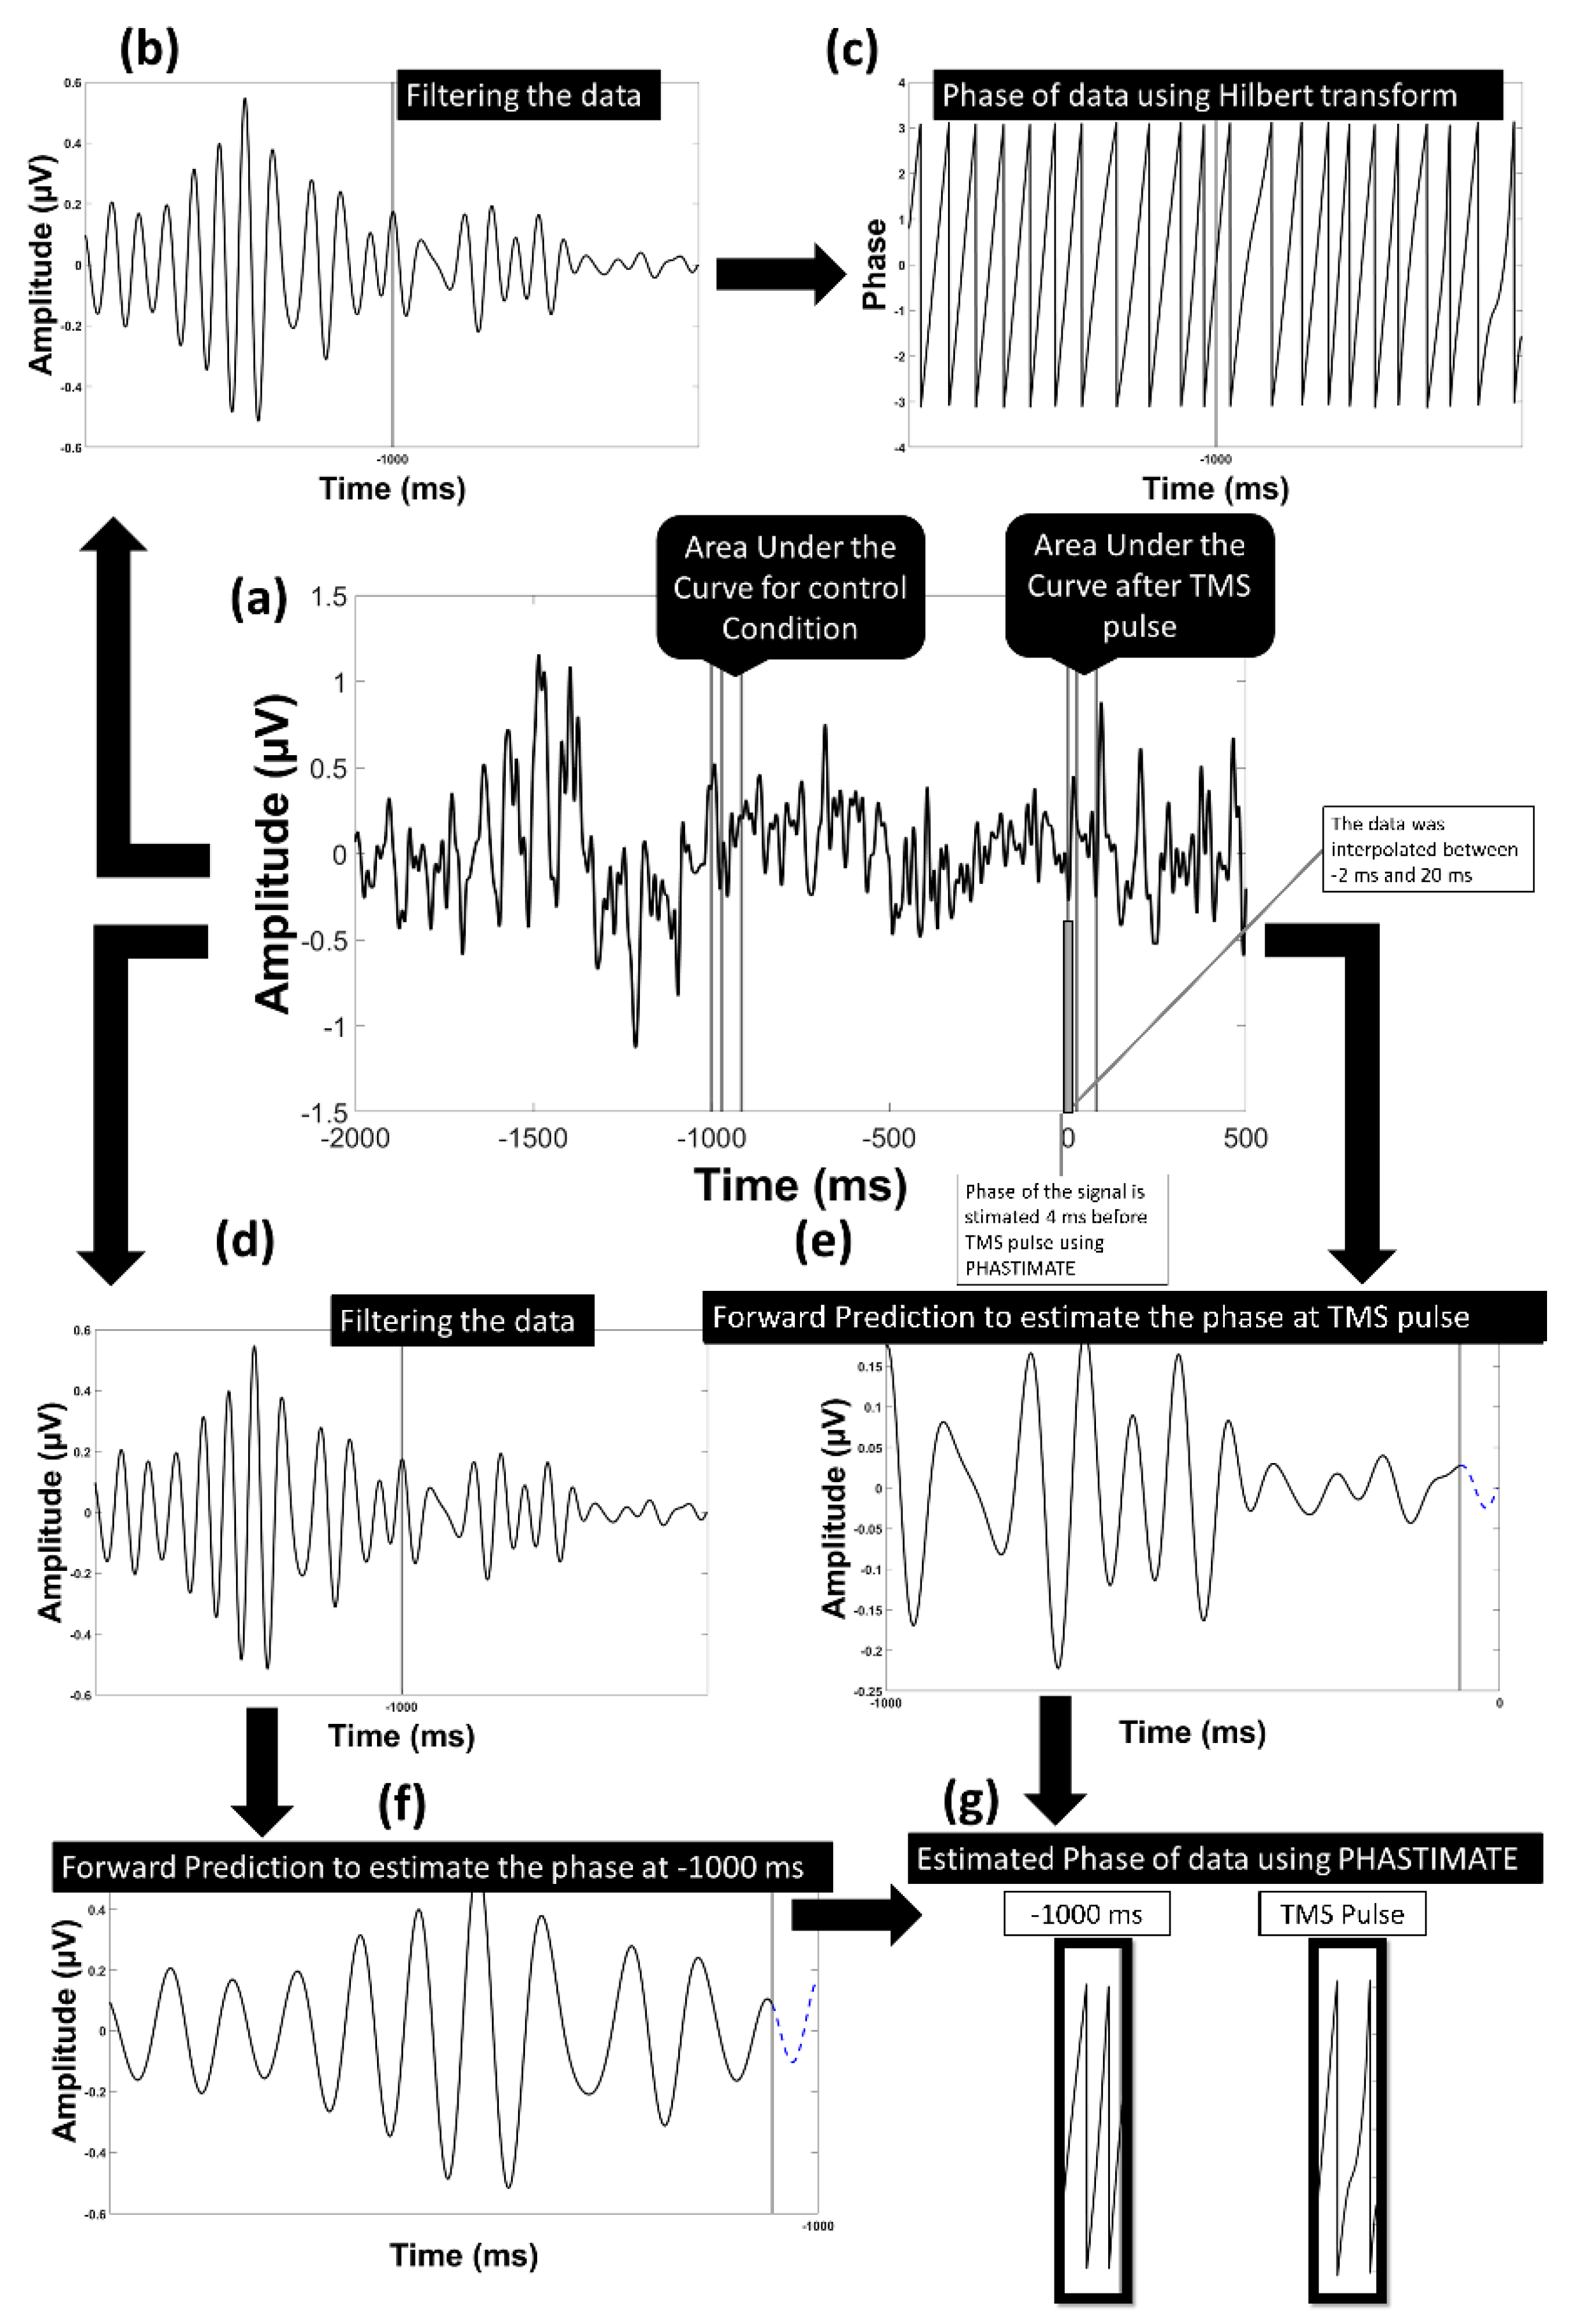
2.4. EEG Pre-Processing
2.5. EEG Post-Processing
2.6. Single-Trial Response to TMS Pulse
2.7. The Control Condition: Single-Trial Response without TMS Pulse
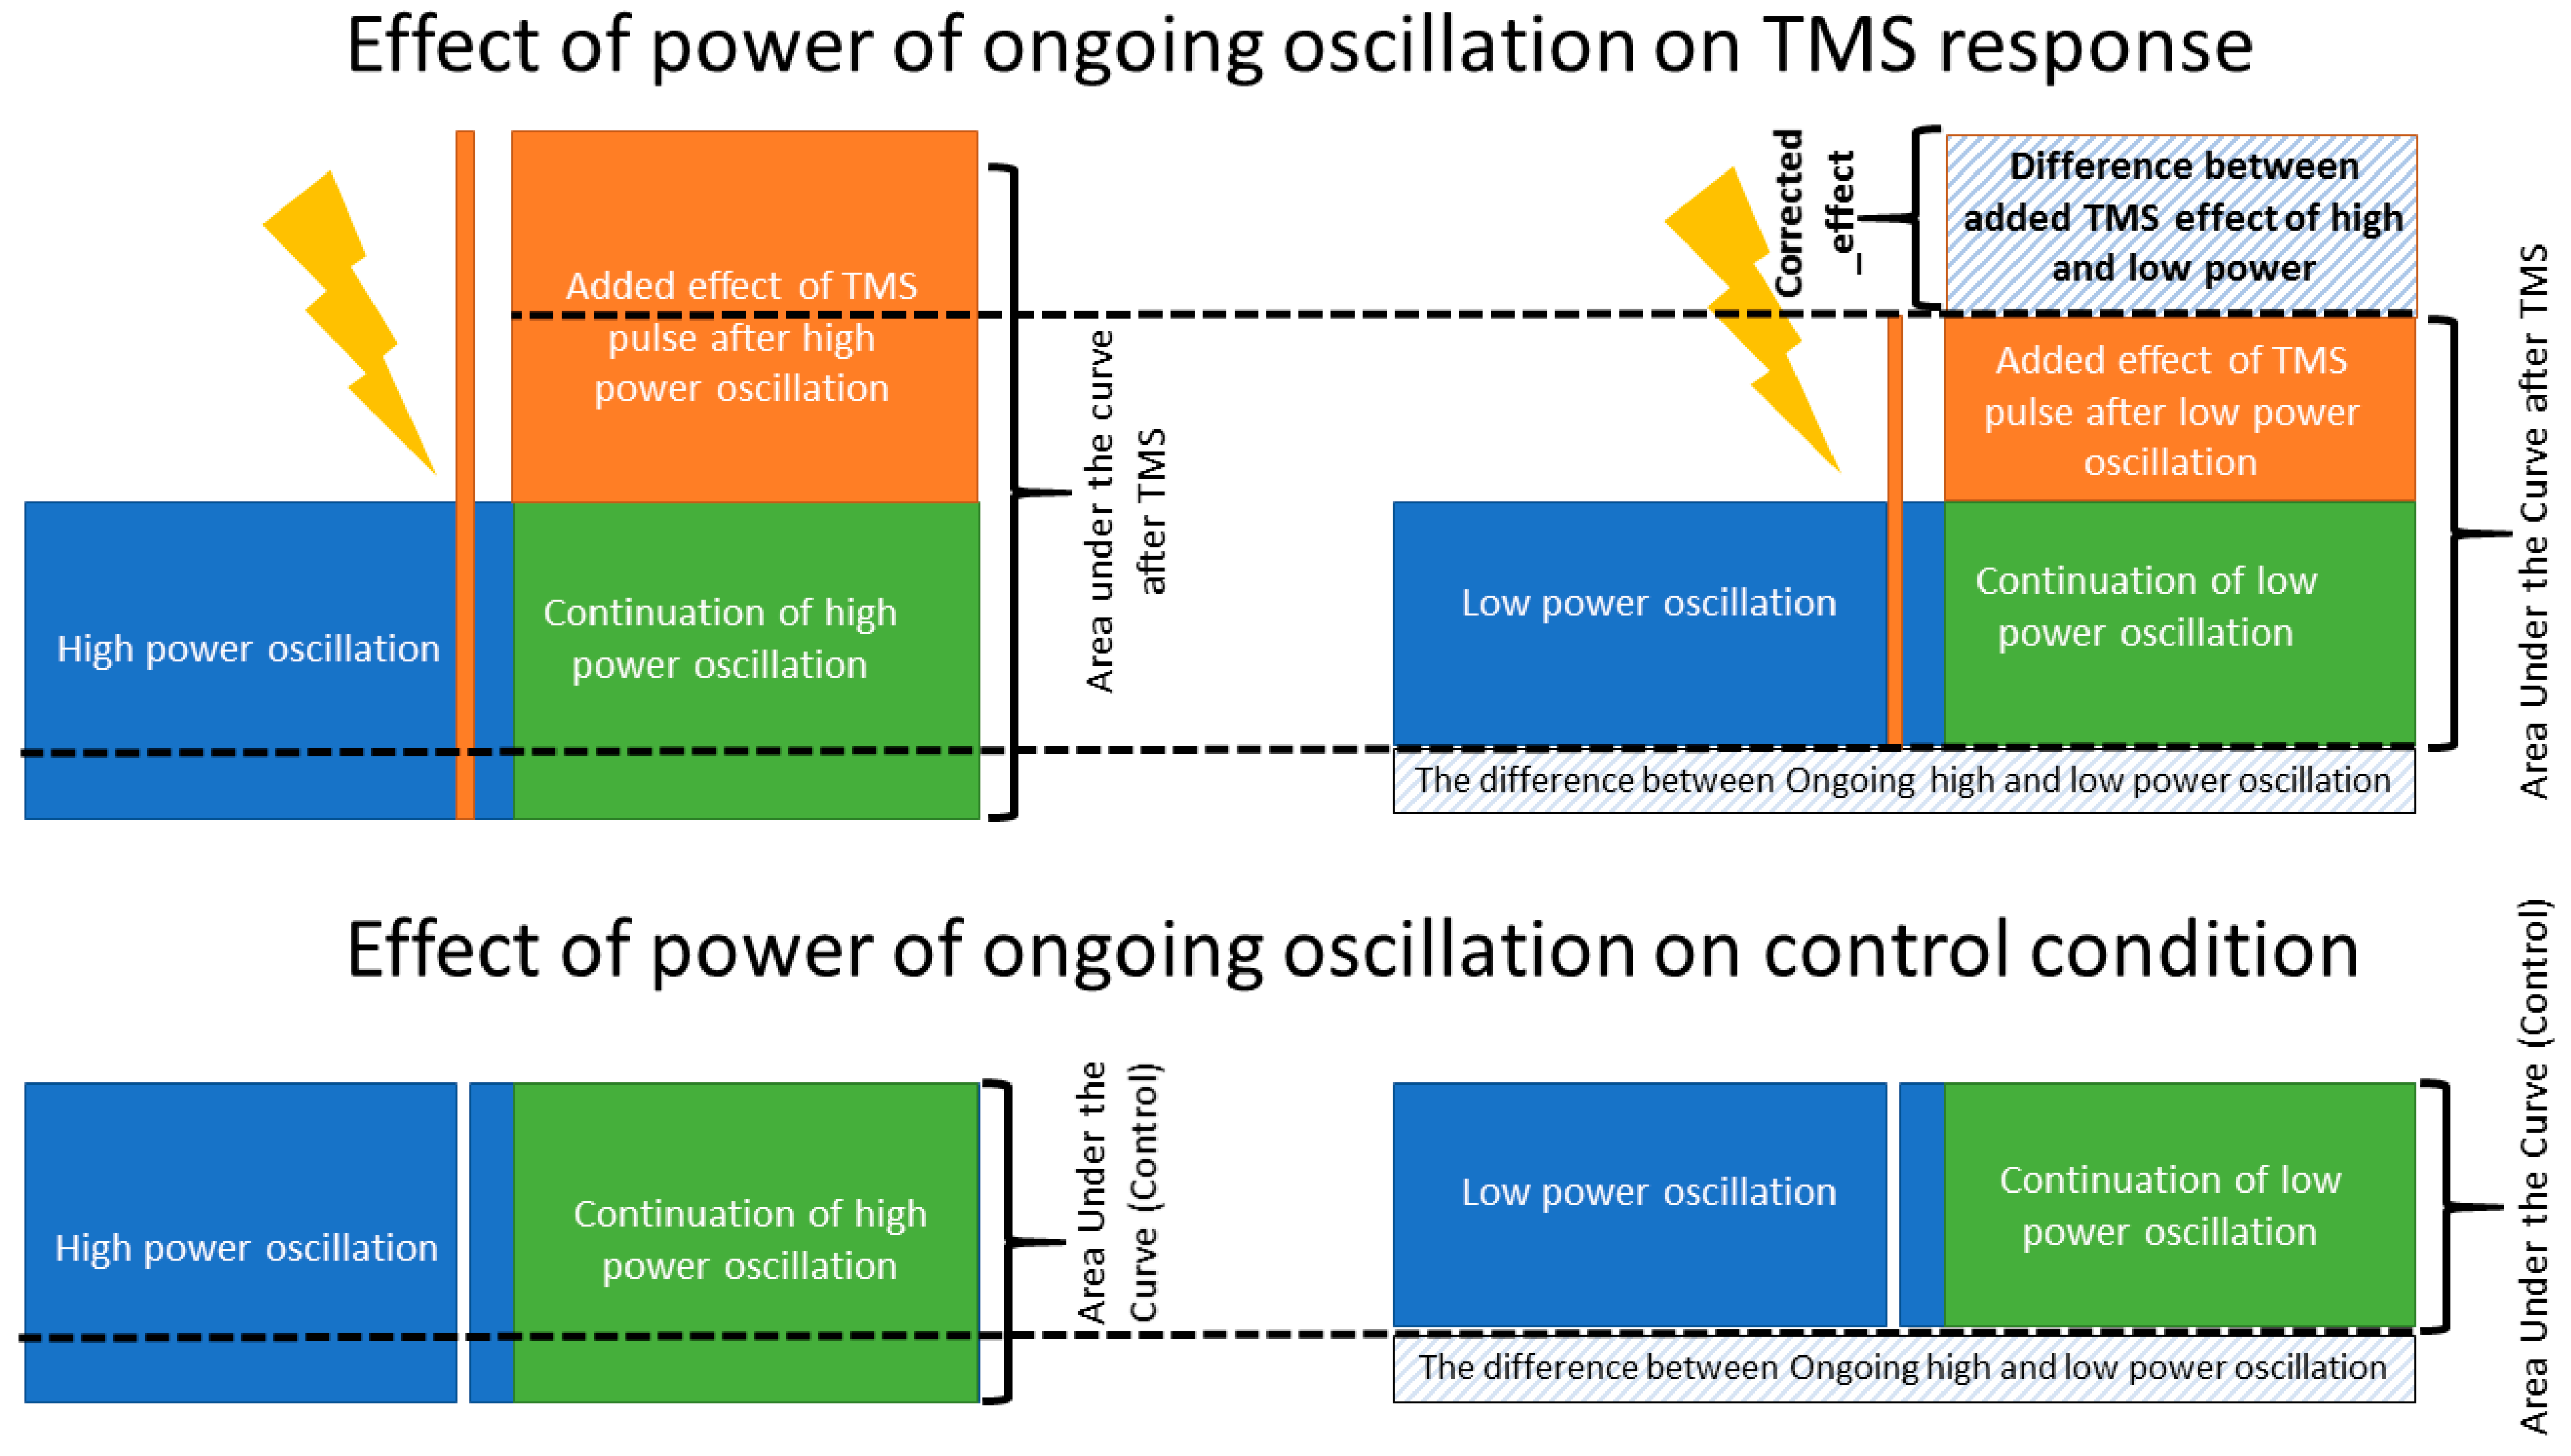
2.8. Power Threshold to Exclude Trials with Low Power
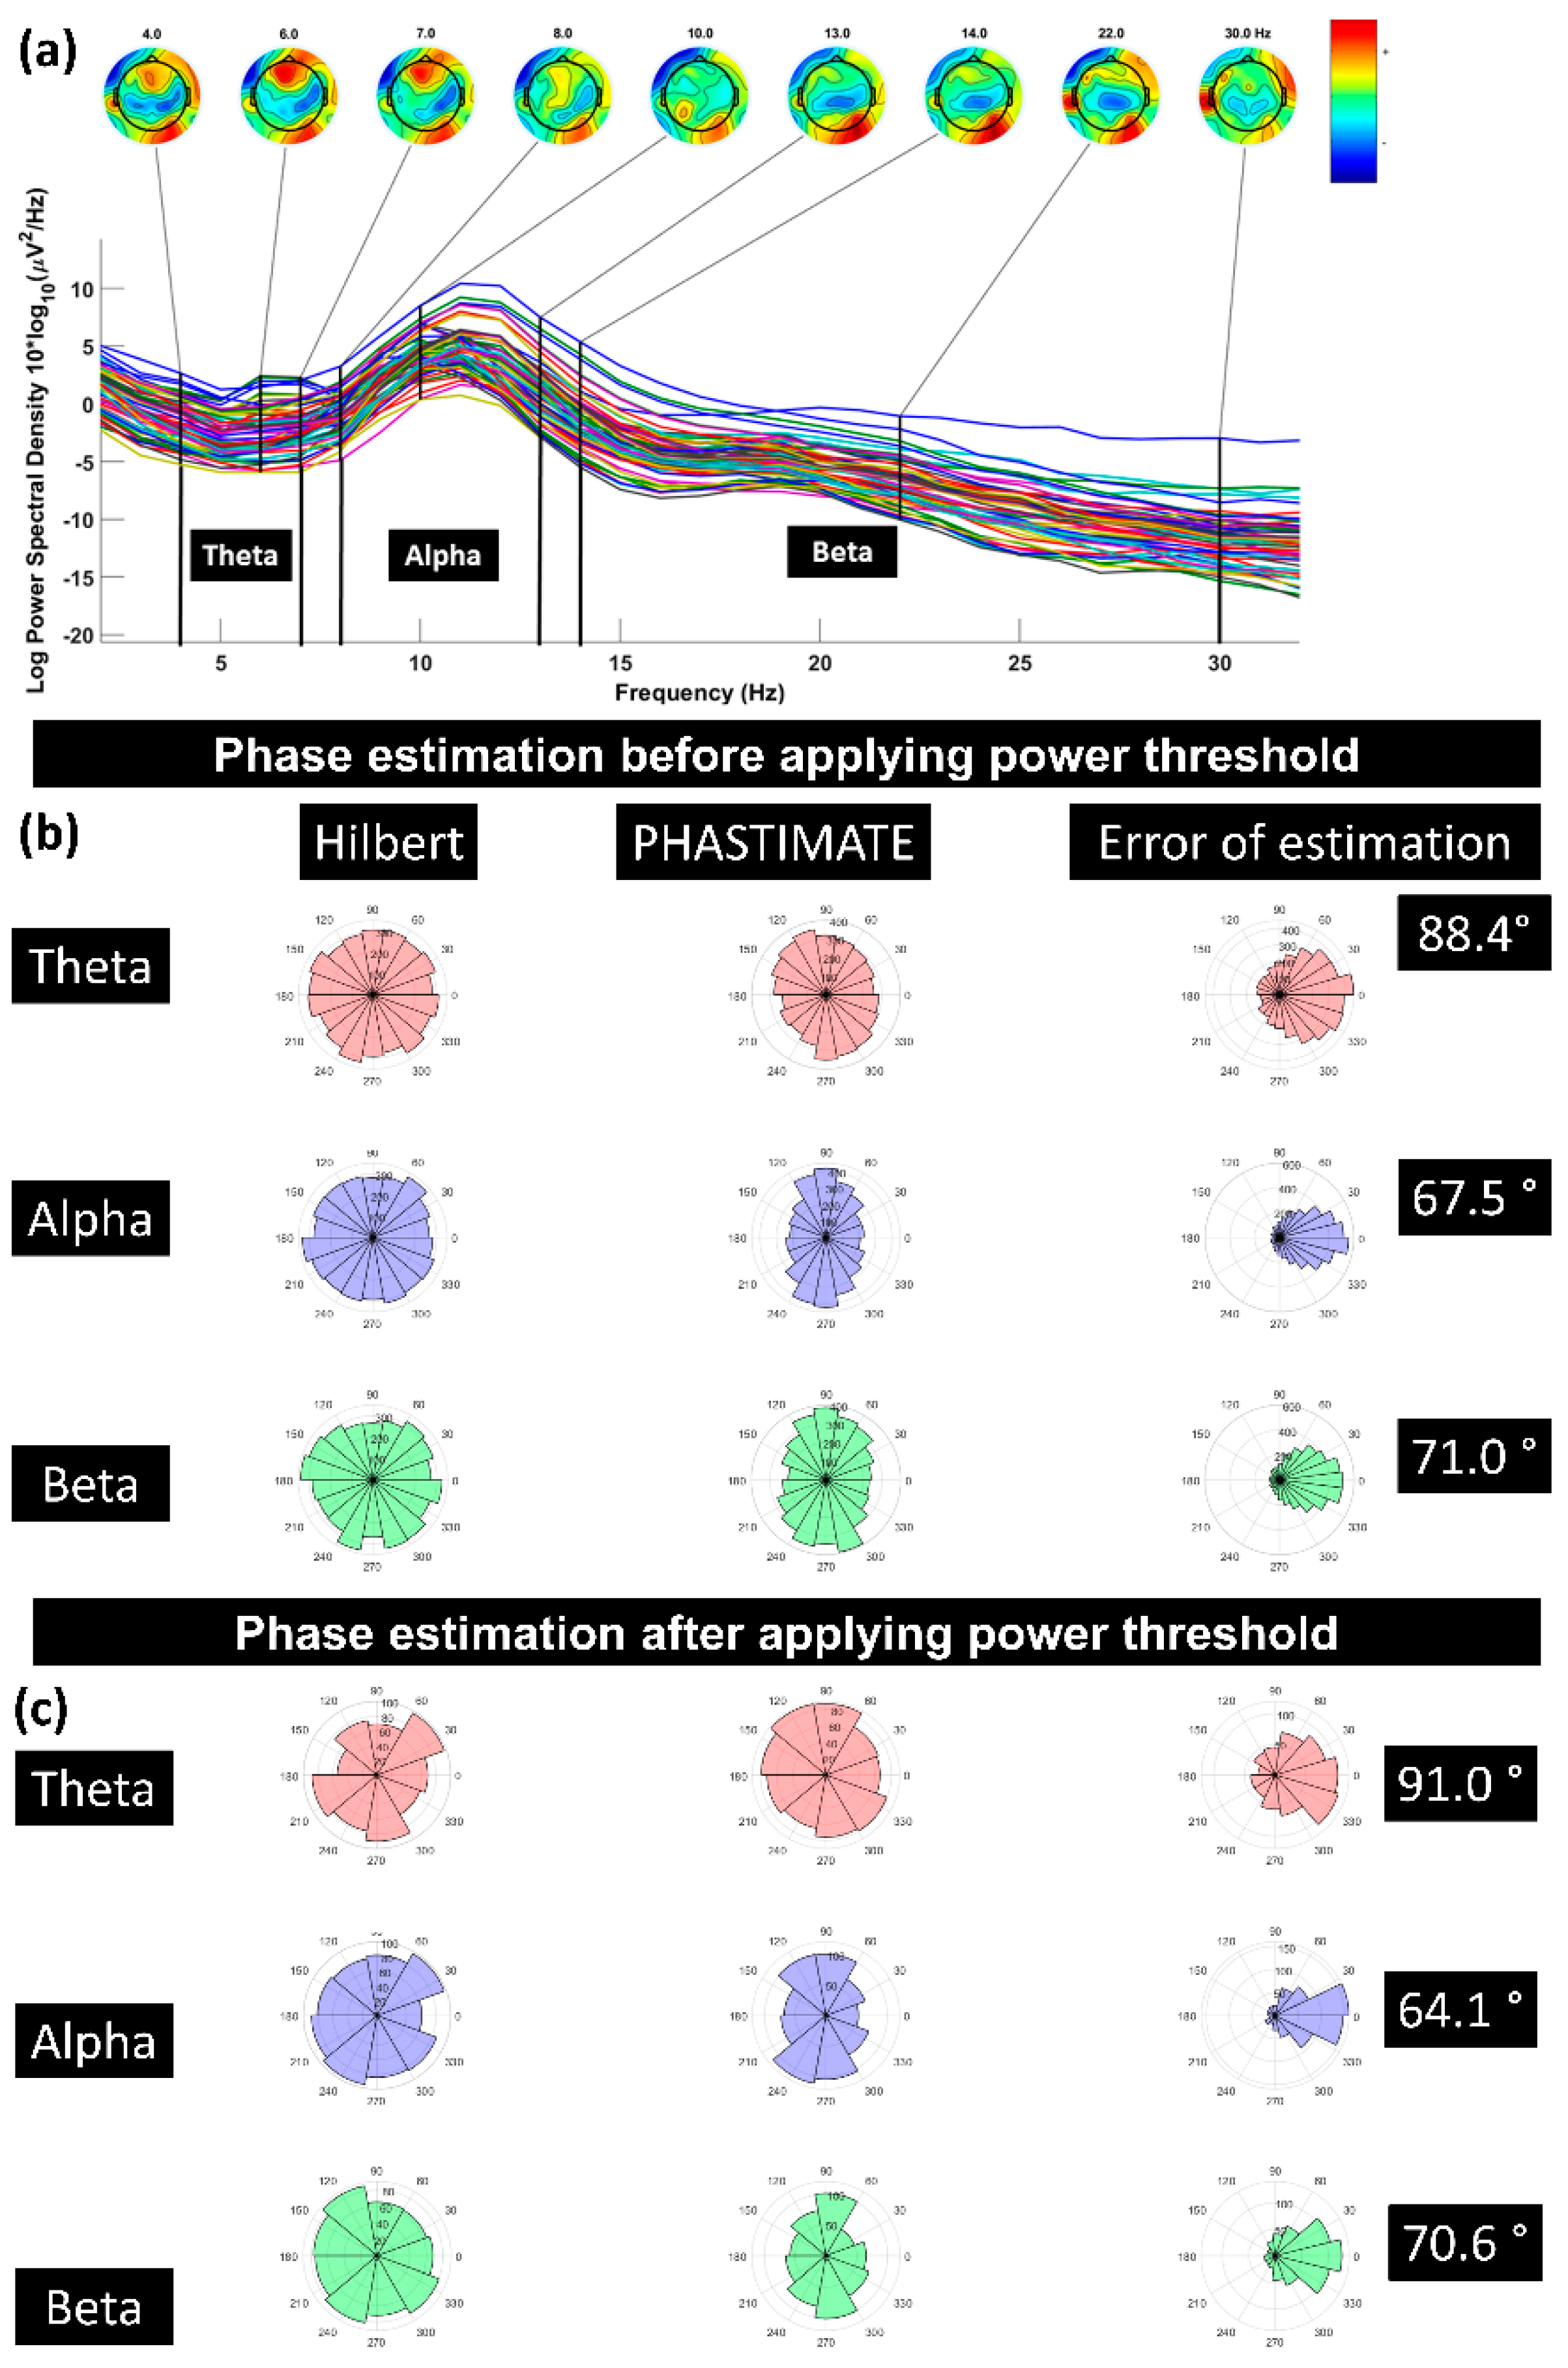
2.9. Power Spectrum Calculation
3. Results
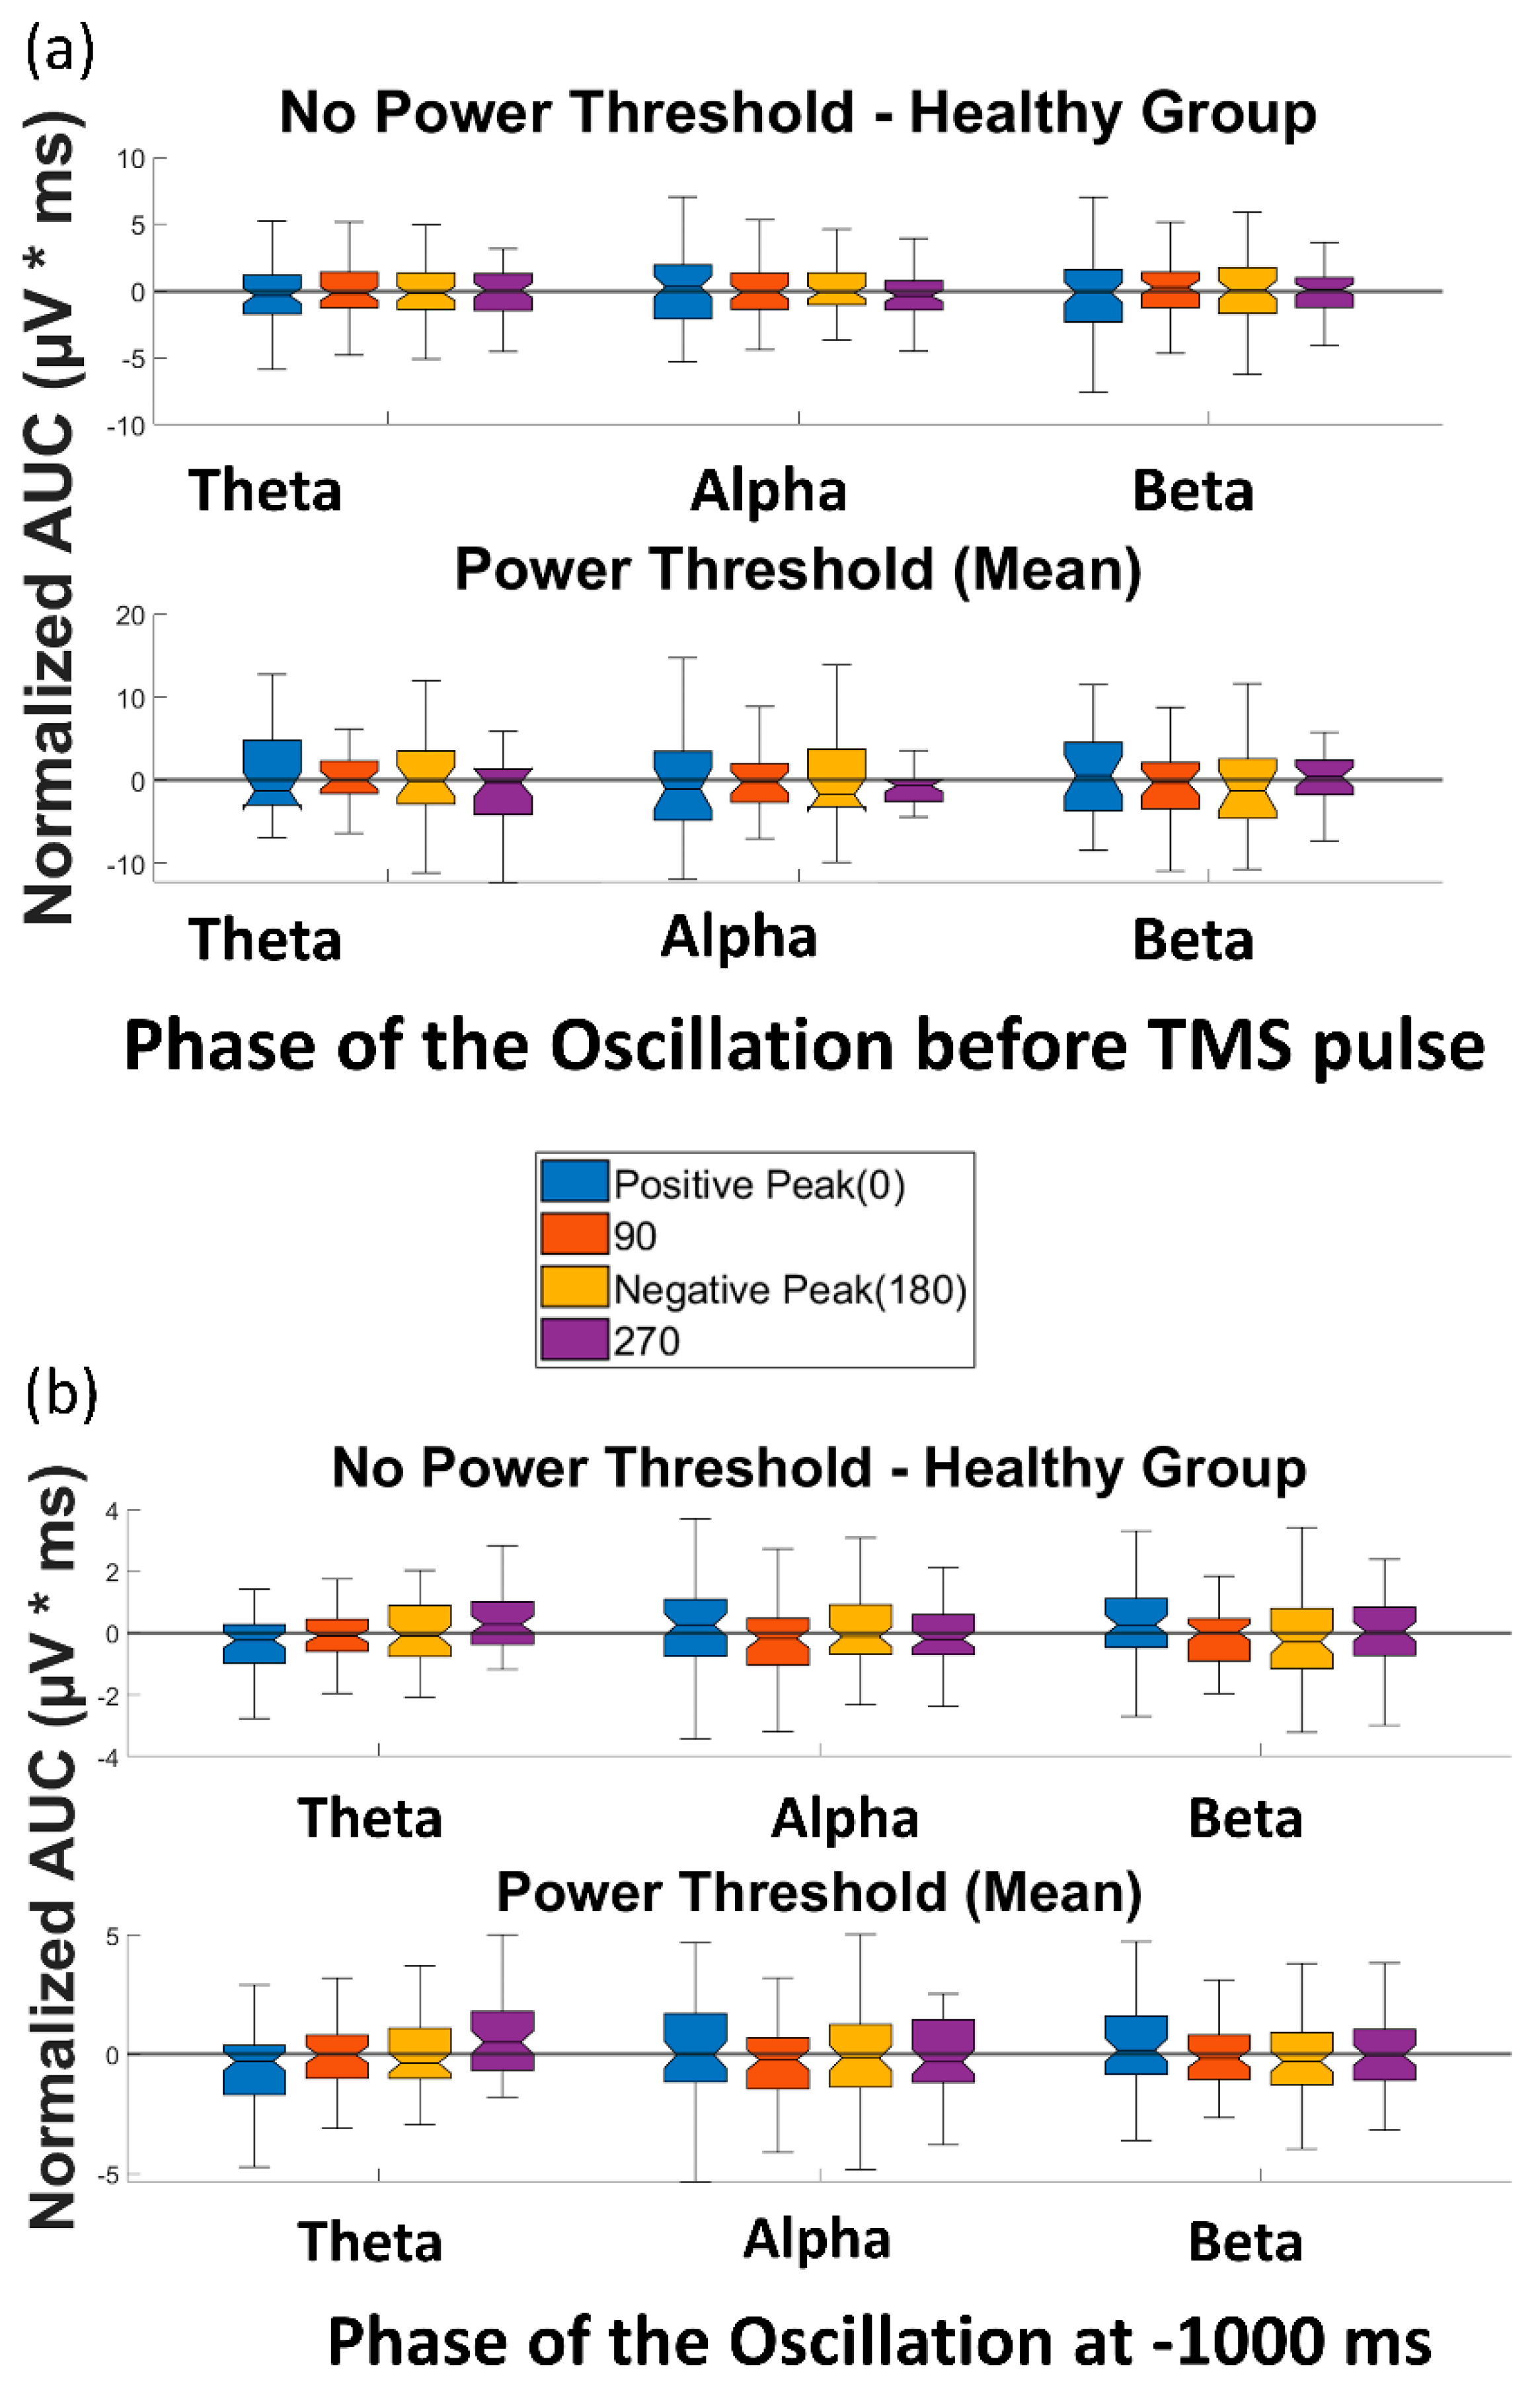
3.1. Effect of Pre-TMS Phase of Ongoing Brain Oscillation on TMS Cortical Response
3.2. Effect of Phase of Ongoing Brain Oscillation in Control Condition
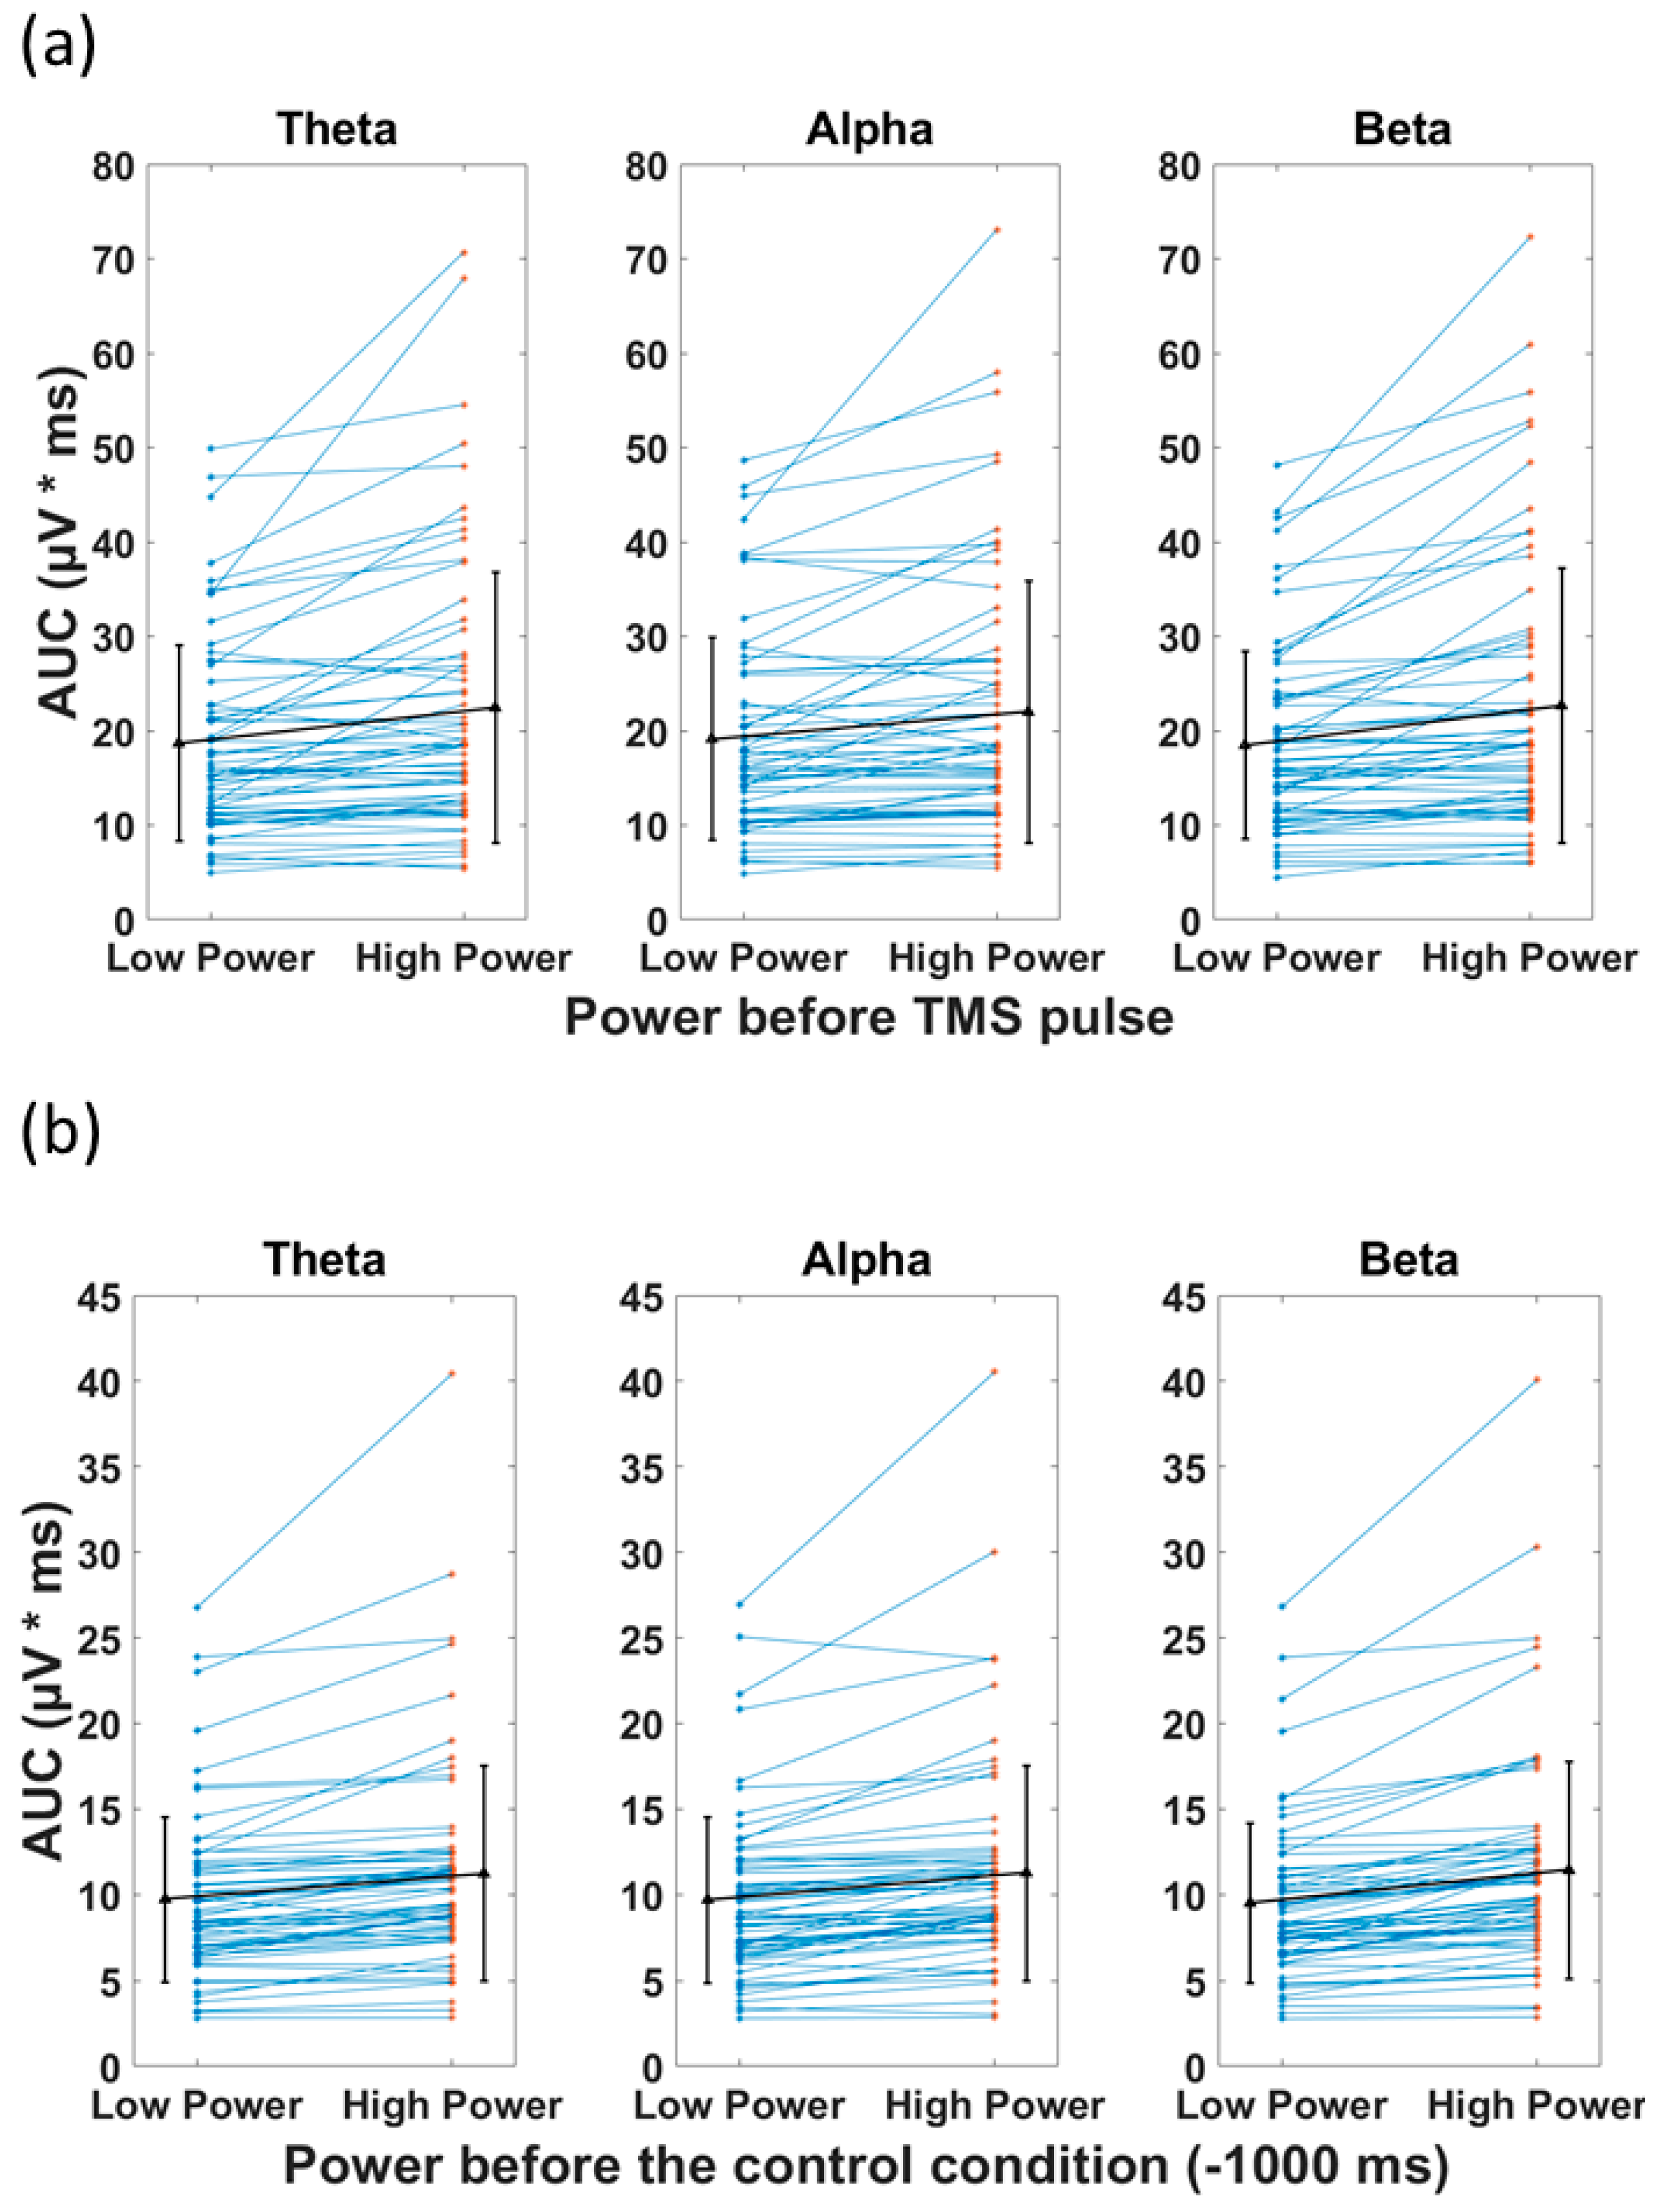
3.3. Power of the Signal and the Recorded Response
4. Discussion
4.1. Summary
4.2. Phase and Cortical Response
4.3. Power and Cortical Response
4.4. Variability of Cortical Reactivity in TMS-EEG
4.5. Limitations
4.6. Conclusions
Supplementary Materials
Author Contributions
Funding
Institutional Review Board Statement
Informed Consent Statement
Data Availability Statement
Conflicts of Interest
References
- Barker, A.T.; Jalinous, R.; Freeston, I.L. Non-invasive magnetic stimulation of human motor cortex. Lancet 1985, 325, 1106–1107. [Google Scholar] [CrossRef] [PubMed]
- Rossini, P.M.; Burke, D.; Chen, R.; Cohen, L.G.; Daskalakis, Z.; Di Iorio, R.; Di Lazzaro, V.; Ferreri, F.; Fitzgerald, P.B.; George, M.S.; et al. Non-Invasive Electrical and Magnetic Stimulation of the Brain, Spinal Cord, Roots and Peripheral Nerves: Basic Principles and Procedures for Routine Clinical and Research Application. An Updated Report from an I.F.C.N. Committee. Clin. Neurophysiol. 2015, 126, 1071–1107. [Google Scholar] [CrossRef] [PubMed]
- Farzan, F.; Vernet, M.; Shafi, M.M.D.; Rotenberg, A.; Daskalakis, Z.J.; Pascual-Leone, A. Characterizing and Modulating Brain Circuitry through Transcranial Magnetic Stimulation Combined with Electroencephalography. Front. Neural Circuits 2016, 10. [Google Scholar] [CrossRef] [PubMed]
- Hui, J.; Tremblay, S.; Daskalakis, Z.J. The Current and Future Potential of Transcranial Magnetic Stimulation With Electroencephalography in Psychiatry. Clin. Pharmacol. Ther. 2019, 106, 734–746. [Google Scholar] [CrossRef] [PubMed]
- Tremblay, S.; Rogasch, N.C.; Premoli, I.; Blumberger, D.M.; Casarotto, S.; Chen, R.; Di Lazzaro, V.; Farzan, F.; Ferrarelli, F.; Fitzgerald, P.B.; et al. Clinical Utility and Prospective of TMS–EEG. Clin. Neurophysiol. 2019, 130, 802–844. [Google Scholar] [CrossRef] [PubMed]
- O’Reardon, J.P.; Solvason, H.B.; Janicak, P.G.; Sampson, S.; Isenberg, K.E.; Nahas, Z.; McDonald, W.M.; Avery, D.; Fitzgerald, P.B.; Loo, C.; et al. Efficacy and Safety of Transcranial Magnetic Stimulation in the Acute Treatment of Major Depression: A Multisite Randomized Controlled Trial. Biol. Psychiatry 2007, 62, 1208–1216. [Google Scholar] [CrossRef]
- Blumberger, D.M.; Vila-Rodriguez, F.; Thorpe, K.E.; Feffer, K.; Noda, Y.; Giacobbe, P.; Knyahnytska, Y.; Kennedy, S.H.; Lam, R.W.; Daskalakis, Z.J.; et al. Effectiveness of Theta Burst versus High-Frequency Repetitive Transcranial Magnetic Stimulation in Patients with Depression (THREE-D): A Randomised Non-Inferiority Trial. Lancet 2018, 391, 1683–1692. [Google Scholar] [CrossRef] [PubMed]
- Sehatzadeh, S.; Daskalakis, Z.J.; Yap, B.; Tu, H.-A.; Palimaka, S.; Bowen, J.M.; O’Reilly, D.J. Unilateral and Bilateral Repetitive Transcranial Magnetic Stimulation for Treatment-Resistant Depression: A Meta-Analysis of Randomized Controlled Trials over 2 Decades. J. Psychiatry Neurosci. 2019, 44, 151–163. [Google Scholar] [CrossRef]
- Klooster, D.C.W.; Ferguson, M.A.; Boon, P.A.J.M.; Baeken, C. Personalizing Repetitive Transcranial Magnetic Stimulation Parameters for Depression Treatment Using Multimodal Neuroimaging. Biol. Psychiatry Cogn. Neurosci. Neuroimaging 2021, 260, 119465. [Google Scholar] [CrossRef]
- Allen, E.A.; Pasley, B.N.; Duong, T.; Freeman, R.D. Transcranial Magnetic Stimulation Elicits Coupled Neural and Hemodynamic Consequences. Science 2007, 317, 1918–1921. [Google Scholar] [CrossRef] [Green Version]
- Pasley, B.N.; Allen, E.A.; Freeman, R.D. State-Dependent Variability of Neuronal Responses to Transcranial Magnetic Stimulation of the Visual Cortex. Neuron 2009, 62, 291–303. [Google Scholar] [CrossRef] [PubMed]
- Zrenner, C.; Belardinelli, P.; Müller-Dahlhaus, F.; Ziemann, U. Closed-Loop Neuroscience and Non-Invasive Brain Stimulation: A Tale of Two Loops. Front. Cell. Neurosci. 2016, 10, 92. [Google Scholar] [CrossRef] [PubMed]
- Buzsaki, G. Neuronal Oscillations in Cortical Networks. Science 2004, 304, 1926–1929. [Google Scholar] [CrossRef] [PubMed]
- Freeman, W.J. Origin, Structure, and Role of Background EEG Activity. Part 2. Analytic Phase. Clin. Neurophysiol. 2004, 115, 2089–2107. [Google Scholar] [CrossRef] [PubMed]
- Zrenner, C.; Desideri, D.; Belardinelli, P.; Ziemann, U. Real-Time EEG-Defined Excitability States Determine Efficacy of TMS-Induced Plasticity in Human Motor Cortex. Brain Stimul. 2018, 11, 374–389. [Google Scholar] [CrossRef] [PubMed]
- Zrenner, B.; Zrenner, C.; Gordon, P.C.; Belardinelli, P.; McDermott, E.J.; Soekadar, S.R.; Fallgatter, A.J.; Ziemann, U.; Müller-Dahlhaus, F. Brain Oscillation-Synchronized Stimulation of the Left Dorsolateral Prefrontal Cortex in Depression Using Real-Time EEG-Triggered TMS. Brain Stimul. Basic Transl. Clin. Res. Neuromodulation 2020, 13, 197–205. [Google Scholar] [CrossRef] [PubMed]
- Desideri, D.; Zrenner, C.; Gordon, P.C.; Ziemann, U.; Belardinelli, P. Nil Effects of μ-Rhythm Phase-Dependent Burst-RTMS on Cortical Excitability in Humans: A Resting-State EEG and TMS-EEG Study. PLoS ONE 2018, 13, e0208747. [Google Scholar] [CrossRef]
- Madsen, K.H.; Karabanov, A.N.; Krohne, L.G.; Safeldt, M.G.; Tomasevic, L.; Siebner, H.R. No Trace of Phase: Corticomotor Excitability Is Not Tuned by Phase of Pericentral Mu-Rhythm. Brain Stimul. 2019, 12, 1261–1270. [Google Scholar] [CrossRef]
- van Elswijk, G.; Maij, F.; Schoffelen, J.-M.; Overeem, S.; Stegeman, D.F.; Fries, P. Corticospinal Beta-Band Synchronization Entails Rhythmic Gain Modulation. J. Neurosci. 2010, 30, 4481–4488. [Google Scholar] [CrossRef]
- Hussain, S.J.; Claudino, L.; Bönstrup, M.; Norato, G.; Cruciani, G.; Thompson, R.; Zrenner, C.; Ziemann, U.; Buch, E.; Cohen, L.G. Sensorimotor Oscillatory Phase-Power Interaction Gates Resting Human Corticospinal Output. Cereb Cortex 2019, 29, 3766–3777. [Google Scholar] [CrossRef]
- Voineskos, D.; Blumberger, D.M.; Rogasch, N.C.; Zomorrodi, R.; Farzan, F.; Foussias, G.; Rajji, T.K.; Daskalakis, Z.J. Neurophysiological Effects of Repetitive Transcranial Magnetic Stimulation (RTMS) in Treatment Resistant Depression. Clin. Neurophysiol. 2021, 132, 2306–2316. [Google Scholar] [CrossRef]
- Rajji, T.K.; Sun, Y.; Zomorrodi-Moghaddam, R.; Farzan, F.; Blumberger, D.M.; Mulsant, B.H.; Fitzgerald, P.B.; Daskalakis, Z.J. PAS-Induced Potentiation of Cortical-Evoked Activity in the Dorsolateral Prefrontal Cortex. Neuropsychopharmacology 2013, 38, 2545–2552. [Google Scholar] [CrossRef]
- Sun, Y.; Blumberger, D.M.; Mulsant, B.H.; Rajji, T.K.; Fitzgerald, P.B.; Barr, M.S.; Downar, J.; Wong, W.; Farzan, F.; Daskalakis, Z.J. Magnetic Seizure Therapy Reduces Suicidal Ideation and Produces Neuroplasticity in Treatment-Resistant Depression. Transl. Psychiatry 2018, 8, 1–11. [Google Scholar] [CrossRef] [PubMed]
- Poorganji, M.; Zomorrodi, R.; Hawco, C.; Hill, A.T.; Hadas, I.; Rajji, T.K.; Chen, R.; Voineskos, D.; Daskalakis, A.A.; Blumberger, D.M.; et al. Differentiating Transcranial Magnetic Stimulation Cortical and Auditory Responses via Single Pulse and Paired Pulse Protocols: A TMS-EEG Study. Clin. Neurophysiol. 2021, 132, 1850–1858. [Google Scholar] [CrossRef] [PubMed]
- Dhami, P.; Atluri, S.; Lee, J.C.; Knyahnytska, Y.; Croarkin, P.E.; Blumberger, D.M.; Daskalakis, Z.J.; Farzan, F. Prefrontal Cortical Reactivity and Connectivity Markers Distinguish Youth Depression from Healthy Youth. Cereb Cortex 2020, 30, 3884–3894. [Google Scholar] [CrossRef] [PubMed]
- Delorme, A.; Makeig, S. EEGLAB: An Open Source Toolbox for Analysis of Single-Trial EEG Dynamics Including Independent Component Analysis. J. Neurosci. Methods 2004, 134, 9–21. [Google Scholar] [CrossRef] [PubMed]
- Rogasch, N.C.; Sullivan, C.; Thomson, R.H.; Rose, N.S.; Bailey, N.W.; Fitzgerald, P.B.; Farzan, F.; Hernandez-Pavon, J.C. Analysing Concurrent Transcranial Magnetic Stimulation and Electroencephalographic Data: A Review and Introduction to the Open-Source TESA Software. NeuroImage 2017, 147, 934–951. [Google Scholar] [CrossRef] [PubMed]
- Oostenveld, R.; Fries, P.; Maris, E.; Schoffelen, J.-M. FieldTrip: Open Source Software for Advanced Analysis of MEG, EEG, and Invasive Electrophysiological Data. Comput. Intell. Neurosci. 2011, 2011, 156869. [Google Scholar] [CrossRef]
- Hadas, I.; Sun, Y.; Lioumis, P.; Zomorrodi, R.; Jones, B.; Voineskos, D.; Downar, J.; Fitzgerald, P.B.; Blumberger, D.M.; Daskalakis, Z.J. Association of Repetitive Transcranial Magnetic Stimulation Treatment With Subgenual Cingulate Hyperactivity in Patients With Major Depressive Disorder: A Secondary Analysis of a Randomized Clinical Trial. JAMA Netw. Open 2019, 2, e195578. [Google Scholar] [CrossRef]
- Kayser, J.; Tenke, C.E. On the Benefits of Using Surface Laplacian (Current Source Density) Methodology in Electrophysiology. Int. J. Psychophysiol. 2015, 97, 171–173. [Google Scholar] [CrossRef] [Green Version]
- Zrenner, C.; Galevska, D.; Nieminen, J.O.; Baur, D.; Stefanou, M.-I.; Ziemann, U. The Shaky Ground Truth of Real-Time Phase Estimation. Neuroimage 2020, 214, 116761. [Google Scholar] [CrossRef] [PubMed]
- Gordon, P.C.; Dörre, S.; Belardinelli, P.; Stenroos, M.; Zrenner, B.; Ziemann, U.; Zrenner, C. Prefrontal Theta-Phase Synchronized Brain Stimulation With Real-Time EEG-Triggered TMS. Front. Hum. Neurosci. 2021, 15, 691821. [Google Scholar] [CrossRef] [PubMed]
- Wodeyar, A.; Schatza, M.; Widge, A.S.; Eden, U.T.; Kramer, M.A. A State Space Modeling Approach to Real-Time Phase Estimation. eLife 2021, 10, e68803. [Google Scholar] [CrossRef] [PubMed]
- Biabani, M.; Fornito, A.; Mutanen, T.P.; Morrow, J.; Rogasch, N.C. Characterizing and Minimizing the Contribution of Sensory Inputs to TMS-Evoked Potentials. Brain Stimul. 2019, 12, 1537–1552. [Google Scholar] [CrossRef]
- Conde, V.; Tomasevic, L.; Akopian, I.; Stanek, K.; Saturnino, G.B.; Thielscher, A.; Bergmann, T.O.; Siebner, H.R. The Non-Transcranial TMS-Evoked Potential Is an Inherent Source of Ambiguity in TMS-EEG Studies. NeuroImage 2019, 185, 300–312. [Google Scholar] [CrossRef]
- Gordon, P.C.; Jovellar, D.B.; Song, Y.; Zrenner, C.; Belardinelli, P.; Siebner, H.R.; Ziemann, U. Recording Brain Responses to TMS of Primary Motor Cortex by EEG—Utility of an Optimized Sham Procedure. NeuroImage 2021, 245, 118708. [Google Scholar] [CrossRef]
- Rocchi, L.; Di Santo, A.; Brown, K.; Ibáñez, J.; Casula, E.; Rawji, V.; Di Lazzaro, V.; Koch, G.; Rothwell, J. Disentangling EEG Responses to TMS Due to Cortical and Peripheral Activations. Brain Stimul. 2021, 14, 4–18. [Google Scholar] [CrossRef]
- Linkenkaer-Hansen, K.; Nikouline, V.V.; Palva, J.M.; Ilmoniemi, R.J. Long-Range Temporal Correlations and Scaling Behavior in Human Brain Oscillations. J. Neurosci. 2001, 21, 1370–1377. [Google Scholar] [CrossRef]
- Zhang, J.; Huang, Z.; Chen, Y.; Zhang, J.; Ghinda, D.; Nikolova, Y.; Wu, J.; Xu, J.; Bai, W.; Mao, Y.; et al. Breakdown in the Temporal and Spatial Organization of Spontaneous Brain Activity during General Anesthesia. Hum. Brain Mapp. 2018, 39, 2035–2046. [Google Scholar] [CrossRef]
- Sugimura, K.; Iwasa, Y.; Kobayashi, R.; Honda, T.; Hashimoto, J.; Kashihara, S.; Zhu, J.; Yamamoto, K.; Kawahara, T.; Anno, M.; et al. Association between Long-Range Temporal Correlations in Intrinsic EEG Activity and Subjective Sense of Identity. Sci. Rep. 2021, 11, 422. [Google Scholar] [CrossRef]
- Arieli, A.; Sterkin, A.; Grinvald, A.; Aertsen, A.D. Dynamics of Ongoing Activity: Explanation of the Large Variability in Evoked Cortical Responses. Science 1996, 273, 1868–1871. [Google Scholar] [CrossRef] [PubMed]
- Huerta, P.T.; Lisman, J.E. Bidirectional Synaptic Plasticity Induced by a Single Burst during Cholinergic Theta Oscillation in CA1 in Vitro. Neuron 1995, 15, 1053–1063. [Google Scholar] [CrossRef] [PubMed]
- Haegens, S.; Nácher, V.; Luna, R.; Romo, R.; Jensen, O. α-Oscillations in the Monkey Sensorimotor Network Influence Discrimination Performance by Rhythmical Inhibition of Neuronal Spiking. Proc. Natl. Acad. Sci. USA 2011, 108, 19377–19382. [Google Scholar] [CrossRef] [PubMed]
- Mäki, H.; Ilmoniemi, R.J. EEG Oscillations and Magnetically Evoked Motor Potentials Reflect Motor System Excitability in Overlapping Neuronal Populations. Clin. Neurophysiol. 2010, 121, 492–501. [Google Scholar] [CrossRef] [PubMed]
- Schaworonkow, N.; Triesch, J.; Ziemann, U.; Zrenner, C. EEG-Triggered TMS Reveals Stronger Brain State-Dependent Modulation of Motor Evoked Potentials at Weaker Stimulation Intensities. Brain Stimul. 2019, 12, 110–118. [Google Scholar] [CrossRef] [PubMed]
- Bergmann, T.O.; Lieb, A.; Zrenner, C.; Ziemann, U. Pulsed Facilitation of Corticospinal Excitability by the Sensorimotor μ-Alpha Rhythm. J. Neurosci. 2019, 39, 10034–10043. [Google Scholar] [CrossRef] [PubMed]
- Desideri, D.; Zrenner, C.; Ziemann, U.; Belardinelli, P. Phase of Sensorimotor μ-Oscillation Modulates Cortical Responses to Transcranial Magnetic Stimulation of the Human Motor Cortex. J. Physiol. 2019, 597, 5671–5686. [Google Scholar] [CrossRef]
- Hallett, M. Transcranial Magnetic Stimulation and the Human Brain. Nature 2000, 406, 147–150. [Google Scholar] [CrossRef]
- Fecchio, M.; Pigorini, A.; Comanducci, A.; Sarasso, S.; Casarotto, S.; Premoli, I.; Derchi, C.-C.; Mazza, A.; Russo, S.; Resta, F.; et al. The Spectral Features of EEG Responses to Transcranial Magnetic Stimulation of the Primary Motor Cortex Depend on the Amplitude of the Motor Evoked Potentials. PLoS ONE 2017, 12, e0184910. [Google Scholar] [CrossRef]
- Zarkowski, P.; Shin, C.J.; Dang, T.; Russo, J.; Avery, D. EEG and the Variance of Motor Evoked Potential Amplitude. Clin. EEG Neurosci. 2006, 37, 247–251. [Google Scholar] [CrossRef]
- Klimesch, W.; Sauseng, P.; Hanslmayr, S. EEG Alpha Oscillations: The Inhibition–Timing Hypothesis. Brain Res. Rev. 2007, 53, 63–88. [Google Scholar] [CrossRef] [PubMed]
- Romei, V.; Brodbeck, V.; Michel, C.; Amedi, A.; Pascual-Leone, A.; Thut, G. Spontaneous Fluctuations in Posterior α-Band EEG Activity Reflect Variability in Excitability of Human Visual Areas. Cereb. Cortex 2008, 18, 2010–2018. [Google Scholar] [CrossRef] [PubMed]
- Lange, J.; Oostenveld, R.; Fries, P. Reduced Occipital Alpha Power Indexes Enhanced Excitability Rather than Improved Visual Perception. J. Neurosci. 2013, 33, 3212–3220. [Google Scholar] [CrossRef] [PubMed]
- Sauseng, P.; Klimesch, W.; Gerloff, C.; Hummel, F.C. Spontaneous Locally Restricted EEG Alpha Activity Determines Cortical Excitability in the Motor Cortex. Neuropsychologia 2009, 47, 284–288. [Google Scholar] [CrossRef] [PubMed]
- Jones, S.R.; Kerr, C.E.; Wan, Q.; Pritchett, D.L.; Hämäläinen, M.; Moore, C.I. Cued Spatial Attention Drives Functionally Relevant Modulation of the Mu Rhythm in Primary Somatosensory Cortex. J. Neurosci. 2010, 30, 13760–13765. [Google Scholar] [CrossRef] [PubMed]
- Schulz, H.; Ubelacker, T.; Keil, J.; Müller, N.; Weisz, N. Now I Am Ready-Now i Am Not: The Influence of Pre-TMS Oscillations and Corticomuscular Coherence on Motor-Evoked Potentials. Cereb Cortex 2014, 24, 1708–1719. [Google Scholar] [CrossRef]
- Anderson, K.L.; Ding, M. Attentional Modulation of the Somatosensory Mu Rhythm. Neuroscience 2011, 180, 165–180. [Google Scholar] [CrossRef]
- Ogata, K.; Nakazono, H.; Uehara, T.; Tobimatsu, S. Prestimulus Cortical EEG Oscillations Can Predict the Excitability of the Primary Motor Cortex. Brain Stimul. 2019, 12, 1508–1516. [Google Scholar] [CrossRef]
- Thies, M.; Zrenner, C.; Ziemann, U.; Bergmann, T.O. Sensorimotor Mu-Alpha Power Is Positively Related to Corticospinal Excitability. Brain Stimul. 2018, 11, 1119–1122. [Google Scholar] [CrossRef] [PubMed]
- Cavanagh, J.F.; Frank, M.J. Frontal Theta as a Mechanism for Cognitive Control. Trends Cogn. Sci. 2014, 18, 414–421. [Google Scholar] [CrossRef] [Green Version]
- Cohen, M.; Cavanagh, J.F. Single-Trial Regression Elucidates the Role of Prefrontal Theta Oscillations in Response Conflict. Front. Psychol. 2011, 2, 30. [Google Scholar] [CrossRef] [PubMed]
- Itthipuripat, S.; Wessel, J.R.; Aron, A.R. Frontal Theta Is a Signature of Successful Working Memory Manipulation. Exp. Brain Res. 2013, 224, 255–262. [Google Scholar] [CrossRef]
- Nigbur, R. Theta Power as a Marker for Cognitive Interference. Clin. Neurophysiol. 2011, 122, 2185–2194. [Google Scholar] [CrossRef] [PubMed]
- Cohen, M.X.; Donner, T.H. Midfrontal Conflict-Related Theta-Band Power Reflects Neural Oscillations That Predict Behavior. J. Neurophysiol. 2013, 110, 2752–2763. [Google Scholar] [CrossRef] [PubMed]
- Luu, P.; Tucker, D.M.; Makeig, S. Frontal Midline Theta and the Error-Related Negativity: Neurophysiological Mechanisms of Action Regulation. Clin. Neurophysiol. 2004, 115, 1821–1835. [Google Scholar] [CrossRef] [PubMed]
- Trujillo, L.T.; Allen, J.J.B. Theta EEG Dynamics of the Error-Related Negativity. Clin. Neurophysiol. 2007, 118, 645–668. [Google Scholar] [CrossRef] [PubMed]
- Zavala, B.; Jang, A.; Trotta, M.; Lungu, C.I.; Brown, P.; Zaghloul, K.A. Cognitive Control Involves Theta Power within Trials and Beta Power across Trials in the Prefrontal-Subthalamic Network. Brain 2018, 141, 3361–3376. [Google Scholar] [CrossRef] [PubMed]
- Allen, J.J.B.; Urry, H.L.; Hitt, S.K.; Coan, J.A. The Stability of Resting Frontal Electroencephalographic Asymmetry in Depression. Psychophysiology 2004, 41, 269–280. [Google Scholar] [CrossRef]
- Kemp, A.H.; Griffiths, K.; Felmingham, K.L.; Shankman, S.A.; Drinkenburg, W.; Arns, M.; Clark, C.R.; Bryant, R.A. Disorder Specificity despite Comorbidity: Resting EEG Alpha Asymmetry in Major Depressive Disorder and Post-Traumatic Stress Disorder. Biol. Psychol. 2010, 85, 350–354. [Google Scholar] [CrossRef]
- Kołodziej, A.; Magnuski, M.; Ruban, A.; Brzezicka, A. No Relationship between Frontal Alpha Asymmetry and Depressive Disorders in a Multiverse Analysis of Five Studies. eLife 2021, 10, e60595. [Google Scholar] [CrossRef]
- Gordon, P.C.; Belardinelli, P.; Stenroos, M.; Ziemann, U.; Zrenner, C. Prefrontal Theta Phase-Dependent RTMS-Induced Plasticity of Cortical and Behavioral Responses in Human Cortex. Brain Stimul. 2022, S1935861X22000341. [Google Scholar] [CrossRef] [PubMed]
- McLoughlin, G.; Gyurkovics, M.; Palmer, J.; Makeig, S. Midfrontal Theta Activity in Psychiatric Illness: An Index of Cognitive Vulnerabilities Across Disorders. Biol. Psychiatry 2022, 91, 173–182. [Google Scholar] [CrossRef] [PubMed]
- Daskalakis, Z.J.; Poorganji, M. Getting Things Right—Proper Training in Non-Invasive Brain Stimulation. Clin. Neurophysiol. 2021, 132, 810–811. [Google Scholar] [CrossRef] [PubMed]
- Fried, P.J.; Santarnecchi, E.; Antal, A.; Bartres-Faz, D.; Bestmann, S.; Carpenter, L.L.; Celnik, P.; Edwards, D.; Farzan, F.; Fecteau, S.; et al. Training in the Practice of Noninvasive Brain Stimulation: Recommendations from an IFCN Committee. Clin. Neurophysiol. 2021, 132, 819–837. [Google Scholar] [CrossRef] [PubMed]
- Kundu, B.; Johnson, J.S.; Postle, B.R. Prestimulation Phase Predicts the TMS-Evoked Response. J. Neurophysiol. 2014, 112, 1885–1893. [Google Scholar] [CrossRef]
- Shafi, M.M.; Vernet, M.; Klooster, D.; Chu, C.J.; Boric, K.; Barnard, M.E.; Romatoski, K.; Westover, M.B.; Christodoulou, J.A.; Gabrieli, J.D.E.; et al. Physiological Consequences of Abnormal Connectivity in a Developmental Epilepsy. Ann. Neurol. 2015, 77, 487–503. [Google Scholar] [CrossRef] [Green Version]


| Frequency | Filter Order (Zero-Phase Forward and Backward) | Window Size | Removed Edge | Order (Yule–Walker) | Hilbert Window |
|---|---|---|---|---|---|
| Theta (4–7 Hz) | 320 | 1000 ms | 140 ms | 30 | 256 |
| Alpha (8–13 Hz) | 192 | 718 ms | 65 ms | 25 | 128 |
| Beta (14–30 Hz) | 100 | 500 ms | 30 ms | 15 | 64 |
| No Power Threshold | |||||
|---|---|---|---|---|---|
| Frequency/Phase | Random | Positive Peak | 90° | Negative Peak | 270° |
| Theta | 5347 | 799 | 999 | 722 | 1045 |
| Alpha | 5347 | 658 | 1264 | 673 | 1121 |
| Beta | 5347 | 670 | 1125 | 642 | 1172 |
| Power Threshold Applied | |||||
| Frequency/Phase | Random | Positive Peak | 90° | Negative Peak | 270° |
| Theta | 660 | 109 | 127 | 100 | 123 |
| Alpha | 732 | 80 | 168 | 88 | 153 |
| Beta | 683 | 85 | 152 | 82 | 145 |
| t-Test Statistics Comparing the Area under the Curve of TMS for Low vs. High Pre-TMS Power in Healthy Group | |||||||
|---|---|---|---|---|---|---|---|
| Frequency | Mean-Low | Std-Low | Mean-High | Std-High | t.stat | df | p |
| Theta | 18.7 | 10.3 | 22.5 | 14.4 | 4.7 | 63 | 1.27 × 10⁻⁵ |
| Alpha | 19.1 | 10.7 | 22.0 | 13.9 | 4.2 | 63 | 8.67 × 10⁻⁵ |
| Beta | 18.5 | 9.9 | 22.7 | 14.6 | 5.4 | 63 | 1.01 × 10⁻⁶ |
| t-Test Statistics Comparing the Area under the Curve of Control Condition for Low vs. High Power in Healthy Group | |||||||
| Theta | 9.7 | 4.8 | 11.2 | 6.3 | 5.7 | 63 | 3.67 × 10⁻⁷ |
| Alpha | 9.7 | 4.8 | 11.3 | 6.3 | 5.6 | 63 | 4.39 × 10⁻⁷ |
| Beta | 9.5 | 4.7 | 11.4 | 6.4 | 6.7 | 63 | 7.07 × 10⁻⁹ |
Disclaimer/Publisher’s Note: The statements, opinions and data contained in all publications are solely those of the individual author(s) and contributor(s) and not of MDPI and/or the editor(s). MDPI and/or the editor(s) disclaim responsibility for any injury to people or property resulting from any ideas, methods, instructions or products referred to in the content. |
© 2023 by the authors. Licensee MDPI, Basel, Switzerland. This article is an open access article distributed under the terms and conditions of the Creative Commons Attribution (CC BY) license (https://creativecommons.org/licenses/by/4.0/).
Share and Cite
Poorganji, M.; Zomorrodi, R.; Zrenner, C.; Bansal, A.; Hawco, C.; Hill, A.T.; Hadas, I.; Rajji, T.K.; Chen, R.; Zrenner, B.; et al. Pre-Stimulus Power but Not Phase Predicts Prefrontal Cortical Excitability in TMS-EEG. Biosensors 2023, 13, 220. https://doi.org/10.3390/bios13020220
Poorganji M, Zomorrodi R, Zrenner C, Bansal A, Hawco C, Hill AT, Hadas I, Rajji TK, Chen R, Zrenner B, et al. Pre-Stimulus Power but Not Phase Predicts Prefrontal Cortical Excitability in TMS-EEG. Biosensors. 2023; 13(2):220. https://doi.org/10.3390/bios13020220
Chicago/Turabian StylePoorganji, Mohsen, Reza Zomorrodi, Christoph Zrenner, Aiyush Bansal, Colin Hawco, Aron T. Hill, Itay Hadas, Tarek K. Rajji, Robert Chen, Brigitte Zrenner, and et al. 2023. "Pre-Stimulus Power but Not Phase Predicts Prefrontal Cortical Excitability in TMS-EEG" Biosensors 13, no. 2: 220. https://doi.org/10.3390/bios13020220