Article

Ultrasensitive Photochemical Immunosensor Based on Flowerlike SnO2/BiOI/Ag2S Composites for Detection of Procalcitonin

1
School of Chemistry and Chemical Engineering, Shandong University of Technology, Zibo 255049, China
2
Key Laboratory of Interfacial Reaction & Sensing Analysis in Universities of Shandong, School of Chemistry and Chemical Engineering, University of Jinan, Jinan 250022, China
3
Shandong Provincial Key Laboratory of Molecular Engineering, School of Chemistry and Chemical Engineering, Qilu University of Technology (Shandong Academy of Sciences), Jinan 250353, China
*
Authors to whom correspondence should be addressed.
Biosensors 2021, 11(11), 421; https://doi.org/10.3390/bios11110421
Submission received: 7 October 2021 / Revised: 25 October 2021 / Accepted: 25 October 2021 / Published: 28 October 2021
(This article belongs to the Special Issue Application of Nanomaterials for Biosensors)

Abstract

:
Based on the necessity and urgency of detecting infectious disease marker procalcitonin (PCT), a novel unlabeled photoelectrochemical (PEC) immunosensor was prepared for the rapid and sensitive detection of PCT. Firstly, SnO2 porous nanoflowers with good photocatalytic performance were prepared by combining hydrothermal synthesis and calcining. BiOI nanoflowers were synthesized by facile ultrasonic mixed reaction. Ag2S quantum dots were deposited on SnO2/BiOI composites by in situ growth method. The SnO2/BiOI/Ag2S composites with excellent photoelectric properties were employed as substrate material, which could provide significantly enhanced and stable signal because of the energy level matching of SnO2, BiOI and Ag2S and the good light absorption performance. Accordingly, a PEC immunosensor based on SnO2/BiOI/Ag2S was constructed by using the layered modification method to achieve high sensitivity analysis of PCT. The linear dynamic range of the detection method was 0.50 pg·mL−1~100 ng·mL−1, and the detection limit was 0.14 pg·mL−1. In addition, the designed PEC immunosensor exhibited satisfactory sensitivity, selectivity, stability and repeatability, which opened up a new avenue for the analyzation of PCT and further provided guidance for antibiotic therapy.

1. Introduction

Due to its high accuracy for the diagnosis of bacterial infections, procalcitonin (PCT) is an FDA-approved blood infection marker for guiding antibiotic therapy [1,2]. In normal human serum, the level of PCT is less than 0.1 ng·mL−1 [3]. When the human body suffers from bacteria, fungi, or parasites and more severe sepsis or multiple organ failure, the level of PCT increases sharply. When PCT concentration in serum exceeds 0.5 ng·mL−1, the antibiotic therapy will be strongly recommended [4]. Research shows that elevated serum PCT is frequently seen in sepsis, severe trauma, heatstroke, necrotizing fasciitis, urinary tract infection, lower respiratory tract infections, neoplastic diseases and so on [5]. Some evidence also supports that PCT is also a new biomarker for the cardiologist [6]. In addition, PCT may be an indicator of disease severity in COVID-19 and may contribute to determine the severity of patients infected with SARS-CoV-2, thus playing an important role in COVID-19 antimicrobial stewardship [7,8]. Therefore, exploring an accurate, sensitive, simple and rapid determination method of PCT level in human blood serum is quite important for the early diagnosis of inflammation and other diseases, further guiding the antibiotic therapy.
Up to now, many detection methods based on immunoassay have been developed for PCT determination; for instance, enzyme-linked immunosorbent assay [9], chemiluminescence immunoassay [10,11], electrochemical immunoassay [12,13,14], microfluidics immunoassays [15], fluorescence immunoassay [16], lateral flow immunoassays [17], surface plasma resonance immunoassay [18], photoelectrochemical (PEC) immunosensor [19,20] and so on. Compared with other methods, PEC immunosensors have excellent features of high signal-to-noise ratio, simple operation, needlessness of expensive maintenance and easy miniaturization because of the dual advantages of optical and electrochemical methods. It is worth mentioning that label-free PEC immunosensors do not need complex labeling steps for the detected objects, which can save time, improve reproducibility and maintain the intrinsic characteristics of the objects.
As is known to all, the new photoelectrical sensing material plays an important role in the construction of the sensor [21,22]. Especially, metal oxide nanomaterials have good photoelectric and photocatalytic properties, which have been widely used in the field of PEC immunosensors. Among many oxide semiconductors, stannic oxide (SnO2) is one of the most representative semiconductor materials because of its unique catalytic and electrochemical properties, which has been widely applied in various domains including lithium-ion battery, solar cells, photocatalyst, photodetection and gas sensors [23,24,25,26,27]. A different morphology of SnO2 can be obtained by different synthesis methods and reaction conditions, such as nanoparticles, nanorods, nano-microspheres, nanoflowers and other microstructures. Flowerlike SnO2 is in favor of surface reaction and can enhance the sensing performances due to its structure configuration. Nonetheless, the wide band gap of SnO2 (Eg = 3.6 eV) leads to the poor light absorption properties and high electron-hole recombination. In order to improve the photocurrent conversion efficiency of SnO2, two basic approaches should be considered: one is to add the active sites of SnO2 by designing reasonable structure, and another is to build the heterostructure of SnO2 nanocomposites to promote charge separation effectively.
Environmentally friendly bismuth-based materials have attracted people’s great attention because of their special layered structure and excellent photocatalytic performance [28]. Among these materials, bismuth oxyiodide (BiOI) is a well-known layered p-type semiconductor (Eg = 1.7~1.9 eV), which has been widely used in the field of photocatalysis and pharmaceutical materials recently [29,30,31]. BiOI has strong absorption in the visible region and the alternates [Bi2O2]2+ layer and double I-layer can promote separation efficiency of photo-induced electrons and holes [32,33]. Through construction SnO2/BiOI heterojunction, excellent photocatalytic activity and efficient sunlight-harvesting nature can be realized. In addition, Ag2S nanoparticles with a narrower band gap (~1.0 eV) have also attracted great interests in the field of photocatalysis because of their excellent properties such as excellent stability, good electron transfer efficiency and prominent absorption coefficient, which are commonly employed in PEC fields [34]. With its good sensitization, Ag2S can be modified on the SnO2/BiOI electrode to further improve the photoelectric properties of the substrate material.
Herein, based on SnO2/BiOI/Ag2S nanocomposites, an ultrasensitive PEC immunosensor was developed for detection of PCT. Firstly, SnO2/BiOI/Ag2S composites were modified onto the ITO electrode, which can improve the sensitivity because of the high initial signal. SnO2 and BiOI can form N-P heterojunction with good photoactivity, and with the sensitization of Ag2S nanoparticles, the photocurrent response enhanced significantly. Secondly, anti-PCT and PCT were immobilized on the modified electrode by the reaction between carbonyl and amino groups and antibody–antigen specific recognition, respectively. Anti-PCT and PCT can generate a hydrophobic and insulating layer on the electrode surface, resulting in decrease of electron transfer and photocurrent intensity. According to the relationship between PCT concentration and photoelectric signal, the content of PCT in the unknown sample can be calculated.

2. Materials and Methods

2.1. Materials

PCT and anti-PCT were purchased from Linc-Bio Science Co., Ltd. (Shanghai, China). Indium tin oxide (ITO) glasses were obtained from Zhuhai Kaivo Electronic Components Co., Ltd. (Zhuhai, China) and cut into small pieces with a size of 2.5 × 1.0 cm2. ITO glasses were successively washed in acetone, ultrapure water, ethanol and ultrapure water under ultrasound before being used as working electrode. Other materials and instruments used are described in detail in the support materials.

2.2. Synthesis of SnO2

Flowerlike SnO2 was prepared by the reported method [35]. Briefly, 0.016 g of thioacetamide and 7 μL of anhydrous SnCl4 were added into a stainless-steel high-pressure reactor containing 10 mL of isopropanol. The mixture was ultrasonicated until completely dissolved. Then, the mixture was heated at 180 °C for 24 h and cooled naturally. Then, the products SnS2 were rinsed and dried and then calcined at 500 °C for 2 h in a muffle to obtain mesoporous SnO2.

2.3. Synthesis of BiOI

According to the literature [33], 1.0 mmol of KI was dissolved in 60 mL ultrapure water under stirring for 40 min. Then, 1.0 mmol of Bi(NO3)3·5H2O were added slowly drop by drop and treated with ultrasonic for at least 15 min. Subsequently, the mixtures were continuously stirred for about 3 h to obtain orange yellow powder. Finally, after washing and purification, the product BiOI was dried at 60 °C.

2.4. Fabrication of the PEC Immunosensor

Typically, 6 μL of SnO2 was dropped onto a piece of clean ITO and dried at room temperature. Then, 6 μL of BiOI aqueous solution with the concentration of 5 mg·mL−1 was coated on the surface of the ITO/SnO2. After being dried, the as-prepared ITO/SnO2/BiOI electrode was successively soaked 3 min for each step in 0.1 mol·L−1 AgNO3 solution in alcohol and 0.1 mol·L−1 Na2S in methanol aqueous solution (V/V = 1:1). Through this process, Ag2S was deposited on SnO2/BiOI composites by in situ growth method. Thereafter, 4 μL of thioglycolic acid (TGA) (3 mmol·L−1) was added on its surface, and then 6 μL of anti-PCT solution (1 μg·mL−1) was attached to the modified electrode. Subsequently, 4 μL of 0.1% BSA was used to block the unbound sites. At last, 6 μL of PCT solution with different concentrations was dropped onto the electrode and incubated with anti-PCT. The fabrication process of the immunosensor is shown in Figure 1.

2.5. PEC Detection of PCT

In this experiment, PEC detection was performed in PBS solution containing ascorbic acid (AA) and the light source used was LED lamp (working voltage was 36 V and operating current was 0~3.5 A). According to the relationship between the photocurrent intensity and the concentration of PCT, the quantitative PCT detection can be realized.

3. Results and Discussion

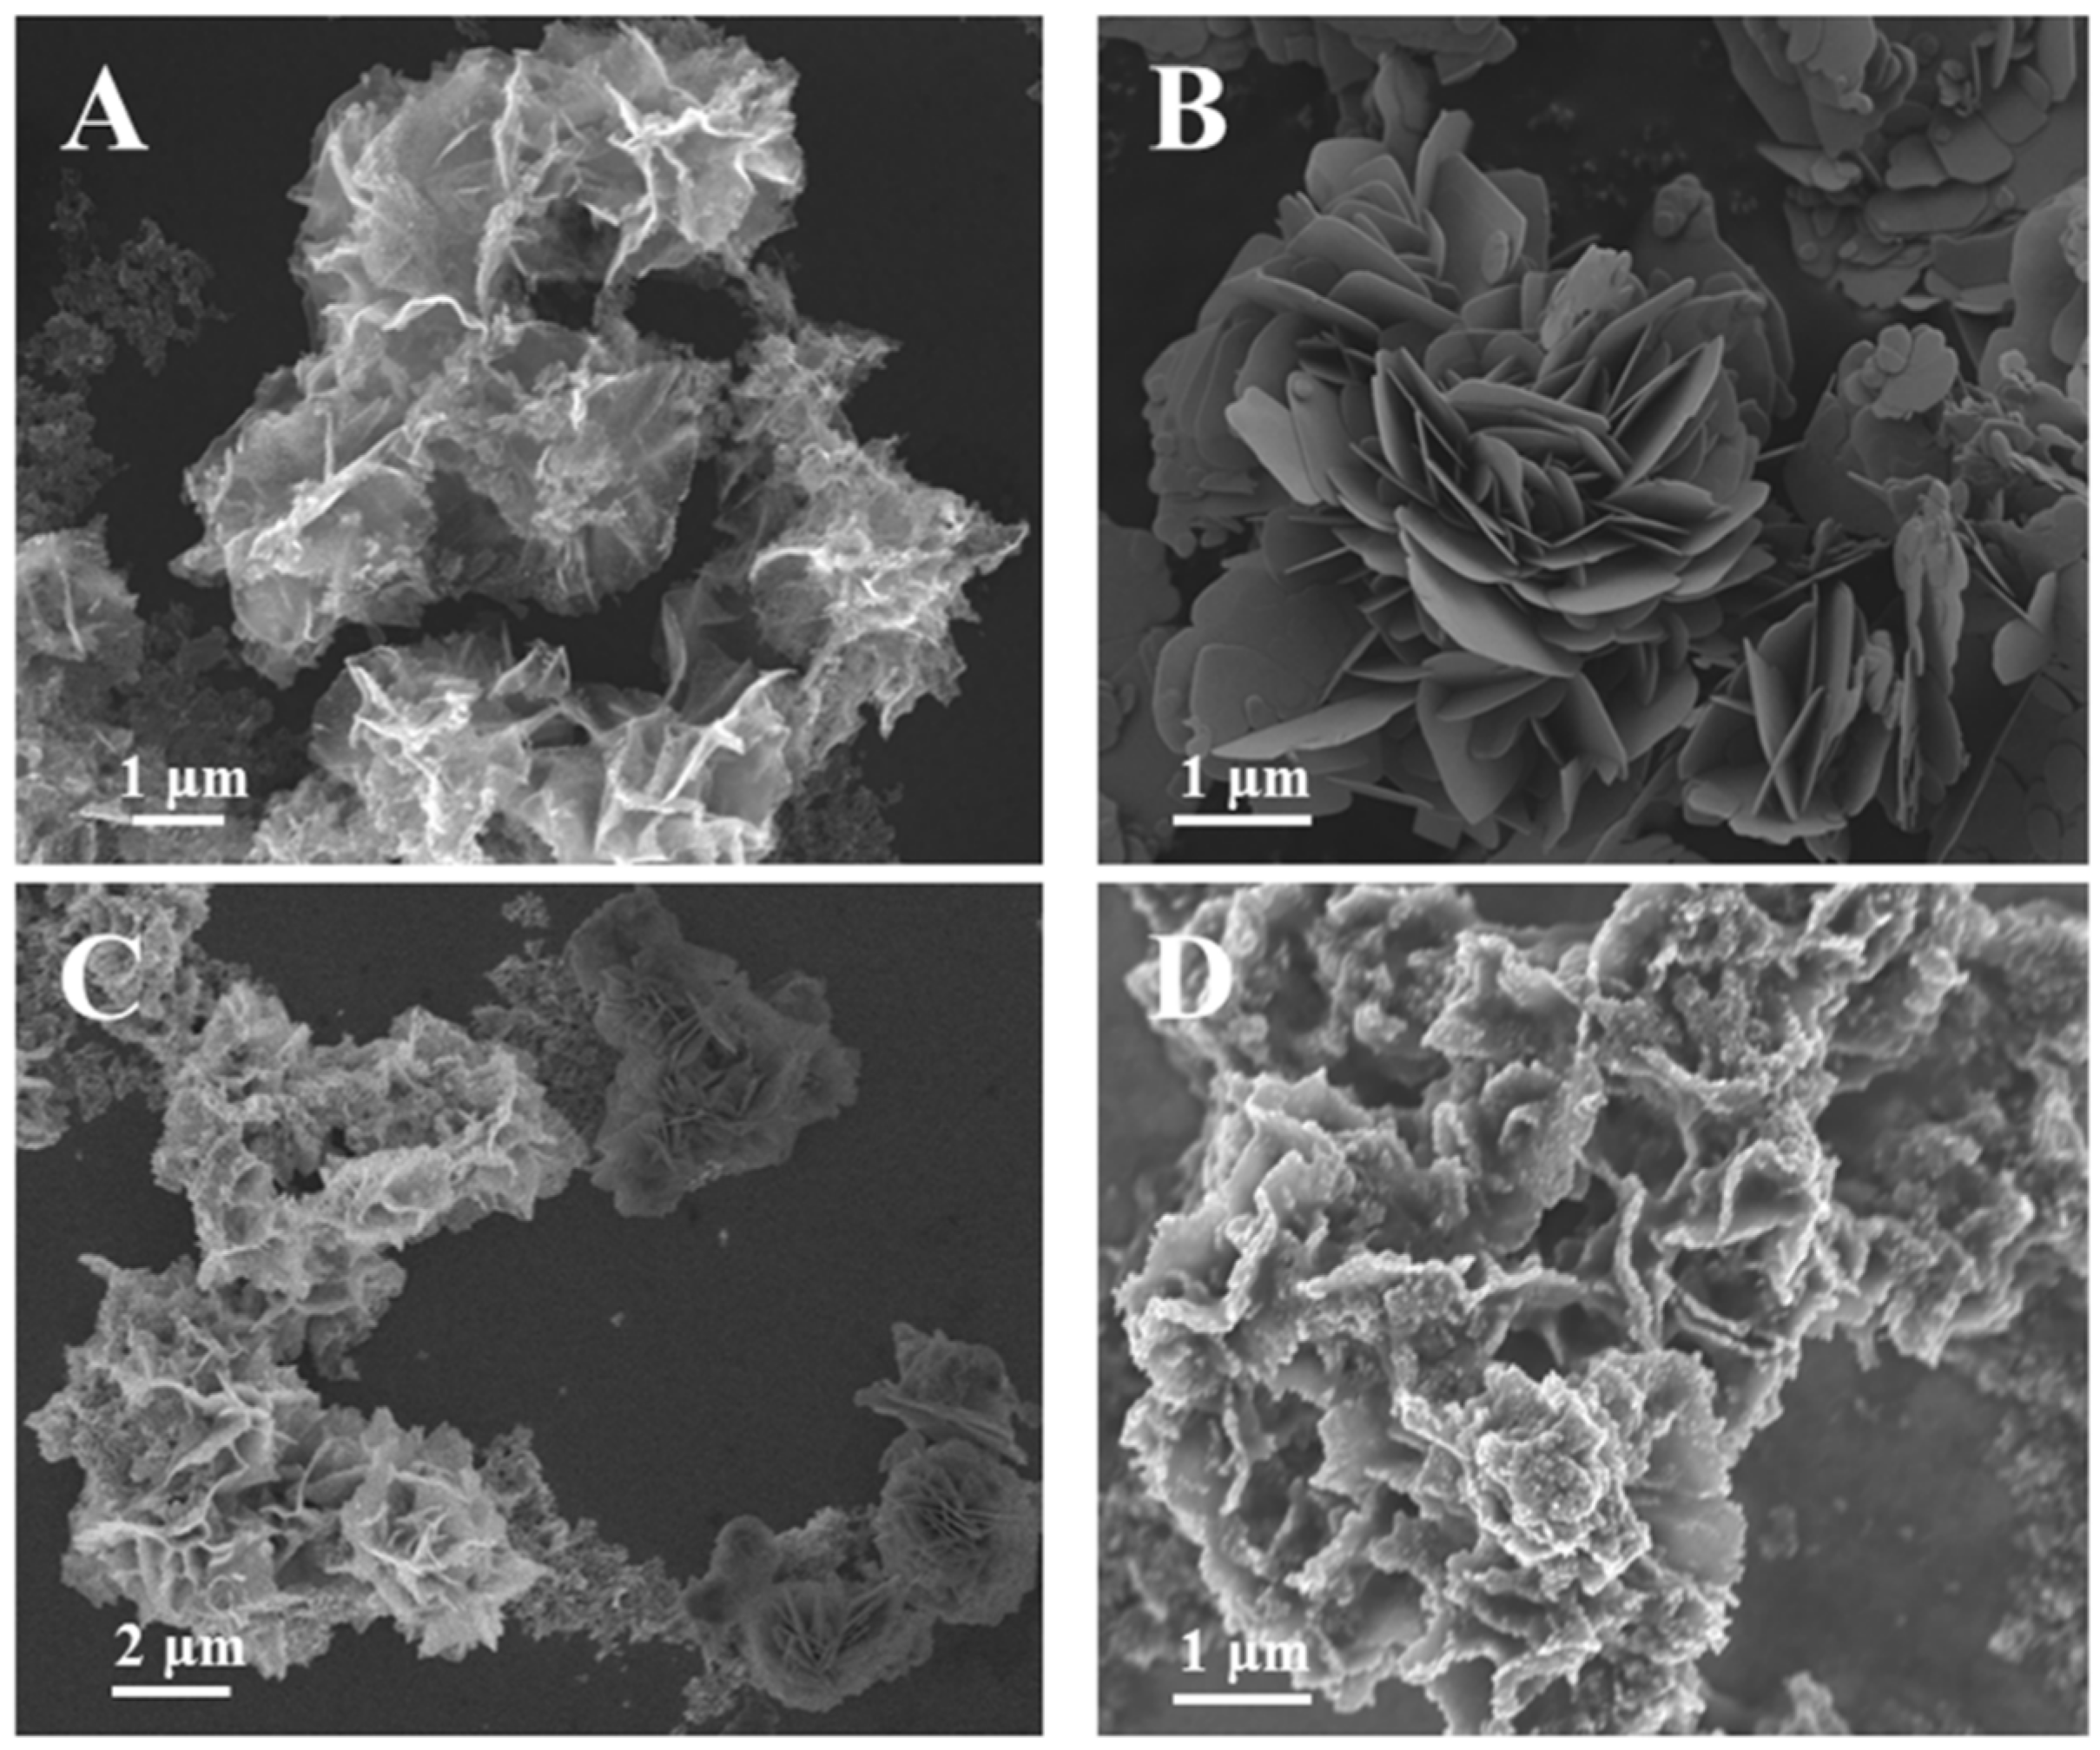
3.1. Characteristic Description of the Materials

The morphology of SnO2, BiOI, SnO2/BiOI and SnO2/BiOI/Ag2S was characterized by scanning electron microscopy (SEM). According to Figure 2A,B, it can be seen that both SnO2 and BiOI showed a flower structure composed of thin nanosheets with a size of about 2~3 μm, which could provide a large surface area for loading of more excellent performance of nanoparticles. Although both were flower-like structures, the pieces that make up the flower were not the same. In addition, in the atomic number contrast image, regions with large average atomic numbers were brighter than regions with small atomic numbers. According to the contrast of the sample with different atomic number, the morphology of the two samples can be clearly distinguished (Figure 2C). After SnO2/BiOI composites were successfully coated on the ITO electrode, Ag2S nanoparticles were uniformly deposited on its surface as sensitizer, which is shown in Figure 2D. We can see that the lamellar structure that made up the flower became thick due to the deposition of Ag2S. The element composition of the composites was measured with EDS spectrum, as shown in Figure S1. It can be seen that Sn, O, Bi, I, S and Ag elements were clearly observed, which further proved Ag2S was successfully fixed on the surface of SnO2/BiOI to obtain SnO2/BiOI/Ag2S composites. Furthermore, the EDS mapping images further confirmed the homogenous distribution.
Figure S2 shows the absorption of ultraviolet and visible light by the as-prepared SnO2, SnO2/BiOI and SnO2/BiOI/Ag2S composites. The absorption wavelength of SnO2 was less in the visible region, which was ascribed to its wide band gap. However, SnO2 could be coupled with BiOI, which resulted in the absorption peak shifting red, and the absorption peak became wider with strong absorption at 400~600 nm. Then, modification of Ag2S on the above electrode could improve the broad absorption in visible light obviously, further noticeably enhancing the photocurrent effect as expected. Observed from Figure S3, the photocurrent of SnO2/BiOI/Ag2S can be up to 93 μA, while SnO2, BiOI, SnO2/BiOI, SnO2/Ag2S, BiOI/Ag2S was 0.6 μA, 4 μA, 60 μA, 50 μA and 5 μA, respectively. Therefore, we selected SnO2/BiOI/Ag2S composites as the substrate material because of its excellent photoelectric property in this study. About the electron transfer mechanism, we suspected that SnO2, BiOI and Ag2S could form cascade band-edge levels because their energy bands were well matched (Figure 3), which promoted the separation of photogenic electrons and photogenic holes, resulting in ultrafast transfer of charge. In addition, the composite material has better light absorption in the visible region, resulting in a favorable utilization rate of solar energy.

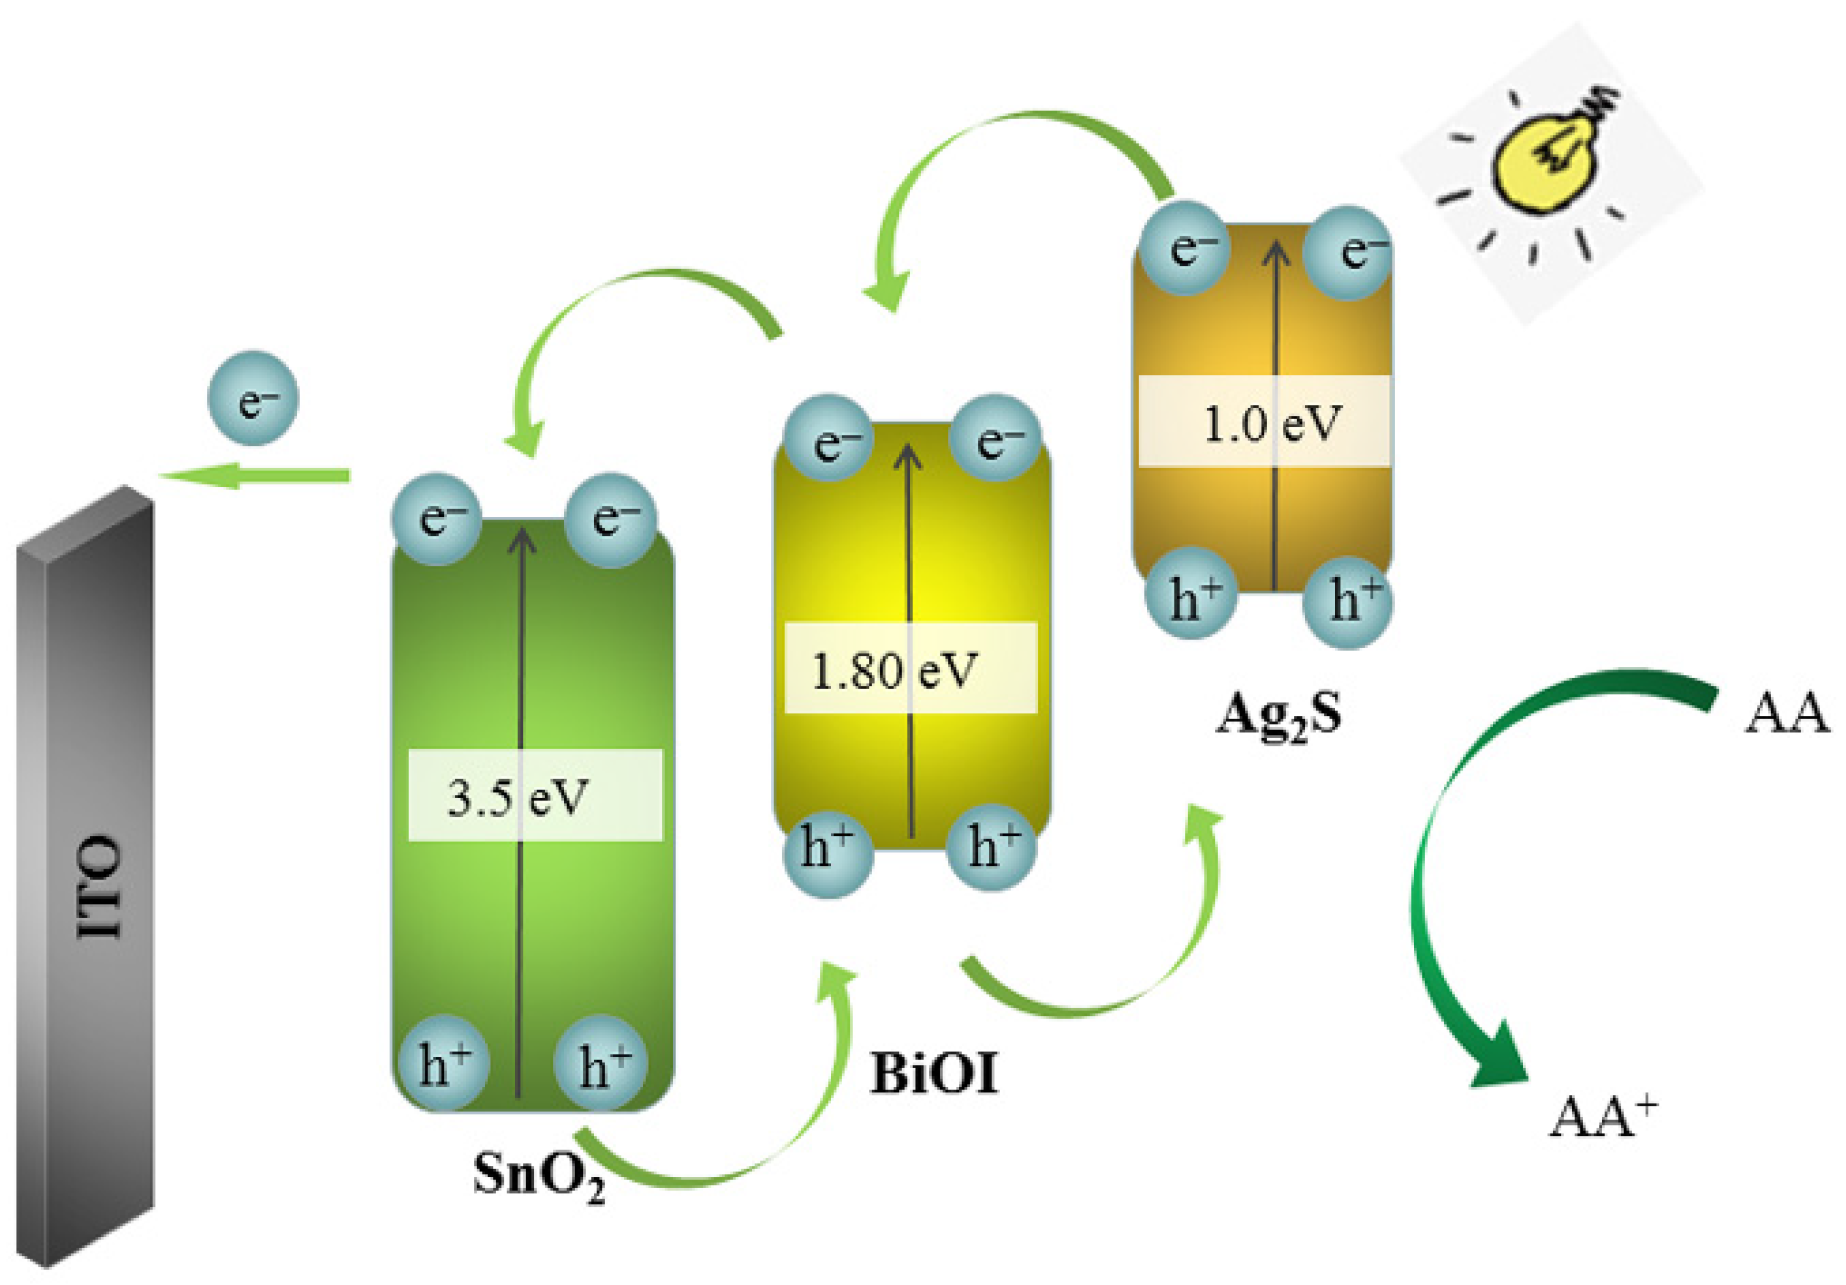
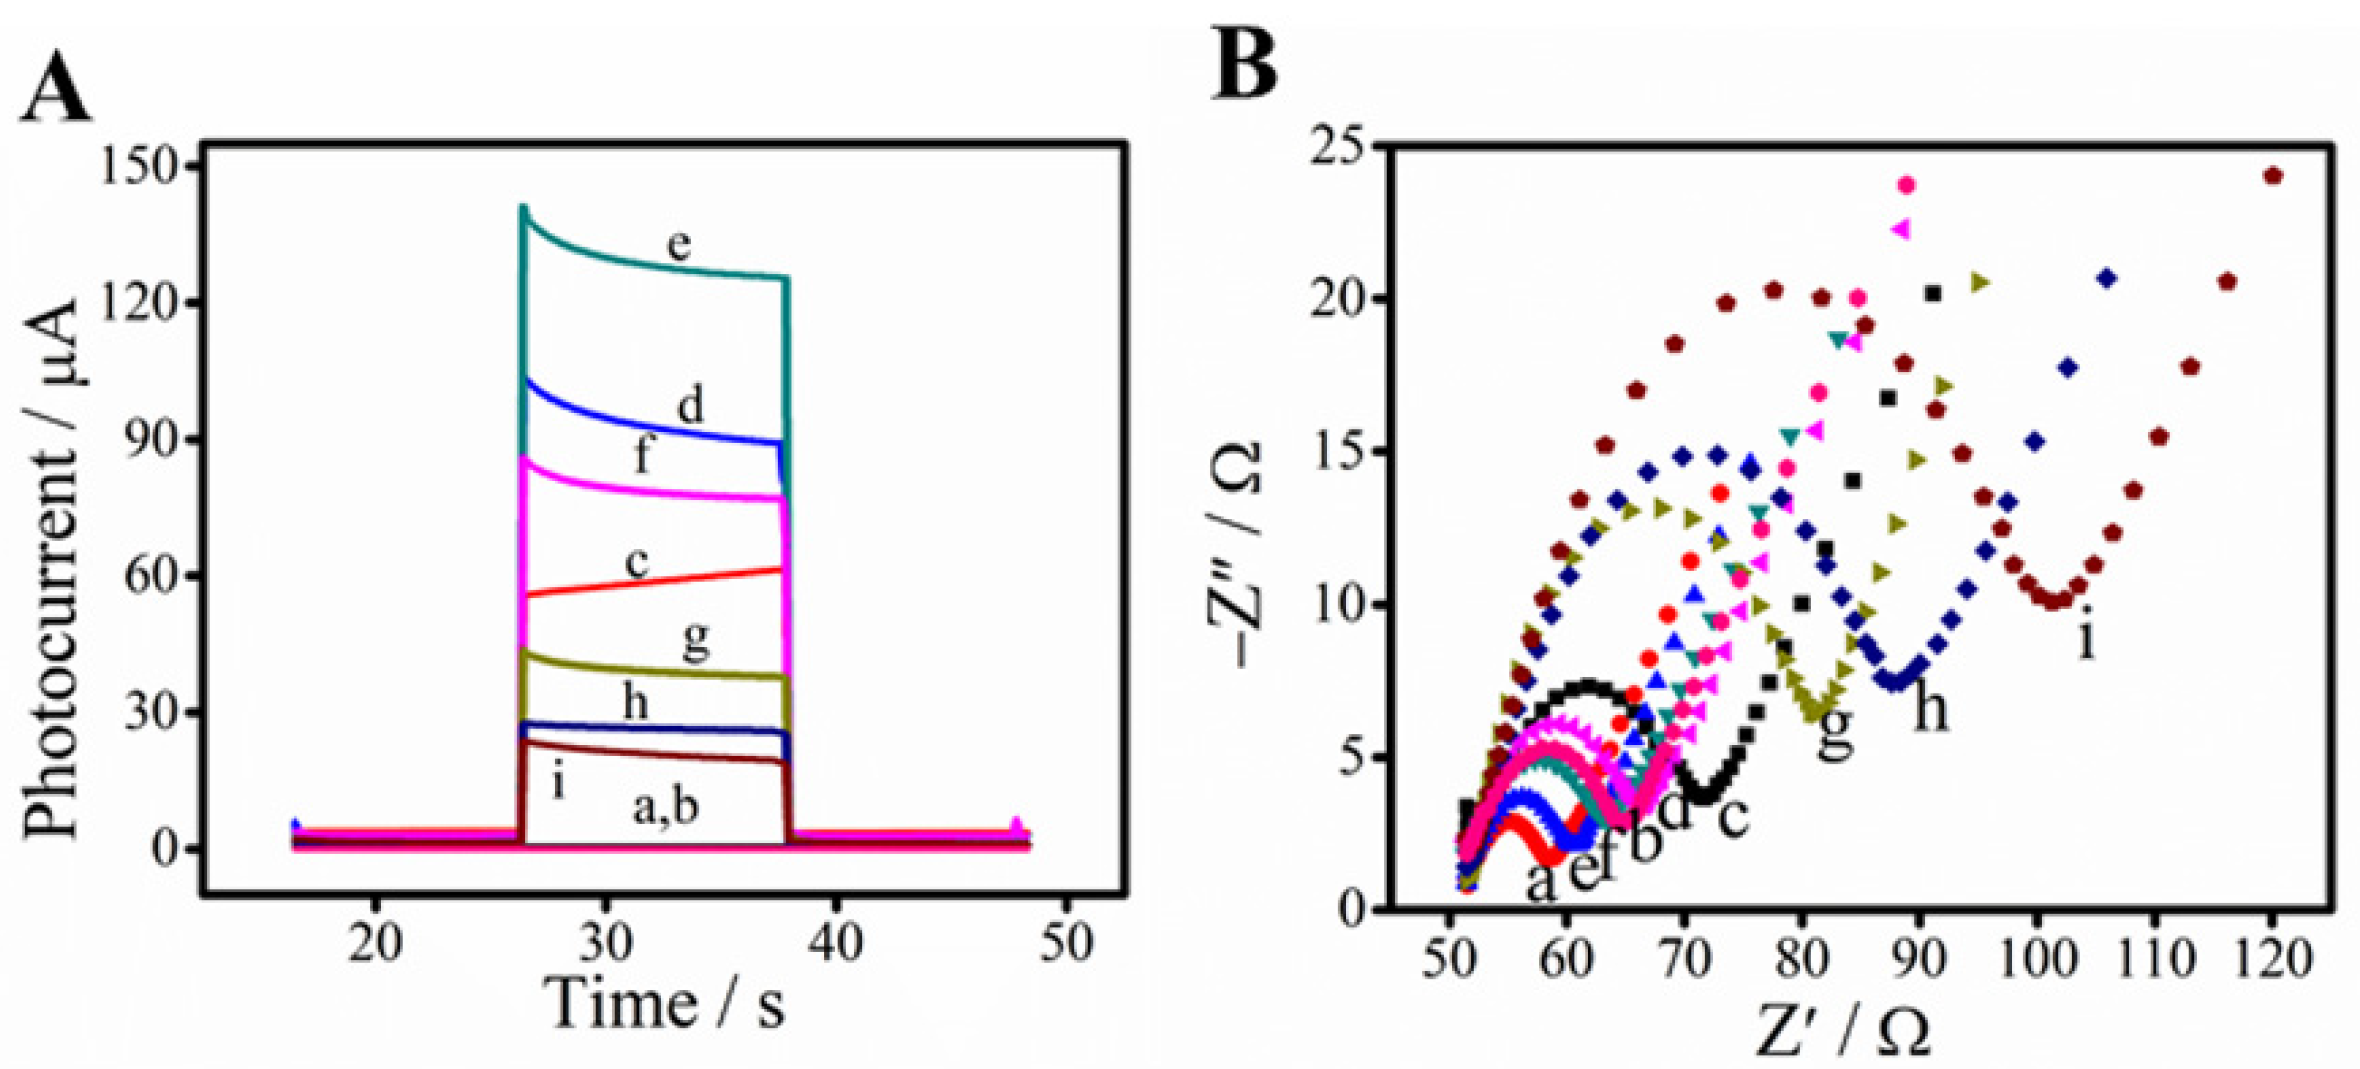
3.2. Characterization of the PEC Immunosensor

The photocurrent variation trends of the modified electrodes are shown in Figure 4A, and the enlarged view of curve a and b is shown in Figure S4. After layer-by-layer modification, the photocurrent signal generated by the SnO2/BiOI/Ag2S modified electrode was significantly increased up to 104 μA (curve d), which was much higher than that of SnO2 and SnO2/BiOI (0.6 μA of SnO2 and 60 μA of SnO2/BiOI, curve b and c). This further confirmed the successful modification of Ag2S nanocomposites on the electrode surface. After the incubation of anti-PCT (curve g) and PCT (curve i) were modified onto the electrode in sequence, the photocurrents reduced from 45 μA to 20 μA. Part of the reason is that bioactive substances such as PCT, BSA and anti-PCT were insulating. Besides this, the increase in steric hindrance would block part of electron transfer to the photoactive substrate, leading to a gradual decline of photocurrent.
Electrochemical impedance spectroscopy (EIS) was applied to further analyze the interfacial properties of the proposed immunosensor, as shown in Figure 4B. The electron-transfer resistance (Ret) value of ITO was small on account of the low electron transfer resistance (curve a). After the stepwise modification with SnO2 (curve b), BiOI (curve c), Ag2S (curve d), anti-PTC (curve g), BSA (curve h) and PCT (curve i), the Ret value changed significantly, which clearly verified the successful assembly process of the PEC immunosensor for PCT determination.

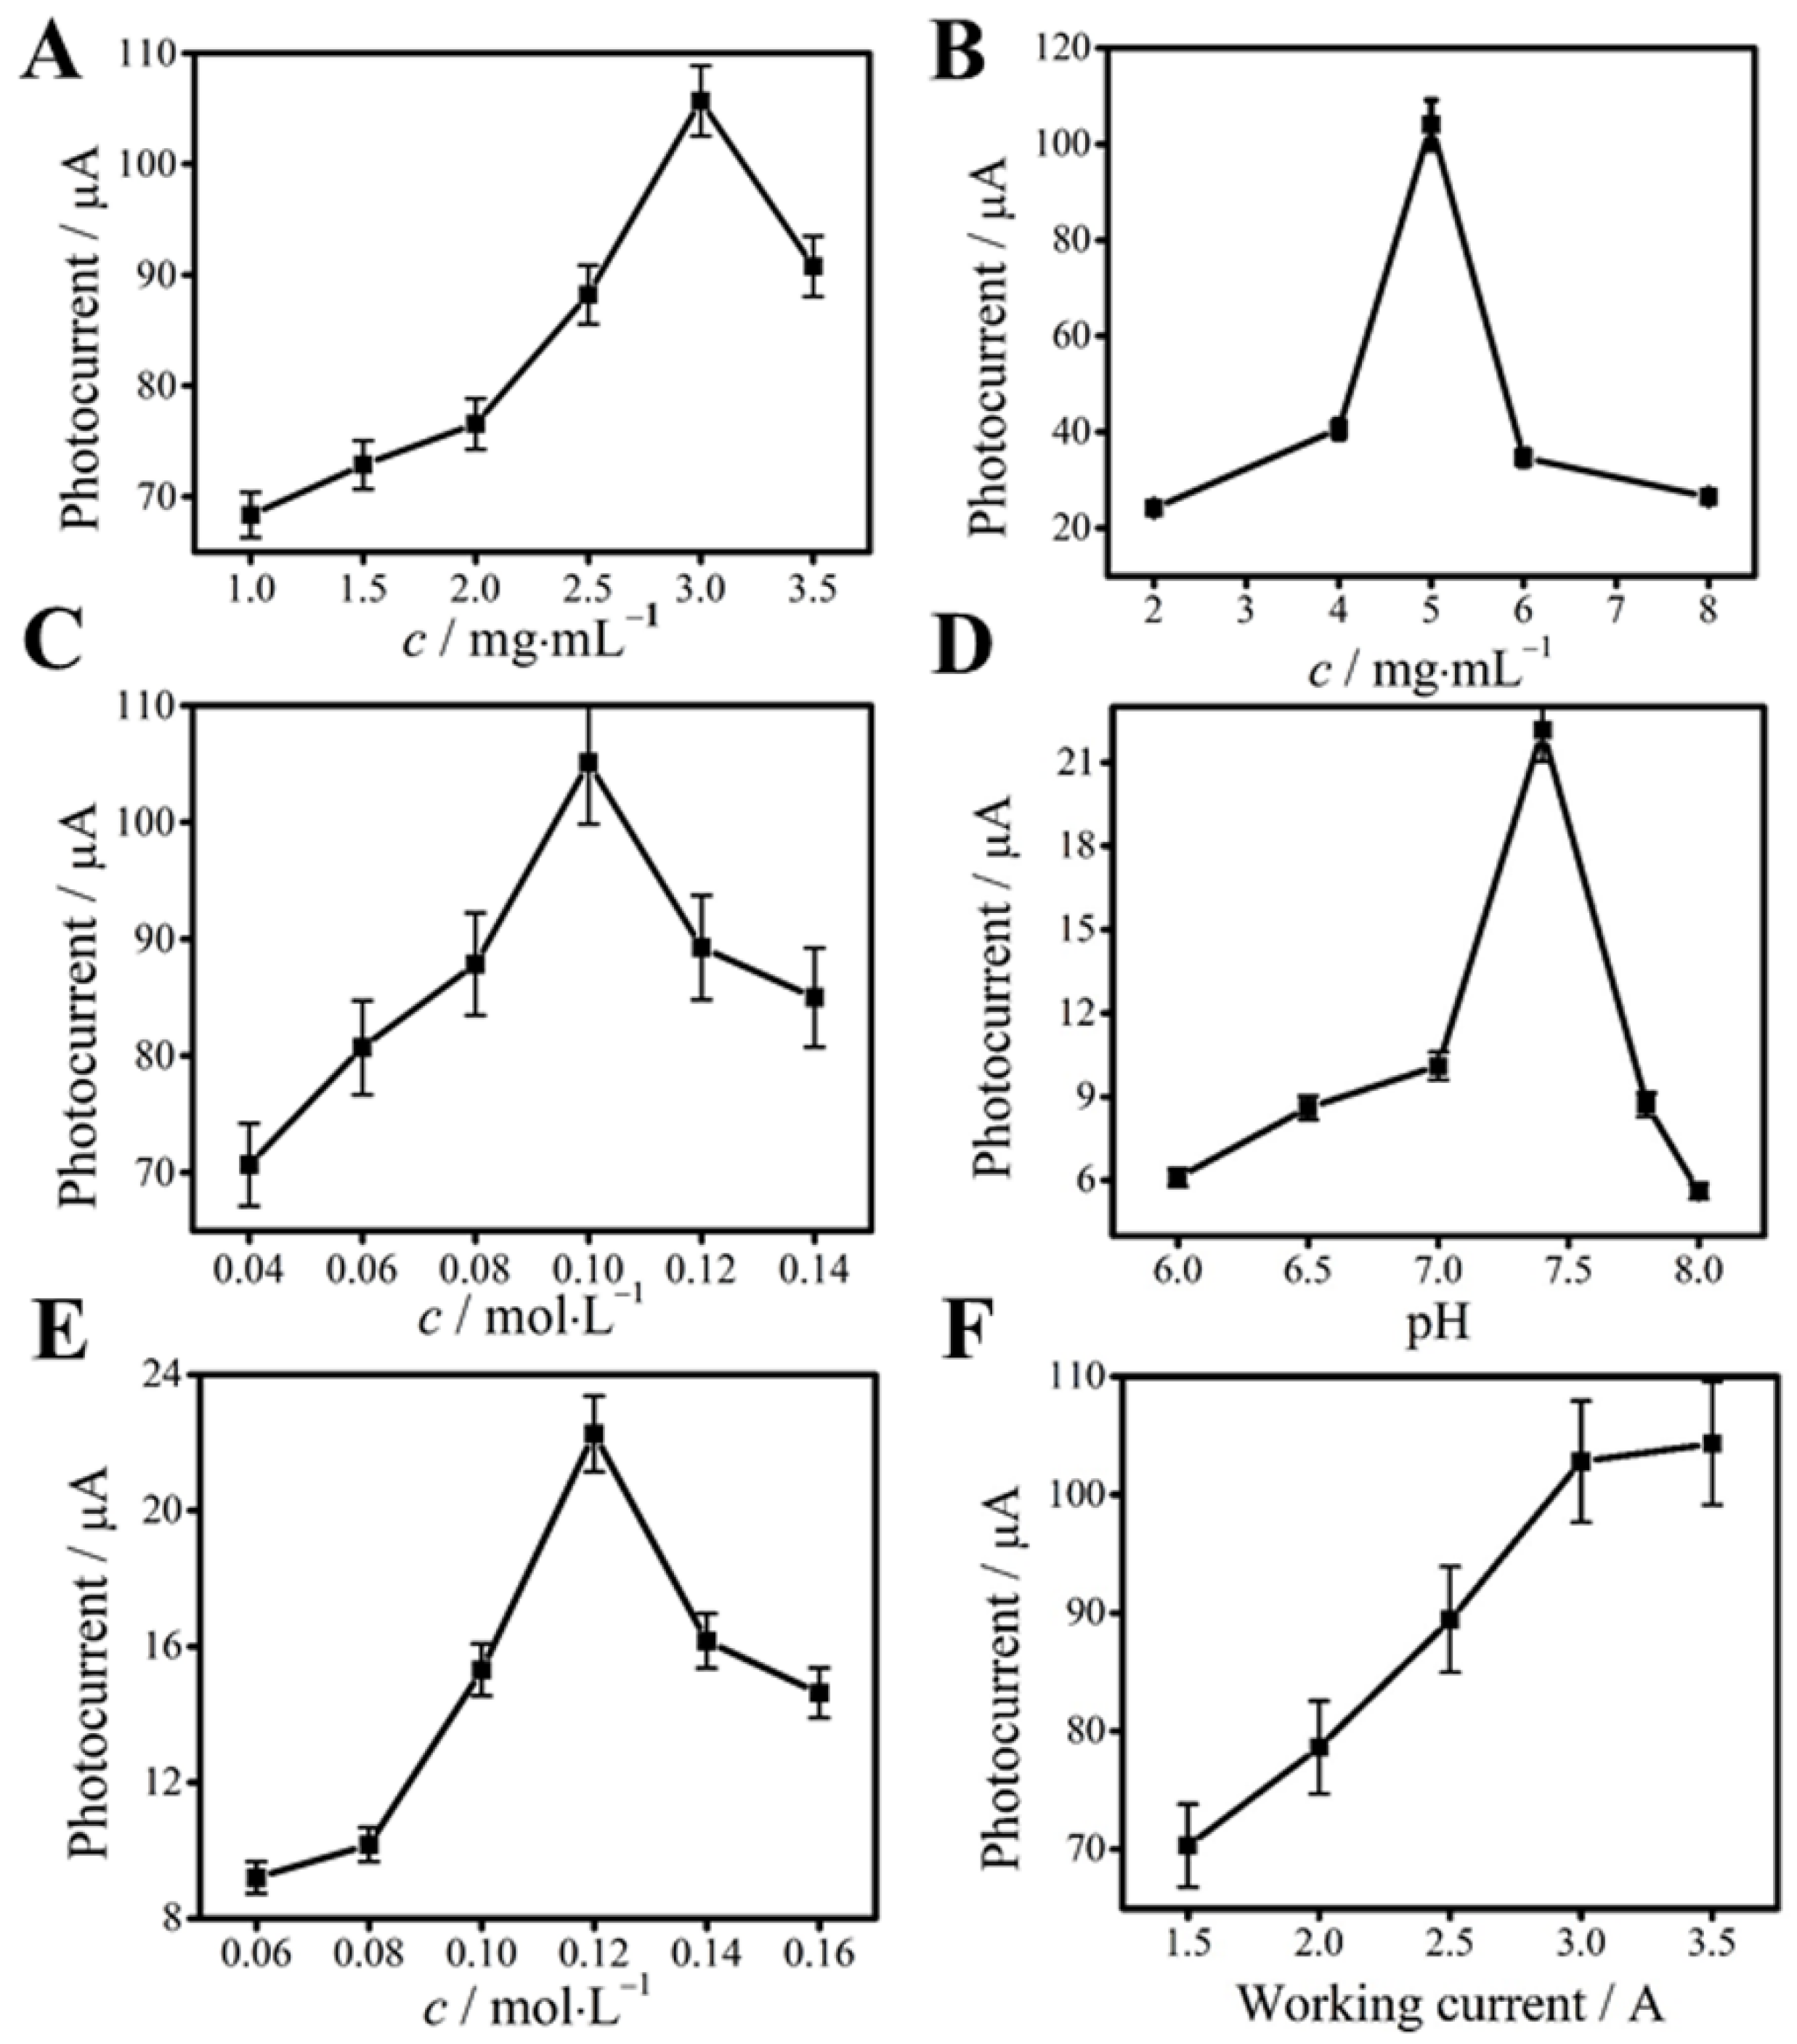
3.3. Optimal Conditions for PCT Detection
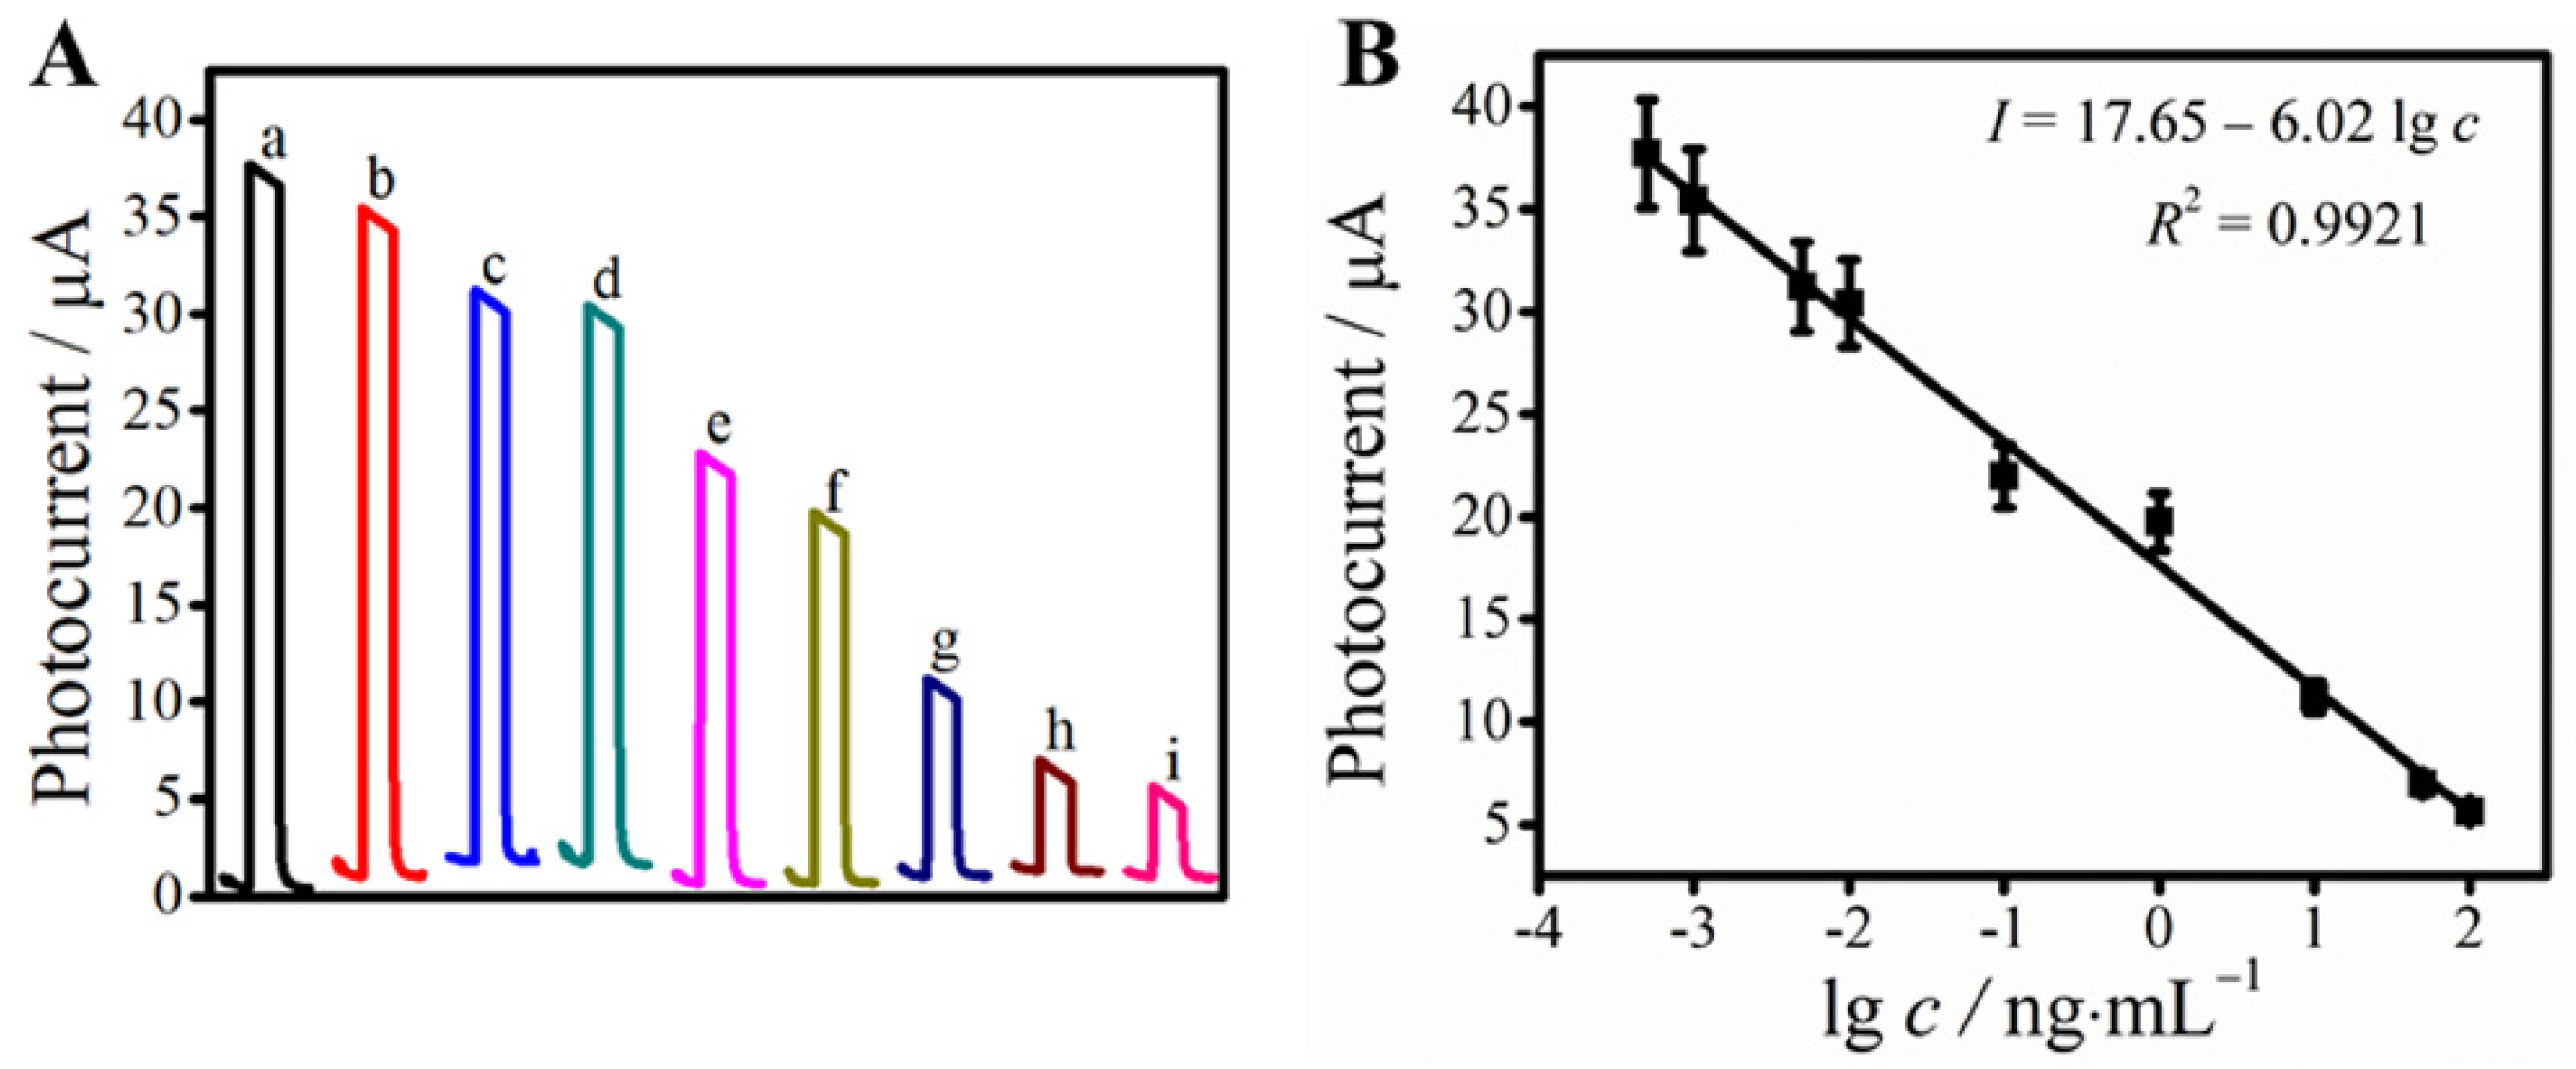
The concentration of substrate material (SnO2, BiOI and AgNO3), the pH value, the concentration of AA and the light intensity are some essential experimental influence factors. From Figure 5A, we can see that when the concentration of SnO2 was too high, it probably blocked some of the electron transport. Hence, the SnO2 concentration of 3.0 mg·mL−1 was used in this study. Similarly, the optimal concentration of BiOI and AgNO3 was 5.0 mg·mL−1 and 0.10 mol·L−1 (Figure 5B,C). As shown in Figure 5D, pH 7.4 was selected as the best concentration. At this condition, the immobilized protein had the greatest activity. According to Figure 5E, when the concentration of AA was too low, fewer holes will be captured and there will be more electron-hole complexes in the system, so the photocurrent signal was small. However, when the concentration of AA in the solution was too high, the light intensity reaching the electrode surface decreased due to the absorption of the light intensity itself, making the excitation efficiency of Ag2S decrease, thus reducing the photocurrent signal of the whole system [36]. Therefore, 0.12 mol·L−1 of AA was chosen as the appropriate concentration in this system. Last but not the least, the photocurrent intensity increased with the increasing of the light intensity and reached a platform when the working current of LED lights was 3.0 A, which was selected as the optimal light intensity current in this experiment, as shown in Figure 5F.

3.4. PCT Detection

Under the above optimal experimental conditions, the detection of PCT was realized on the change of photocurrent intensity of the substrate materials, which attributed to the immunoreactions between PCT and anti-PCT and the changes of PCT concentration. According to Figure 6A, the photocurrent density and the logarithmic values of concentration of PCT had a good linear relationship with the range from 0.50 pg·mL−1 to 100 ng·mL−1. The linear equation was I = 17.65–6.02 lg cPCT with a correlation coefficient of 0.9921 (Figure 6B). The limit of detection for PCT concentration was calculated to be 0.14 pg·mL−1 (S/N = 3). As shown in Table S1, the PEC immunosensor we constructed had a lower detection limit and a wider linear range than some other reported methods for the detection of PCT, for example, chemiluminescence immunoassay, electrochemical immunosensor, immunochromatographic assay, immunosorbent assay, time-resolved digital immunoassay and electrochemical paper-based analysis, but it was slightly inferior to electrochemiluminescence immunosensor. Compared with other existing PEC immunosensors, the as-prepared immunosensor still showed a satisfying performance in sensitivity and linear range.

3.5. Repeatability, Stability, Specificity and Application of the PEC Immunosensor

The repeatability, stability and specificity of biosensors are important indexes to measure the actual performance of biosensors.
The excellent repeatability is a prerequisite for accuracy. From Table S2, we can see that the relative standard deviation (RSD) of eleven parallel measurements was in the range of 2.2~8.4%, which demonstrated good repeatability.
The stability is critical to sensors. From Figure S5A, the photocurrent intensity was recorded with 16 light on/off cycles of incubation with 0.1 ng·mL−1 of PCT. There was no distinct change of photocurrent intensity value, indicating the prepared PEC immunosensor possessed the satisfactory stability for PCT detection.
To evaluate the specificity of the immunosensor for PCT, 100 ng·mL−1 of two typical interfering antigens, carcinoembryonic antigen (CEA) and prostatic specific antigen (PSA), were selected for interference test by mixing with 1.0 ng·mL−1 of PCT. According to Figure S5B, there was no obvious change of the photocurrent response in the case of the addition of CEA and PSA, which indicated that the satisfactory specificity.
To verify the viability of the PEC immunosensor for PCT detection in practical blood samples, the recovery experiments were carried out through adding different PCT standard solution to human serum samples. According to Table S2, we can see that the recoveries of the samples were in the range of 98.8~103%, and the RSD was in the range of 2.2~8.4%, which indicated the promising potential for the analyzation of PCT in the human blood serum samples.

4. Conclusions

In this study, based on the good photoelectric performance of SnO2/BiOI/Ag2S composites, a novel unlabeled PEC immunosensor was successfully constructed for PCT detection. The application of SnO2 in immunosensing analysis is still less, and SnO2 was a perfect substrate for PEC immunosensors due to its good stability on ITO electrode. Through construction SnO2/BiOI heterojunction, excellent photocatalytic activity and efficient sunlight-harvesting nature can be realized, and flower-like SnO2 and BiOI can provide large surface area for the loading of Ag2S and further sensitize to the photocurrent response. Under the optimal experimental detection conditions, the proposed immunosensor had a detection limit of 0.14 pg·mL−1 for PCT detection, and the linear range was 0.50 pg·mL−1~100 ng·mL−1, which showed a satisfying performance compared with some other reported methods. It is worth mentioning that SnO2/BiOI/Ag2S composites had some advantages such as convenient synthesis, low cost, excellent photoelectric performance and environmental friendliness, which have potential applications in the field of photoelectrocatalysis, photoelectric device research and so on.

Supplementary Materials

The following are available online at https://www.mdpi.com/article/10.3390/bios11110421/s1. Figure S1: The EDS mapping images of SnO2/BiOI/Ag2S composites; Figure S2: UV-Vis diffuse reflectance spectra of SnO2 (a), SnO2/BiOI (b) and SnO2/BiOI/Ag2S (c); Figure S3: Time-based photocurrent response curves of SnO2(a), BiOI(b), SnO2/BiOI(c), SnO2/Ag2S(d), BiOI/Ag2S(e) and SnO2/BiOI/Ag2S(f); Figure S4: Time-based photocurrent response curves of ITO electrode (a) and ITO/SnO2 (b); Figure S5: Stability curve of chronocurrent (A); Selectivity of the PEC immunosensor for detecting PCT (B): (a) Blank, (b) Blank + 100 ng·mL−1 CEA, (c) Blank + 100 ng·mL−1 PSA, (d) 1.0 ng·mL−1 PCT, (f) 1.0 ng·mL−1 PCT + 100 ng·mL−1 CEA, (g) 1.0 ng·mL−1 PCT + 100 ng·mL−1 PSA. The applied potential was 0 V. Error bars = SD (n = 5); Table S1: Comparison of the performance of the proposed PEC immunosensor for PCT detection and those of other reports; Table S2: The results of the PCT determination in human serum samples.

Author Contributions

Conceptualization, N.Z. and Y.W.; data curation, N.Z.; formal analysis, N.Z.; funding acquisition, N.Z., Y.W. and Q.W.; methodology, J.F. and X.D.; project administration, Y.W., D.Z. and Q.W.; supervision, Y.W. and D.Z.; visualization, G.Z.; writing—original draft preparation, N.Z.; writing—review and editing, Y.W. All authors have read and agreed to the published version of the manuscript.

Funding

This study was supported by the National Key Scientific Instrument and Equipment Development Project of China (No. 21627809), the National Natural Science Foundation of China (No. 21777056 and 22006080), the Shandong Provincial Natural Science Foundation (No. ZR2020QB097 and ZR2020QB094), the Special Foundation for Taishan Scholar Professorship of Shandong Province, the Jinan Scientific Research Leader Workshop Project (No. 2018GXRC021 and 2018GXRC024) and the Innovation Team Project of Colleges and Universities in Jinan (No. 2019GXRC027).

Data Availability Statement

The data presented in this study are available on request from the corresponding author.

Conflicts of Interest

The authors declare no conflict of interest.

References

  1. Liu, P.; Li, C.; Zhang, R.; Tang, Q.; Wei, J.; Lu, Y.; Shen, P. An ultrasensitive electrochemical immunosensor for procalcitonin detection based on the gold nanoparticles-enhanced tyramide signal amplification strategy. Biosens. Bioelectron. 2019, 126, 543–550. [Google Scholar] [CrossRef]
  2. Schuetz, P.; Wirz, Y.; Mueller, B. Procalcitonin testing to guide antibiotic therapy in acute upper and lower respiratory tract infections. JAMA 2018, 319, 925–926. [Google Scholar] [CrossRef] [PubMed]
  3. Miao, J.; Du, K.; Li, X.; Xu, X.; Dong, X.; Fang, J.; Cao, W.; Wei, Q. Ratiometric electrochemical immunosensor for the detection of procalcitonin based on the ratios of SiO2-Fc-COOH-Au and UiO-66-TB complexes. Biosens. Bioelectron. 2021, 171, 112713. [Google Scholar] [CrossRef]
  4. Tang, B.M.; Eslick, G.D.; Craig, J.C.; McLean, A.S. Accuracy of procalcitonin for sepsis diagnosis in critically ill patients: Systematic review and meta-analysis. Lancet. Infect. Dis. 2007, 7, 210–217. [Google Scholar] [CrossRef]
  5. Yu, Y.; Li, X.-X.; Jiang, L.-X.; Du, M.; Liu, Z.-G.; Cen, Z.-R.; Wang, H.; Guo, Z.-H.; Chang, P. Procalcitonin levels in patients with positive blood culture, positive body fluid culture, sepsis, and severe sepsis: A cross-sectional study. Infect. Dis. 2015, 48, 63–69. [Google Scholar] [CrossRef] [PubMed]
  6. Schuetz, P.; Daniels, L.B.; Kulkarni, P.; Anker, S.D.; Mueller, B. Procalcitonin: A new biomarker for the cardiologist. Int. J. Cardiol. 2016, 223, 390–397. [Google Scholar] [CrossRef]
  7. Hu, R.; Han, C.; Pei, S.; Yin, M.; Chen, X. Procalcitonin levels in COVID-19 patients. Int. J. Antimicrob. Agents 2020, 56, 106051. [Google Scholar] [CrossRef]
  8. Drewett, G.P.; Smibert, O.C.; Holmes, N.E.; Trubiano, J.A. The use of procalcitonin as an antimicrobial stewardship tool and a predictor of disease severity in coronavirus disease 2019 (COVID-19). Infect. Cont. Hosp. Ep. 2021, 1–3. [Google Scholar] [CrossRef]
  9. Rieger, M.; Kochleus, C.; Teschner, D.; Rascher, D.; Barton, A.K.; Geerlof, A.; Kremmer, E.; Schmid, M.; Hartmann, A.; Gehlen, H. A new ELISA for the quantification of equine procalcitonin in plasma as potential inflammation biomarker in horses. Anal. Bioanal. Chem. 2014, 406, 5507–5512. [Google Scholar] [CrossRef]
  10. Wang, G.; Wan, Y.; Lin, G.; Li, Z.; Dong, Z.; Liu, T. Development of a novel chemiluminescence immunoassay for the detection of procalcitonin. J. Immunol. Methods 2020, 484–485, 112829. [Google Scholar] [CrossRef] [PubMed]
  11. Chen, P.; Qiao, X.; Liu, J.; Xia, F.; Tian, D.; Zhou, C. A dual-signals response electrochemiluminescence immunosensor based on PTC-DEPA/KCC-1 NCs for detection of procalcitonin. Sens. Actuators B Chem. 2018, 267, 525–532. [Google Scholar] [CrossRef]
  12. Ding, H.; Yang, L.; Jia, H.; Fan, D.; Zhang, Y.; Sun, X.; Wei, Q.; Ju, H. Label-free electrochemical immunosensor with palladium nanoparticles functionalized MoS2/NiCo heterostructures for sensitive procalcitonin detection. Sens. Actuators B Chem. 2020, 312, 127980. [Google Scholar] [CrossRef]
  13. Feng, Y.-G.; Wang, X.-Y.; Wang, Z.-W.; Wang, A.-J.; Mei, L.-P.; Luo, X.; Feng, J.-J. A label-free electrochemical immunosensor based on encapsulated signal molecules in mesoporous silica-coated gold nanorods for ultrasensitive assay of procalcitonin. Bioelectrochemistry 2021, 140, 107753. [Google Scholar] [CrossRef]
  14. Liu, J.; Quan, L.; Yu, X.; Wang, L. Quantitative detection of procalcitonin using an electrochemical immunosensor based on MoO3/Au@rGO nanocomposites. Analyst 2019, 144, 6968–6974. [Google Scholar] [CrossRef]
  15. Yang, R.; Wang, J.; Gao, Y. Advances of microfluidic technologies applied in diagnosis and treatment of sepsis. Zhongguo Wei Zhong Bing Ji Jiu Yi Xue 2019, 31, 789–792. [Google Scholar]
  16. Li, H.; Huang, Z.; Lin, B.; Chen, X.; Xiong, X.; Cao, A.; Yang, C. Simultaneous detection of fungal (1,3)-β-d-glucan and procalcitonin using a dual-label time-resolved fluorescence immunoassay. Biotechnol. Appl. Biochem. 2020, 68, 157–164. [Google Scholar] [CrossRef] [PubMed]
  17. Serebrennikova, K.; Samsonova, J.; Osipov, A. Hierarchical Nanogold Labels to Improve the Sensitivity of Lateral Flow Immunoassay. Nano-Micro Lett. 2017, 10, 24. [Google Scholar] [CrossRef] [Green Version]
  18. Vashist, S.K.; Schneider, E.M.; Barth, E.; Luong, J.H. Surface plasmon resonance-based immunoassay for procalcitonin. Anal. Chim. Acta 2016, 938, 129–136. [Google Scholar] [CrossRef] [PubMed]
  19. Feng, J.; Li, F.; Liu, L.; Liu, X.; Qian, Y.; Ren, X.; Wang, X.; Wei, Q. Ultrasensitive photoelectrochemical immunosensor for procalcitonin detection with porous nanoarray BiVO4/CuxS platform as advanced signal amplification under anodic bias. Sens. Actuators B Chem. 2020, 308, 127685. [Google Scholar] [CrossRef]
  20. Bao, C.; Fan, D.; Liu, X.; Wang, X.; Wu, D.; Ma, H.; Hu, L.; Wang, H.; Sun, X.; Wei, Q. A signal-off type photoelectrochemical immunosensor for the ultrasensitive detection of procalcitonin: Ru(bpy)32+ and Bi2S3 co-sensitized ZnTiO3/TiO2 polyhedra as matrix and dual inhibition by SiO2/PDA-Au. Biosens. Bioelectron. 2019, 142, 111513. [Google Scholar] [CrossRef]
  21. Ding, Q.; Zhu, M.; Deng, H.; Yuan, R.; Yuan, Y. A novel self-enhanced carbon nitride platform coupled with highly effective dual-recycle strand displacement amplifying strategy for sensitive photoelectrochemical assay. Biosens. Bioelectron. 2021, 184, 113227. [Google Scholar] [CrossRef]
  22. Li, F.; Benetti, D.; Zhang, M.; Feng, J.; Wei, Q.; Rosei, F. Modulating the 0D/2D Interface of Hybrid Semiconductors for Enhanced Photoelectrochemical Performances. Small Methods 2021, 5, 2100109. [Google Scholar] [CrossRef]
  23. Han, H.; Kment, S.; Karlicky, F.; Wang, L.; Naldoni, A.; Schmuki, P.; Zboril, R. Sb-Doped SnO2 nanorods underlayer effect to the α-Fe2O3 nanorods sheathed with TiO2 for Enhanced. Small 2018, 14, 1703860. [Google Scholar] [CrossRef] [PubMed]
  24. Nguyen, T.P.; Kim, I.T. Self-Assembled Few-Layered MoS2 on SnO2 Anode for Enhancing Lithium-Ion Storage. Nanomaterials 2020, 10, 2558. [Google Scholar] [CrossRef]
  25. Yan, S.; Liang, X.; Song, H.; Ma, S.; Lu, Y. Synthesis of porous CeO2-SnO2 nanosheets gas sensors with enhanced sensitivity. Ceram. Int. 2018, 44, 358–363. [Google Scholar] [CrossRef]
  26. Praus, P.; Svoboda, L.; Dvorský, R.; Reli, M. Nanocomposites of SnO2 and g-C3N4: Preparation, characterization and photocatalysis under visible LED irradiation. Ceram. Int. 2018, 44, 3837–3846. [Google Scholar] [CrossRef]
  27. Huang, H.; Ju, X.; Li, H.; Qu, B.; Wang, T. Construction of complex WO3-SnO2 hollow nanospheres as a highperformance anode for lithium-ion batteries. J. Alloys Compd. 2018, 744, 375–380. [Google Scholar] [CrossRef]
  28. Li, R.; Luan, Q.; Dong, C.; Dong, W.; Tang, W.; Wang, G.; Lu, Y. Light-facilitated structure reconstruction on self-optimized photocatalyst TiO2@BiOCl for selectively efficient conversion of CO2 to CH4. Appl. Catal. B Environ. 2021, 286, 119832. [Google Scholar] [CrossRef]
  29. Hu, X.; Wang, G.; Wang, J.; Hu, Z.; Su, Y. Step-scheme NiO/BiOI heterojunction photocatalyst for rhodamine pho-todegradation. Appl. Surf. Sci. 2020, 511, 145499. [Google Scholar] [CrossRef]
  30. Zhong, S.; Wang, B.; Zhou, H.; Li, C.; Peng, X.; Zhang, S. Fabrication and characterization of Ag/BiOI/GO composites with enhanced photocatalytic activity. J. Alloys Compd. 2019, 806, 401–409. [Google Scholar] [CrossRef]
  31. Arumugam, M.; Choi, M.Y. Recent progress on bismuth oxyiodide (BiOI) photocatalyst for environmental remediation. J. Ind. Eng. Chem. 2020, 81, 237–268. [Google Scholar] [CrossRef]
  32. Fan, L.; Liang, G.; Zhang, C.; Fan, L.; Yan, W.; Guo, Y.; Shuang, S.; Bi, Y.; Li, F.; Dong, C. Visible-light-driven photoelectrochemical sensing platform based on BiOI nanoflowers/TiO2 nanotubes for detection of atrazine in environmental samples. J. Hazard. Mater. 2021, 409, 124894. [Google Scholar] [CrossRef] [PubMed]
  33. Han, Q.; Wang, R.; Xing, B.; Zhang, T.; Khan, M.S.; Wu, D.; Wei, Q. Label-free photoelectrochemical immunoassay for CEA detection based on CdS sensitized WO3@BiOI heterostructure nanocomposite. Biosens. Bioelectron. 2018, 99, 493–499. [Google Scholar] [CrossRef] [PubMed]
  34. Bao, C.; Wang, C.; Fan, D.; Ma, H.; Hu, L.; Fan, Y.; Wei, Q. A novel sandwich-type photoelectrochemical sensor for SCCA detection based on Ag2S-sensitized BiOI matrix and AucorePdshell nanoflower label for signal amplification. New J. Chem. 2018, 42, 15762–15769. [Google Scholar] [CrossRef]
  35. Li, F.; Chen, L.; Knowles, G.; Macfarlane, D.R.; Zhang, J. Hierarchical mesoporous SnO2 Nanosheets on carbon cloth: A robust and flexible electrocatalyst for CO2 reduction with high efficiency and selectivity. Angew. Chem. Int. Ed. 2017, 56, 505–509. [Google Scholar] [CrossRef]
  36. Wang, Y.; Fan, D.; Zhao, G.; Feng, J.; Wei, D.; Zhang, N.; Cao, W.; Du, B.; Wei, Q. Ultrasensitive photoelectrochemical immunosensor for the detection of amyloid β-protein based on SnO2/SnS2/Ag2S nanocomposites. Biosens. Bioelectron. 2018, 120, 1–7. [Google Scholar] [CrossRef]
Figure 1. Illustration of the fabrication of immunosensor for detection of PCT.
Biosensors 11 00421 g001
Figure 2. SEM images of SnO2 (A), BiOI (B), SnO2/BiOI (C), SnO2/BiOI/Ag2S (D).
Biosensors 11 00421 g002
Figure 3. The possible photogenerated electron-hole transfer mechanism of the immunosensor.
Biosensors 11 00421 g003
Figure 4. Photocurrent responses (A) and Nyquist plots of EIS (B). Different lines represent different materials to modify the electrode surface layer by layer: ITO electrode (a), after SnO2 modified (b), after BiOI modified (c), after Ag2S deposited (d), after carboxylation of TGA (e), after drops of EDC/NHS (f), after anti-PCT immobilization (g), after BSA blocking (h), after incubation with 0.1 ng·mL−1 of PCT (i).
Biosensors 11 00421 g004
Figure 5. Optimal of concentration of SnO2 (A), BiOI (B), AgNO3 (C) and AA (E); pH value (D); intensity of the light source (F). Error bar = SD (n = 5).
Biosensors 11 00421 g005
Figure 6. Photocurrent intensity of the immunosensor (A) and logarithmic calibration curve (B) of the PEC immunosensor at different PCT concentrations. The concentrations of PCT were 0.0005 (a), 0.001 (b), 0.005 (c), 0.01 (d), 0.1 (e), 1 (f), 10 (g), 50 (h), 100 (i) ng·mL−1; Error bars = SD (n = 5).
Biosensors 11 00421 g006
Publisher’s Note: MDPI stays neutral with regard to jurisdictional claims in published maps and institutional affiliations.

