
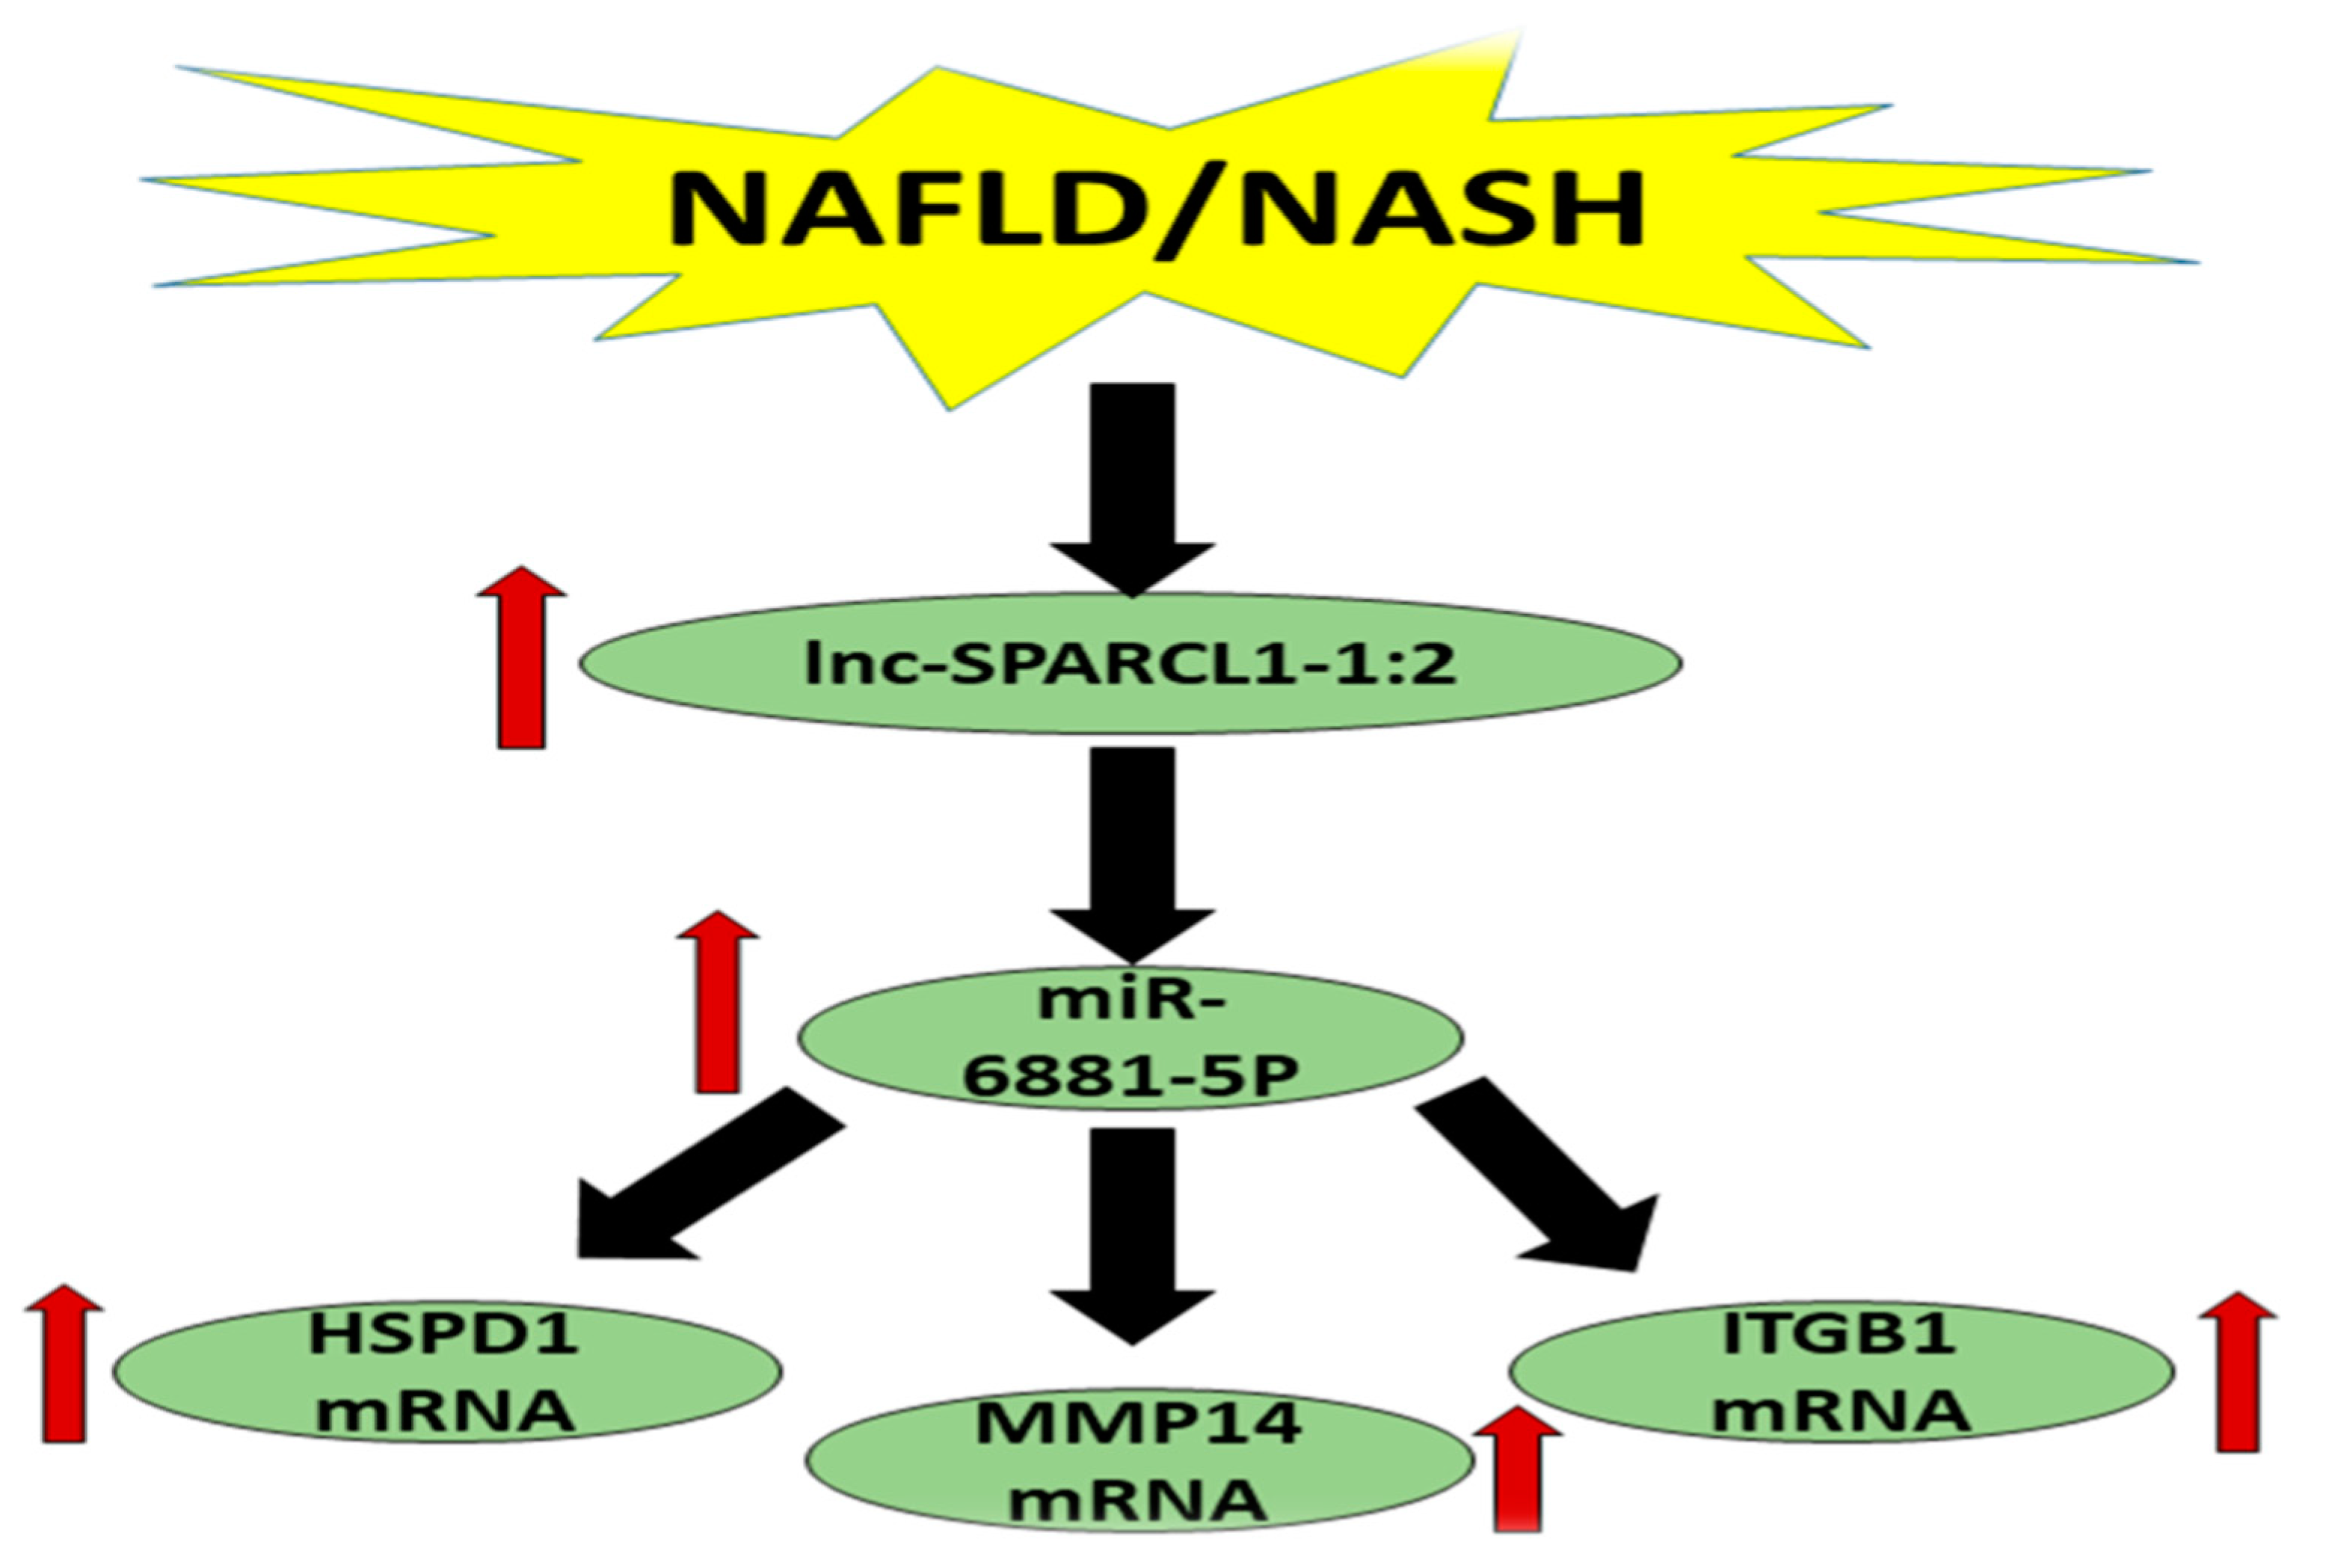
Clinical Significance of HSPD1/MMP14/ITGB1/miR-6881-5P/Lnc-SPARCL1-1:2 RNA Panel in NAFLD/NASH Diagnosis: Egyptian Pilot Study

 , ,
, ,
Abstract
:1. Introduction
2. Materials and Methods
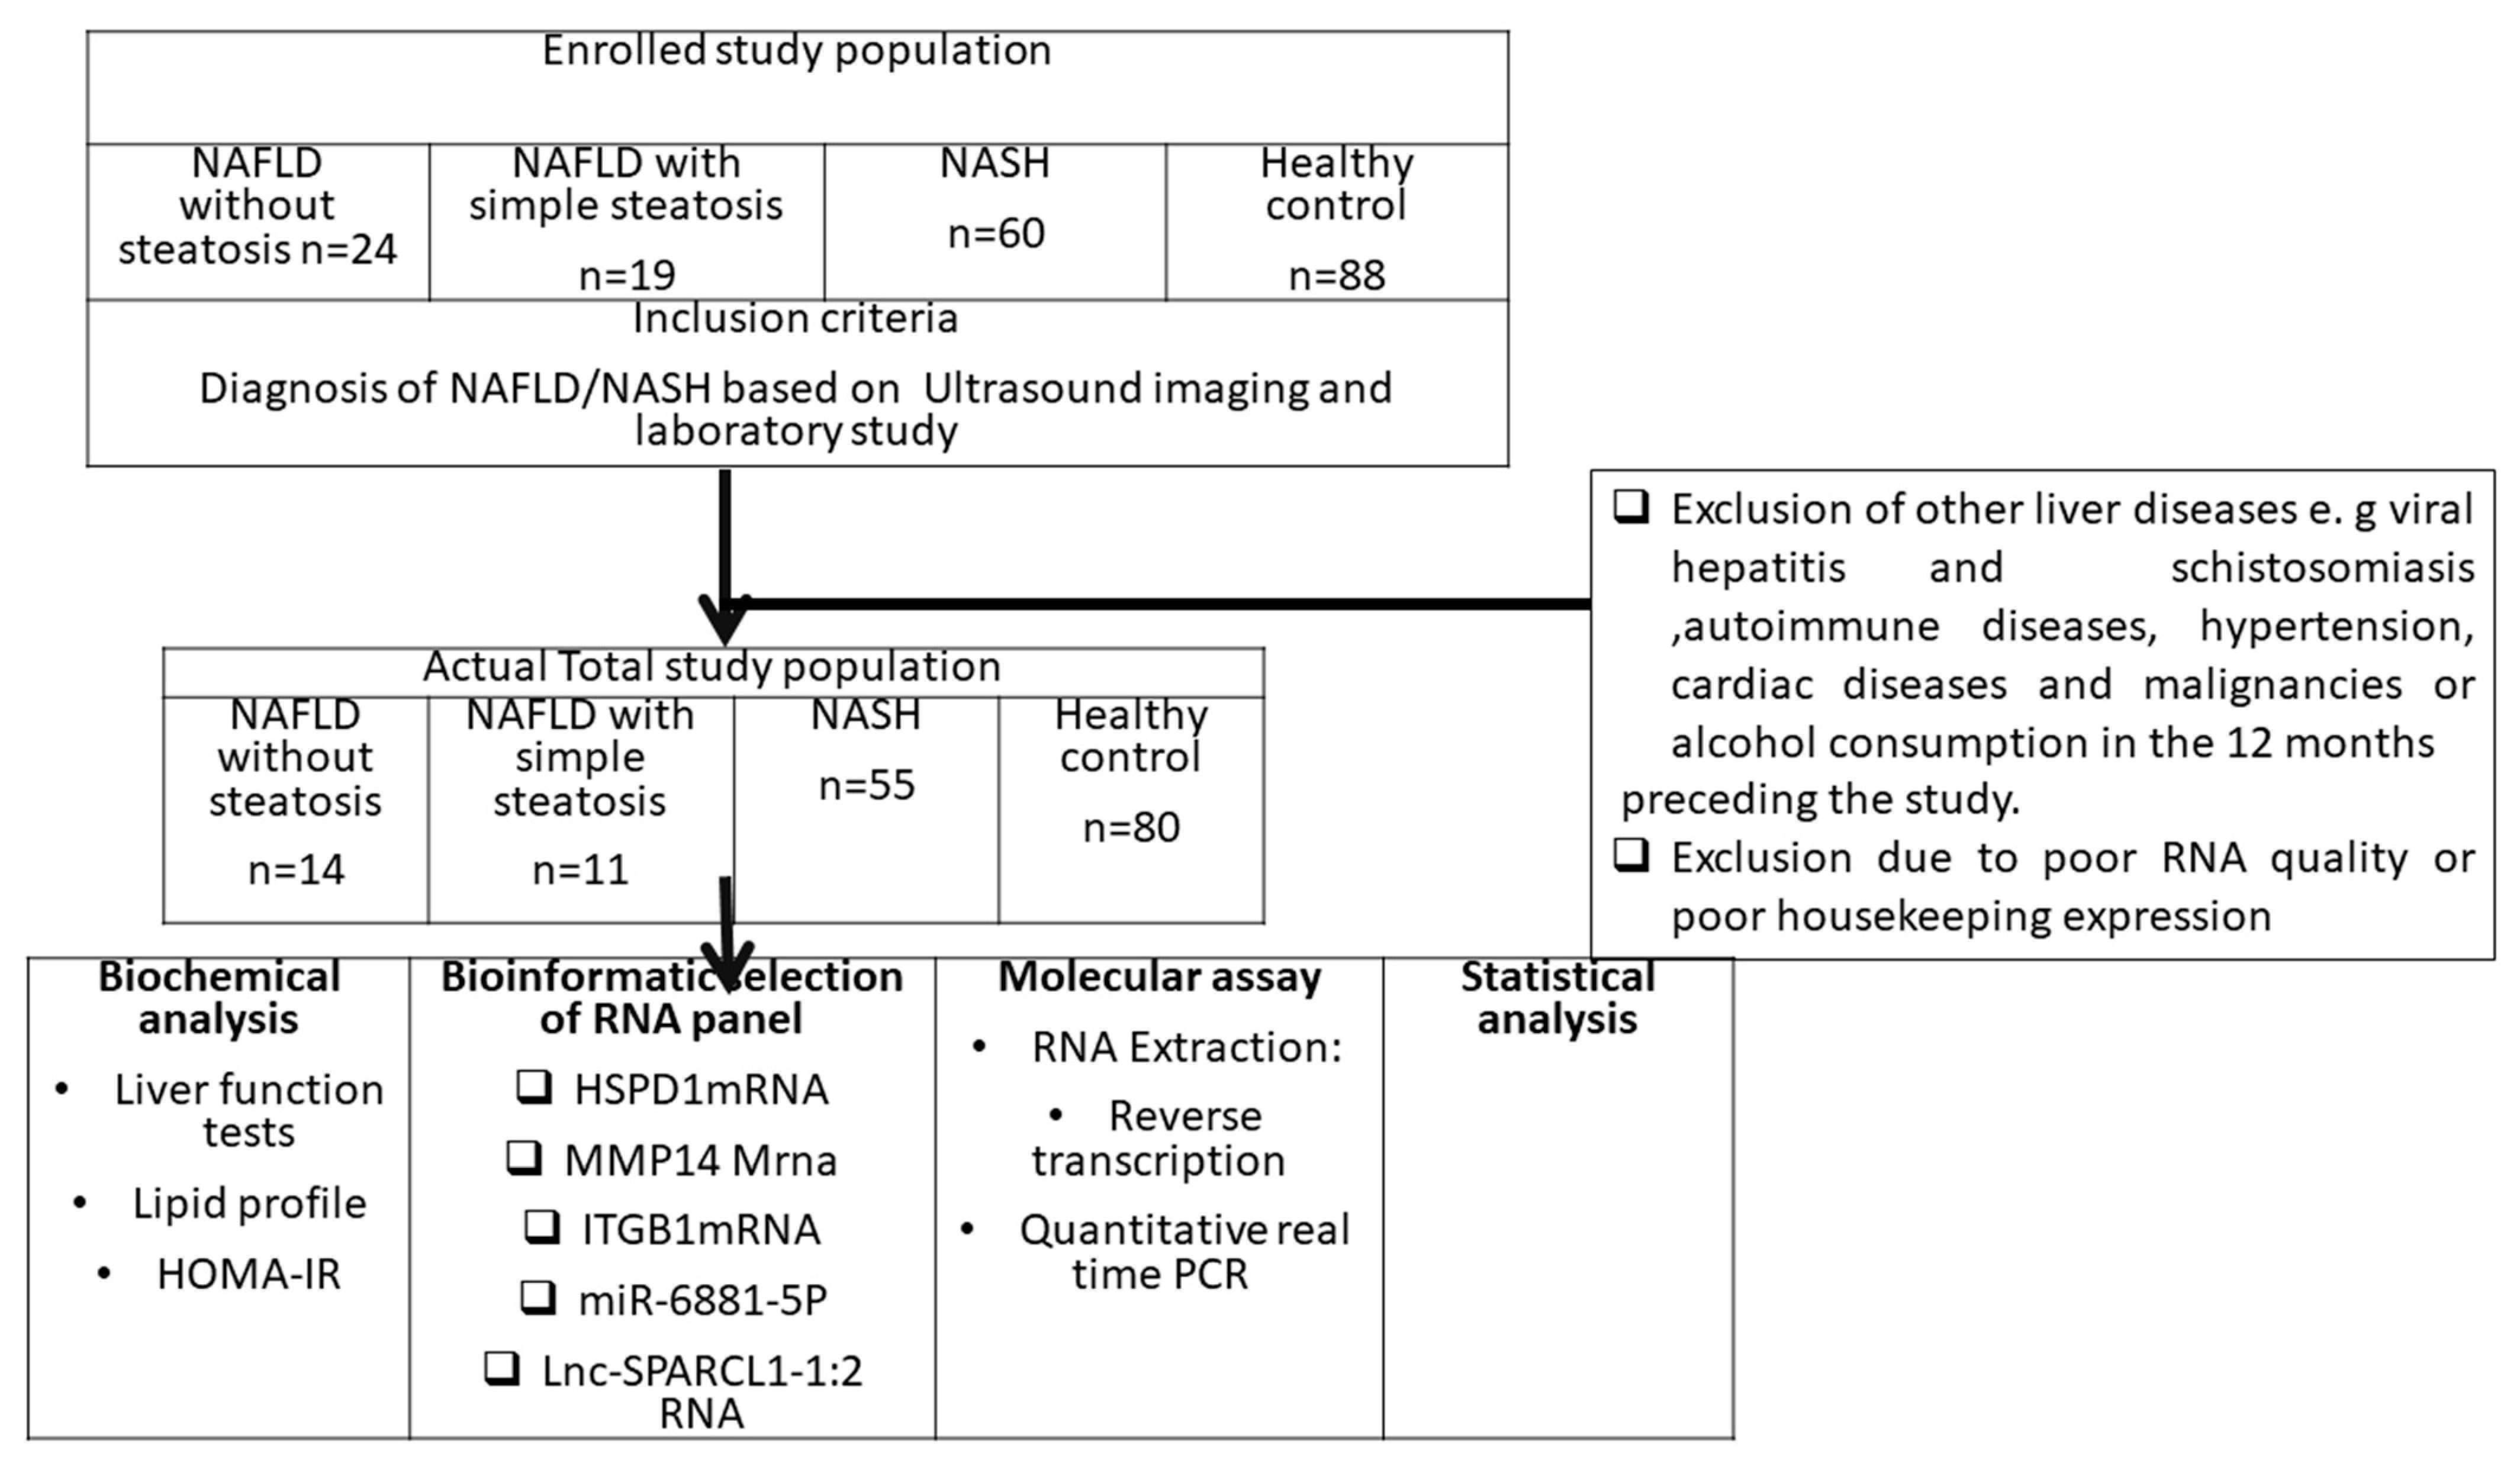
2.1. Study Population
2.2. Bioinformatics Set Up
2.3. RNA Extraction
2.4. Reverse Transcription and Real-Time PCR (RT-qpcr)
2.5. Statistical Analysis
3. Results
3.1. NASH Association with Clinical and Biochemical Markers
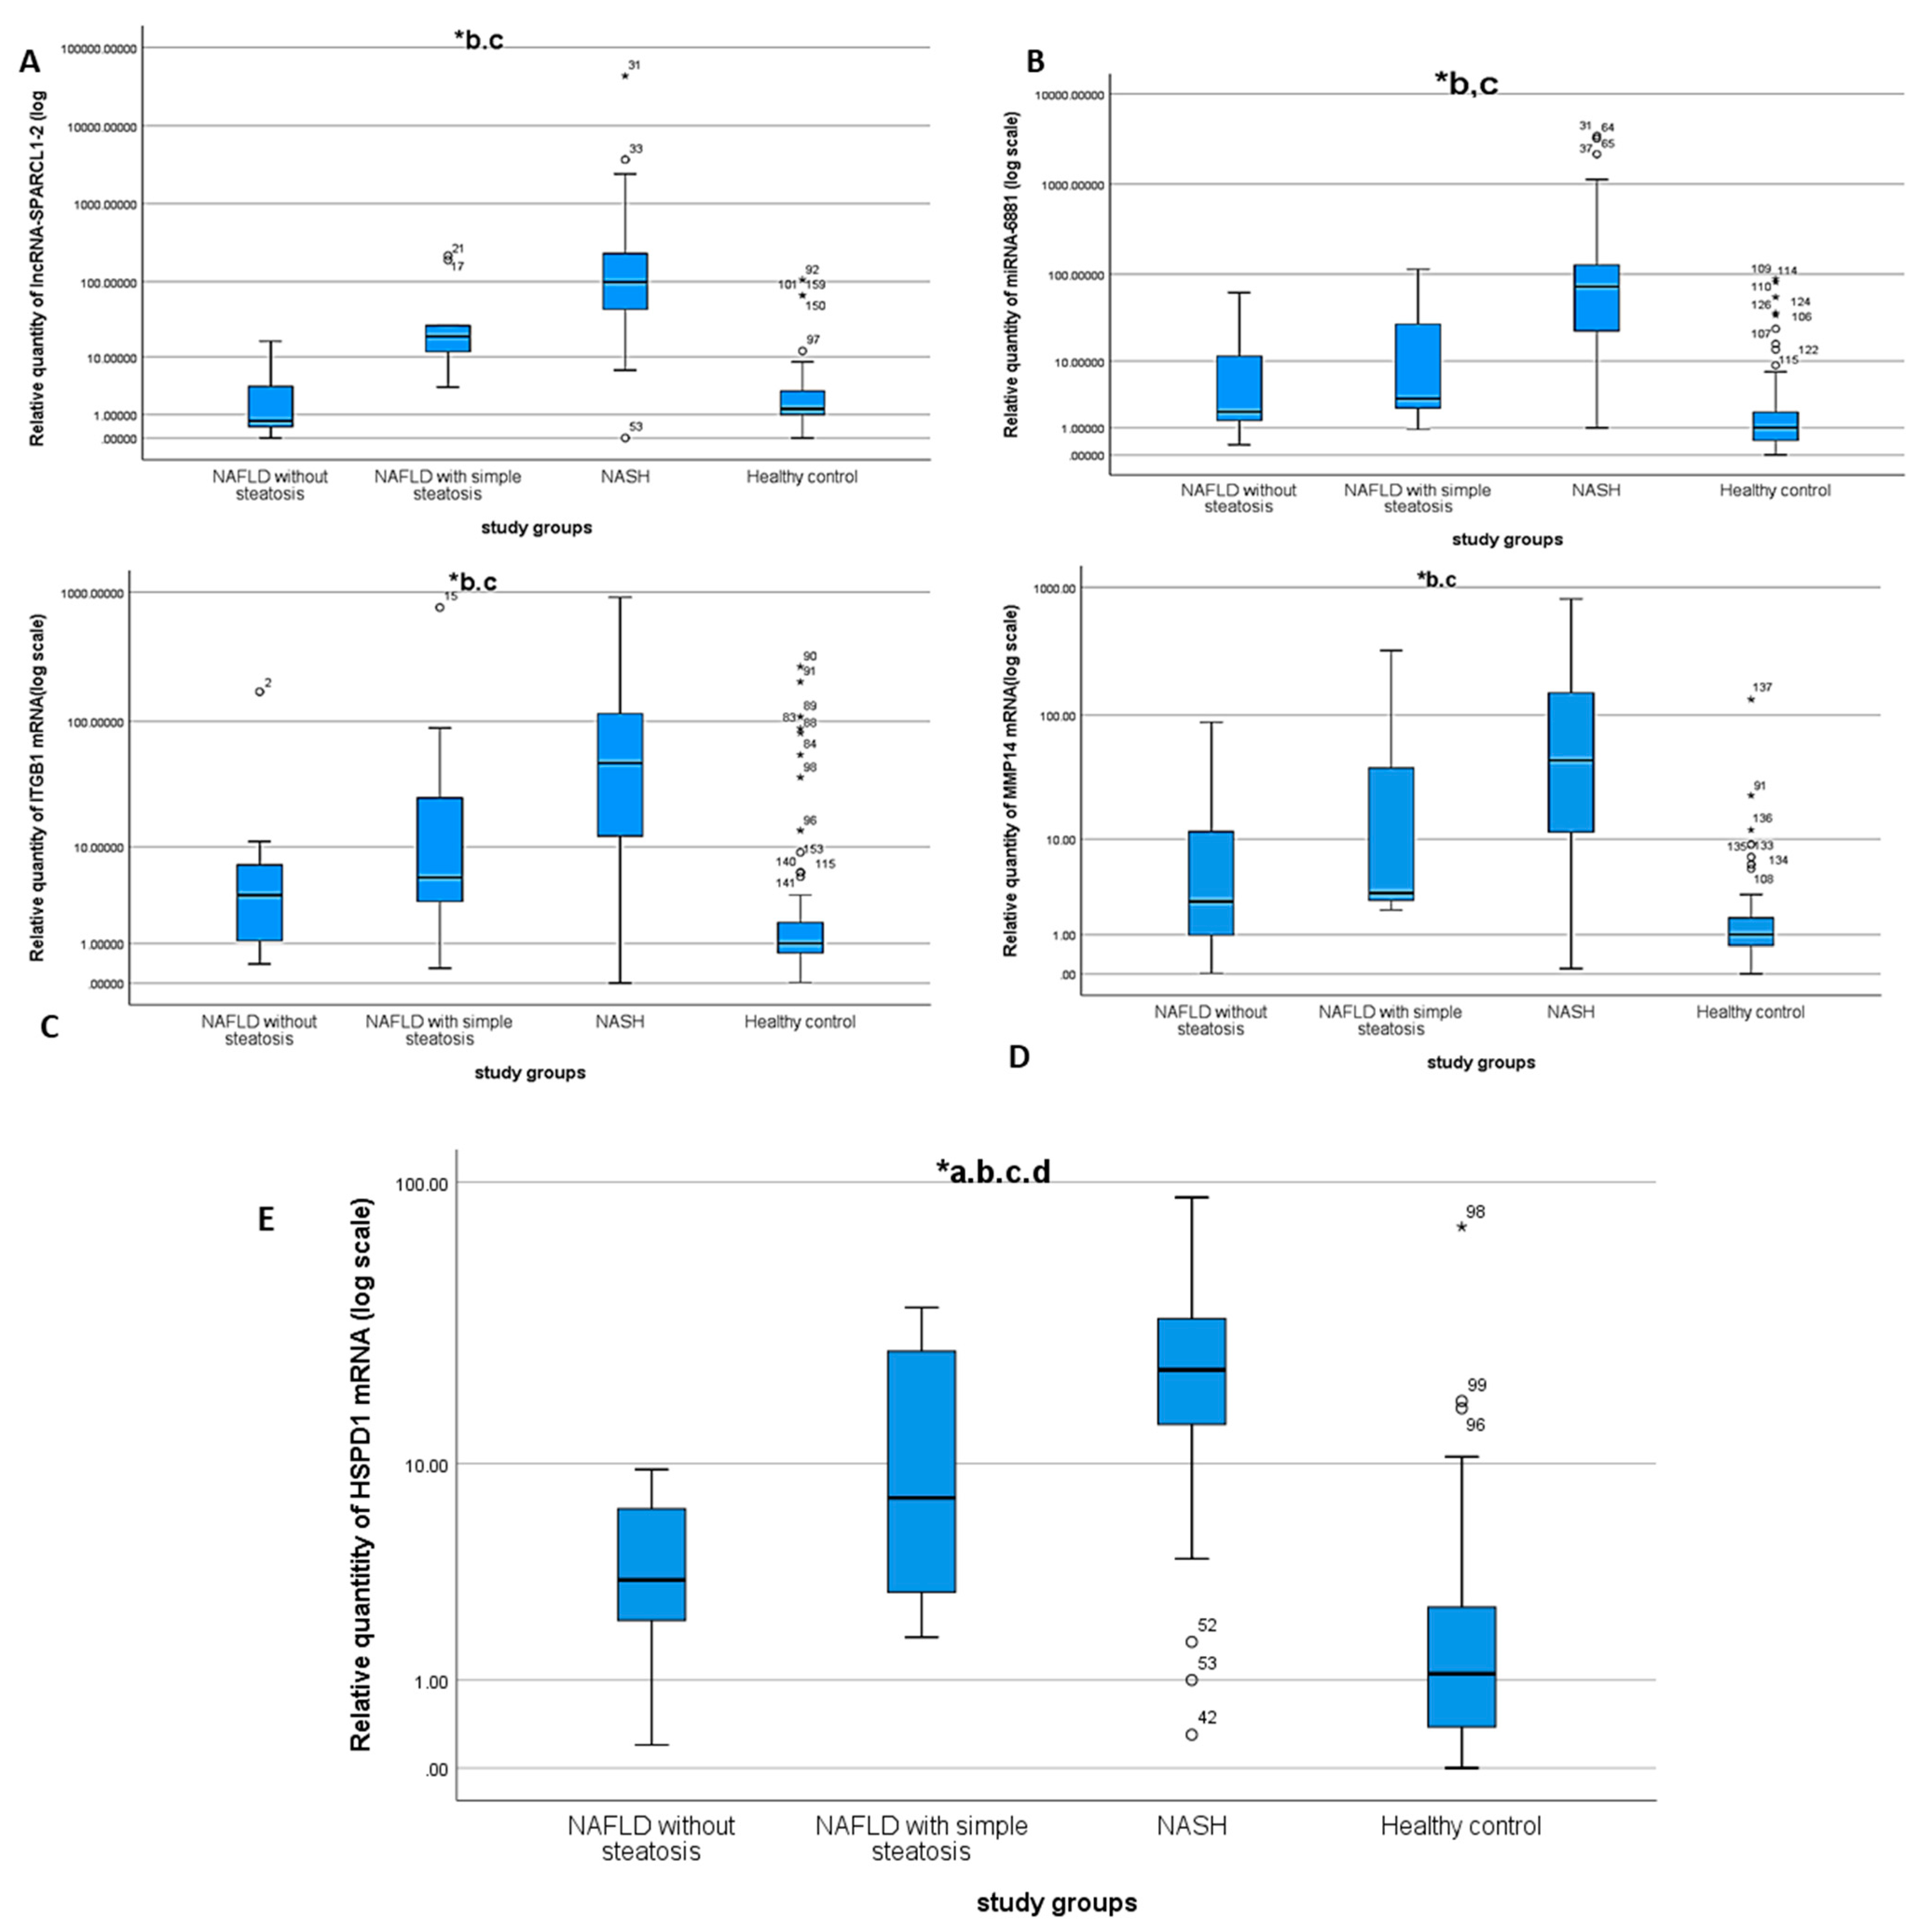
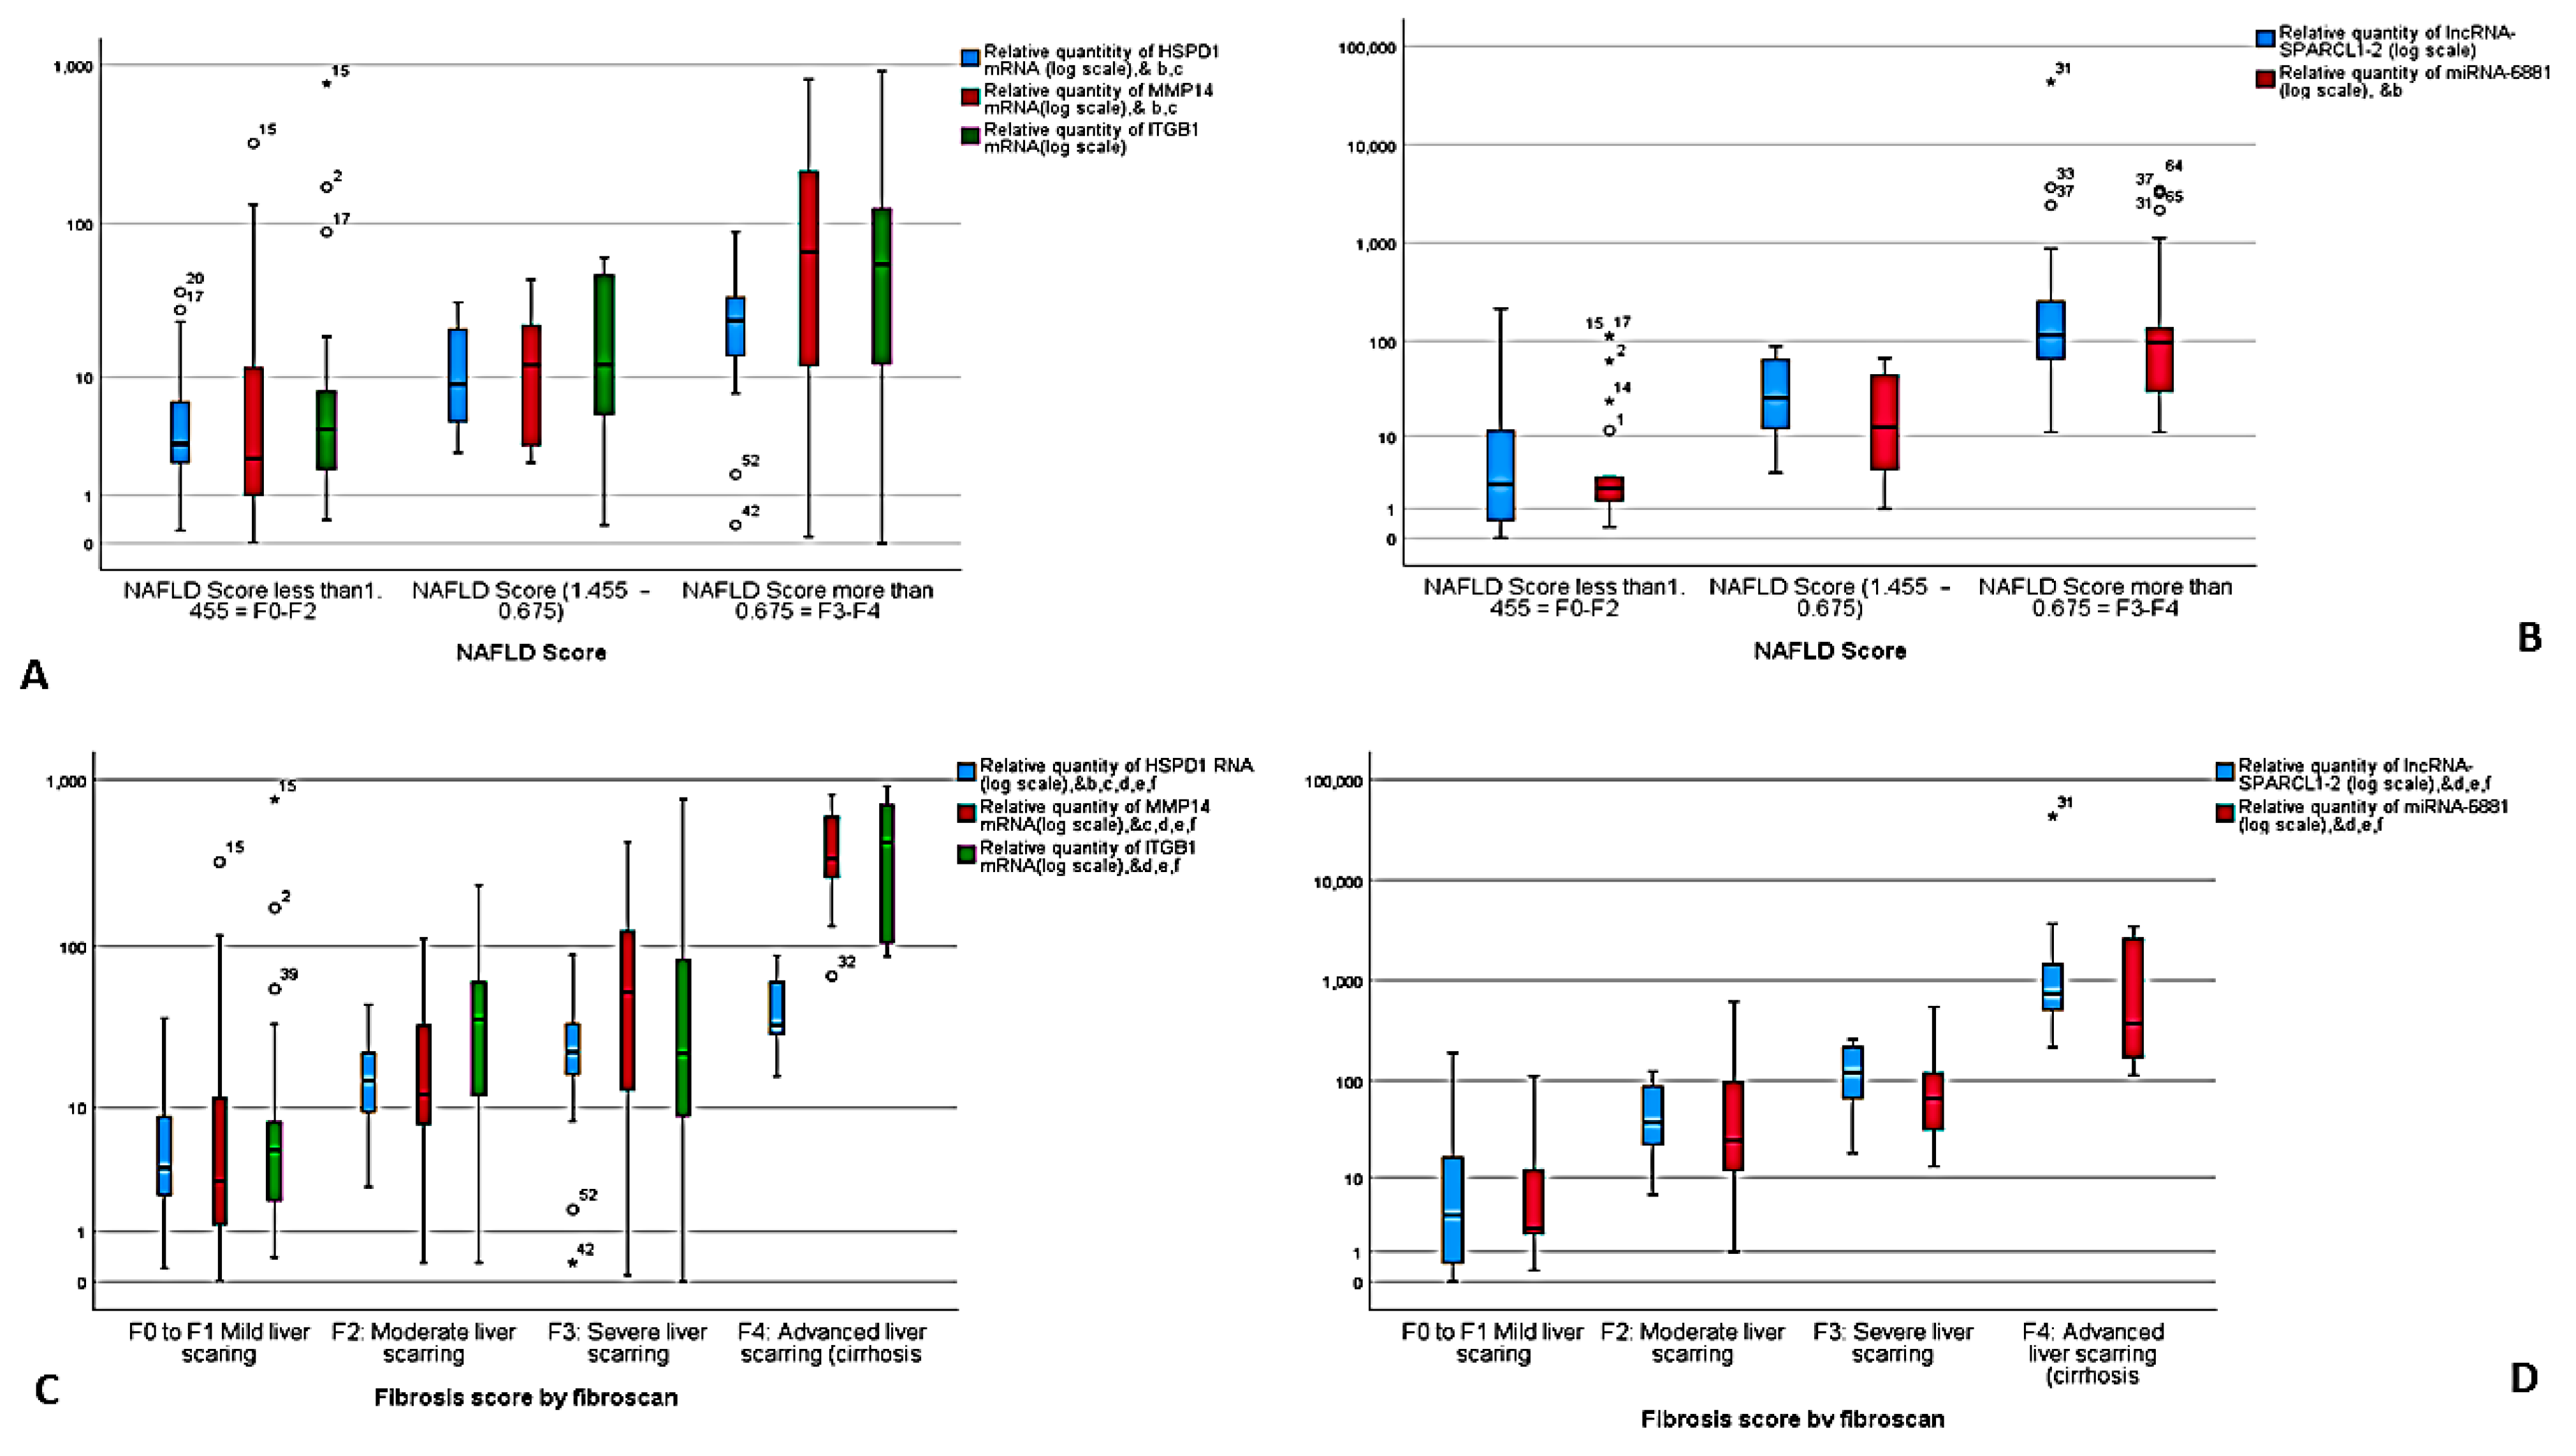
3.2. Differential Expression of the NASH Predictors in the Study Groups
3.3. Correlation between NASH Predictors
4. Discussion
5. Conclusions
Supplementary Materials
Author Contributions
Funding
Institutional Review Board Statement
Informed Consent Statement
Data Availability Statement
Conflicts of Interest
References
- Takahashi, T.F.Y. Histopathology of nonalcoholic fatty liver disease/nonalcoholic steatohepatitis. World J. Gastroenterol. 2014, 20, 15539–15548. [Google Scholar] [CrossRef]
- Cohen, J.C.; Horton, J.D.; Hobbs, H.H. Human Fatty Liver Disease: Old Questions and New Insights. Science 2011, 332, 1519–1523. [Google Scholar] [CrossRef] [Green Version]
- Della Corte, C.; Ferrari, F.; Villani, A.; Nobili, V. Epidemiology and Natural History of Nafld/Epidemiologija I Prirodna Istorija Nealkoholne Masne Jetre. J. Med. Biochem. 2015, 34, 13–17. [Google Scholar] [CrossRef] [Green Version]
- Povsic, M.; Wong, O.Y.; Perry, R.; Bottomley, J. A Structured Literature Review of the Epidemiology and Disease Burden of Non-Alcoholic Steatohepatitis (NASH). Adv. Ther. 2019, 36, 1574–1594. [Google Scholar] [CrossRef] [Green Version]
- Ludwig, J.; Viggiano, T.R.; McGill, D.B.; Oh, B.J. Nonalcoholic steatohepatitis: Mayo Clinic experiences with a hitherto unnamed disease. Mayo Clin. Proc. 1980, 55, 434–438. [Google Scholar]
- Tilg, H.; Moschen, A.R. Evolution of inflammation in nonalcoholic fatty liver disease: The multiple parallel hits hypothesis. Hepatology 2010, 52, 1836–1846. [Google Scholar] [CrossRef] [PubMed]
- Dostert, C.; Petrilli, V.; Van Bruggen, R.; Steele, C.; Mossman, B.T.; Tschopp, J. Innate Immune Activation Through Nalp3 Inflammasome Sensing of Asbestos and Silica. Science 2008, 320, 674–677. [Google Scholar] [CrossRef] [Green Version]
- Shimada, K.; Crother, T.R.; Karlin, J.; Dagvadorj, J.; Chiba, N.; Chen, S.; Ramanujan, V.K.; Wolf, A.J.; Vergnes, L.; Ojcius, D.M.; et al. Oxidized Mitochondrial DNA Activates the NLRP3 Inflammasome during Apoptosis. Immunity 2012, 36, 401–414. [Google Scholar] [CrossRef] [PubMed] [Green Version]
- Szabo, G.; Csak, T. Inflammasomes in liver diseases. J. Hepatol. 2012, 57, 642–654. [Google Scholar] [CrossRef] [Green Version]
- Dixon, L.J.; Flask, C.A.; Papouchado, B.G.; Feldstein, A.E.; Nagy, L.E. Caspase-1 as a Central Regulator of High Fat Diet-Induced Non-Alcoholic Steatohepatitis. PLoS ONE 2013, 8, e56100. [Google Scholar] [CrossRef] [Green Version]
- Stienstra, R.; Joosten, L.A.B.; Koenen, T.; van Tits, B.; van Diepen, J.A.; van den Berg, S.A.A.; Rensen, P.C.N.; Voshol, P.J.; Fantuzzi, G.; Hijmans, A.; et al. The Inflammasome-Mediated Caspase-1 Activation Controls Adipocyte Differentiation and Insulin Sensitivity. Cell Metab. 2010, 12, 593–605. [Google Scholar] [CrossRef] [Green Version]
- Membrez, M.; Ammon-Zufferey, C.; Philippe, D.; Aprikian, O.; Monnard, I.; Macé, K.; Darimont, C. Interleukin-18 Protein Level Is Upregulated in Adipose Tissue of Obese Mice. Obesity 2009, 17, 393–395. [Google Scholar] [CrossRef] [PubMed]
- Rottiers, V.; Näär, A.M. MicroRNAs in metabolism and metabolic disorders. Nat. Rev. Mol. Cell Biol. 2012, 13, 239–250. [Google Scholar] [CrossRef] [PubMed]
- Ferreira, D.M.S.; Simão, A.L.; Rodrigues, C.M.P.; Castro, R.E. Revisiting the metabolic syndrome and paving the way for microRNAs in non-alcoholic fatty liver disease. FEBS J. 2014, 281, 2503–2524. [Google Scholar] [CrossRef] [PubMed] [Green Version]
- Soronen, J.; Yki-Järvinen, H.; Zhou, Y.; Sädevirta, S.; Sarin, A.-P.; Leivonen, M.; Sevastianova, K.; Perttilä, J.; Laurila, P.-P.; Sigruener, A.; et al. Novel hepatic microRNAs upregulated in human nonalcoholic fatty liver disease. Physiol. Rep. 2016, 4, e12661. [Google Scholar] [CrossRef] [PubMed] [Green Version]
- Sun, C.; Liu, X.; Yi, Z.; Xiao, X.; Yang, M.; Hu, G.; Liu, H.; Liao, L.; Huang, F. Genome-wide analysis of long noncoding RNA expression profiles in patients with non-alcoholic fatty liver disease. IUBMB Life 2015, 67, 847–852. [Google Scholar] [CrossRef] [PubMed]
- Baranova, A.; Younossi, Z.M. The future is around the corner: Noninvasive diagnosis of progressive nonalcoholic steatohepatitis. Hepatology 2008, 47, 373–375. [Google Scholar] [CrossRef]
- Palekar, N.A.; Naus, R.; Larson, S.P.; Ward, J.; Harrison, S.A. Clinical model for distinguishing nonalcoholic steatohepatitis from simple steatosis in patients with nonalcoholic fatty liver disease. Liver Int. 2006, 26, 151–156. [Google Scholar] [CrossRef]
- A Neuschwander-Tetri, B. Nonalcoholic steatohepatitis: Summary of an AASLD Single Topic Conference. Hepatology 2003, 37, 1202–1219. [Google Scholar] [CrossRef]
- Angulo, P.; Hui, J.M.; Marchesini, G.; Bugianesi, E.; George, J.; Farrell, G.C.; Enders, F.; Saksena, S.; Burt, A.D.; Bida, J.P.; et al. The NAFLD fibrosis score: A noninvasive system that identifies liver fibrosis in patients with NAFLD. Hepatology 2007, 45, 846–854. [Google Scholar] [CrossRef]
- Salgado, A.L.F.D.A.; De Carvalho, L.; Oliveira, A.C.; dos Santos, V.N.; Vieira, J.; Parise, E.R. Insulin resistance index (HOMA-IR) in the differentiation of patients with non-alcoholic fatty liver disease and healthy individuals. Arq. Gastroenterol. 2010, 47, 165–169. [Google Scholar] [CrossRef] [Green Version]
- Null, N. Trends in adult body-mass index in 200 countries from 1975 to 2014: A pooled analysis of 1698 population-based measurement studies with 19·2 million participants. Lancet 2016, 387, 1377–1396. [Google Scholar] [CrossRef] [Green Version]
- Younossi, Z.; Tacke, F.; Arrese, M.; Sharma, B.C.; Mostafa, I.; Bugianesi, E.; Wong, V.W.-S.; Yilmaz, Y.; George, J.; Fan, J.; et al. Global Perspectives on Nonalcoholic Fatty Liver Disease and Nonalcoholic Steatohepatitis. Hepatology 2019, 69, 2672–2682. [Google Scholar] [CrossRef] [PubMed] [Green Version]
- Charlton, M.R.; Burns, J.M.; Pedersen, R.A.; Watt, K.D.; Heimbach, J.K.; Dierkhising, R.A. Frequency and Outcomes of Liver Transplantation for Nonalcoholic Steatohepatitis in the United States. Gastroenterology 2011, 141, 1249–1253. [Google Scholar] [CrossRef] [PubMed]
- Jennison, E.; Patel, J.; Scorletti, E.; Byrne, C.D. Diagnosis and management of non-alcoholic fatty liver disease. Postgrad. Med. J. 2019, 95, 314–322. [Google Scholar] [CrossRef]
- Matboli, M.; Gadallah, S.; Rashed, W.; Hasanin, A.; Essawy, N.; Ghanem, H.; Eissa, S. mRNA-miRNA-lncRNA Regulatory Network in Nonalcoholic Fatty Liver Disease. Int. J. Mol. Sci. 2021, 22, 6770. [Google Scholar] [CrossRef]
- Caligiuri, A.; Gentilini, A.; Marra, F. Molecular Pathogenesis of NASH. Int. J. Mol. Sci. 2016, 17, 1575. [Google Scholar] [CrossRef] [PubMed] [Green Version]
- Ganz, M.; Csak, T.; Nath, B.; Szabo, G. Lipopolysaccharide induces and activates the Nalp3 inflammasome in the liver. World J. Gastroenterol. 2011, 17, 4772–4778. [Google Scholar] [CrossRef]
- He, K.; Zhu, X.; Liu, Y.; Miao, C.; Wang, T.; Li, P.; Zhao, L.; Chen, Y.; Gong, J.; Cai, C.; et al. Inhibition of NLRP3 inflammasome by thioredoxin-interacting protein in mouse Kupffer cells as a regulatory mechanism for non-alcoholic fatty liver disease development. Oncotarget 2017, 8, 37657–37672. [Google Scholar] [CrossRef] [PubMed]
- Huang, C.; Liu, Q.; Tang, Q.; Jing, X.; Wu, T.; Zhang, J.; Zhang, G.; Zhou, J.; Zhang, Z.; Zhao, Y.; et al. Hepatocyte-specific deletion of Nlrp6 in mice exacerbates the development of non-alcoholic steatohepatitis. Free. Radic. Biol. Med. 2021, 169, 110–121. [Google Scholar] [CrossRef] [PubMed]
- Ohashi, K.; Wang, Z.; Yang, Y.M.; Billet, S.; Tu, W.; Pimienta, M.; Cassel, S.L.; Pandol, S.J.; Lu, S.C.; Sutterwala, F.S.; et al. NOD-like receptor C4 Inflammasome Regulates the Growth of Colon Cancer Liver Metastasis in NAFLD. Hepatology 2019, 70, 1582–1599. [Google Scholar] [CrossRef] [PubMed]
- Ogawa, M.; Kanda, T.; Higuchi, T.; Takahashi, H.; Kaneko, T.; Matsumoto, N.; Nirei, K.; Yamagami, H.; Matsuoka, S.; Kuroda, K.; et al. Possible association of arrestin domain-containing protein 3 and progression of non-alcoholic fatty liver disease. Int. J. Med. Sci. 2019, 16, 909–921. [Google Scholar] [CrossRef] [PubMed] [Green Version]
- Lefebvre, P.; Lalloyer, F.; Baugé, E.; Pawlak, M.; Gheeraert, C.; Dehondt, H.; Vanhoutte, J.; Woitrain, E.; Hennuyer, N.; Mazuy, C.; et al. Interspecies NASH disease activity whole-genome profiling identifies a fibrogenic role of PPARα-regulated dermatopontin. JCI Insight 2017, 2, e92264. [Google Scholar] [CrossRef]
- Clapper, J.R.; Hendricks, M.D.; Gu, G.; Wittmer, C.; Dolman, C.S.; Herich, J.; Athanacio, J.; Villescaz, C.; Ghosh, S.S.; Heilig, J.S.; et al. Diet-induced mouse model of fatty liver disease and nonalcoholic steatohepatitis reflecting clinical disease progression and methods of assessment. Am. J. Physiol. Liver Physiol. 2013, 305, G483–G495. [Google Scholar] [CrossRef] [Green Version]
- Hedjazifar, S.; Shahidi, R.K.; Hammarstedt, A.; Bonnet, L.; Church, C.; Boucher, J.; Blüher, M.; Smith, U. The Novel Adipokine Gremlin 1 Antagonizes Insulin Action and Is Increased in Type 2 Diabetes and NAFLD/NASH. Diabetes 2019, 69, 331–341. [Google Scholar] [CrossRef] [PubMed] [Green Version]
- Nie, H.; Deng, Y.; Zheng, C.; Pan, M.; Xie, J.; Zhang, Y.; Yang, Q. A network pharmacology-based approach to explore the effects of Chaihu Shugan powder on a non-alcoholic fatty liver rat model through nuclear receptors. J. Cell. Mol. Med. 2020, 24, 5168–5184. [Google Scholar] [CrossRef] [PubMed] [Green Version]
- Pirola, C.J.; Fernández Gianotti, T.; Castaño, G.O.; Mallardi, P.; San Martino, J.; Mora Gonzalez Lopez Ledesma, M.; Flichman, D.M.; Mirshahi, F.; Sanyal, A.J.; Sookoian, S.C. Circulating microRNA signature in non-alcoholic fatty liver disease: From serum non-coding RNAs to liver histology and disease pathogenesis. Gut 2015, 64, 800–812. [Google Scholar] [CrossRef] [PubMed] [Green Version]
- Hur, W.; Lee, J.H.; Kim, S.W.; Kim, J.-H.; Bae, S.H.; Kim, M.; Hwang, D.; Kim, Y.S.; Park, T.; Um, S.-J.; et al. Downregulation of microRNA-451 in non-alcoholic steatohepatitis inhibits fatty acid-induced proinflammatory cytokine production through the AMPK/AKT pathway. Int. J. Biochem. Cell Biol. 2015, 64, 265–276. [Google Scholar] [CrossRef] [Green Version]
- Castro, R.E.; Ferreira, D.M.; Afonso, M.B.; Borralho, P.M.; Machado, M.V.; Cortez-Pinto, H.; Rodrigues, C.M. miR-34a/SIRT1/p53 is suppressed by ursodeoxycholic acid in the rat liver and activated by disease severity in human non-alcoholic fatty liver disease. J. Hepatol. 2013, 58, 119–125. [Google Scholar] [CrossRef]
- Wang, X. Down-regulation of lncRNA-NEAT1 alleviated the non-alcoholic fatty liver disease via mTOR/S6K1 signaling pathway. J. Cell. Biochem. 2018, 119, 1567–1574. [Google Scholar] [CrossRef]
- Atanasovska, B.; Rensen, S.S.; Van Der Sijde, M.R.; Marsman, G.; Kumar, V.; Jonkers, I.; Withoff, S.; Shiri-Sverdlov, R.; Greve, J.W.M.; Faber, K.N.; et al. A liver-specific long noncoding RNA with a role in cell viability is elevated in human nonalcoholic steatohepatitis. Hepatology 2017, 34, 67–79. [Google Scholar] [CrossRef]
- Lin, K.; Lin, B.; Lian, I.Y.; Mestril, R.; Scheffler, I.E.; Dillmann, W.H. Combined and Individual Mitochondrial HSP60 and HSP10 Expression in Cardiac Myocytes Protects Mitochondrial Function and Prevents Apoptotic Cell Deaths Induced by Simulated Ischemia-Reoxygenation. Circulation 2001, 103, 1787–1792. [Google Scholar] [CrossRef] [PubMed] [Green Version]
- Radford, S.E. GroEL: More than Just a Folding Cage. Cell 2006, 125, 831–833. [Google Scholar] [CrossRef] [PubMed] [Green Version]
- Kaufman, B.A.; Kolesar, J.E.; Perlman, P.S.; Butow, R.A. A function for the mitochondrial chaperonin Hsp60 in the structure and transmission of mitochondrial DNA nucleoids in Saccharomyces cerevisiae. J. Cell Biol. 2003, 163, 457–461. [Google Scholar] [CrossRef] [PubMed] [Green Version]
- Kim, K.-H.; Song, K.; Yoon, S.-H.; Shehzad, O.; Kim, Y.-S.; Son, J.H. Rescue of PINK1 Protein Null-specific Mitochondrial Complex IV Deficits by Ginsenoside Re Activation of Nitric Oxide Signaling. J. Biol. Chem. 2012, 287, 44109–44120. [Google Scholar] [CrossRef] [Green Version]
- Lin, L.; Pan, S.; Zhao, J.; Liu, C.; Wang, P.; Fu, L.; Xu, X.; Jin, M.; Zhang, A. HSPD1 Interacts with IRF3 to Facilitate Interferon-Beta Induction. PLoS ONE 2014, 9, e114874. [Google Scholar] [CrossRef]
- Xiao, G.; Zhuang, W.; Wang, T.; Lian, G.; Luo, L.; Ye, C.; Wang, H.; Xie, L. Transcriptomic analysis identifies Toll-like and Nod-like pathways and necroptosis in pulmonary arterial hypertension. J. Cell. Mol. Med. 2020, 24, 11409–11421. [Google Scholar] [CrossRef]
- Torina, A.; Villari, S.; Blanda, V.; Vullo, S.; La Manna, M.; Azgomi, M.S.; Di Liberto, D.; De La Fuente, J.; Sireci, G. Innate Immune Response to Tick-Borne Pathogens: Cellular and Molecular Mechanisms Induced in the Hosts. Int. J. Mol. Sci. 2020, 21, 5437. [Google Scholar] [CrossRef]
- Enomoto, H.; Mittal, N.; Inomata, T.; Arimura, T.; Izumi, T.; Kimura, A.; Fukuda, K.; Makino, S. Dilated cardiomyopathy-linked heat shock protein family D member 1 mutations cause up-regulation of reactive oxygen species and autophagy through mitochondrial dysfunction. Cardiovasc. Res. 2021, 117, 1118–1131. [Google Scholar] [CrossRef]
- Stefano, J.; Pereira, I.V.A.; Torres, M.; Bida, P.; Coelho, A.; Xerfan, M.; Cogliati, B.; Barbeiro, D.; Mazo, D.; Kubrusly, M.; et al. Sorafenib prevents liver fibrosis in a non-alcoholic steatohepatitis (NASH) rodent model. Braz. J. Med. Biol. Res. 2015, 48, 408–414. [Google Scholar] [CrossRef] [Green Version]
- Yuan, D.; Huang, S.; Berger, E.; Liu, L.; Gross, N.; Heinzmann, F.; Ringelhan, M.; Connor, T.O.; Stadler, M.; Meister, M.; et al. Kupffer Cell-Derived Tnf Triggers Cholangiocellular Tumorigenesis through JNK due to Chronic Mitochondrial Dysfunction and ROS. Cancer Cell 2017, 31, 771–789.e6. [Google Scholar] [CrossRef] [PubMed] [Green Version]
- Wheeler, M.C.; Gekakis, N. Hsp90 modulates PPARγ activity in a mouse model of nonalcoholic fatty liver disease. J. Lipid Res. 2014, 55, 1702–1710. [Google Scholar] [CrossRef] [Green Version]
- Rydlova, M.; Holubec, L.; Kalfert, D.; Franekova, J.; Povýšil, C.; Ludvíková, M. Biological activity and clinical implications of the matrix metalloproteinases. Anticancer. Res. 2008, 28, 1389–1397. [Google Scholar]
- Baker, A.H.; Edwards, D.; Murphy, G. Metalloproteinase inhibitors: Biological actions and therapeutic opportunities. J. Cell Sci. 2002, 115, 3719–3727. [Google Scholar] [CrossRef] [Green Version]
- Ito, A.; Mukaiyama, A.; Itoh, Y.; Nagase, H.; Thøgersen, I.B.; Enghild, J.J.; Sasaguri, Y.; Mori, Y. Degradation of Interleukin 1β by Matrix Metalloproteinases. J. Biol. Chem. 1996, 271, 14657–14660. [Google Scholar] [CrossRef] [PubMed] [Green Version]
- McQuibban, G.A.; Gong, J.-H.; Tam, E.M.; McCulloch, C.A.G.; Clark-Lewis, I.; Overall, C.M. Inflammation Dampened by Gelatinase A Cleavage of Monocyte Chemoattractant Protein. Science 2000, 289, 1202–1206. [Google Scholar] [CrossRef] [PubMed]
- Chakraborti, S.; Mandal, M.; Das, S.; Mandal, A.; Chakraborti, T. Regulation of matrix metalloproteinases: An overview. Mol. Cell. Biochem. 2003, 253, 269–285. [Google Scholar] [CrossRef]
- Sato, H.; Takino, T.; Okada, Y.; Cao, J.; Shinagawa, A.; Yamamoto, E.; Seiki, M. A matrix metalloproteinase expressed on the surface of invasive tumour cells. Nat. Cell Biol. 1994, 370, 61–65. [Google Scholar] [CrossRef]
- Cui, G.; Cai, F.; Ding, Z.; Gao, L. MMP14 predicts a poor prognosis in patients with colorectal cancer. Hum. Pathol. 2019, 83, 36–42. [Google Scholar] [CrossRef]
- Stawowczyk, M.; Wellenstein, M.D.; Lee, S.B.; Yomtoubian, S.; Durrans, A.; Choi, H.; Narula, N.; Altorki, N.K.; Gao, D.; Mittal, V. Matrix Metalloproteinase 14 promotes lung cancer by cleavage of Heparin-Binding EGF-like Growth Factor. Neoplasia 2017, 19, 55–64. [Google Scholar] [CrossRef]
- Watanabe, T.; Niioka, M.; Ishikawa, A.; Hozawa, S.; Arai, M.; Maruyama, K.; Okada, A.; Okazaki, I. Dynamic change of cells expressing MMP-2 mRNA and MT1-MMP mRNA in the recovery from liver fibrosis in the rat. J. Hepatol. 2001, 35, 465–473. [Google Scholar] [CrossRef]
- Arthur, M.J.P. Fibrogenesis II. Metalloproteinases and their inhibitors in liver fibrosis. Am. J. Physiol. Liver Physiol. 2000, 279, G245–G249. [Google Scholar] [CrossRef]
- Ley, K.; Pramod, A.B.; Croft, M.; Ravichandran, K.S.; Ting, J.P. How Mouse Macrophages Sense What Is Going On. Front. Immunol. 2016, 7, 204. [Google Scholar] [CrossRef] [Green Version]
- Hsu, K.-S.; Kao, H.-Y. PML: Regulation and multifaceted function beyond tumor suppression. Cell Biosci. 2018, 8, 5. [Google Scholar] [CrossRef] [Green Version]
- Zha, R.; Guo, W.; Zhang, Z.; Qiu, Z.; Wang, Q.; Ding, J.; Huang, S.; Chen, T.; Gu, J.; Yao, M.; et al. Genome-Wide Screening Identified That miR-134 Acts as a Metastasis Suppressor by Targeting Integrin β1 in Hepatocellular Carcinoma. PLoS ONE 2014, 9, e87665. [Google Scholar] [CrossRef]
- Guo, Q.; Furuta, K.; Lucien, F.; Sanchez, L.H.G.; Hirsova, P.; Krishnan, A.; Kabashima, A.; Pavelko, K.D.; Madden, B.; Alhuwaish, H.; et al. Integrin β1-enriched extracellular vesicles mediate monocyte adhesion and promote liver inflammation in murine NASH. J. Hepatol. 2019, 71, 1193–1205. [Google Scholar] [CrossRef] [PubMed]
- Arrese, M.; Eguchi, A.; Feldstein, A.E. Circulating microRNAs: Emerging Biomarkers of Liver Disease. Semin. Liver Dis. 2015, 35, 043–054. [Google Scholar] [CrossRef] [PubMed]
- Mitchell, P.S.; Parkin, R.K.; Kroh, E.M.; Fritz, B.R.; Wyman, S.K.; Pogosova-Agadjanyan, E.L.; Peterson, A.; Noteboom, J.; O’Briant, K.C.; Allen, A.; et al. Circulating microRNAs as stable blood-based markers for cancer detection. Proc. Natl. Acad. Sci. USA 2008, 105, 10513–10518. [Google Scholar] [CrossRef] [Green Version]
- Weiland, M.; Gao, X.-H.; Zhou, L.; Mi, Q.-S. Small RNAs have a large impact. RNA Biol. 2012, 9, 850–859. [Google Scholar] [CrossRef] [Green Version]
- Baffy, G. MicroRNAs in Nonalcoholic Fatty Liver Disease. J. Clin. Med. 2015, 4, 1977–1988. [Google Scholar] [CrossRef] [PubMed] [Green Version]
- Gerhard, G.S. Micro RNAs in the development of non-alcoholic fatty liver disease. World J. Hepatol. 2014, 7, 226–234. [Google Scholar] [CrossRef]
- He, Z.; Hu, C.; Jia, W. miRNAs in non-alcoholic fatty liver disease. Front. Med. 2016, 10, 389–396. [Google Scholar] [CrossRef] [PubMed]
- Chen, Y.; Huang, H.; Xu, C.; Yu, C.; Li, Y. Long Non-Coding RNA Profiling in a Non-Alcoholic Fatty Liver Disease Rodent Model: New Insight into Pathogenesis. Int. J. Mol. Sci. 2017, 18, 21. [Google Scholar] [CrossRef] [PubMed] [Green Version]
- Grimaldi, B.; Bellet, M.M.; Katada, S.; Astarita, G.; Hirayama, J.; Amin, R.H.; Granneman, J.G.; Piomelli, D.; Leff, T.; Sassone-Corsi, P. PER2 Controls Lipid Metabolism by Direct Regulation of PPARγ. Cell Metab. 2010, 12, 509–520. [Google Scholar] [CrossRef] [PubMed] [Green Version]
- Zhang, M.; Chi, X.; Qu, N.; Wang, C. Long noncoding RNA lncARSR promotes hepatic lipogenesis via Akt/SREBP-1c pathway and contributes to the pathogenesis of nonalcoholic steatohepatitis. Biochem. Biophys. Res. Commun. 2018, 499, 66–70. [Google Scholar] [CrossRef]
- Huang, X.-Q.; Cen, X.; Sun, W.-T.; Xia, K.; Yu, L.-Y.; Liu, J.; Zhao, Z.-H. CircPOMT1 and circMCM3AP inhibit osteogenic differentiation of human adipose-derived stem cells by targeting miR-6881-3p. Am. J. Transl. Res. 2019, 11, 4776–4788. [Google Scholar] [PubMed]
- Yong, M.; Hu, J.; Zhu, H.; Jiang, X.; Gan, X.; Hu, L. Circ-EEF2 facilitated autophagy via interaction with mir-6881-3p and ANXA2 in EOC. Am. J. Cancer Res. 2020, 10, 3737–3751. [Google Scholar]
- Chi, Y.; Gong, Z.; Xin, H.; Wang, Z.; Liu, Z. Long noncoding RNA lncARSR promotes nonalcoholic fatty liver disease and hepatocellular carcinoma by promoting YAP1 and activating the IRS2/AKT pathway. J. Transl. Med. 2020, 18, 126. [Google Scholar] [CrossRef] [Green Version]
- Wang, H.; Cao, Y.; Shu, L.; Zhu, Y.; Peng, Q.; Ran, L.; Wu, J.; Luo, Y.; Zuo, G.; Luo, J.; et al. Long non-coding RNA (lncRNA) H19 induces hepatic steatosis through activating MLXIPL and mTORC1 networks in hepatocytes. J. Cell. Mol. Med. 2019, 24, 1399–1412. [Google Scholar] [CrossRef] [Green Version]
- Zhao, Y.; Wu, J.; Liangpunsakul, S.; Wang, L. Long non-coding RNA in liver metabolism and disease: Current status. Liver Res. 2017, 136, 629–641. [Google Scholar] [CrossRef]
- Lai, F.; Ørom, U.; Cesaroni, M.; Beringer, M.; Taatjes, D.J.; Blobel, G.A.; Shiekhattar, R. Activating RNAs associate with Mediator to enhance chromatin architecture and transcription. Nat. Cell Biol. 2013, 494, 497–501. [Google Scholar] [CrossRef] [PubMed]
- Ramchandran, R.; Chaluvally-Raghavan, P. miRNA-mediated RNA activation in mammalian cells. In RNA Activation; Springer: Singapore, 2017; pp. 81–89. [Google Scholar]


| Parameters | NAFLD without Steatosis n = 14 | NAFLD with Simple Steatosis n = 11 | NASH n = 55 | Healthy Control n = 80 | p Value |
|---|---|---|---|---|---|
| Sex | N/A | 0.785 | |||
| male | 10 (71.4%) | 7 (63.6%) | 40 (72.7%) | 52 (65%) | |
| female | 4 (28.6%) | 4 (36.4%) | 15 (27.3%) | 18 (35%) | |
| History of diabetes mellitus | N/A | N/A | N/A | N/A | 0.00 ** |
| positive | 13 (92.9%) | 9 (81.8%) | 46 (83.6%) | 27 (33.8%) | |
| negative | 1 (7.1%) | 2 (18.2%) | 9 (16.4%) | 53 (66.3%) | |
| Body mass index (kg/m2) BMI | 35.7 ± 4.2 | 35.4 ± 4.2 | 35.11 ± 6.1 | 25.99 ± 3.2 | a 0.00 b 0.00 c 0.677 |
| Total cholesterol (mg/dL) | 285.14 ± 35.4 | 291.36 ± 43.2 | 300.91 ± 68.7 | 176.63 ± 84.9 | a 0.00 b 0.00 c 0.479 |
| LDLc (mg/dL) | 200.14 ± 32.3 | 202.73 ± 35.2 | 212.31 ± 60.5 | 126.15 ± 64.5 | a 0.00 b 0.00 c 0.495 |
| HDLc (mg/dL) | 34.64 ± 10 | 28.82 ± 7.3 | 28.80 ± 8.1 | 53.49 ± 20.9 | a 0.00 b 0.00 c 0.226 |
| Total triglycerides (mg/dL) | 259.29 ± 76 | 268.18 ± 61.7 | 288.45 ± 74.8 | 163.91 ± 92.6 | a 0.00 ** b 0.00 ** c 0.247 |
| albumin creatinie ratio | 23.43 ± 4.2 | 25.27 ± 4.38 | 24.22 ± 4.9 | 19.04 ± 6.8 | a 0.011 * b 0.00 ** c 0.655 |
| AST (IU/L) | 58.85 ± 20.9 | 69.98 ± 39.3 | 74.43 ± 43.9 | 48.13 ± 18.9 | a 0.241 b 0.00 ** c 0.1 |
| ALT (IU/L) | 37.21 ± 20 | 47.300 ± 24.28 | 57.78 ± 41.28 | 33.96 ± 16.4 | a 0.692 b 0.00 ** c 0.016 * |
| Total bilirubin (mg/dL) | 2.01 ± 0.6 | 2.74 ± 0.4 | 2.9 ± 1 | 1.57 ± 1.3 | a 0.187 b 0.00 ** c 0.005 ** |
| Direct bilirubin (mg/dL) | 1.21 ± 0.5 | 1.66 ± 0.2 | 1.7 ± 0.7 | 0.90 ± 0.4 | a 0.07 b 0.00 ** c 0.005 ** |
| Albumin (g/dL) | 3.14 ± 0.2 | 2.48 ± 0.4 | 2.3 ± 0.4 | 3.23 ± 0.3 | a 0.443 b 0.00 ** c 0.00 ** |
| Gamma glutammyl transferase (IU/L) | 38.73 ± 20.2 | 46 ± 26.4 | 73.9 ± 44.46 | 26.7 ± 20.76 | a 0.187 b 0.00 ** c 0.00 ** |
| alpha fetoprotein | 81.17 ± 85.4 | 160.13 ± 124.67 | 341.85 ± 534 | 17.26 ± 30.8 | a 0.448 b 0.00 ** c 0.007 ** |
| Fasting blood glucose (mg/dL) | 213.71 ± 87.5 | 183.18 ± 80.3 | 186.27 ± 83.7 | 143.02 ± 87 | a 0.005 ** b 0.004 ** c 0.286 |
| Glycated hemoglobin HbA1c (%) | 6.32 ± 2.4 | 6.72 ± 1.7 | 7.7 ± 1.7 | 6.2 ± 2.7 | a 0.496 b 0.00 ** c 0.039 * |
| HOMA IR | 6.5 ± 7.8 | 16.5 ± 8.1 | 18.15 ± 6.7 | 4.4 ± 6.1 | a 0.272 b 0.00 ** c 0.00 ** |
| Scoring and Grading | |||||
| NAFLD Score | N/A | N/A | N/A | --- | --- |
| NAFLD Score < −1.455 = F0F2 | 13 (92.9%) | 7 (63.6%) | 1 (1.8%) | ||
| NAFLD Score −1.455–0.675 | 1 (7.1%) | 3 (27.3%) | 6 (10.9%) | ||
| NAFLD Score > 0.675 = F3F4 | 0 (0.0%) | 1 (2%) | 48 (98%) | ||
| Fbrosis score | N/A | N/A | N/A | --- | --- |
| F0 to F1 Mild liver scaring | 14 (100%) | 8 (72.7%) | 3 (5.5%) | ||
| F2: Moderate liver scarring | 0 (0%) | 2 (18.2%) | 18 (32.7%) | ||
| F3: Severe liver scarring | 0 (0%) | 0 (0%) | 24 (43.6%) | ||
| F4: Advanced liver scarring (cirrhosis | 0 (0%) | 0 (0%) | 10 (18.2%) | ||
| steatosis grading | N/A | N/A | N/A | --- | --- |
| S1 mild steatosis | 0 (0.0%) | 10 (90.9%) | 1 (1.8%) | ||
| S2 moderate stetosis | 0 (0.0%) | 1 (9.1%) | 19 (34.5%) | ||
| S3 severe steatosis | 0 (0.0%) | 0 (0.0%) | 25 (63.6%) | ||
| S4 non steatosis | 14 (100%) | 0 (0.0%) | 0 (0.0%) | ||
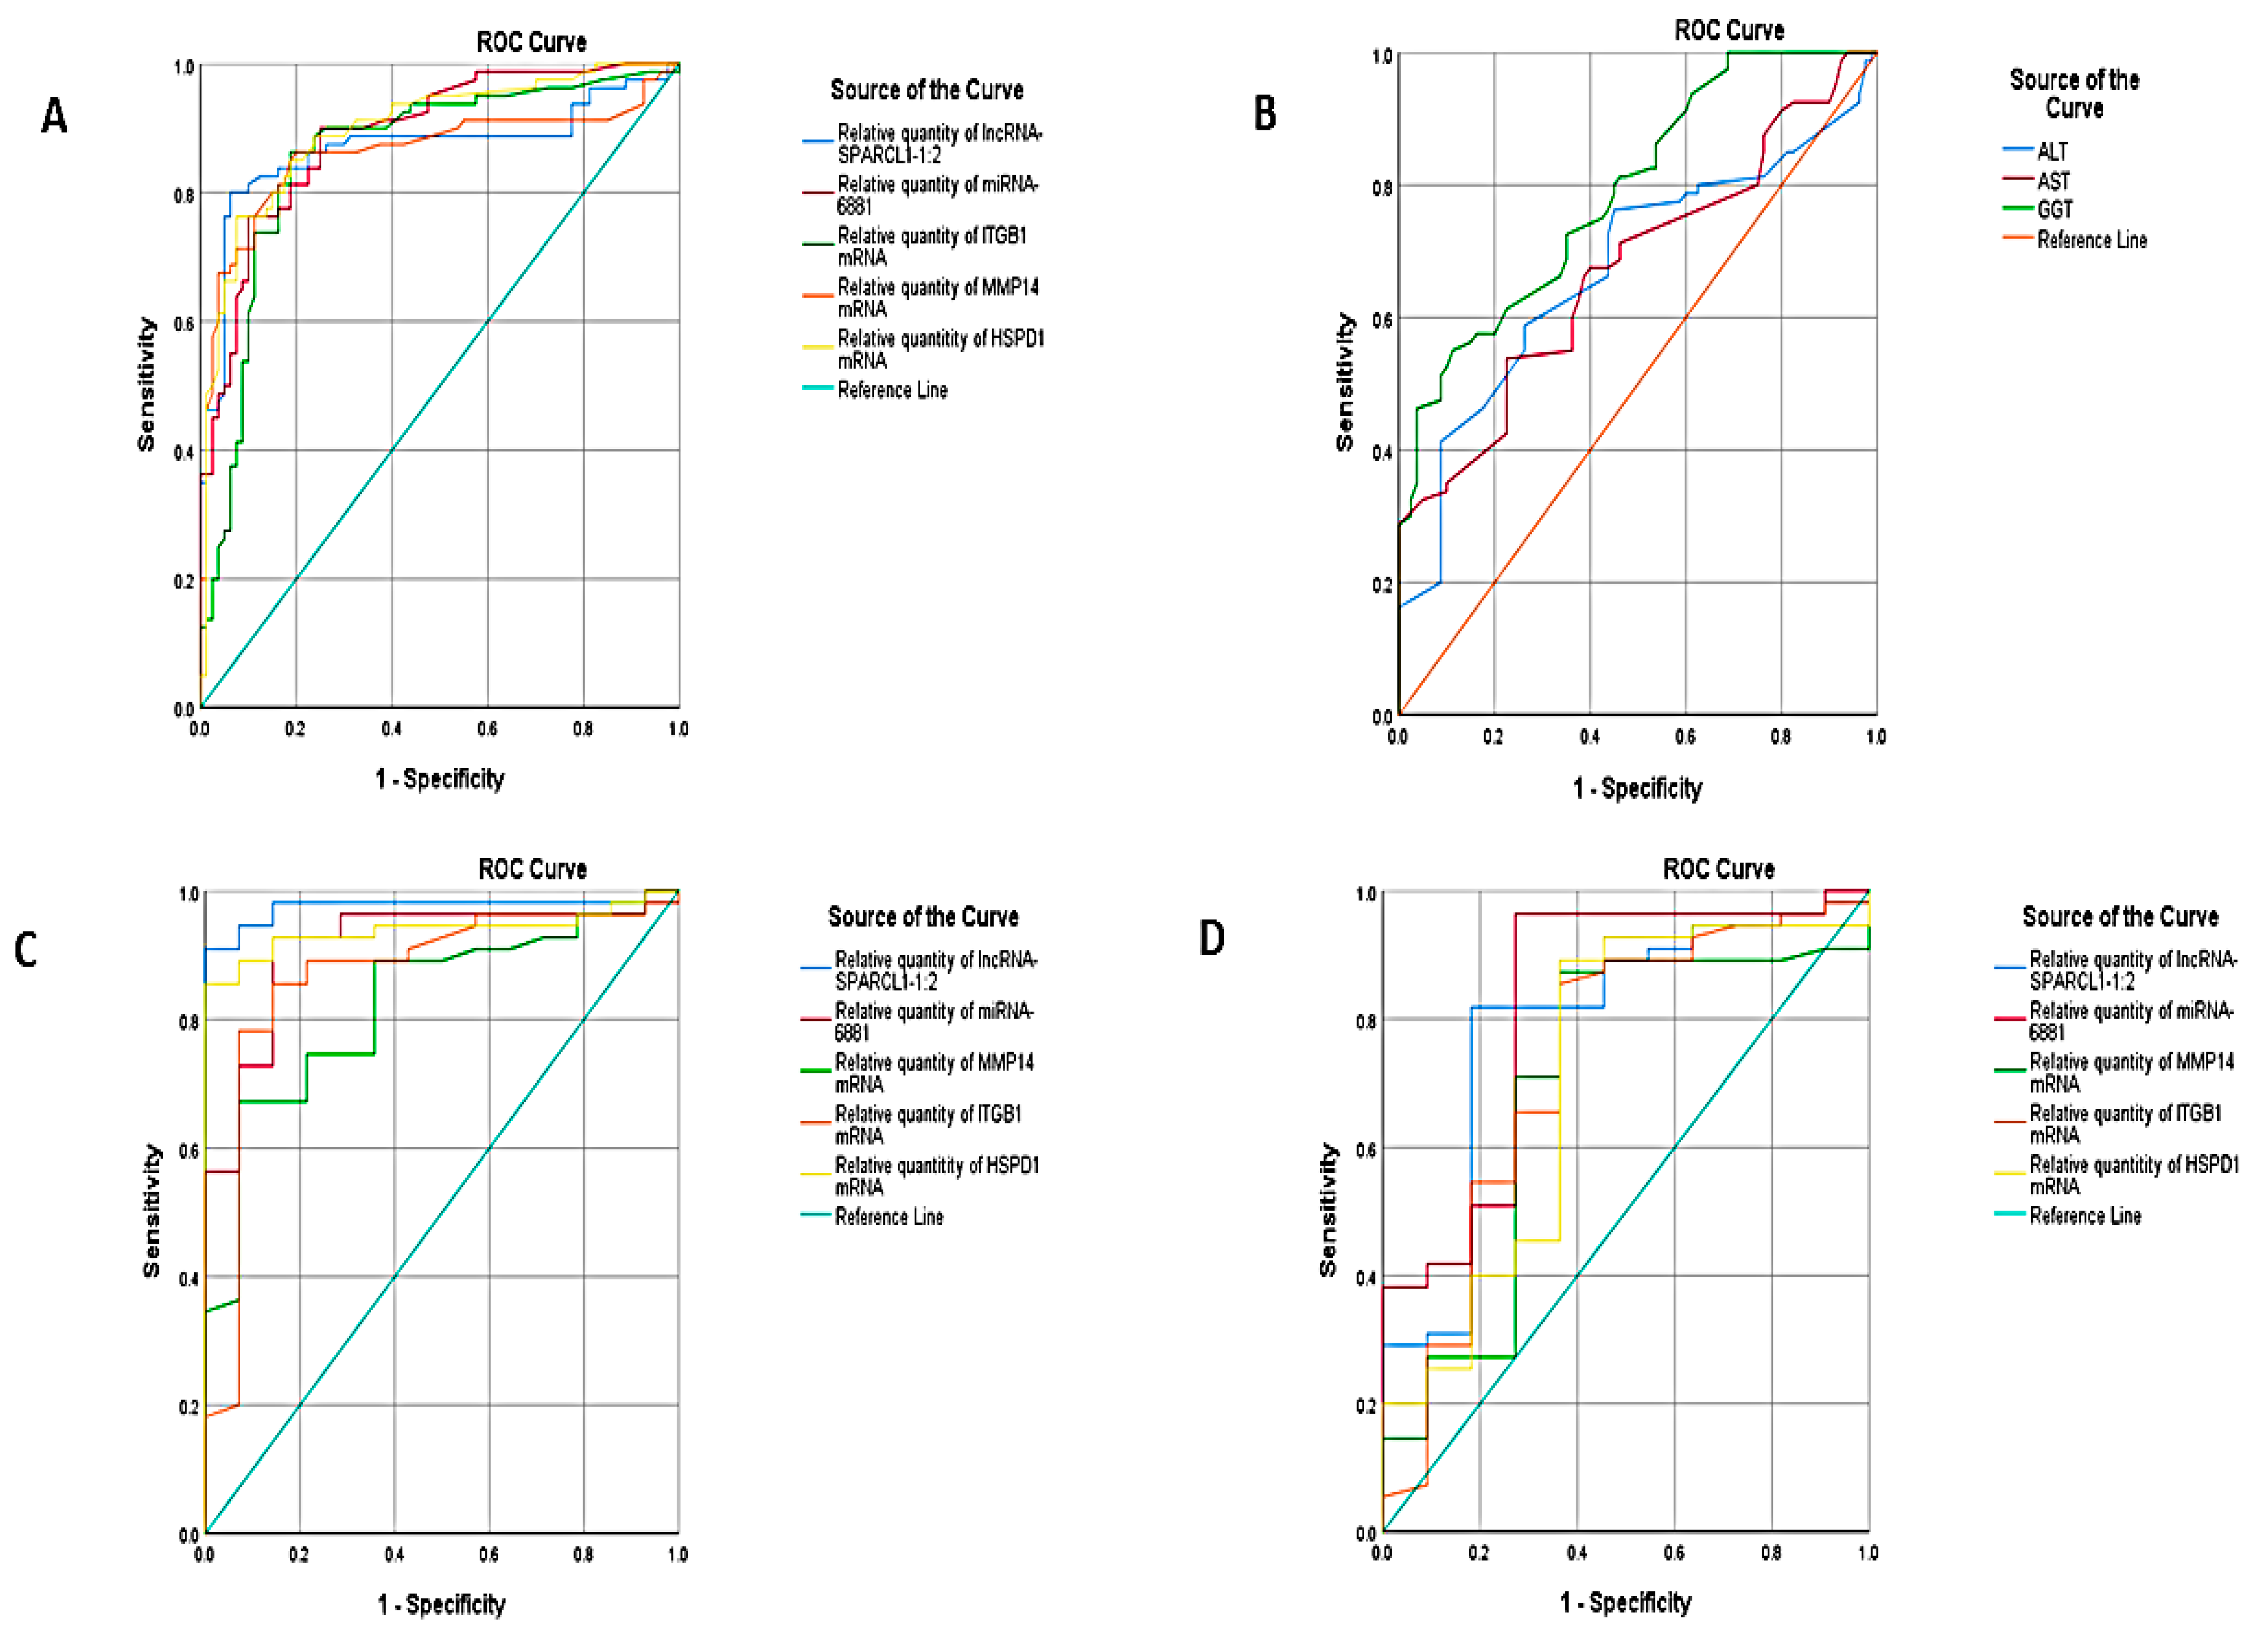
| Test Result Variable(s) | Area under Curve | Std. Error | Asymptotic Sig | Asymptotic 95% Confidence Interval | ||||
|---|---|---|---|---|---|---|---|---|
| Lower Bound | Upper Bound | Cutoff | Sensitivity | Specificity | ||||
| NAFLD versus healthy control | ||||||||
| Relative quantity of lncRNA-SPARCL1-1:2 | 0.870 | 0.032 | 0.000 | 0.807 | 0.932 | 4.45 | 83.8% | 83.8 |
| Relative quantity of miRNA-6881 | 0.891 | 0.025 | 0.000 | 0.842 | 0.940 | 1.65 | 90% | 72.5% |
| Relative quantity of ITGB1 mRNA | 0.858 | 0.032 | 0.000 | 0.796 | 0.920 | 1.75 | 90% | 70% |
| Relative quantity of MMP14 mRNA | 0.862 | 0.033 | 0.000 | 0.798 | 0.925 | 2.05 | 86.3 | 80 |
| Relative quantity of HSPD1 mRNA | 0.897 | 0.025 | 0.000 | 0.847 | 0.947 | 2.65 | 88.8 | 76.2 |
| ALT | 0.674 | 0.043 | 0.000 | 0.589 | 0.759 | 42 | 55% | 74% |
| AST | 0.674 | 0.043 | 0.000 | 0.590 | 0.757 | 57 | 53.8% | 77.5% |
| GGT | 0.790 | 0.035 | 0.000 | 0.722 | 0.858 | 42 | 61.3% | 82% |
| NASH versus NAFLD | ||||||||
| Relative quantity of lncRNA-SPARCL1-1:2 | 0.974 | 0.019 | 0.000 | 0.936 | 1.000 | 17.2 | 90% | 100 |
| Relative quantity of miRNA-6881 | 0.916 | 0.040 | 0.000 | 0.838 | 0.994 | 24.8 | 70.9% | 93.2 |
| Relative quantity of ITGB1 mRNA | 0.825 | 0.056 | 0.000 | 0.715 | 0.936 | 12.5 | 74% | 78% |
| Relative quantity of MMP14 mRNA | 0.868 | 0.059 | 0.000 | 0.752 | 0.984 | 11.3 | 78.2% | 78% |
| Relative quantity of HSPD1 mRNA | 0.939 | 0.029 | 0.000 | 0.883 | 0.995 | 5.3 | 89% | 93% |
| NASH versus Simple steatosis | ||||||||
| Relative quantity of lncRNA-SPARCL1-1:2 | 0.790 | 0.079 | 0.003 | 0.636 | 0.945 | 54.5 | 70% | 81% |
| Relative quantity of miRNA-6881 | 0.823 | 0.077 | 0.001 | 0.672 | 0.974 | 24.6 | 72% | 83% |
| Relative quantity of ITGB1 mRNA | 0.695 | 0.095 | 0.042 | 0.508 | 0.882 | 12.1 | 70% | 83% |
| Relative quantity of MMP14 mRNA | 0.730 | 0.094 | 0.017 | 0.545 | 0.914 | 20.3 | 65% | 83% |
| Relative quantity of HSPD1 mRNA | 0.712 | .096 | 0.027 | 0.525 | 0.900 | 9.4 | 85.5% | 63% |
| Predictors | Sig. | Exp(B) | 95% C.I. for EXP(B) | |
|---|---|---|---|---|
| Lower | Upper | |||
| sex | 0.683 | 1.254 | 0.423 | 3.713 |
| NAFLD scoring | 0.000 | 54.828 | 9.483 | 317.015 |
| grading of steatosis | 0.051 | 0.943 | 0.891 | 0.922 |
| fibrosis scoring | 0.04 | 0.955 | 0.877 | 0.891 |
| lncRNA-SPARCL1-1:2 | 0.006 | 0.958 | 0.929 | 0.988 |
| miRNA-6881 | 0.046 | 0.964 | 0.930 | 0.999 |
| ITGB1 mRNA | 0.087 | 1.014 | 0.998 | 1.029 |
| MMP14 mRNA | 0.015 | 0.965 | 0.937 | 0.993 |
| HSPD1 mRNA | 0.007 | 0.924 | 0.873 | 0.979 |
Publisher’s Note: MDPI stays neutral with regard to jurisdictional claims in published maps and institutional affiliations. |
© 2021 by the authors. Licensee MDPI, Basel, Switzerland. This article is an open access article distributed under the terms and conditions of the Creative Commons Attribution (CC BY) license (https://creativecommons.org/licenses/by/4.0/).
Share and Cite
Albadawy, R.; Agwa, S.H.A.; Khairy, E.; Saad, M.; El Touchy, N.; Othman, M.; Matboli, M. Clinical Significance of HSPD1/MMP14/ITGB1/miR-6881-5P/Lnc-SPARCL1-1:2 RNA Panel in NAFLD/NASH Diagnosis: Egyptian Pilot Study. Biomedicines 2021, 9, 1248. https://doi.org/10.3390/biomedicines9091248
Albadawy R, Agwa SHA, Khairy E, Saad M, El Touchy N, Othman M, Matboli M. Clinical Significance of HSPD1/MMP14/ITGB1/miR-6881-5P/Lnc-SPARCL1-1:2 RNA Panel in NAFLD/NASH Diagnosis: Egyptian Pilot Study. Biomedicines. 2021; 9(9):1248. https://doi.org/10.3390/biomedicines9091248
Chicago/Turabian StyleAlbadawy, Reda, Sara H. A. Agwa, Eman Khairy, Maha Saad, Naglaa El Touchy, Mohamed Othman, and Marwa Matboli. 2021. "Clinical Significance of HSPD1/MMP14/ITGB1/miR-6881-5P/Lnc-SPARCL1-1:2 RNA Panel in NAFLD/NASH Diagnosis: Egyptian Pilot Study" Biomedicines 9, no. 9: 1248. https://doi.org/10.3390/biomedicines9091248