Relationship between Levels of Pre-Stroke Physical Activity and Post-Stroke Serum Insulin-Like Growth Factor I

 ,
,
Abstract
:1. Introduction
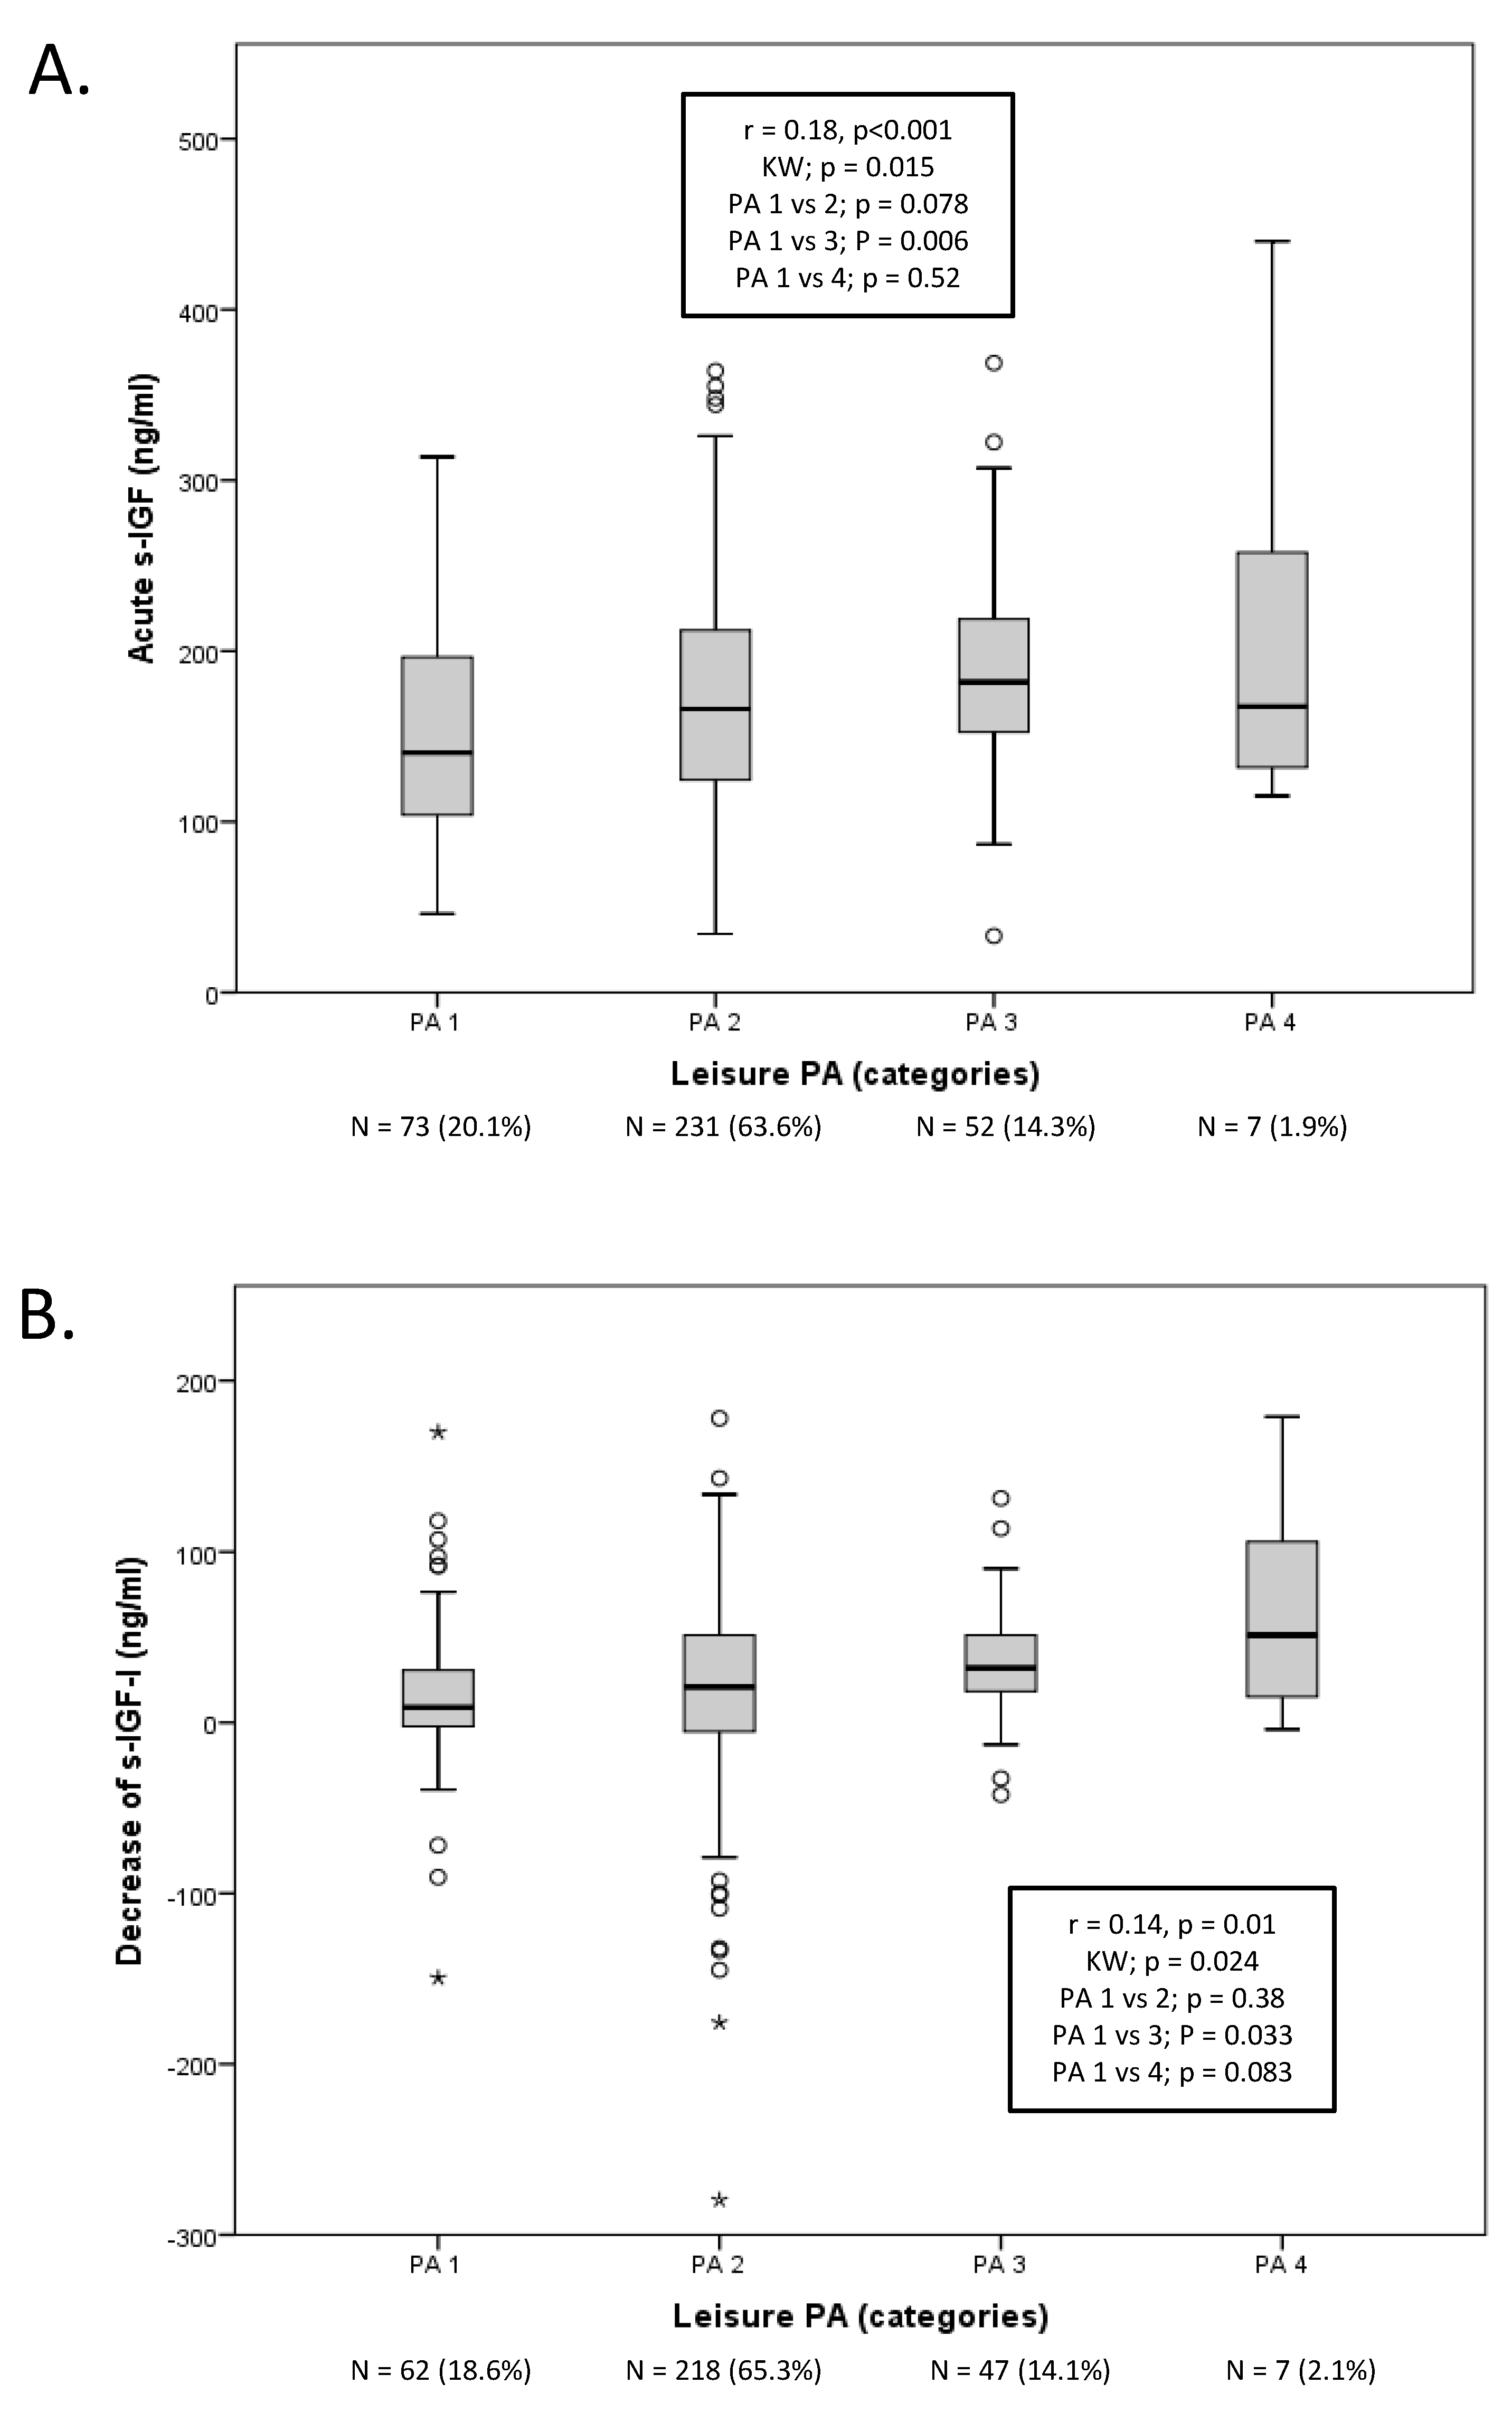
2. Results
Pre-stroke Physical Activity and Post-stroke s-IGF-I
3. Discussion
3.1. Physical Activity and s-IGF-I
3.2. Strengths and Limitations
4. Materials and Methods
4.1. Subjects and Design
4.2. Statistical Analysis
5. Conclusions
Supplementary Materials
Author Contributions
Funding
Acknowledgments
Conflicts of Interest
Abbreviations
| BMI | Body mass index |
| IGF-I | Insulin-like growth factor I |
| NIHSS | National Institutes of Health Stroke Scale |
| PA | Physical activity |
| SGPALS | Saltin-Grimby Physical Activity Level |
References
- Claesson, L.; Gosman-Hedström, G.; Johannesson, M.; Fagerberg, B.; Blomstrand, C. Resource utilization and costs of stroke unit care integrated in a care continuum: A 1-year controlled, prospective, randomized study in elderly patients: The Göteborg 70+ Stroke Study. Stroke 2000, 31, 2569–2577. [Google Scholar] [CrossRef] [Green Version]
- Åberg, N.D.; Brywe, K.G.; Isgaard, J. Aspects of growth hormone and insulin-like growth factor-I related to neuroprotection, regeneration, and functional plasticity in the adult brain. Sci. World J. 2006, 6, 53–80. [Google Scholar] [CrossRef] [PubMed] [Green Version]
- Denti, L.; Annoni, V.; Cattadori, E.; Salvagnini, M.A.; Visioli, S.; Merli, M.F.; Corradi, F.; Ceresini, G.; Valenti, G.; Hoffman, A.R.; et al. Insulin-like growth factor 1 as a predictor of ischemic stroke outcome in the elderly. Am. J. Med. 2004, 117, 312–317. [Google Scholar] [CrossRef] [PubMed]
- Bondanelli, M.; Ambrosio, M.R.; Onofri, A.; Bergonzoni, A.; Lavezzi, S.; Zatelli, M.C.; Valle, D.; Basaglia, N.; degli Uberti, E.C. Predictive value of circulating insulin-like growth factor I levels in ischemic stroke outcome. J. Clin. Endocrinol. Metab. 2006, 91, 3928–3934. [Google Scholar] [CrossRef] [PubMed] [Green Version]
- Åberg, D.; Jood, K.; Blomstrand, C.; Jern, C.; Nilsson, M.; Isgaard, J.; Aberg, N.D. Serum IGF-I levels correlate to improvement of functional outcome after ischemic stroke. J. Clin. Endocrinol. Metab. 2011, 96, E1055–E1064. [Google Scholar] [CrossRef] [Green Version]
- De Smedt, A.; Brouns, R.; Uyttenboogaart, M.; De Raedt, S.; Moens, M.; Wilczak, N.; Luijckx, G.J.; De Keyser, J. Insulin-like growth factor I serum levels influence ischemic stroke outcome. Stroke 2011, 42, 2180–2185. [Google Scholar] [CrossRef] [Green Version]
- Åberg, N.D.; Åberg, D.; Jood, K.; Nilsson, M.; Blomstrand, C.; Kuhn, H.G.; Svensson, J.; Jern, C.; Isgaard, J. Altered levels of circulating insulin-like growth factor I (IGF-I) following ischemic stroke are associated with outcome—A prospective observational study. BMC Neurol. 2018, 18, 106. [Google Scholar] [CrossRef]
- Johnsen, S.P.; Hundborg, H.H.; Sørensen, H.T.; Orskov, H.; Tjønneland, A.; Overvad, K.; Jørgensen, J.O. Insulin-like growth factor (IGF) I, -II, and IGF binding protein-3 and risk of ischemic stroke. J. Clin. Endocrinol. Metab. 2005, 90, 5937–5941. [Google Scholar] [CrossRef]
- Landin-Wilhelmsen, K.; Wilhelmsen, L.; Lappas, G.; Rosén, T.; Lindstedt, G.; Lundberg, P.A.; Bengtsson, B.A. Serum insulin-like growth factor I in a random population sample of men and women: Relation to age, sex, smoking habits, coffee consumption and physical activity, blood pressure and concentrations of plasma lipids, fibrinogen, parathyroid hormone and osteocalcin. Clin. Endocrinol. 1994, 41, 351–357. [Google Scholar]
- Parekh, N.; Roberts, C.B.; Vadiveloo, M.; Puvananayagam, T.; Albu, J.B.; Lu-Yao, G.L. Lifestyle, anthropometric, and obesity-related physiologic determinants of insulin-like growth factor-1 in the Third National Health and Nutrition Examination Survey (1988–1994). Ann. Epidemiol. 2010, 20, 182–193. [Google Scholar] [CrossRef]
- Mattlage, A.E.; Rippee, M.A.; Sandt, J.; Billinger, S.A. Decrease in Insulin-Like Growth Factor-1 and Insulin-Like Growth Factor-1 Ratio in the First Week of Stroke Is Related to Positive Outcomes. J. Stroke Cereb. Dis. 2016, 25, 1800–1806. [Google Scholar] [CrossRef] [PubMed] [Green Version]
- Schwab, S.; Spranger, M.; Krempien, S.; Hacke, W.; Bettendorf, M. Plasma insulin-like growth factor I and IGF binding protein 3 levels in patients with acute cerebral ischemic injury. Stroke 1997, 28, 1744–1748. [Google Scholar] [CrossRef] [PubMed]
- Rist, P.M.; Capistrant, B.D.; Mayeda, E.R.; Liu, S.Y.; Glymour, M.M. Physical activity, but not body mass index, predicts less disability before and after stroke. Neurology 2017, 88, 1718–1726. [Google Scholar] [CrossRef] [Green Version]
- Oberlin, L.E.; Waiwood, A.M.; Cumming, T.B.; Marsland, A.L.; Bernhardt, J.; Erickson, K.I. Effects of Physical Activity on Poststroke Cognitive Function: A Meta-Analysis of Randomized Controlled Trials. Stroke 2017, 48, 3093–3100. [Google Scholar] [CrossRef] [PubMed]
- Carro, E.; Trejo, J.L.; Busiguina, S.; Torres-Aleman, I. Circulating insulin-like growth factor I mediates the protective effects of physical exercise against brain insults of different etiology and anatomy. J. Neurosci. Off. J. Soc. Neurosci. 2001, 21, 5678–5684. [Google Scholar] [CrossRef] [Green Version]
- Jood, K.; Ladenvall, C.; Rosengren, A.; Blomstrand, C.; Jern, C. Family history in ischemic stroke before 70 years of age: The Sahlgrenska Academy Study on Ischemic Stroke. Stroke 2005, 36, 1383–1387. [Google Scholar] [CrossRef] [PubMed] [Green Version]
- Olsson, S.; Jood, K.; Blomstrand, C.; Jern, C. Genetic variation on chromosome 9p21 shows association with the ischaemic stroke subtype large-vessel disease in a Swedish sample aged ≤70. Eur. J. Neurol. 2011, 18, 365–367. [Google Scholar] [CrossRef] [PubMed]
- Gatti, R.; De Palo, E.F.; Antonelli, G.; Spinella, P. IGF-I/IGFBP system: Metabolism outline and physical exercise. J. Endocrinol. Investig. 2012, 35, 699–707. [Google Scholar] [CrossRef]
- Nindl, B.C.; Santtila, M.; Vaara, J.; Hakkinen, K.; Kyrolainen, H. Circulating IGF-I is associated with fitness and health outcomes in a population of 846 young healthy men. Growth Horm. IGF Res. 2011, 21, 124–128. [Google Scholar] [CrossRef]
- Mattlage, A.E.; Rippee, M.A.; Abraham, M.G.; Sandt, J.; Billinger, S.A. Estimated Prestroke Peak VO2 Is Related to Circulating IGF-1 Levels during Acute Stroke. Neurorehabil. Neural Repair 2017, 31, 65–71. [Google Scholar] [CrossRef] [Green Version]
- Reinholdsson, M.; Palstam, A.; Sunnerhagen, K.S. Prestroke physical activity could influence acute stroke severity (part of PAPSIGOT). Neurology 2018, 91, e1461–e1467. [Google Scholar] [CrossRef] [PubMed] [Green Version]
- Ursin, M.H.; Ihle-Hansen, H.; Fure, B.; Tveit, A.; Bergland, A. Effects of premorbid physical activity on stroke severity and post-stroke functioning. J. Rehabil. Med. 2015, 47, 612–617. [Google Scholar] [CrossRef] [PubMed] [Green Version]
- Saltin, B.; Grimby, G. Physiological analysis of middle-aged and old former athletes. Comparison with still active athletes of the same ages. Circulation 1968, 38, 1104–1115. [Google Scholar] [CrossRef] [PubMed] [Green Version]
- Gray, L.J.; Ali, M.; Lyden, P.D.; Bath, P.M.; VISTA Collaboration. Interconversion of the National Institutes of Health Stroke Scale and Scandinavian Stroke Scale in acute stroke. J. Stroke Cerebrovasc. Dis. 2009, 18, 466–468. [Google Scholar] [CrossRef] [PubMed] [Green Version]


| Parameter | Value | Subjects | Missing | Correlation (vs. PA) | |
|---|---|---|---|---|---|
| N | N (%) | r | p | ||
| Patients with stroke (N) | 380 | 380 | 0 (0) | N/A | N/A |
| Age, years, median (IQR) | 57.0 (49.8–63.0) | 380 | 0 (0) | −0.07 | 0.13 |
| Male/female, N (male %) | 241/139 (63.4) | 380 | 0 (0) | −0.091 | 0.078 |
| History of stroke, N (%) | 71 (18.6) | 380 | 0 (0) | −0.152 | 0.006 |
| History of cardiovascular disease, N (%) | 117 (30.7) | 380 | 0 (0) | −0.018 | 0.75 |
| BMI, kg/m2, median (IQR) | 25.7 (23.6–28.7) | 377 | 3 (0.8) | −0.122 | 0.018 |
| Diabetes, N (%) | 70 (18.4) | 380 | 0 (0) | −0.179 | <0.001 |
| Hypertension, N (%) | 206 (54.2) | 376 | 4 (1.1) | −0.051 | 0.32 |
| Current smoking, N (%) | 147 (38.7) | 380 | 0 (0) | −0.164 | 0.001 |
| LDL, mmol/L, median (IQR) | 3.3 (2.6–4.0) | 342 | 38 (10) | −0.015 | 0.79 |
| Imputed LDL, mmol/L, median (IQR) | 3.3 (2.7–3.9) | 380 | 0 (0) | −0.016 | 0.76 |
| 3-month mRS, median (IQR) | 2 (1–2) | 359 | 21 (5.5) | −0.029 | 0.59 |
| PA, median (IQR) | 2 (2–2) | 380 | 0 (0) | N/A | N/A |
| PA 1, N (%) | 3.54 (1.6–9.56) | 76 (20.0) | 0 (0) | N/A | N/A |
| PA 2, N (%) | 2.46 (0.74–6.33) | 239 (62.9) | 0 (0) | N/A | N/A |
| PA 3, N (%) | 2.46 (1.6–10.2) | 57 (15.0) | 0 (0) | N/A | N/A |
| PA 4, N (%) | 2.46 (1.82–12.35) | 8 (2.1) | 0 (0) | N/A | N/A |
| Stroke severity, NIHSS, median (IQR) | 2.89 (1.17–7.62) | 380 | 0 (0) | −0.017 | 0.75 |
| Type of s-IGF-I/Regression Model | B Per Increase in PA (B = ng/mL s-IGF-I) | p | N (PA1–4) | Partial Correlation |
|---|---|---|---|---|
| Baseline s-IGF-I level | ||||
| Model 1 [PA/A/S] | 12.9 (2.52–21.9) | 0.014 | 363 | 0.13 |
| Model 2 [PA/A/S/history] | 12.1 (2.34–21.8) | 0.015 | 363 | 0.13 |
| Model 3 [PA/A/S/history/B/C] | 9.7 (−0.33–19.8) | 0.058 | 356 | 0.10 |
| Model 4 [PA/A/S/history/B/C/I] | 9.7 (−0.38–19.7) | 0.059 | 356 | 0.10 |
| Change in s-IGF-I level (ΔIGF-I) | ||||
| Model 1 [PA/A/S] | 8.9 (0.29–17.5) | 0.043 | 334 | 0.11 |
| Model 2 [PA/A/S/history] | 9.3 (0.62–18.0) | 0.036 | 334 | 0.12 |
| Model 3 [PA/A/S/history/B/C] | 9.2 (0.36–18.0) | 0.041 | 332 | 0.11 |
| Model 4 [PA/A/S/history/B/C/I] | 9.7 (1.1–18.4) | 0.028 | 332 | 0.12 |
© 2020 by the authors. Licensee MDPI, Basel, Switzerland. This article is an open access article distributed under the terms and conditions of the Creative Commons Attribution (CC BY) license (http://creativecommons.org/licenses/by/4.0/).
Share and Cite
Åberg, N.D.; Gadd, G.; Åberg, D.; Hällgren, P.; Blomstrand, C.; Jood, K.; Nilsson, M.; Walker, F.R.; Svensson, J.; Jern, C.; et al. Relationship between Levels of Pre-Stroke Physical Activity and Post-Stroke Serum Insulin-Like Growth Factor I. Biomedicines 2020, 8, 52. https://doi.org/10.3390/biomedicines8030052
Åberg ND, Gadd G, Åberg D, Hällgren P, Blomstrand C, Jood K, Nilsson M, Walker FR, Svensson J, Jern C, et al. Relationship between Levels of Pre-Stroke Physical Activity and Post-Stroke Serum Insulin-Like Growth Factor I. Biomedicines. 2020; 8(3):52. https://doi.org/10.3390/biomedicines8030052
Chicago/Turabian StyleÅberg, N. David, Gustaf Gadd, Daniel Åberg, Peter Hällgren, Christian Blomstrand, Katarina Jood, Michael Nilsson, Fredrick R. Walker, Johan Svensson, Christina Jern, and et al. 2020. "Relationship between Levels of Pre-Stroke Physical Activity and Post-Stroke Serum Insulin-Like Growth Factor I" Biomedicines 8, no. 3: 52. https://doi.org/10.3390/biomedicines8030052