Article

Gender-Specific Interactions in a Visual Object Recognition Task in Persons with Opioid Use Disorder

1
Department of Psychology, Brigham Young University, Provo, UT 84602, USA
2
Department of Neuroscience, Noorda College of Osteopathic Medicine, Provo, UT 84606, USA
3
PhotoPharmics, Inc., 947 So, 500 E, Suite 100, American Fork, UT 84003, USA
*
Author to whom correspondence should be addressed.
Biomedicines 2023, 11(9), 2460; https://doi.org/10.3390/biomedicines11092460
Submission received: 31 July 2023 / Revised: 26 August 2023 / Accepted: 30 August 2023 / Published: 5 September 2023
(This article belongs to the Special Issue Dopamine Signaling Pathway in Health and Disease)

Abstract

:
Opioid use disorder (OUD)-associated overdose deaths have reached epidemic proportions worldwide over the past two decades, with death rates for men reported at twice the rate for women. Using a controlled, cross-sectional, age-matched (18–56 y) design to better understand the cognitive neuroscience of OUD, we evaluated the electroencephalographic (EEG) responses of male and female participants with OUD vs. age- and gender-matched non-OUD controls during a simple visual object recognition Go/No-Go task. Overall, women had significantly slower reaction times (RTs) than men. In addition, EEG N200 and P300 event-related potential (ERP) amplitudes for non-OUD controls were significantly larger for men, while their latencies were significantly shorter than for women. However, while N200 and P300 amplitudes were not significantly affected by OUD for either men or women in this task, latencies were also affected differentially in men vs. women with OUD. Accordingly, for both N200 and P300, male OUD participants exhibited longer latencies while female OUD participants exhibited shorter ones than in non-OUD controls. Additionally, robust oscillations were found in all participants during a feedback message associated with performance in the task. Although alpha and beta power during the feedback message were significantly greater for men than women overall, both alpha and beta oscillations exhibited significantly lower power in all participants with OUD. Taken together, these findings suggest important gender by OUD differences in cognitive processing and reflection of performance in this simple visual task.

1. Introduction

Substance use disorders (SUDs) and addictions [1,2,3,4] are recognized as complex, chronically relapsing disorders of brain function and cognitive processing that are still not well understood and are commonly undertreated [3,5,6,7,8,9,10]. Ongoing research indicates that these neurobiological disorders often begin with recreational use that deteriorates into compulsive and self-destructive drug-seeking behaviors despite intentional and repeated efforts by the individual to stop [1,3,11,12,13,14]. Accordingly, the 2019 US Centers for Disease Control (CDC) and the Department of Substance Abuse and Mental Health Services Administration (SAMHSA) reported that nearly 20.4 million Americans 12 years and older struggled with some type of SUD, yet less than 20% received treatment [15]. Alarmingly, estimates also suggest that the annual economic societal costs for US citizen struggling with opioid use disorder (OUD) are between 78.5 and 504 billion USD when considering loss of future family income, and 2.8% of the GDP when considering health care costs, unemployment, and lost potential and productivity brought about by the premature death caused by OUD [12,15,16,17,18,19,20]. Such costs may be even greater in future years, given that the opioid epidemic especially affects adults of prime working age (25–54 years), and mortality rates from overdoses more than tripled between 1999 and 2018 [21]. In 2021, the National Institute of Drug Abuse (NIDA) reported that more than 106,000 people in the US had died that year from drug-involved overdoses, including illicit drugs and prescription opioids [22,23]. Most reported deaths involved fentanyl, a powerful synthetic opioid that is similar to morphine, but is 50 to 100 times more potent [22,23]. Young-adult men (ages 25–39; urban and rural alike) have been affected the most by this opioid overdose epidemic, with their death rate at least double that of women in the same age group [21,22]. This discrepancy in mortality may suggest that physiological and/or psychological sex differences differentially inform response to opiates and associated withdrawal.
For the purposes of this study, the terms “women” and/or “men” or “female” and/or “male” are used interchangeably and refer to the biological sex and/or gender that our participants identified with at the time of this study. Discussion and research on the influence of biological sex or gender-specific differences on neural substrates that may influence cognitive responses to alcohol and other drugs (AOD) of abuse [24,25,26], including opiate/opioids [27,28,29], has historically been limited. However, with it now known that there is such biological diversity in those at risk for substance abuse or predisposition for opioid tolerance, dependence, and lethal OUD, and knowing that opioid overdose deaths happen in men at twice the rate of women, there is a great need for improved research in how treatment best works in SUDs [21,22]. Such research can inform evidence-based and individualized addiction treatment plans, which recognize any biological sex or gender-specific differences in the effects of certain drugs for males as opposed to females, including differences observed in individuals with opiate-related SUDs [28,30,31,32,33,34,35,36,37,38,39,40,41,42,43,44,45,46,47,48,49,50].
We aimed to expand this research in OUDs by observing potential gender-specific neurobiological differences in the visual cognitive processing of a simple Go/No-Go visual object recognition task in men and women with and without opioid use. Non-invasive electroencephalographic (EEG) scalp recordings with the accompanying analysis of visual evoked potentials (VEPs) and event-related potentials (ERP) are well-established neuroimaging techniques for recording brain function [51,52,53,54,55,56,57,58,59,60,61,62,63,64,65,66,67,68,69,70,71,72,73,74]. There is also hope that any chronic cognitive wavelength deficits and/or changes found in long-term substance use and subsequent SUDs can be recovered with detoxification efforts and ongoing recovery maintenance by the individual [62,64,67,75,76,77,78,79,80,81,82,83,84,85]. However, despite many studies measuring and documenting the maladaptive effects of chronic alcohol use disorder (AUD) via P300 ERPs [84], there are still few studies that measure this for other SUDs, including OUD [85]. Age-matched participants with no history of OUD (non-OUD) were compared to recently detoxified individuals with diagnosed OUD who were still in the addictive state of OUD craving and withdrawal while receiving in-patient treatment [64,81,84,86,87]. While collecting the EEG data, we also questioned whether reaction times (RT) would be another useful variable with measurable gender-specific differences when using our techniques and protocols. We hypothesized that there would be gender-OUD interactions for ERPs in this simple visual task.

2. Materials and Methods

2.1. Participants

The current study was designed specifically to obtain EEG measures of gender-specific differences in OUD [1,3]. All non-OUD control participants were recruited from the local community, including Brigham Young University (BYU), via Institutional Review Board (IRB)-approved announcements, word of mouth, and/or flyers. All subjects with OUD were recruited with the approval and help of the trained and licensed staff of a high-intensity residential and detoxification treatment facility in Utah, USA, adhering to 42 CFR Part 2 law [18]. This approved treatment center was a state-licensed, evidence-based detoxification and addiction rehabilitation center for the treatment of persons with or without mental health disorders co-occurring with SUDs and addiction, including OUD. The facility was required to meet the very stringent confidentiality and established regulations of the 1996 Health Insurance Portability and Accountability Act (HIPAA) [18] and provide SUD care according to the most current published American Society of Addiction Medicine (ASAM) Patient Placement Criteria. All diagnoses of OUD were based on the American Psychiatric Association’s (APA) Diagnostic Statistical Manual (DSM)-IV-TR development criteria [1,2]. However, it was understood that for the purposes of this study, the OUD cohort were all in various stages of withdrawal from their OUD, with time from last opioid use being as short as 24 h and no longer than 30 days out. Subjects ranged in age from 18 to 56 years. Once pre-screening self-report questionnaires were completed to ensure their basic good health, all participants from both cohorts were matched as closely as possible for age and gender [88] to yield the same mean age per group [84,88,89,90,91,92,93]: (1) Men with OUD (age range = 18–53 years); (2) women with OUD (age range = 18–51 years); (3) men with no-OUD as controls (age range = 17–53 years); and, (4) women with no-OUD as controls (age range = 18–56 years). After all EEG data were collected, only those data considered to be good quality were used in statistical analyses, as determined is best practice by at least 3 authors (see [87,94,95]). A final study sample size of 38 participants’ data was used in the four groups for this project: (1) Men with OUD (n = 10, age range = 20–53 years, M = 30, SD = 9); (2) women with OUD (n = 10, age range = 18–51 years, M = 30, SD = 12); (3) male controls with non-OUD (n = 9; age range = 21–46 years, M = 26, SD = 7); and (4) female controls (n = 9, age range = 18–56 years, M = 25, SD = 12). The mean age difference between participants with OUD and the non-OUD controls was four years.

2.2. Ethical Considerations

Strict adherence to ethical issues and research standards was maintained. All study procedures were approved by the Brigham Young University (BYU) Institutional Review Board (IRB) before recruitment started. Confidentiality and compliance met the 1996 Health Insurance Portability and Accountability Act (HIPAA) requirements for research data collected, and all clinical and research personnel were trained in confidentiality protocols and maintained the required Collaborative Institutional Training Initiative (CITI) certifications [96]. All personnel involved in the research project signed confidentiality agreements. Signed consent forms were also obtained from all participants prior to any testing. Subjects were then immediately given research identification numbers so their data could be anonymized. All electronic data were stripped of any unique identifiers (e.g., name, date of birth) and stored in a secure electronic database. No personally identifying information or data were entered into the multi-lab computer database or EEG console. All data entries were verified by two raters for accuracy.

2.3. Inclusion Criteria

Eligibility for each volunteer participant was initially established through a brief in-person interview with either a licensed staff member and/or a therapist at the recruiting treatment center or by a trained research assistant referring to an already established and approved Pre-Screening Checklist developed for the study. Participants with OUD were diagnosed following the DSM-IV-TR manual, were between ages 18–56 years, were detoxified from all substances including opioids but still experiencing severe daily craving for drugs, and had not used opioids in the past 24 h but were no longer than 30 days from opioid use. Inclusion criteria for non-OUD control participants required that there was no history of OUD or use of any opioid painkiller medication in the last three months or sleep aids in the past month, including no use of prescription painkillers or other mood- or mind-altering prescription drugs. Additional participation criteria for both groups were: male or female, age 18–56 years, no prior history of severe brain injury, seizure free, not prone to fainting, not claustrophobic, and willing to indicate all drug use on drug history sheet. Further, to ensure no current drug use confounding factors, a sample for urine analysis (UA) was required from all participants onsite at the time of testing. All UA samples were tested for a variety of drugs including opiates, marijuana/THC, cocaine, amphetamines, and benzodiazepines. No positive reports from the subsequent independent UA were obtained, and thus no participant data were excluded due to confounding substance exposure.

2.4. EEG Procedures

The current study is part of a 2 h assessment period session designed for comparing men and women with or without OUD in a controlled setting. This controlled session included a battery of standardized computerized and pencil-and-paper neuropsychological tests for assessment of cognitive processing capabilities and short-term memory tasks, and computerized paradigms coupled with EEG recordings. To limit EEG testing confounds as much as possible, all participants were tested for handedness and eye dominance, binocular rivalry, color vision deficiencies, and finger-tapping ability (for reaction time (RT) data collection). All participants also completed an online demographics/screening questionnaire prior to the EEG session to verify that they met the necessary study inclusion criteria. If all pre-qualification criteria were met, participants were scheduled immediately for their EEG session. To ensure that every participant was truly drug-free at the time of the study, rather than relying on self-report only, each participant provided a required urine sample for analysis (UA) before any testing continued. Each UA sample was immediately coded with their study ID number only and placed in a locked freezer in the lab until it could be transferred by the PI (J.P.)to the partner treatment center’s lab to be later tested for a variety of illicit drugs including opiates, marijuana/THC, cocaine, amphetamines, benzodiazepines, and phencyclidine (PCP). A positive UA would later indicate a need to discard participant data due to drugs in the system; there were no positive UAs found. All participants were again advised of their confidentiality rights and following consent. All other tests for the larger study were taken at the same time the UA sample was given [97].

2.5. Preparation for Evoked Potential Recording

Each participant’s head circumference was measured to determine the correct size EEG sensor net. To ensure a good cap fit, three different sizes of the 128-channel Geodesic EEG System™ (GES) HydroCel Geodesic Sensor Nets (HCGSN; Electrical Geodesics, Inc., Eugene, Oregon) were utilized in testing. The 10–20 placement system of the sensor net’s 128 electrodes was used for referencing points of the Average-Reference Mastoid Montage [98]. E-prime 3.0 software ® (Psychology Software Tools, Inc., Sharpsburg, PA, USA) was used for the computerized visual attention tasks with EEG data transmission to a closed-circuit computer monitor screen placed directly in front (68 cm) of the participant. All collected EEG data were sent to an observation screen being monitored outside of the sound-proofed, dimly lit, and electromagnetic-shielded EEG recording room.

2.6. Object Recognition Task

For this visual evoked potential (VEP) task, one object in the Relevant matrix of right-pointing arrows was an oddball “open” diamond symbol and one object in the Irrelevant matrix was a variation of a diamond and arrow. The Standard matrix had only right-facing arrows (see Figure 1 for example matrix). Before beginning the object recognition task, each participant was shown a sample visual stimulus on the computer screen and instructed to respond with a simple key press whenever the oddball “open” diamond was observed in the Relevant matrix. Visual evoked potentials (VEPs) were acquired in 2 s epochs 100 ms before the stimulus and 1900 ms after the stimulus for each visual presentation, with the three 3 × 3 matrices randomly presented at 2–4 s intervals during the 8 min recording session. In order to avoid errors of the gaze throughout the trial, the targeted symbols for each matrix were also randomly positioned on the computer screen. Regardless of the matrix presented, these oddball elements were readily distinguished by participants as a “pop-out” from the other eight elements of each matrix, even with very brief presentation to the participant (50 ms). Reaction times (RT) were measured from the time the stimulus was presented until the participant pressed the button. If the participant correctly detected the oddball target, the word “Correct” was displayed as feedback on the computer screen 500 ms after their reaction time, with their reaction time posted. When no target was presented and participants did not press a button, the words “No response detected” were shown on the screen at 900 ms after the stimulus presentation. An “Incorrect response” notice appeared if the participant inadvertently pressed the button when no target object was in the matrix.

2.7. Wavelet Analysis

Alpha and beta brain oscillation power values were also calculated by comparing individual frequency bands with the continuous wavelet analysis tool in Net Station 4.5.7® (Electrical Geodesics, Inc., 2013 (Computer Software), Eugene, OR, USA). A wavelet is a waveform similar to sine waves; however, it terminates at zero at each end. This allows the wavelet data analysis tool to decompose the waveform and calculate a power statistic at each time point for each wave’s frequency band of interest. Net Station 4.5.7® uses a Morlet wavelet, which is a symmetrical waveform created by multiplying a Gaussian envelope by a sine wave. Whenever a waveform is analyzed, there is a tradeoff between accuracy in the frequency scale and accuracy in the time scale. We used the default settings for the Net Station 4.5.7® wavelet tool (1.95–30.27 Hz, frequency step = 0.98, frequency scale factor = 5, window type = Cosinus, taper length = 0.10 s). Pre-processing involved 1–60 Hz bandpass filter, then segmentation (100 ms pre-stimulus to 1800 ms post-stimulus for a total of 1900 ms per segment), and finally baseline correction (100 ms pre-stimulus, 100 ms duration). The sampling rate was 250 Hz, so each 1900 ms segment (100 ms pre- + 1800 ms post-stimulus) included 475 time points. Therefore, the continuous wavelet analysis included 475 wavelet coefficients per segment. We exported the wavelet power coefficients to text files, organized and labeled the data using R (version 3.6.3) [99], and calculated statistics using SAS® (version 9.2) [100].

2.8. Statistical Analyses

As observed ERPs and feedback oscillations were most evident in the back of the head, the analysis was simplified to include only seven occipital electrodes: Oz, Pz, P1, P2, O1, O2, and POz. Amplitude and latency were measured for the within-participant average VEP components for the N100, P100, N200, P200, and P300 using Net Station 4.5.7® Data Analysis Tools (Electrical Geodesics, Inc., 2013 (Computer Software), Eugene, OR, USA). The quantitative electrophysiological data obtained through the EGI Data Analysis Tools® were analyzed using the SAS (r) Proprietary Software 9.4 (TS1M5) and its mixed model SAS/STAT® Proc Mixed 14.3 statistical analytics software program (SAS Institute Inc., Cary, NC, USA). This particular statistical program was developed to fit multilevel and hierarchical linear models and considered suitable for analyses of the “mixed” statistical data from the current study where data on individuals were nested within naturally occurring hierarchies such as men and women within the OUD cohort. A double-multivariate analysis of variance (MANOVA) approach was used to account for the several dependent variables (DVs) of the current study. This approach also used a typical MANOVA design for calculating a first set of independent variables (IVs), followed by a higher hierarchical analysis for a second set of IVs. The first set of IVs for our design included gender, OUD status, and gender-by-OUD status, nested within the second set of IVs: component, gender, and condition. Component included types of measurement, such as N200 and P300. Condition included different stimulus conditions: Standard, Irrelevant, and Relevant. In addition, Igor Pro 8.1® software (WaveMetrics, Lake Oswego, OR, USA) was used to present the data in graphic form, while measures of reaction times (RT) were analyzed using one-way analysis of variance (ANOVA).

3. Results

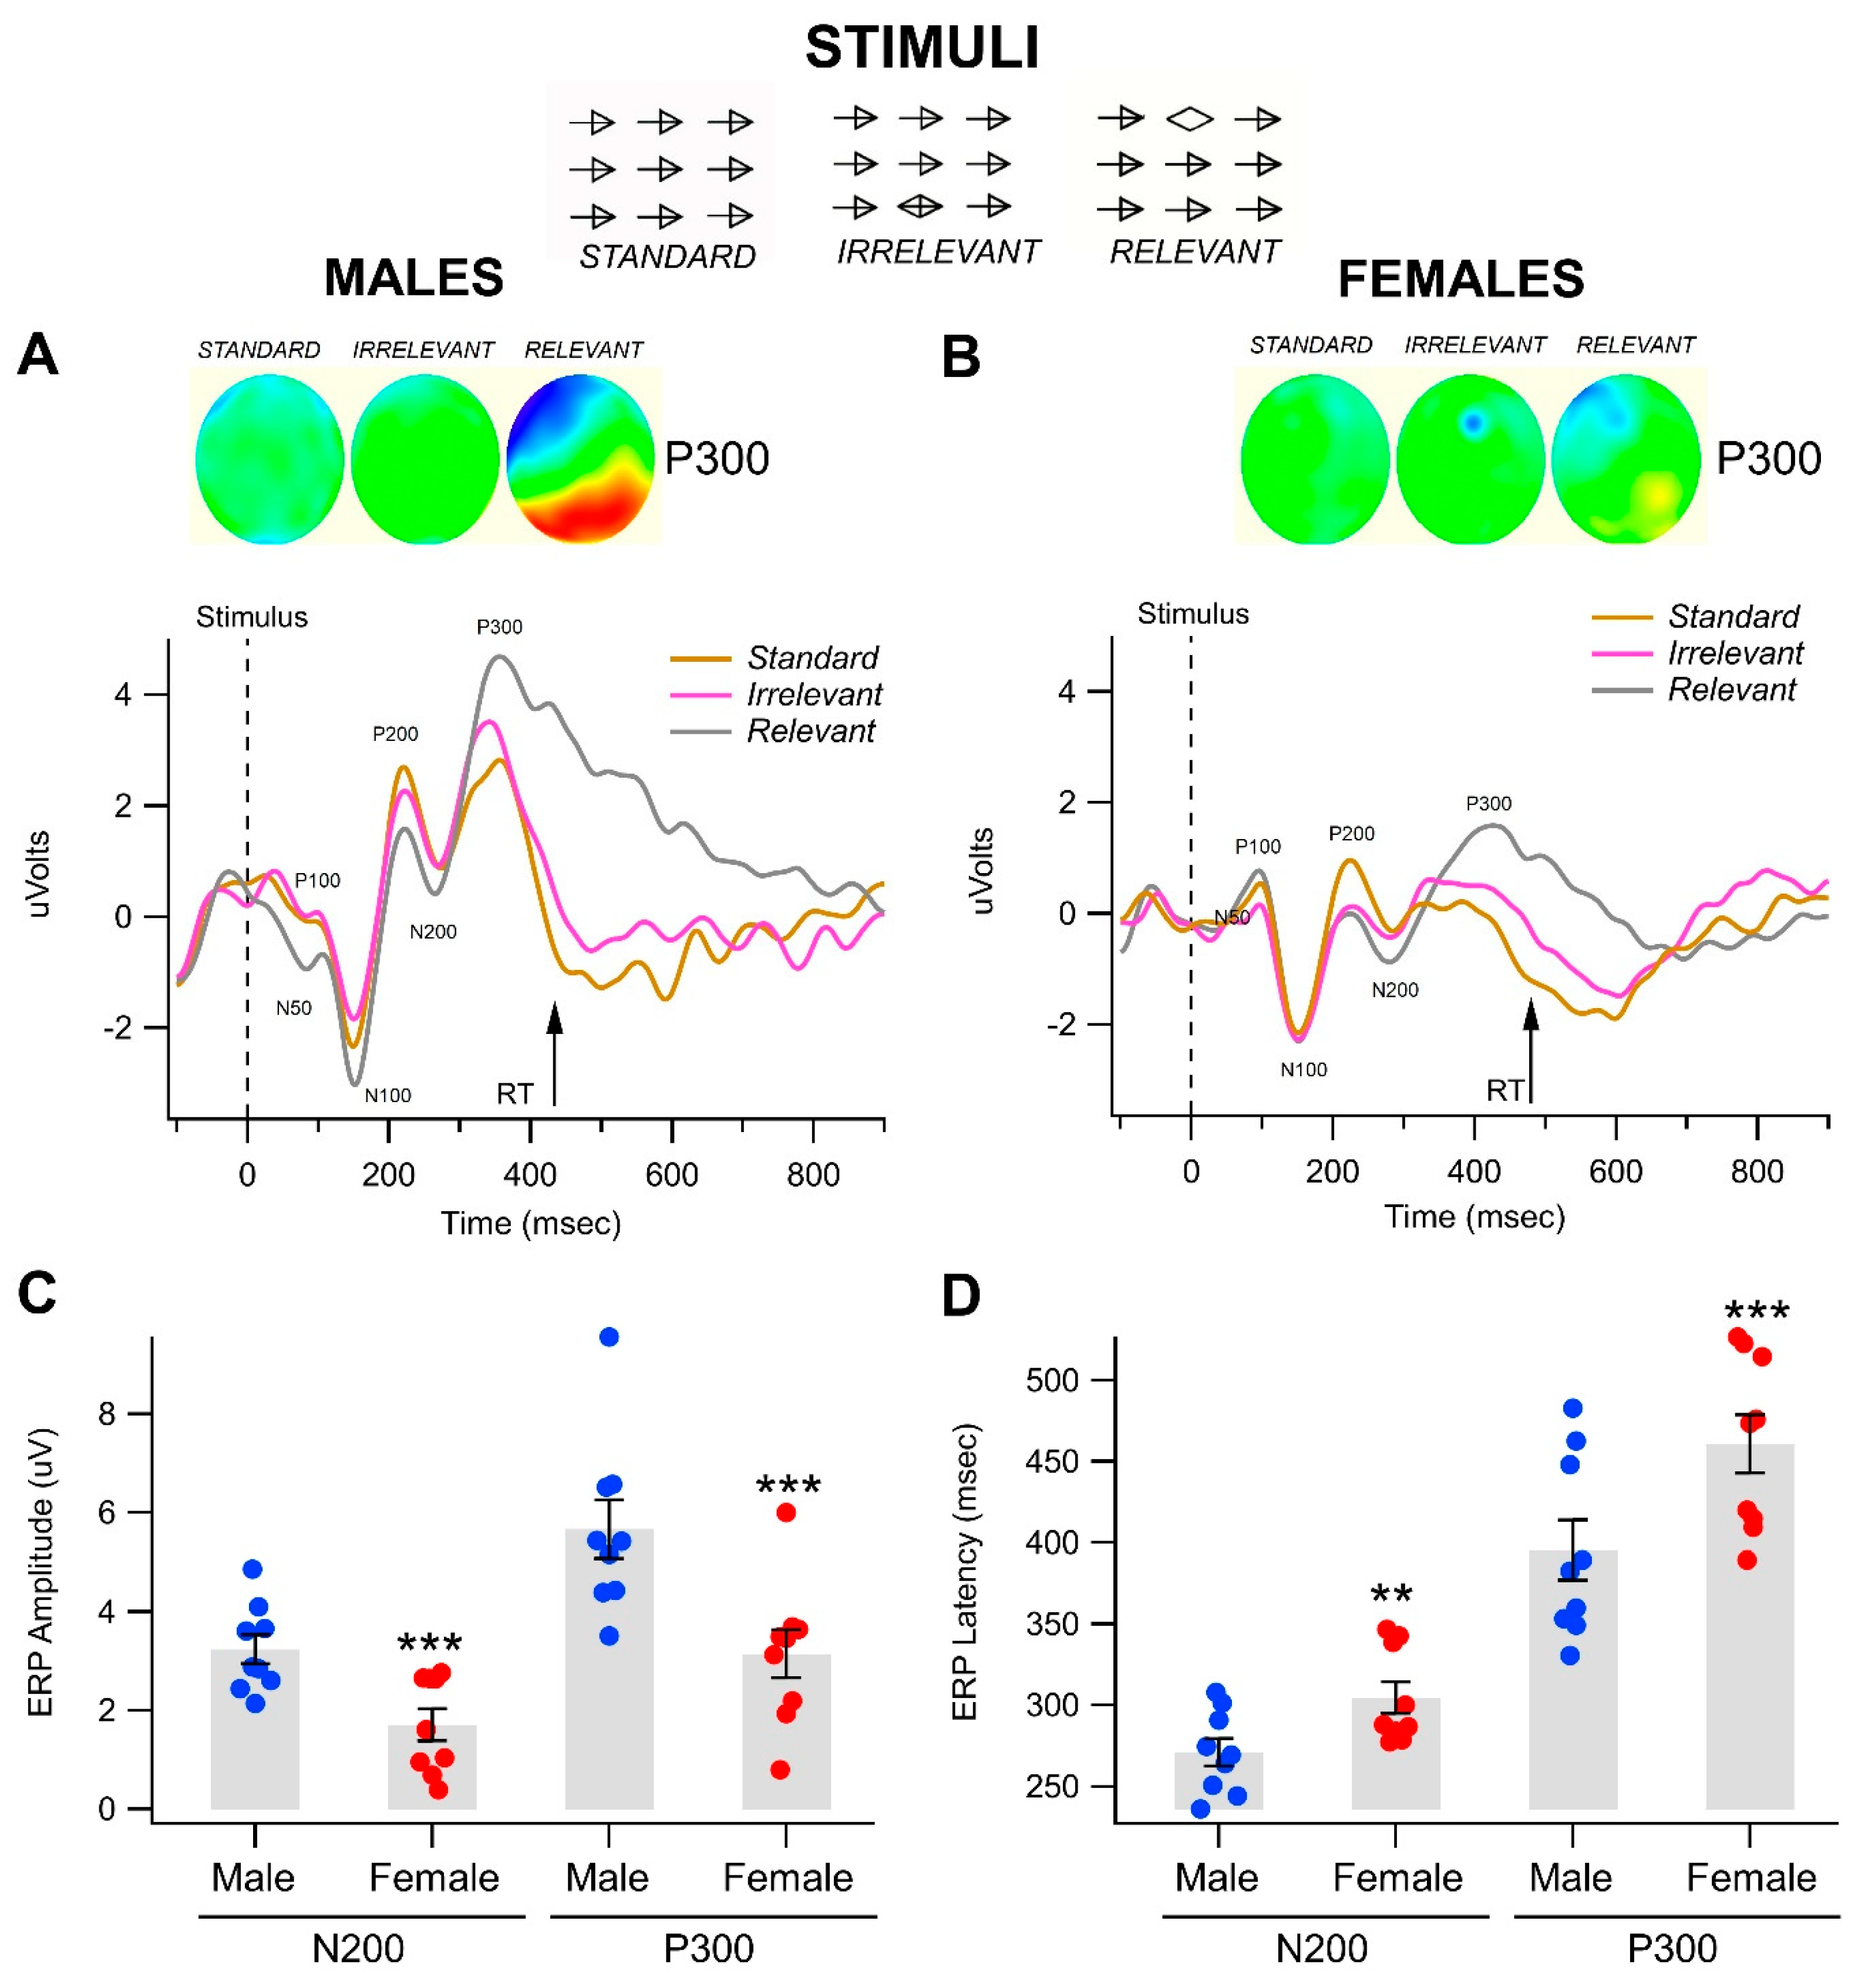
3.1. Gender-Related Differences in Event-Related Potentials in the Visual Object Recognition Task

Throughout the Go/No-Go object recognition task’s recording session, matrices of visual stimuli (see Standard, Irrelevant, and Relevant examples in Figure 1) were randomly presented at 2–4-s intervals for 50 ms durations. Figure 1 compares grand-averaged visual evoked potentials (VEPs) elicited by Standard, Irrelevant, and Relevant stimuli at the Pz electrode for both men (Figure 1A) and women overall (Figure 1B) (n = 19 for each group). Parietal and occipital electrode sites provided the most well-defined combination of early (i.e., task-independent) and late (task-dependent) components of the VEP, and ERPs were generated in this Go/No-Go task, as shown in the topo maps for each of the stimuli in both men and women participants (Figure 1A,B).
Statistical analyses showed no significant differences in the N100, P100, or the P200 between men and women. However, in line with previous studies on substance use and abuse, N200 and P300 amplitudes within the grand-averaged wave forms were more strongly associated with Relevant stimuli conditions than with Irrelevant or Standard conditions. This trend was especially notable in occipital and parietal areas. Stimuli-specific changes in such amplitudes can suggest that this simple visual task was able to effectively differentiate between cognitive states. Overall, women had significantly slower RTs compared to men (men: 434.2 ± 6.9 ms; women: 480.6 ± 11.5 ms; F(1,37) = 10.3, p = 0.003; n = 19 each; see Figure 1A,B). Thus, this simple visual oddball or pop-out object recognition task evinced robust differentiation of cognitive potentials, despite individual variations in latencies of N200 and P300 and RT across participants. While the grand-averaged VEPs and topo maps demonstrated differences between responses obtained with the Relevant stimulus, it should be noted that averaging waveforms often underestimates the significance of the effects because of many factors including temporal dispersion, differences in latencies between subjects, and so forth. Therefore, in an effort to ameliorate issues involving temporal dispersion and massive grand averaging, we measured components of the VEP in each participant separately with windowing and adaptive mean procedures and obtained individual measurements of amplitude and latency. (See Figure 1C,D, the distribution of amplitude and latency measurements for N200 and P300 for the Relevant stimulus at the posterior Pz electrode or all men vs. women participants as a representative example.) MANOVA revealed a significant overall effect of gender (Table 1).

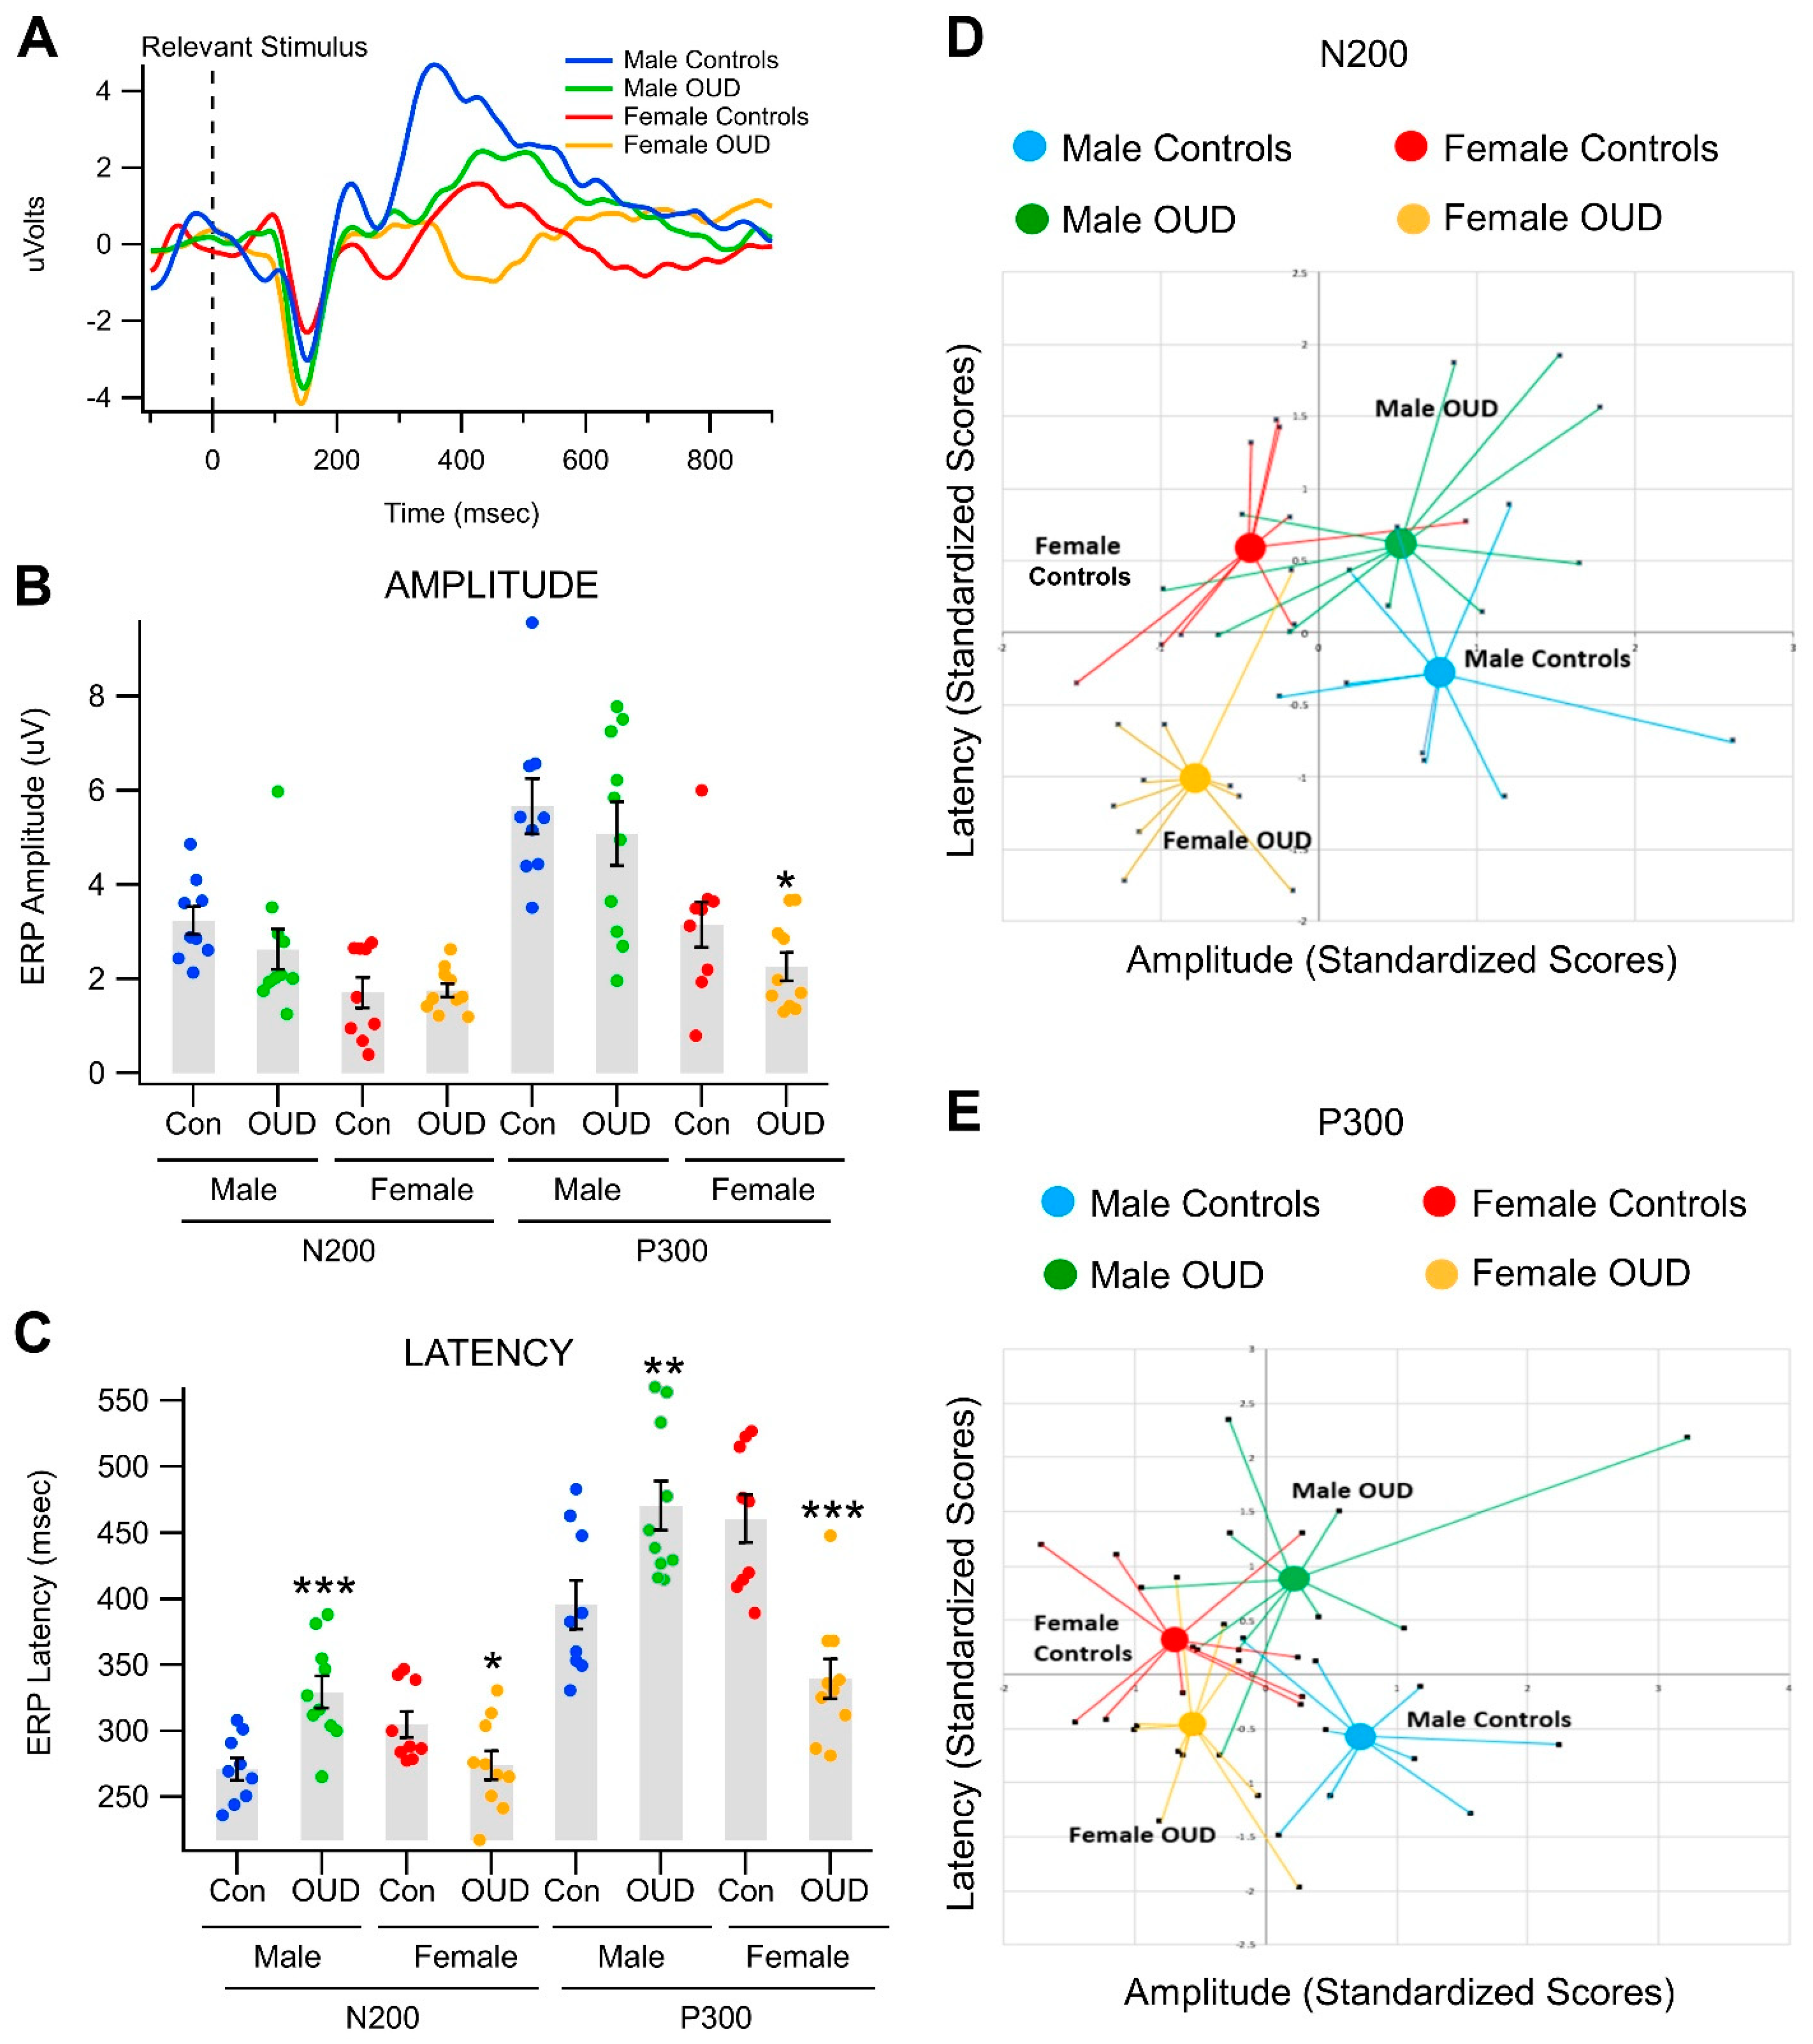
3.2. Effects of Opioid Use Disorder on Event-Related Potentials in a Visual Object Recognition Task

We compared grand-averaged VEPs obtained in non-OUD controls vs. OUD participants in the object recognition task (Figure 2A,C; shown here for the Relevant stimulus). MANOVA revealed a significant overall effect of OUD (Table 1). OUD effects nested within gender were significant for both P300 latency (p < 0.0001, eta-squared = 0.462) and N200 latency (p = 0.0004, eta-squared = 0.356; mixed-model correction verified these results), but not amplitude (Table 2). The gender-by-addiction interaction becomes more evident in the bivariate scatterplots in Figure 2D,E. Therein, latencies and amplitudes are standardized and then plotted for each participant in the study. This demonstrates differential responsiveness in men vs. women for both the N200 and P300, with latency being the primary factor. Clear clusters emerged for the differential relationship of OUD and gender in all participants. However, we also found that, although men and women with OUD had longer RTs than the non-OUD controls (men with OUD: 468.2 ± 15.8 ms; women with OUD: 516.4 ± 23.9 ms), there were no significant RT differences between non-OUD male controls vs. those males with OUD (p > 0.05); or between the non-OUD female controls and those females with OUD (p > 0.05).

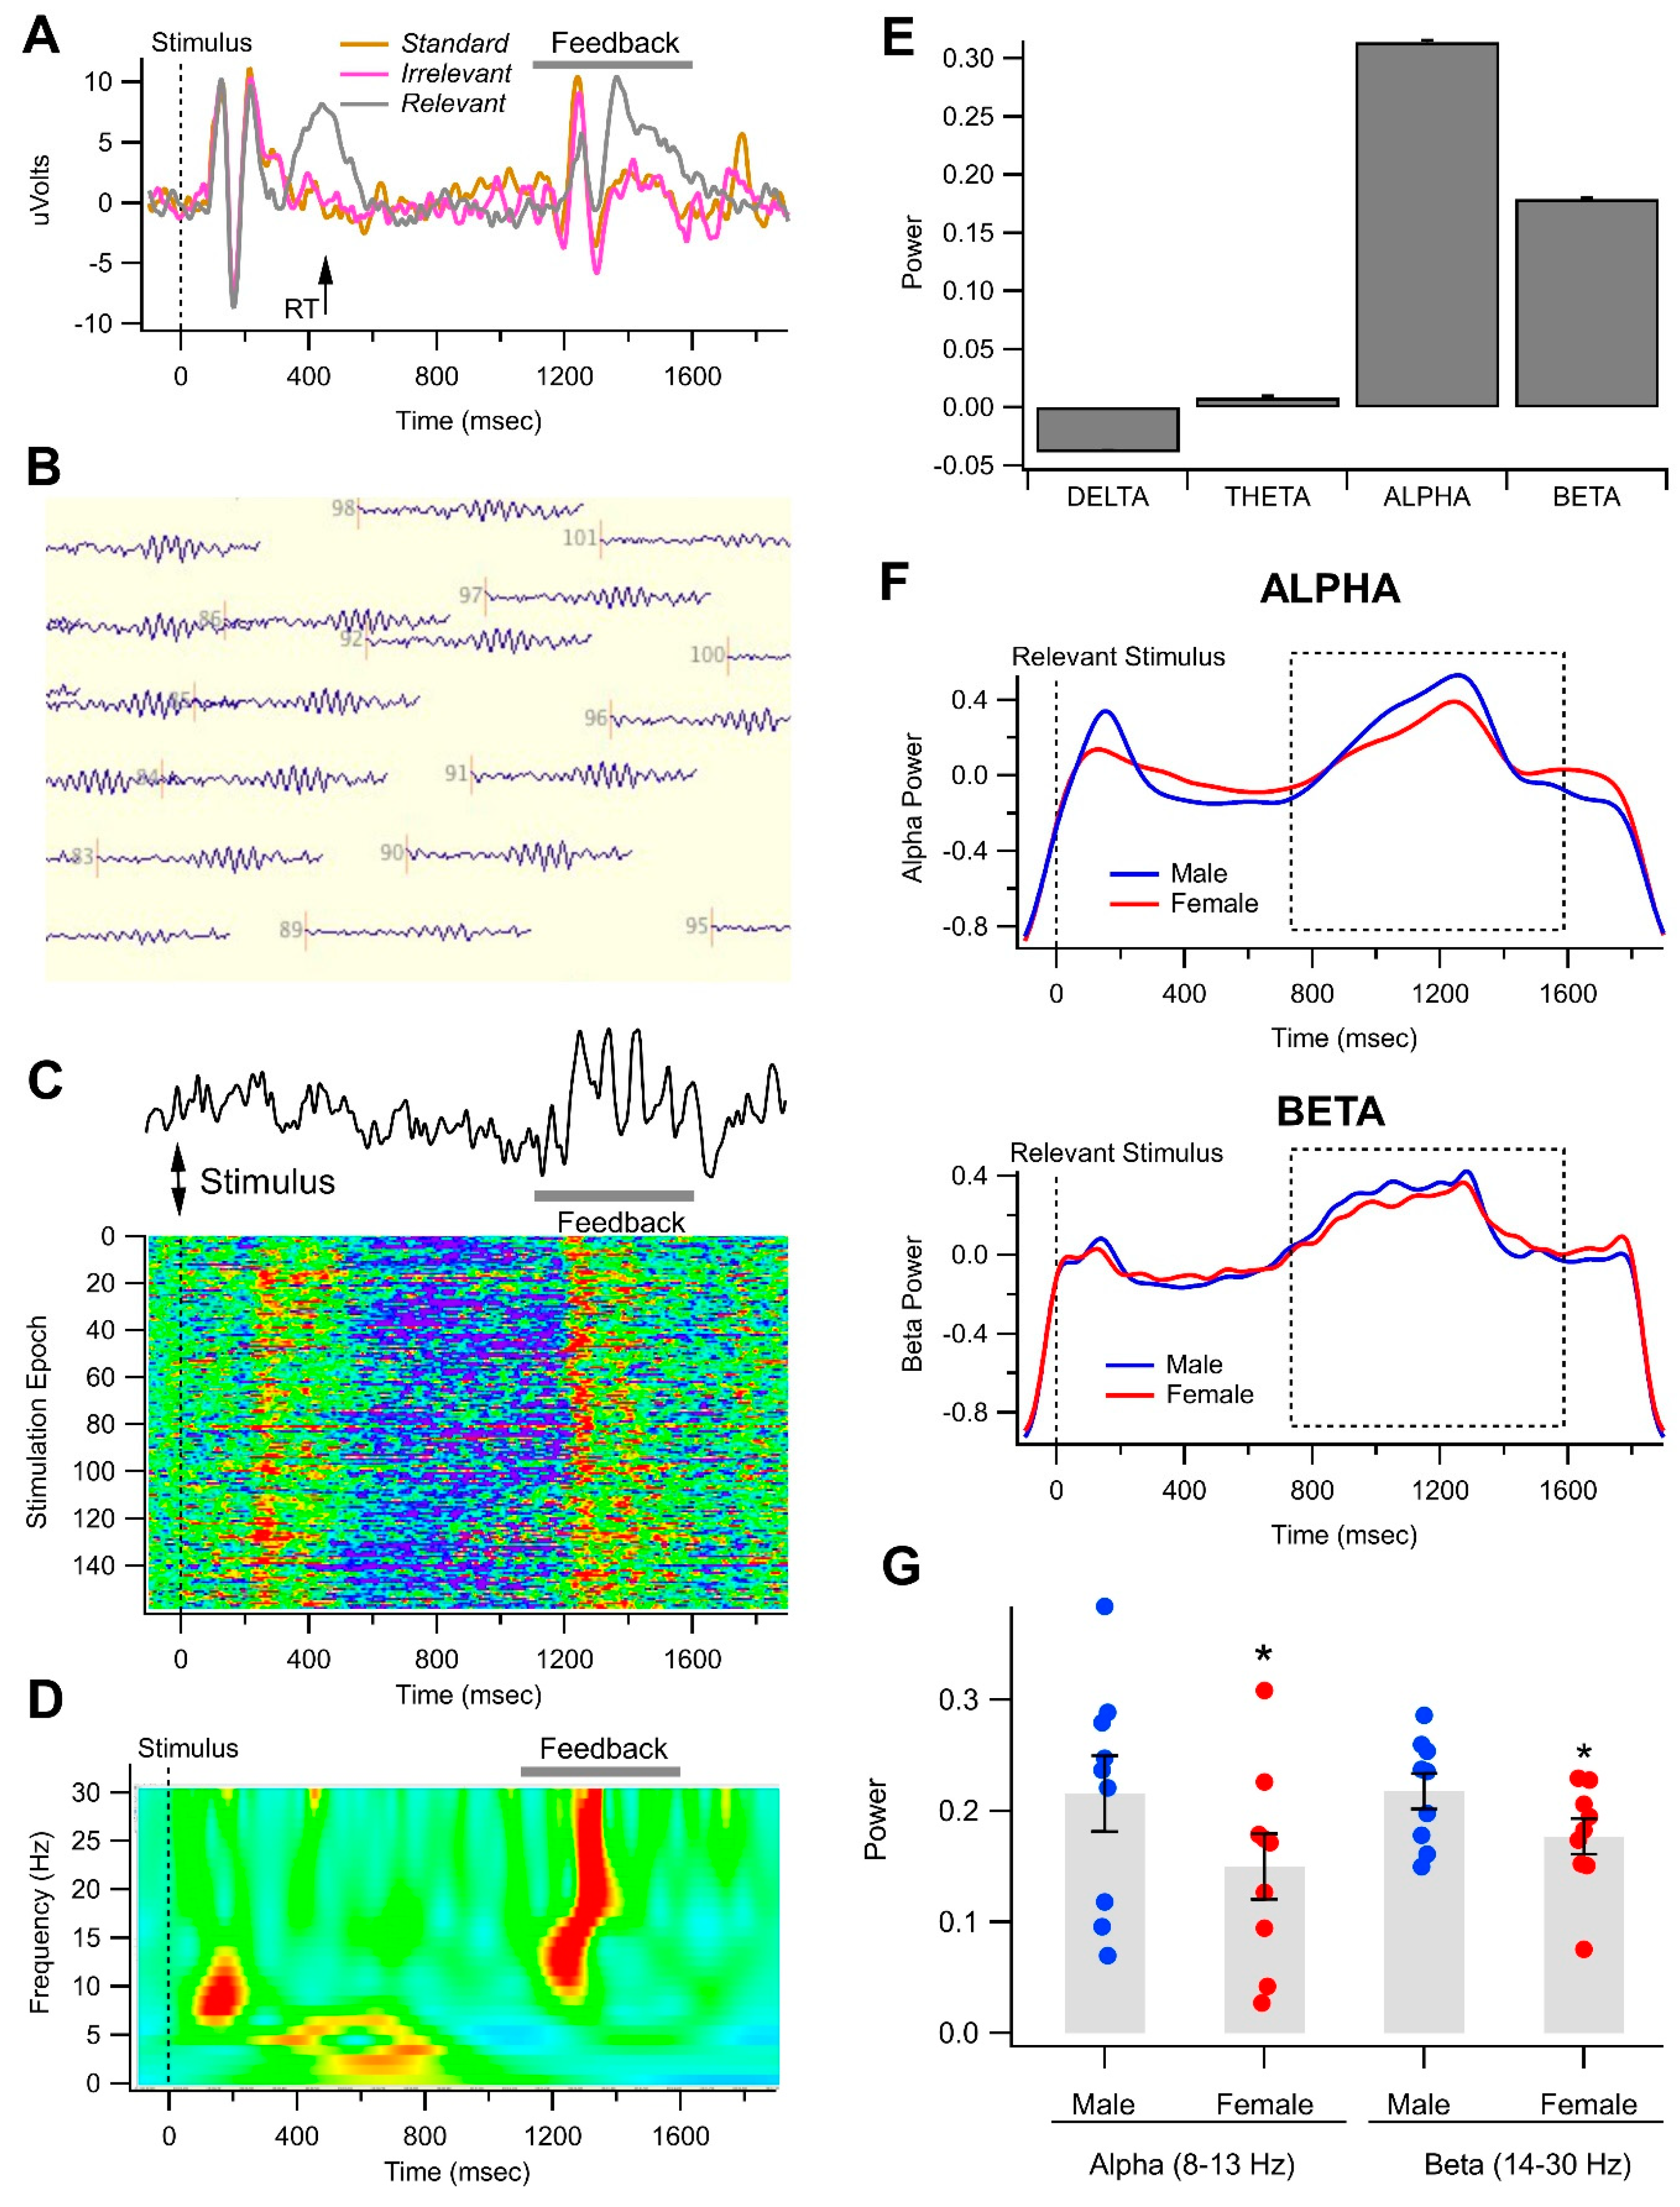
3.3. Gender-Related Differences in Alpha and Beta Oscillations in the Visual Object Recognition Task

Upon inspection of visual evoked potential (VEP) waveforms, it became obvious that there was an evoked potential in some subjects associated with the feedback message that had components that mirrored those associated with those of the original VEP (Figure 3A). Figure 3A–E shows representative data from one male non-OUD control participant.
We observed high-power oscillations for most trials in this participant’s raw EEG recordings during the time interval when the 500 ms feedback message was presented. These feedback oscillations were most evident in electrodes at the back of the head (Figure 3B). The oscillation shown in Figure 3C is from one occipital electrode of this participant, and the oscillation persisted for the duration of the feedback message. However, there was no clear pattern of occurrence or amplitude of alpha/beta oscillations in the raw EEG by epochs of stimulus presentation (Figure 3C). Wavelet analysis in this subject revealed that the feedback oscillation was composed of mostly alpha and beta power (Figure 3D). Wavelet analysis also demonstrated that the oscillation consisted of theta, alpha, and beta frequencies during the time of the feedback message for one epoch of stimulation (Figure 3D,E). Figure 3E shows averaged wavelet power for the four frequency bands: delta (1–4 Hz), theta (4–8 Hz), alpha (8–13 Hz), and beta (13–30 Hz) for this male control participant evaluated from 700–1600 ms after the Relevant stimulus from an average of seven electrodes in the back of the head. Since more than 90% of the oscillation was dominated by alpha/beta power, we focused on these two bands for gender and OUD comparisons. Grand-averaged wavelet waveforms revealed slight differences in alpha and beta power between males and females (Figure 3F). Comparisons were then made between the alpha and beta wavelet power for all women vs. all men regardless of OUD during the feedback stimulus by using within-subject measurements rather than grand averaging waveforms. MANOVA revealed that there were significant differences between genders for both alpha and beta power, with females being lower in both alpha and beta power overall (Figure 3G; Table 1).

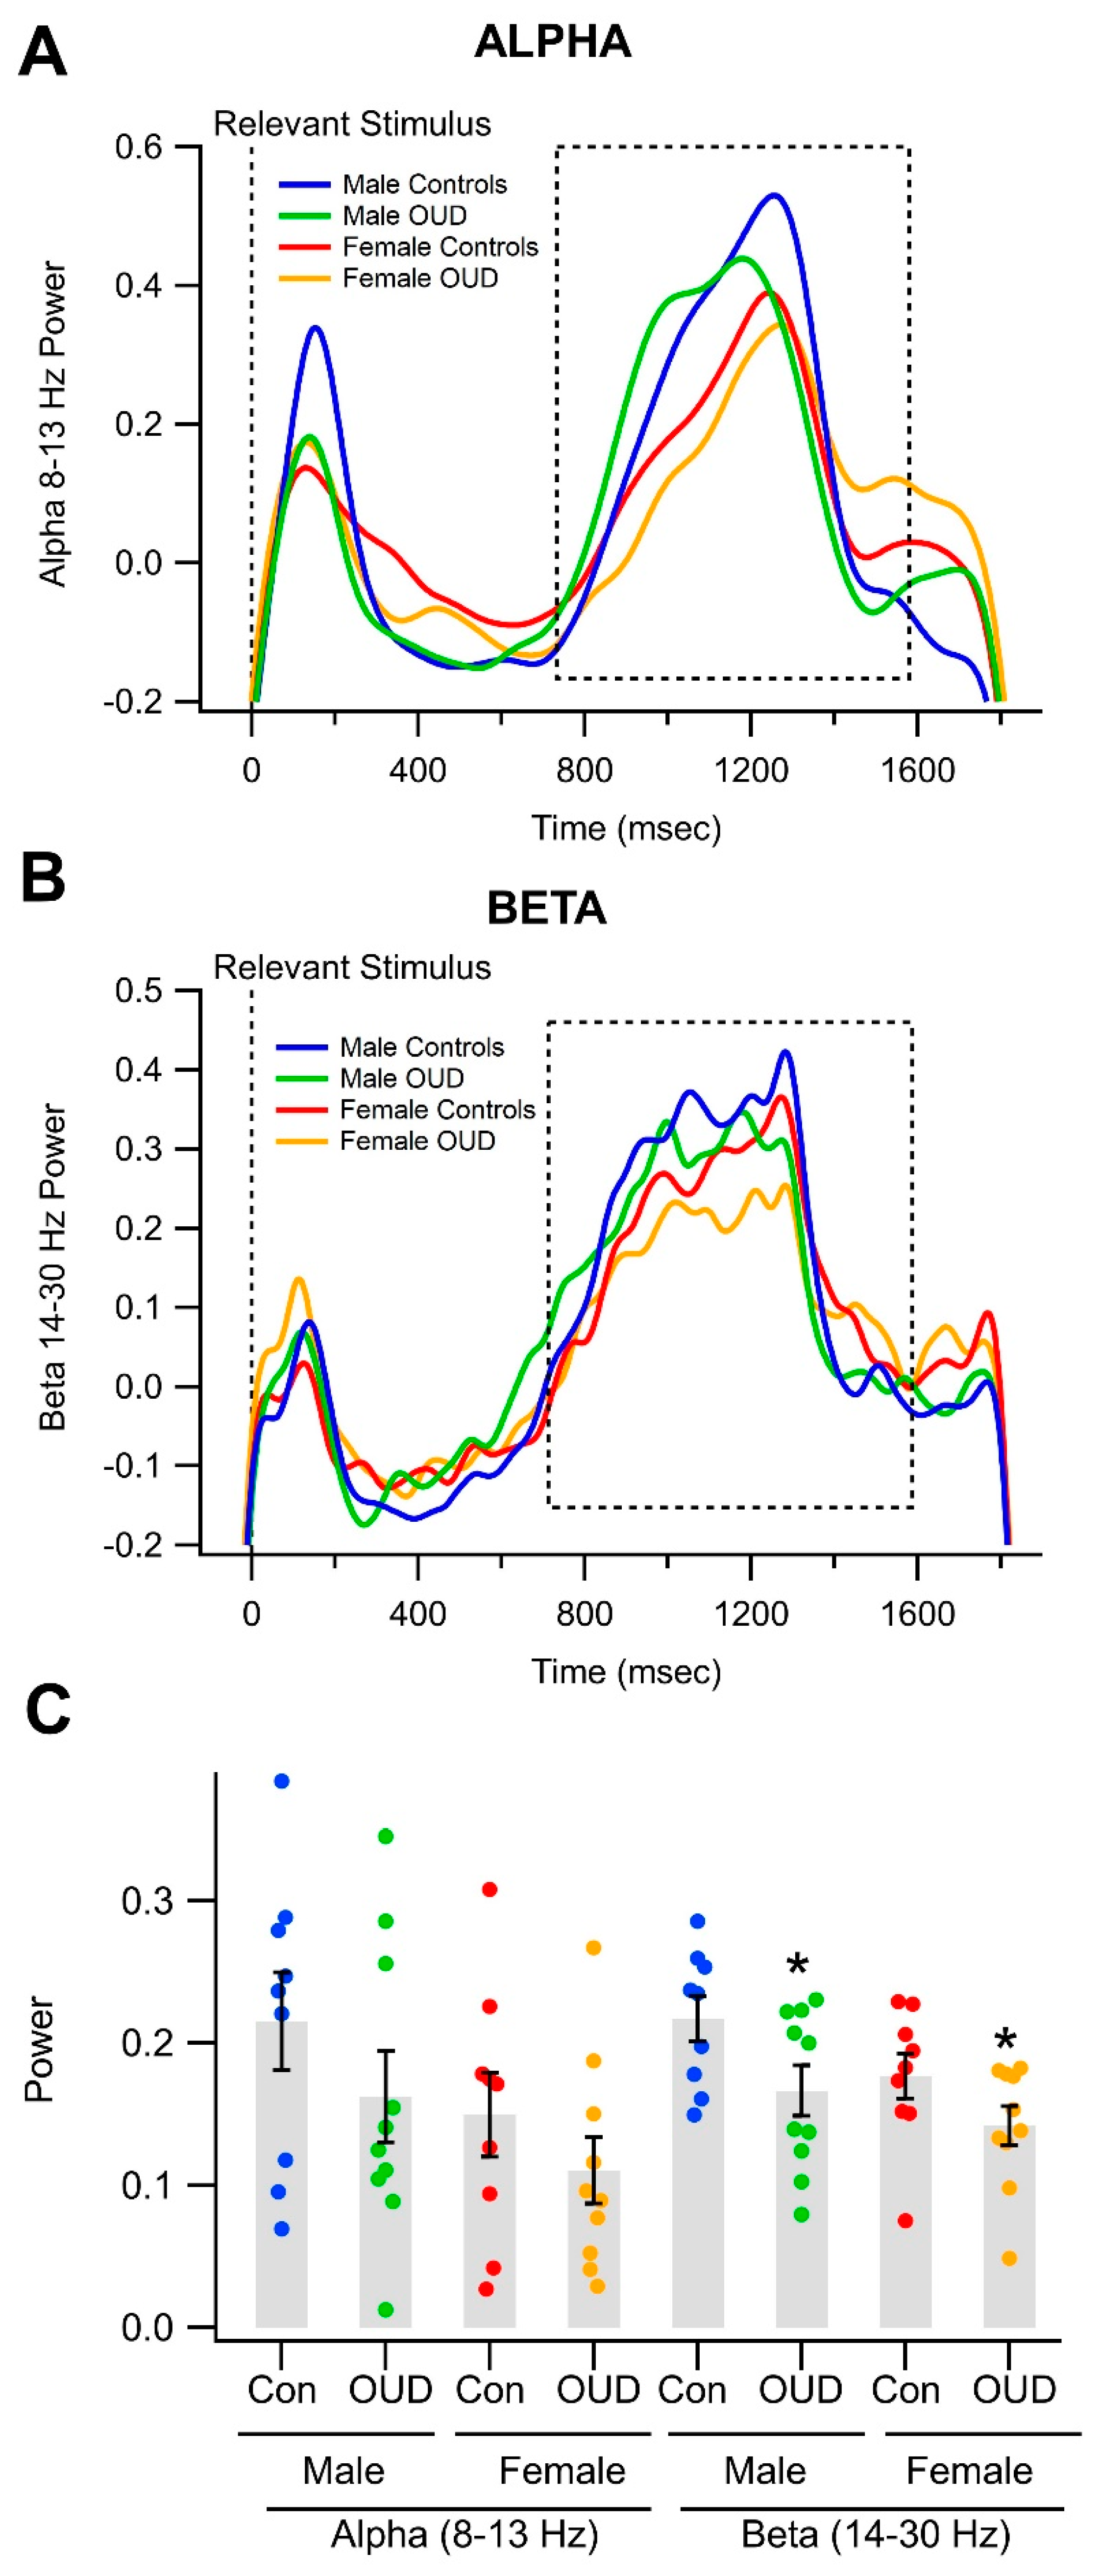
3.4. Effects of Opioid Use Disorder on Alpha/Beta Oscillations in a Visual Object Recognition Task

We then compared alpha and beta power during the feedback stimulus in OUD vs. the non-OUD participants. Grand averages of wavelet waveforms during feedback oscillation revealed only minor differences across all OUD vs. all non-OUD participants for alpha and beta power (see Figure 4A,B). Figure 4C shows averages of alpha and beta power measurements for all participants in the current study.
Although there were no univariate differences in alpha power between OUD vs. non-OUD participants, there was a significant difference in beta power during the feedback stimulus between men with OUD vs. non-OUD men participants, with OUD men having less beta power (Figure 4C). Overall, OUD effects nested within gender were significant (p = 0.0333, η2 = 0.165). Roy’s Greatest Root—one of the four corresponding multivariate tests for this effect—is also statistically significant (p = 0.0261), hedging against the alpha inflation problem of multiple testing. Table 3 summarizes all correlations for all dependent variables (DVs) used in the MANOVA models. There was a strong correlation between N200 and P300 ERPs but only weak correlations with the other DVs like alpha and beta power.

4. Discussion

4.1. Event-Related Potential (ERP) Studies

Non-invasive electrophysiological scalp recordings in electroencephalograms (EEGs) have been recognized as objective means of observing neuronal information processing. Event-related potentials (ERPs) and visual event potentials (VEPs) are linked with normal and abnormal cognitions [101,102], including those associated with chronic drug use. For almost 3 decades, alternations in P300 ERPs in opiate and cocaine users have been shown to be meliorated by buprenorphine treatment [103], yet those findings did not amount to, or advocate for, improving the human condition of those individuals struggling with opioid addiction and OUDs.
Building on a previous EEG study [87], the current study investigates how persons with substance use disorders (SUDs) and addictions—in particular OUD—process a simple Go/No-Go visual object recognition task. As grand-averaged VEPs suggested potentially important gender differences in these data, we compared ERP latencies and amplitudes during the Go/No-Go visual object recognition task for male and female participants with and without OUD [30,64,75,103].

The P300 and N200 as Good Measures of OUD

Previous research has identified the P300 ERP as an objective measure of brain activity that responds to central nervous system (CNS) disruptions and pharmacologic manipulation [84] and may represent unique biological and/or genetic factors [53]. For over 40 years, decreased P300 amplitudes with no consistent differences in latencies have been identified in acute ethanol and marijuana use [64,104]. However, similar research has associated reduced amplitudes with increased latencies in chronic alcohol abuse [105,106] as well as within opioid addiction [52,84,103,107]. Reduced P300 amplitudes with no apparent changes in latency have also been observed in acute cocaine use [52,57,75,108]. Low P300 amplitude or P300 amplitude reduction is thought to be a strong indicator of the state of disinhibition [109,110,111,112] and is implicated in behaviors associated with early onset of SUDs [77,81], including the emotional disinhibition found in the alcohol-naïve children of those with alcohol use disorder (AUD) when performing a NoGo task [62]. In addition, the N200 ERP reflects a mismatch process associated with the orienting reflex [113]. Increases in the N200 latency have been related to increased effort in stimulus discrimination [114], while reduced N200 amplitude and longer latency have been found in those abstinent from AUD [79]. Increased N200 amplitude has also been observed in those with AUD, and these findings are similar to those associated with schizophrenia [115]. Because ERP measurements can quickly and affordably monitor electrical events which are associated with the development of drug tolerance and withdrawal, research on electrophysiological changes in visual processing may illuminate key neuronal mechanisms which may be modified in opiate addiction and OUD.
Our central aim was to use electrophysiological (EEG) scalp recordings to investigate gender-linked behavioral, physiological, or molecular markers in men and women with and without addiction and opiate use disorder (OUD). Our primary hypothesis was that there would be significant gender-by-OUD interactions in ERPs. Specifically, we wanted to observe N200 and P300 event-related potentials (ERPs) and brain function of those women and men struggling with OUD when compared to healthy non-OUD control participants by use of visual stimuli in a controlled setting. We also hypothesized that a basic neurophysiological marker might provide an objective index for the efficacy of treatment strategies for addiction—in particular opiate addiction and OUD. While N200 and P300 amplitudes were not significantly affected by OUD for either men or women in this study, latencies were significantly affected, and differentially, in men vs. women with OUD. Male OUD participants exhibited longer and female OUD participants exhibited shorter latencies, for both N200 and P300, than for non-OUD controls. These findings suggest that one can effectively use an EEG to objectively measure differences in ERPs over time and monitor improvement via simple individual EEG data studies. These techniques could be applied throughout initial treatment and beyond, and potentially help identify changes in biological patterns that could indicate risk of overlap in OUD, as we continue to face the question of why OUD overdose deaths happen in men at twice the rate as for women. Significant differences in patterns observed in males and females with opiate addiction suggests that the groups are distinct from one another. These findings are also in line with previous studies demonstrating reduced P300 amplitudes in males with alcohol and cocaine addiction, as compared with healthy male controls [33,34,35,52,79,114,116,117]. Until recently, little has been researched or said about females and addictions and SUDs [29], especially regarding P300. In addition, there are few ERP studies of visual cognitive processing involving P300s differences between men and women. The current study of object recognition stimuli in a Go/NoGo task was designed to address that gap, following two previous EEG studies that found P300s and N200s do not significantly vary across the menstrual phases, suggesting that the menses cycle does not account for possible cognitive processing differences between men and women [118,119].

4.2. Potential Limitations

Potential limitations of this ERP/EEG study may come from the smaller sample size of those with OUD being sorted to even smaller gender-specific cohorts. However, we did see distinctive variations in ERPs and oscillations that match other EEG studies of SUDs. Traditionally, very few of the EEG studies of SUDs of any kind have reported large sample sizes, which may be due to the societal stigmas that surround substance abuse and addictions [120,121]. Other confounds may come from the lack of EEG research specific to OUD, as polysubstance use and abuse is common with all struggling with addiction. With this in mind, it is difficult to design clinical research that can replicate previous EEG studies of OUD so as not to repeat any common errors in research design and data analyses [102]. Additionally, our participants were recruited during various phases of withdrawal and active detoxification. This spectrum of symptom profiles may limit our results’ generalization to effects of ‘kindling’, or eventual limbic system hypersensitization seen in chronic alcohol detoxification and withdrawal [51,122]. Despite this potential limitation, our findings are in alignment with prior literature on ERP variance in this context, particularly similarly decreased P300 amplitudes and increased latencies observed in AUD and other chronic SUDs [82,103,123,124]. Cognitive changes associated with addictive or withdrawal states also mirror traditional treatment dogma encouraging those in early abstinence and/or withdrawal to avoid settings and company associated with prior drug-use, as sensory ‘triggers’ or ‘cues’ may disrupt CNS inhibition and promote relapse. Finally, self-reporting of how much or how long substance abuse has taken place can be a problem in SUD research; however, most SUD research must rely on such reports, and literature indicates that, for the most part, self-reporting is reliable in this type of investigation [103,125].

4.3. Correlation of ERPs with Wavelets

Wavelets were not correlated with stimulus condition as were ERPs. Further, ERPs and wavelets were uncorrelated overall, providing some evidence that they may index independent phenomena. Although the statistics presented in this paper are not sufficient to delineate precisely the cognitive and physiological processes that cause ERP and wavelet measurements, we can begin to form a new hypothesis for future research to test in SUDs and, in particular, for OUD. ERPs are well-established in their relationship to cognitive processes over decades of research, but the controversial nature of attributing causes to alpha or beta oscillations, in particular during the cognitive load of a feedback message in a Go/No-Go task, needs further experimental manipulations to prove or disprove causes. One possibility not presented in previous research is that there are many causes of alpha oscillations, and in the circumstances found in typical ERP studies, one or more of these causes can be present. Boredom, restlessness, or unfocused attention could contribute simultaneously, along with underlying personality traits and physiological properties that vary among participants. Routine physiological processes may be present as well, or even attenuated by each of the previously mentioned causes. Studies designed with alpha oscillations as a primary consideration could gather enough information about each of these variables to account for factors that vary the alpha oscillation effect. Regardless, oscillations during the feedback stimulus were robust, being evident on raw EEG waveforms, and were affected significantly by gender–OUD interactions. Studies are ongoing in our lab to determine if oscillations during the feedback message might be dependent upon dopamine levels in the brain.

4.4. Feedback Message Oscillation Studies

Although we did not expect to see evoked waveforms during the feedback stimulus presented at 500 ms after the subject’s response to the visual stimulus in this simple visual Go/No-Go task, upon inspection of grand-averaged waveforms in some subjects (Figure 3), it became evident that there was an appreciable evoked waveform that evinced differential response waveforms, similar to the waveforms induced by the visual stimulus that form the VEP and ERPs in the encompassing task. This observation led us to inspect the raw waveforms during the feedback message. It was obvious that a robust oscillation occurred therein for almost all subjects across all stimulus conditions and all around the head, but most evidently at the back of the head. Very rarely was a VEP or ERP evident on a single stimulus trial, as were the oscillations during the feedback message. As this observation was an unexpected outcome of the study, we did not generate hypotheses for this phenomenon, but report it here with our interpretation and its potential implications. Wavelet analysis of the oscillations evoked during the feedback stimulus was able to detect quantitative differences in delta, theta, alpha, and beta power during the feedback stimulus, with alpha and beta activity dominating the oscillation. However, given that the message itself was presented for only 500 ms, slower frequencies like delta and theta would not have had enough time to accurately sum in order to determine their power during this short epoch, hence their lower power. Surprisingly, unlike ERPs, alpha and beta activity did not vary significantly by stimulus condition in the simple Go/No-Go task. However, because of the variability in RT amongst participants and the presentation of the 500 ms feedback message (500 ms after the subject’s response to a Relevant stimulus), their amplitude varied considerably, except in those participants whose RTs for each trial were relatively less variable. As mentioned previously with ERPs (Figure 1 and Figure 2), because of temporal dispersion, differences in RT, grand-averaged waveforms, etc. often underestimate the significance of the effects due to temporal dispersion and other vagaries associated with averaging. This was especially true of the feedback message, given that it was dependent upon RT, at least for the Relevant stimulus. Thus, for this study, wavelet analysis was used instead of waveform grand-averaging to evaluate the power of alpha and beta oscillations during the feedback message. We found a significant difference between men and women for alpha and beta oscillations during the feedback message, and a significant difference between male OUD vs. non-OUD participants.
Alpha oscillations occur during visual tasks and occur mostly in the occipital and parietal lobes [126,127]. One study found perceptual stimuli in the visual field to be most relevant for accounting for power of alpha oscillations [128]. Background processing and visual perception activation have not been sufficient to explain alpha oscillations, so a cognitive explanation is a potentially fruitful cause to explore [129]. Although alpha oscillation often occurs in a resting participant, the alpha and beta oscillations in this study were robust and time-locked to the feedback message. There are several theories that compete in explaining why alpha oscillations occur in visual tasks and why they occur immediately preceding the presentation of a stimulus [130]. One theory is that they are tied to attention [131]. A competing theory is that they are tied to boredom [117,132]. Some researchers consider alpha oscillations as artifacts that can disrupt the collection of clean ERP components in event-focused ERP studies if care is not taken [102]. Alpha oscillations have also been attributed to participants’ anticipation of the upcoming stimulus [133,134]. As such, these brief but consistent alpha oscillations commonly occur immediately preceding a visual task in an ERP study. Researchers have sought to document the pattern of these alpha oscillations and what may cause them, and have targeted perceptual and attentional systems as likely causes of alpha oscillations [135]. The current study not only documents the presence of these types of alpha oscillations in all participants, but also provides evidence that they rival ERP components in their usefulness for discriminating their differences in the groups of participants and any interactions, including the gender-specific differences of brain functions in OUD. Many studies use short intervals between stimuli where ERPs are affected negatively by the alpha oscillations superimposed over those ERP components involved in the waveform [52,64,71,76,78,79,86,111,115,126,129,136,137,138,139,140,141,142,143,144,145,146,147,148,149]. Our study includes enough time between stimuli to avoid such overlap and evaluate oscillations with wavelets exclusively within the window of the feedback message. In this way, further studies can separate the effects of alpha oscillations and ERP components and test if they represent overlapping phenomena or if they are component-independent phenomena [117], possibly related to separate cognitive processes.

4.5. Future Studies

Across biological research over the past two decades, DA has consistently emerged as one of the greatest driving forces in substance abuse. As DA is associated with substance use and visual processing, we suggest that continuations of this study should explore whether DA levels vary across different visual tasks and EEG/ERP studies. Increasing sample sizes, especially when grouping by addiction status and sex, would be in line with these aims, as would incorporation of different stimuli. Another method of sampling for DA depletion using the same type of visual cognitive recognition task would also help generalize observed associations to other types of SUDs.
Given our results as well as previous findings on sex differences in object recognition tasks [118,119,150], we also suggest there is great need for further consideration of possible hormonal effects on DA neurotransmission in men and women, especially as these differences may relate to any form of addiction or other disinhibitory disorder [151]. This suggestion is in line with emerging clinical patterns. A robust study of substance abuse across 30,000 assessments completed in 220 different treatment centers between 2005 and 2008 indicated significant differences in men and women’s use of opioid pain pills [29]. Women out-used men overall, but not within opiate- or heroin-specific categories [152]. Women were also especially likely to abuse these substances when they were already problem drinkers. Better understanding the cognitive changes which may drive this gender-related susceptibility to different substances can potentially inform better practices for opioid prescriptions for pain management in women who may be more at risk for some types of substance abuse [81,125,153,154,155,156].
Furthermore, our findings may suggest that exploring simple, cost-effective visual processing tasks that could identify signs of relapse or risk for abuse is necessary and may be possible through observation of ERPs or VEPs. Previous research also demonstrates promise around the development of some type of light visualization [157,158] or other types of environmental enhancement stimuli that can improve inhibition systems such as those studied in cocaine addiction reversal [122,157,158,159]. Similar studies should be carried out for opioid addiction given recent estimates suggesting that societal effects of opioid misuse, abuse, and overdose deaths have surpassed those of cocaine.
Gazzaniga [160] notes that neuroscience is still in its infancy in understanding who and/or what is in charge of “free will” and what sort of neurobiological adaptations may or may not be within human control. In order to reduce societal stigmatization and enhance treatment outcomes, questions such as: “Why can’t they just stop?” must continue to be asked, and evidence-based answers to those harrowing inquiries must continue to be sought. Cognitive neuroscience and biological perspectives may serve as an especially firm foundation for understanding these aspects of human behavior.
Overall, as hypothesized, our results suggest that differences emerge in visual attention, cognitive processing, and physiology in men and women experiencing substance abuse and opiate addiction. Our results also suggest that the object recognition task used in the current study may be sensitive to such differences. Therefore, this task or other visual paradigms may further our understanding of biological mechanisms behind opiate addiction and its related inhibitory behaviors. We propose that such “behaviors may be [linked with] ‘out the gate’ immediate, evoked potentials from visual stimuli, [which] trigger some type of neurobiological cascade of neurotransmitters and component generation that can be ‘visualized’ on EEG studies” [160]. We hold that these uninhibited cascading neurotransmission events may lead to or represent signs of relapse in persons with OUD who are trying to stimulate the reward system with or without conscious awareness or deliberate attending to reward-associated stimuli in both women and men, but particularly in men. Our results offer further evidence that continued research in the area of DA neurotransmission and search for biomarkers in the visual system for opiate addiction and relapse as measured by EEG is warranted to illuminate reasons for sex-related differences in OUD prevalence and mortality rates [21,22].

Author Contributions

Conceptualization, J.P., S.C.S., K.B.B. and D.A.; methodology, J.P. and S.C.S.; software, L.R.K. and S.K.; validation, J.P. and S.C.S.; formal analysis, B.L.B. and L.R.K.; resources, S.C.S.; data curation, L.R.K. and S.K.; writing—original draft preparation, J.P. and L.R.K.; writing—review and editing, S.C.S., D.E.F. and S.K.; visualization, S.C.S., B.L.B. and D.E.F.; supervision, S.C.S. and J.P.; project administration, J.P.; funding acquisition, S.C.S., J.P., K.B.B. and D.A. All authors have read and agreed to the published version of the manuscript.

Funding

This work was supported by NIH grant DA053083 to S.C.S. and D.A. as well as Brigham Young University Women’s Research Institute to S.C.S. and J.P.

Institutional Review Board Statement

The study was conducted in accordance with the Declaration of Helsinki and approved by the Institutional Review Board (or Ethics Committee) of Brigham Young University, Provo (F100210, 7-6-2010).

Informed Consent Statement

Informed consent was obtained from all subjects involved in the study. Written informed consent has been obtained from the patient(s) to publish this paper.

Data Availability Statement

The data supporting the findings of this study are available from the corresponding author upon reasonable request.

Acknowledgments

We would like to acknowledge the men and women who willingly shared their very personal information and stories of opioid addiction and relapse and recovery successes.

Conflicts of Interest

The authors declare no conflict of interest. The funders had no role in the design of the study; in the collection, analyses, or interpretation of data; in the writing of the manuscript; or in the decision to publish the results.

References

  1. American Psychiatric Association (APA). Diagnostic and Statistical Manual of Mental Disorders—Fourth Edition (DSM-IV); American Psychiatric Association: Washington, DC, USA, 1994; p. 886. [Google Scholar]
  2. American Psychiatric Association (APA). DSM-5 Development: Substance Related Disorders. Available online: http://www.dsm5.org/ProposedRevisions/Pages/Substance-RelatedDisorders.aspx (accessed on 20 February 2012).
  3. American Psychiatric Association (APA). Diagnostic and Statistical Manual of Mental Disorders—Fifth Edition (DSM-5); American Psychiatric Publishing: Arlington, VA, USA, 2013; p. 947. [Google Scholar]
  4. Grant, J.E.; Chamberlain, S.R. Expanding the definition of addiction: DSM-5 vs. ICD-11. CNS Spectr. 2016, 21, 300–303. [Google Scholar] [CrossRef] [PubMed]
  5. O’Brien, C.P. Recent developments in the pharmacotherapy of substance abuse. J. Consult. Clin. Psychol. 1996, 64, 677–686. [Google Scholar] [CrossRef] [PubMed]
  6. American Psychiatric Association (APA). What Is Addiction? Available online: https://www.psychiatry.org/patients-families/addiction/what-is-addiction (accessed on 12 November 2020).
  7. Koob, G.F. Neurobiological substrates for the dark side of compulsivity in addiction. Neuropharmacology 2009, 56 (Suppl. S1), 18–31. [Google Scholar] [CrossRef] [PubMed]
  8. Dobs, Y.E.; Ali, M.M. The epigenetic modulation of alcohol/ethanol and cannabis exposure/co-exposure during different stages. Open Biol. 2019, 9, 180115. [Google Scholar] [CrossRef] [PubMed]
  9. Gilpin, N.W.; Koob, G.F. Neurobiology of alcohol dependence: Focus on motivational mechanisms. Alcohol Res. Health 2008, 31, 185–195. [Google Scholar] [PubMed]
  10. Polter, A.M.; Kauer, J.A. Stress and VTA synapses: Implications for addiction and depression. Eur. J. Neurosci. 2014, 39, 1179–1188. [Google Scholar] [CrossRef]
  11. DiFranza, J.R. Hooked from the first cigarette. Sci. Am. 2008, 298, 82–87. [Google Scholar] [CrossRef]
  12. United Nations Office on Drugs and Crime (UNODC). World Drug Report 2020; Sales No. E.20.XI.6; United Nations: New York, NY, USA, 20 June 2020; p. 52.
  13. Bartram, A.; Eliott, J.; Crabb, S. ‘Why can’t I just not drink?’ A qualitative study of adults’ social experiences of stopping or reducing alcohol consumption. Drug Alcohol Rev. 2017, 36, 449–455. [Google Scholar] [CrossRef]
  14. Hoffman, J.; Froemke, S. (Eds.) Addiction: Why Can’t They Just Stop? 1st ed.; Rodale Books: Emmaus, PA, USA, 2007; p. 256. [Google Scholar]
  15. Substance Abuse and Mental Health Services Administration (SAMHSA). Key Substance Use and Mental Health Indicators in the United States: Results from the 2019 National Survey on Drug Use and Health; Center for Behavioral Health Statistics and Quality, Substance Abuse and Mental Health Services Administration: Rockville, MD, USA, 2020.
  16. The Council of Economic Advisors: Executive Office of the President of the United States 2019. The Underestimated Cost of the Opioid Crisis. Available online: https://crisisnextdoor.trumpwhitehouse.archives.gov/ (accessed on 20 July 2023).
  17. Substance Abuse and Mental Health Services Administration (SAMHSA). Behavioral Health Treatment and Services. Available online: https://www.samhsa.gov/find-help/treatment#opioid (accessed on 14 November 2020).
  18. U.S. Department of Health & Human Services. Fact Sheet: SAMHSA 42 CFR Part 2 Revised Rule; U.S. Department of Health & Human Services: Washington, DC, USA, 2020.
  19. Volkow, N.D.; Blanco, C. The changing opioid crisis: Development, challenges and opportunities. Mol. Psychiatry 2020, 26, 218–233. [Google Scholar] [CrossRef]
  20. Wilson, N.; Kariisa, M.; Seth, P.; Smith, H., IV; Davis, N.L. Drug and opioid-involved overdose deaths—United States, 2017–2018. Morb. Mortal. Wkly. Rep. 2020, 69, 290–297. [Google Scholar] [CrossRef]
  21. McGranahan, D.A.; Parker, T.S. The Opioid Epidemic: A Geography in Two Phases ERR-287; U.S. Department of Agriculture, Economic Research Service: Washington, DC, USA, 2021; p. 48.
  22. National Institute on Drug Abuse (NIDA). Drug Overdose Death Rates. In Trends & Statistics; National Institute on Drug Abuse (NIDA): North Bethesda, MD, USA, 2023. [Google Scholar]
  23. National Institute on Drug Abuse (NIDA). Fentanyl DrugFacts. 1 June 2021. Available online: https://nida.nih.gov/publications/drugfacts/fentanyl (accessed on 21 July 2023).
  24. Lee, S.K. Sex as an important biological variable in biomedical research. BMB Rep. 2018, 51, 167–173. [Google Scholar] [CrossRef] [PubMed]
  25. Hilderbrand, E.R.; Lasek, A.W. Studying sex differences in animal models of addiction: An emphasis on alcohol-related behaviors. ACS Chem. Neurosci. 2018, 9, 1907–1916. [Google Scholar] [CrossRef] [PubMed]
  26. Halpern, D.F.; Benbow, C.P.; Geary, D.C.; Gur, R.C.; Hyde, J.S.; Gernsbacher, M.A. The science of sex differences in science and mathematics. Psychol. Sci. Public Interest 2007, 8, 1–51. [Google Scholar] [CrossRef] [PubMed]
  27. Hamilton, A.B.; Grella, C.E. Gender differences among older heroin users. J. Women Aging 2009, 21, 111–124. [Google Scholar] [CrossRef] [PubMed]
  28. Back, S.E.; Payne, R.L.; Wahlquist, A.H.; Carter, R.E.; Stroud, Z.; Haynes, L.; Hillhouse, M.; Brady, K.T.; Ling, W. Comparative profiles of men and women with opioid dependence: Results from a national multisite effectiveness trial. Am. J. Drug Alcohol Abuse 2011, 37, 313–323. [Google Scholar] [CrossRef]
  29. Green, T.C.; Grimes Serrano, J.M.; Licari, A.; Budman, S.H.; Butler, S.F. Women who abuse prescription opioids: Findings from the Addiction Severity Index-Multimedia Version Connect prescription opioid database. Drug Alcohol Depend. 2009, 103, 65–73. [Google Scholar] [CrossRef]
  30. Ait-Daoud, N.; Blevins, D.; Khanna, S.; Sharma, S.; Holstege, C.P.; Amin, P. Women and addiction: An update. Med. Clin. N. Am. 2019, 103, 699–711. [Google Scholar] [CrossRef]
  31. Barbosa-Leiker, C.; McPherson, S.; Layton, M.E.; Burduli, E.; Roll, J.M.; Ling, W. Sex differences in opioid use and medical issues during buprenorphine/naloxone treatment. Am. J. Drug Alcohol Abuse 2018, 44, 488–496. [Google Scholar] [CrossRef]
  32. Barker, J.M.; Taylor, J.R. Sex differences in incentive motivation and the relationship to the development and maintenance of alcohol use disorders. Physiol. Behav. 2019, 203, 91–99. [Google Scholar] [CrossRef]
  33. Becker, J.B. Sex differences in addiction. Dialogues Clin. Neurosci. 2016, 18, 395–402. [Google Scholar] [CrossRef]
  34. Becker, J.B.; Chartoff, E. Sex differences in neural mechanisms mediating reward and addiction. Neuropsychopharmacology 2019, 44, 166–183. [Google Scholar] [CrossRef] [PubMed]
  35. Becker, J.B.; McClellan, M.L.; Reed, B.G. Sex differences, gender and addiction. J. Neurosci. Res. 2017, 95, 136–147. [Google Scholar] [CrossRef] [PubMed]
  36. Bisagno, V.; Cadet, J.L. Stress, sex, and addiction: Potential roles of corticotropin-releasing factor, oxytocin, and arginine-vasopressin. Behav. Pharmacol. 2014, 25, 445–457. [Google Scholar] [CrossRef] [PubMed]
  37. Bobzean, S.A.; DeNobrega, A.K.; Perrotti, L.I. Sex differences in the neurobiology of drug addiction. Exp. Neurol. 2014, 259, 64–74. [Google Scholar] [CrossRef]
  38. Carroll, M.E.; Lynch, W.J. How to study sex differences in addiction using animal models. Addict. Biol. 2016, 21, 1007–1029. [Google Scholar] [CrossRef]
  39. Chowdhury, T.G.; Wallin-Miller, K.G.; Rear, A.A.; Park, J.; Diaz, V.; Simon, N.W.; Moghaddam, B. Sex differences in reward- and punishment-guided actions. Cogn. Affect. Behav. Neurosci. 2019, 19, 1404–1417. [Google Scholar] [CrossRef]
  40. Dahan, A.; Kest, B.; Waxman, A.R.; Sarton, E. Sex-specific responses to opiates: Animal and human studies. Anesth. Analg. 2008, 107, 83–95. [Google Scholar] [CrossRef]
  41. Fattore, L.; Melis, M. Sex differences in impulsive and compulsive behaviors: A focus on drug addiction. Addict. Biol. 2016, 21, 1043–1051. [Google Scholar] [CrossRef]
  42. Huhn, A.S.; Berry, M.S.; Dunn, K.E. Review: Sex-based differences in treatment outcomes for persons with opioid use disorder. Am. J. Addict. 2019, 28, 246–261. [Google Scholar] [CrossRef]
  43. Kaplovitch, E.; Gomes, T.; Camacho, X.; Dhalla, I.A.; Mamdani, M.M.; Juurlink, D.N. Sex differences in dose escalation and overdose death during chronic opioid therapy: A population-based cohort study. PLoS ONE 2015, 10, e0134550. [Google Scholar] [CrossRef]
  44. Kokane, S.S.; Perrotti, L.I. Sex differences and the role of estradiol in mesolimbic reward circuits and vulnerability to cocaine and opiate addiction. Front. Behav. Neurosci. 2020, 14, 74. [Google Scholar] [CrossRef] [PubMed]
  45. Marrocco, J.; McEwen, B.S. Sex in the brain: Hormones and sex differences. Dialogues Clin. Neurosci. 2016, 18, 373–383. [Google Scholar] [CrossRef] [PubMed]
  46. Orsini, C.A.; Setlow, B. Sex differences in animal models of decision making. J. Neurosci. Res. 2017, 95, 260–269. [Google Scholar] [CrossRef]
  47. Shimamoto, A. Social defeat stress, sex, and addiction-kike behaviors. Int. Rev. Neurobiol. 2018, 140, 271–313. [Google Scholar] [CrossRef] [PubMed]
  48. Songtachalert, T.; Roomruangwong, C.; Carvalho, A.F.; Bourin, M.; Maes, M. Anxiety disorders: Sex differences in serotonin and tryptophan metabolism. Curr. Top. Med. Chem. 2018, 18, 1704–1715. [Google Scholar] [CrossRef]
  49. Zachry, J.E.; Johnson, A.R.; Calipari, E.S. Sex differences in value-based decision making underlie substance use disorders in females. Alcohol Alcohol. 2019, 54, 339–341. [Google Scholar] [CrossRef] [PubMed]
  50. Zhou, Y.; Zhao, M.; Zhou, C.; Li, R. Sex differences in drug addiction and response to exercise intervention: From human to animal studies. Front. Neuroendocrinol. 2016, 40, 24–41. [Google Scholar] [CrossRef]
  51. Ballenger, J.C.; Post, R.M. Kindling as a model for alcohol withdrawal syndromes. Br. J. Psychiatry 1978, 133, 1–14. [Google Scholar] [CrossRef]
  52. Bauer, L.O. Predicting relapse to alcohol and drug abuse via quantitative electroencephalography. Neuropsychopharmacology 2001, 25, 332–340. [Google Scholar] [CrossRef]
  53. Begleiter, H.; Porjesz, B. Genetics of human brain oscillations. Int. J. Psychophysiol. 2006, 60, 162–171. [Google Scholar] [CrossRef]
  54. Bigler, E.D.; Fleming, D.E. Pharmacological suppression of photically evoked after-discharges in rats: Incremental dose, hippocampal EEG and behavioral activity correlates. Psychopharmacologia 1976, 46, 73–82. [Google Scholar] [CrossRef] [PubMed]
  55. Ceballos, N.A.; Bauer, L.O.; Houston, R.J. Recent EEG and ERP findings in substance abusers. Clin. EEG Neurosci. 2009, 40, 122–128. [Google Scholar] [CrossRef] [PubMed]
  56. Hensel, M.; Wolter, S.; Kox, W.J. EEG controlled rapid opioid withdrawal under general anaesthesia. Br. J. Anaesth. 2000, 84, 236–238. [Google Scholar] [CrossRef]
  57. Herning, R.I.; Glover, B.J.; Koeppl, B.; Phillips, R.L.; London, E.D. Cocaine-induced increases in EEG alpha and beta activity: Evidence for reduced cortical processing. Neuropsychopharmacology 1994, 11, 1–9. [Google Scholar] [CrossRef] [PubMed]
  58. Howe, R.C.; Hegge, F.W.; Phillips, J.L. Acute heroin abstinence in man: II. Alterations in rapid eye movement (REM) sleep. Drug Alcohol Depend. 1980, 6, 149–161. [Google Scholar] [CrossRef] [PubMed]
  59. Howe, R.C.; Hegge, F.W.; Phillips, J.L. Acute heroin abstinence in man: I. Changes in behavior and sleep. Drug Alcohol Depend. 1980, 5, 341–356. [Google Scholar] [CrossRef]
  60. Jurado-Barba, R.; Sion, A.; Martínez-Maldonado, A.; Domínguez-Centeno, I.; Prieto-Montalvo, J.; Navarrete, F.; García-Gutierrez, M.S.; Manzanares, J.; Rubio, G. Neuropsychophysiological measures of alcohol dependence: Can we use EEG in the clinical assessment? Front. Psychiatry 2020, 11, 676. [Google Scholar] [CrossRef]
  61. Kamarajan, C.; Porjesz, B.; Jones, K.; Chorlian, D.; Padmanabhapillai, A.; Rangaswamy, M.; Stimus, A.; Begleiter, H. Event-related oscillations in offspring of alcoholics: Neurocognitive disinhibition as a risk for alcoholism. Biol. Psychiatry 2006, 59, 625–634. [Google Scholar] [CrossRef]
  62. Logar, C.; Grabmair, W.; Reinbacher, N.; Ladurner, G. EEG changes in the withdrawal phase of tranquilizer or drug abuse. EEG EMG Z Elektroenzephalogr Elektromyogr Verwandte Geb 1986, 17, 37–40. [Google Scholar]
  63. Lukas, S.E.; Mendelson, J.H.; Kouri, E.; Bolduc, M.; Amass, L. Ethanol-induced alterations in EEG alpha activity and apparent source of the auditory P300 evoked response potential. Alcohol 1990, 7, 471–477. [Google Scholar] [CrossRef]
  64. Prichep, L.S.; Alper, K.; Kowalik, S.C.; Rosenthal, M. Neurometric QEEG studies of crack cocaine dependence and treatment outcome. J. Addict. Dis. 1996, 15, 39–53. [Google Scholar] [CrossRef] [PubMed]
  65. Prichep, L.S.; Kowalik, S.C.; Alper, K.; de Jesus, C. Quantitative EEG characteristics of children exposed in utero to cocaine. Clin. Electroencephalogr. 1995, 26, 166–172. [Google Scholar] [CrossRef] [PubMed]
  66. Rangaswamy, M.; Jones, K.A.; Porjesz, B.; Chorlian, D.B.; Padmanabhapillai, A.; Kamarajan, C.; Kuperman, S.; Rohrbaugh, J.; O’Connor, S.J.; Bauer, L.O.; et al. Delta and theta oscillations as risk markers in adolescent offspring of alcoholics. Int. J. Psychophysiol. 2007, 63, 3–15. [Google Scholar] [CrossRef] [PubMed]
  67. Roohi-Azizi, M.; Azimi, L.; Heysieattalab, S.; Aamidfar, M. Changes of the brain’s bioelectrical activity in cognition, consciousness, and some mental disorders. Med. J. Islam. Repub. Iran 2017, 31, 53. [Google Scholar] [CrossRef]
  68. Urbano, F.J.; Bisagno, V.; Garcia-Rill, E. Arousal and drug abuse. Behav. Brain Res. 2017, 333, 276–281. [Google Scholar] [CrossRef]
  69. Volavka, J.; Zaks, A.; Roubicek, J.; Fink, M. Acute EEG effects of heroin and naloxone. Electroencephalogr. Clin. Neurophysiol. 1971, 30, 165. [Google Scholar]
  70. Wang, Y.K.; Jung, T.P.; Lin, C.T. Theta and alpha oscillations in attentional interaction during distracted driving. Front. Behav. Neurosci. 2018, 12, 3. [Google Scholar] [CrossRef]
  71. Yener, G.G.; Başar, E. Brain oscillations as biomarkers in neuropsychiatric disorders: Following an interactive panel discussion and synopsis. Suppl. Clin. Neurophysiol. 2013, 62, 343–363. [Google Scholar] [CrossRef]
  72. Zhao, Q.; Li, H.; Hu, B.; Wu, H.; Liu, Q. Abstinent heroin addicts tend to take risks: ERP and source localization. Front. Neurosci. 2017, 11, 681. [Google Scholar] [CrossRef]
  73. Höller, Y. Quantitative EEG in Cognitive Neuroscience. Brain Sci. 2021, 11, 517. [Google Scholar] [CrossRef]
  74. Amass, L.; Lukas, S.E.; Weiss, R.D.; Mendelson, J. Evaluation of cognitive skills in ethanol- and cocaine-dependent patients during detoxification using P300 evoked response potentials (ERPs). NIDA Res. Monogr. 1989, 95, 353–354. [Google Scholar]
  75. Bahramali, H.; Gordon, E.; Li, W.M.; Rennie, C.; Wright, J.; Meares, R. Fast and slow reaction times and associated ERPs in patients with schizophrenia and controls. Int. J. Neurosci. 1998, 95, 155–165. [Google Scholar] [CrossRef] [PubMed]
  76. Carlson, S.R.; McLarnon, M.E.; Iacono, W.G. P300 amplitude, externalizing psychopathology, and earlier- versus later-onset substance-use disorder. J. Abnorm. Psychol. 2007, 116, 565–577. [Google Scholar] [CrossRef]
  77. Elkashef, A.; Vocci, F. Biological markers of cocaine addiction: Implications for medications development. Addict. Biol. 2003, 8, 123–139. [Google Scholar] [CrossRef] [PubMed]
  78. Emmerson, R.Y.; Dustman, R.E.; Shearer, D.E.; Chamberlin, H.M. EEG, visually evoked and event related potentials in young abstinent alcoholics. Alcohol 1987, 4, 241–248. [Google Scholar] [CrossRef] [PubMed]
  79. Iacono, W.G.; Carlson, S.R.; Malone, S.M. Identifying a multivariate endophenotype for substance use disorders using psychophysiological measures. Int. J. Psychophysiol. 2000, 38, 81–96. [Google Scholar] [CrossRef] [PubMed]
  80. Iacono, W.G.; Malone, S.M.; McGue, M. Substance use disorders, externalizing psychopathology, and P300 event-related potential amplitude. Int. J. Psychophysiol. 2003, 48, 147–178. [Google Scholar] [CrossRef]
  81. Lubman, D.I.; Yucel, M.; Kettle, J.W.; Scaffidi, A.; Mackenzie, T.; Simmons, J.G.; Allen, N.B. Responsiveness to drug cues and natural rewards in opiate addiction: Associations with later heroin use. Arch. Gen. Psychiatry 2009, 66, 205–212. [Google Scholar] [CrossRef]
  82. Marques-Teixeira, J.E.; Barbosa, M.F. Emotional states and informational brain processing in drug addicts free of drugs: An ERPs study. Int. J. Psychiatry Clin. Pract. 2005, 9, 213–220. [Google Scholar] [CrossRef]
  83. Polich, J. Clinical application of the P300 event-related brain potential. Phys. Med. Rehabil. Clin. N. Am. 2004, 15, 133–161. [Google Scholar] [CrossRef]
  84. Motlagh, F.; Ibrahim, F.; Rashid, R.; Seghatoleslam, T.; Habil, H. Investigation of brain electrophysiological properties among heroin addicts: Quantitative EEG and event-related potentials. J. Neurosci. Res. 2017, 95, 1633–1646. [Google Scholar] [CrossRef] [PubMed]
  85. Bauer, L.O. CNS recovery from cocaine, cocaine and alcohol, or opioid dependence: A P300 study. Clin. Neurophysiol. 2001, 112, 1508–1515. [Google Scholar] [CrossRef]
  86. Steffensen, S.C.; Ohran, A.J.; Shipp, D.N.; Hales, K.; Stobbs, S.H.; Fleming, D.E. Gender-selective effects of the P300 and N400 components of the visual evoked potential. Vis. Res. 2008, 48, 917–925. [Google Scholar] [CrossRef] [PubMed]
  87. Hedden, T.; Gabrieli, J.D. Insights into the ageing mind: A view from cognitive neuroscience. Nat. Rev. Neurosci. 2004, 5, 87–96. [Google Scholar] [CrossRef]
  88. Faresjö, T.; Faresjö, A. To match or not to match in epidemiological studies--same outcome but less power. Int. J. Environ. Res. Public Health 2010, 7, 325–332. [Google Scholar] [CrossRef] [PubMed]
  89. Király, A.; Szabó, N.; Tóth, E.; Csete, G.; Faragó, P.; Kocsis, K.; Must, A.; Vécsei, L.; Kincses, Z.T. Male brain ages faster: The age and gender dependence of subcortical volumes. Brain Imaging Behav. 2016, 10, 901–910. [Google Scholar] [CrossRef] [PubMed]
  90. Lortie, C.L.; Thibeault, M.; Guitton, M.J.; Tremblay, P. Effects of age on the amplitude, frequency and perceived quality of voice. Age 2015, 37, 117. [Google Scholar] [CrossRef]
  91. Saygili, E.; Kluttig, R.; Rana, O.R.; Saygili, E.; Gemein, C.; Zink, M.D.; Rackauskas, G.; Weis, J.; Schwinger, R.H.; Marx, N.; et al. Age-related regional differences in cardiac nerve growth factor expression. Age 2012, 34, 659–667. [Google Scholar] [CrossRef]
  92. Sella, O.; Jones, R.D.; Huckabee, M.L. Age and gender effects on submental motor-evoked potentials. Age 2014, 36, 9735. [Google Scholar] [CrossRef]
  93. Steffensen, S.C.; Taylor, S.R.; Horton, M.L.; Barber, E.N.; Lyle, L.T.; Stobbs, S.H.; Allison, D.W. Cocaine disinhibits dopamine neurons in the ventral tegmental area via use-dependent blockade of GABA neuron voltage-sensitive sodium channels. Eur. J. Neurosci. 2008, 28, 2028–2040. [Google Scholar] [CrossRef]
  94. Steffensen, S.C.; Walton, C.H.; Hansen, D.M.; Yorgason, J.T.; Gallegos, R.A.; Criado, J.R. Contingent and non-contingent effects of low-dose ethanol on GABA neuron activity in the ventral tegmental area. Pharmacol. Biochem. Behav. 2009, 92, 68–75. [Google Scholar] [CrossRef] [PubMed]
  95. CITI Program. The Collaborative Institutional Training Initiative (CITI Program). Available online: https://about.citiprogram.org/en/module/research-and-hipaa-privacy-protections/ (accessed on 8 December 2020).
  96. Jarvis, M.; Williams, J.; Hurford, M.; Lindsay, D.; Lincoln, P.; Giles, L.; Luongo, P.; Safarian, T. Appropriate use of drug testing in clinical addiction medicine. J. Addict. Med. 2017, 11, 163–173. [Google Scholar] [CrossRef] [PubMed]
  97. Jasper, H. Progress and problems in brain research. J. Mt. Sinai Hosp. N. Y. 1958, 25, 244–253. [Google Scholar] [PubMed]
  98. R Core Team. R: A Language and Environment for Statistical Computing. Available online: http://www.R-project.org/ (accessed on 6 June 2020).
  99. SAS Institute Inc. SAS/STAT® 9.2 User’s Guide; SAS Institute Inc.: Hongkong, China, 2008. [Google Scholar]
  100. Chiappa, K.A. Evoked Potentials in Clinical Medicine, 3rd ed.; Lippincott Williams & Wilkins: New York, NY, USA, 1997; p. 720. [Google Scholar]
  101. Luck, S.J. An Introduction to the Event-Related Potential Technique, 2nd ed.; A Bradford Book; The MIT Press: Cambridge, MA, USA, 2014; p. 406. [Google Scholar]
  102. Kouri, E.M.; Lukas, S.E.; Mendelson, J.H. P300 assessment of opiate and cocaine users: Effects of detoxification and buprenorphine treatment. Biol. Psychiatry 1996, 40, 617–628. [Google Scholar] [CrossRef] [PubMed]
  103. Kopell, B.S.; Roth, W.T.; Tinklenberg, J.R. Time course effects of marijuana and ethanol on event-related potentials. Psychopharmacology 1978, 56, 15–20. [Google Scholar] [CrossRef]
  104. Begleiter, H.; Porjesz, B.; Tenner, M. Neuroradiological and neurophysiological evidence of brain deficits in chronic alcoholics. Acta Psychiatr. Scand. Suppl. 1980, 286, 3–13. [Google Scholar] [CrossRef]
  105. Pfefferbaum, A.; Horvath, T.B.; Roth, W.T.; Kopell, B.S. Event-related potential changes in chronic alcoholics. Electroencephalogr. Clin. Neurophysiol. 1979, 47, 637–647. [Google Scholar] [CrossRef]
  106. Pfefferbaum, A.; Horvath, T.B.; Roth, W.T.; Clifford, S.T.; Kopell, B.S. Acute and chronic effects of ethanol on event-related potentials. Adv. Exp. Med. Biol. 1980, 126, 625–639. [Google Scholar] [CrossRef]
  107. Herning, R.I.; Jones, R.T.; Hooker, W.D.; Tulunay, F.C. Information processing components of the auditory event related potential are reduced by cocaine. Psychopharmacology 1985, 87, 178–185. [Google Scholar] [CrossRef]
  108. Bauer, L.O.; Hesselbrock, V.M. P300 decrements in teenagers with conduct problems: Implications for substance abuse risk and brain development. Biol. Psychiatry 1999, 46, 263–272. [Google Scholar] [CrossRef]
  109. Bauer, L.O.; Hesselbrock, V.M. Signal in the noise: Altered brain activation among adolescent alcohol users detected via the analysis of intra-individual variability(1). Psychopharmacology 2022, 239, 3595–3604. [Google Scholar] [CrossRef] [PubMed]
  110. Iacono, W.G.; Carlson, S.R.; Malone, S.M.; McGue, M. P3 event-related potential amplitude and the risk for disinhibitory disorders in adolescent boys. Arch. Gen. Psychiatry 2002, 59, 750–757. [Google Scholar] [CrossRef] [PubMed]
  111. Porjesz, B.; Rangaswamy, M. Neurophysiological endophenotypes, CNS disinhibition, and risk for alcohol dependence and related disorders. ScientificWorldJournal 2007, 7, 131–141. [Google Scholar] [CrossRef] [PubMed]
  112. Ritter, W.; Ford, J.M.; Gaillard, A.W.; Harter, M.R.; Kutas, M.; Näätänen, R.; Polich, J.; Renault, B.; Rohrbaugh, J. Cognition and event-related potentials. I. The relation of negative potentials and cognitive processes. Ann. N. Y. Acad. Sci. 1984, 425, 24–38. [Google Scholar] [CrossRef]
  113. Pandey, A.K.; Kamarajan, C.; Tang, Y.; Chorlian, D.B.; Roopesh, B.N.; Manz, N.; Stimus, A.; Rangaswamy, M.; Porjesz, B. Neurocognitive deficits in male alcoholics: An ERP/sLORETA analysis of the N2 component in an equal probability Go/NoGo task. Biol. Psychol. 2012, 89, 170–182. [Google Scholar] [CrossRef] [PubMed]
  114. Olbrich, H.M.; Maes, H.; Gann, H.; Hagenbuch, F.; Feige, B. Auditory and visual event-related potentials in alcoholics: Abnormalities of components and brain electrical field. Eur. Arch. Psychiatry Clin. Neurosci. 2000, 250, 215–220. [Google Scholar] [CrossRef]
  115. Bauer, L.O.; Hesselbrock, V.M. Brain maturation and subtypes of conduct disorder: Interactive effects on p300 amplitude and topography in male adolescents. J. Am. Acad. Child Adolesc. Psychiatry 2003, 42, 106–115. [Google Scholar] [CrossRef]
  116. Pandey, A.K.; Kamarajan, C.; Manz, N.; Chorlian, D.B.; Stimus, A.; Porjesz, B. Delta, theta, and alpha event-related oscillations in alcoholics during Go/NoGo task: Neurocognitive deficits in execution, inhibition, and attention processing. Prog. Neuropsychopharmacol. Biol. Psychiatry 2016, 65, 158–171. [Google Scholar] [CrossRef]
  117. Nash, M. The Effect of Menstrual Phases on Visual Attention and Event-Related Potentials. Master’s Thesis, Brigham Young University, Provo, UT, USA, 2009. [Google Scholar]
  118. Wolf, M.M. Association between Academic Performance and Electro-Cortical Processing of Cognitive Stimuli in College Students. Master’s Thesis, Brigham Young University, Provo, UT, USA, 2011. [Google Scholar]
  119. Matthews, S.; Dwyer, R.; Snoek, A. Stigma and Self-Stigma in Addiction. J. Bioeth. Inq. 2017, 14, 275–286. [Google Scholar] [CrossRef]
  120. Nyblade, L.; Stockton, M.A.; Giger, K.; Bond, V.; Ekstrand, M.L.; Lean, R.M.; Mitchell, E.M.H.; Nelson, R.E.; Sapag, J.C.; Siraprapasiri, T.; et al. Stigma in health facilities: Why it matters and how we can change it. BMC Med. 2019, 17, 25. [Google Scholar] [CrossRef]
  121. Smookler, H.H.; Buckley, J.P. Effect of drugs on animals exposed to chronic environmental stress. Fed. Proc. 1970, 29, 1980–1984. [Google Scholar] [PubMed]
  122. Gonzalez, G.; Oliveto, A.; Kosten, T.R. Combating opiate dependence: A comparison among the available pharmacological options. Expert Opin. Pharmacother. 2004, 5, 713–725. [Google Scholar] [CrossRef] [PubMed]
  123. Rich, J.D.; McKenzie, M.; Shield, D.C.; Wolf, F.A.; Key, R.G.; Poshkus, M.; Clarke, J. Linkage with methadone treatment upon release from incarceration: A promising opportunity. J. Addict. Dis. 2005, 24, 49–59. [Google Scholar] [CrossRef] [PubMed]
  124. Coviello, D.M.; Alterman, A.I.; Cacciola, J.S.; Rutherford, M.J.; Zanis, D.A. The role of family history in addiction severity and treatment response. J. Subst. Abuse Treat. 2004, 26, 303–313. [Google Scholar] [CrossRef]
  125. Sewards, T.V.; Sewards, M.A. Alpha-band oscillations in visual cortex: Part of the neural correlate of visual awareness? Int. J. Psychophysiol. 1999, 32, 35–45. [Google Scholar] [CrossRef]
  126. Ro, T. Alpha oscillations and feedback processing in visual cortex for conscious perception. J. Cogn. Neurosci. 2019, 31, 948–960. [Google Scholar] [CrossRef]
  127. Romei, V.; Brodbeck, V.; Michel, C.; Amedi, A.; Pascual-Leone, A.; Thut, G. Spontaneous fluctuations in posterior alpha-band EEG activity reflect variability in excitability of human visual areas. Cereb. Cortex 2008, 18, 2010–2018. [Google Scholar] [CrossRef]
  128. Başar, E. Brain oscillations in neuropsychiatric disease. Dialogues Clin. Neurosci. 2013, 15, 291–300. [Google Scholar] [CrossRef]
  129. van Diepen, R.M.; Miller, L.M.; Mazaheri, A.; Geng, J.J. The role of alpha activity in spatial and feature-based attention. eNeuro 2016, 3, ENEURO.0204-16.2016. [Google Scholar] [CrossRef]
  130. Herring, J.D.; Thut, G.; Jensen, O.; Bergmann, T.O. Attention modulates TMS-locked alpha oscillations in the visual cortex. J. Neurosci. 2015, 35, 14435–14447. [Google Scholar] [CrossRef]
  131. Miyauchi, E.; Kawasaki, M. Electroencephalogram oscillations support the involvement of task-unrelated thoughts in the mechanism of boredom: A pilot study. Neurosci. Lett. 2018, 677, 72–77. [Google Scholar] [CrossRef]
  132. Foxe, J.J.; Simpson, G.V.; Ahlfors, S.P. Parieto-occipital approximately 10 Hz activity reflects anticipatory state of visual attention mechanisms. Neuroreport 1998, 9, 3929–3933. [Google Scholar] [CrossRef]
  133. Mathewson, K.E.; Gratton, G.; Fabiani, M.; Beck, D.M.; Ro, T. To see or not to see: Prestimulus alpha phase predicts visual awareness. J. Neurosci. 2009, 29, 2725–2732. [Google Scholar] [CrossRef]
  134. Newson, J.J.; Thiagarajan, T.C. EEG frequency bands in psychiatric disorders: A review of resting state studies. Front. Hum. Neurosci. 2018, 12, 521. [Google Scholar] [CrossRef]
  135. Cona, G.; Chiossi, F.; Di Tomasso, S.; Pellegrino, G.; Piccione, F.; Bisiacchi, P.; Arcara, G. Theta and alpha oscillations as signatures of internal and external attention to delayed intentions: A magnetoencephalography (MEG) study. Neuroimage 2020, 205, 116295. [Google Scholar] [CrossRef]
  136. Deiber, M.P.; Hasler, R.; Colin, J.; Dayer, A.; Aubry, J.M.; Baggio, S.; Perroud, N.; Ros, T. Linking alpha oscillations, attention and inhibitory control in adult ADHD with EEG neurofeedback. Neuroimage Clin. 2020, 25, 102145. [Google Scholar] [CrossRef]
  137. Fingelkurts, A.; Kahkonen, S.; Fingelkurts, A.; Kivisaari, R.; Borisov, S.; Puuskari, V.; Jokela, O.; Autti, T. Reorganization of the composition of brain oscillations and their temporal characteristics during opioid withdrawal. J. Psychopharmacol. 2008, 22, 270–284. [Google Scholar] [CrossRef]
  138. Fingelkurts, A.A.; Fingelkurts, A.A.; Kivisaari, R.; Autti, T.; Borisov, S.; Puuskari, V.; Jokela, O.; Kahkonen, S. Increased local and decreased remote functional connectivity at EEG alpha and beta frequency bands in opioid-dependent patients. Psychopharmacology 2006, 188, 42–52. [Google Scholar] [CrossRef]
  139. Forschack, N.; Nierhaus, T.; Müller, M.M.; Villringer, A. Alpha-band brain oscillations shape the processing of perceptible as well as imperceptible somatosensory stimuli during selective attention. J. Neurosci. 2017, 37, 6983–6994. [Google Scholar] [CrossRef]
  140. Foster, J.J.; Awh, E. The role of alpha oscillations in spatial attention: Limited evidence for a suppression account. Curr. Opin. Psychol. 2019, 29, 34–40. [Google Scholar] [CrossRef]
  141. Gardner, E.L. Addiction and brain reward and antireward pathways. Adv. Psychosom. Med. 2011, 30, 22–60. [Google Scholar] [CrossRef]
  142. Ikkai, A.; Dandekar, S.; Curtis, C.E. Lateralization in alpha-band oscillations predicts the locus and spatial distribution of attention. PLoS ONE 2016, 11, e0154796. [Google Scholar] [CrossRef]
  143. Koob, G.F. A role for brain stress systems in addiction. Neuron 2008, 59, 11–34. [Google Scholar] [CrossRef]
  144. Magosso, E.; De Crescenzio, F.; Ricci, G.; Piastra, S.; Ursino, M. EEG alpha power is modulated by attentional changes during cognitive tasks and virtual reality immersion. Comput. Intell. Neurosci. 2019, 2019, 7051079. [Google Scholar] [CrossRef]
  145. Mangun, G.R. Neural mechanisms of visual selective attention. Psychophysiology 1995, 32, 4–18. [Google Scholar] [CrossRef]
  146. Mo, J.; Liu, Y.; Huang, H.; Ding, M. Coupling between visual alpha oscillations and default mode activity. Neuroimage 2013, 68, 112–118. [Google Scholar] [CrossRef]
  147. Motlagh, F.; Ibrahim, F.; Menke, J.M.; Rashid, R.; Seghatoleslam, T.; Habil, H. Neuroelectrophysiological approaches in heroin addiction research: A review of literatures. J. Neurosci. Res. 2016, 94, 297–309. [Google Scholar] [CrossRef]
  148. Samaha, J.; Postle, B.R. The speed of alpha-band oscillations predicts the temporal resolution of visual perception. Curr. Biol. 2015, 25, 2985–2990. [Google Scholar] [CrossRef]
  149. Samaha, J.; Sprague, T.C.; Postle, B.R. Decoding and Reconstructing the Focus of Spatial Attention from the Topography of Alpha-band Oscillations. J. Cogn. Neurosci. 2016, 28, 1090–1097. [Google Scholar] [CrossRef]
  150. White, F.J.; Kalivas, P.W. Neuroadaptations involved in amphetamine and cocaine addiction. Drug Alcohol Depend. 1998, 51, 141–153. [Google Scholar] [CrossRef]
  151. Wise, R.A.; Hoffman, D.C. Localization of drug reward mechanisms by intracranial injections. Synapse 1992, 10, 247–263. [Google Scholar] [CrossRef]
  152. Buckley, D.I.; Calvert, J.F.; Lapidus, J.A.; Morris, C.D. Chronic opioid therapy and preventive services in rural primary care: An Oregon rural practice-based research network study. Ann. Fam. Med. 2010, 8, 237–244. [Google Scholar] [CrossRef] [PubMed]
  153. Chou, R.; Ballantyne, J.C.; Fanciullo, G.J.; Fine, P.G.; Miaskowski, C. Research gaps on use of opioids for chronic noncancer pain: Findings from a review of the evidence for an American Pain Society and American Academy of Pain Medicine clinical practice guideline. J. Pain 2009, 10, 147–159. [Google Scholar] [CrossRef]
  154. Fishbein, D.H.; Krupitsky, E.; Flannery, B.A.; Langevin, D.J.; Bobashev, G.; Verbitskaya, E.; Augustine, C.B.; Bolla, K.I.; Zvartau, E.; Schech, B.; et al. Neurocognitive characterizations of Russian heroin addicts without a significant history of other drug use. Drug Alcohol Depend. 2007, 90, 25–38. [Google Scholar] [CrossRef]
  155. Webster, L.R.; Webster, R.M. Predicting aberrant behaviors in opioid-treated patients: Preliminary validation of the Opioid Risk Tool. Pain Med. 2005, 6, 432–442. [Google Scholar] [CrossRef] [PubMed]
  156. Pascoli, V.; Turiault, M.; Luscher, C. Reversal of cocaine-evoked synaptic potentiation resets drug-induced adaptive behaviour. Nature 2012, 481, 71–75. [Google Scholar] [CrossRef] [PubMed]
  157. Wolf, M.E. Neuroscience: Behavioural effects of cocaine reversed. Nature 2012, 481, 36–37. [Google Scholar] [CrossRef]
  158. Chauvet, C.; Lardeux, V.; Jaber, M.; Solinas, M. Brain regions associated with the reversal of cocaine conditioned place preference by environmental enrichment. Neuroscience 2011, 184, 88–96. [Google Scholar] [CrossRef]
  159. Gazzaniga, M.S. Who’s in Charge?: Free Will and the Science of the Brain; Ecco: New York, NY, USA, 2011; p. 272. [Google Scholar]
  160. Petrie, J. Visual Attention, Color Processing and Physiological Measure Differences in Males and Females with Substance Abuse and Opiate Addiction. Ph.D. Thesis, Brigham Young University, Provo, UT, USA, 2012. [Google Scholar]
Figure 1. Gender-specific differences in event-related potentials in a visual object recognition task. Insets show the Standard, Irrelevant, and Relevant stimuli (50 ms) that were randomly presented at 2–4 s intervals over 10 min. Participants responded to the Relevant oddball open diamond “pop out” stimuli. (A,B) Each graph depicts superimposed grand-average visual event potentials (VEPs; N50, P100, N100, P200, N200, and P300) in response to Standard, Irrelevant, and Relevant stimuli during the Go/No-Go visual object recognition tasks. VEPs were recorded at electrode Pz in males (A) and females (B). Time of stimulus presentation is noted by dashed lines. Average Go Response reaction time (RT) is also noted by arrows. Of particular note is the stimulus-specific difference in P300 ERPs for the Relevant condition (vs. Irrelevant and Standard) in both men and women. The 128 sensor topo maps (colored circles) represent grand-averaged potentials obtained from across the head for all men compared to all women participants at 349 ms (P300) after the presentation of the stimuli. These maps are oriented as if looking down on the head from above (top of circle = front of head, bottom of circle = back of head). Extreme negative potentials are depicted in violet, and extreme positive potentials are shown in red. Again, note the differentiation across stimuli conditions of the P300 ERPs associated with the Relevant stimulus in both men and women on the topo maps and their prominence in the back of the head for the men but not for women. (C,D) These composite plots give a summary of descriptive statistics for ERP amplitude and latency measurements taken at location Pz for Relevant stimuli only across back of the head electrodes. They show the data points for each of the 38 participants by gender and ERP component. Male non-OUD subjects were characterized by significantly larger N200 and P300 amplitudes and shorter latencies than female non-OUD subjects. Note ** p < 0.001; *** p < 0.0001.
Biomedicines 11 02460 g001
Figure 2. Effects of opioid use disorder on event-related potentials in a visual object recognition task. (A) Grand averaged visual event potentials (VEPs) obtained at Pz in men and women non-OUD controls vs. men and women with OUD for the Relevant stimulus. Compared to controls, those with OUD were characterized by smaller P300s on the grand-averaged waveform. (B) This graph summarizes ERP amplitude measurements in men and women and those with OUD. Scatter plots represent all the values in each group. Men had significantly greater N200 and P300 amplitudes compared to women regardless of OUD. However, there was a significant decrease in P300 ERP amplitudes for women with OUD. (C) This graph summarizes ERP latency measurements in men and women and those with OUD. Men had significantly shorter N200 and P300 latencies compared to women. Most interestingly, those with OUD had significantly longer N200 and P300 latencies in men, but shorter latencies in women. (D,E) In order to better demonstrate this double dissociation, standardized values for all participants by latency vs. amplitude are plotted in vectors to show the differential contrast between OUD and gender for N200 (D) and P300 (E).Note * p < 0.05; ** p < 0.001; *** p < 0.0001.
Biomedicines 11 02460 g002
Figure 3. Gender differences in alpha and beta oscillations in a visual object recognition task. (A) This is a representative 2 s trace of raw electroencephalogram (EEG) data obtained in one non-OUD male participant at Pz for a Relevant stimulus. Note the feedback oscillations that occurred at around 1200 ms after the stimulus, when the feedback message was delivered to the subject. (B) Raw EEG data from a Relevant stimulus epoch in the same subject in (A) for all electrodes on the head. Top is front and bottom is back of the head. Note the oscillations that appeared during the feedback stimulus all around the head, but most evident at the back of the head. (C) Raw EEG epoch from one back of the head electrodes in (B) showing the robust oscillations during the feedback message as a Raster color plot of individual traces obtained for each of the 154 stimuli presented in one session for this representative participant. Red represents high positive amplitudes and violet represents low. Note that the oscillations are present for most of the epochs. (D) Wavelet analysis of a Relevant stimulus epoch from the same electrode shown in (C). Red indicates positive power while violet indicates negative. Note that in this subject there is robust theta, alpha, and beta power during the feedback stimulus. (E) This graph shows wavelet analysis of the average power for 4 bands during the feedback Relevant stimulus in this subject. Note that the feedback oscillation is dominated by alpha and beta activity. (F) Superimposed grand-averaged wavelets of alpha (8–13 Hz; above) and beta (13–30 Hz; below) activity in males vs. females for the Relevant stimuli. Note that alpha and beta activity is high around 1200 ms after the stimulus, which reflects the raw waveforms and wavelet analysis in (BD). The dashed-line box indicates the window during the feedback stimulus which was used for determination of alpha and beta power. (G) This graph shows alpha and beta power (trapezoidal integration of area in dashed boxes shown in (C,D) over the epoch) for all men compared to all women for the Relevant stimulus condition across back of the head electrodes. Note that both alpha and beta power are significantly higher in men overall than for women Note * p < 0.05.
Biomedicines 11 02460 g003
Figure 4. Effects of opioid use disorder (OUD) on alpha and beta oscillations in a visual object recognition task. (A) Superimposed grand-averaged alpha and beta (B) power determined with wavelet analysis comparing men vs. women and OUD vs. non-OUD participants. There appears to be a tendency for men’s waveforms to be greater than those for women during the feedback stimulus shown during the dashed-lined box corresponding to the feedback stimulus. (C) This graph shows alpha and beta power measurements for all men compared to all women and OUD vs. non-OUD. Although the trend was for OUD male and female subjects to have lower have lower alpha power, it was not significant. However, beta power was significantly lower in men and women participants with OUD vs. non-OUD controls. Note * p < 0.05.
Biomedicines 11 02460 g004
Table 1. Two-factor authentication of mixed-model multivariate analysis of variance (MANOVA) of the effects of opioid use disorder (OUD) nested within gender on P300 and N200 amplitudes and latencies and wavelet power levels.
A. Univariate Test
Gender EffectsOUD Effects within Gender
(Fixed)(Random)
VariableF(1, 34)pη2F(2, 34)pη2
P300
    Amplitude 25.16<0.0001 ***0.4110.37880.033
    Latency3.520.06920.04916.63<0.0001 ***0.462
N200
    Amplitude14.50.0006 ***0.2890.940.40180.037
    Latency1.060.31050.0199.840.0004 *0.356
Wavelet Power
    Alpha 3.830.05850.0951.210.31110.06
    Beta 4.220.0477 ***0.0713.760.0333 *0.165
B. Multivariate Tests
Gender Effects
(Fixed)
Opioid Effects within Gender
‡ (Random)
† Variable and TestValuepValuep
P300
    Wilks’ lambda0.5735150.0001 ***0.469855<0.0001 ***
    Pillai’s trace0.4264850.0001 ***0.5546210.0002 ***
    Hotelling-Lawley Trace0.7436320.0001 ***1.076223<0.0001 ***
    Roy’s Greatest Root0.7436320.0001 ***1.025422<0.0001 ***
N200
    Wilks’ lambda0.693950.0024 ***0.5980110.0018 ***
    Pillai’s trace0.306050.0024 ***0.4050140.0036 ***
    Hotelling-Lawley Trace0.4410260.0024 ***0.6671520.0014 ***
    Roy’s Greatest Root0.4410260.0024 ***0.6594820.0002 ***
Wavelet Power
    Wilks’ lambda0.8453760.06260.8068480.1263
    Pillai’s trace0.1546240.06260.1931690.1355
    Hotelling-Lawley Trace0.1829050.06260.2393710.1206
    Roy’s Greatest Root0.1829050.06260.2392860.0261
†, ‡ Mixed-model correction does not affect the random factor. The mixed-model analysis is used to properly adjust the fixed factor with which the random factor is crossed or nested. Note * p < 0.05; *** p < 0.0001.
Table 2. Means and confidence intervals (CI) for the two-factor mixed-model MANOVA of the effects of gender and opioid use disorder (OUD) status nested within gender.
VariablesMeans
(95% CI)
Z-Score Means
(95% CI)
P300 Amplitude
Female
OUD2.257 (1.670, 2.844)−0.358 (−0.698, −0.018)
Control3.148 (2.201, 4.095)0.158 (−0.390, 0.706)
Male
OUD5.082 (3.749, 6.415)1.279 (0.507, 2.051)
Control5.665 (4.514, 6.816)1.616 (0.949, 2.283)
P300 Latency
Female
OUD339.5 (309.8, 369.1)−0.897 (−1.348, −0.446)
Control460.7 (425.7, 495.8)0.945 (0.413, 1.477)
Male
OUD470.4 (434.4, 506.4)1.092 (0.545, 1.639)
Control395.4 (359.2, 431.6)−0.047 (−0.596, 0.502)
N200 Amplitude
Female
OUD1.750 (1.459, 2.041)−0.518 (−0.858, −0.178)
Control1.710 (1.075, 2.345)−0.553 (−1.101, −0.004)
Male
OUD2.620 (1.785, 3.455)0.144 (−0.628, 0.917)
Control3.240 (2.664, 3.816)0.606 (−0.061, 1.273)
N200 Latency
Female
OUD274.0 (252.7, 295.3)−0.660 (−1.110, −0.209)
Control304.7 (285.6, 323.8)0.124 (−0.408, 0.656)
Male
OUD329.5 (305.1, 353.8)0.755 (0.208, 1.302)
Control271.0 (254.5, 287.5)−0.737 (−1.286, −0.189)
Alpha Wavelet Power
Female
OUD0.1107 (0.0651, 0.1563)−0.795 (−1.278, −0.312)
Control0.1498 (0.0918, 0.2078)−0.381 (−0.995, 0.233)
Male
OUD0.1624 (0.1994, 0.2255)−0.248 (−0.916, 0.420)
Control0.2155 (0.1483, 0.2826)0.314 (−0.397, 1.025)
Beta Wavelet Power
Female
OUD0.1421 (0.1154, 0.1687)−0.219 (−0.748, 0.310)
Control0.1769 (0.1458, 0.2080)0.472 (−0.146, 1.089)
Male
OUD0.1667 (0.1320, 0.2013)0.269 (−0.418, 0.957)
Control0.2175 (0.1863, 0.2487)1.227 (0.659, 1.896)
Table 3. Correlation matrix for all event-related potentials (ERPs) and wavelets variables for the Relevant condition in the object recognition task.
N200
Amplitude
P300
Amplitude
N200
Latency
P300
Latency
AlphaBeta
N200 amplitude1
P300 amplitude0.581
N200 latency0.040.041
P300 latency0.150.370.541
alpha0.030.010.270.031
beta0.15−0.03−0.17−0.040.431
Disclaimer/Publisher’s Note: The statements, opinions and data contained in all publications are solely those of the individual author(s) and contributor(s) and not of MDPI and/or the editor(s). MDPI and/or the editor(s) disclaim responsibility for any injury to people or property resulting from any ideas, methods, instructions or products referred to in the content.

