
Investigation of the Effect of Exendin-4 on Oleic Acid-Induced Steatosis in HepG2 Cells Using Fourier Transform Infrared Spectroscopy
 , , , , and
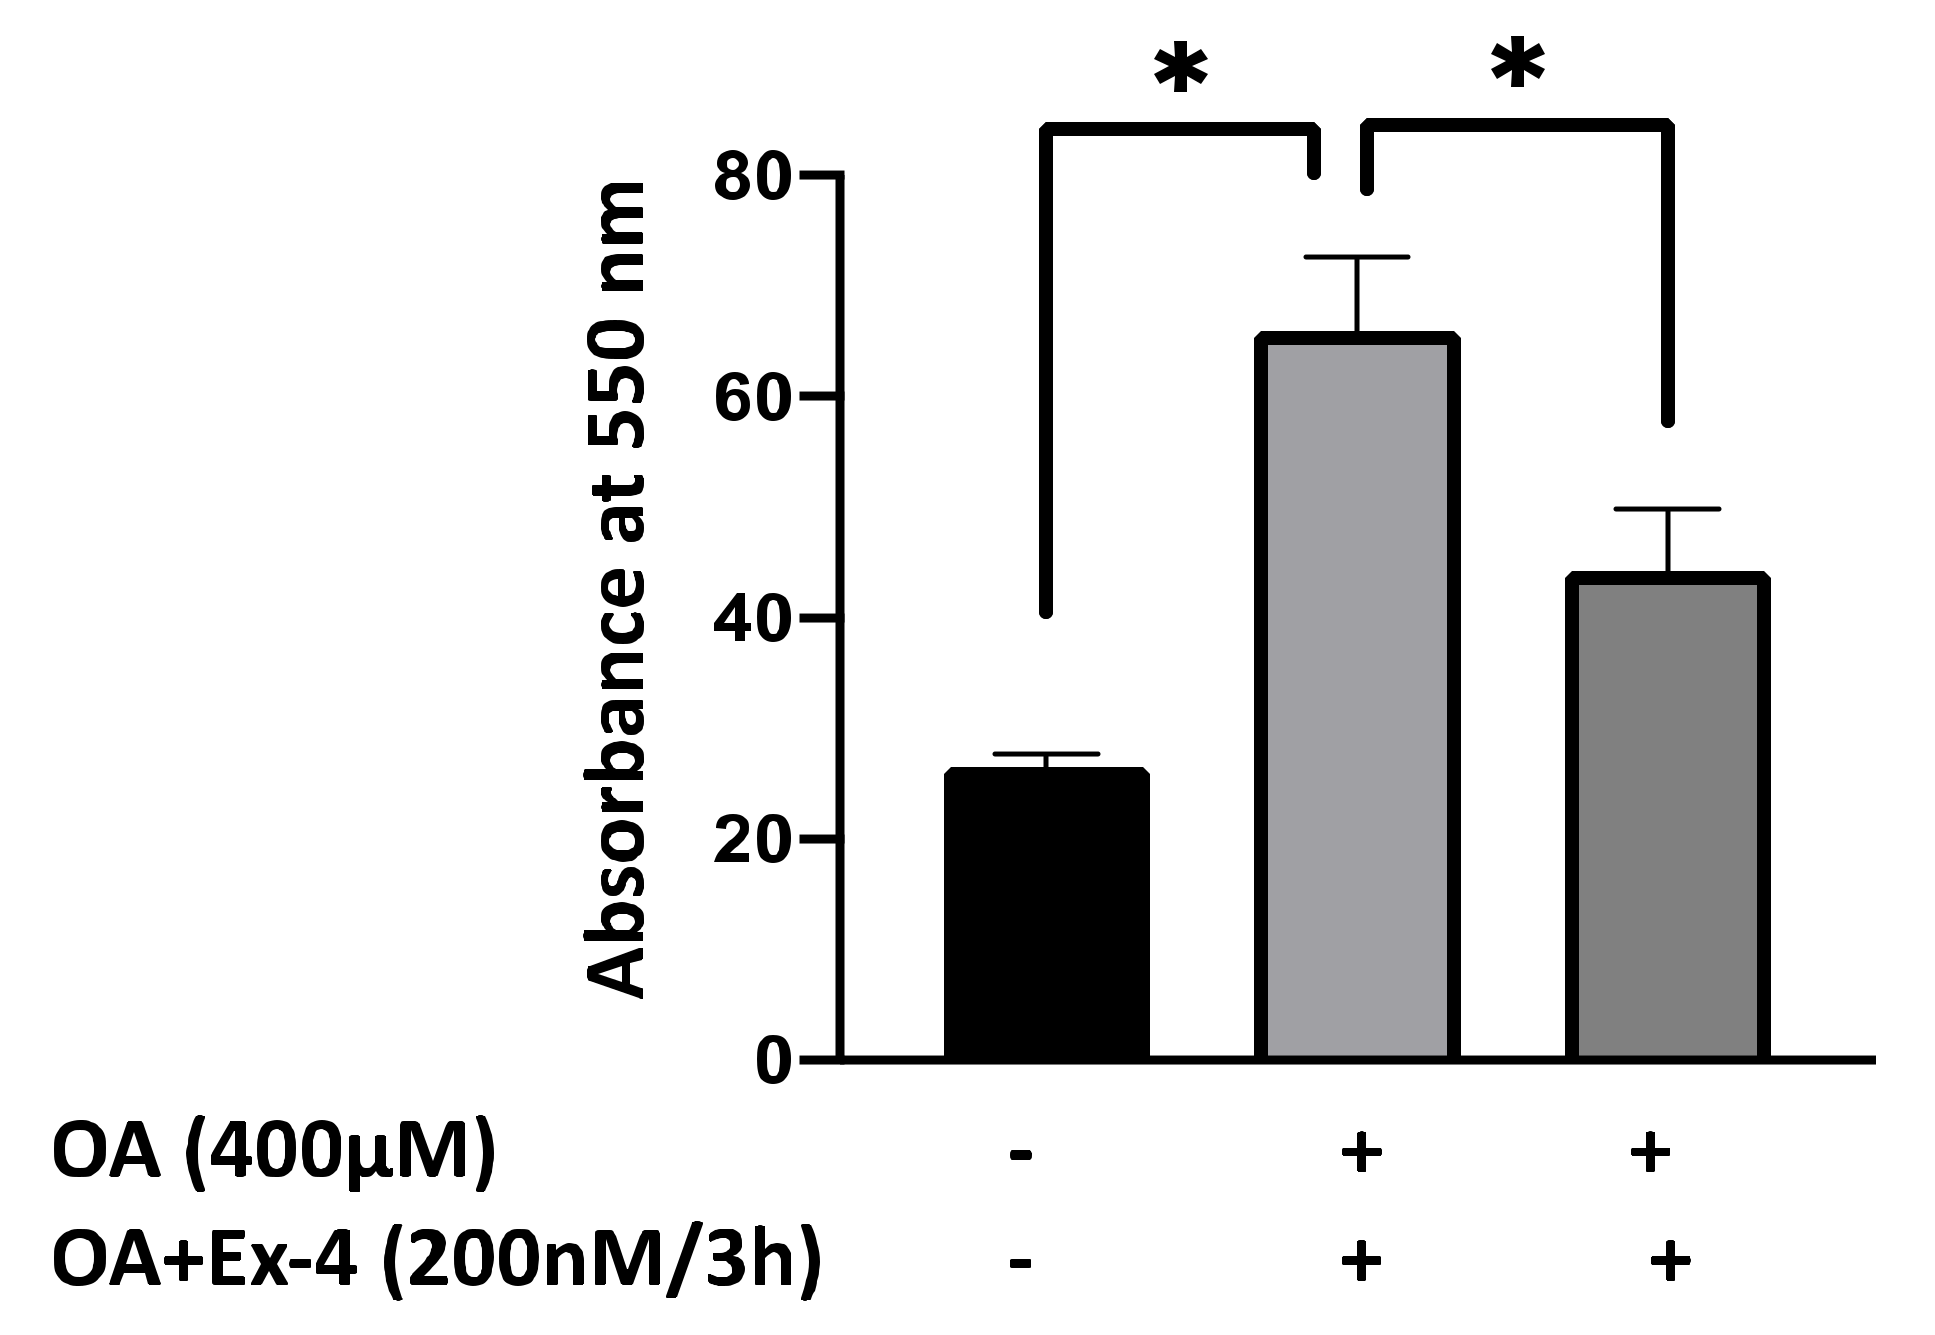
Abstract
:1. Introduction
2. Materials and Methods
2.1. HepG2 Culture
2.2. Preparation of Oleic Acid
2.3. Induction of Steatosis and Treatment with Exendin-4
2.4. Quantification of Steatosis
2.5. Sample Preparation for FTIR Analysis
2.6. FTIR Data Collection
2.7. FTIR Data Processing and Analysis
2.8. Chemometric Analysis
3. Results
3.1. Ex-4 Significantly Reduces OA-Induced Lipid Accumulation in HepG2
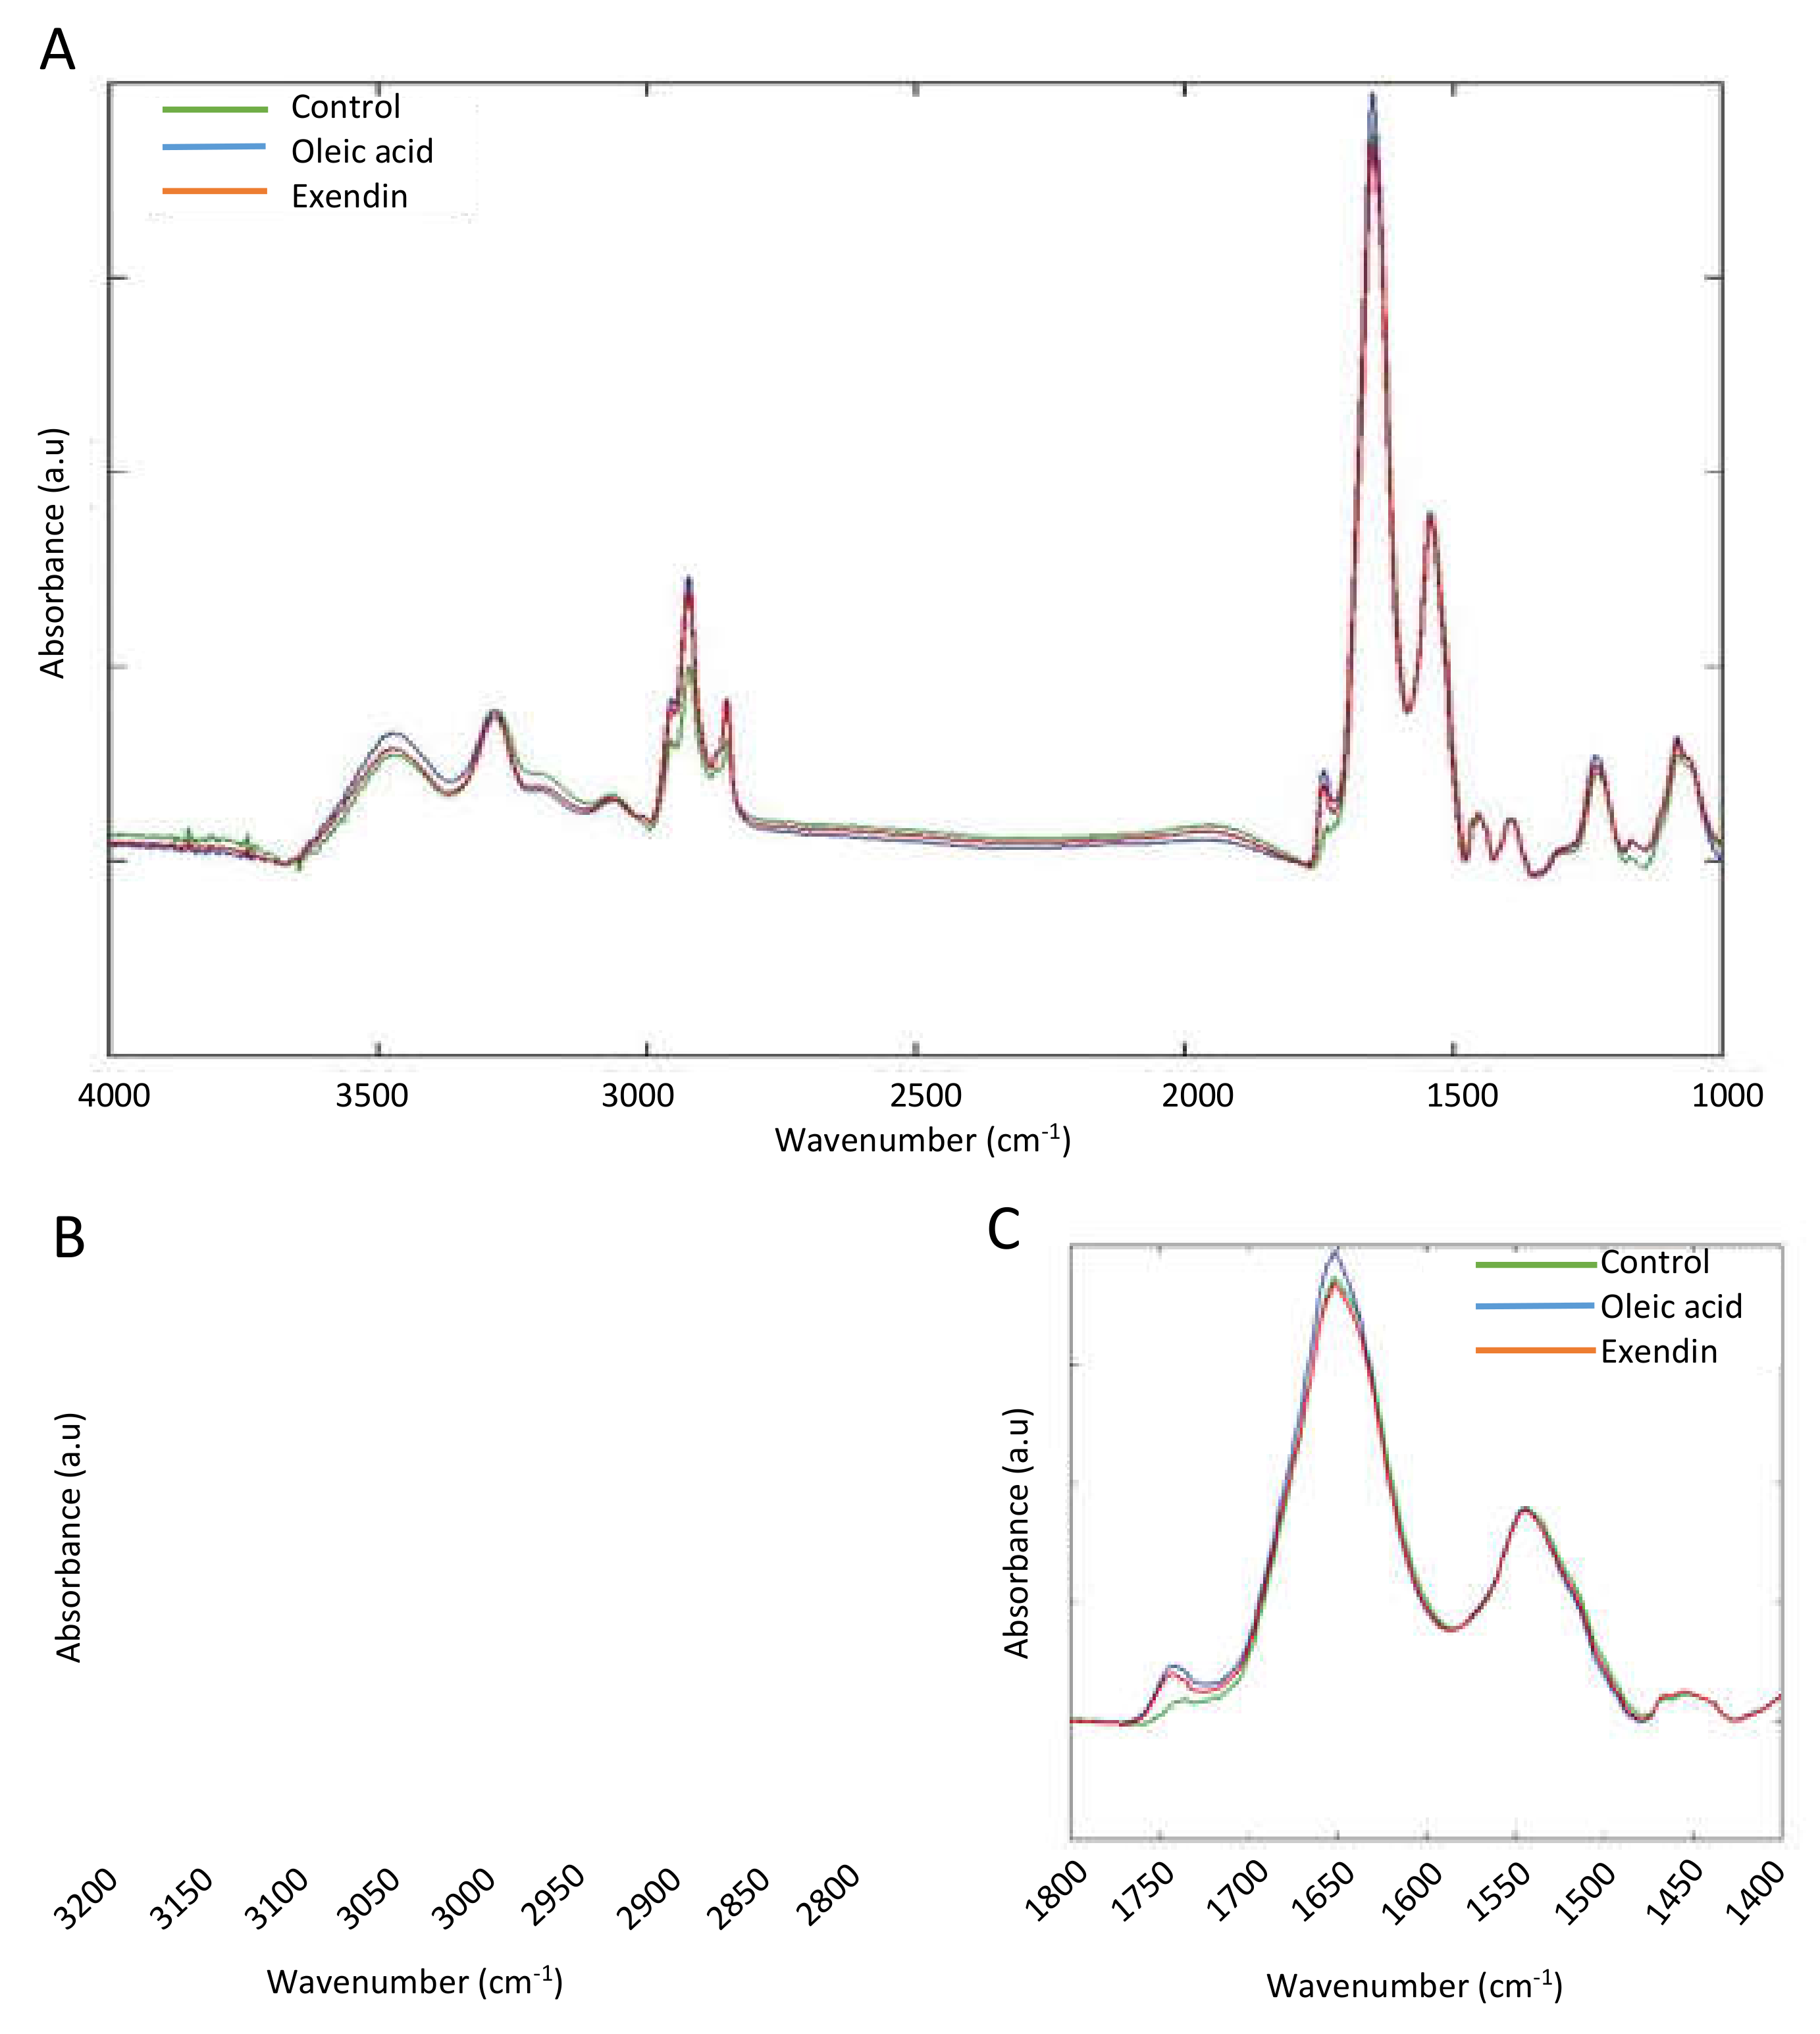
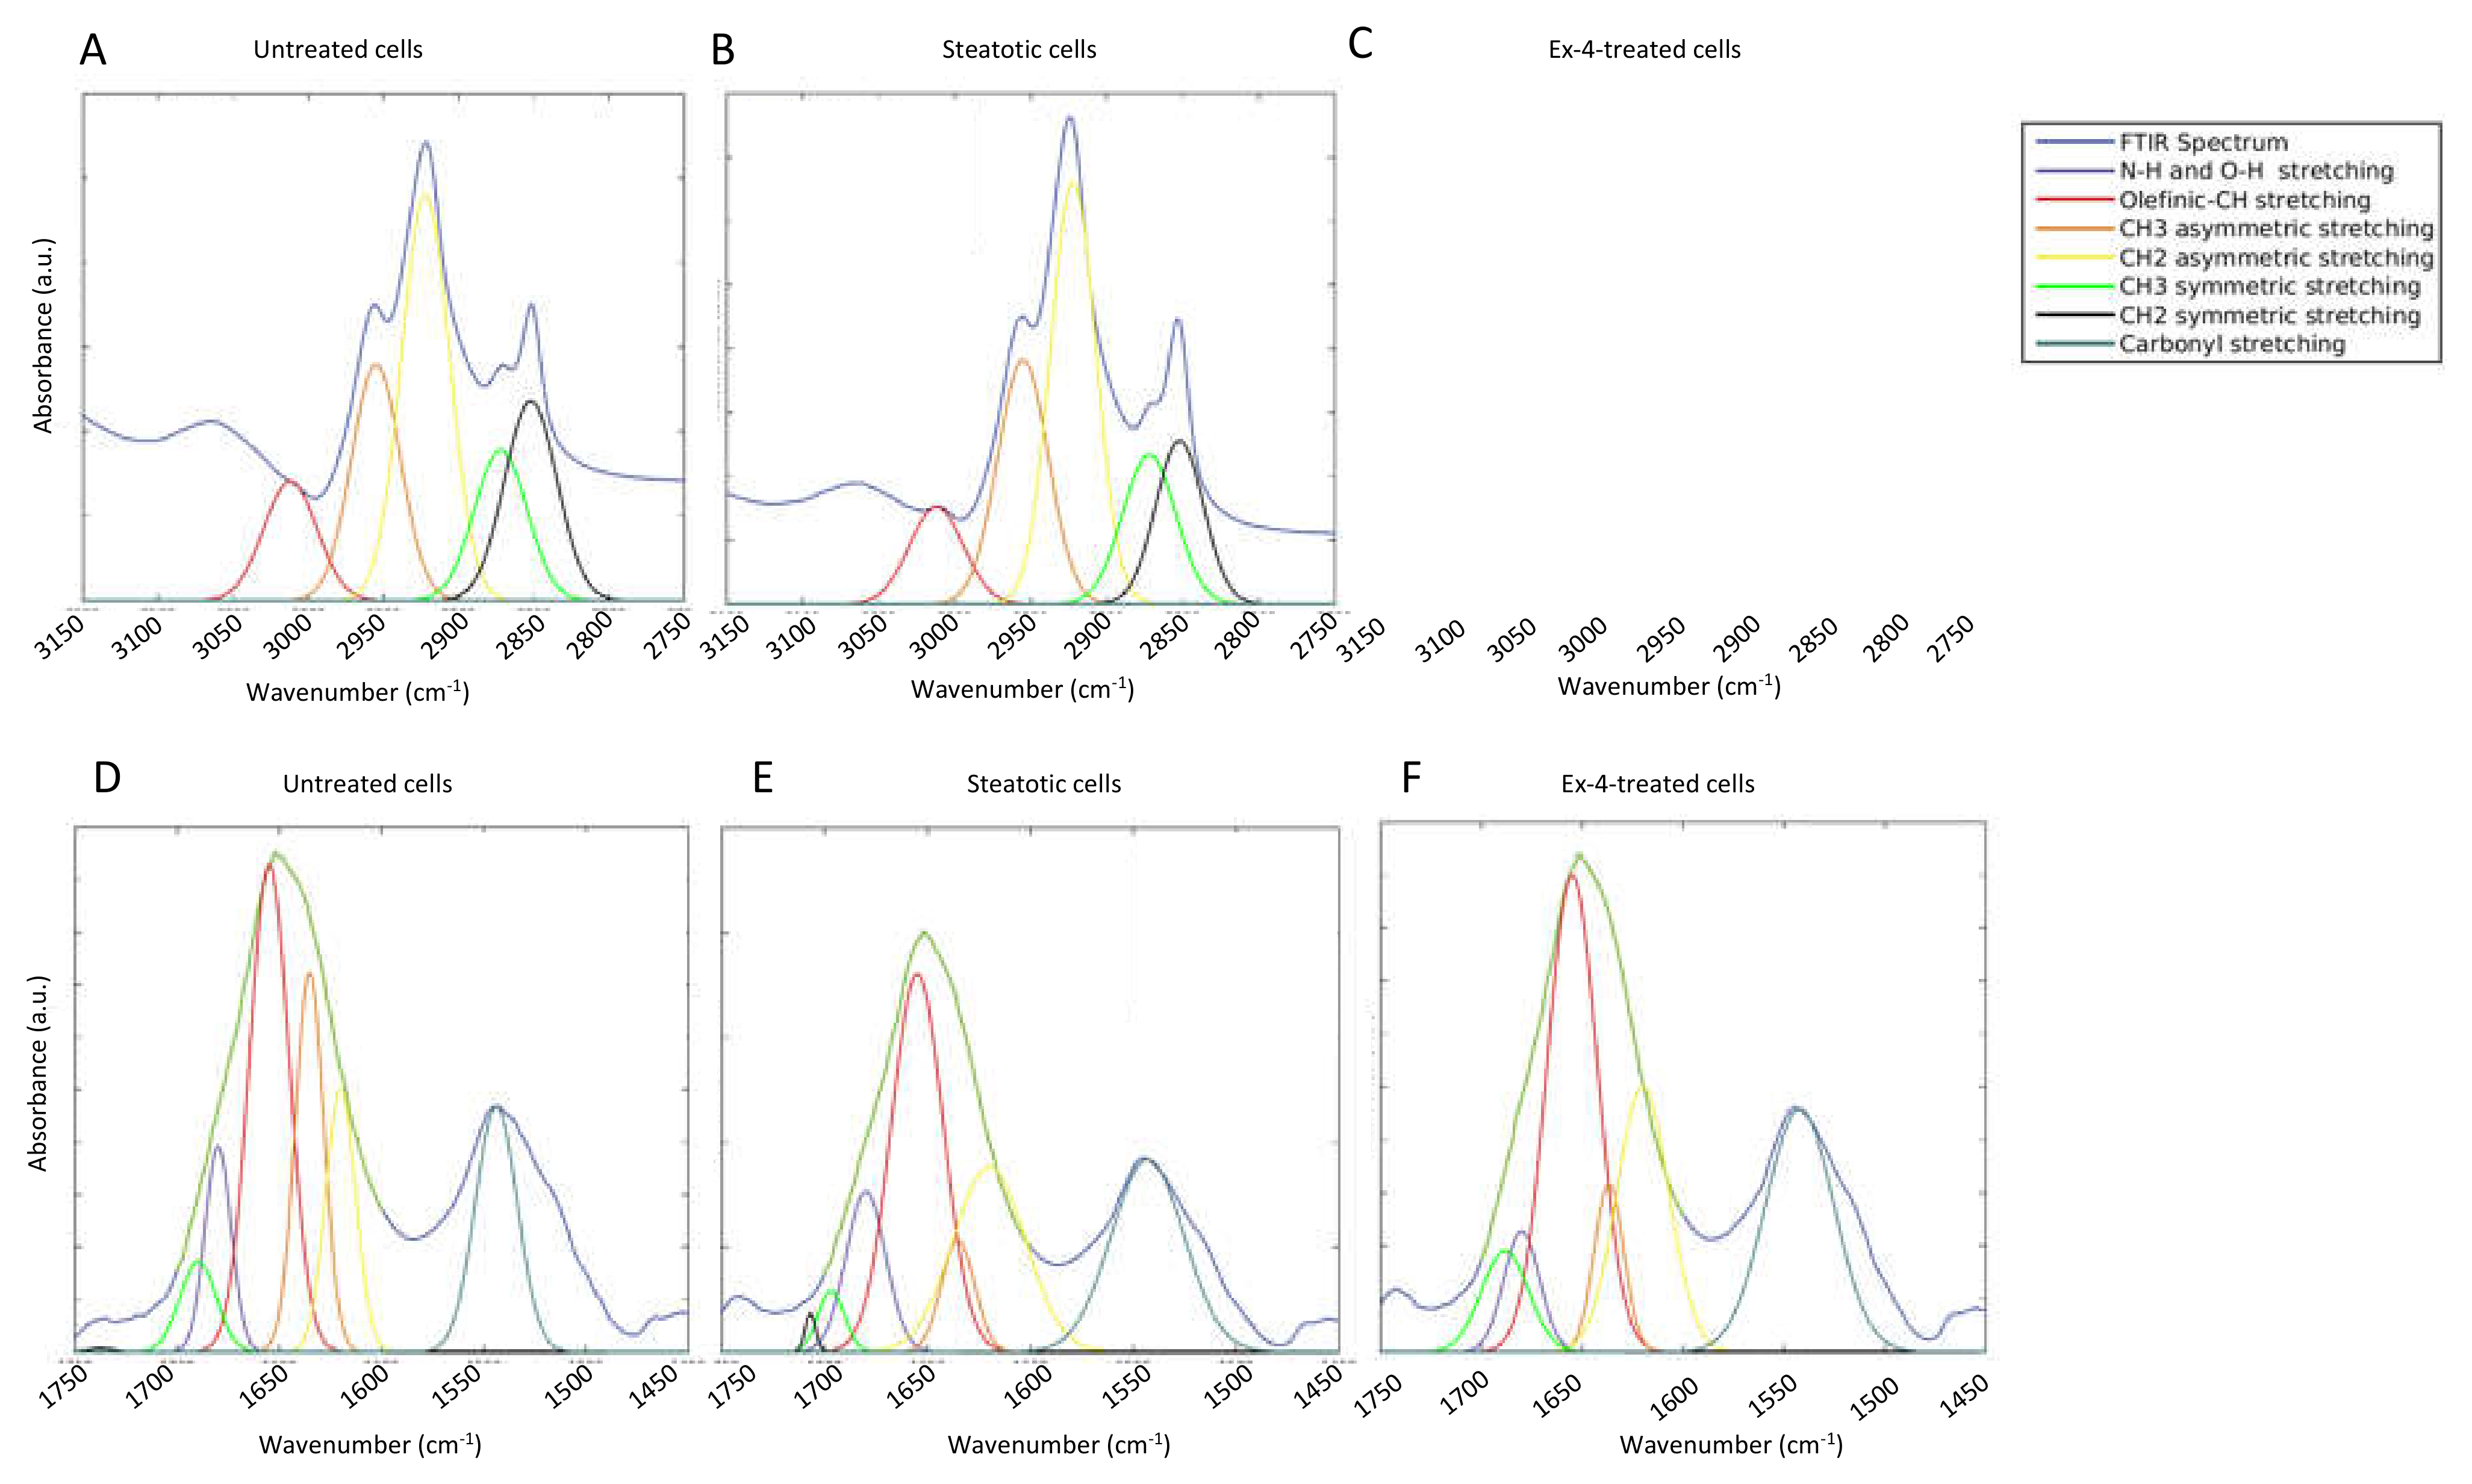
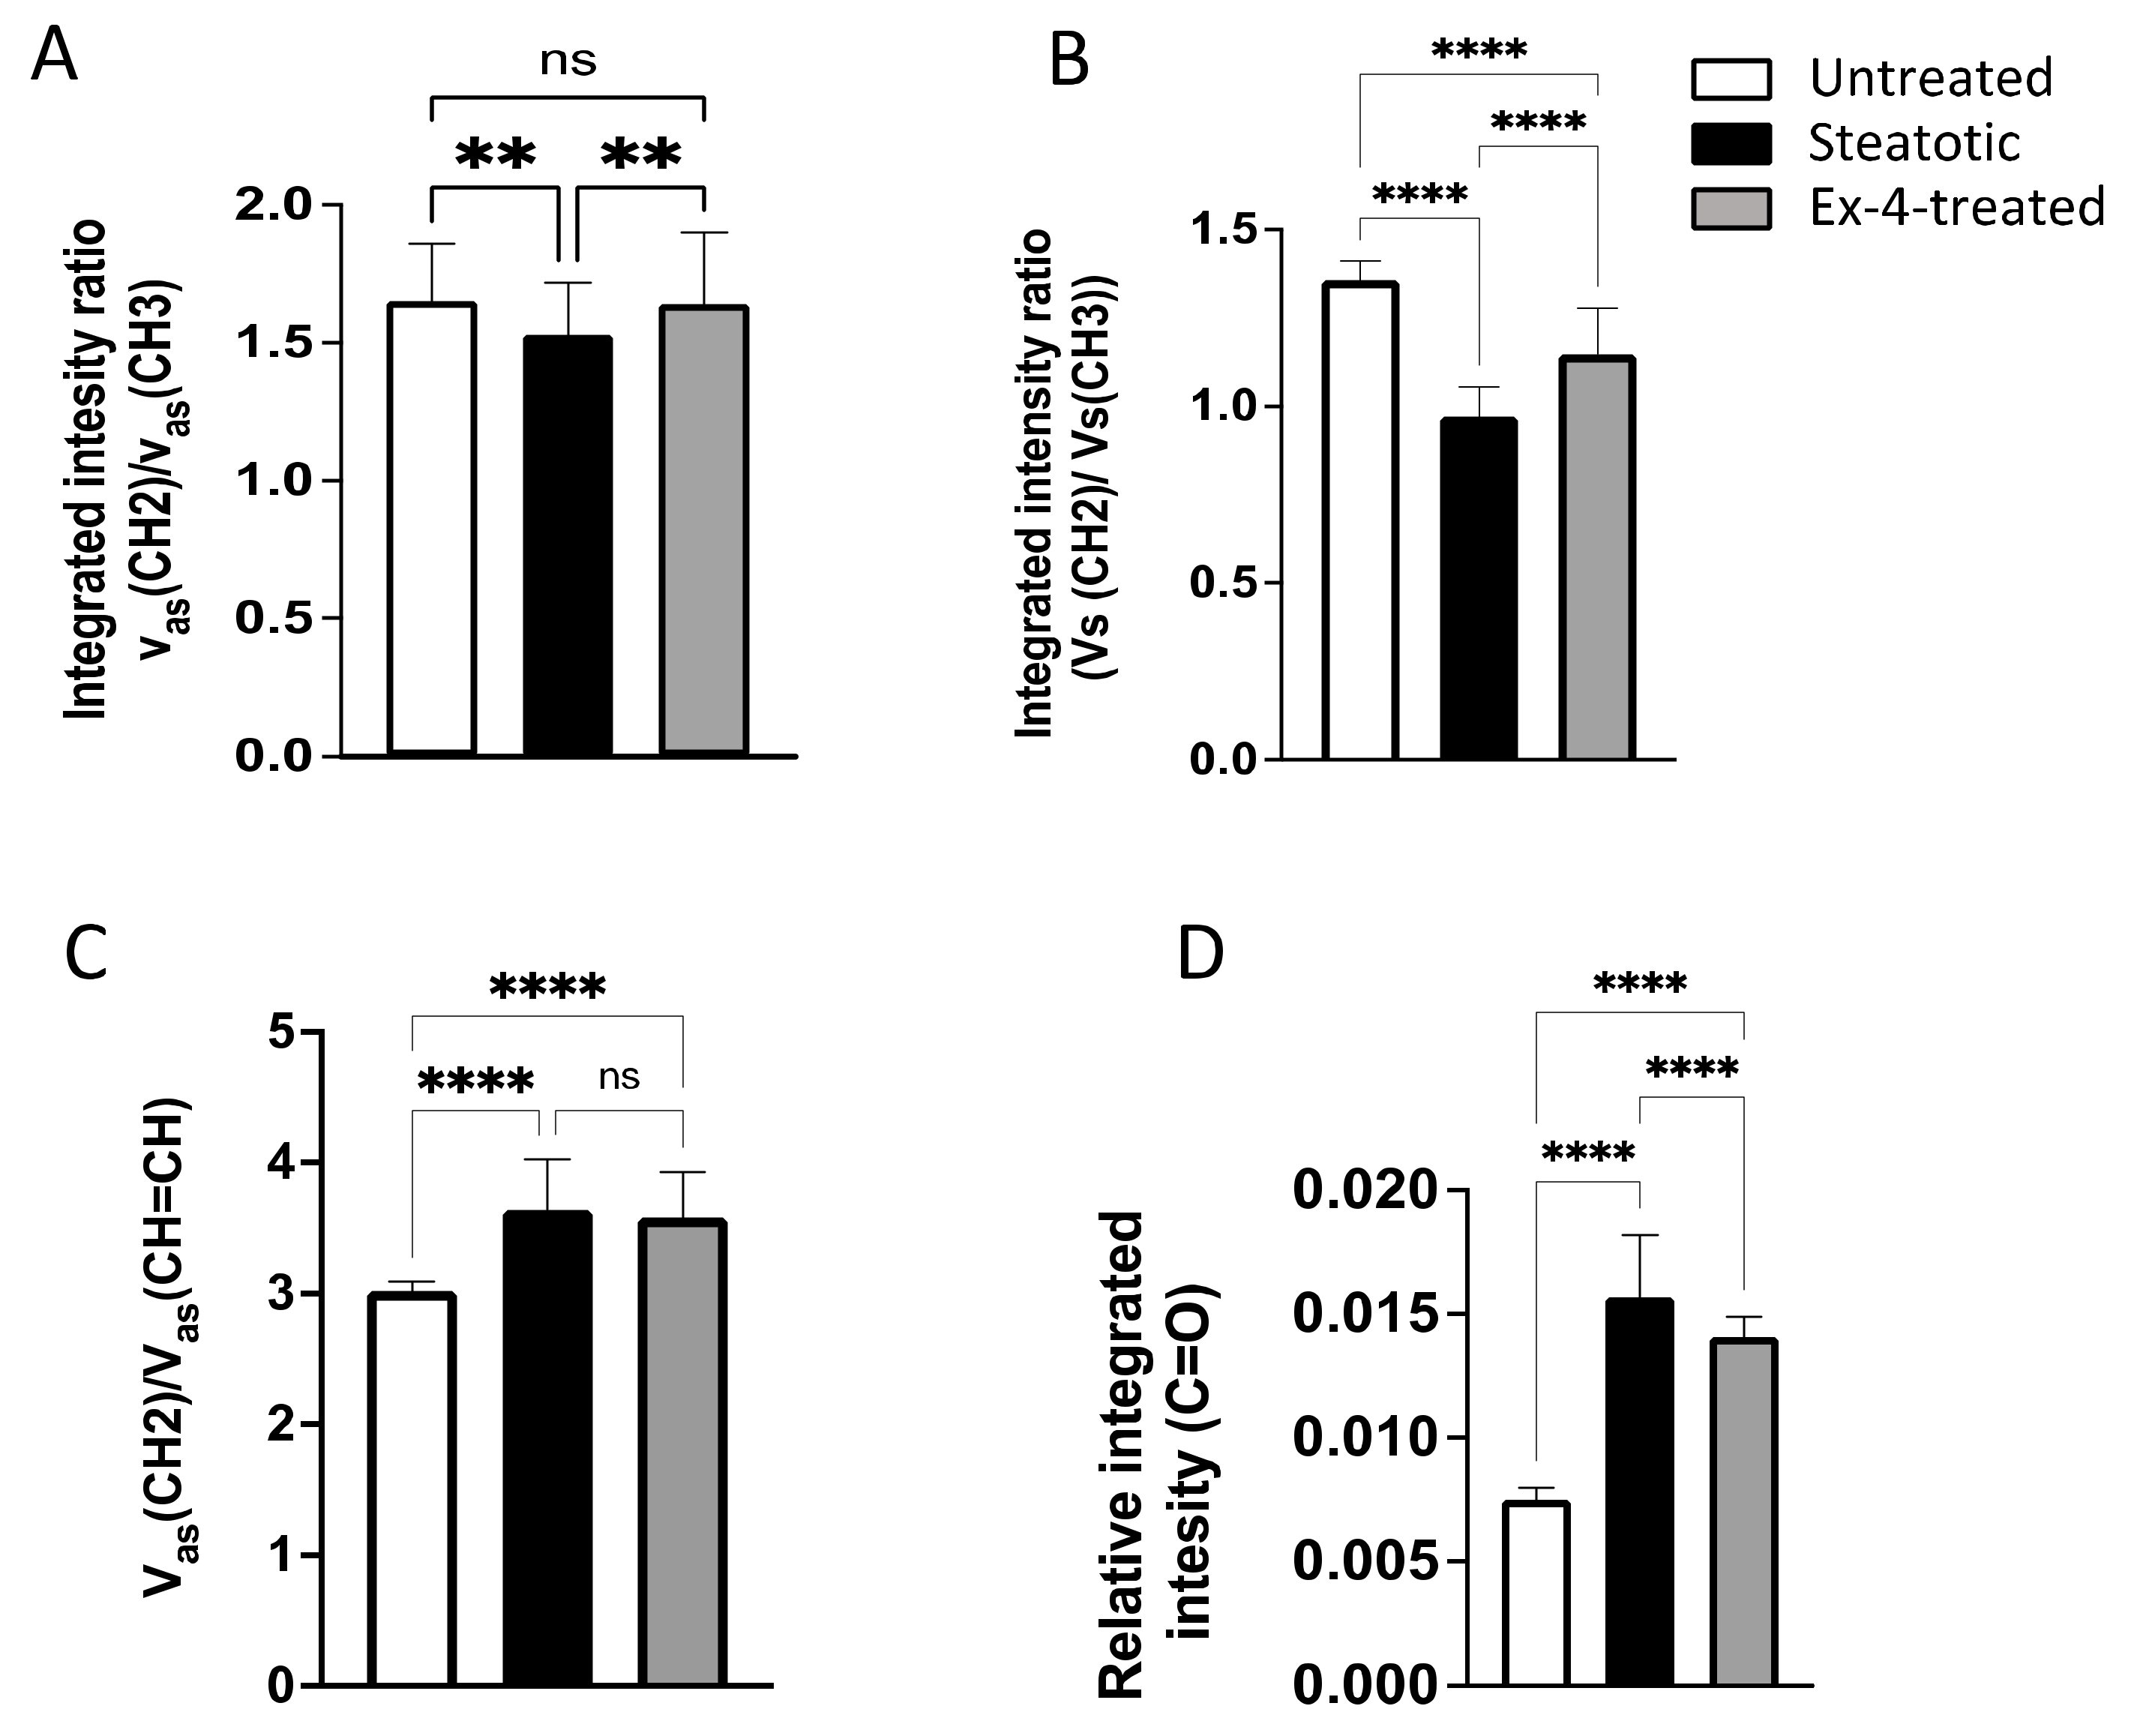
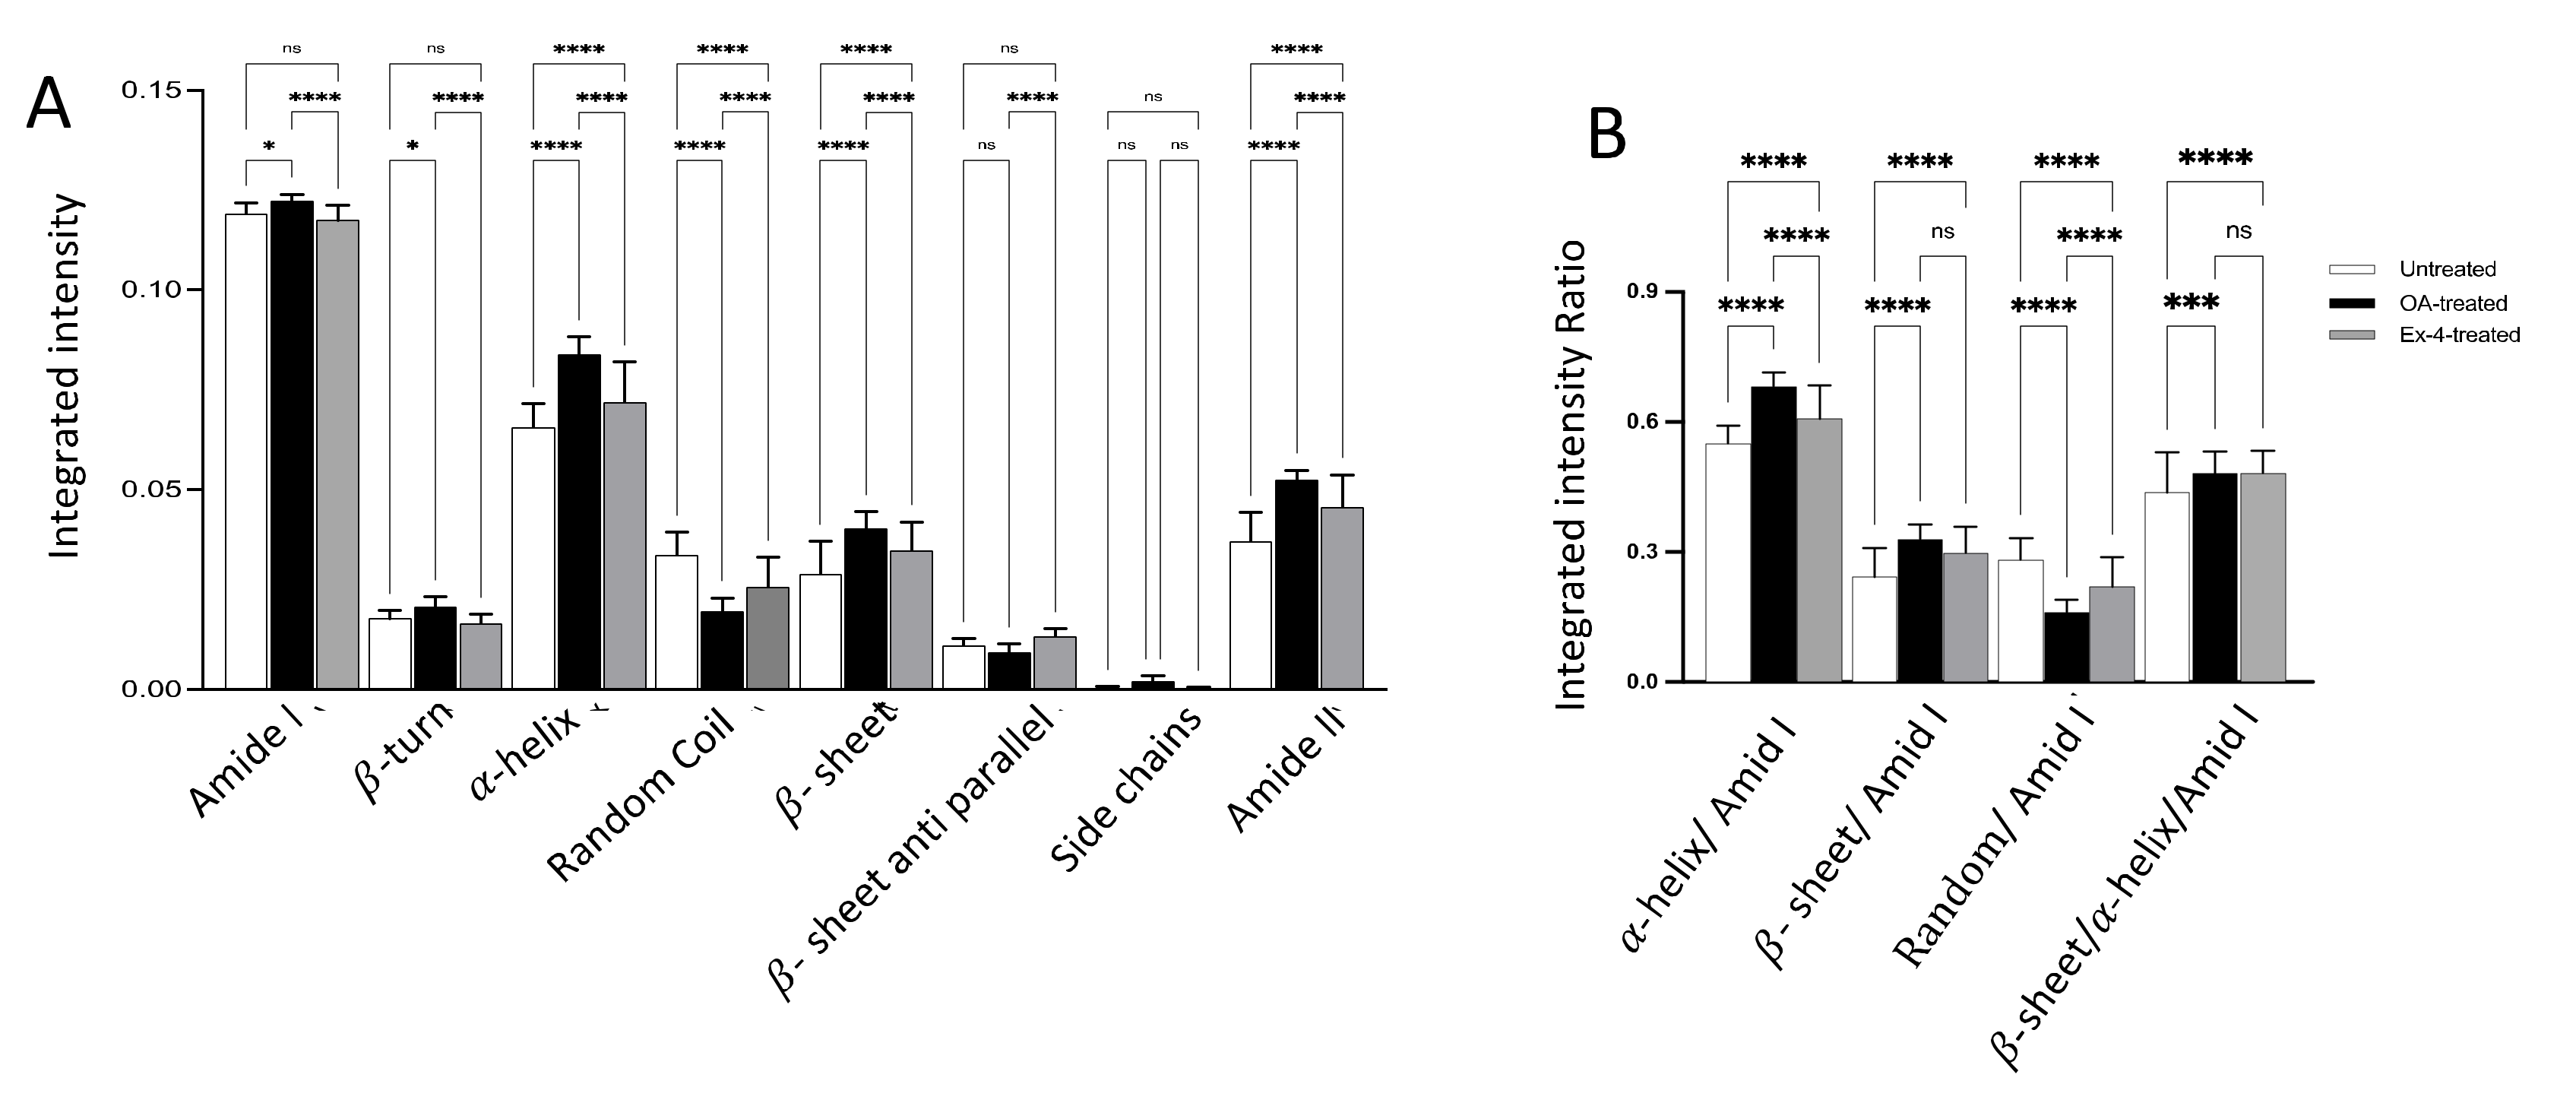
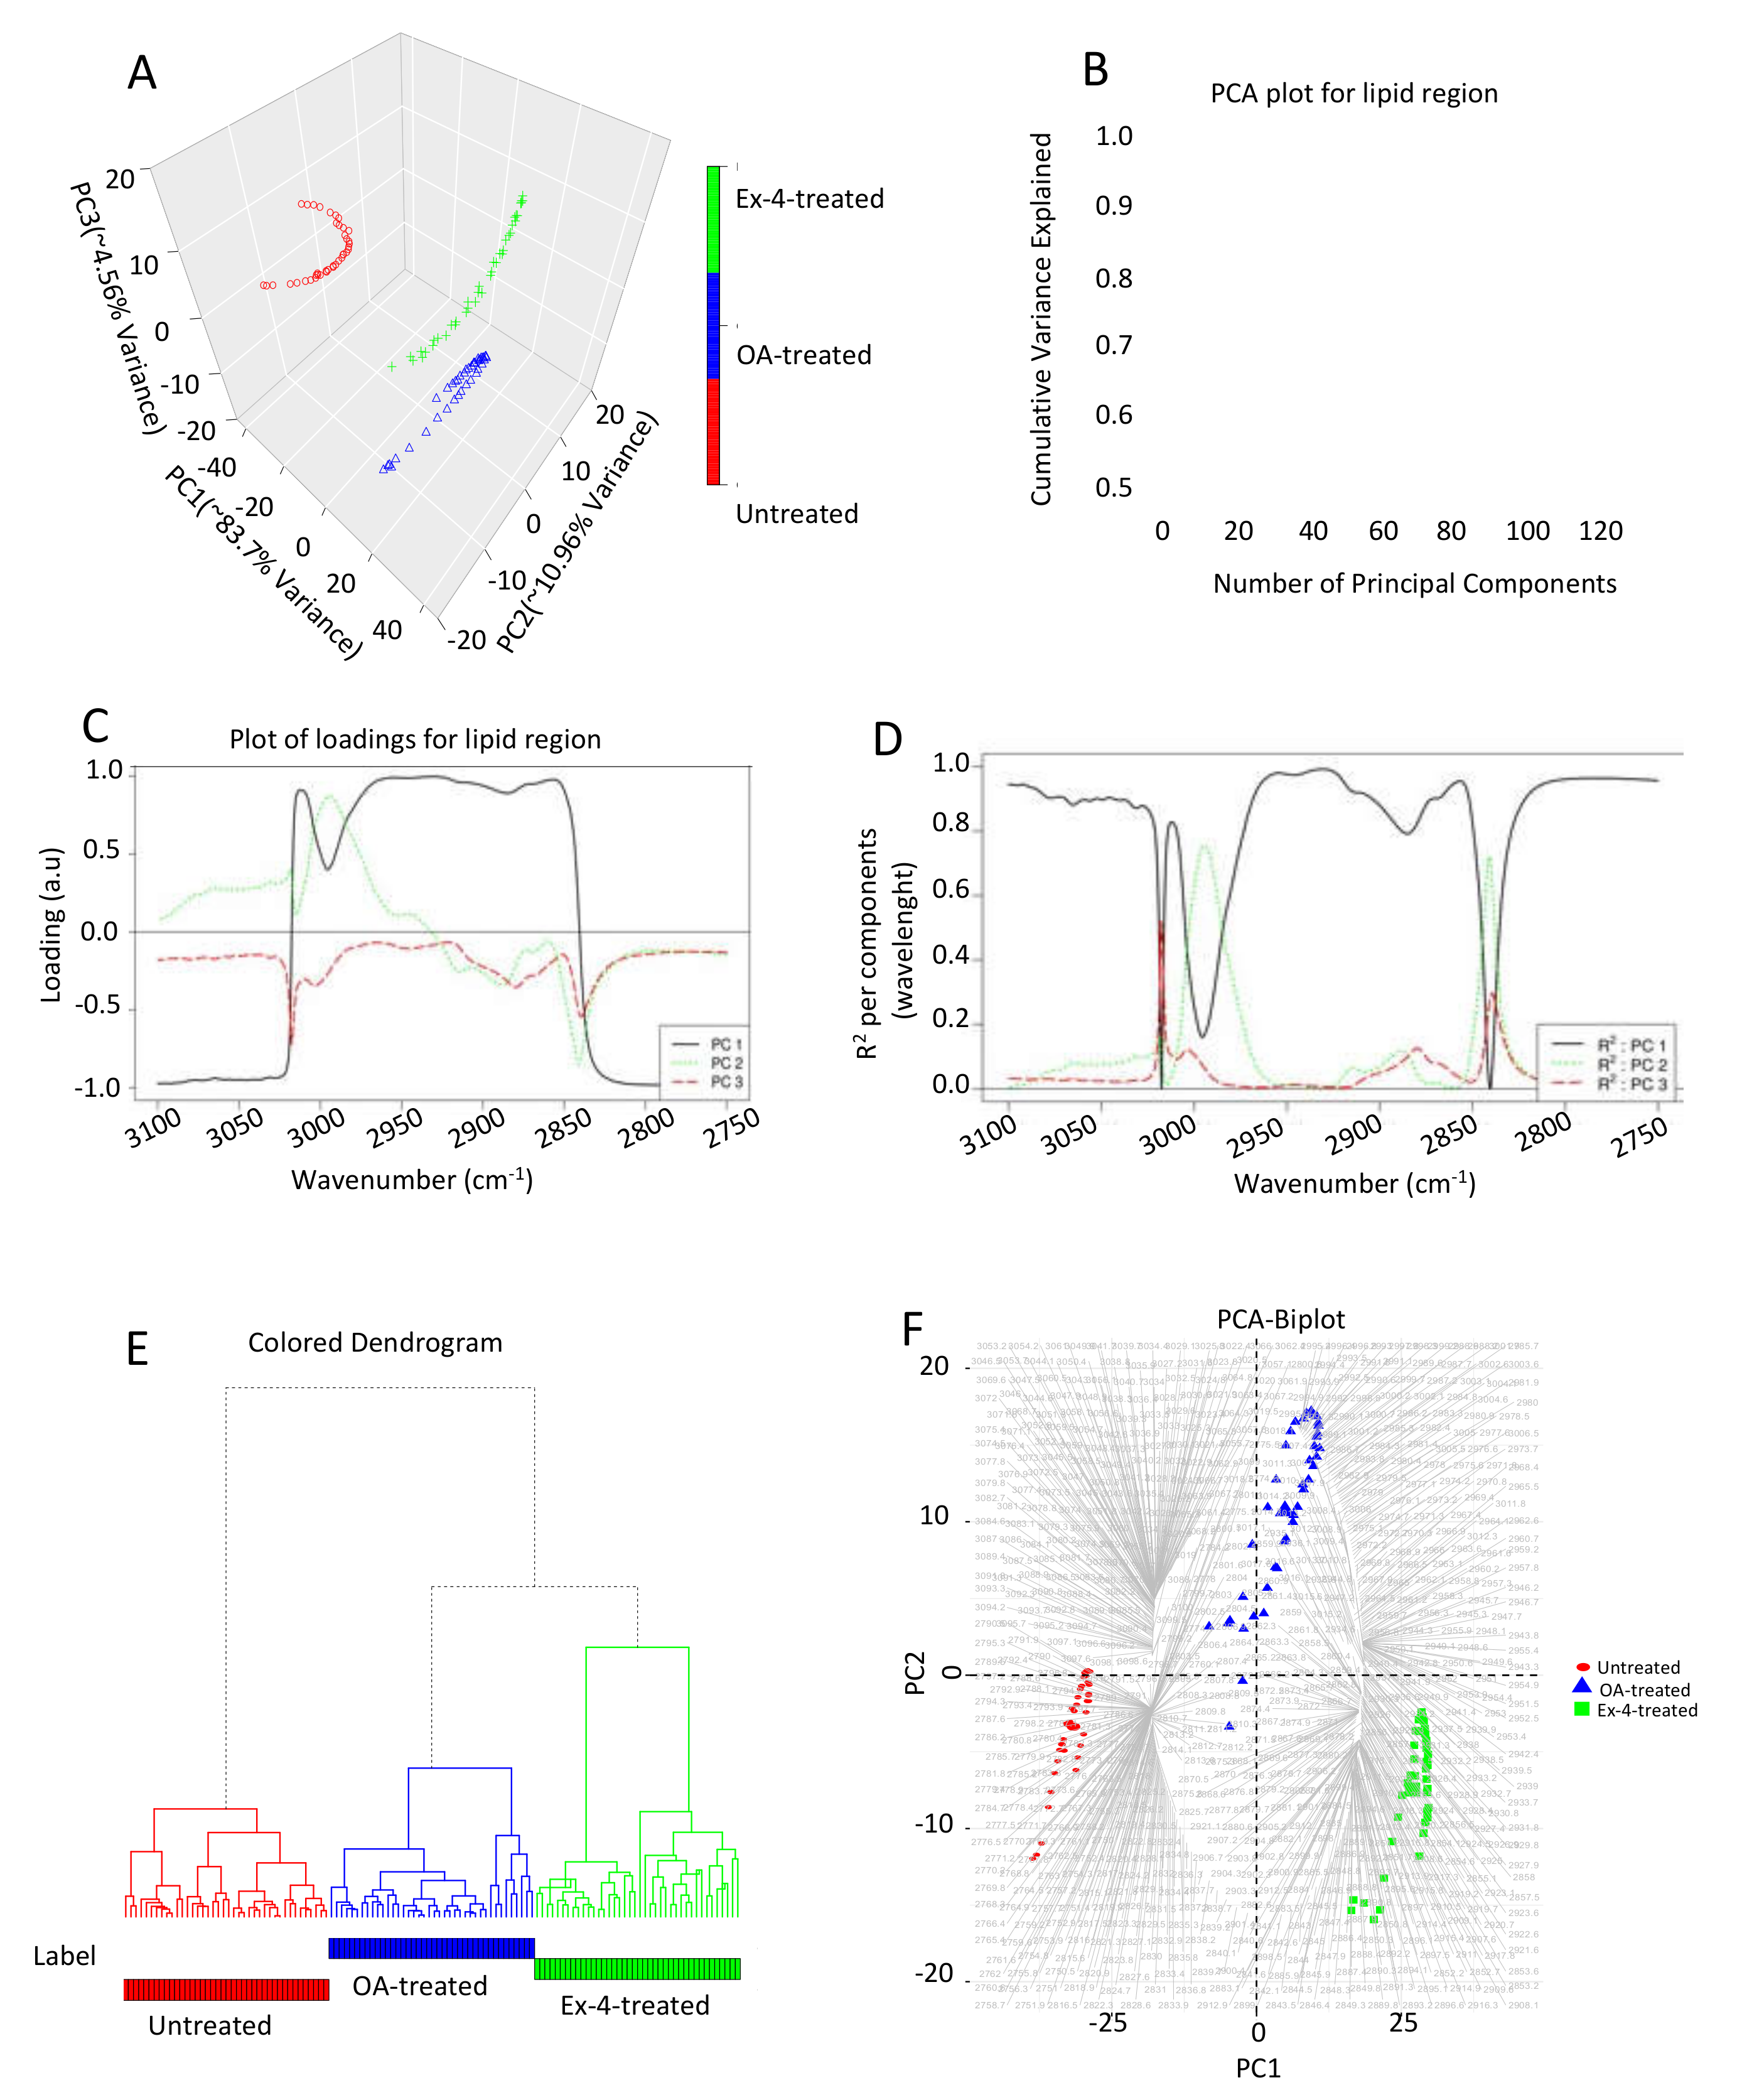
3.2. FTIR Spectroscopic Profiling of Total Lipids and Proteins
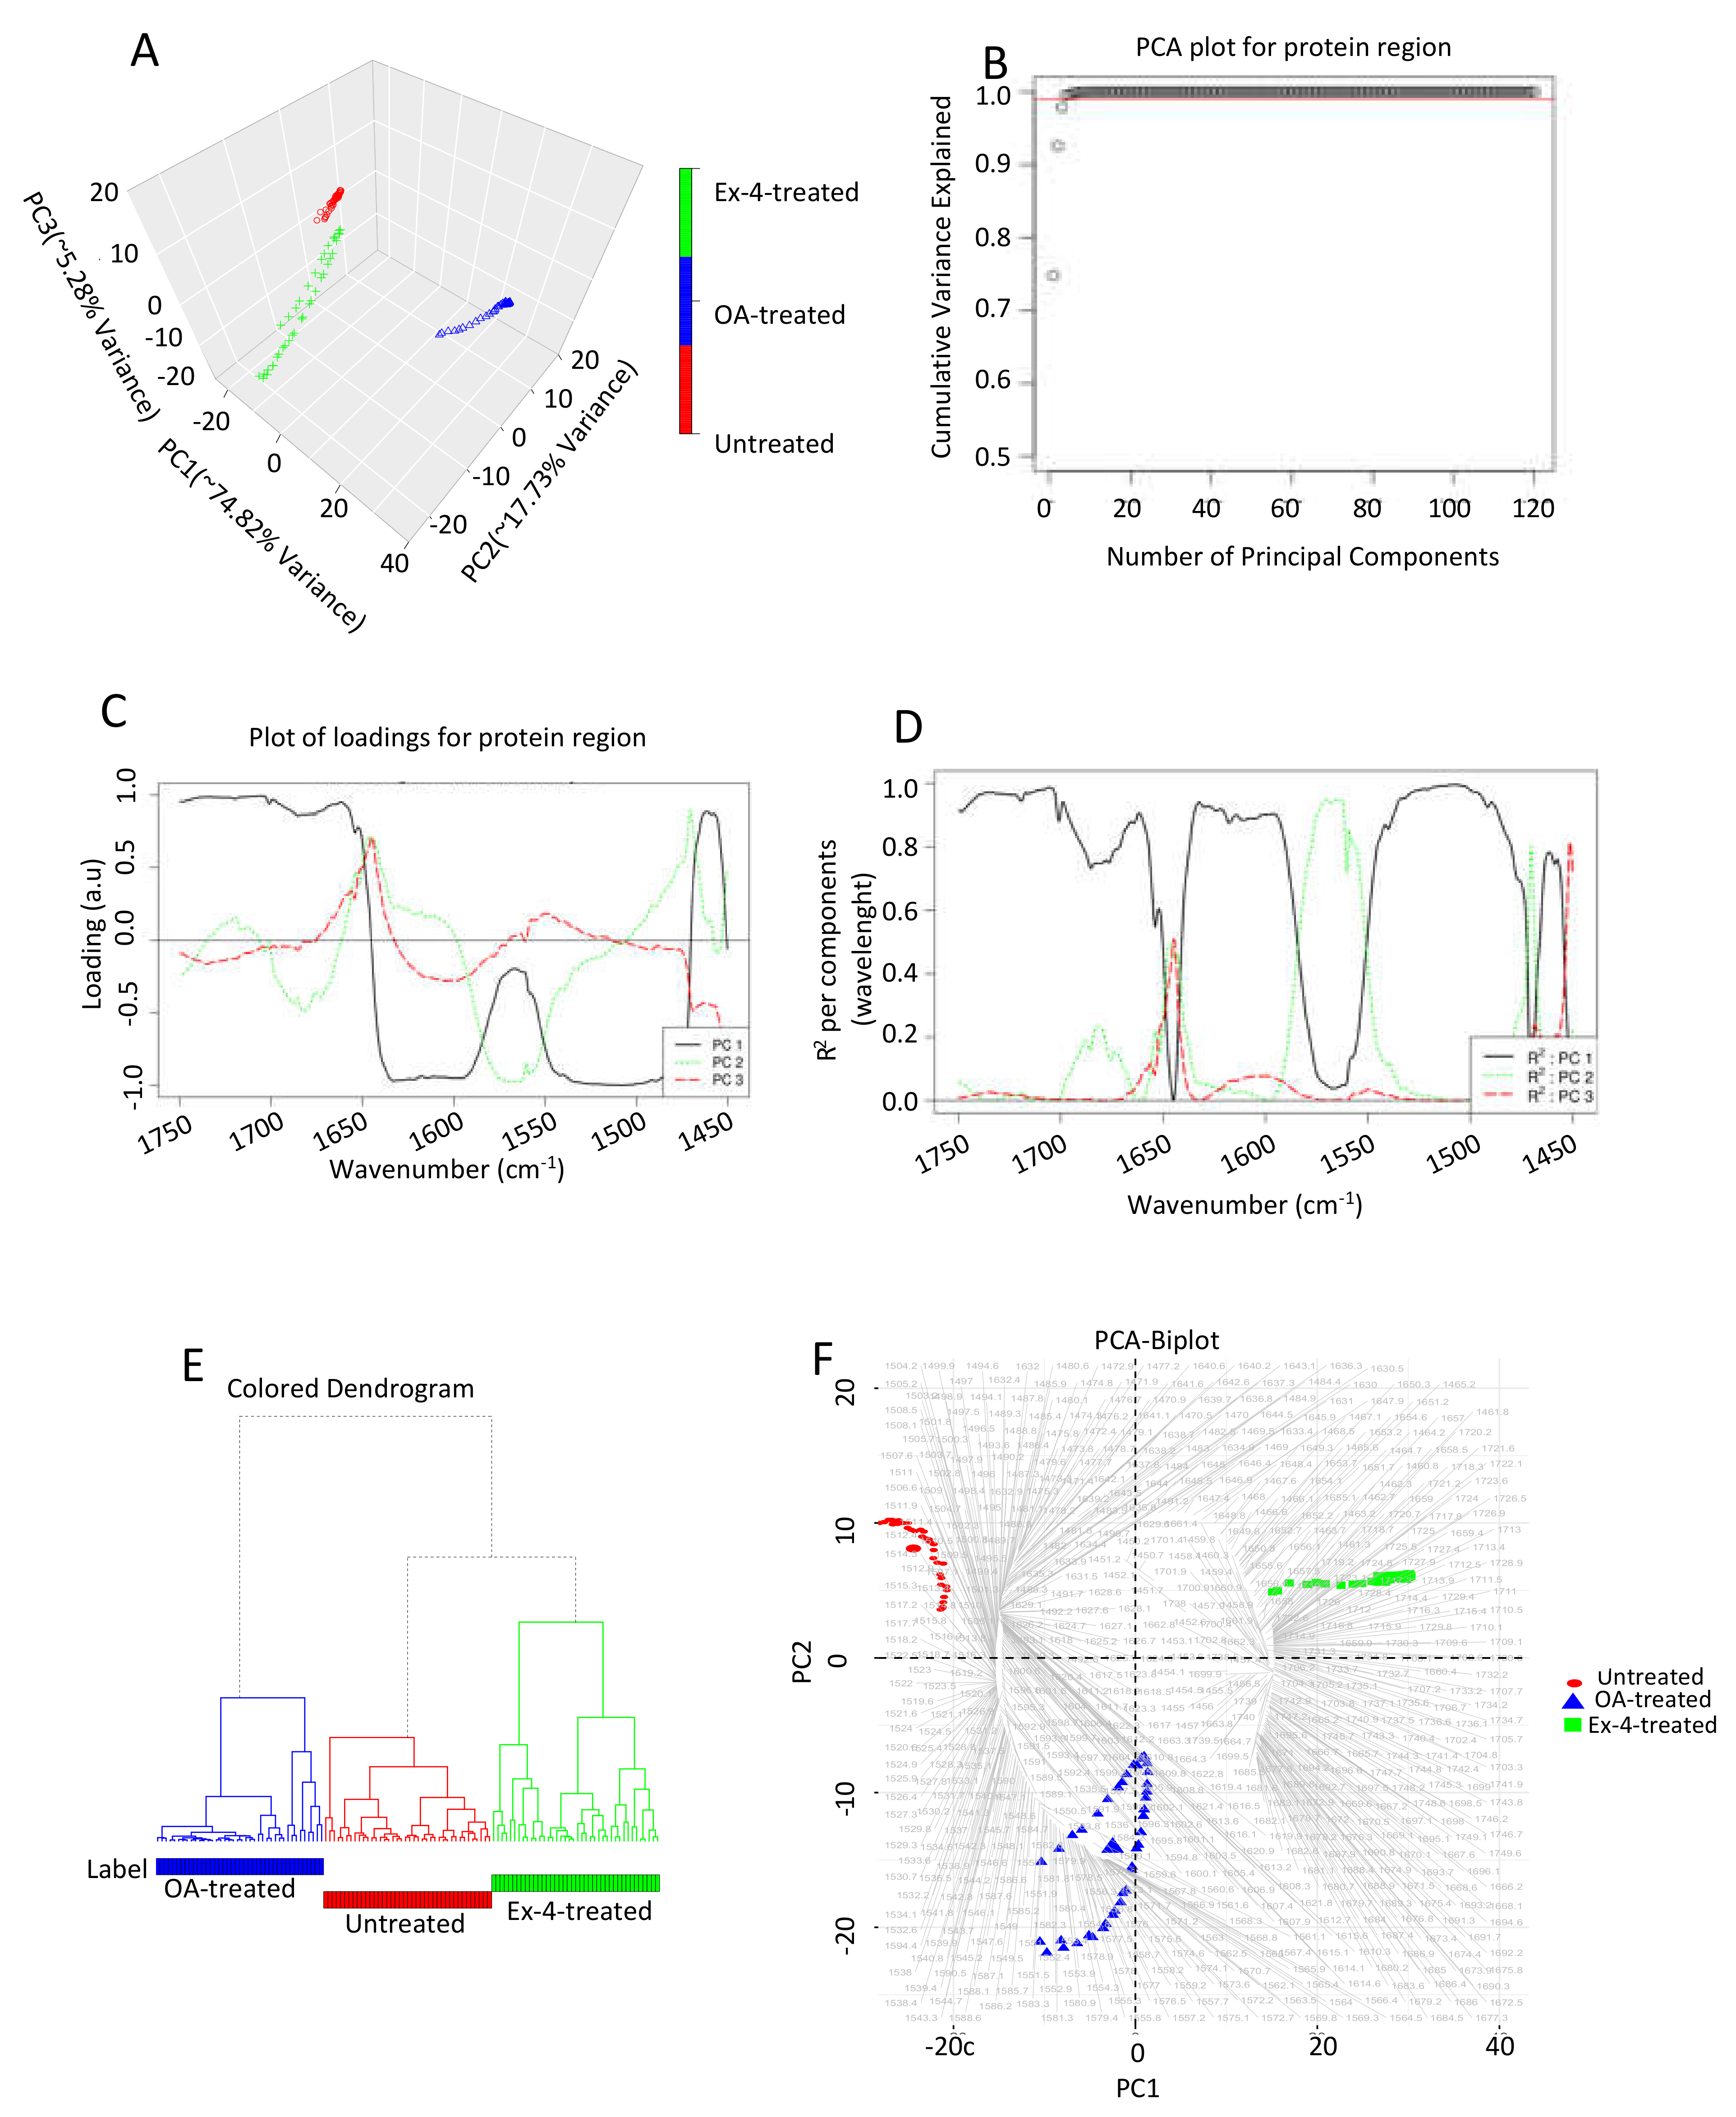
3.3. FTIR Spectroscopic Profiling of Total Proteins
3.4. Chemometric Data Analysis
4. Discussion
5. Conclusions
Supplementary Materials
Author Contributions
Funding
Institutional Review Board Statement
Informed Consent Statement
Data Availability Statement
Acknowledgments
Conflicts of Interest
References
- Benedict, M.; Zhang, X. Non-alcoholic fatty liver disease: An expanded review. World J. Hepatol. 2017, 9, 715–732. [Google Scholar] [CrossRef] [PubMed]
- Chalasani, N.; Younossi, Z.; LaVine, J.E.; Charlton, M.; Cusi, K.; Rinella, M.; Harrison, S.A.; Brunt, E.M.; Sanyal, A.J. The diagnosis and management of nonalcoholic fatty liver disease: Practice guidance from the American Association for the Study of Liver Diseases. Hepatology 2018, 67, 328–357. [Google Scholar] [CrossRef] [PubMed] [Green Version]
- Juanola, O.; Martínez-López, S.; Francés, R.; Gómez-Hurtado, I. Non-Alcoholic Fatty Liver Disease: Metabolic, Genetic, Epigenetic and Environmental Risk Factors. Int. J. Environ. Res. Public Health 2021, 18, 5227. [Google Scholar] [CrossRef] [PubMed]
- Powell, E.E.; Wong, V.W.; Rinella, M. Non-Alcoholic Fatty Liver Disease. Lancet 2021, 397, 2212–2224. [Google Scholar] [CrossRef]
- Younossi, Z.M.; Marchesini, G.; Pinto-Cortez, H.; Petta, S. Epidemiology of Nonalcoholic Fatty Liver Disease and Nonalcoholic Steatohepatitis: Implications for Liver Transplantation. Transplantation 2019, 103, 22–27. [Google Scholar] [CrossRef]
- Loomba, R.; Friedman, S.L.; Shulman, G.I. Mechanisms and disease consequences of nonalcoholic fatty liver disease. Cell 2021, 184, 2537–2564. [Google Scholar] [CrossRef]
- Yoo, E.R.; Sallam, S.; Perumpail, B.J.; Iqbal, U.; Shah, N.D.; Kwong, W.; Cholankeril, G.; Kim, D.; Ahmed, A. When to Initiate Weight Loss Medications in the NAFLD Population. Diseases 2018, 6, 91. [Google Scholar] [CrossRef] [Green Version]
- Van der Windt, D.J.; Sud, V.; Zhang, H.; Tsung, A.; Huang, H. The Effects of Physical Exercise on Fatty Liver Disease. Gene Expr. 2018, 18, 89–101. [Google Scholar] [CrossRef] [Green Version]
- Hsu, C.C.; Ness, E.; Kowdley, K.V. Nutritional Approaches to Achieve Weight Loss in Nonalcoholic Fatty Liver Disease. Adv. Nutr. Int. Rev. J. 2017, 8, 253–265. [Google Scholar] [CrossRef] [Green Version]
- Evert, A.B.; Franz, M.J. Why Weight Loss Maintenance Is Difficult. Diabetes Spectr. 2017, 30, 153–156. [Google Scholar] [CrossRef]
- Sumithran, P.; Prendergast, L.A.; Delbridge, E.; Purcell, K.; Shulkes, A.; Kriketos, A.; Proietto, J. Long-Term Persistence of Hormonal Adaptations to Weight Loss. N. Engl. J. Med. 2011, 365, 1597–1604. [Google Scholar] [CrossRef] [PubMed] [Green Version]
- Takase, T.; Nakamura, A.; Yamamoto, C.; Nomoto, H.; Miya, A.; Dannoura, M.; Cho, K.Y.; Kurihara, Y.; Manda, N.; Aoki, S.; et al. Improvement in treatment satisfaction after switching from liraglutide to dulaglutide in patients with type 2 diabetes: A randomized controlled trial. J. Diabetes Investig. 2018, 10, 699–705. [Google Scholar] [CrossRef] [PubMed]
- Prasad-Reddy, L.; Isaacs, D. A clinical review of GLP-1 receptor agonists: Efficacy and safety in diabetes and beyond. Drugs Context 2015, 4, 212283. [Google Scholar] [CrossRef] [PubMed]
- Nagaike, H.; Ohara, M.; Kohata, Y.; Hiromura, M.; Tomoyasu, M.; Takada, M.; Yamamoto, T.; Hayashi, T.; Fukui, T.; Hirano, T. Effect of Dulaglutide Versus Liraglutide on Glucose Variability, Oxidative Stress, and Endothelial Function in Type 2 Diabetes: A Prospective Study. Diabetes Ther. 2019, 10, 215–228. [Google Scholar] [CrossRef] [PubMed] [Green Version]
- Baggio, L.L.; Drucker, D.J. Glucagon-like peptide-1 receptor co-agonists for treating metabolic disease. Mol. Metab. 2020, 46, 101090. [Google Scholar] [CrossRef]
- Zhou, R.; Lin, C.; Cheng, Y.; Zhuo, X.; Li, Q.; Xu, W.; Zhao, L.; Yang, L. Liraglutide Alleviates Hepatic Steatosis and Liver Injury in T2MD Rats via a GLP-1R Dependent AMPK Pathway. Front. Pharmacol. 2021, 11, 600175. [Google Scholar] [CrossRef]
- Yang, M.; Ma, X.; Xuan, X.; Deng, H.; Chen, Q.; Yuan, L. Liraglutide Attenuates Non-Alcoholic Fatty Liver Disease in Mice by Regulating the Local Renin-Angiotensin System. Front. Pharmacol. 2020, 11, 432. [Google Scholar] [CrossRef] [Green Version]
- Yamamoto, T.; Nakade, Y.; Yamauchi, T.; Kobayashi, Y.; Ishii, N.; Ohashi, T.; Ito, K.; Sato, K.; Fukuzawa, Y.; Yoneda, M. Glucagon-like peptide-1 analogue prevents nonalcoholic steatohepatitis in non-obese mice. World J. Gastroenterol. 2016, 22, 2512–2523. [Google Scholar] [CrossRef]
- Wewer Albrechtsen, N.J. Glucagon receptor signaling in metabolic diseases. Peptides 2018, 100, 42–47. [Google Scholar] [CrossRef]
- Valdecantos, M.P.; Ruiz, L.; Pardo, V.; Castro-Sanchez, L.; García-Monzón, C.; Lanzón, B.; Rupérez, J.; Barbas, C.; Naylor, J.; Trevaskis, J.L.; et al. Differential Effects of a Glucagon-Like Peptide 1 Receptor Agonist in Non-Alcoholic Fatty Liver Disease and in Response to Hepatectomy. Sci. Rep. 2018, 8, 16461. [Google Scholar] [CrossRef]
- Song, T.; Jia, Y.; Li, Z.; Wang, F.; Ren, L.; Chen, S. Effects of Liraglutide on Nonalcoholic Fatty Liver Disease in Patients with Type 2 Diabetes Mellitus: A Systematic Review and Meta-Analysis. Diabetes Ther. 2021, 12, 1735–1749. [Google Scholar] [CrossRef] [PubMed]
- Somm, E.; Montandon, S.A.; Loizides-Mangold, U.; Gaïa, N.; Lazarevic, V.; De Vito, C.; Perroud, E.; Bochaton-Piallat, M.-L.; Dibner, C.; Schrenzel, J.; et al. The GLP-1R agonist liraglutide limits hepatic lipotoxicity and inflammatory response in mice fed a methionine-choline deficient diet. Transl. Res. 2020, 227, 75–88. [Google Scholar] [CrossRef] [PubMed]
- Petit, J.M.; Vergès, B. Glp-1 Receptor Agonists in NAFLD. Diabetes Metab. 2017, 43, 2S28–2S33. [Google Scholar] [CrossRef]
- Mantovani, A.; Petracca, G.; Beatrice, G.; Csermely, A.; Lonardo, A.; Targher, G. Glucagon-Like Peptide-1 Receptor Agonists for Treatment of Nonalcoholic Fatty Liver Disease and Nonalcoholic Steatohepatitis: An Updated Meta-Analysis of Randomized Controlled Trials. Metabolites 2021, 11, 73. [Google Scholar] [CrossRef] [PubMed]
- Kuchay, M.S.; Krishan, S.; Mishra, S.K.; Choudhary, N.S.; Singh, M.K.; Wasir, J.S.; Kaur, P.; Gill, H.K.; Bano, T.; Farooqui, K.J.; et al. Effect of dulaglutide on liver fat in patients with type 2 diabetes and NAFLD: Randomised controlled trial (D-LIFT trial). Diabetologia 2020, 63, 2434–2445. [Google Scholar] [CrossRef]
- Hupa-Breier, K.; Dywicki, J.; Hartleben, B.; Wellhöner, F.; Heidrich, B.; Taubert, R.; Mederacke, Y.-S.; Lieber, M.; Iordanidis, K.; Manns, M.; et al. Dulaglutide Alone and in Combination with Empagliflozin Attenuate Inflammatory Pathways and Microbiome Dysbiosis in a Non-Diabetic Mouse Model of NASH. Biomedicines 2021, 9, 353. [Google Scholar] [CrossRef]
- Han, X.; Ding, C.; Zhang, G.; Pan, R.; Liu, Y.; Huang, N.; Hou, N.; Han, F.; Xu, W.; Sun, X. Liraglutide Ameliorates Obesity-Related Nonalcoholic Fatty Liver Disease by Regulating Sestrin2-Mediated Nrf2/Ho-1 Pathway. Biochem. Biophys. Res. Commun. 2020, 525, 895–901. [Google Scholar] [CrossRef]
- Gao, H.; Zeng, Z.; Zhang, H.; Zhou, X.; Guan, L.; Deng, W.; Xu, L. The Glucagon-Like Peptide-1 Analogue Liraglutide Inhibits Oxidative Stress and Inflammatory Response in the Liver of Rats with Diet-Induced Non-alcoholic Fatty Liver Disease. Biol. Pharm. Bull. 2015, 38, 694–702. [Google Scholar] [CrossRef] [Green Version]
- Feng, W.-H.; Bi, Y.; Li, P.; Yin, T.-T.; Gao, C.-X.; Shen, S.-M.; Gao, L.-J.; Yang, D.-H.; Zhu, D.-L. Effects of liraglutide, metformin and gliclazide on body composition in patients with both type 2 diabetes and non-alcoholic fatty liver disease: A randomized trial. J. Diabetes Investig. 2018, 10, 399–407. [Google Scholar] [CrossRef] [Green Version]
- Dougherty, J.A.; Guirguis, E.; Thornby, K.-A. A Systematic Review of Newer Antidiabetic Agents in the Treatment of Nonalcoholic Fatty Liver Disease. Ann. Pharmacother. 2020, 55, 65–79. [Google Scholar] [CrossRef]
- Bouchi, R.; Nakano, Y.; Fukuda, T.; Takeuchi, T.; Murakami, M.; Minami, I.; Izumiyama, H.; Hashimoto, K.; Yoshimoto, T.; Ogawa, Y. Reduction of visceral fat by liraglutide is associated with ameliorations of hepatic steatosis, albuminuria, and micro-inflammation in type 2 diabetic patients with insulin treatment: A randomized control trial. Endocr. J. 2017, 64, 269–281. [Google Scholar] [CrossRef] [PubMed] [Green Version]
- Armstrong, M.J.; Hull, D.; Guo, K.; Barton, D.; Hazlehurst, J.M.; Gathercole, L.L.; Nasiri, M.; Yu, J.; Gough, S.C.; Newsome, P.N.; et al. Glucagon-like peptide 1 decreases lipotoxicity in non-alcoholic steatohepatitis. J. Hepatol. 2015, 64, 399–408. [Google Scholar] [CrossRef] [PubMed] [Green Version]
- Müller, T.D.; Finan, B.; Bloom, S.R.; D’Alessio, D.; Drucker, D.J.; Flatt, P.R.; Fritsche, A.; Gribble, F.; Grill, H.J.; Habener, J.F.; et al. Glucagon-Like Peptide 1 (Glp-1). Mol. Metab. 2019, 30, 72–130. [Google Scholar] [CrossRef] [PubMed]
- Gribble, F.M.; Reimann, F. Metabolic Messengers: Glucagon-like peptide 1. Nat. Metab. 2021, 3, 142–148. [Google Scholar] [CrossRef]
- Rowlands, J.; Heng, J.; Newsholme, P.; Carlessi, R. Pleiotropic Effects of Glp-1 and Analogs on Cell Signaling, Metabolism, and Function. Front. Endocrinol. 2018, 9, 672. [Google Scholar] [CrossRef] [Green Version]
- Nadkarni, P.; Chepurny, O.G.; Holz, G.G. Regulation of Glucose Homeostasis by Glp-1. Prog. Mol. Biol. Transl. Sci. 2014, 121, 23–65. [Google Scholar]
- Campbell, J.E.; Drucker, D.J. Pharmacology, Physiology, and Mechanisms of Incretin Hormone Action. Cell Metab. 2013, 17, 819–837. [Google Scholar] [CrossRef] [Green Version]
- Gupta, N.A.; Mells, J.; Dunham, R.M.; Grakoui, A.; Handy, J.; Saxena, N.K.; Anania, F.A. Glucagon-like peptide-1 receptor is present on human hepatocytes and has a direct role in decreasing hepatic steatosis in vitro by modulating elements of the insulin signaling pathway. Hepatology 2010, 51, 1584–1592. [Google Scholar] [CrossRef] [Green Version]
- Errafii, K.; Al-Akl, N.S.; Khalifa, O.; Arredouani, A. Comprehensive analysis of LncRNAs expression profiles in an in vitro model of steatosis treated with Exendin-4. J. Transl. Med. 2021, 19, 235. [Google Scholar] [CrossRef]
- Khalifa, O.; Al-Akl, N.S.; Errafii, K.; Arredouani, A. Exendin-4 alleviates steatosis in an in vitro cell model by lowering FABP1 and FOXA1 expression via the Wnt/-catenin signaling pathway. Sci. Rep. 2022, 12, 2226. [Google Scholar] [CrossRef]
- Seo, M.H.; Lee, J.; Hong, S.-W.; Rhee, E.-J.; Park, S.E.; Park, C.Y.; Oh, K.W.; Park, S.W.; Lee, W.-Y. Exendin-4 Inhibits Hepatic Lipogenesis by Increasing β-Catenin Signaling. PLoS ONE 2016, 11, e0166913. [Google Scholar] [CrossRef] [PubMed]
- Gao, Z.; Song, G.-Y.; Ren, L.-P.; Ma, H.-J.; Ma, B.-Q.; Chen, S.-C. β-catenin mediates the effect of GLP-1 receptor agonist on ameliorating hepatic steatosis induced by high fructose diet. Eur. J. Histochem. 2020, 64, 3160. [Google Scholar] [CrossRef] [PubMed]
- Baker, M.J.; Trevisan, J.; Bassan, P.; Bhargava, R.; Butler, H.J.; Dorling, K.M.; Fielden, P.R.; Fogarty, S.W.; Fullwood, N.J.; Heys, K.A.; et al. Using Fourier transform IR spectroscopy to analyze biological materials. Nat. Protoc. 2014, 9, 1771–1791. [Google Scholar] [CrossRef] [PubMed] [Green Version]
- Kazarian, S.G.; Chan, K.L.A. Applications of ATR-FTIR spectroscopic imaging to biomedical samples. Biochim. Biophys. Acta Biomembr. 2006, 1758, 858–867. [Google Scholar] [CrossRef] [PubMed] [Green Version]
- Kochan, K.; Maslak, E.; Chlopicki, S.; Baranska, M. FT-IR imaging for quantitative determination of liver fat content in non-alcoholic fatty liver. Analyst 2015, 140, 4997–5002. [Google Scholar] [CrossRef] [Green Version]
- Thumanu, K.; Sangrajrang, S.; Khuhaprema, T.; Kalalak, A.; Tanthanuch, W.; Pongpiachan, S.; Heraud, P. Diagnosis of liver cancer from blood sera using FTIR microspectroscopy: A preliminary study. J. Biophotonics 2014, 7, 222–231. [Google Scholar] [CrossRef]
- Hackett, M.J.; Lee, J.; El-Assaad, F.; McQuillan, J.A.; Carter, E.A.; Grau, G.E.; Hunt, N.H.; Lay, P.A. FTIR Imaging of Brain Tissue Reveals Crystalline Creatine Deposits Are an ex Vivo Marker of Localized Ischemia during Murine Cerebral Malaria: General Implications for Disease Neurochemistry. ACS Chem. Neurosci. 2012, 3, 1017–1024. [Google Scholar] [CrossRef] [Green Version]
- Lewis, P.D.; Lewis, K.E.; Ghosal, R.; Bayliss, S.; Lloyd, A.J.; Wills, J.; Godfrey, R.; Kloer, P.; Mur, L.A. Evaluation of FTIR Spectroscopy as a diagnostic tool for lung cancer using sputum. BMC Cancer 2010, 10, 640. [Google Scholar] [CrossRef] [Green Version]
- Wood, B.R.; Chiriboga, L.; Yee, H.; Quinn, M.A.; McNaughton, D.; Diem, M. Fourier Transform Infrared (FTIR) Spectral Mapping of the Cervical Transformation Zone, and Dysplastic Squamous Epithelium. Gynecol. Oncol. 2004, 93, 59–68. [Google Scholar] [CrossRef] [Green Version]
- Marzec, K.M.; Wrobel, T.P.; Rygula, A.; Maslak, E.; Jasztal, A.; Fedorowicz, A.; Chlopicki, S.; Baranska, M. Visualization of the biochemical markers of atherosclerotic plaque with the use of Raman, IR and AFM. J. Biophotonics 2014, 7, 744–756. [Google Scholar] [CrossRef]
- Junhom, C.; Weerapreeyakul, N.; Tanthanuch, W.; Thumanu, K. FTIR microspectroscopy defines early drug resistant human hepatocellular carcinoma (HepG2) cells. Exp. Cell Res. 2016, 340, 71–80. [Google Scholar] [CrossRef] [PubMed]
- Junhom, C.; Weerapreeyakul, N.; Tanthanuch, W.; Thumanu, K. Partial Least Squares Regression and Fourier Transform Infrared (FTIR) Microspectroscopy for Prediction of Resistance in Hepatocellular Carcinoma Hepg2 Cells. Exp. Cell Res. 2017, 351, 82–90. [Google Scholar] [CrossRef]
- Alkhatatbeh, M.J.; Lincz, L.F.; Thorne, R.F. Low simvastatin concentrations reduce oleic acid-induced steatosis in HepG2 cells: An in vitro model of non-alcoholic fatty liver disease. Exp. Ther. Med. 2016, 11, 1487–1492. [Google Scholar] [CrossRef] [PubMed] [Green Version]
- Ali, M.H.M.; Toor, S.M.; Rakib, F.; Mall, R.; Ullah, E.; Mroue, K.; Kolatkar, P.R.; Al-Saad, K.; Elkord, E. Investigation of the Effect of PD-L1 Blockade on Triple Negative Breast Cancer Cells Using Fourier Transform Infrared Spectroscopy. Vaccines 2019, 7, 109. [Google Scholar] [CrossRef] [Green Version]
- Bassan, P.; Kohler, A.; Martens, H.; Lee, J.; Byrne, H.J.; Dumas, P.; Gazi, E.; Brown, M.; Clarke, N.; Gardner, P. Resonant Mie Scattering (RMieS) correction of infrared spectra from highly scattering biological samples. Analyst 2010, 135, 268–277. [Google Scholar] [CrossRef]
- Bethi, C.M.S.; Narayan, B.; Martin, A.; Kudre, T.G. Recovery, physicochemical and functional characteristics of proteins from different meat processing wastewater streams. Environ. Sci. Pollut. Res. 2020, 27, 25119–25131. [Google Scholar] [CrossRef] [PubMed]
- Islam, Z.; Ali, M.H.; Popelka, A.; Mall, R.; Ullah, E.; Ponraj, J.; Kolatkar, P.R. Probing the fibrillation of lysozyme by nanoscale-infrared spectroscopy. J. Biomol. Struct. Dyn. 2020, 39, 1481–1490. [Google Scholar] [CrossRef] [Green Version]
- Pribic, R. Principal Component Analysis of Fourier Transform Infrared and/or Circular Dichroism Spectra of Proteins Applied in a Calibration of Protein Secondary Structure. Anal. Biochem. 1994, 223, 26–34. [Google Scholar] [CrossRef]
- Hotelling, H. Analysis of a Complex of Statistical Variables into Principal Components. J. Educ. Psychol. 1933, 24, 417–441. [Google Scholar] [CrossRef]
- Ali, M.H.M.; Rakib, F.; Nischwitz, V.; Ullah, E.; Mall, R.; Shraim, A.M.; Ahmad, M.I.; Ghouri, Z.K.; McNaughton, D.; Küppers, S.; et al. Application of FTIR and LA-ICPMS Spectroscopies as a Possible Approach for Biochemical Analyses of Different Rat Brain Regions. Appl. Sci. 2018, 8, 2436. [Google Scholar] [CrossRef] [Green Version]
- Cakmak-Arslan, G.; Miller, L.M.; Zorlu, F.; Severcan, F. Amifostine, a radioprotectant agent, protects rat brain tissue lipids against ionizing radiation induced damage: An FTIR microspectroscopic imaging study. Arch. Biochem. Biophys. 2012, 520, 67–73. [Google Scholar] [CrossRef] [PubMed]
- Kong, J.; Yu, S. Fourier Transform Infrared Spectroscopic Analysis of Protein Secondary Structures. Acta Biochim. Biophys. Sin. 2007, 39, 549–559. [Google Scholar] [CrossRef] [PubMed] [Green Version]
- Sadat, A.; Joye, I.J. Peak Fitting Applied to Fourier Transform Infrared and Raman Spectroscopic Analysis of Proteins. Appl. Sci. 2020, 10, 5918. [Google Scholar] [CrossRef]
- Yang, S.; Zhang, Q.; Yang, H.; Shi, H.; Dong, A.; Wang, L.; Yu, S. Progress in Infrared Spectroscopy as an Efficient Tool for Predicting Protein Secondary Structure. Int. J. Biol. Macromol. 2022, 206, 175–187. [Google Scholar] [CrossRef]
- Zhang, J.; Zhang, S.-D.; Wang, P.; Guo, N.; Wang, W.; Yao, L.-P.; Yang, Q.; Efferth, T.; Jiao, J.; Fu, Y.-J. Pinolenic acid ameliorates oleic acid-induced lipogenesis and oxidative stress via AMPK/SIRT1 signaling pathway in HepG2 cells. Eur. J. Pharmacol. 2019, 861, 172618. [Google Scholar] [CrossRef]
- Tie, F.; Ding, J.; Hu, N.; Dong, Q.; Chen, Z.; Wang, H. Kaempferol and Kaempferide Attenuate Oleic Acid-Induced Lipid Accumulation and Oxidative Stress in HepG2 Cells. Int. J. Mol. Sci. 2021, 22, 8847. [Google Scholar] [CrossRef]
- Li, J.; Wang, T.; Liu, P.; Yang, F.; Wang, X.-D.; Zheng, W.; Sun, W. Hesperetin ameliorates hepatic oxidative stress and inflammation via the PI3K/AKT-Nrf2-ARE pathway in oleic acid-induced HepG2 cells and a rat model of high-fat diet-induced NAFLD. Food Funct. 2021, 12, 3898–3918. [Google Scholar] [CrossRef]
- Patel, T.P.; Rawal, K.; Soni, S.; Gupta, S. Swertiamarin ameliorates oleic acid induced lipid accumulation and oxidative stress by attenuating gluconeogenesis and lipogenesis in hepatic steatosis. Biomed. Pharmacother. 2016, 83, 785–791. [Google Scholar] [CrossRef]
- Yu, Q.; Liu, Y.; Wu, Y.; Chen, Y. Dihydrocurcumin ameliorates the lipid accumulation, oxidative stress and insulin resistance in oleic acid-induced L02 and HepG2 cells. Biomed. Pharmacother. 2018, 103, 1327–1336. [Google Scholar] [CrossRef]
- Qu, L.-L.; Yu, B.; Li, Z.; Jiang, W.-X.; Jiang, J.-D.; Kong, W.-J. Gastrodin Ameliorates Oxidative Stress and Proinflammatory Response in Nonalcoholic Fatty Liver Disease through the AMPK/Nrf2 Pathway. Phytother. Res. 2015, 30, 402–411. [Google Scholar] [CrossRef]
- Liu, Y.; Liao, L.; Chen, Y.; Han, F. Effects of Daphnetin on Lipid Metabolism, Insulin Resistance and Oxidative Stress in Oa-Treated Hepg2 Cells. Mol. Med. Rep. 2019, 19, 4673–4684. [Google Scholar] [CrossRef] [PubMed]
- Caviglia, J.M.; Gayet, C.; Ota, T.; Hernandez-Ono, A.; Conlon, D.M.; Jiang, H.; Fisher, E.A.; Ginsberg, H.N. Different Fatty Acids Inhibit Apob100 Secretion by Different Pathways: Unique Roles for Er Stress, Ceramide, and Autophagy. J. Lipid Res. 2011, 52, 1636–1651. [Google Scholar] [CrossRef] [PubMed] [Green Version]
- Balachander, G.J.; Subramanian, S.; Ilango, K. Rosmarinic acid attenuates hepatic steatosis by modulating ER stress and autophagy in oleic acid-induced HepG2 cells. RSC Adv. 2018, 8, 26656–26663. [Google Scholar] [CrossRef] [Green Version]
- Macdonald, G.A.; Bridle, K.R.; Ward, P.J.; Walker, N.I.; Houglum, K.; George, D.K.; Smith, J.L.; Powell, L.W.; Crawford, D.H.; Ramm, G.A. Lipid peroxidation in hepatic steatosis in humans is associated with hepatic fibrosis and occurs predominately in acinar zone 3. J. Gastroenterol. Hepatol. 2001, 16, 599–606. [Google Scholar] [CrossRef] [PubMed]
- Shen, X.; Luo, L.; Yang, M.; Lin, Y.; Li, J.; Yang, L. Exendin-4 Inhibits Lipotoxicity-Induced Oxidative Stress in Β-Cells by Inhibiting the Activation of Tlr4/Nf-Κb Signaling Pathway. Int. J. Mol. Med. 2020, 45, 1237–1249. [Google Scholar] [CrossRef]
- Erdogdu, O.; Eriksson, L.; Xu, H.; Sjöholm, A.; Zhang, Q.; Nyström, T. Exendin-4 Protects Endothelial Cells from Lipoapoptosis by Pka, Pi3k, Enos, P38 Mapk, and Jnk Pathways. J. Mol. Endocrinol. 2013, 50, 229–241. [Google Scholar] [CrossRef] [Green Version]
- Dahl, J.-U.; Gray, M.J.; Jakob, U. Protein Quality Control under Oxidative Stress Conditions. J. Mol. Biol. 2015, 427, 1549–1563. [Google Scholar] [CrossRef]


Publisher’s Note: MDPI stays neutral with regard to jurisdictional claims in published maps and institutional affiliations. |
© 2022 by the authors. Licensee MDPI, Basel, Switzerland. This article is an open access article distributed under the terms and conditions of the Creative Commons Attribution (CC BY) license (https://creativecommons.org/licenses/by/4.0/).
Share and Cite
Khalifa, O.; H. Mroue, K.; Mall, R.; Ullah, E.; S. Al-Akl, N.; Arredouani, A. Investigation of the Effect of Exendin-4 on Oleic Acid-Induced Steatosis in HepG2 Cells Using Fourier Transform Infrared Spectroscopy. Biomedicines 2022, 10, 2652. https://doi.org/10.3390/biomedicines10102652
Khalifa O, H. Mroue K, Mall R, Ullah E, S. Al-Akl N, Arredouani A. Investigation of the Effect of Exendin-4 on Oleic Acid-Induced Steatosis in HepG2 Cells Using Fourier Transform Infrared Spectroscopy. Biomedicines. 2022; 10(10):2652. https://doi.org/10.3390/biomedicines10102652
Chicago/Turabian StyleKhalifa, Olfa, Kamal H. Mroue, Raghvendra Mall, Ehsan Ullah, Nayla S. Al-Akl, and Abdelilah Arredouani. 2022. "Investigation of the Effect of Exendin-4 on Oleic Acid-Induced Steatosis in HepG2 Cells Using Fourier Transform Infrared Spectroscopy" Biomedicines 10, no. 10: 2652. https://doi.org/10.3390/biomedicines10102652