Article

A nop56 Zebrafish Loss-of-Function Model Exhibits a Severe Neurodegenerative Phenotype

by
Ana Quelle-Regaldie
1,2,
Mónica Folgueira
3,4,
Julián Yáñez
3,4,
Daniel Sobrido-Cameán
5,†,
Anabel Alba-González
3,4,
Antón Barreiro-Iglesias
5,
María-Jesús Sobrido
2 and
Laura Sánchez
1,*
1
Department of Zoology, Genetics and Physical Anthropology, Faculty of Veterinary Science, University of Santiago de Compostela, 27002 Lugo, Spain
2
Instituto de Investigación Biomédica de A Coruña (INIBIC), Servicio Galego de Saúde, 15008 La Coruña, Spain
3
Department of Biology, Faculty of Sciences, University of A Coruña, 15008 La Coruña, Spain
4
Centro de Investigaciones Científicas Avanzadas (CICA), University of A Coruña, 15008 La Coruña, Spain
5
Department of Functional Biology, Faculty of Biology, Centro de Investigaciones Biológicas CIBUS, University of Santiago de Compostela, 15706 Santiago de Compostela, Spain
*
Author to whom correspondence should be addressed.
Present Address: Department of Zoology, University of Cambridge, Cambridge CB2 3EJ, UK.
Biomedicines 2022, 10(8), 1814; https://doi.org/10.3390/biomedicines10081814
Submission received: 6 July 2022 / Revised: 21 July 2022 / Accepted: 22 July 2022 / Published: 28 July 2022
(This article belongs to the Special Issue Animal Models of Neurological Disorders: Where Are We Now?)

Abstract

:
NOP56 belongs to a C/D box small nucleolar ribonucleoprotein complex that is in charge of cleavage and modification of precursor ribosomal RNAs and assembly of the 60S ribosomal subunit. An intronic expansion in NOP56 gene causes Spinocerebellar Ataxia type 36, a typical late-onset autosomal dominant ataxia. Although vertebrate animal models were created for the intronic expansion, none was studied for the loss of function of NOP56. We studied a zebrafish loss-of-function model of the nop56 gene which shows 70% homology with the human gene. We observed a severe neurodegenerative phenotype in nop56 mutants, characterized mainly by absence of cerebellum, reduced numbers of spinal cord neurons, high levels of apoptosis in the central nervous system (CNS) and impaired movement, resulting in death before 7 days post-fertilization. Gene expression of genes related to C/D box complex, balance and CNS development was impaired in nop56 mutants. In our study, we characterized the first NOP56 loss-of-function vertebrate model, which is important to further understand the role of NOP56 in CNS function and development.

1. Introduction

NOP56 is part of a core protein complex, along with NOP58, fibrillarin (FBL) and a 15.5 kD RNA-binding protein, of the C/D box small nucleolar ribonucleoprotein (snoRNP), which is in charge of cleavage and modification of precursor ribosomal RNAs (pre-rRNAs) and assembly of the 60S ribosomal subunit [1,2,3] Specifically, this C/D box snoRNP introduces a direct 2′-O-ribose methylation in specific residues in pre-rRNA and is involved in the endonucleolytic cleavages of the 35S rRNA primary transcript [4]. This C/D complex is highly conserved throughout evolution from archaea to humans [3,5,6,7,8,9].
NOP56 is decisive for the final maturation and activation of a catalytically active C/D box snoRNP. Small nucleolar RNAs (snoRNAs) control protein levels of NOP56 depending on the availability of C/D box snoRNP assembly factors [10]. Mutations in NOP56 in yeast and human cells lead to altered ribosomal biogenesis, notably on the pathway of 25S/5.8S rRNA synthesis, produce defects in 60S subunit assembly and disrupt cell cycle progression [7,10].
C/D complex dysregulation has been associated with cancer, mainly by effects on snoRNAs, which show differential expression patterns in diverse types of human cancers and are able to alter cell transformation, tumorigenesis and metastasis [11,12,13]. NOP56 was found to be a critical gene associated with Myc protooncogene transformation to produce Burkitt’s lymphomas [14]. NOP58 and fibrillarin are also associated with hepatocellular carcinoma and breast cancer, respectively [15,16,17].
Spinocerebellar Ataxia type 36 (SCA36), also known as “Costa da Morte ataxia” [18] and “Asidan ataxia” [19], is caused by a heterozygous expansion of the “GGCCTG” repeats within NOP56 intron (referred as “SCA36 expansion” throughout the text). SCA36 is a type of late-onset autosomal dominant ataxia characterized by cerebellar ataxia, sensory hearing loss and discrete motor neuron impairment (tongue atrophy with denervation, discrete pyramidal signs) [18,19]. Magnetic resonance imaging (MRI) of SCA36 brains shows cerebellar atrophy, while neuropathological studies revealed Purkinje and motor neuron loss [20,21]. As no reduction in NOP56 protein levels was found in affected human lymphoblastoids and RNA foci were detected, SCA36 is thought to be caused by a toxic mRNA gain of function or a combination of toxic gain of function and loss of function [19]. Although symptoms are milder, the hexonucleotide repeated mutation in SCA36 is similar to the C9ORF72 gene mutation that causes Amyotrophic Lateral Sclerosis (ALS). C9ORF72 mutation of ALS consists of an intronic repetition of the “GGGGCC” expansion and has been proposed to function as a gain of toxic effect on RNA metabolism [22,23]. However, some studies suggest that ALS could be caused by a combination of gain-of-function and loss-of-function mechanisms [22,24,25]. As the mechanisms of ALS have been much more deeply studied than those of SCA36, it would be interesting to see what happens under loss of function of NOP56 in an animal model. Despite efforts to unravel how SCA36 repeats lead to disease, currently there is no vertebrate model with a similar stable mutation in their genome to that of human patients. In vertebrates, only transient models were generated in mouse. So far, most models of the nucleotide expansion observed in SCA36 have been developed in cell cultures [26,27,28]. Nop56 transgenic models in Drosophila shows defects in optic lobe development, which is caused by inhibition of cell cycle progression [29]. Recently, McEachin et al. (2020) demonstrated that SCA36 expansion caused intronic retention in mRNA and repeat-associated non-AUG (RAN) translation that caused five different dipeptide repeat proteins (DPRs) in samples from SCA36 patients. In addition, injection of DNA constructs with the SCA36 expansion in mice results in inclusions of DPRs in the central nervous system (CNS), but not other hallmarks of SCA36 [28]. Another mouse model, generated by injection of constructs containing 62 repeats of the SCA36 expansion, shows pronounced locomotor defect, loss of cerebellar Purkinje cells, RNA foci and DPR inclusions in the brains [30].
Zebrafish (Danio rerio) has become an important model for the study of hereditary neurological disorders, as it has orthologs for 76% to 82% of human genes and its general organization of the CNS is highly similar to humans and many CNS regions relevant for human disease studies show molecular and structural homology in zebrafish [31]. Many zebrafish genetic models have been developed for neurological disorders, including ataxias [32,33,34,35,36,37] and ALS [38,39,40,41].
Given that a reduction in mRNA and protein levels was not studied in SCA36 pathogenesis, here we characterize a zebrafish loss-of-function model of the nop56 gene, which shows 70% homology with the human gene. We observed an aberrant phenotype in homozygous nop56 embryos that includes smaller size, malformations in the jaw, eye, inner ear and brain (e.g., absence of cerebellum and reduced number of spinal cord neurons), and impaired movement, resulting in death before 7 days post-fertilization (dpf). Homozygous mutants also showed high levels of apoptosis in the CNS. Transcription of nop56 gene was reduced in homozygous mutants, while nop58 and fbl were overexpressed, so rRNA processing seems to be impaired. C9orf72, fus and tardbp genes, related to Amyotrophic Lateral Sclerosis (ALS), also had reduced mRNA expression in nop56 homozygous mutants. In addition, expression of zpld1a and zpld1b genes, related to the development of the cupula of the inner ear, which is responsible for balance, were significantly reduced. Our study provides the first NOP56 loss-of-function vertebrate model, which will be an important tool to further understand the role of NOP56 in CNS development and function.

2. Materials and Methods

2.1. Zebrafish Care and Maintenance

Zebrafish carrying the wild-type and mutant nop56sa12582 alleles [42] were obtained from the European Zebrafish Resource Center (EZRC). The Nop56sa12582 line was generated by the ENU method (N-ethyl-N-nitrosourea) [43], which caused a C > T change that resulted in a premature stop codon.
Zebrafish individuals were maintained in the fish facilities of the Department of Genetics of the University of Santiago de Compostela (code of ethical approval committee and for animal experiments: AE-LU-003, ES270280346401) at 28 °C with a photoperiod of 14 h of light and 10 h of darkness according to standardized protocols [44,45]. All experiments involving animals followed the guidelines of the European Community and Spanish Government on animal care and experimentation (Directive 2012-63-UE and RD 53/2013).
Heterozygous fish (nop56+/−) were crossed to obtain wild-type, heterozygous (nop56+/−) and homozygous embryos (nop56−/−). Embryos were obtained after spawning at the beginning of the light morning cycle. Embryos were kept at 28 °C in Petri dishes with E3 medium (5 mM NaCl, 0.17 mM KCl, 0.33 mM CaCl2 and 0.33 mM MgSO4).

2.2. Genotyping

DNA was extracted with Chelex 100 Resin (1422822, Bio-Rad; Hercules, CA, USA) and amplified by PCR with AmpliTaq Gold™ DNA Polymerase (Thermo Fisher Scientific; Waltham, MA, USA) in a thermal cycler with the primers specific for the mutation in nop56sa12582: F: 5′ TGGCGGAAGATTTGATTCTG 3′ and R: 5′ TTTCCACTCGACATTCATCG 3′. PCR products were detected using 1% agarose gels. Sequencing of the PCR products were performed using the capillary sequencer 3730xl DNA Analyzer (Thermo Fisher Scientific) by Sanger sequencing. The results were analyzed with GeneMapper® Software (Thermo Fisher Scientific; Waltham, MA, USA) and aligned using the CodonCode Aligner software (Codon Code Corporation; Centerville, USA). The results indicated if the analyzed individuals possess the mutation of interest and whether they are homozygous or heterozygous. Finally, we analyzed if the segregation of the genotypes was Mendelian by using a chi-square test.

2.3. Characterization of General Morphology

Fish carrying wild-type and mutant nop56 sa12582 alleles were used for a phenotypic study between 24 and 120 h post-fertilization (hpf). For this, 446 embryos and larvae were dechorionated and anesthetized with 0.002% tricaine methanesulfonate (Ms-222, Sigma-Aldrich; Saint Louis, MO, USA). Photographs were taken every 24 h with a Nikon Ds-Ri1 camera coupled to an inverted fluorescence microscope (AZ100 Multizoom Nikon; Tokyo, Japan). Images were analyzed with ImageJ software (National Institutes of Health; Bethesda, MD, USA), annotating alterations in general morphology and measuring parameters such as total length of the body and size of the head, eye and otoliths. All fish were genotyped by the end of the experiments. For more detailed analysis, a few selected embryos and larvae were mounted in lateral and ventral views in 1% agarose in phosphate-buffered saline pH 7.4 (PBS) and imaged likewise at higher magnification. In this case, we performed a detailed analysis of malformations in the jaw, body midline, somites and notochord.
In addition, brains and eyes of adult wild-type and heterozygous fish were analyzed. Adult fish were euthanized by tricaine methanesulfonate overdose and fixed overnight in 4% paraformaldehyde (PFA) in PBS at 4 °C. After dissection of the brain and eyes, these were imaged under a stereomicroscope. ImageJ software was then used to measure the area of the brain and optic tectum.

2.4. Survival Analysis

Survival rate of each group (wild types, heterozygous and homozygous) was calculated. A Kaplan–Meier graph of survival between 1 and 7 days post-fertilization was generated and the average days of survival were calculated. All fish were genotyped after the experiments.

2.5. Expression Analysis

To perform an mRNA expression analysis, we used larvae between 72 and 120 hpf from a heterozygous incross. The resulting larvae were sectioned into two parts—head and tail. The heads were put in RNAlater (Sigma-Aldrich; Saint Louis, MO, USA). The tails were used to determine the genotype as previously indicated. After genotyping, pools of larval heads of each of the three groups (wild type, nop56+/− and nop56−/−) were selected. We used 3 pools (20–25 heads of larvae in each pool) for each experimental group and age. Total RNA was extracted with TRIzol Reagent (Invitrogen; Waltham, MA, USA) and treated with RNase-Free DNase Set (Qiagen; Germantown, MD, USA). RNA was quantified using NanoDrop® 2000 (Thermo Fisher Scientific). cDNA was generated with the kit Affinity Script cDNA Synthesis (Agilent; Santa Clara, CA, USA). RT-qPCR was carried out with the miRNA QRT-PCR Detection Kit (Agilent Santa Clara, CA, USA) and using the following primers specific for nop56 and other genes of interest:
nop56-F: 5′ CCCACAAGTGTGTTTGGTGA 3′
nop56-R: 5′ CCTTCTGCAGTGGAAAGAGC 3′
nop58-F: 5′ GGACAGACCACAGCCAAGAA 3′
nop58-R: 5′ CGCCTGATCCCTTTCTCCTC 3′
fbl-F: 5′ ATCAGTGCAGCAGTAGACCG 3′
fbl-R: 5′ CCTTGGGCTGAATCCTGGTC 3′
zpld1a-F: 5′ ACCCGAAGTGATGAAACTCCC 3′
zpld1a-R: 5′ GCATTTAGCTGAACGCTGGG 3′
zpld1b-F: 5′ CATCAGGGGACTGAGCTGTT 3′
zpld1b-R: 5′ CTCCATGACGGCTGTTCAGT 3′
c9orf72-F: 5′ ACACTGTGCTCAACGACGAT 3′
c9orf72-R: 5′ AACTGCCGGTGGAGTCCTTA 3′
tardbp-F: 5′ CTTTGCAGATGACCAGGTTGC 3′
tardbp-R: 5′ CCTCCGAACCCATTCCCAAA 3′
fus-F: 5′ AGCAGAGTGGAGGTGGGTAT 3′
fus-R: 5′ GTTGTAACCTCCCTGTCCGT 3′
cbln12-F: 5′ GCCCACTAATTCAGGTTGCCT 3′
cbln12-R: 5′ CCCGTCTGTCAGTTTTCCCT 3′
grid2-F: 5′ GTCCCATCGAAGGAGGACGATA 3′
grid2-R: 5′ AGAGTCTGGATCTGCTCTGGT 3′
ptf1a-F: 5′ ACATGCCAATTCGGAACCCA 3′
ptf1a-R: 5′ CATTTGGAGATGGGGATCTTGTT 3′
p21-F: 5′ CGCAAACAGACCAACATCAC 3′
p21-R: 5′ ATGCAGCTCCAGACAGATGA 3′
In addition, primers sequences of 5′ETS, 18S, ITS1, ITS2 and p53 were obtained from Bouffard et al., 2018 [46].
Each sample was run in triplicate and we used primers for beta-actin 2 as housekeeping gene, F: 5′ ACTTCACGCCGACTCAAACT 3′ R: 5′ ATCCTGAGTCAAGCGCCAAA 3′. Relative mRNA levels of each gene were normalized to the expression of the housekeeping gene through the 2∆∆CT calculation method.

2.6. Acridine Orange

Apoptotic cells of wild-type, nop56+/− and nop56−/− embryos at 24–30 hpf were stained with a 3 μg/mL solution of acridine orange in E3 medium for 30 min. After that, the embryos were washed twice in E3 medium. Confocal photomicrographs were taken with a Leica TCS SPE confocal laser microscope (Leica Microsystems, Wetzlar, Germany) with the GFP filter set (excitation 473, emission 520) at 5 × magnification and always using the same parameters of laser intensity and photomultiplier gain. The images were analyzed with ImageJ software (National Institutes of Health; Bethesda, MD, USA). Pixels of the embryo were selected using the tracing tool and the area; the mean and the integrated density of each fish were measured. These measurements were combined in the formula of corrected total cell fluorescence (CTCF): CTCF = integrated density − (area of selected cell × mean fluorescence of background readings).

2.7. Immunofluorescence

Fish were euthanized by tricaine methanesulfonate overdose and then fixed with 4% paraformaldehyde (PFA) in phosphate-buffered saline (PBS; pH 7.4) for at least 2 h at room temperature.
For serotonin (5-HT) and zebrin immunofluorescence experiments, after washes in PBS, larvae were incubated in collagenase (2 mg/mL in PBS) for 25 min at room temperature and then in glycine (50 mM in PBS with 1% Triton X-100) for 10 min at room temperature. Then, the animals were incubated with rabbit anti-5-HT (Immunostar, Still Water, MN, USA; Cat#: 20080; dilution 1:2500) or Zebrin II (mouse anti-Aldolase C; kindly provided by Prof. Richard Hawkes: dilution 1:100) antibodies overnight at 4 °C. The larvae were rinsed in PBS with 1% Triton X-100 (1% PBST) and incubated overnight at 4 °C with a Cy3-conjugated goat anti-rabbit antibody (Millipore; Burlington, MA, USA; dilution 1:200) or a FITC-conjugated goat anti-mouse antibody (Millipore; dilution 1:100). Antibodies were always diluted in 1% PBST, 1% DMSO, 1% normal goat serum and 1% bovine serum albumin. Larvae were mounted with 70% glycerol in PBS. Confocal photomicrographs were taken with TCS-SP2 spectral confocal laser microscope (Leica Microsystems, Wetzlar, Germany). For the quantification of serotonergic neurons, the total number of 5-HT-ir interneurons located in the 4 spinal cord segments located at the level of the caudal fin was quantified manually using the cell counter plugin of the Fiji software (Image J; National Institutes of Health; Bethesda, MD, USA) going through the stack of confocal optical sections.
For alpha-tubulin and synaptic vesicle 2 (SV2) immunofluorescence, fish were transferred to 100% methanol and kept at −20 °C for at least 30 min. After rinsing in PBS with 0.5% Triton X-100 (0.5% PBST), fish were digested in proteinase K (Sigma, Aldrich; Saint Louis, MO, USA), fixed in PFA and incubated with normal goat serum in 0.5% PBST for 1 h. Then, fish were incubated with alpha-tubulin (Sigma-Aldrich; Saint Louis, USA; Cat#: T7451, dilution 1:250) or SV2 (DSHB; Cat#: AB2315387, dilution 1:250) primary antibodies diluted in 1% normal goat serum in PBST overnight at 4 °C. The next day, after washing in PBST, fish were incubated overnight with goat anti mouse antibodies conjugated to Alexa Fluor 568 (Invitrogen, Waltham, USA; A-11029 and A-11031) in 1% normal goat serum in PBST. After washes, some fish were counter stained with Sytox Green Nuclear Stain (Invitrogen, Waltham, MA, USA; Cat#: S7020; dilution 1:1000). Fish were mounted in 1% agarose in 80% glycerol and imaged using a laser scanning confocal microscope Nikon A1R (Nikon; Tokyo, Japan).

2.8. Behavioral Analysis

Embryos between 2 and 3 dpf were dechorionated with a pair of forceps and were subjected to touch-evoked escape response analysis. Behavior was recorded with a Nikon Ds-Ri1 camera coupled to an inverted fluorescence microscope (AZ100 Multizoom Nikon; Tokyo, Japan). Distance moved was measured under quantification mode of Zebralab software (Viewpoint).
Movement of 4 dpf zebrafish larvae was quantified with a Zebralab system composed of a Zebrabox (Viewpoint; Civrieux, France). The 4 dpf larvae were introduced in 96-well plates and total movement was measured in periods of 10 min during an hour alternating light and dark.

2.9. Morpholino Injection

p53 morpholino injection was used to assess that the observed phenotype is not a consequence of upregulation of p53-mediated apoptosis caused by off-target effects. p53 morpholino was designed and synthesized by Gene Tools (Philomath, OR, USA). Its sequence is: 5′GCGCCATTGCTTTGCAAGAATTG3′. It was injected into one-cell-stage embryos in a volume of 3–5 nL/embryo and at a concentration of 1 mM.

2.10. Statistical Analysis

Data analysis of the three groups (wild type, nop56+/− and nop56−/−) and graphs were generated with GraphPad Prism (GraphPad; San Diego, CA, USA), using one-way ANOVA with Bonferroni test for multiple comparisons after performing the D’Agostino–Pearson normality test. Statistical significance was established at p-value < 0.05. Statistically significant tests are indicated with asterisks in the graphs.

3. Results

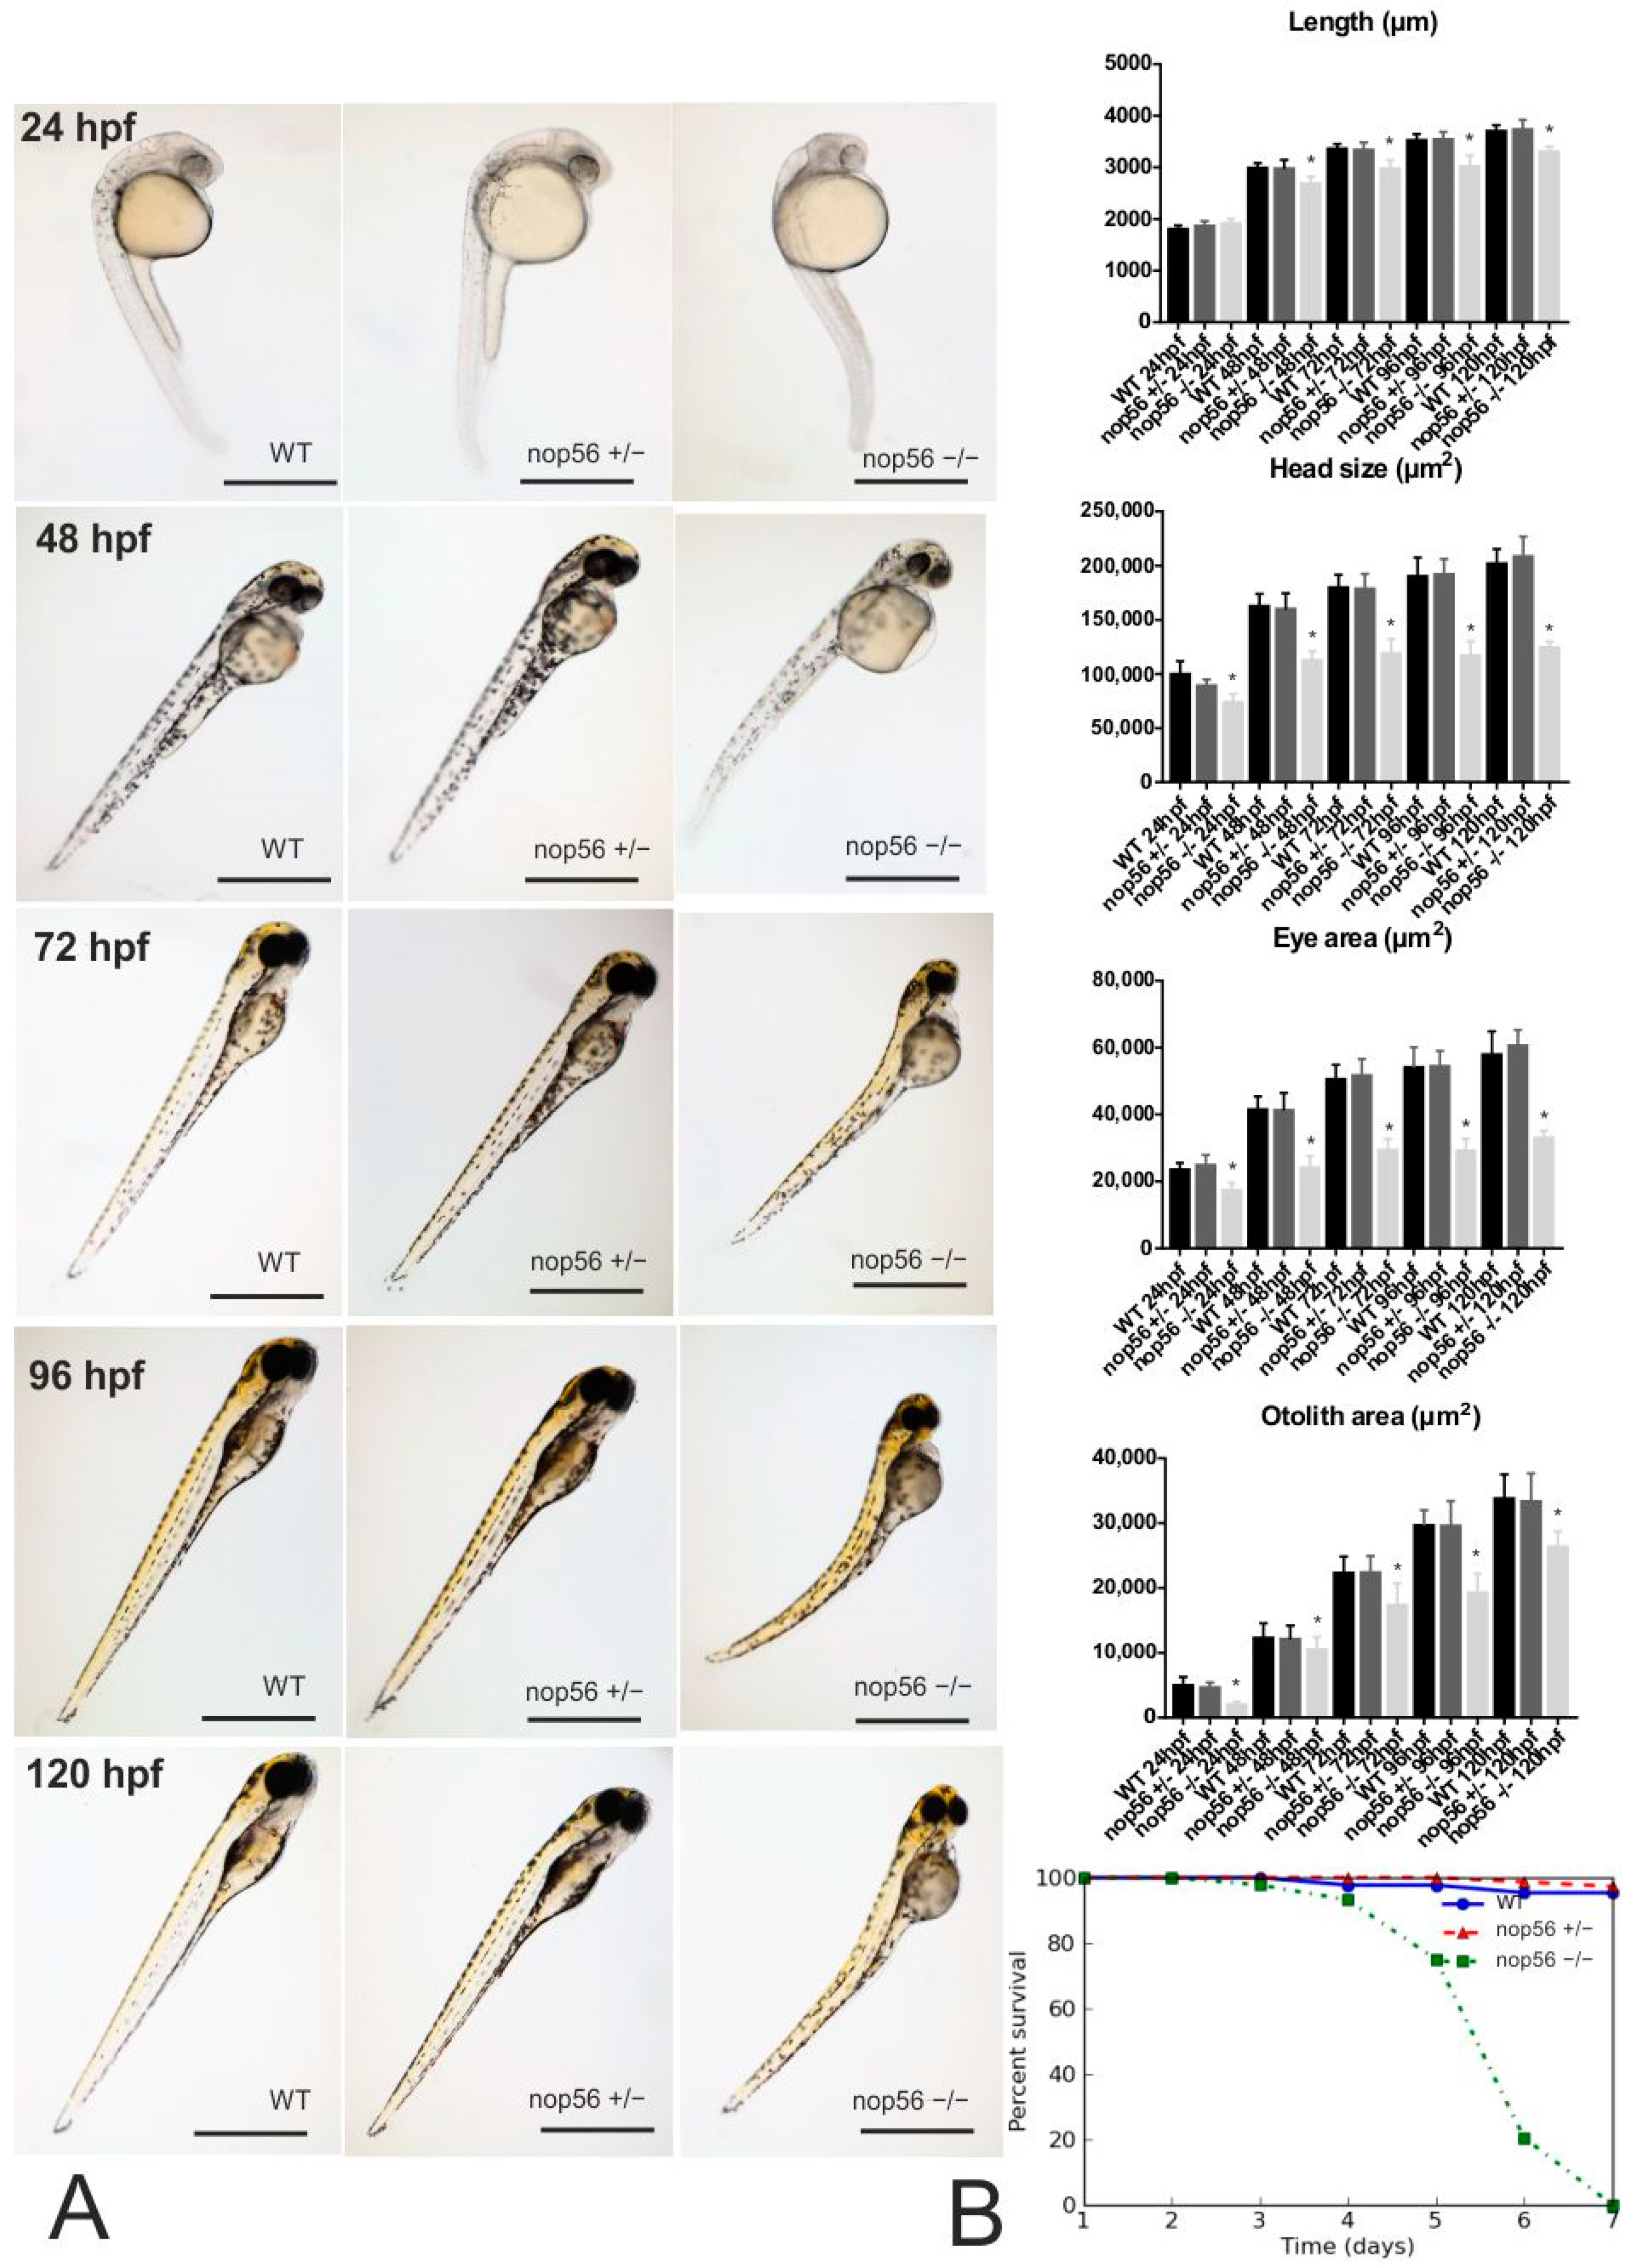
3.1. nop56−/− Embryos Develop an Abnormal Phenotype

From 24 to 120 hpf, we confirmed the expected Mendelian distribution of genotypes from an incross between heterozygous using chi-square test, with 27.5% of wild type (n = 123), 48% of nop56+/− (n = 213) and 24.5% of nop56−/− (n = 110).
Nop56−/− individuals have a characteristic abnormal phenotype, showing a reduced body length (differences are statistically significant from 48 hpf onwards, p-value < 0.001) and a smaller head, otoliths and eyes (these 3 characteristics being statistically significant from 24 hpf onwards: p-value < 0.001) (Figure 1). In addition, after detailed analysis, we also observed abnormal eye morphology in the homozygous fish compared to wild type, including coloboma and midline malformations (Figure 2). We also observed other characteristics such as swollen yolk in 100% of the nop56−/− embryos since 48 hpf (less than 2% of the wild type and nop56+/− had swollen yolk). Cardiac edema was detected in 77% of the nop56−/− embryos at 72 hpf, 88% at 96 hpf and in 100% at 120 hpf (less than 3% of the wild type and nop56+/− had cardiac edema). Lordosis was first observed at 48 hpf in 40% of nop56−/−, at 120 hpf the number rises to 50% of the larvae (less than 5% of the wild type and nop56+/− had this malformation at this developmental stage). Nop56−/− embryos fail to hatch from the chorion, but this is not the cause of the curved body shape because when manually removed from the chorion, they keep their curved body shape. From 96 hpf, we observed absence of the swimming bladder in 100% of the nop56−/− embryos (100% of the wild-type and nop56+/− embryos had swimming bladder).
In addition, a more detailed analysis under a bright-field microscope showed additional malformations in homozygous fish compared to wild types by 3.5 dpf (Figure 2), mainly affecting the jaw, eye and brain. Homozygous fish had much smaller jaw and seemed to show abnormal patterning of the brain, with much smaller or absent cerebellum and smaller midbrain.
In order to analyze possible macroscopic differences in the brain of heterozygous individuals for the nop56 gene in adult zebrafish, the dimensions of different regions of fixed brains were measured. Data analysis between wild-type individuals and heterozygotes carrying the mutation at six months of age, resulted in no significant differences observed in the sizes corresponding to different areas of the brain, including the cerebellum (not shown).
Finally, we analyzed survival of wild-type (n = 43), nop56+/− (n = 75) and nop56−/− (n = 44) zebrafish during their first week of life and plotted their survival curves using a Kaplan–Meier survival graph (Figure 1B). A log-rank statistical test comparing the individual group survival curves revealed that the nop56−/− had a significantly shorter survival with decease start as soon as 4 dpf as compared to nop56+/− and wild-type (p < 0.0001) animals during early development. Our results showed that 80% of the nop56−/− larvae died before 6 dpf and all the nop56−/− animals died by 7 dpf.

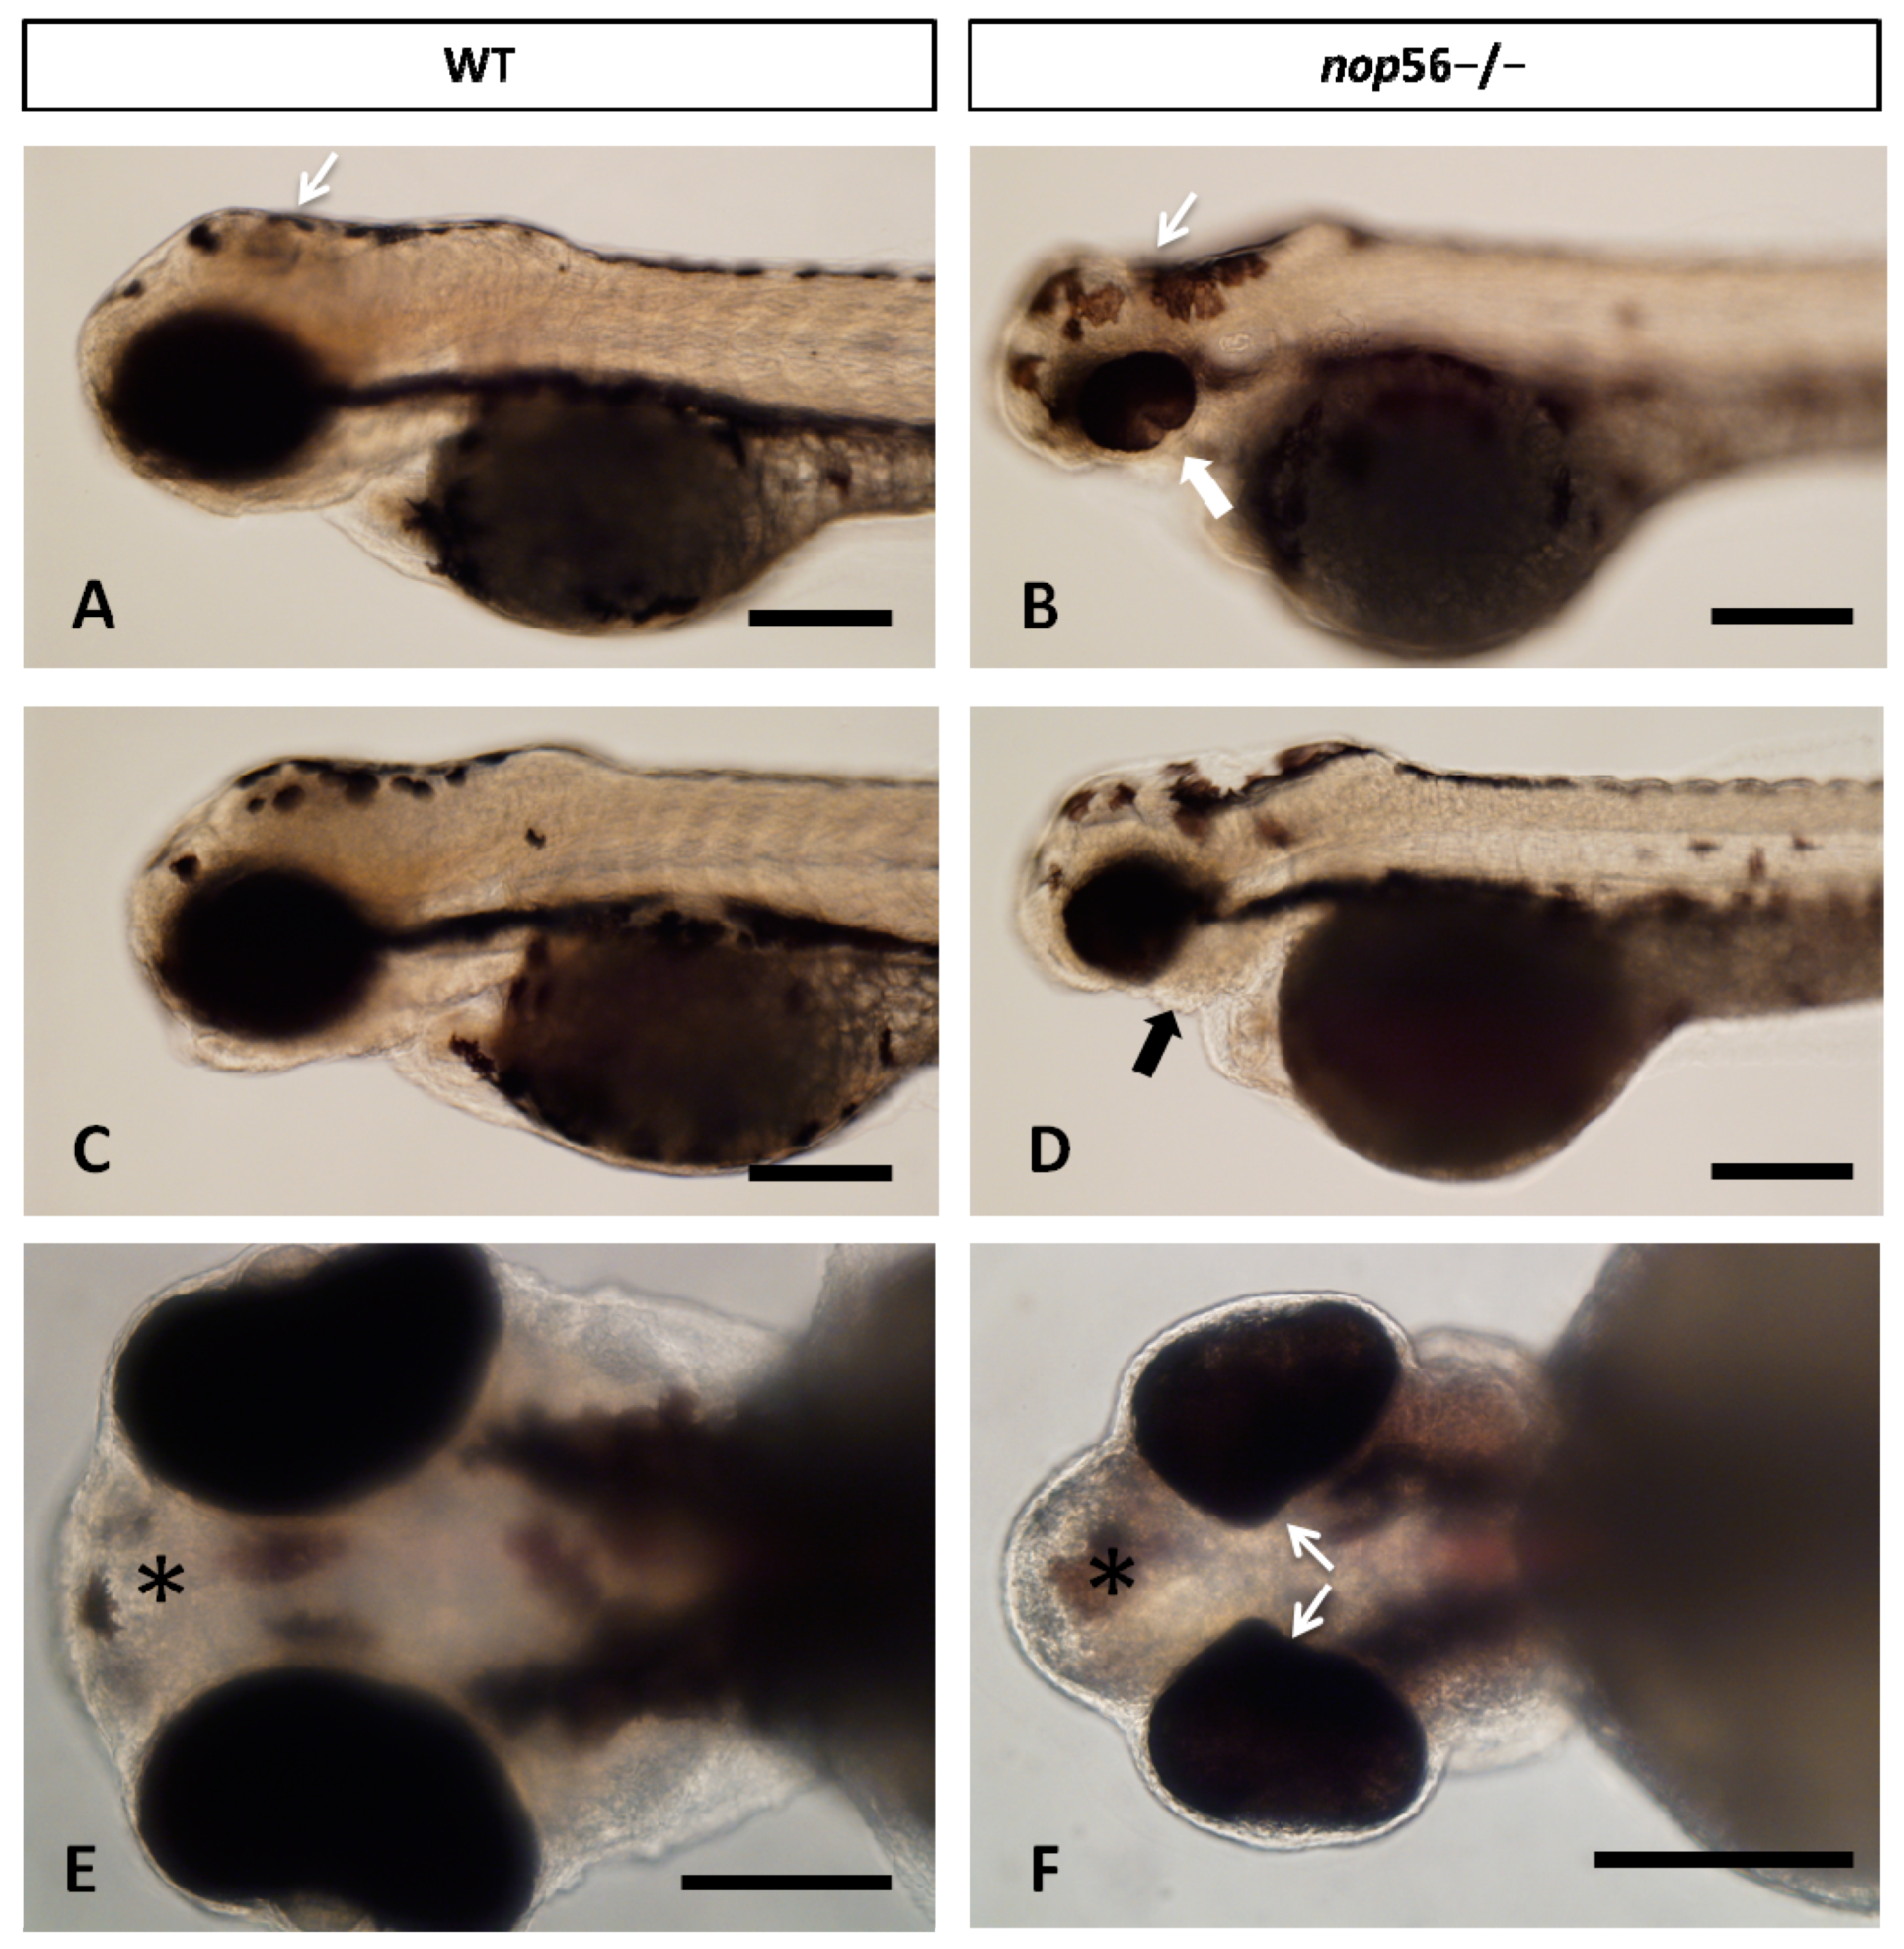
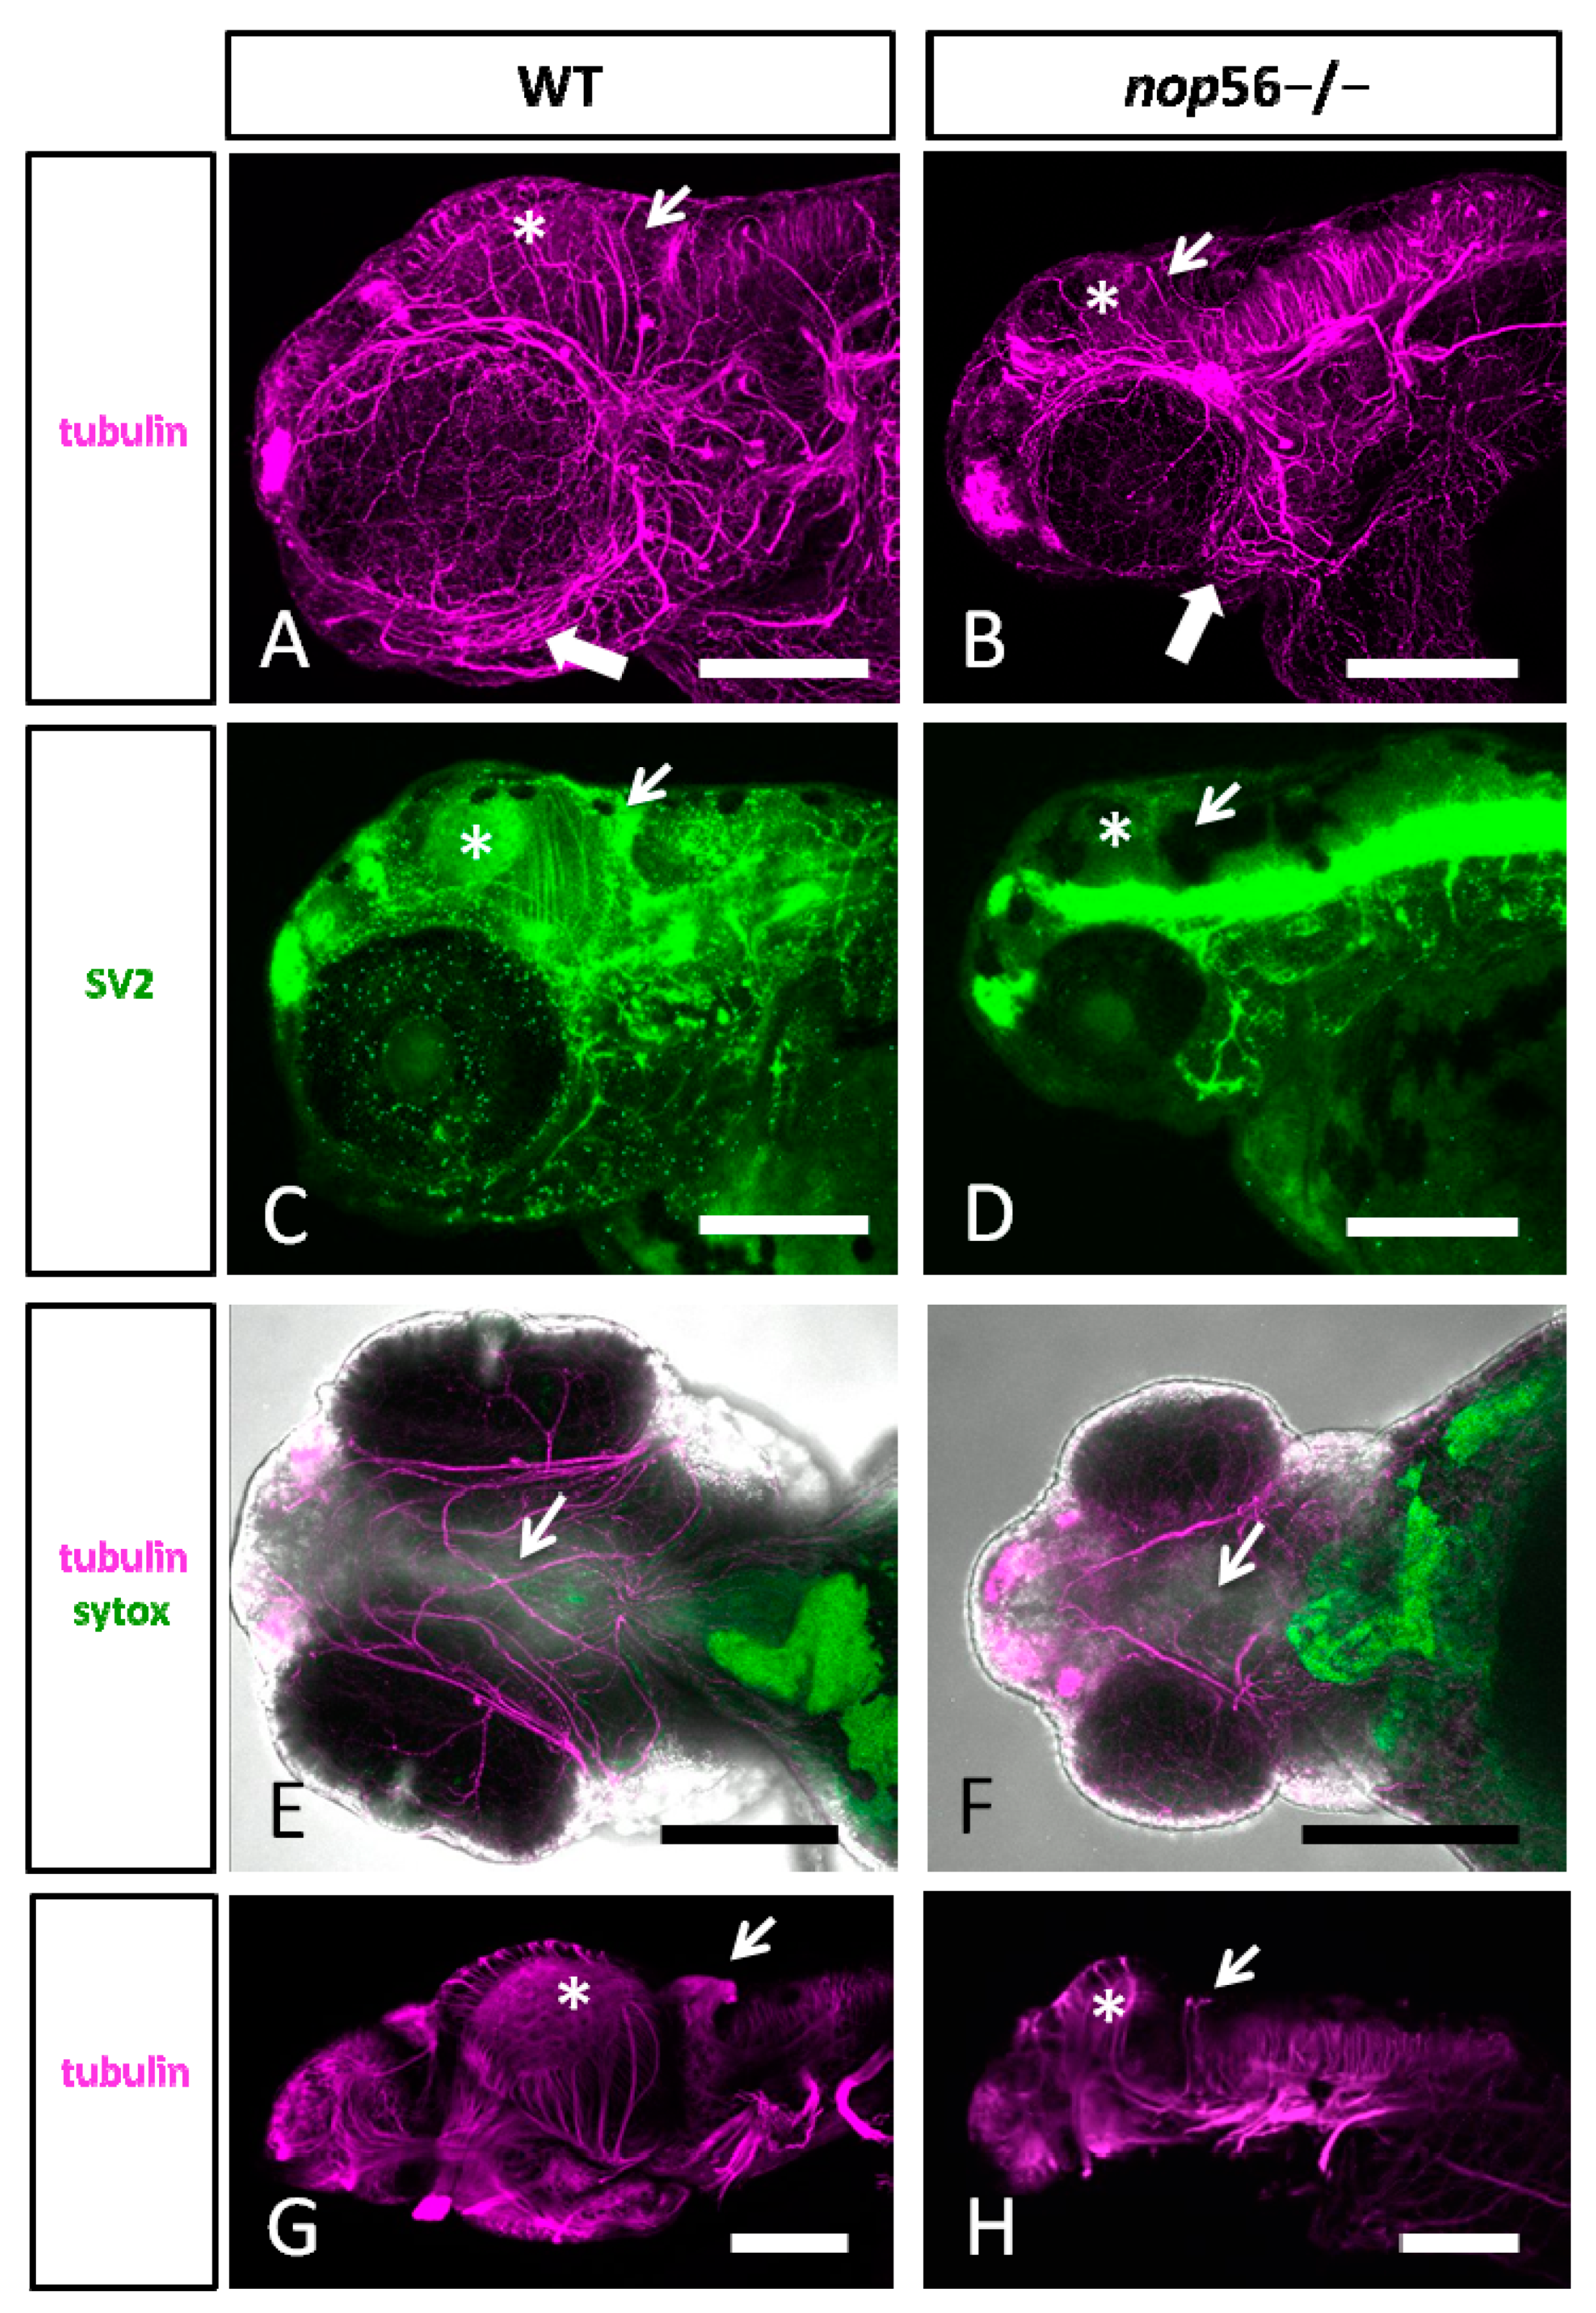
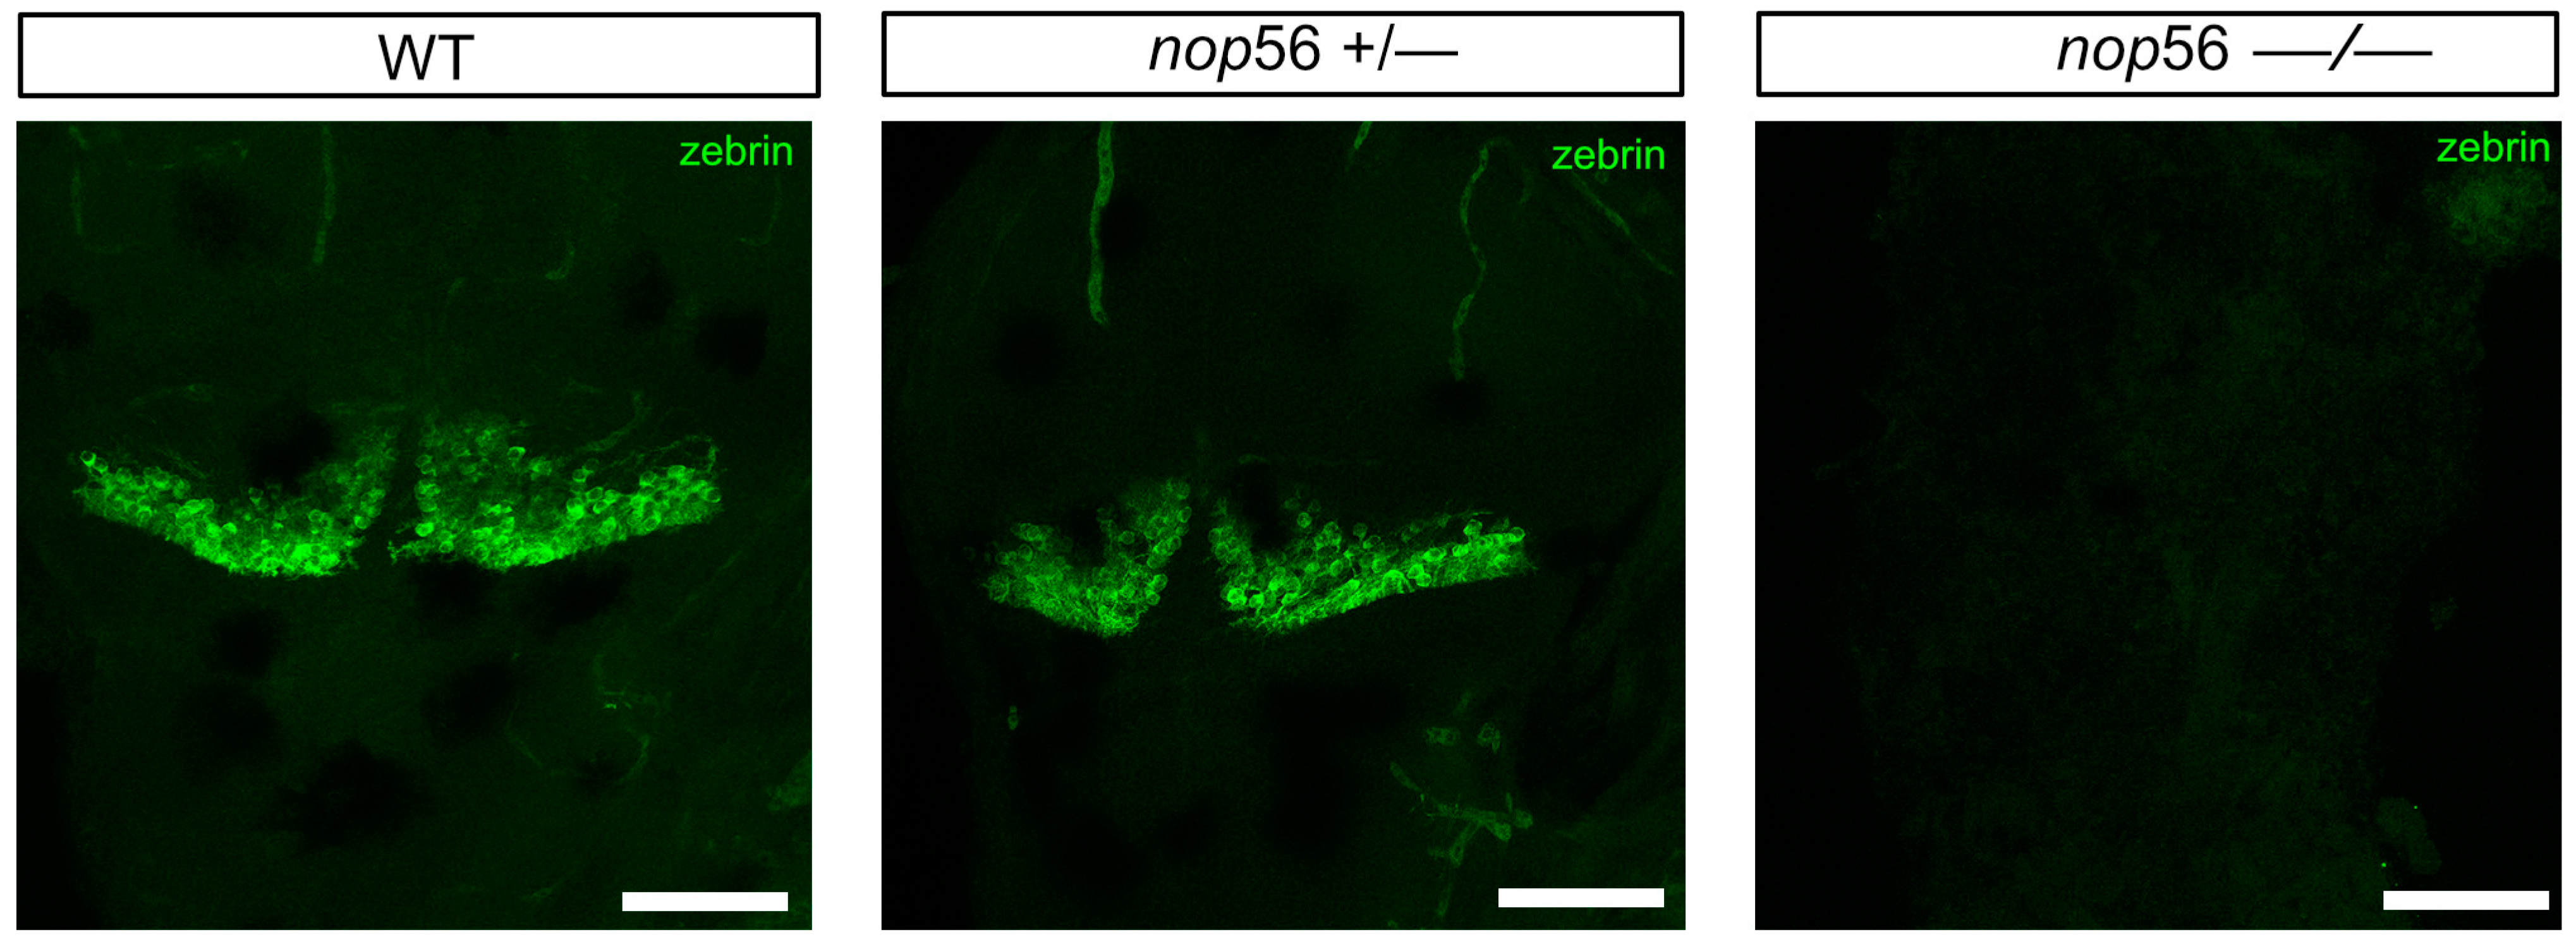
3.2. Malformations in the Central and Peripheral Nervous System of nop56 −/− Larvae

We quantified mRNA levels by RT-qPCR of three genes that are expressed in specific cell types of the zebrafish cerebellum: ptf1a and grid2 (Purkinje cells) and cbln12 (granule cells) [47,48]. We observed a significant reduction in ptf1a, grid2 and cbln12 in nop56−/− (p-value < 0.0001) (Figure 3). grid2 and cbln12 expression was observed to be also reduced in nop56+/− between 72 and 120 hpf in comparison with wild-type embryos (p-value < 0.0001) but not as strong as nop56−/− larvae.
We analyzed in more detail the central and peripheral nervous system in 3.5 dpf wild type, nop56+/− and nop56−/− by using alpha-tubulin and synaptic vesicles 2 (SV2). In the head, we observed abnormal innervation of the jaw (Figure 4). In the brain, we observed smaller optic tectum and smaller or absent cerebellum (Figure 4). Zebrin II immunofluorescence experiments revealed a complete lack of cerebellar Purkinje cells in 4 dpf nop56−/− animals as compared to wild-type or heterozygous fish (Figure 5).

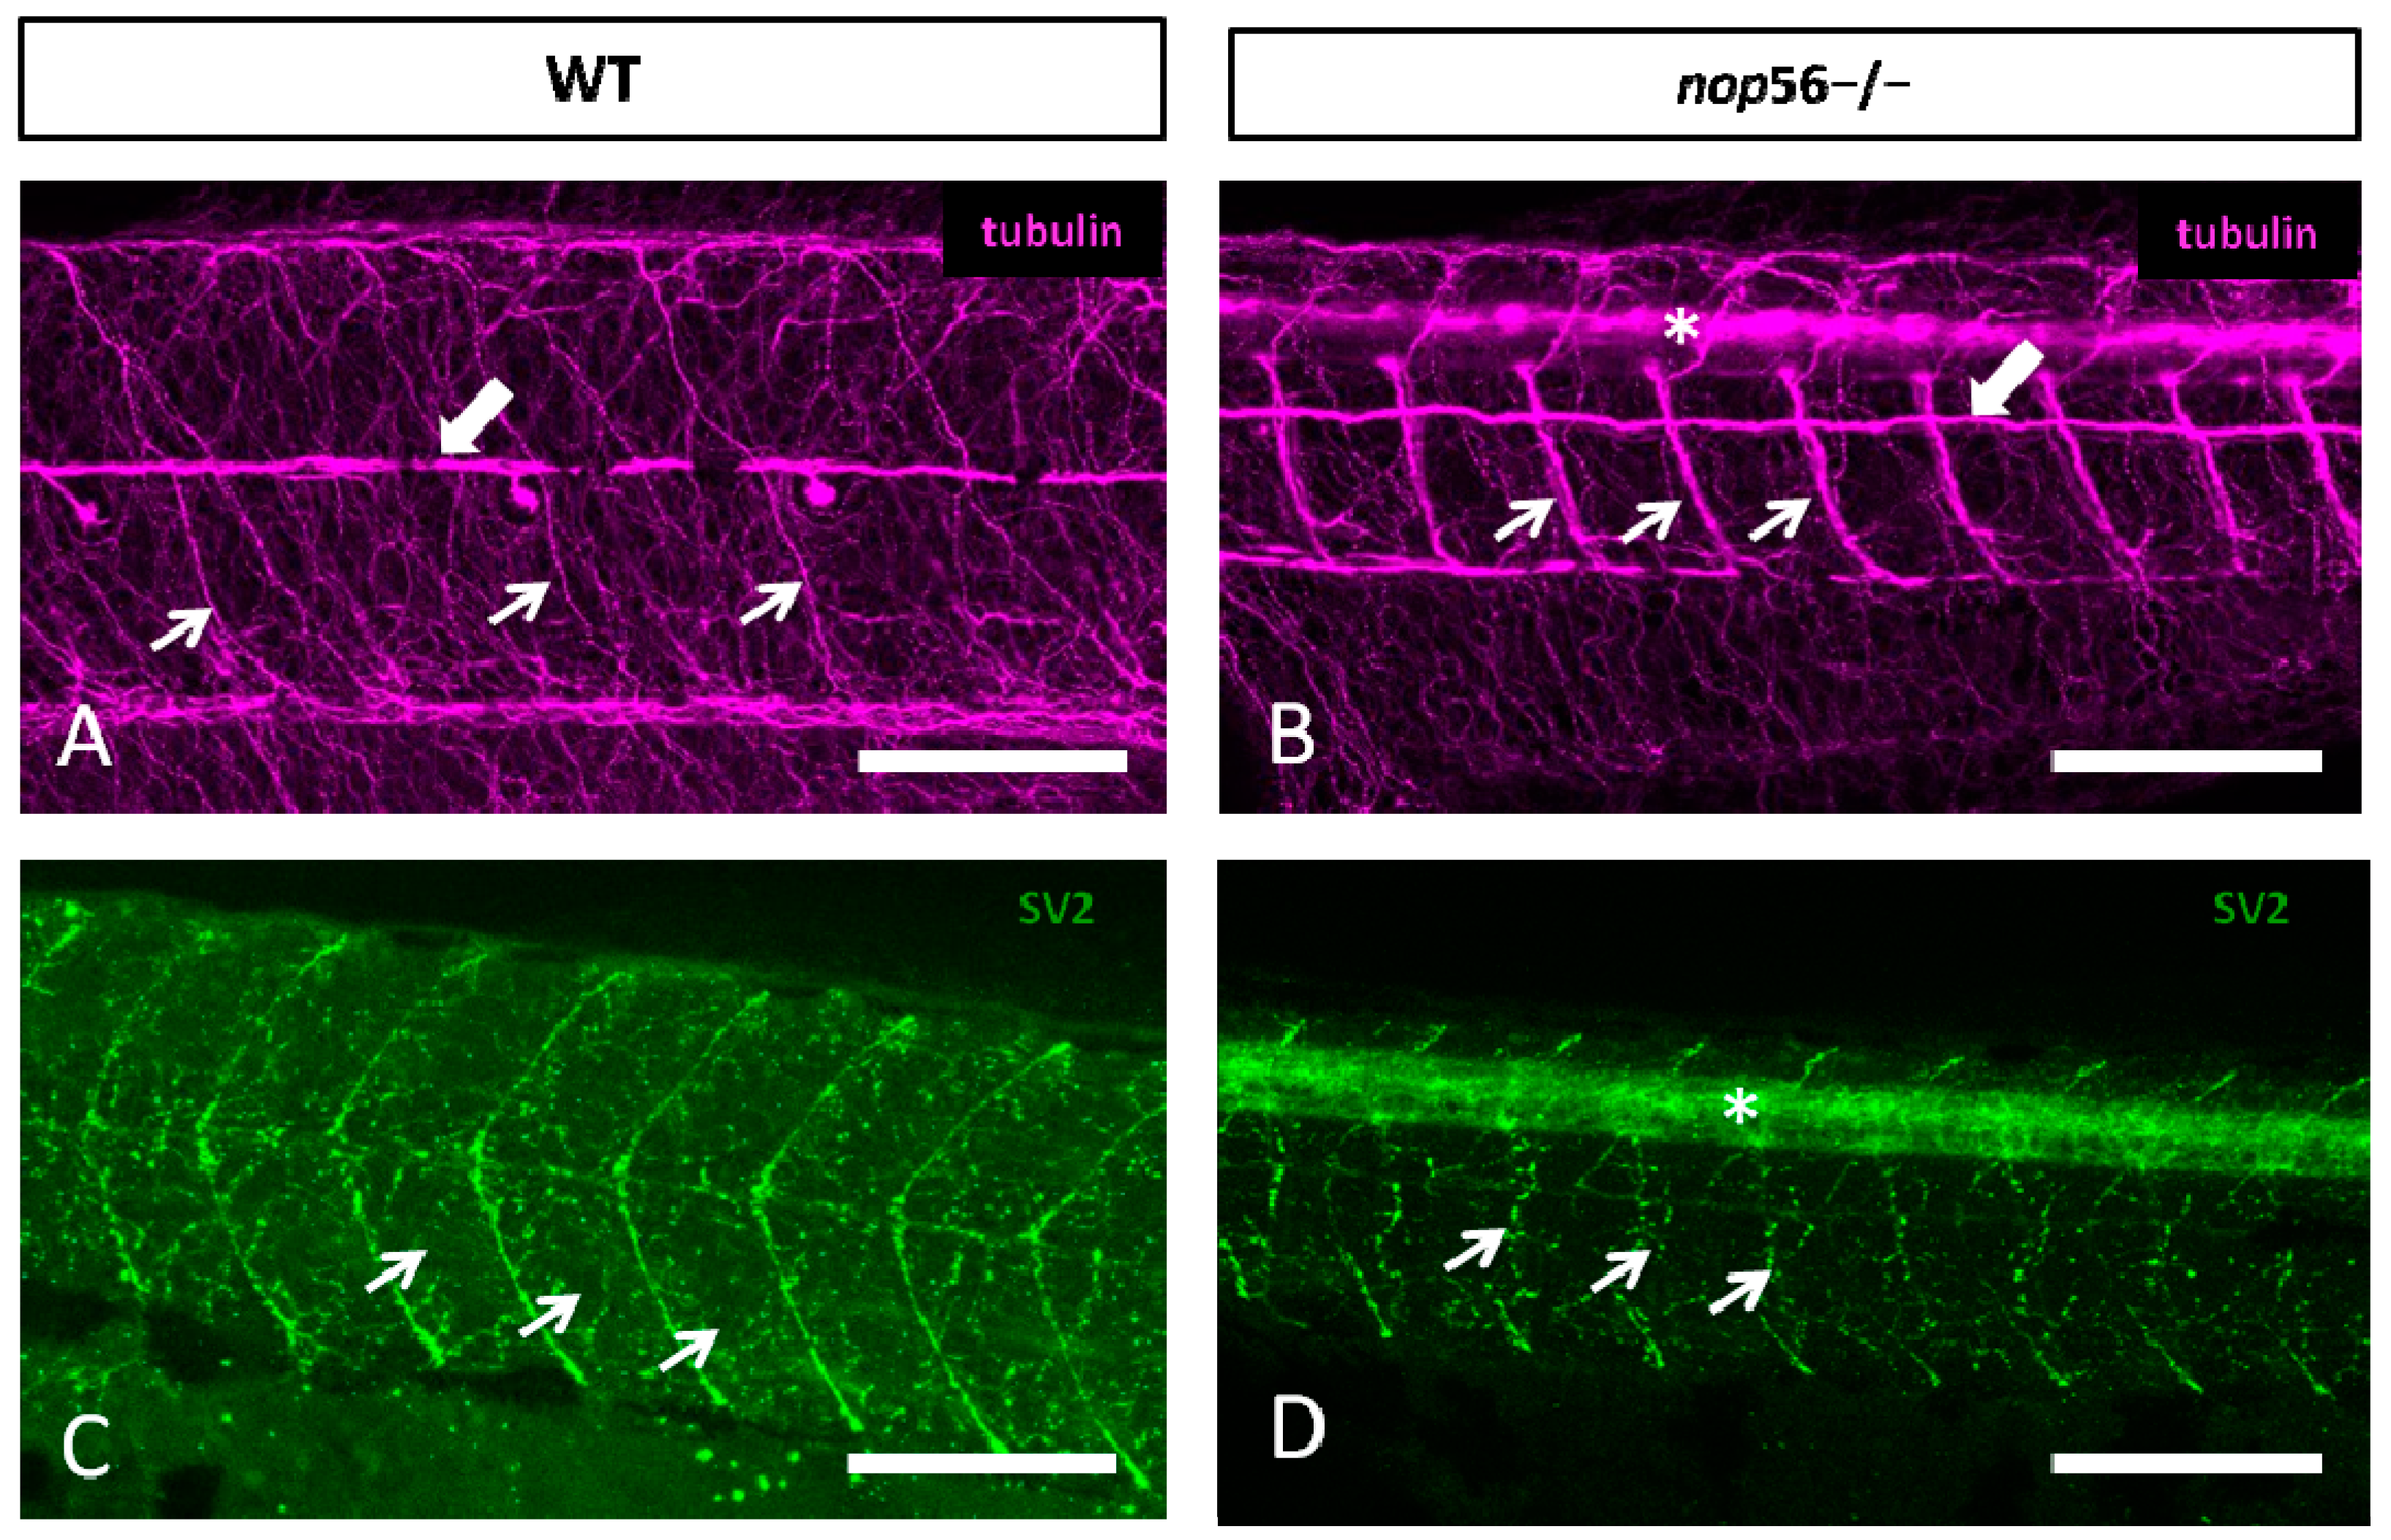
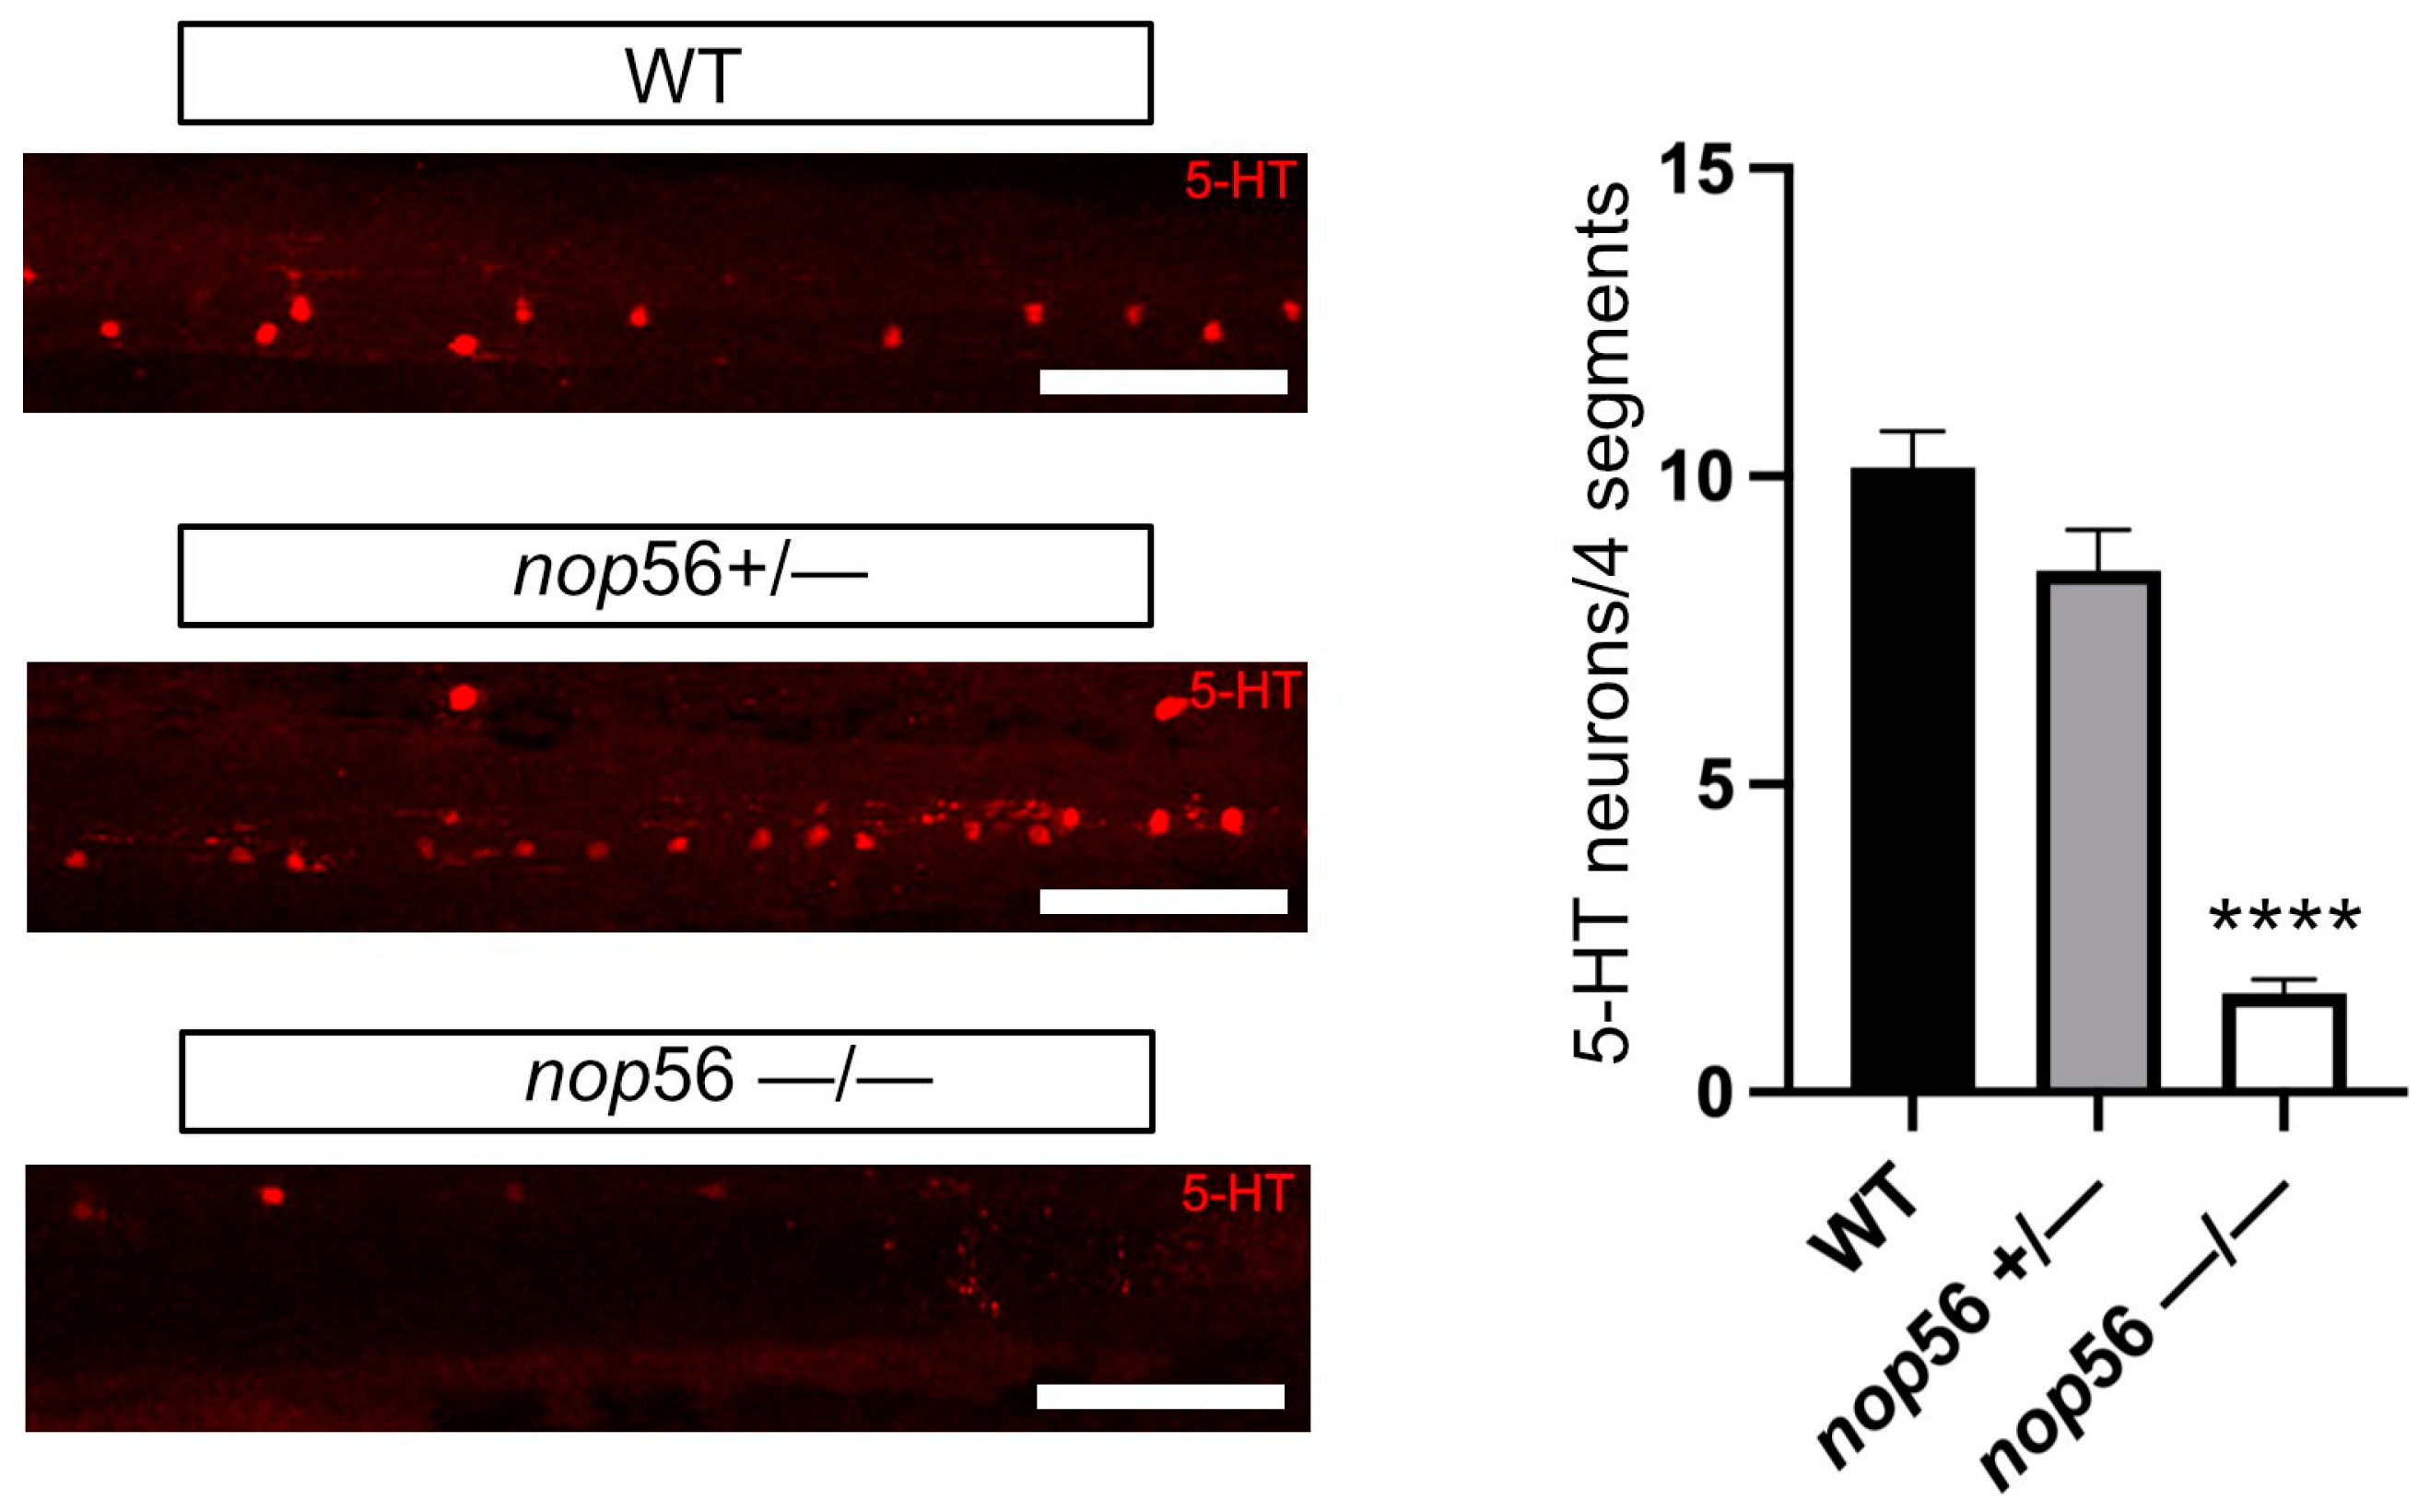
3.3. Neuromuscular Junction and 5-HT Spinal Cord Interneurons

We next analyzed neuromuscular junction integrity. For this, we used alpha-tubulin to label the whole trunk innervation and SV2 as a presynaptic marker. Both markers revealed abnormal innervation of the trunk myomeres in nop56−/− compared with wild types by 3.5 dpf (Figure 6). Alpha-tubulin shows that axons of primary motor neurons are thicker and less branched in nop56−/− than in wild types (Figure 6 and Supplementary Materials: Videos S1 and S2). SV2 also shows less branching of the axons innervating the myomeres, as well as differences in myosepta staining.
We also observed that the number of 5-HT-ir neurons was significantly reduced in the spinal cord of 4 dpf nop56−/− larvae (one-way ANOVA, p < 0.0001) as compared to control wild-type animals (Figure 7). No significant differences were observed between control wild-type and nop56+/− animals.

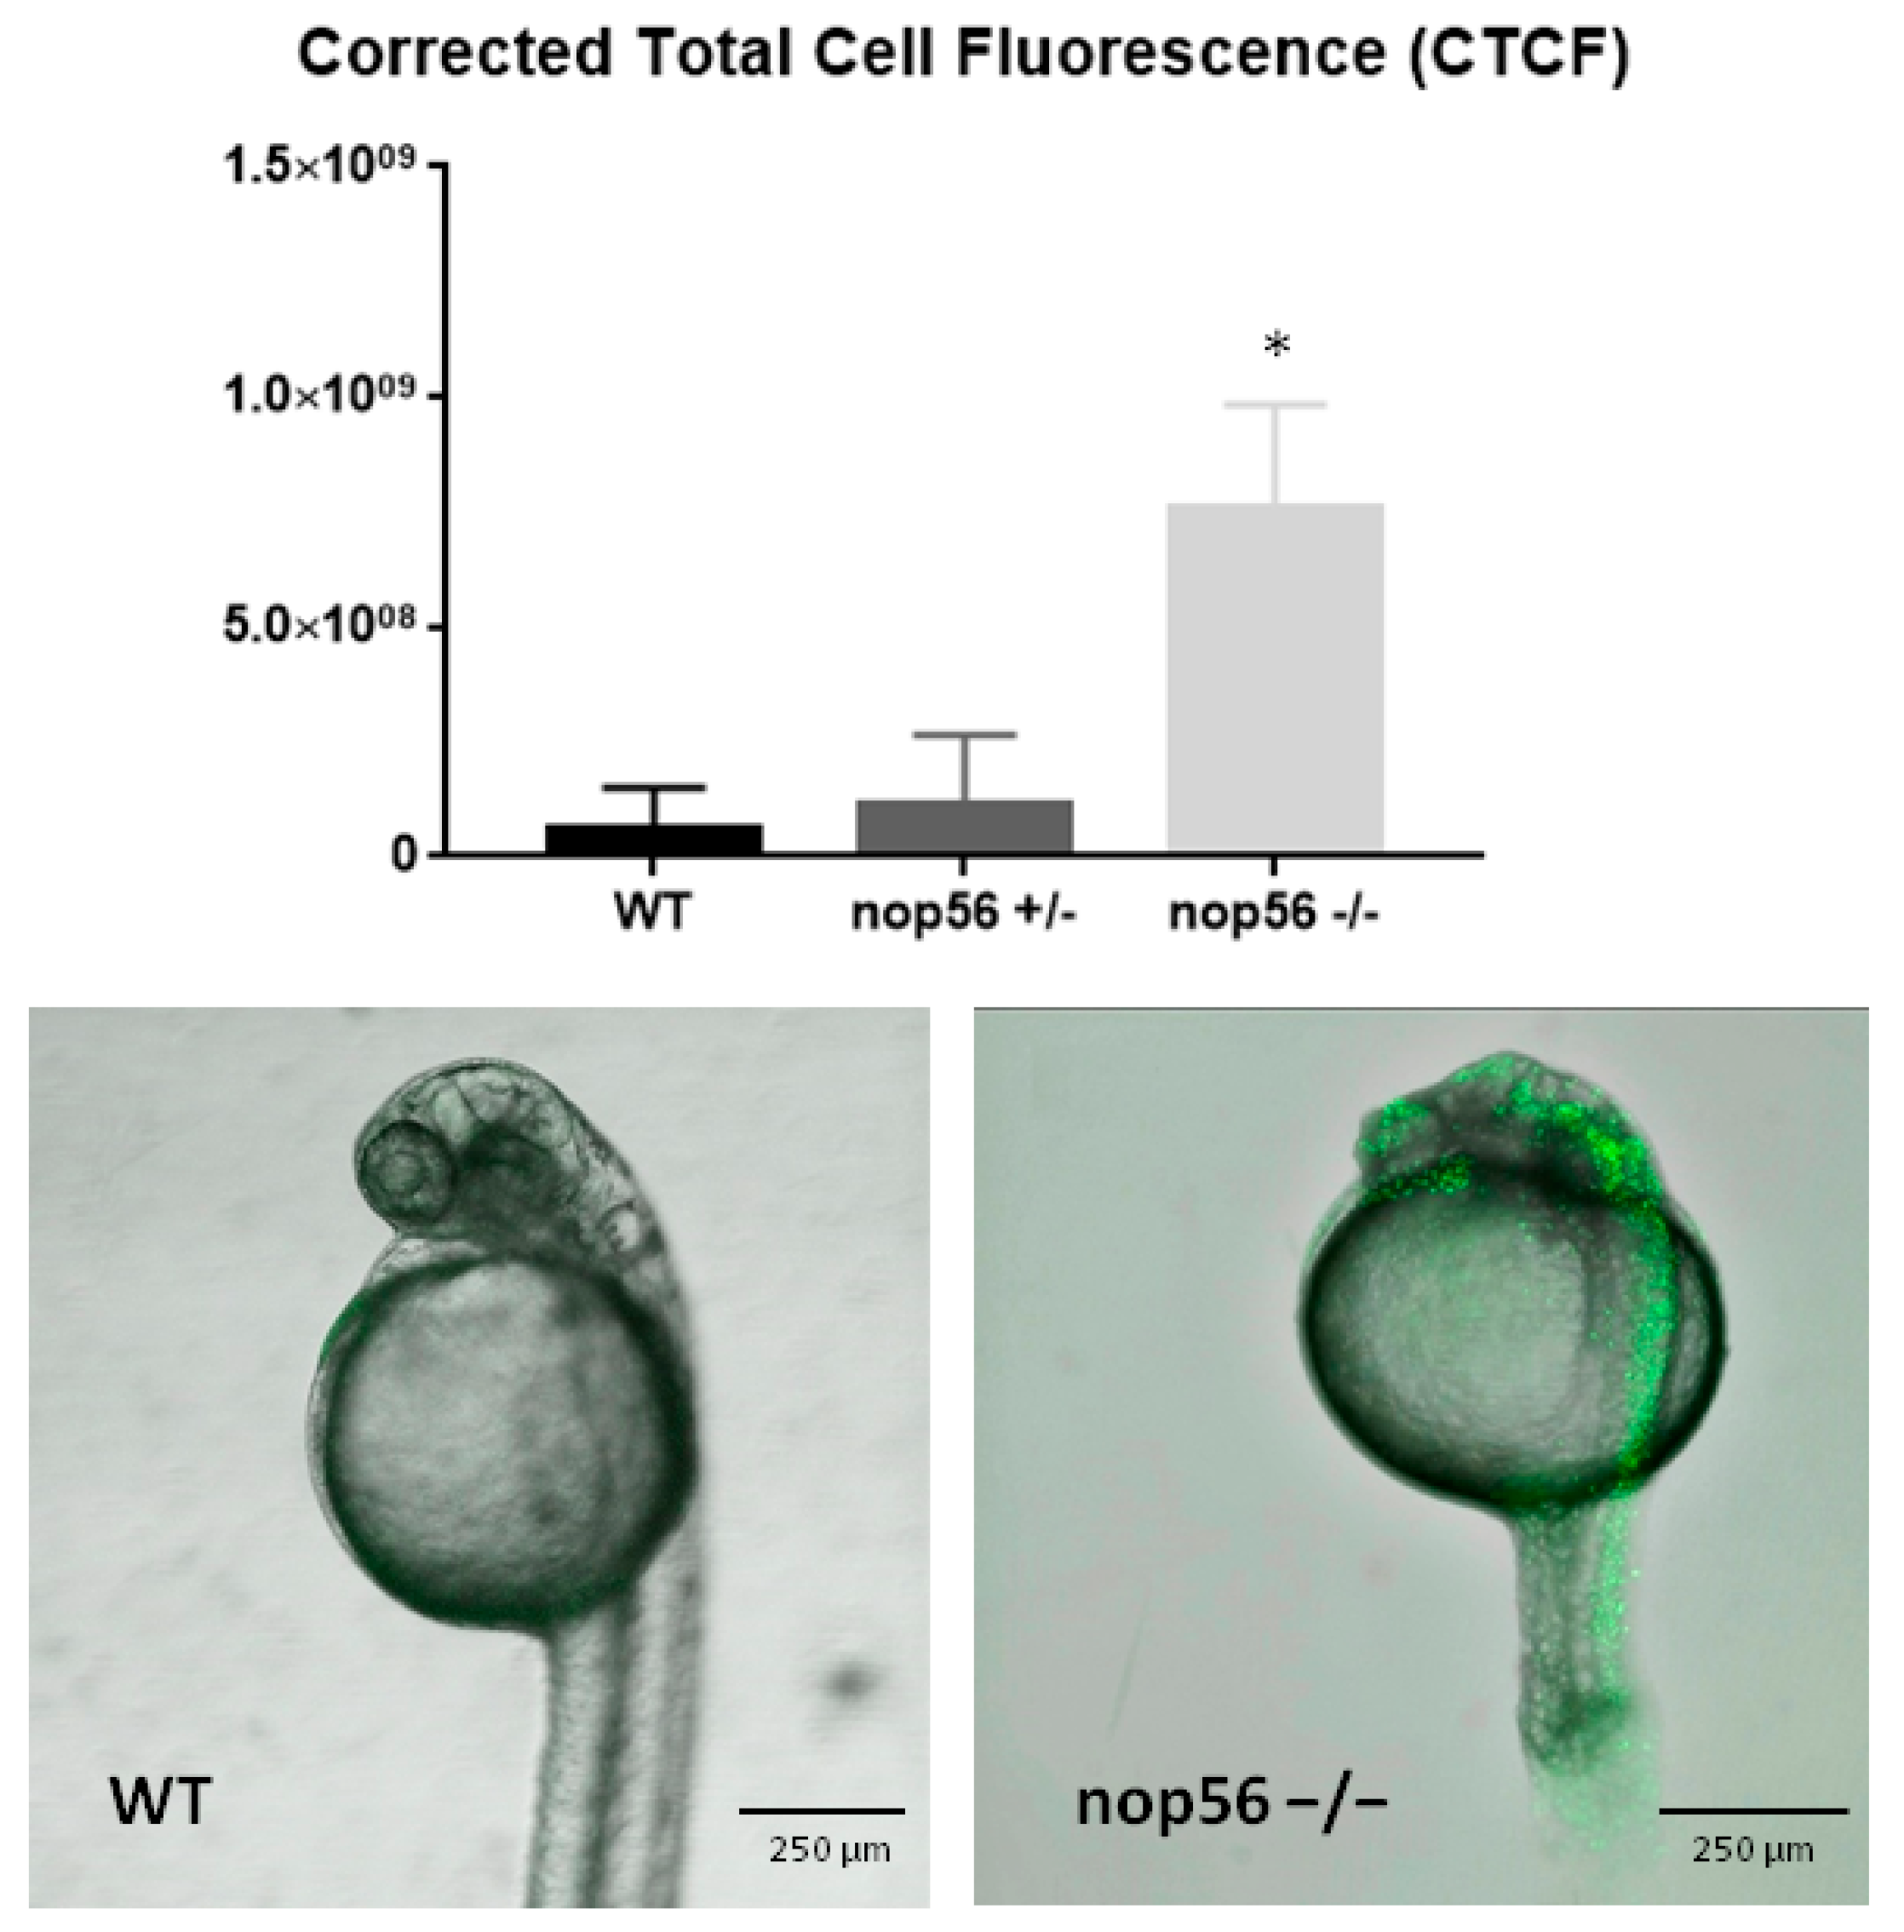
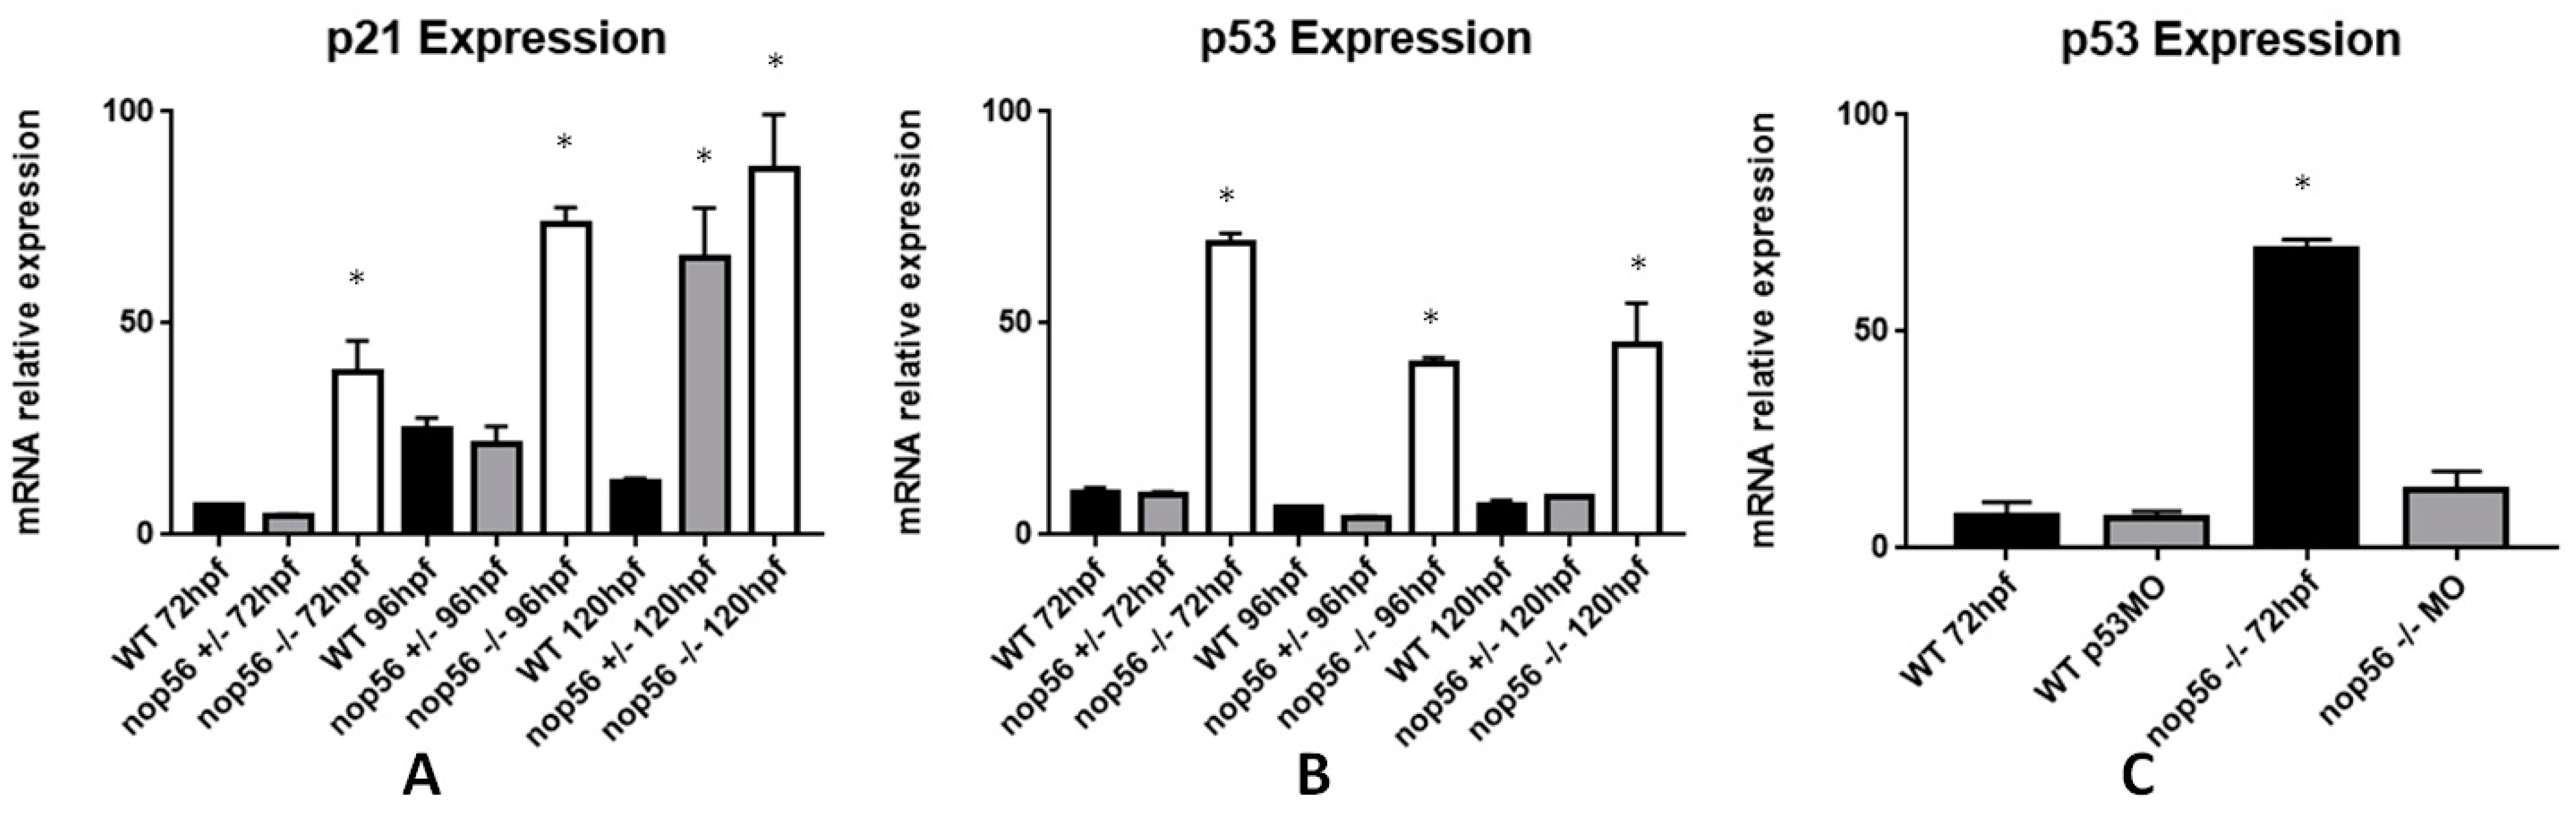
3.4. nop56−/− Larvae Have Increased Apoptosis Mainly in the CNS

Acridine orange was used for in vivo staining of cellular apoptosis. An increase in apoptosis was seen in the nop56−/− embryos (p-value < 0.0001), mainly in the eye, brain and spinal cord (Figure 8).
We examined mRNA expression by RT-qPCR of p21 and p53 genes that are related to apoptosis and cell cycle control [49]. We found both were overexpressed in nop56−/− larvae (p-value < 0.0001). The microinjection of a p53 translation block morfolino at one-cell-stage did not rescue the nop56−/− malformations (not shown) even when the expression of p53 was similar to wild type when measured at 72 hpf (Figure 9). The reduction in p53 mRNA concentrations can be explained by the fact that it was observed that sometimes when a translation block morpholino binds to an mRNA, its secondary structure suffer changes, altering the availability of mRNA for nucleotyc degradation [50].

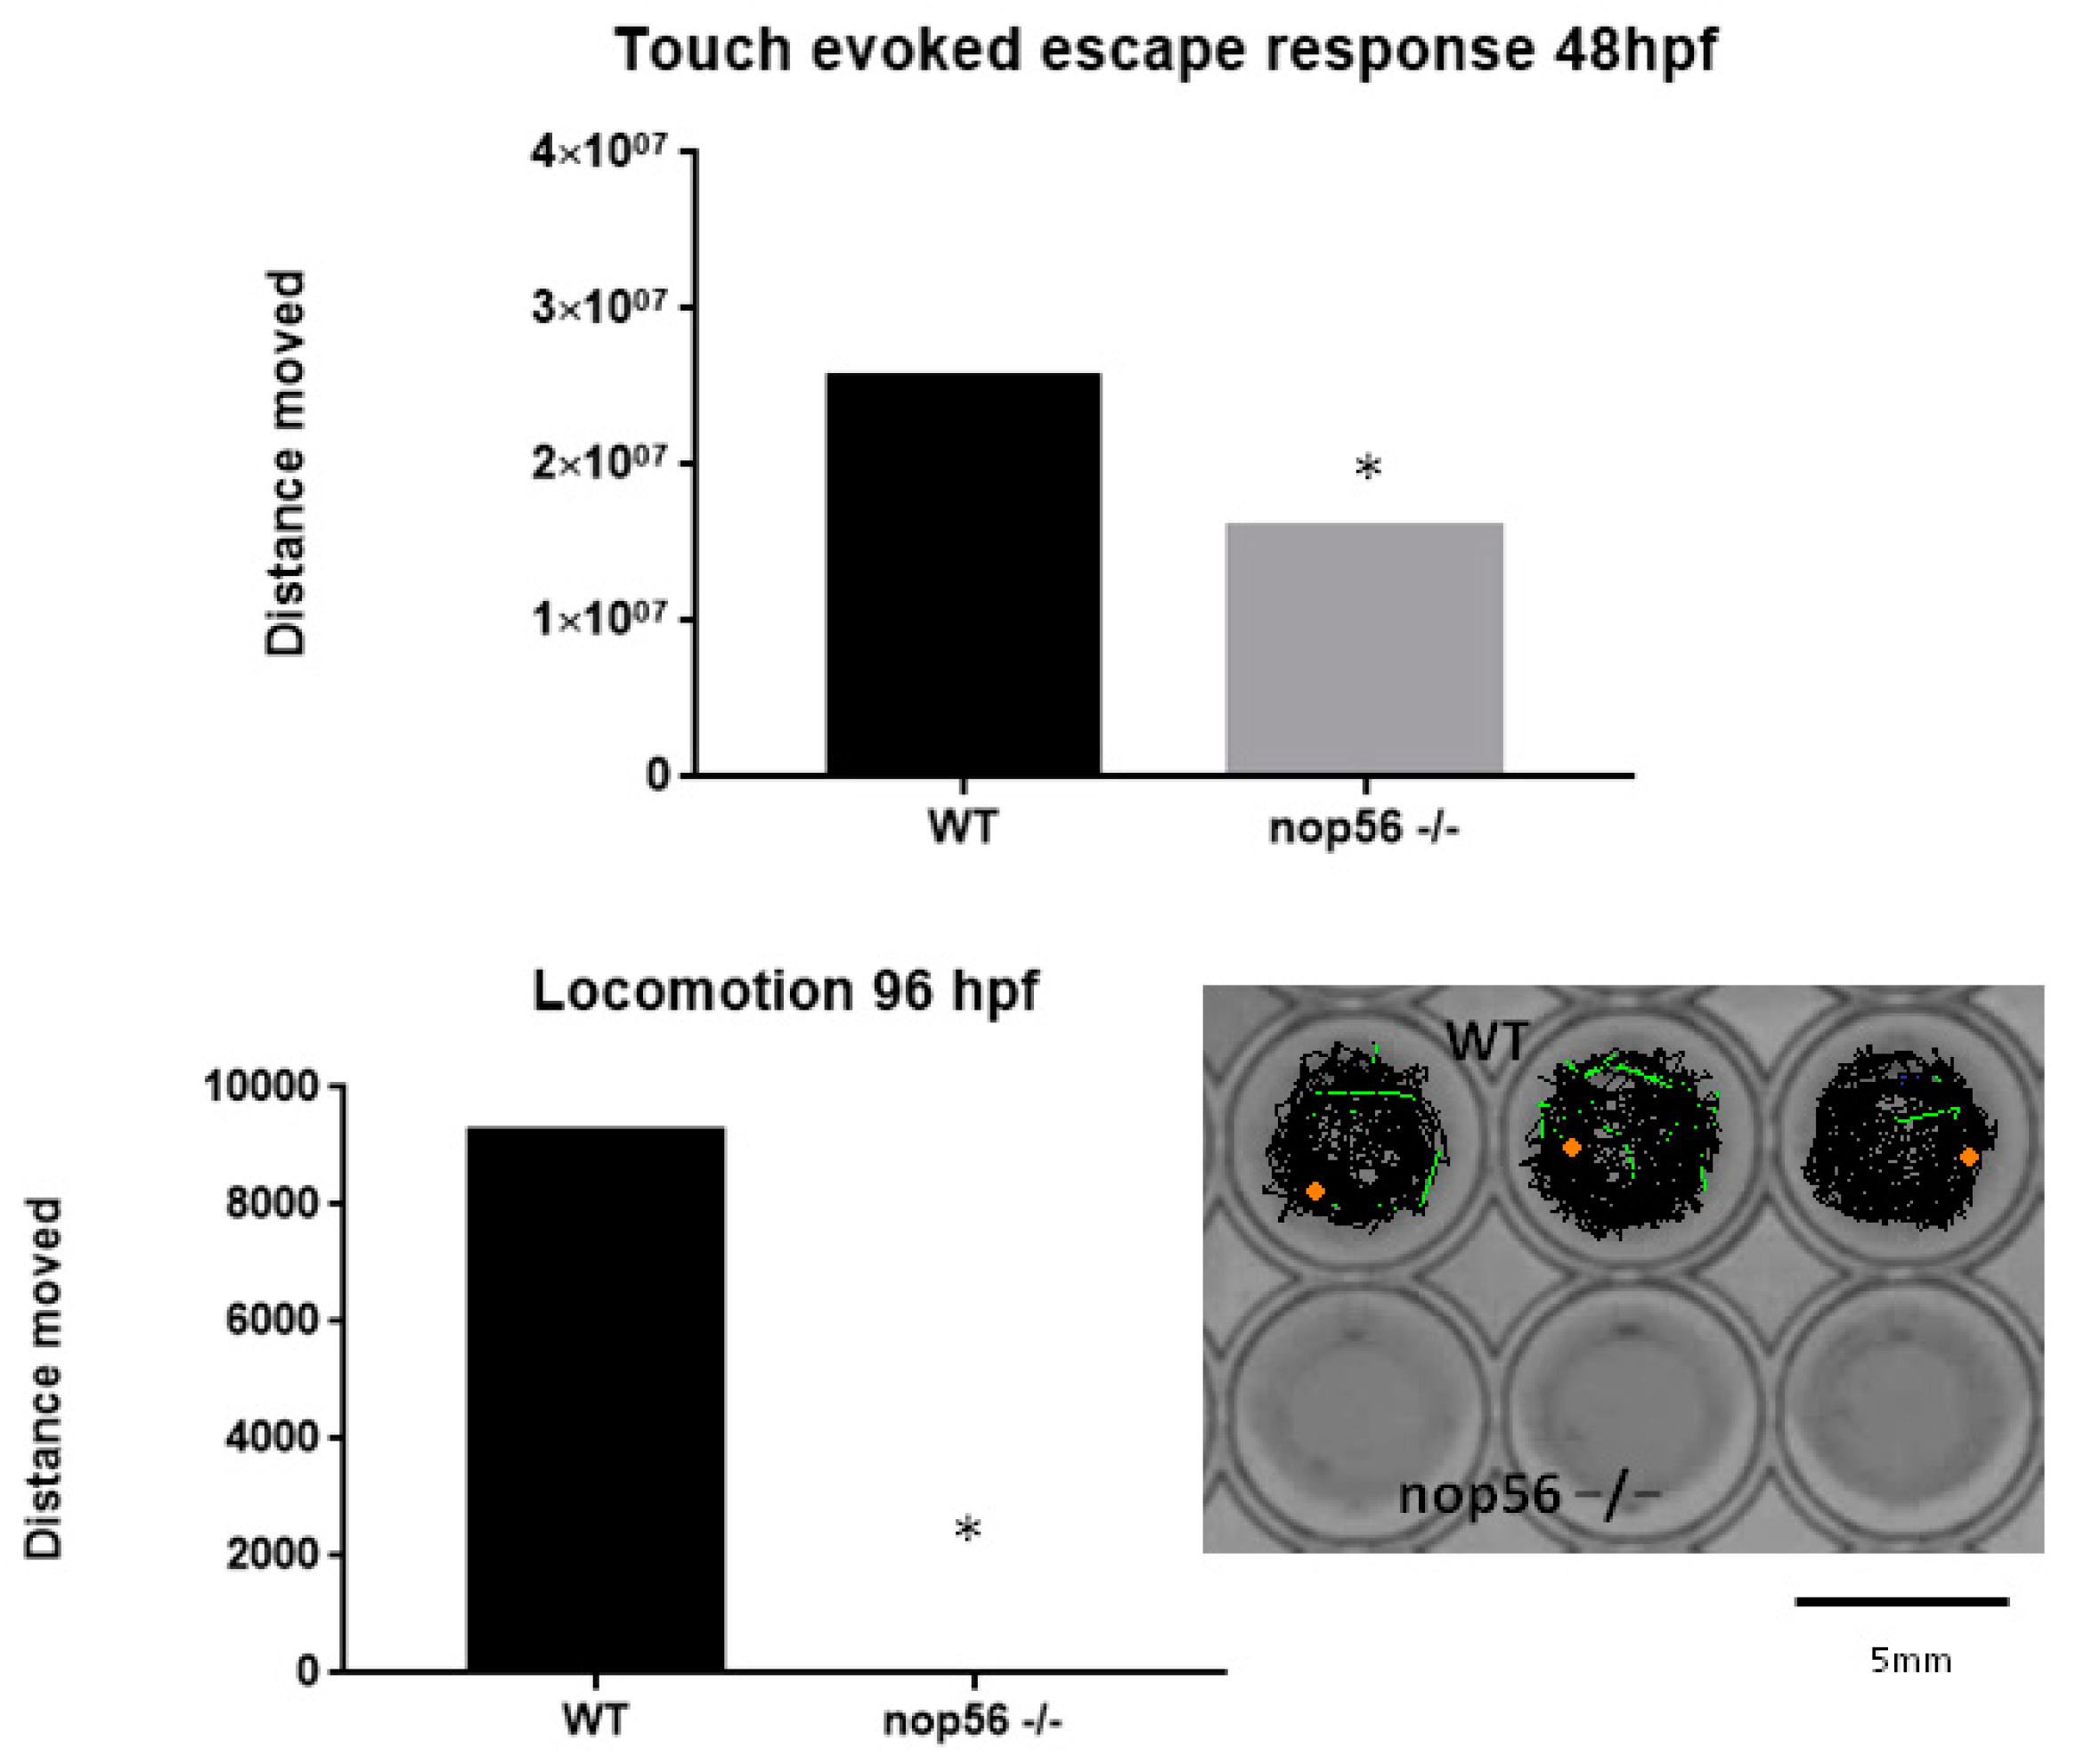
3.5. nop56 Knockout Caused Impaired Motor Function

At 48 hpf, nop56−/− embryos were observed to develop a balance defect characterized with failure to maintain an upright position during swimming with the presence of trembling (Supplementary Materials: Video S3).
Touch-evoked response at 48 hpf was measured and observed to be impaired in nop56−/− embryos. Moreover, when locomotion was measured at 96 hpf, that nop56−/− larvae did not have the ability to swim was observed (Figure 10), which is consistent with our observation of abnormalities in neuromuscular junctions and spinal cord interneurons.

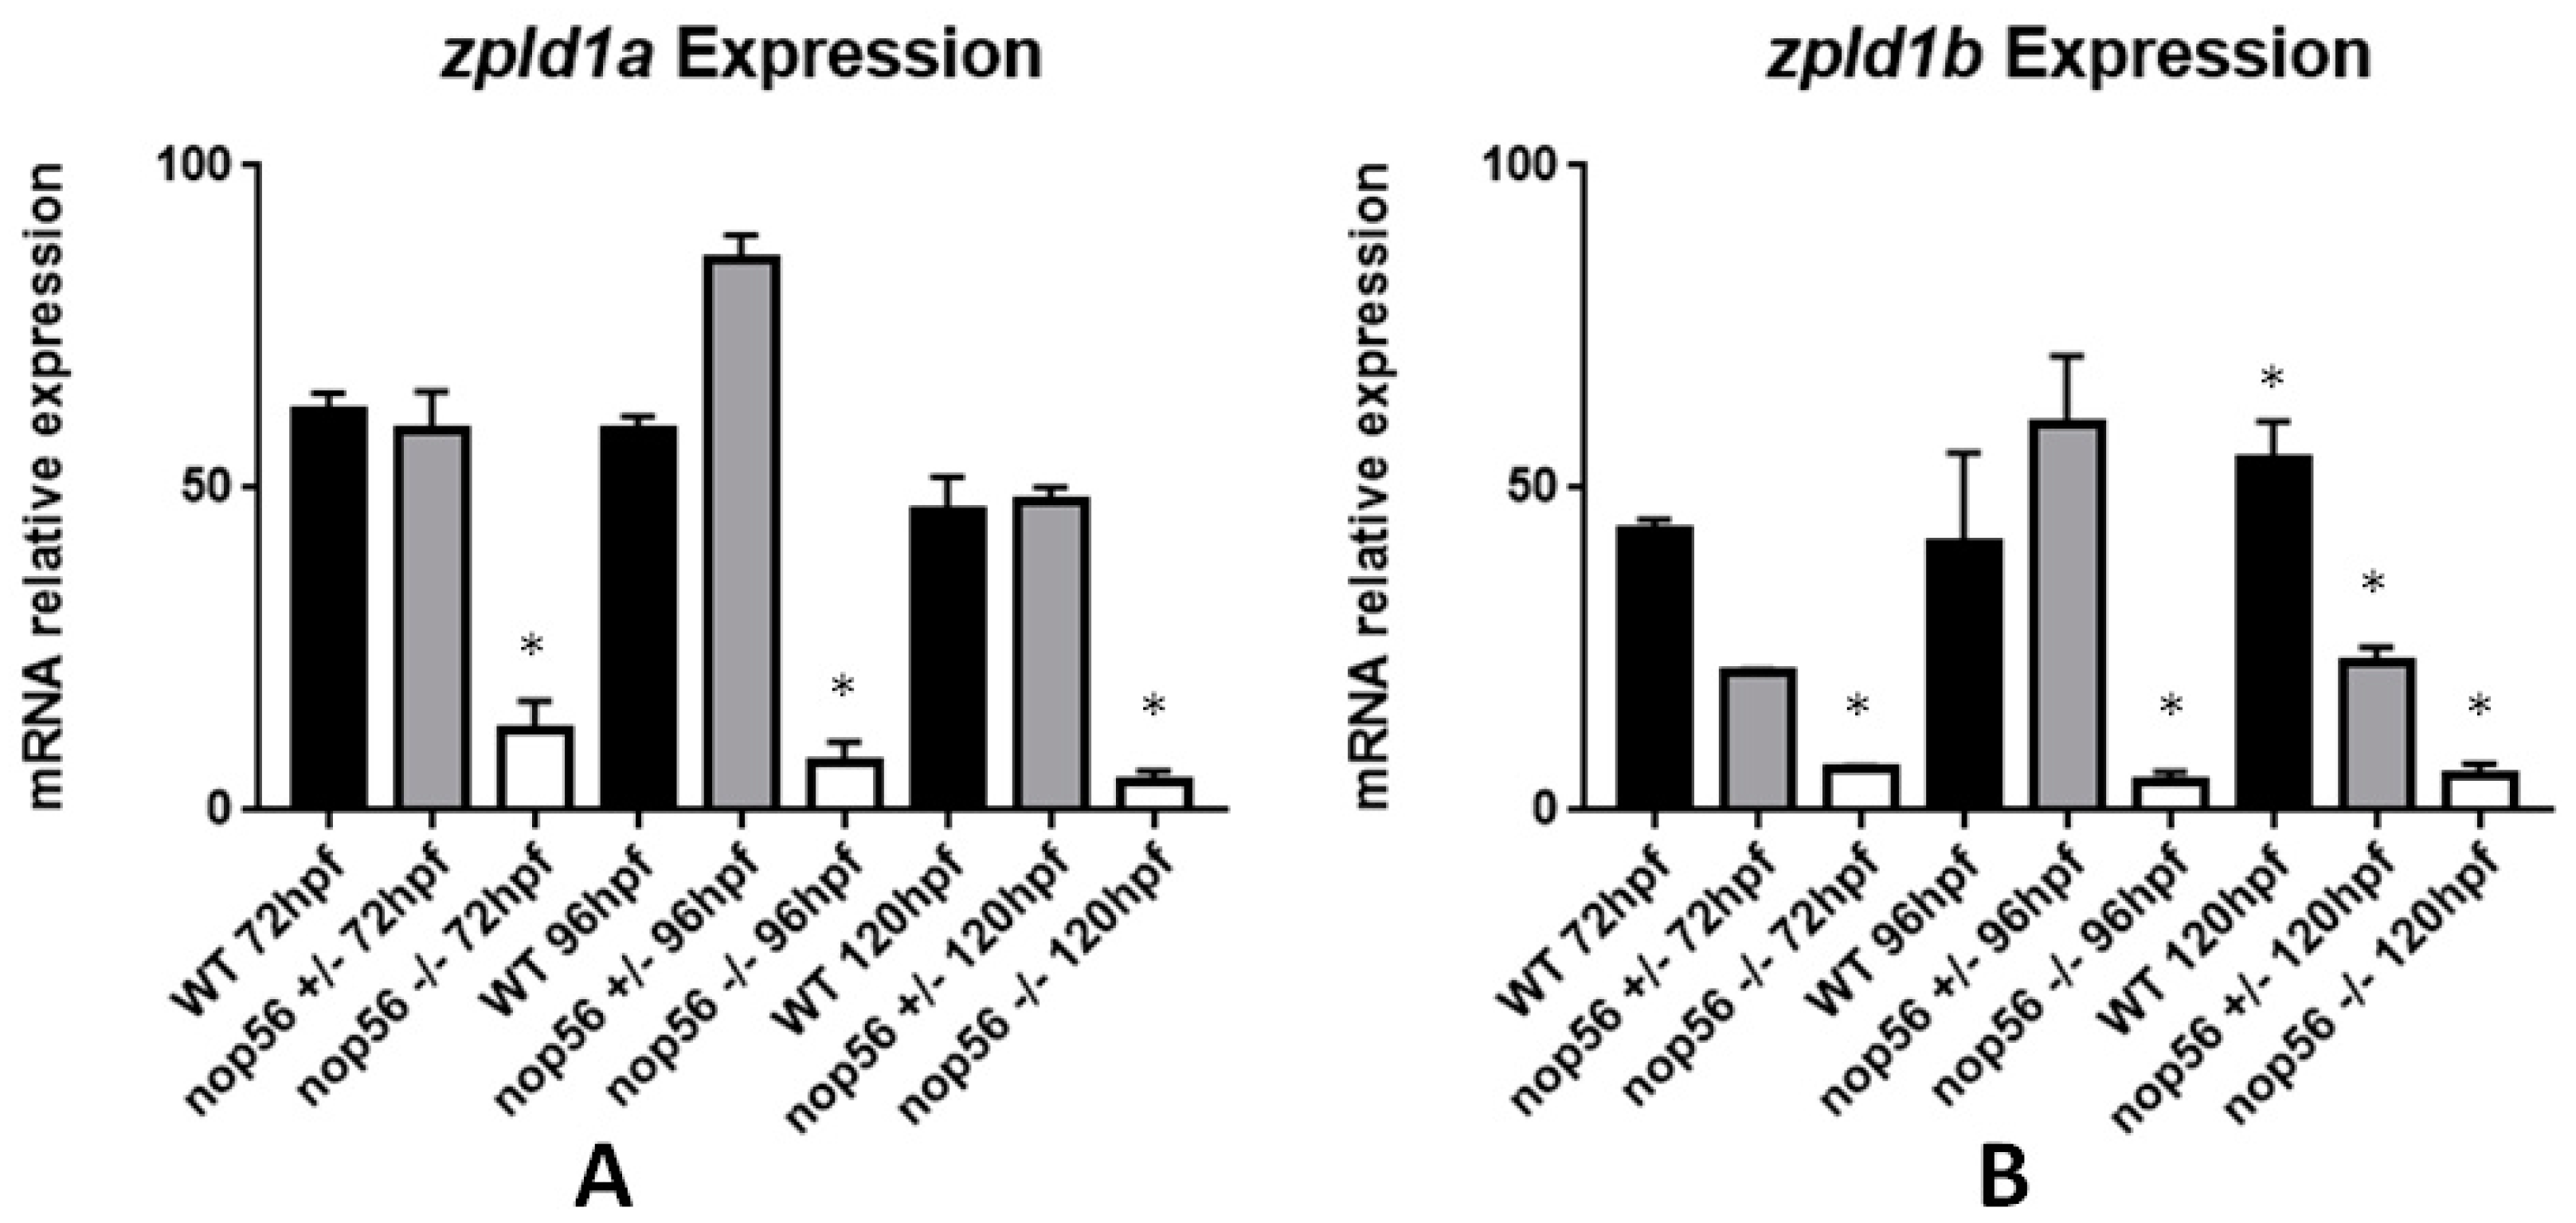
3.6. Reduced Expression of the zpld1 Genes from the Cupula of the Inner Ear

ZPLD1 (zona pellucida-like domain 1) is a gene expressed in the cupula, a gelatinous membrane overlying the crista ampullaris of the semicircular canal in the inner ear, which is important for sensing rotation of the head and critical for normal balance [51]. In zebrafish, there are two paralogous genes: zpld1a and zpld1b. Since SCA36 patients have hearing loss, and nop56−/− zebrafish embryos developed a balance defect, we performed an expression analysis of these genes in our loss-of-function model. The expression of zpld1a and zpld1b in nop56−/− was significantly reduced in homozygous mutants as compared to wild-type and heterozygous larvae (p-value < 0.0001) (Figure 11). zpld1b was also significantly reduced in nop56+/− embryos at 120 hpf, but not as strong as npc1−/− expression.

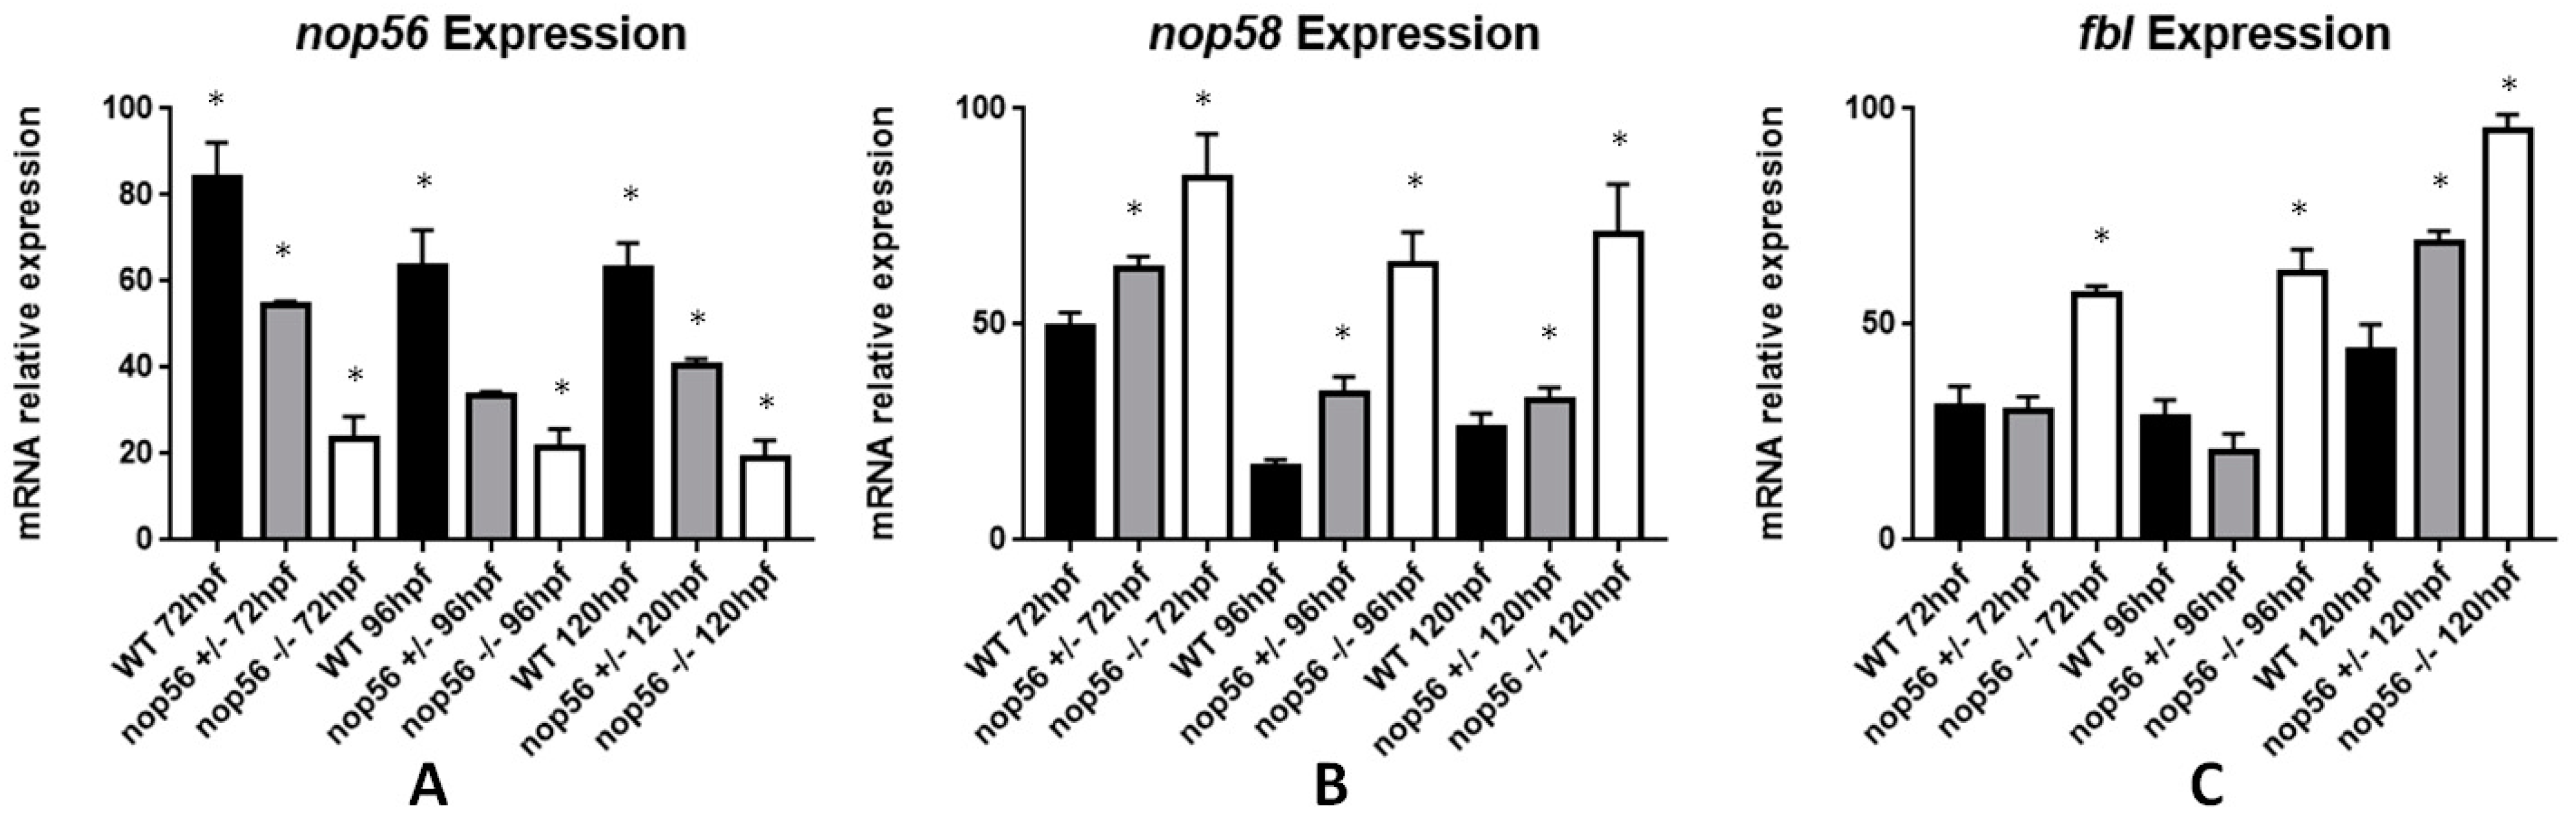
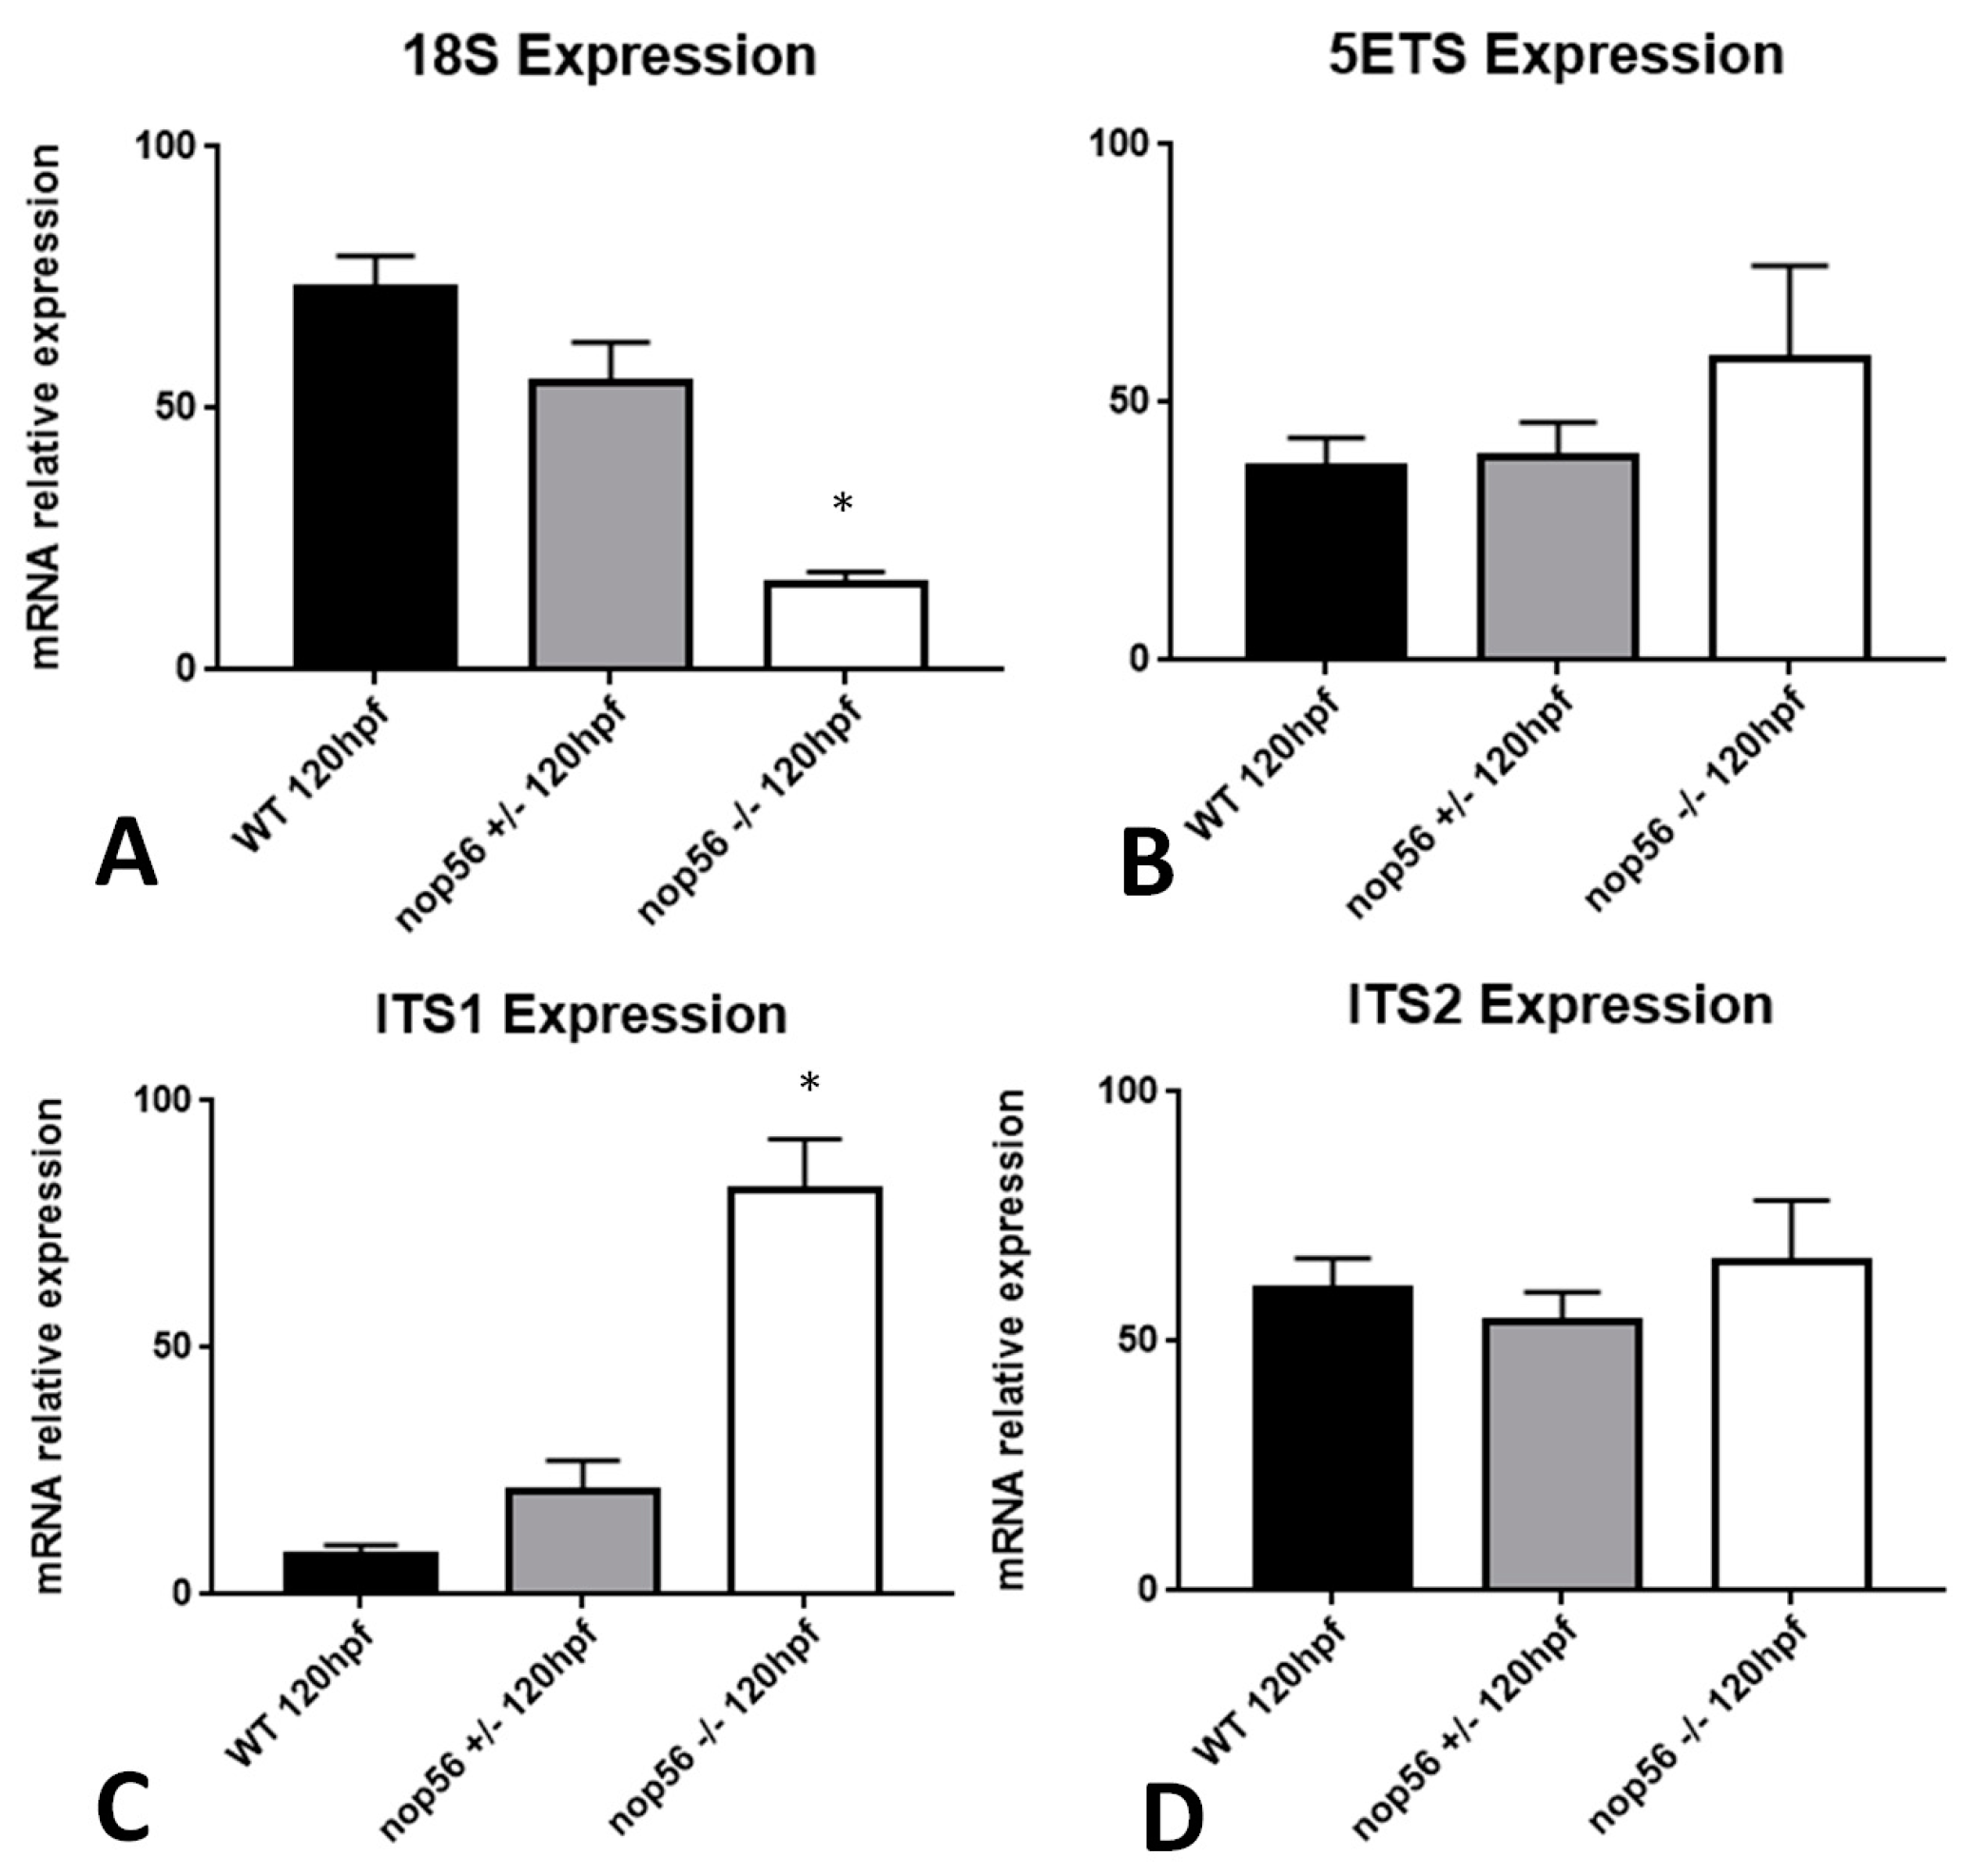
3.7. nop56 Disruption Causes Overexpression in nop58 and fbl Related Genes and Impaired rRNA Processing

NOP56 is a protein required for the assembly of the 60S ribosomal subunit. Together with NOP58 and FBL, they function as core proteins to form the C/D box small nucleolar ribonucleoprotein that modifies and processes ribosomal RNAs (see introduction). For this reason, we examined the mRNA expression of nop56 gene and associated genes nop58 and fbl by RT-qPCR (Figure 12). We observed significant differences in nop56 expression between wild type, nop56+/− and nop56−/− embryos (p-value < 0.0001). nop56−/− embryos have a reduced expression of nop56 and nop56+/− embryos have an intermediate expression between nop56−/− and wild type. Nop58 expression levels were increased in nop56−/− larvae respect to wild type and nop56+/− (p-value < 0.0001). fbl expression levels were also increased at 120 hpf in nop56+/− and nop56−/− embryos respect to wild-type animals (p-value < 0.0001).
In addition, as NOP56 participates in rRNAs processing, we examined by RT-qPCR the rRNA expression at 120 hpf of the 5′ externally transcribed sequence (5ETS) and internally transcribed sequences (ITS1 and ITS2) of the 47S intermediate rRNA, whose transcription is implicated in the first step of ribosome biogenesis. Moreover, we quantified by RT-qPCR the expression at 120 hpf of 18S rRNA, which is generated after processing of the 47S one. We obtained similar results as in a zebrafish knockout model of fbl gene [46]. 18S rRNA levels were significantly lower in nop56−/− in comparison with nop56+/− and wild type (p-value < 0.0001), which means that rRNA processing is impaired. 5′ETS and ITS2 expression did not differ between the three groups, although we detected a surprising overexpression of ITS1 (p-value < 0.0001) (Figure 13). This indicates that 47S rRNA transcription was not affected but subsequent processing was indeed affected.

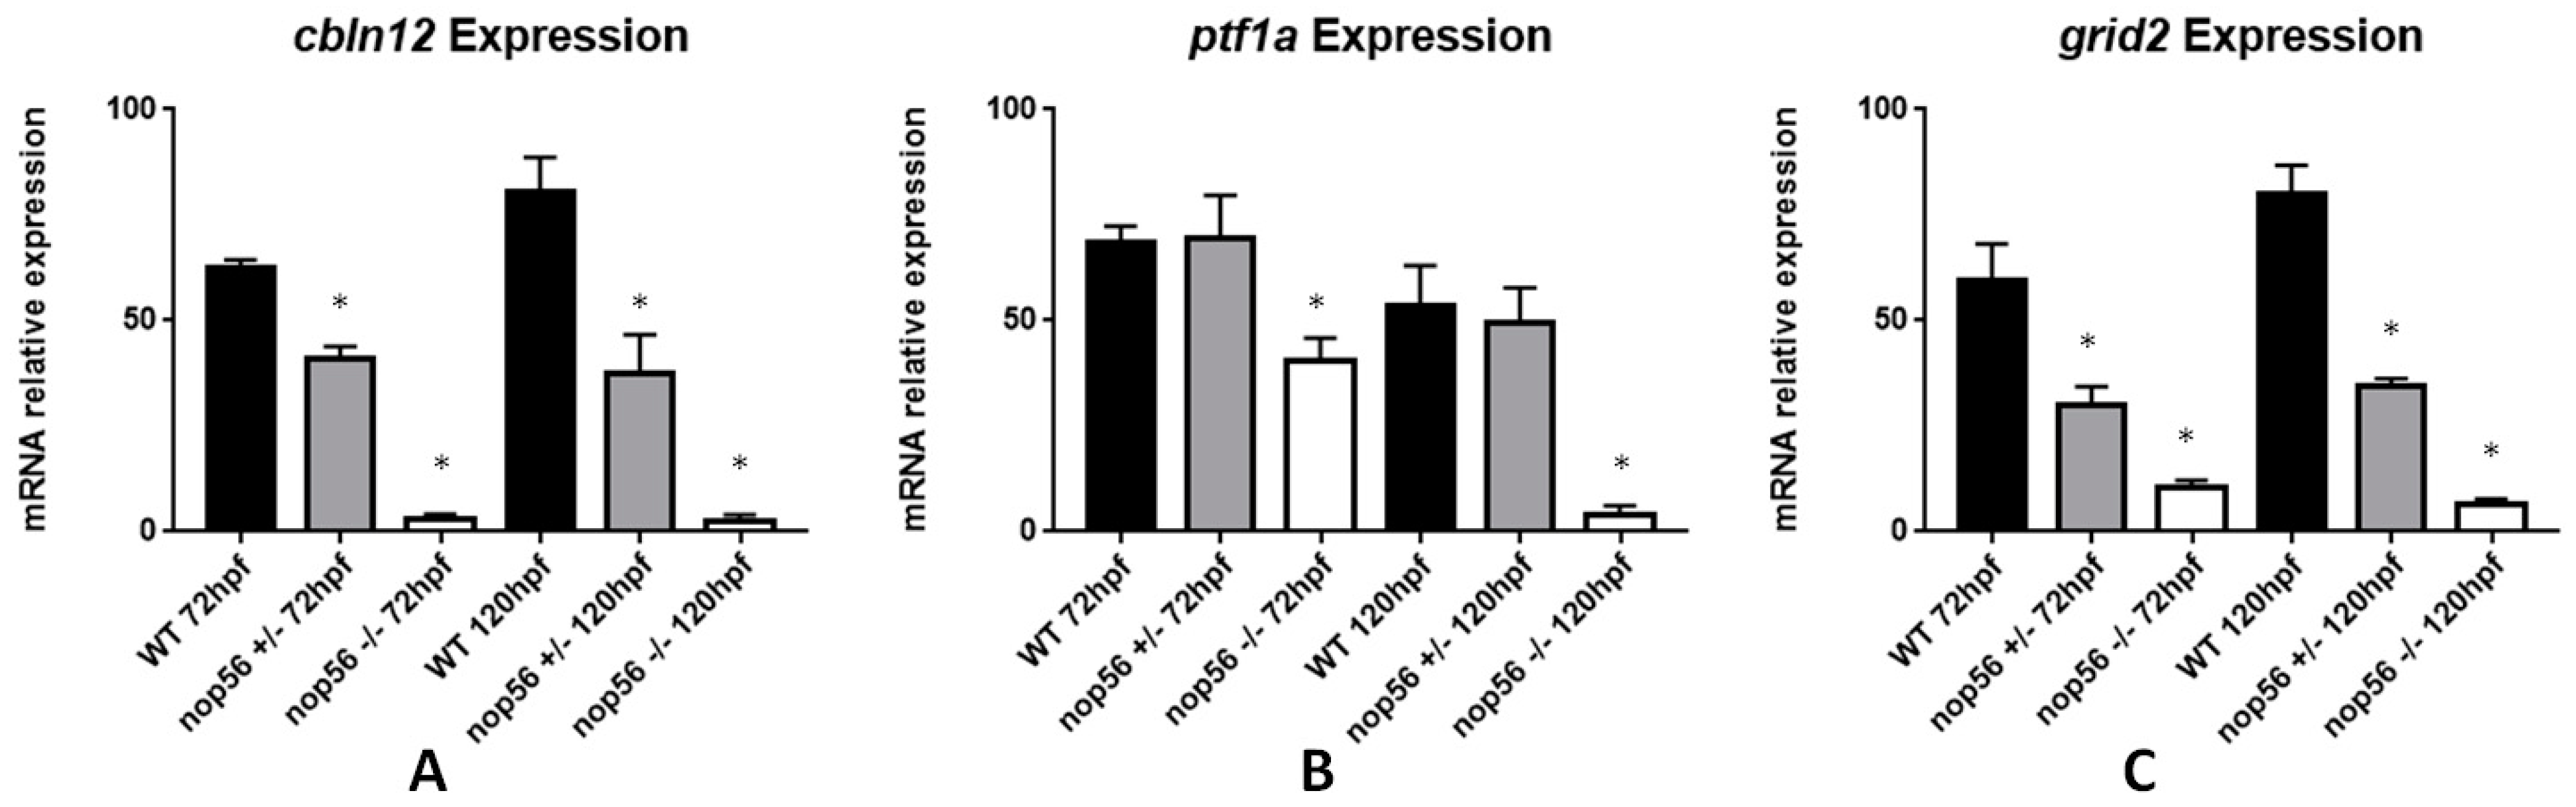
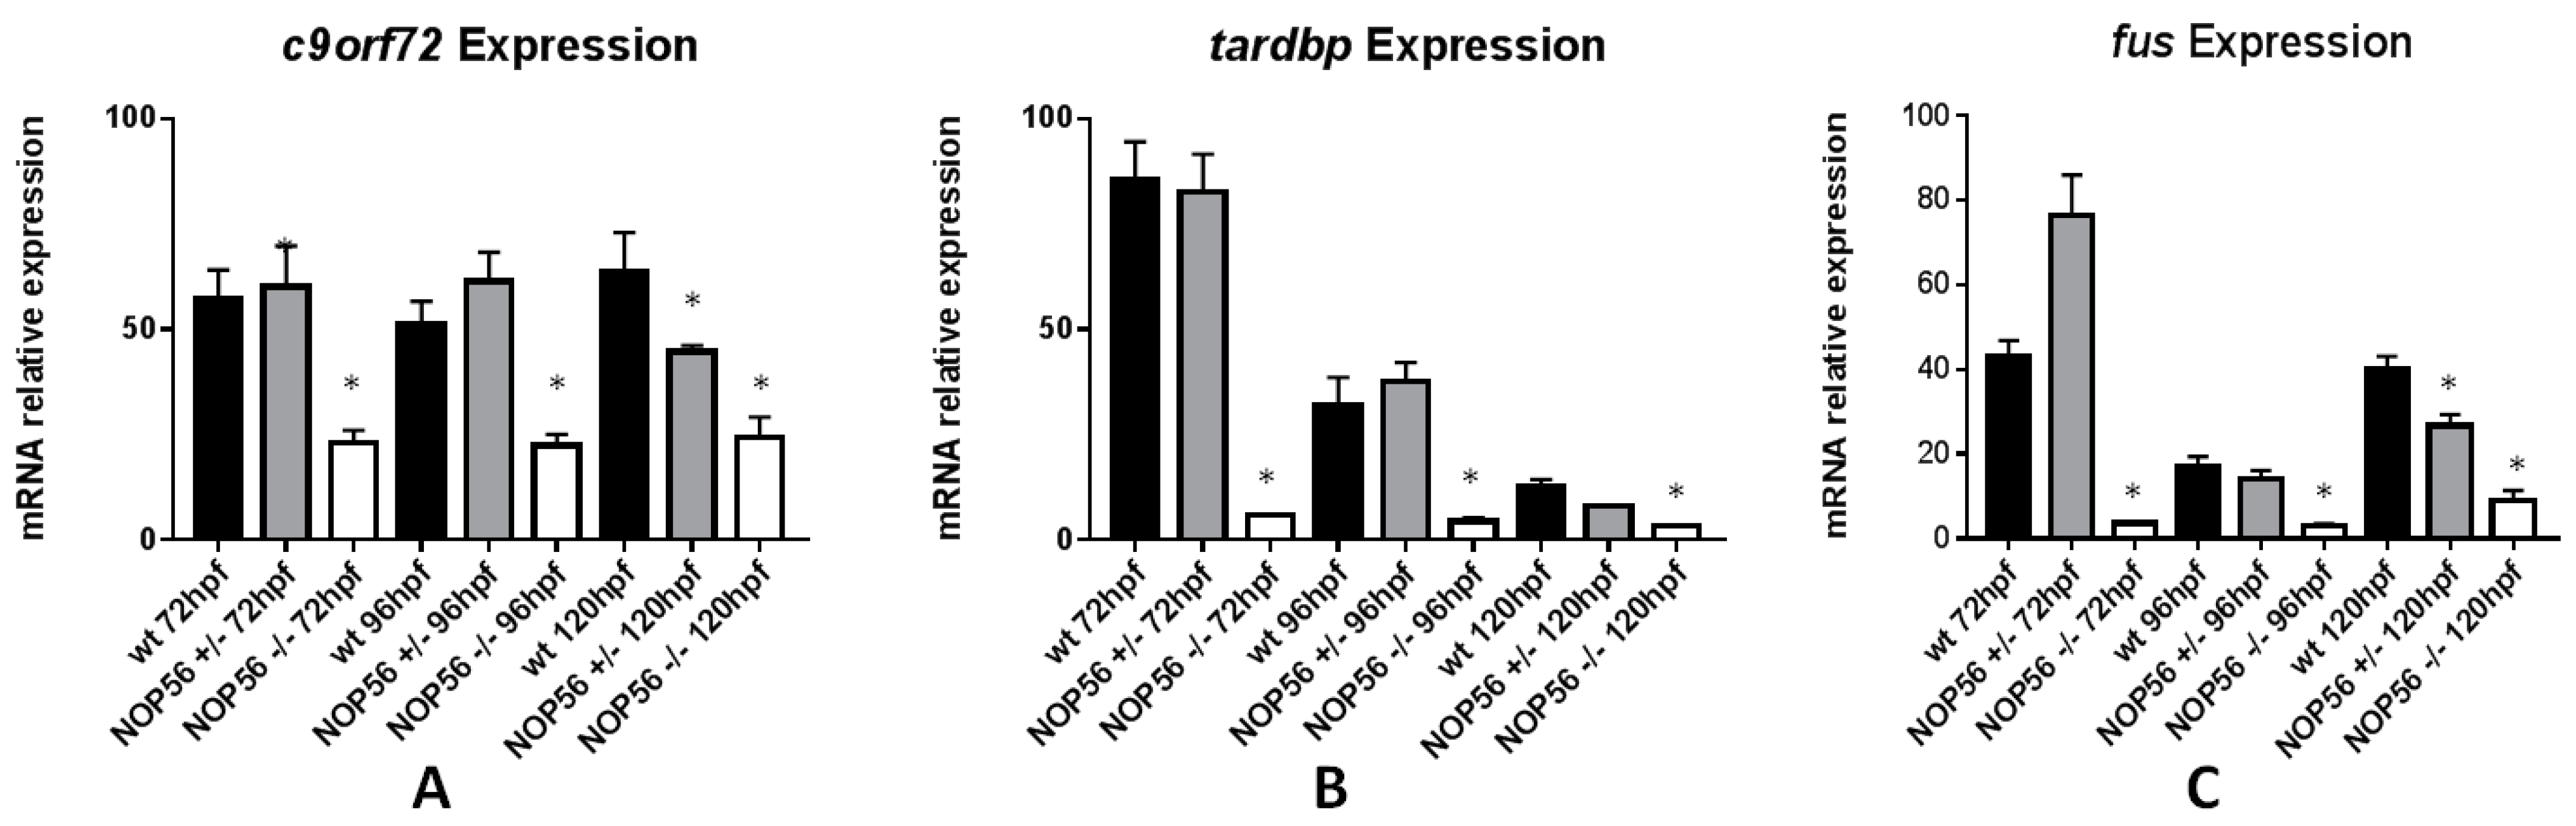
3.8. Expression of Genes Related to ALS Is Also Affected in the nop56 Knockout Embryos

Mutations in autophagy regulator protein C9ORF72 and in DNA/RNA binding proteins TDP-43 and FUS are associated with Amyotrophic Lateral Sclerosis (ALS) disease. A hexanucleotide (GGGGCC) expansion in a noncoding region of C9ORF72 gene is the main cause of ALS and Frontotemportal Dementia (FTD). This expansion generates RNA foci, RNA/DNA G-quadruplexes and dipeptide repeat proteins (DPRs) that cause neurotoxicity [52]. TARDBP encodes the protein TDP-43, which regulates transcription, alternative splicing of mRNA and non-homologous end joining (NHEJ) repair of DNA in motor neurons [53]. FUS (Fused in Sarcoma) is involved in RNA metabolism (transcription, splicing and export to cytoplasm) and DNA repair of double strand breaks through DNA damage response [54]. It has been shown that FUS loss of function causes impairment of proper DNA damage response leading to neurodegeneration and formation of aggregates [55]. Expression assay of c9orf72, tardbp and fus (Figure 14) revealed a significant reduction in the expression of these genes in the nop56−/− embryos (c9orf72 p-value < 0.001, tardbp p-value < 0.001, fus p-value < 0.0001).

4. Discussion

In this work, we characterized a zebrafish loss-of-function model of the nop56 gene. Homozygous mutants nop56+/− showed a severe neurodegenerative phenotype characterized by, among other features, absence of cerebellum, reduced numbers of spinal cord neurons and impaired movement. Apoptosis pathway was increased in the CNS causing death before 7 days post-fertilization (dpf). Nop58 and fbl genes were overexpressed, while rRNA processing seems to be impaired. Other genes with reduced expression in nop56−/− were c9orf72, fus, tardbp (genes related to ALS), zpld1a, zpld1b (genes involved in the development of the cupula of the inner ear, which is responsible for balance) and ptf1a, grid2 and cbln12 (expressed in the zebrafish cerebellum).
Previous studies in cells demonstrated that reduced expression of NOP56 gene leads to decreased pre-rRNA biogenesis and an increase in apoptotic cells [10]. When NOP58 expression is reduced in cells, increased expression of NOP56 and FBL can be observed [10]. Similar to these results, our data also indicate impaired rRNA processing and increased apoptosis (mainly in the CNS), together with mRNA overexpression of nop58 and fbl, which seems to be a compensatory mechanism for reduced nop56 expression. A zebrafish fbl mutant develops a similar phenotype with severe neurodegeneration accompanied by eye abnormalities, massive apoptosis, defects in ribosome biogenesis and activity, and impaired S-phase progression [46].
Strong nop56 mRNA expression was previously localized in the retina, posterior midbrain lamina and the cerebellum of zebrafish embryos [56]. In mice Nop56 protein expression was also found mainly in CNS in Purkinje cells of the cerebellum, motor neurons of the hypoglossal nucleus and spinal cord anterior horn [19]. Increased apoptosis restricted to the CNS was observed, which seems to be in concordance with nop56 expression mainly in the CNS.
Locomotor defects in nop56−/− could be caused by absence of cerebellum, reduced numbers of 5-HT-ir spinal cord neurons and defected body innervation. Previous studies linked cerebellar ataxia with the impairment of the serotonergic cerebellar system, where it was used as a target for some experimental treatments [57,58,59]. More recently, it has been seen in other ataxia animal models that treatments with serotonergic agents improved significantly the locomotion [60]. In addition, we observed reduced mRNA expression of zpld1 genes in nop56−/−, this reduced expression of ZPLD1 genes in other species was related to balance dysfunction. In mouse, two spontaneous mutations in Zpld1 gene resulted in vestibular dysfunction but not auditory dysfunction [61]. In humans, a mutation in ZPLD1 was found in a patient with balanced translocation and cerebral cavernous malformations [62].
Our results show altered mRNA levels of tdp-43 and fus (which are related to ALS) in nop56−/−. The relationship between TDP-43, FUS and NOP56 was previously signaled by Miyazaki and colleagues [63] in an ALS mouse model, which shows a progressive reduction in the mRNA levels of Nop56, Tdp-43 and Fus in large motor neurons. TDP-43 and FUS participate, as NOP56, in RNA processing pathway. We also analyzed mRNA expression of another gene related to ALS, c9orf72. This gene not only is an autophagy regulator, but also participates in the regulation of actin dynamics and axon extension in motor neurons [64]. We found a reduced mRNA expression of c9orf72 in nop56a12582 mutants, which correlated with reduced numbers of spinal cord neurons.
Nop56sa12582 homozygous mutant had a severe cerebellar defect; in fact, they did not develop a cerebellum and had a premature death. In humans, the only known illness that affected NOP56 gene is SCA36. There are no homozygous patients for SCA36. However, the heterozygous intronic repeated expansion of GGCCTG in NOP56 causes SCA36, which presented less severe phenotype than our nop56−/− zebrafish with reduced locomotion, sensory hearing loss and discrete motor neuron impairment. Heterozygous nop56 fishes had reduced nop56 mRNA expression in comparison with wild types, but not as dramatically as homozygous nop56−/− fish. Nop58 and fbl mRNA were also overexpressed in nop56+/− compared with wild type, while c9orf72, fus, cbln12, grid2 and zpld1b had reduced mRNA expression starting mainly at 5 dpf. All these statistically significant differences of expression compared to the wild type are not as strong as those of the nop56−/−
Our studies in the brain of nop56+/−adult fishes of 6 months did not show any macroscopic differences and also we did not observe any alteration in nop56+/− Purkinje cells at 4 dpf. This does not mean that there are no neuronal differences between nop56+/−and adult wild type, especially seeing that genes related to Purkinje cells (grid2), granular cells (cbln12), to balance (zpld1b) and genes that have been related to ALS (c9orf72 and fus) had reduced expression compared to wild type. Future research is necessary to see if there really are differences at the CNS level between adult nop56+/− and adult wild type. Although SCA36 illness is thought to be a gain-of-function disease as ALS, recent studies in ALS signaled a causative combination of factors in which haploinsufficiency had an important role [22,24,25,52,65]. For these reasons, future studies on nop56+/− older adult fishes are necessary.
Mice injected with a construct containing the SCA36 expansion showed not only RNA foci and DPR inclusions in the brain, but also locomotor defects and loss of Purkinje cells [30]. The generation of overexpression of SCA36 expansion in the zebrafish model facilitates the search for candidate therapies through drug or genetic screens to ameliorate the SCA36 symptoms.

5. Conclusions

We provided the first vertebrate NOP56 loss of function model in which we reported a severe neurodegenerative phenotype mainly characterized by early death, increase of apoptosis, absence of cerebellum, reduced numbers of spinal cord neurons and impaired movement.

Supplementary Materials

The following supporting information can be downloaded at: https://www.mdpi.com/article/10.3390/biomedicines10081814/s1. Video S1: Alpha-tubulin projections of axons of primary motor neurons in wild-type embryo. Video S2: Alpha-tubulin projections of axons of primary motor neurons in nop56−/− embryo are thicker and less branched than in wild types. Video S3: nop56−/− embryo motor dysfunction.

Author Contributions

Conceptualization, A.Q.-R.; methodology, A.Q.-R., M.F., J.Y., D.S.-C. and A.A.-G.; formal analysis, A.Q.-R. and A.B.-I.; investigation, A.Q.-R., M.F., J.Y., D.S.-C., A.A.-G. and A.B.-I.; resources, L.S. and M.-J.S.; writing—original draft, A.Q.-R.; writing—review and editing, M.F., J.Y., D.S.-C., A.A.-G. and A.B.-I.; supervision, L.S. and M.-J.S.; project administration, L.S. and M.-J.S.; funding acquisition, M.-J.S. All authors have read and agreed to the published version of the manuscript.

Funding

This research was funded by Fondo de Investigaciones Sanitarias-Instituto de Salud Carlos III (Spain), grant number: PI17/01582. Grant PID2020-115121GB-I00 funded by MCIN/AEI/10.13039/501100011033 to Laura Sánchez and Antón Barreiro-Iglesias. Anabel Alba-González is recipient of a Predoctoral Felloeship from Xunta de Galicia (Grant number ED481A-2019/003).

Institutional Review Board Statement

The animal study protocol was approved by Ethics Committee of University of Santiago de (codes of ethical approval committee: AE-LU-003, ES270280346401) for studies involving animals.

Informed Consent Statement

Not applicable.

Data Availability Statement

The data that support the findings of this study are available from the corresponding author upon reasonable request.

Conflicts of Interest

The authors declare no conflict of interest.

References

  1. Falaleeva, M.; Welden, J.R.; Duncan, M.J.; Stamm, S. C/D-Box SnoRNAs Form Methylating and Non-Methylating Ribonucleoprotein Complexes: Old Dogs Show New Tricks. BioEssays 2017, 39, 1600264. [Google Scholar] [CrossRef] [Green Version]
  2. Lechertier, T.; Grob, A.; Hernandez-Verdun, D.; Roussel, P. Fibrillarin and Nop56 Interact before Being Co-Assembled in Box C/D SnoRNPs. Exp. Cell Res. 2009, 315, 928–942. [Google Scholar] [CrossRef] [PubMed]
  3. Oruganti, S.; Zhang, Y.; Li, H.; Robinson, H.; Terns, M.P.; Terns, R.M.; Yang, W.; Li, H. Alternative Conformations of the Archaeal Nop56/58-Fibrillarin Complex Imply Flexibility in Box C/D RNPs. J. Mol. Biol. 2007, 371, 1141–1150. [Google Scholar] [CrossRef] [PubMed]
  4. Nepomuceno-Mejía, T.; Florencio-Martínez, L.E.; Martínez-Calvillo, S. Nucleolar Division in the Promastigote Stage of Leishmania Major Parasite: A Nop56 Point of View. BioMed Res. Int. 2018, 2018, 1641839. [Google Scholar] [CrossRef] [PubMed]
  5. Gagnon, K.T.; Biswas, S.; Zhang, X.; Brown, B.A.; Wollenzien, P.; Mattos, C.; Maxwell, E.S. Structurally Conserved Nop56/58 N-Terminal Domain Facilitates Archaeal Box C/D Ribonucleoprotein-Guided Methyltransferase Activity. J. Biol. Chem. 2012, 287, 19418–19428. [Google Scholar] [CrossRef] [Green Version]
  6. Garcıa-Planells, J.; Paricio, N.; Palau, F.; de Frutos, R. Dnop56, a Drosophila Gene Homologous to the Yeast Nucleolar NOP56 Gene. Genetica 2000, 109, 275–282. [Google Scholar] [CrossRef]
  7. Gautier, T.; Bergès, T.; Tollervey, D.; Hurt, E. Nucleolar KKE/D Repeat Proteins Nop56p and Nop58p Interact with Nop1p and Are Required for Ribosome Biogenesis. Mol. Cell. Biol. 1997, 17, 7088–7098. [Google Scholar] [CrossRef] [PubMed] [Green Version]
  8. Renzi, F.; Filippini, D.; Loreni, F.; Bozzoni, I.; Caffarelli, E. Characterization of the Sequences Encoding for Xenopus Laevis Box C/D SnoRNP Nop56 Protein. Biochim. Et Biophys. Acta (BBA)—Gene Struct. Expr. 2002, 1575, 26–30. [Google Scholar] [CrossRef]
  9. Watkins, N.J.; Bohnsack, M.T. The Box C/D and H/ACA SnoRNPs: Key Players in the Modification, Processing and the Dynamic Folding of Ribosomal RNA: Box C/D and H/ACA SnoRNPs. WIREs RNA 2012, 3, 397–414. [Google Scholar] [CrossRef]
  10. Lykke-Andersen, S.; Ardal, B.K.; Hollensen, A.K.; Damgaard, C.K.; Jensen, T.H. Box C/D SnoRNP Autoregulation by a Cis-Acting SnoRNA in the NOP56 Pre-MRNA. Mol. Cell 2018, 72, 99–111.e5. [Google Scholar] [CrossRef] [Green Version]
  11. Gong, J.; Li, Y.; Liu, C.; Xiang, Y.; Li, C.; Ye, Y.; Zhang, Z.; Hawke, D.H.; Park, P.K.; Diao, L.; et al. A Pan-Cancer Analysis of the Expression and Clinical Relevance of Small Nucleolar RNAs in Human Cancer. Cell Rep. 2017, 21, 1968–1981. [Google Scholar] [CrossRef] [PubMed] [Green Version]
  12. Mannoor, K.; Liao, J.; Jiang, F. Small Nucleolar RNAs in Cancer. Biochim. Et Biophys. Acta (BBA)—Rev. Cancer 2012, 1826, 121–128. [Google Scholar] [CrossRef] [Green Version]
  13. Williams, G.T.; Farzaneh, F. Are SnoRNAs and SnoRNA Host Genes New Players in Cancer? Nat. Rev. Cancer 2012, 12, 84–88. [Google Scholar] [CrossRef]
  14. Cowling, V.H.; Turner, S.A.; Cole, M.D. Burkitt’s Lymphoma-Associated c-Myc Mutations Converge on a Dramatically Altered Target Gene Response and Implicate Nol5a/Nop56 in Oncogenesis. Oncogene 2014, 33, 3519–3527. [Google Scholar] [CrossRef] [Green Version]
  15. He, J.; Yu, J. Long Noncoding RNA FAM83A-AS1 Facilitates Hepatocellular Carcinoma Progression by Binding with NOP58 to Enhance the MRNA Stability of FAM83A. Biosci. Rep. 2019, 39, BSR20192550. [Google Scholar] [CrossRef]
  16. Marcel, V.; Catez, F.; Diaz, J.-J. P53, a Translational Regulator: Contribution to Its Tumour-Suppressor Activity. Oncogene 2015, 34, 5513–5523. [Google Scholar] [CrossRef] [PubMed]
  17. Su, H.; Xu, T.; Ganapathy, S.; Shadfan, M.; Long, M.; Huang, T.H.-M.; Thompson, I.; Yuan, Z.-M. Elevated SnoRNA Biogenesis Is Essential in Breast Cancer. Oncogene 2014, 33, 1348–1358. [Google Scholar] [CrossRef]
  18. García-Murias, M.; Quintáns, B.; Arias, M.; Seixas, A.I.; Cacheiro, P.; Tarrío, R.; Pardo, J.; Millán, M.J.; Arias-Rivas, S.; Blanco-Arias, P.; et al. ‘Costa Da Morte’ Ataxia Is Spinocerebellar Ataxia 36: Clinical and Genetic Characterization. Brain 2012, 135, 1423–1435. [Google Scholar] [CrossRef] [PubMed] [Green Version]
  19. Kobayashi, H.; Abe, K.; Matsuura, T.; Ikeda, Y.; Hitomi, T.; Akechi, Y.; Habu, T.; Liu, W.; Okuda, H.; Koizumi, A. Expansion of Intronic GGCCTG Hexanucleotide Repeat in NOP56 Causes SCA36, a Type of Spinocerebellar Ataxia Accompanied by Motor Neuron Involvement. Am. J. Hum. Genet. 2011, 89, 121–130. [Google Scholar] [CrossRef] [Green Version]
  20. Arias, M.; García-Murias, M.; Sobrido, M.J. La ataxia espinocerebelosa 36 (SCA36): «Ataxia da Costa da Morte». Neurología 2017, 32, 386–393. [Google Scholar] [CrossRef]
  21. Ikeda, Y.; Ohta, Y.; Kobayashi, H.; Okamoto, M.; Takamatsu, K.; Ota, T.; Manabe, Y.; Okamoto, K.; Koizumi, A.; Abe, K. Clinical Features of SCA36 A Novel Spinocerebellar Ataxia with Motor Neuron Involvement (Asidan). Neurology 2012, 79, 333–341. [Google Scholar] [CrossRef] [PubMed]
  22. DeJesus-Hernandez, M.; Mackenzie, I.R.; Boeve, B.F.; Boxer, A.L.; Baker, M.; Rutherford, N.J.; Nicholson, A.M.; Finch, N.A.; Flynn, H.; Kouri, N.; et al. Expanded GGGGCC Hexanucleotide Repeat in Noncoding Region of C9ORF72 Causes Chromosome 9p-Linked FTD and ALS. Neuron 2011, 72, 245–256. [Google Scholar] [CrossRef] [Green Version]
  23. Renton, A.E.; Majounie, E.; Waite, A.; Simón-Sánchez, J.; Rollinson, S.; Gibbs, J.R.; Schymick, J.C.; Laaksovirta, H.; van Swieten, J.C.; Myllykangas, L.; et al. A Hexanucleotide Repeat Expansion in C9ORF72 Is the Cause of Chromosome 9p21-Linked ALS-FTD. Neuron 2011, 72, 257–268. [Google Scholar] [CrossRef] [PubMed] [Green Version]
  24. Belzil, V.V.; Bauer, P.O.; Prudencio, M.; Gendron, T.F.; Stetler, C.T.; Yan, I.K.; Pregent, L.; Daughrity, L.; Baker, M.C.; Rademakers, R.; et al. Reduced C9orf72 Gene Expression in C9FTD/ALS Is Caused by Histone Trimethylation, an Epigenetic Event Detectable in Blood. Acta Neuropathol. 2013, 126, 895–905. [Google Scholar] [CrossRef] [PubMed] [Green Version]
  25. Butti, Z.; Pan, Y.E.; Giacomotto, J.; Patten, S.A. Reduced C9orf72 Function Leads to Defective Synaptic Vesicle Release and Neuromuscular Dysfunction in Zebrafish. Commun. Biol. 2021, 4, 792. [Google Scholar] [CrossRef]
  26. Furuta, N.; Tsukagoshi, S.; Hirayanagi, K.; Ikeda, Y. Suppression of the Yeast Elongation Factor Spt4 Ortholog Reduces Expanded SCA36 GGCCUG Repeat Aggregation and Cytotoxicity. Brain Res. 2019, 1711, 29–40. [Google Scholar] [CrossRef]
  27. Matsuzono, K.; Imamura, K.; Murakami, N.; Tsukita, K.; Yamamoto, T.; Izumi, Y.; Kaji, R.; Ohta, Y.; Yamashita, T.; Abe, K.; et al. Antisense Oligonucleotides Reduce RNA Foci in Spinocerebellar Ataxia 36 Patient IPSCs. Mol. Ther. Nucleic Acids 2017, 8, 211–219. [Google Scholar] [CrossRef] [Green Version]
  28. McEachin, Z.T.; Gendron, T.F.; Raj, N.; García-Murias, M.; Banerjee, A.; Purcell, R.H.; Ward, P.J.; Todd, T.W.; Merritt-Garza, M.E.; Jansen-West, K.; et al. Chimeric Peptide Species Contribute to Divergent Dipeptide Repeat Pathology in C9ALS/FTD and SCA36. Neuron 2020, 107, 292–305.e6. [Google Scholar] [CrossRef]
  29. Wang, H.; Chen, X.; He, T.; Zhou, Y.; Luo, H. Evidence for Tissue-Specific JAK/STAT Target Genes in Drosophila Optic Lobe Development. Genetics 2013, 195, 1291–1306. [Google Scholar] [CrossRef] [Green Version]
  30. Todd, T.W.; McEachin, Z.T.; Chew, J.; Burch, A.R.; Jansen-West, K.; Tong, J.; Yue, M.; Song, Y.; Castanedes-Casey, M.; Kurti, A.; et al. Hexanucleotide Repeat Expansions in C9FTD/ALS and SCA36 Confer Selective Patterns of Neurodegeneration In Vivo. Cell Rep. 2020, 31, 107616. [Google Scholar] [CrossRef]
  31. Kozol, R.A.; Abrams, A.J.; James, D.M.; Buglo, E.; Yan, Q.; Dallman, J.E. Function Over Form: Modeling Groups of Inherited Neurological Conditions in Zebrafish. Front. Mol. Neurosci. 2016, 9, 55. [Google Scholar] [CrossRef] [PubMed]
  32. Imamura, S.; Kishi, S. Molecular Cloning and Functional Characterization of Zebrafish ATM. Int. J. Biochem. Cell Biol. 2005, 37, 1105–1116. [Google Scholar] [CrossRef] [PubMed]
  33. Issa, F.A.; Mazzochi, C.; Mock, A.F.; Papazian, D.M. Spinocerebellar Ataxia Type 13 Mutant Potassium Channel Alters Neuronal Excitability and Causes Locomotor Deficits in Zebrafish. J. Neurosci. 2011, 31, 6831–6841. [Google Scholar] [CrossRef] [PubMed] [Green Version]
  34. Liu, H.; Li, X.; Ning, G.; Zhu, S.; Ma, X.; Liu, X.; Liu, C.; Huang, M.; Schmitt, I.; Wüllner, U.; et al. The Machado–Joseph Disease Deubiquitinase Ataxin-3 Regulates the Stability and Apoptotic Function of P53. PLoS Biol. 2016, 14, e2000733. [Google Scholar] [CrossRef] [Green Version]
  35. Quelle-Regaldie, A.; Sobrido-Cameán, D.; Barreiro-Iglesias, A.; Sobrido, M.J.; Sánchez, L. Zebrafish Models of Autosomal Dominant Ataxias. Cells 2021, 10, 421. [Google Scholar] [CrossRef] [PubMed]
  36. Quelle-Regaldie, A.; Sobrido-Cameán, D.; Barreiro-Iglesias, A.; Sobrido, M.J.; Sánchez, L. Zebrafish Models of Autosomal Recessive Ataxias. Cells 2021, 10, 836. [Google Scholar] [CrossRef]
  37. Yanicostas, C.; Barbieri, E.; Hibi, M.; Brice, A.; Stevanin, G.; Soussi-Yanicostas, N. Requirement for Zebrafish Ataxin-7 in Differentiation of Photoreceptors and Cerebellar Neurons. PLoS ONE 2012, 7, e50705. [Google Scholar] [CrossRef]
  38. Ciura, S.; Lattante, S.; Le Ber, I.; Latouche, M.; Tostivint, H.; Brice, A.; Kabashi, E. Loss of Function of C9orf72 Causes Motor Deficits in a Zebrafish Model of Amyotrophic Lateral Sclerosis. Ann. Neurol. 2013, 74, 180–187. [Google Scholar] [CrossRef]
  39. Swaminathan, A.; Bouffard, M.; Liao, M.; Ryan, S.; Callister, J.B.; Pickering-Brown, S.M.; Armstrong, G.A.B.; Drapeau, P. Expression of C9orf72-Related Dipeptides Impairs Motor Function in a Vertebrate Model. Hum. Mol. Genet. 2018, 27, 1754–1762. [Google Scholar] [CrossRef] [Green Version]
  40. Swinnen, B.; Bento-Abreu, A.; Gendron, T.F.; Boeynaems, S.; Bogaert, E.; Nuyts, R.; Timmers, M.; Scheveneels, W.; Hersmus, N.; Wang, J.; et al. A Zebrafish Model for C9orf72 ALS Reveals RNA Toxicity as a Pathogenic Mechanism. Acta Neuropathol. 2018, 135, 427–443. [Google Scholar] [CrossRef] [Green Version]
  41. Yeh, T.-H.; Liu, H.-F.; Li, Y.-W.; Lu, C.-S.; Shih, H.-Y.; Chiu, C.-C.; Lin, S.-J.; Huang, Y.-C.; Cheng, Y.-C. C9orf72 Is Essential for Neurodevelopment and Motility Mediated by Cyclin G1. Exp. Neurol. 2018, 304, 114–124. [Google Scholar] [CrossRef]
  42. Busch-Nentwich, E.; Kettleborough, R.; Dooley, C.M.; Scahill, C.; Sealy, I.; White, R.; Stemple, D.L. Sanger Institute Zebrafish Mutation Project Mutant Data Submission. ZFIN Direct Data Submiss. 2013. Available online: http://zfin.org (accessed on 1 July 2022).
  43. Draper, B.W.; McCallum, C.M.; Stout, J.L.; Slade, A.J.; Moens, C.B. A High-Throughput Method for Identifying N-Ethyl-N-Nitrosourea (ENU)-Induced Point Mutations in Zebrafish. In Methods in Cell Biology; Elsevier: Amsterdam, The Netherlands, 2004; Volume 77, pp. 91–112. [Google Scholar] [CrossRef]
  44. Aleström, P.; D’Angelo, L.; Midtlyng, P.J.; Schorderet, D.F.; Schulte-Merker, S.; Sohm, F.; Warner, S. Zebrafish: Housing and Husbandry Recommendations. Lab. Anim. 2020, 54, 213–224. [Google Scholar] [CrossRef] [PubMed] [Green Version]
  45. Westerfield, M. The Zebrafish Book: A Guide for the Laboratory Use of Zebrafish. 2000. Available online: http://zfin.org/zf_info/zfbook/zfbk.html (accessed on 1 July 2022).
  46. Bouffard, S.; Dambroise, E.; Brombin, A.; Lempereur, S.; Hatin, I.; Simion, M.; Corre, R.; Bourrat, F.; Joly, J.-S.; Jamen, F. Fibrillarin Is Essential for S-Phase Progression and Neuronal Differentiation in Zebrafish Dorsal Midbrain and Retina. Dev. Biol. 2018, 437, 1–16. [Google Scholar] [CrossRef] [PubMed]
  47. Kani, S.; Bae, Y.-K.; Shimizu, T.; Tanabe, K.; Satou, C.; Parsons, M.J.; Scott, E.; Higashijima, S.; Hibi, M. Proneural Gene-Linked Neurogenesis in Zebrafish Cerebellum. Dev. Biol. 2010, 343, 1–17. [Google Scholar] [CrossRef] [PubMed] [Green Version]
  48. Takeuchi, M.; Yamaguchi, S.; Sakakibara, Y.; Hayashi, T.; Matsuda, K.; Hara, Y.; Tanegashima, C.; Shimizu, T.; Kuraku, S.; Hibi, M. Gene Expression Profiling of Granule Cells and Purkinje Cells in the Zebrafish Cerebellum: Transcriptomes In Zebrafish Cerebellar Neurons. J. Comp. Neurol. 2017, 525, 1558–1585. [Google Scholar] [CrossRef]
  49. Gomez-Manzano, C.; Fueyo, J.; Kyritsis, A.P.; Steck, P.A.; Levin, V.A.; Alfred Yung, W.K.; McDonnell, T.J. Characterization of P53 and P21 Functional Interactions in Glioma Cells En Route to Apoptosis. JNCI J. Natl. Cancer Inst. 1997, 89, 1036–1044. [Google Scholar] [CrossRef] [Green Version]
  50. Moulton, J.D. Using Morpholinos to Control Gene Expression. Curr. Protoc. Nucleic Acid Chem. 2017, 68, 4–30. [Google Scholar] [CrossRef]
  51. Dernedde, J.; Weise, C.; Müller, E.-C.; Hagiwara, A.; Bachmann, S.; Suzuki, M.; Reutter, W.; Tauber, R.; Scherer, H. Cupulin Is a Zona Pellucida-Like Domain Protein and Major Component of the Cupula from the Inner Ear. PLoS ONE 2014, 9, e111917. [Google Scholar] [CrossRef] [PubMed]
  52. Shi, Y.; Lin, S.; Staats, K.A.; Li, Y.; Chang, W.-H.; Hung, S.-T.; Hendricks, E.; Linares, G.R.; Wang, Y.; Son, E.Y.; et al. Haploinsufficiency Leads to Neurodegeneration in C9ORF72 ALS/FTD Human Induced Motor Neurons. Nat. Med. 2018, 24, 313–325. [Google Scholar] [CrossRef]
  53. Mitra, J.; Guerrero, E.N.; Hegde, P.M.; Liachko, N.F.; Wang, H.; Vasquez, V.; Gao, J.; Pandey, A.; Taylor, J.P.; Kraemer, B.C.; et al. Motor Neuron Disease-Associated Loss of Nuclear TDP-43 Is Linked to DNA Double-Strand Break Repair Defects. Proc. Natl. Acad. Sci. USA 2019, 116, 4696–4705. [Google Scholar] [CrossRef] [Green Version]
  54. Wang, W.-Y.; Pan, L.; Su, S.C.; Quinn, E.J.; Sasaki, M.; Jimenez, J.C.; Mackenzie, I.R.A.; Huang, E.J.; Tsai, L.-H. Interaction of FUS and HDAC1 Regulates DNA Damage Response and Repair in Neurons. Nat. Neurosci. 2013, 16, 1383–1391. [Google Scholar] [CrossRef] [PubMed]
  55. Naumann, M.; Pal, A.; Goswami, A.; Lojewski, X.; Japtok, J.; Vehlow, A.; Naujock, M.; Günther, R.; Jin, M.; Stanslowsky, N.; et al. Impaired DNA Damage Response Signaling by FUS-NLS Mutations Leads to Neurodegeneration and FUS Aggregate Formation. Nat. Commun. 2018, 9, 335. [Google Scholar] [CrossRef]
  56. Recher, G.; Jouralet, J.; Brombin, A.; Heuzé, A.; Mugniery, E.; Hermel, J.-M.; Desnoulez, S.; Savy, T.; Herbomel, P.; Bourrat, F.; et al. Zebrafish Midbrain Slow-Amplifying Progenitors Exhibit High Levels of Transcripts for Nucleotide and Ribosome Biogenesis. Development 2013, 140, 4860–4869. [Google Scholar] [CrossRef] [Green Version]
  57. Trouillas, P.; Xie, J.; Adeleine, P. Treatment of Cerebellar Ataxia with Buspirone: A Double-Blind Study. Lancet. Neurol. 1996, 348, 759. [Google Scholar] [CrossRef]
  58. Trouillas, P. The Cerebellar Serotoninergic System and Its Possible Involvement in Cerebellar Ataxia. Can. J. Neurol. Sci. 1993, 20, S78–S82. [Google Scholar] [CrossRef] [Green Version]
  59. Takei, A.; Hamada, T.; Yabe, I.; Sasaki, H. Treatment of Cerebellar Ataxia with 5-HT1A Agonist. Cerebellum 2005, 4, 211–215. [Google Scholar] [CrossRef]
  60. Chen, Y.-S.; Hong, Z.-X.; Lin, S.-Z.; Harn, H.-J. Identifying Therapeutic Targets for Spinocerebellar Ataxia Type 3/Machado–Joseph Disease through Integration of Pathological Biomarkers and Therapeutic Strategies. Int. J. Mol. Sci. 2020, 21, 3063. [Google Scholar] [CrossRef]
  61. Vijayakumar, S.; Jones, S.M.; Jones, T.A.; Tian, C.; Johnson, K.R. Spontaneous Mutations of the Zpld1 Gene in Mice Cause Semicircular Canal Dysfunction but Do Not Impair Gravity Receptor or Hearing Functions. Sci. Rep. 2019, 9, 12430. [Google Scholar] [CrossRef]
  62. Gianfrancesco, F.; Esposito, T.; Penco, S.; Maglione, V.; Liquori, C.L.; Patrosso, M.C.; Zuffardi, O.; Ciccodicola, A.; Marchuk, D.A.; Squitieri, F. ZPLD1 Gene Is Disrupted in a Patient with Balanced Translocation That Exhibits Cerebral Cavernous Malformations. Neuroscience 2008, 155, 345–349. [Google Scholar] [CrossRef]
  63. Miyazaki, K.; Yamashita, T.; Morimoto, N.; Sato, K.; Mimoto, T.; Kurata, T.; Ikeda, Y.; Abe, K. Early and Selective Reduction of NOP56 (Asidan) and RNA Processing Proteins in the Motor Neuron of ALS Model Mice. Neurol. Res. 2013, 35, 744–754. [Google Scholar] [CrossRef] [PubMed]
  64. Sivadasan, R.; Hornburg, D.; Drepper, C.; Frank, N.; Jablonka, S.; Hansel, A.; Lojewski, X.; Sterneckert, J.; Hermann, A.; Shaw, P.J.; et al. C9ORF72 Interaction with Cofilin Modulates Actin Dynamics in Motor Neurons. Nat. Neurosci. 2016, 19, 1610–1618. [Google Scholar] [CrossRef] [PubMed]
  65. Zhu, Q.; Jiang, J.; Gendron, T.F.; McAlonis-Downes, M.; Jiang, L.; Taylor, A.; Diaz Garcia, S.; Ghosh Dastidar, S.; Rodriguez, M.J.; King, P.; et al. Reduced C9ORF72 Function Exacerbates Gain of Toxicity from ALS/FTD-Causing Repeat Expansion in C9orf72. Nat. Neurosci. 2020, 23, 615–624. [Google Scholar] [CrossRef] [PubMed]
Figure 1. (A): Phenotype of wild-type, nop56+/− and nop56−/− between 24 and 120 hpf. At 24 hpf, nop56−/− show statistically significant reduced head size, smaller eyes and smaller. At 48 hpf, statistically significant reduced body length can be also observed in nop56−/− embryos, as well as swollen yolk (in 100% of nop56−/− embryos) and curved body shape in (40% of the nop56−/− embryos). At 72 hpf, in addition to the previous features, there is cardiac edema in 77% of the embryos. In addition, at 96 and 120 hpf, there is total absence of swimming bladder in all nop56−/− embryos, curved body shape (in 50% of nop56−/− larvae) and a cardiac edema (in 88% of the nop56−/− larvae at 96 hpf and 100% at 120 hpf). For these parameters, no statistically significant differences were observed between wild type and nop56+/−. Statistically significant data in the graphs are indicated with a *. Scale bar: 1000 μm. (B) Kaplan–Meier survival graph for wild-type (n = 43), nop56+/− (n = 75) and nop56−/− (n = 44) zebrafish, revealing significantly different survivals for the nop56−/− embryos p < 0.0001.
Biomedicines 10 01814 g001
Figure 2. (AD) Lateral views of WT and nop56−/− larvae (3.5 dpf), showing coloboma (white thick arrow in (B)) and jaw malformation (black arrow in (D)) in the homozygous fish. Note also differences in the midbrain and cerebellum (thin white arrows). (E,F) Ventral view of WT and nop56−/− fish showing malformation of the eye (arrows) and forebrain (asterisk). Scale bar: 125 μm.
Biomedicines 10 01814 g002
Figure 3. Graphic representation of expression analysis by RT-qPCR. (A) Cbln12 expression is significantly reduced in nop56+/− and nop56−/− embryos between at 72 and 120 hpf in comparison with wild-type embryos (p-value < 0.0001). (B) Ptf1a expression is significantly reduced in nop56−/− embryos at 72 and 120 hpf (p-value < 0.0001.) (C) Grid2 expression is significantly reduced in nop56+/− and nop56−/− embryos between at 72 and 120 hpf in comparison with wild-type embryos (p-value < 0.0001). Statistically significant data in the graphs is indicated with a *.
Biomedicines 10 01814 g003
Figure 4. (A,B) Lateral views of WT (A) and nop56−/− (B) 3.5 dpf larvae immunostained against α-tubulin (magenta) showing abnormalities in the jaw (thick arrow) and brain, specially in the midbrain (asterisk) and cerebellum (thin arrow). (C,D) Lateral views of WT (C) and nop56−/− (D) fish immunostained against SV2 (green) showing different distribution in the brain, especially in the midbrain (asterisk) and cerebellum (arrow). (E,F) Ventral views of WT (E) and nop56−/− (F) showing lack of midline fibers and bundles in the homozygous fish (arrow in (F)), compared to WT (arrow in (E)). (GF) Lateral views of WT (G) and nop56−/− (H) brain showing smaller midbrain in the homozygous fish (asterisk in (H)) and absence of labelling in cerebellum (arrow in (H)), compared to WT (asterisk and arrows in (G)). All images are projections from confocal z-stacks. Scale bars: 125 μm.
Biomedicines 10 01814 g004
Figure 5. Zebrin II immunofluorescence in 4 dpf zebrafish larvae revealed a complete lack of cerebellar Purkinje cells in nop56−/−. Dorsal views. Anterior to the top. Scale bar: 150 μm.
Biomedicines 10 01814 g005
Figure 6. (A,B) Lateral views of WT (A) and nop56−/− (B) 3.5 dpf larvae showing malformations in the neuromuscular junctions and the innervation of the trunk myomeres. All images are projections from confocal z-stacks. (A,B) Alpha-tubulin staining (magenta) showing alterations in the distribution of fibers and bundles in the trunk (thin arrows). White thick arrows in (A,B) point to posterior lateral line nerve. (C,D) SV2 (green) staining showing alterations in neuromuscular junction (arrows) and myosepta in nop56−/− compared to wild type. Asterisk in (B,D) marks the spinal cord. Scale bar: 150 μm.
Biomedicines 10 01814 g006
Figure 7. 5-HT immunofluorescence in 4 dpf zebrafish larvae revealed significant reduction in the number of 5-HT-ir spinal cord neurons in nop56−/− animals. Scale bar: 150 μm. Statistically significant data in the graphs are indicated with ****.
Biomedicines 10 01814 g007
Figure 8. Apoptosis assay in wild type, nop56+/− and nop56−/−. Fluorescence highlights apoptotic cells. nop56−/− have a high increase in apoptosis mainly in CNS (p-value < 0.0001). Statistically significant data in the graphs are indicated with a *.
Biomedicines 10 01814 g008
Figure 9. Graphic representation of analysis of mRNA expression by RT-qPCR. (A) p21 expression is significantly higher in nop56−/− larvae between 72 and 120 hpf (p-value < 0.0001.) (B) p53 expression is significantly higher in nop56−/− larvae between 72 and 120 hpf (p-value < 0.0001.) (C) Microinjection of p53 morpholino restored the expression in nop56−/− embryos to levels similar to wild type but not the malformations (data not shown). Statistically significant data in the graphs are indicated with a *.
Biomedicines 10 01814 g009
Figure 10. Touch-evoked escape was reduced at 48 hpf in nop56−/− embryos and locomotion was absent in nop56−/− larvae at 96 hpf (p-value < 0.0001). Statistically significant data in the graphs are indicated with a *.
Biomedicines 10 01814 g010
Figure 11. Graphic representation of expression analysis by RT-qPCR. (A) Zpld1a expression is significantly reduced in nop56−/− larvae between 72 and 120 hpf (p-value < 0.0001). (B) Zpld1a expression is significantly reduced in nop56−/− larvae between 72 and 120 hpf (p-value < 0.0001) and in nop56+/− at 120 hpf. Statistically significant data in the graphs are indicated with a *.
Biomedicines 10 01814 g011
Figure 12. Graphic representation of mRNA expression analysis by RT-qPCR. (A) nop56 expression is significantly different in wild-type, nop56+/− and nop56−/− larvae between 72 and 120 hpf (p-value < 0.0001). (B) nop58 expression is significantly higher in nop56−/− and nop56+/−larvae between 72 and 120 hpf (p-value < 0.0001.) (C) fbl expression is significantly higher in nop56−/− larvae between 72 and 120 hpf (p-value < 0.0001) and in nop56+/− at 120 hpf respect to wild-type larvae (p-value < 0.0001). Statistically significant data in the graphs are indicated with a *.
Biomedicines 10 01814 g012
Figure 13. Graphic representation of expression analysis by RT-qPCR. (A) 18S rRNA expression is significantly reduced in nop56−/− larvae at 120 hpf (p-value < 0.0001). (B) 5ETS expression does not differ between wild type, nop56−/− and nop56+/− embryos at 120 hpf (C) ITS1 expression is significantly higher in nop56−/− larvae between at 120 hpf (p-value < 0.0001). (D) ITS2 expression does not differ between wild type, nop56−/− and nop56+/− larvae at 120 hpf. Statistically significant data in the graphs are indicated with a *.
Biomedicines 10 01814 g013
Figure 14. Graphic representation of mRNA expression analysis by RT-qPCR. (A) c9of72 expression is significantly reduced in nop56−/− embryos between 72 and 120 hpf (p-value < 0.001) and in nop56+/− at 120 hpf (p-value=0.0015). (B) tardbp expression is significantly reduced in nop56−/− embryos between 72 and 120 hpf (p-value < 0.001). (C) fus expression is significantly reduced in nop56−/− embryos between 72 and 120 hpf (p-value < 0.0001) and in nop56+/− embryos at 120 hpf (p-value < 0.0001). Statistically significant data in the graphs are indicated with a *.
Biomedicines 10 01814 g014
Publisher’s Note: MDPI stays neutral with regard to jurisdictional claims in published maps and institutional affiliations.

