
Comparing the Effects of Canagliflozin vs. Glimepiride by Body Mass Index in Patients with Type 2 Diabetes and Chronic Heart Failure: A Subanalysis of the CANDLE Trial

 ,
,
Abstract
:1. Introduction
2. Materials and Methods
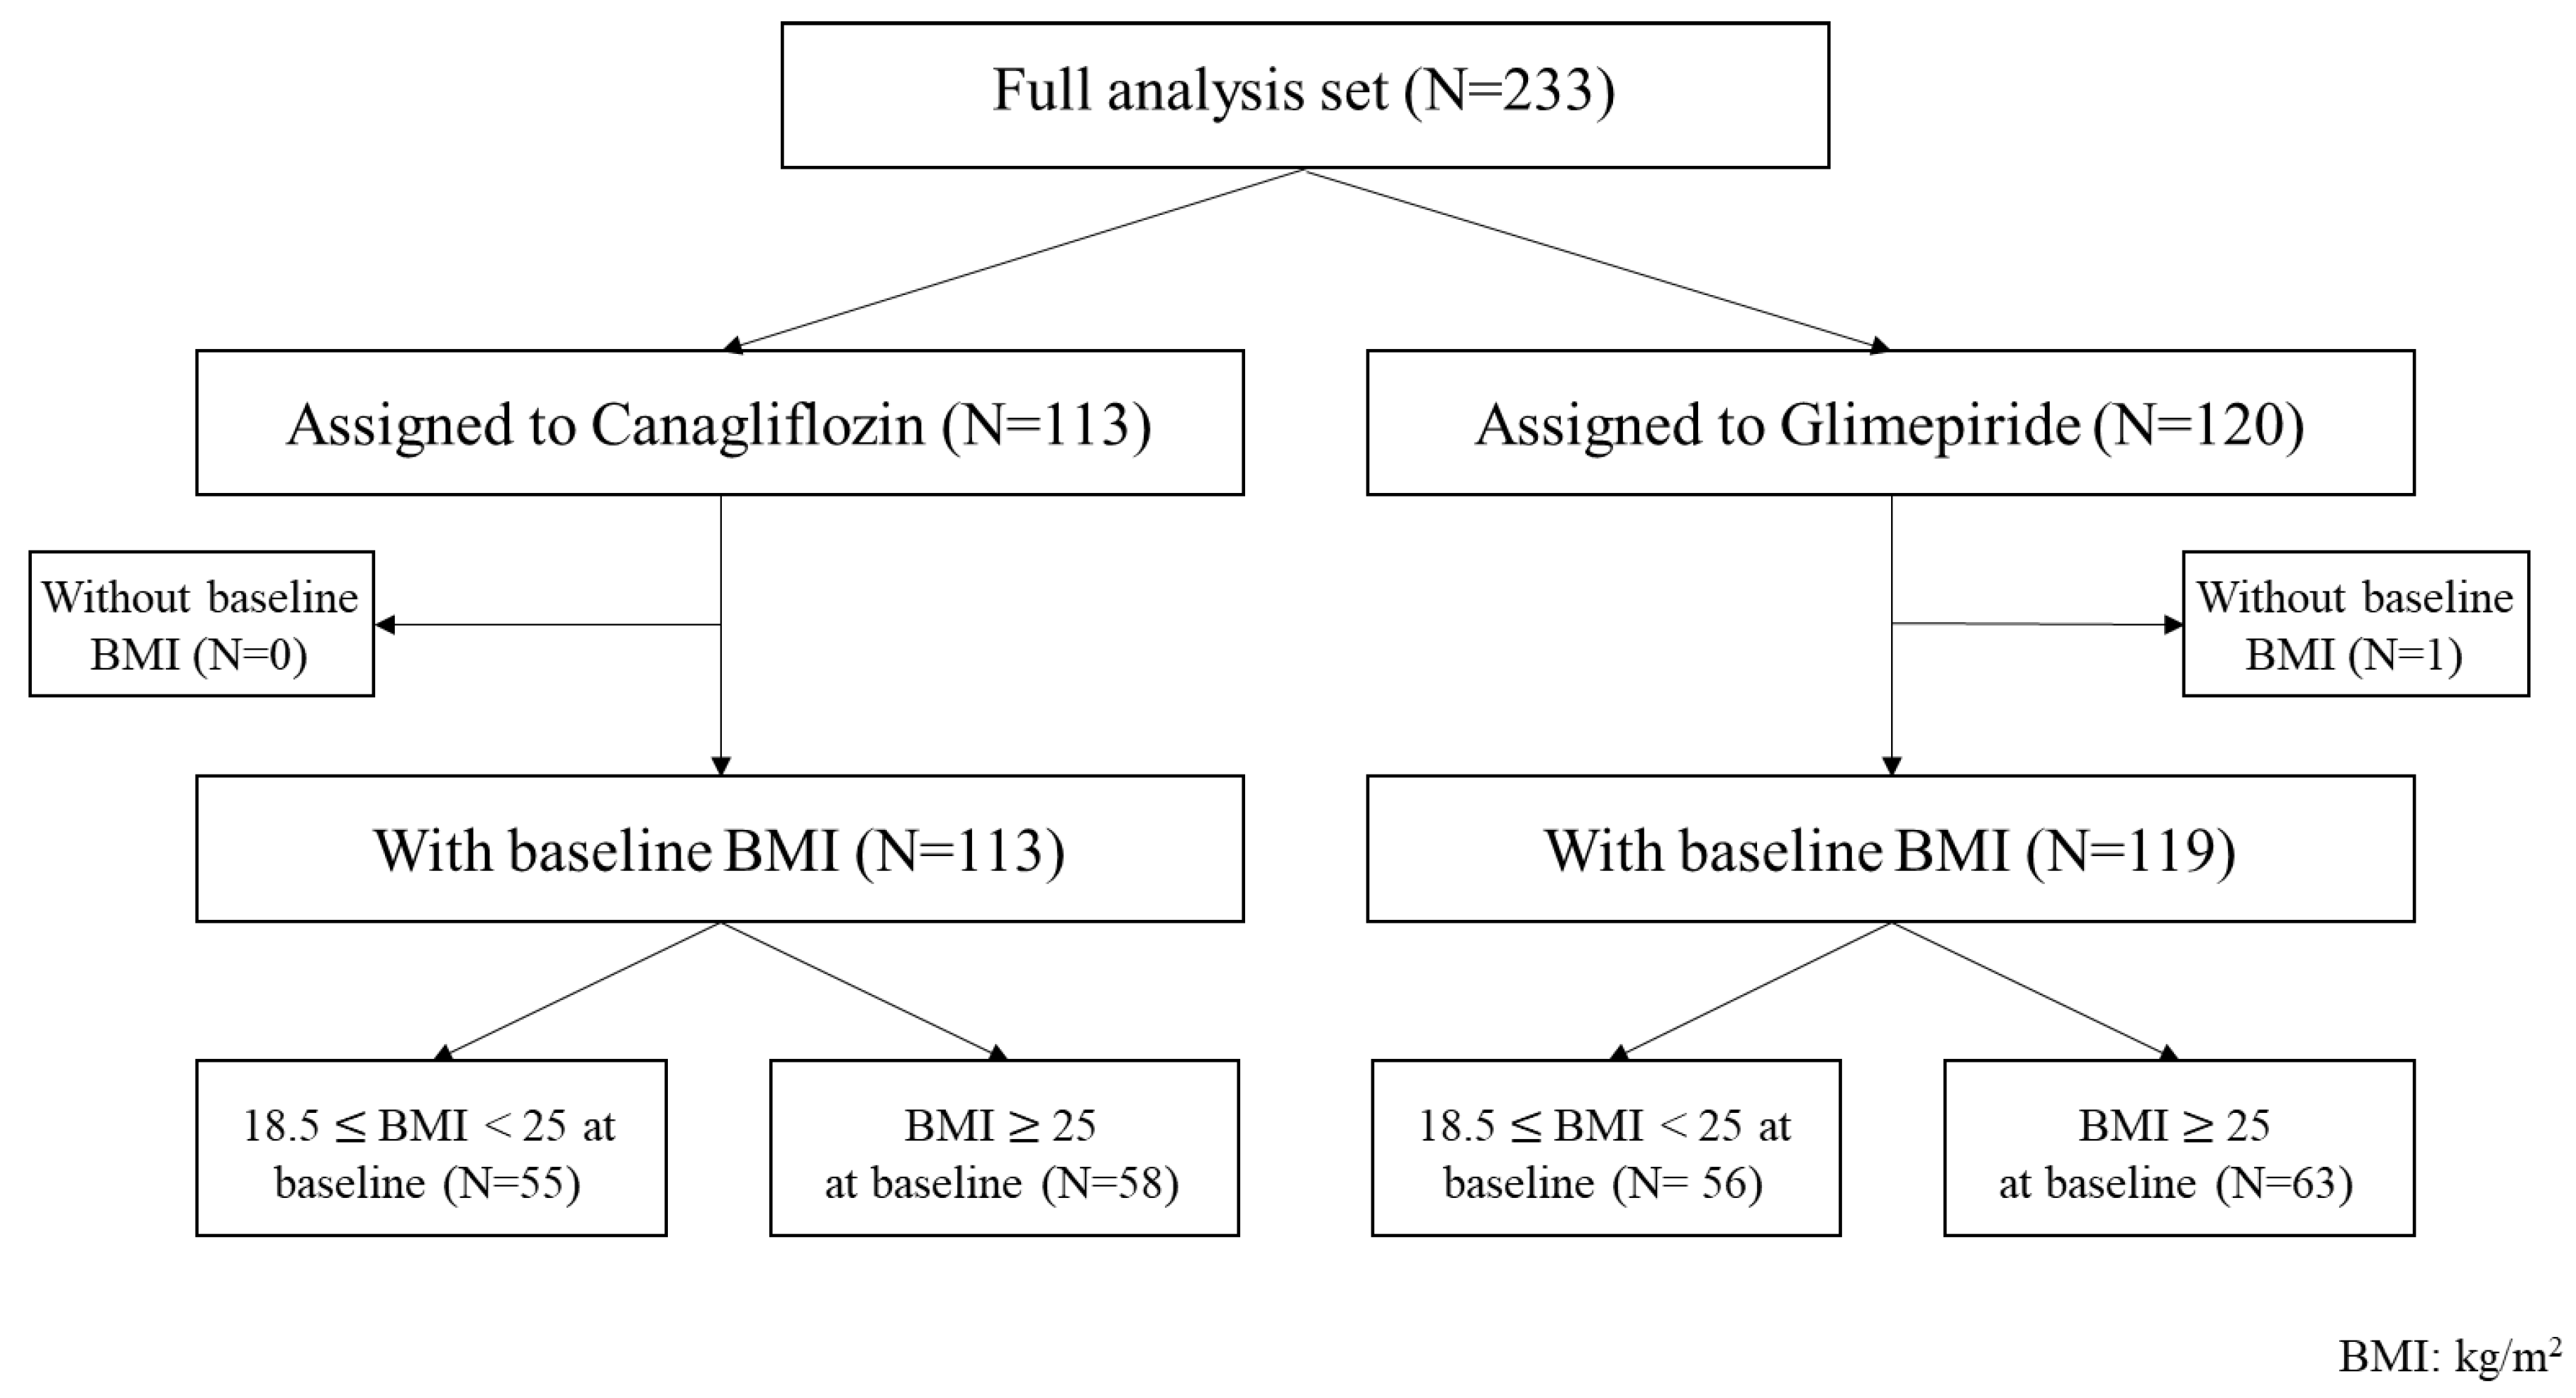
2.1. Study Design and Participants
2.2. Measurements and Endpoints
2.3. Statistical Analysis
3. Results
3.1. Baseline Clinical Characteristics
3.2. Effects of Treatment
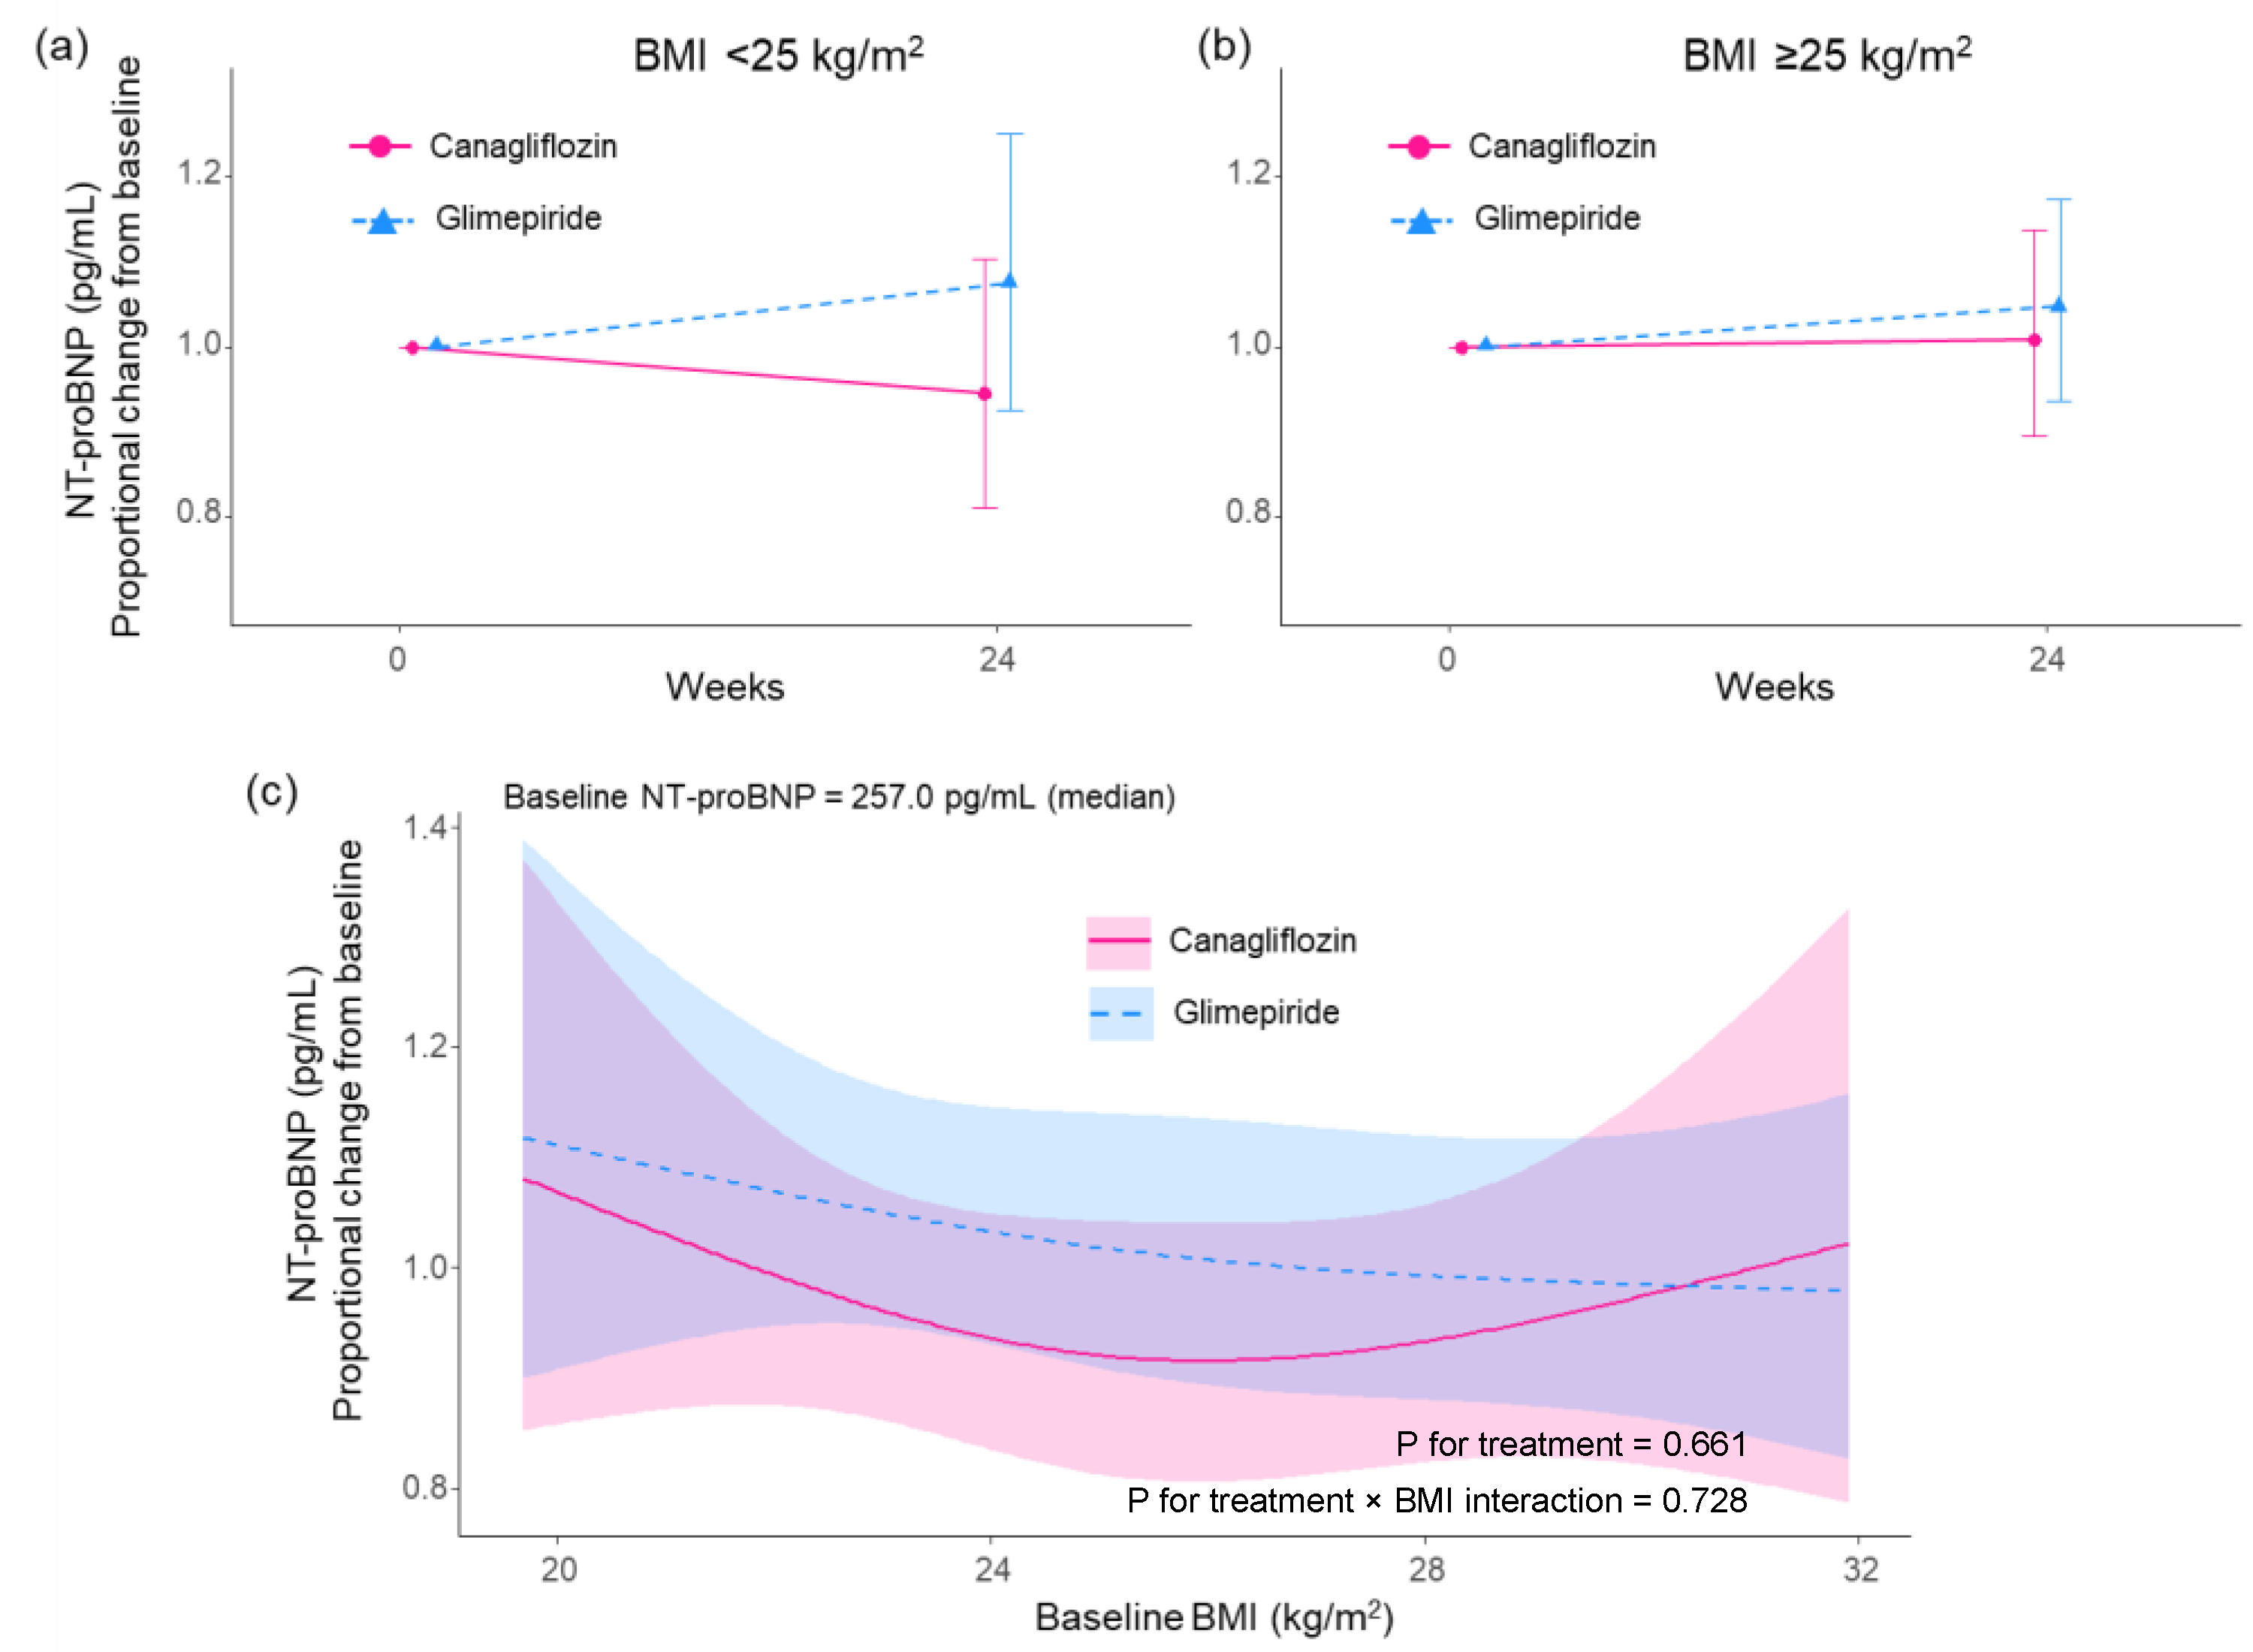
3.2.1. NT-proBNP
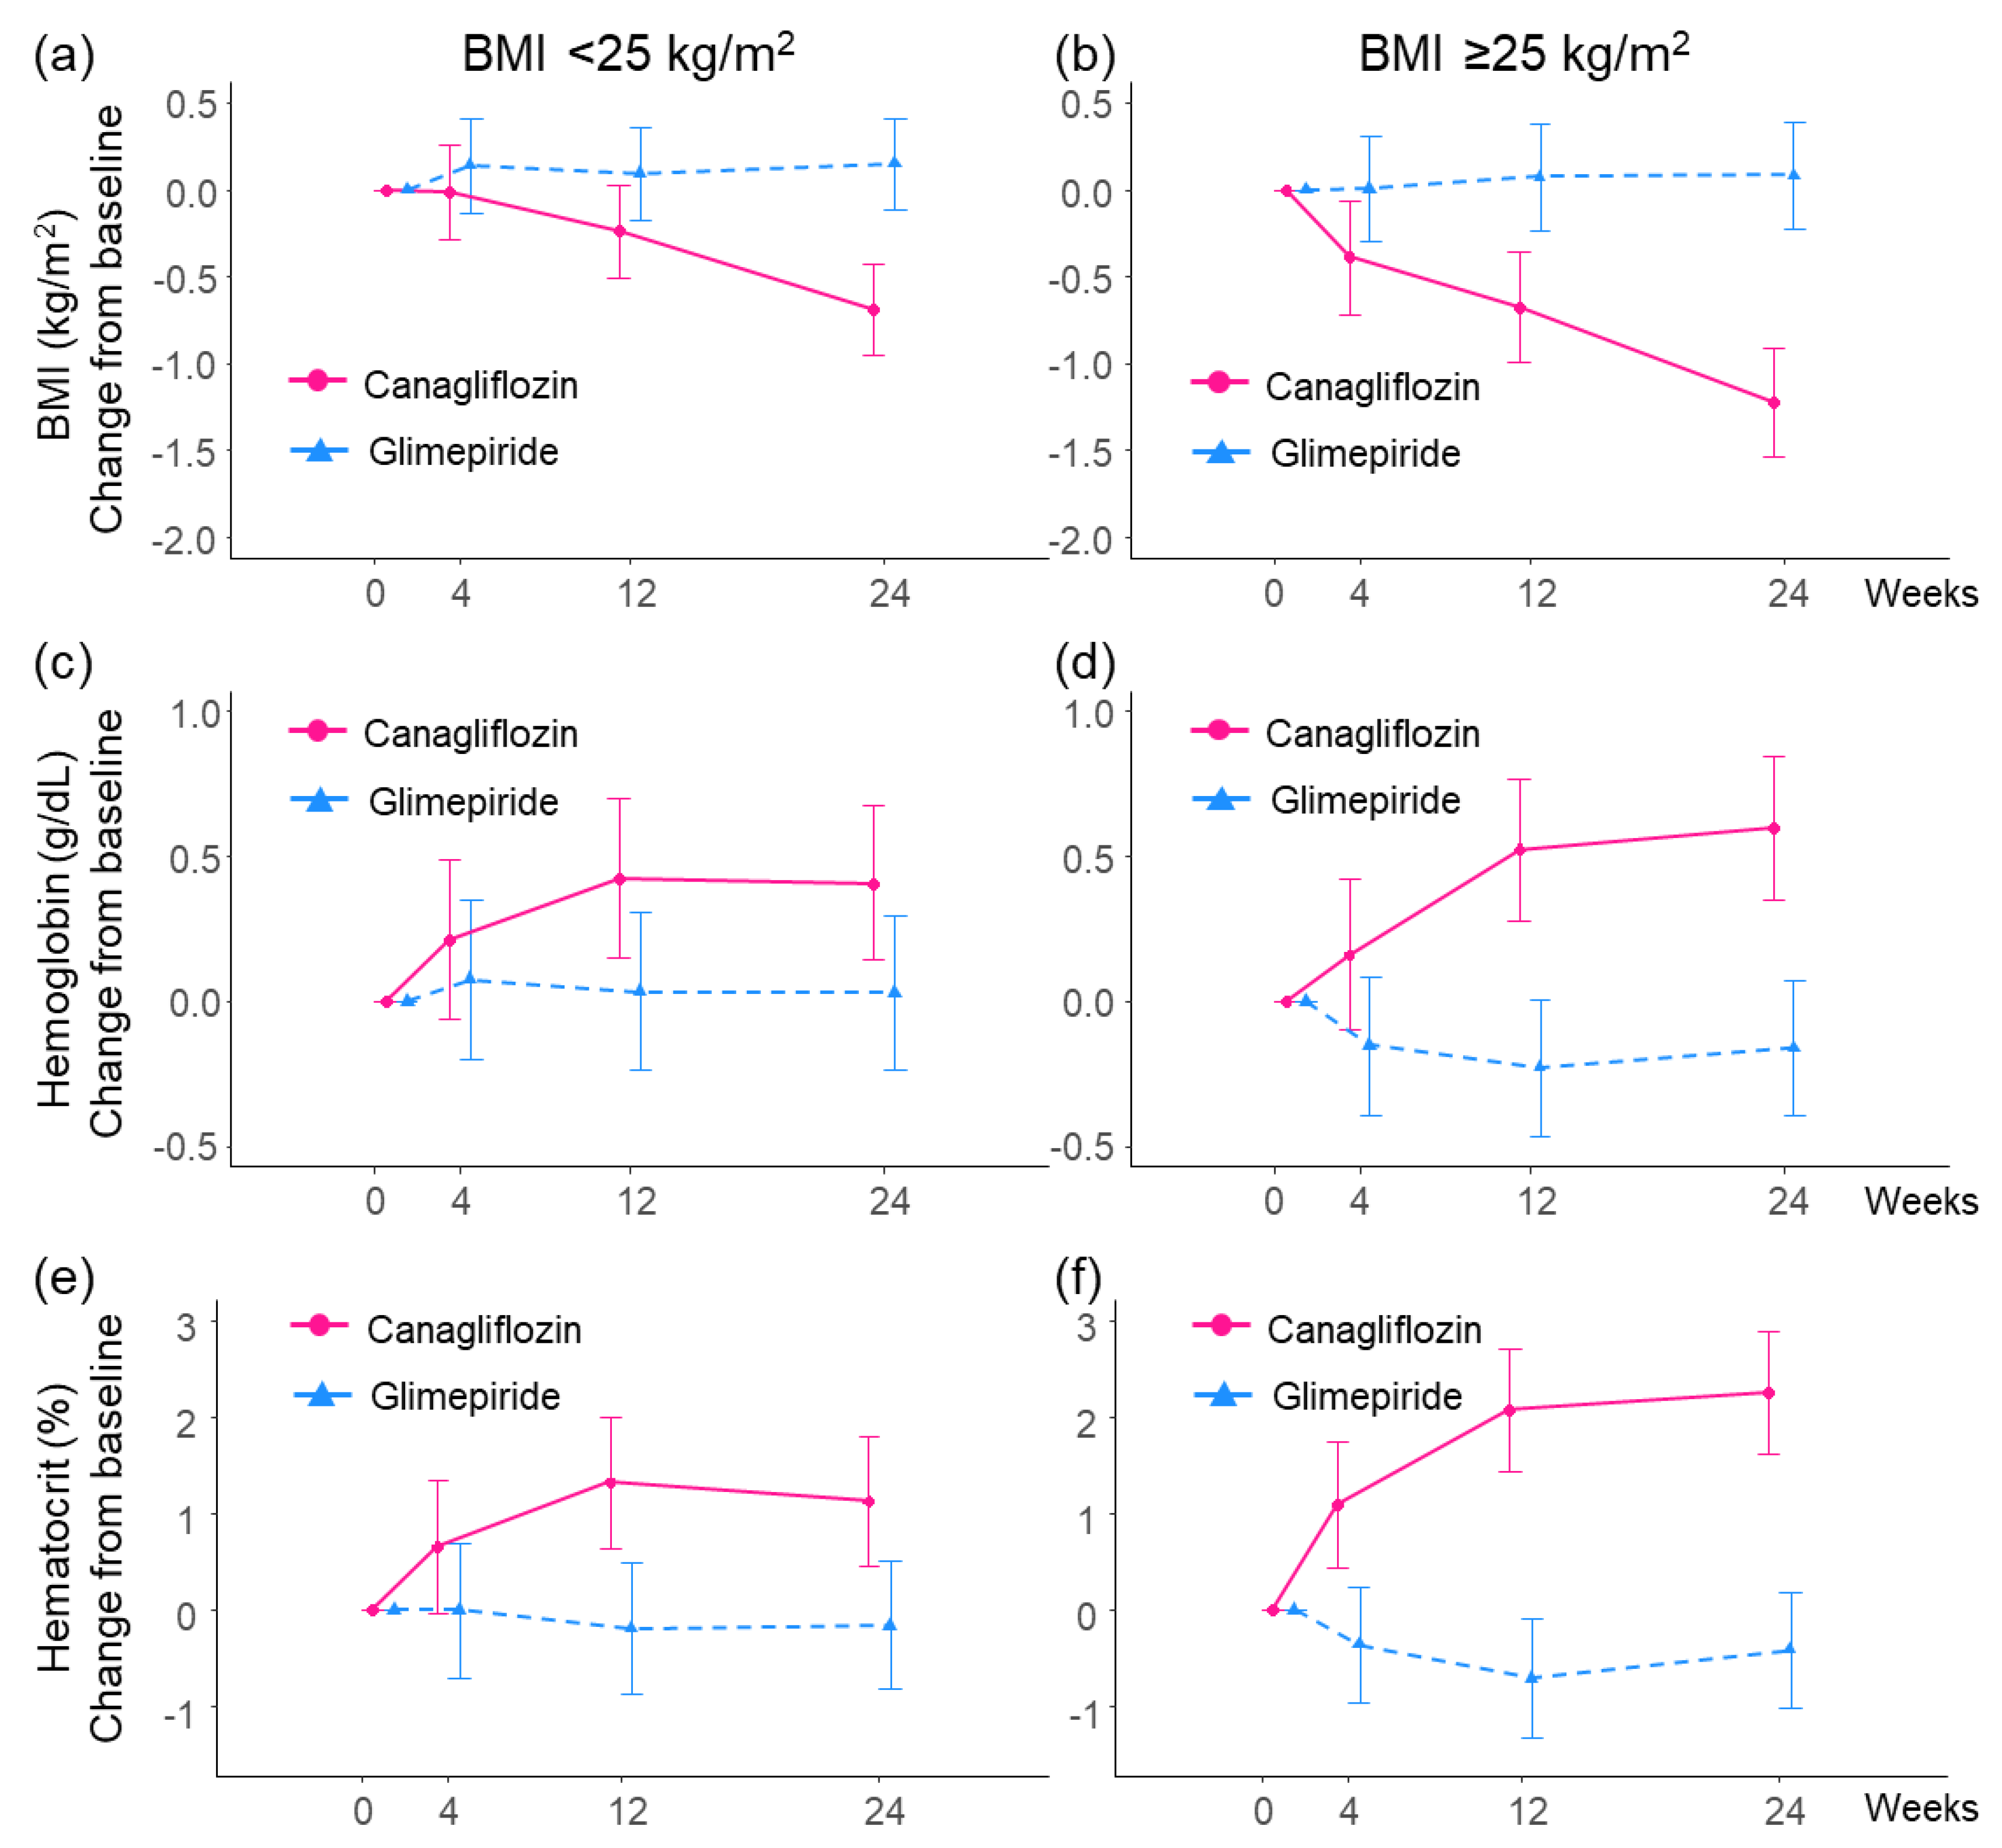
3.2.2. BMI
3.2.3. Hemoglobin and Hematocrit
3.2.4. eGFR
3.2.5. Hemoglobin A1c
4. Discussion
5. Limitation
6. Conclusions
Author Contributions
Funding
Institutional Review Board Statement
Informed Consent Statement
Data Availability Statement
Acknowledgments
Conflicts of Interest
References
- Zinman, B.; Wanner, C.; Lachin, J.M.; Fitchett, D.; Bluhmki, E.; Hantel, S.; Mattheus, M.; Biomath, D.; Devins, T.; Johansen, O.E.; et al. Empagliflozin, cardiovascular outcomes, and mortality in type 2 diabetes. N. Engl. J. Med. 2015, 373, 2117–2128. [Google Scholar] [CrossRef] [PubMed] [Green Version]
- Furtado, R.H.M.; Bonaca, M.P.; Raz, I.; Zelniker, T.A.; Mosenzon, O.; Cahn, A.; Kuder, J.; Murphy, S.A.; Bhatt, D.L.; Leiter, L.A.; et al. Dapagliflozin and cardiovascular outcomes in patients with type 2 diabetes mellitus and previous myocardial infarction. Circulation 2019, 139, 2516–2527. [Google Scholar] [CrossRef] [PubMed]
- Neal, B.; Perkovic, V.; Mahaffey, K.W.; de Zeeuw, D.; Fulcher, G.; Erondu, N.; Shaw, W.; Law, G.; Desai, M.; Mathews, D.R.; et al. CANVAS program collaborative group. canagliflozin and cardiovascular and renal events in type 2 diabetes. N. Engl. J. Med. 2017, 377, 644–657. [Google Scholar] [CrossRef] [PubMed]
- Zelniker, T.A.; Wiviott, S.D.; Raz, I.; Im, K.; Goodrich, E.L.; Bonaca, M.P.; Mosenzon, O.; Kato, E.T.; Cahn, A.; Furtado, R.H.M.; et al. SGLT2 inhibitors for primary and secondary prevention of cardiovascular and renal outcomes in type 2 diabetes: A systematic review and meta-analysis of cardiovascular outcome trials. Lancet 2019, 393, 31–39. [Google Scholar] [CrossRef]
- Packer, M.; Anker, S.D.; Butler, J.; Filippatos, G.; Pocock, S.J.; Carson, P.; Januzzi, J.; Verma, S.; Tsutsui, H.; Brueckmann, M.; et al. EMPEROR-Reduced trial investigators. Cardiovascular and renal outcomes with empagliflozin in heart failure. N. Engl. J. Med. 2020, 383, 1413–1424. [Google Scholar] [CrossRef]
- McMurray, J.J.V.; Solomon, S.D.; Inzucchi, S.E.; Kober, L.; Kosiborod, M.N.; Martinez, F.A.; Ponikowski, P.; Sabatine, M.S.; Anand, I.S.; Bělohlávek, J.; et al. DAPA-HF trial committees and investigators: Dapagliflozin in patients with heart failure and reduced ejection fraction. N. Engl. J. Med. 2019, 381, 1995–2008. [Google Scholar] [CrossRef] [PubMed] [Green Version]
- Anker, S.D.; Butler, J.; Flippatos, G.; Ferreira, J.P.; Bocchi, E.; Böhm, M.; Rocca, H.P.B.L.; Choi, D.J.; Chopra, V.; Valenzuela, E.C.; et al. EMPEROR-Preserved trial investigators. Empagliflozin in heart failure with a preserved ejection fraction. N. Engl. J. Med. 2021, 385, 1451–1461. [Google Scholar] [CrossRef]
- Tanaka, A.; Inoue, T.; Kitakaze, M.; Oyama, J.; Sata, M.; Taguchi, I.; Shimizu, W.; Watada, H.; Tomiyama, H.; Ako, J.; et al. Rationale and design of a randomized trial to test the safety and non-inferiority of canagliflozin in patients with diabetes with chronic heart failure: The CANDLE trial. Cardiovasc. Diabetol. 2016, 15, 57. [Google Scholar] [CrossRef] [Green Version]
- Tanaka, A.; Hisauchi, I.; Taguchi, I.; Sezai, A.; Toyoda, S.; Tomiyama, H.; Sata, M.; Ueda, S.; Oyama, J.; Kitakaze, M.; et al. CANDLE Trial Investigators. Effects of canagliflozin in patients with type 2 diabetes and chronic heart failure: A randomized trial (CANDLE). ESC Heart Fail. 2020, 7, 1585–1594. [Google Scholar] [CrossRef]
- Kusunose, K.; Imai, T.; Tanaka, A.; Dohi, K.; Shiina, K.; Yamada, T.; Kida, K.; Eguchi, K.; Teragawa, H.; Takeishi, Y.; et al. Effects of canagliflozin on NT-proBNP stratified by left ventricular diastolic function in patients with type 2 diabetes and chronic heart failure: A sub analysis of the CANDLE trial. Cardiovasc. Diabetol. 2021, 20, 186. [Google Scholar] [CrossRef]
- Ji, Q.; Ji, L.; Mu, Y.; Zhao, J.; Zinman, B.; Wanner, C.; George, J.T.; Zwiener, I.; Ueki, K.; Yokote, K.; et al. Effect of empagliflozin on cardiorenal outcomes and mortality according to body mass index: A subgroup analysis of the EMPA-REG OUTCOME trial with a focus on Asia. Diabetes Obes. Metab. 2021, 23, 1886–1891. [Google Scholar] [CrossRef] [PubMed]
- Khoo, C.M.; Deerochanawong, C.; Chan, S.P.; Matawaran, B.; Sheu, W.H.; Chan, J.; Suastika, K.; Khoo, C.M.; Yoon, K.H.; Luk, A.; et al. Use of sodium-glucose co-transporter-2 inhibitors in Asian patients with type 2 diabetes and kidney disease: An Asian perspective and expert recommendations. Diabetes Obes. Metab. 2021, 23, 299–317. [Google Scholar] [CrossRef] [PubMed]
- Tanaka, A.; Toyoda, S.; Imai, T.; Shiina, K.; Tomiyama, H.; Matsuzawa, Y.; Kanzaki, Y.; Onishi, K.; Kiyosue, A.; Nishino, M.; et al. Effect of canagliflozib on N-terminal pro-brain natriuretic peptide in patients with type 2 diabetes and chronic heart failure according to baseline use of glucose-lowering agents. Cardiovasc. Diabetol. 2021, 20, 175. [Google Scholar] [CrossRef] [PubMed]
- Fedele, D.; Bicchiega, V.; Collo, A.; Barutta, F.; Psitone, E.; Gruden, G.; Bruno, G. Short term variation in NTproBNP after lifestyle intervention in severe obesity. PLoS ONE 2017, 12, e0181212. [Google Scholar] [CrossRef] [Green Version]
- Nassif, M.E.; Windsor, S.L.; Tang, F.; Khariton, Y.; Husain, M.; Inzucchi, S.E.; McGuire, D.K.; Pitt, B.; Scirica, B.M.; Austin, B.; et al. Dapagliflozin effects on biomarkers, symptoms, and functional status in patients with heart failure with reduced ejection fraction: The DEFINE-HF trial. Circulation 2019, 140, 1463–1476. [Google Scholar] [CrossRef]
- Jensen, J.; Omar, M.; Kistrop, C.; Poulsen, M.K.; Tuxen, D.; Gustafsso, I.; Gustafsson, F.; Faber, J.; Fosbøl, E.L.; Eske Bruun, N.E.; et al. Twelve weeks of treatment with empagliflozin in patients with heart failure and reduced ejection fraction: A double-blinded, randomized, and placebo-controlled trial. Am. Heart J. 2020, 228, 47–56. [Google Scholar] [CrossRef]
- Ferrannini, E.; Baldi, S.; Frascerra, S.; Astiarraga, B.; Barsotti, E.; Clerico, A.; Muscelli, E. Renal handling of ketones in response to sodium-glucose cotransporter 2 inhibition in patients with type 2 diabetes. Diabetes Care 2017, 40, 771–776. [Google Scholar] [CrossRef] [Green Version]
- Tanaka, A.; Node, K. How should me monitor the cardiovascular benefit of sodium-glucose cotransporter 2 inhibition? Cardiovasc. Diabetol. 2020, 19, 206. [Google Scholar] [CrossRef]
- Staels, B. Cardiovascular protection by sodium glucose cotransporter 2 inhibitors: Potential mechanisms. Am. J. Cardiol. 2017, 120, S28–S36. [Google Scholar] [CrossRef] [Green Version]
- Tanaka, A.; Yoshida, H.; Kawaguchi, A.; Oyama, J.; Kotooka, N.; Toyoda, S.; Inoue, T.; Natsuaki, M.; Node, K. N-terminal pro-brain natriuretic peptide and associated factors in the general working population: A baseline survey of the Uranosaki cohort study. Sci. Rep. 2017, 7, 5810. [Google Scholar] [CrossRef] [Green Version]
- Neelanf, I.J.; Winders, B.R.; Ayers, C.R.; Das, S.R.; Chang, A.Y.; Berry, J.D.; Khera, A.; McGuire, D.K.; Vega, G.L.; de Lemos, J.A.; et al. Higher natriuretic peptide levels associate with a favorable adipose tissue distribution profile. J. Am. Coll. Cardiol. 2013, 62, 752–760. [Google Scholar] [CrossRef] [PubMed] [Green Version]
- Garvey, W.T.; Van Gaal, L.; Leiter, L.A.; Vijapurkar, U.; List, J.; Cuddihy, R.; Ren, J.; Davies, M.J. Effects of canagliflozin versus glimepiride on adipokines and inflammatory biomarkers in type 2 diabetes. Metabolism 2018, 85, 32–37. [Google Scholar] [CrossRef] [PubMed] [Green Version]
- Verma, S.; McMurray, J.J.V. SGLT2 inhibitors and mechanisms of cardiovascular benefit: A state-of-the-art review. Diabetologia 2018, 61, 2108–2117. [Google Scholar] [CrossRef] [PubMed] [Green Version]
- Sezai, A.; Sekino, H.; Unosawa, S.; Taoka, M.; Osaka, S.; Tanaka, M. Canagliflozin for Japanese patients with chronic heart failure and type II diabetes. Cardiovasc. Diabetol. 2019, 18, 76. [Google Scholar] [CrossRef] [PubMed] [Green Version]
- Sakai, S.; Kaku, K.; Seino, Y.; Inagaki, N.; Haneda, M.; Sasaki, T.; Fukatsu, A.; Kakiuchi, H.; Samukawa, Y. Efficacy and safety of the SGLT2 inhibitor luseogliflozin in japanese patients with type 2 diabetes mellitus stratified according to baseline body mass index: Pooled analysis of data from 52-week phase III trials. Clin. Ther. 2016, 38, 843–862. [Google Scholar] [CrossRef] [Green Version]
- Cefalu, W.T.; Leiter, L.A.; Yoon, K.H.; Arias, P.; Niskanen, L.; Xie, J.; Balis, D.A.; Canovatchel, W.; Meininger, G. Efficacy and safety of canagliflozin versus glimepiride in patients with type 2 diabetes inadequately controlled with metformin (CANTATA-SU): 52 week results from a randomised, double-blind, phase 3 non-inferiority trial. Lancet 2013, 382, 941–950. [Google Scholar] [CrossRef]
- Ogawa, W.; Sakaguchi, K. Euglycemic diabetic ketoacidosis induced by SGLT2 inhibitors: Possible mechanism and contributing factors. J. Diabetes Investig. 2016, 7, 135–138. [Google Scholar] [CrossRef]
- Takahara, M.; Shiraiwa, T.; Matsuoka, T.A.; Katakami, N.; Shmomura, I. Ameliorated pancreatic β cell dysfunction in type 2 diabetic patients treated with a sodium-glucose contransporter 2 inhibitor ipragliflozin. Endocr. J. 2015, 62, 77–86. [Google Scholar] [CrossRef] [Green Version]


| Patients BMI < 25 kg/m2 at Baseline (N = 111) | Patients BMI ≥ 25 kg/m2 at Baseline (N = 121) | |||
|---|---|---|---|---|
| Characteristic | Canagliflozin Group (N = 55) | Glimepiride Group (N = 56) | Canagliflozin Group (N = 58) | Glimepiride Group (N = 63) |
| Age (mean ± SD), years | 70.8 ± 8.6 | 72.1 ± 7.3 | 65.9 ± 10.3 | 66.1 ± 11.9 |
| Sex, no. (%) | ||||
| Male | 41 (74.5%) | 37 (66.1%) | 47 (81.0%) | 48 (76.2%) |
| Female | 14 (25.5%) | 19 (33.9%) | 11 (19.0%) | 15 (23.8%) |
| NT-proBNP (median [IQR]), pg/mL | 285.0 [116.0 to 662.0] | 374.5 [153.8 to 774.0] | 213.0 [112.0 to 412.0] | 158.0 [58.2 to 499.2] |
| BMI (mean ± SD), kg/m2 | 22.4 ± 1.6 | 22.4 ± 1.8 | 28.0 ± 2.8 | 28.6 ± 3.6 |
| Hemoglobin (mean ± SD), g/dL | 13.4 ± 1.8 | 13.4 ± 1.7 | 14.1 ± 1.6 | 14.1 ± 1.7 |
| Hematocrit (mean ± SD), % | 40.8 ± 5.1 | 40.6 ± 4.0 | 42.4 ± 4.5 | 42.1 ± 4.8 |
| eGFR (mean ± SD), mL/min/1.73 m2 | 62.9 ± 14.8 | 61.6 ± 12.6 | 65.2 ± 15.7 | 64.8 ± 16.7 |
| HbA1c (mean ± SD), % | 6.9 ± 0.8 | 7.0 ± 1.0 | 7.0 ± 0.7 | 7.1 ± 0.9 |
| LVEF < 50%, no. (%) | 19 (34.5%) | 15 (26.8%) | 15 (26.3%) | 18 (28.6%) |
| Heart failure cause, no. (%) | ||||
| Ischemia | 29 (52.7%) | 22 (39.3%) | 25 (43.1%) | 24 (38.1%) |
| Hypertension | 11 (20.0%) | 13 (23.2%) | 21 (36.2%) | 17 (27.0%) |
| Valvular disease | 14 (25.5%) | 11 (19.6%) | 5 (8.6%) | 6 (9.5%) |
| Dilated cardiomyopathy | 6 (10.9%) | 8 (14.3%) | 11 (19.0%) | 11 (17.5%) |
| Arrhythmia | 15 (27.3%) | 20 (35.7%) | 14 (24.1%) | 12 (19.0%) |
| Patients BMI < 25 kg/m2 at Baseline (N = 111) | Patients BMI ≥ 25 kg/m2 at Baseline (N = 121) | |||||||
|---|---|---|---|---|---|---|---|---|
| Change from Baselinea | Group Difference b | Change from Baseline a | Group Difference b | |||||
| Variables | Visit | Canagliflozin (N = 55) | Glimepiride (N = 56) | Canagliflozin vs. Glimepiride | Canagliflozin (N = 58) | Glimepiride (N = 63) | Canagliflozin vs. Glimepiride | p for int. |
| Body mass index (kg/m2) | 4 weeks | −0.01 (−0.28 to 0.26) | 0.14 (−0.13 to 0.41) | −0.15 (−0.58 to 0.28) p = 0.495 | −0.38 (−0.71 to −0.06) | 0.00 (−0.30 to 0.31) | −0.43 (−0.84 to −0.02) p = 0.038 | 0.353 |
| 12 weeks | −0.24 (−0.51 to 0.03) | 0.09 (−0.17 to 0.36) | −0.33 (−0.75 to 0.09) p = 0.125 | −0.67 (−0.99 to −0.36) | 0.07 (−0.23 to 0.38) | −0.79 (−1.19 to −0.38) p < 0.001 | 0.127 | |
| 24 weeks | −0.69 (−0.95 to −0.43) | 0.16 (−0.11 to 0.42) | −0.84 (−1.25 to −0.42) p < 0.001 | −1.22 (−1.54 to −0.91) | 0.08 (−0.22 to 0.39) | −1.35 (−1.75 to −0.95) p < 0.001 | 0.083 | |
| Hemoglobin (g/dL) | 4 weeks | 0.21 (−0.06 to 0.49) | 0.07 (−0.20 to 0.35) | 0.18 (−0.18 to 0.54) p = 0.327 | 0.16 (−0.10 to 0.42) | −0.15 (−0.39 to 0.09) | 0.31 (−0.04 to 0.66) p = 0.082 | 0.604 |
| 12 weeks | 0.42 (0.15 to 0.70) | 0.03 (−0.24 to 0.30) | 0.42 (0.07 to 0.77) p = 0.020 | 0.52 (0.28 to 0.77) | −0.23 (−0.47 to 0.01) | 0.75 (0.41 to 1.09) p < 0.001 | 0.189 | |
| 24 weeks | 0.41 (0.14 to 0.68) | 0.03 (−0.24 to 0.30) | 0.39 (0.04 to 0.74) p = 0.027 | 0.60 (0.35 to 0.84) | −0.16 (−0.40 to 0.07) | 0.76 (0.42 to 1.10) p < 0.001 | 0.136 | |
| Hematocrit (%) | 4 weeks | 0.65 (−0.03 to 1.34) | 0.00 (−0.69 to 0.69) | 0.70 (−0.23 to 1.63) p = 0.140 | 1.09 (0.44 to 1.74) | −0.36 (−0.97 to 0.25) | 1.45 (0.54 to 2.35) p = 0.002 | 0.263 |
| 12 weeks | 1.32 (0.63 to 2.00) | −0.19 (−0.86 to 0.49) | 1.55 (0.63 to 2.47) p = 0.001 | 2.07 (1.44 to 2.71) | −0.70 (−1.31 to −0.09) | 2.77 (1.88 to 3.67) p < 0.001 | 0.061 | |
| 24 weeks | 1.14 (0.47 to 1.80) | −0.16 (−0.82 to 0.51) | 1.33 (0.42 to 2.23) p = 0.004 | 2.25 (1.62 to 2.89) | −0.41 (−1.01 to 0.19) | 2.67 (1.78 to 3.55) p < 0.001 | 0.037 | |
| eGFR (mL/min/1.73 m2) | 4 weeks | −4.42 (−6.28 to −2.56) | 0.89 (−0.96 to 2.74) | −5.20 (−7.73 to −2.66) p < 0.001 | −3.83 (−5.69 to −1.97) | −0.51 (−2.23 to 1.22) | −3.27 (−5.72 to −0.82) p = 0.009 | 0.284 |
| 12 weeks | −3.37 (−5.21 to −1.53) | −1.28 (−3.11 to 0.55) | −1.99 (−4.50 to 0.51) p = 0.119 | −3.60 (−5.40 to −1.80) | −1.23 (−2.96 to 0.50) | −2.34 (−4.76 to 0.07) p = 0.057 | 0.842 | |
| 24 weeks | −2.86 (−4.68 to −1.05) | −2.12 (−3.92 to −0.31) | −0.67 (−3.14 to 1.80) p = 0.596 | −2.99 (−4.78 to −1.20) | −1.21 (−2.94 to 0.52) | −1.79 (−4.19 to 0.61) p = 0.144 | 0.524 | |
| HbA1c (%) | 4 weeks | 0.11 (−0.05 to 0.26) | −0.08 (−0.24 to 0.07) | 0.15 (−0.06 to 0.36) p = 0.156 | 0.09 (−0.07 to 0.26) | −0.11 (−0.26 to 0.05) | 0.16 (−0.05 to 0.36) p = 0.129 | 0.976 |
| 12 weeks | 0.11 (−0.04 to 0.26) | −0.33 (−0.49 to −0.18) | 0.41 (0.20 to 0.61) p < 0.001 | 0.05 (−0.11 to 0.22) | −0.20 (−0.36 to −0.04) | 0.22 (0.02 to 0.42) p = 0.034 | 0.205 | |
| 24 weeks | 0.00 (−0.16 to 0.15) | −0.47 (−0.62 to −0.32) | 0.43 (0.22 to 0.63) p < 0.001 | 0.01 (−0.15 to 0.18) | −0.21 (−0.36 to −0.05) | 0.18 (−0.02 to 0.38) p = 0.077 | 0.098 | |
Publisher’s Note: MDPI stays neutral with regard to jurisdictional claims in published maps and institutional affiliations. |
© 2022 by the authors. Licensee MDPI, Basel, Switzerland. This article is an open access article distributed under the terms and conditions of the Creative Commons Attribution (CC BY) license (https://creativecommons.org/licenses/by/4.0/).
Share and Cite
Sezai, A.; Tanaka, A.; Imai, T.; Kida, K.; Sekino, H.; Murohara, T.; Sata, M.; Suzuki, N.; Node, K., on behalf of CANDLE Trial Investigators. Comparing the Effects of Canagliflozin vs. Glimepiride by Body Mass Index in Patients with Type 2 Diabetes and Chronic Heart Failure: A Subanalysis of the CANDLE Trial. Biomedicines 2022, 10, 1656. https://doi.org/10.3390/biomedicines10071656
Sezai A, Tanaka A, Imai T, Kida K, Sekino H, Murohara T, Sata M, Suzuki N, Node K on behalf of CANDLE Trial Investigators. Comparing the Effects of Canagliflozin vs. Glimepiride by Body Mass Index in Patients with Type 2 Diabetes and Chronic Heart Failure: A Subanalysis of the CANDLE Trial. Biomedicines. 2022; 10(7):1656. https://doi.org/10.3390/biomedicines10071656
Chicago/Turabian StyleSezai, Akira, Atsushi Tanaka, Takumi Imai, Keisuke Kida, Hisakuni Sekino, Toyoaki Murohara, Masataka Sata, Norio Suzuki, and Koichi Node on behalf of CANDLE Trial Investigators. 2022. "Comparing the Effects of Canagliflozin vs. Glimepiride by Body Mass Index in Patients with Type 2 Diabetes and Chronic Heart Failure: A Subanalysis of the CANDLE Trial" Biomedicines 10, no. 7: 1656. https://doi.org/10.3390/biomedicines10071656