Evolutionary Rate Heterogeneity and Functional Divergence of Orthologous Genes in Pyrus


1
Key Laboratory of Cultivation and Protection for Non-Wood Forest Trees, Ministry of Education, Central South University of Forestry and Technology, Changsha 410004, China
2
School of Life Sciences, Anhui Agricultural University, Hefei 230036, China
3
College of Landscape and Ecological Engineering, Hebei University of Engineering, Handan 056038, China
*
Authors to whom correspondence should be addressed.
Biomolecules 2019, 9(9), 490; https://doi.org/10.3390/biom9090490
Submission received: 23 May 2019
/
Revised: 9 September 2019
/
Accepted: 12 September 2019
/
Published: 16 September 2019
(This article belongs to the Section Bioinformatics and Systems Biology)
Abstract
:Negatively selected genes (NSGs) and positively selected genes (PSGs) are the two types of most nuclear protein-coding genes in organisms. However, the evolutionary rates and characteristics of different types of genes have been rarely understood. In the present study, we investigate the rates of synonymous substitution (Ks) and the rates of non-synonymous substitution (Ka) by comparing the orthologous genes of two sequenced Pyrus species, Pyrus bretschneideri and Pyrus communis. Subsequently, we compared the evolutionary rates, gene structures, and expression profiles during different fruit development between PSGs and NSGs. Compared with the NSGs, the PSGs have fewer exons, shorter gene length, lower synonymous substitution rates and have higher evolutionary rates. Remarkably, gene expression patterns between two Pyrus species fruit indicated functional divergence for most of the orthologous genes derived from a common ancestor, and subfunctionalization for some of them. Overall, the present study shows that PSGs differs from NSGs not only under environmental selective pressure (Ka/Ks), but also in their structural, functional, and evolutionary properties. Additionally, our resulting data provides important insights for the evolution and highlights the diversification of orthologous genes in two Pyrus species.
1. Introduction
It is well known that neutral genes, negatively selected genes (NSGs), and positively selected genes (PSGs) are the three types of all nuclear protein-coding genes in organisms [1]. By comparing the rates of synonymous substitution (Ks) and the rates of non-synonymous (Ka), researchers can identify the differentiating gene type. In general, Ka/Ks > 1 indicates positive selection, and Ka/Ks < 1 is potential evidence for negative selection. Certainly, Ka/Ks = 1 may provide evidence of neutral evolution during gene sequence divergence [2]. However, the evolutionary forces of non-synonymous and synonymous substitution rates are still excluded. Fortunately, previous studies have elucidated their relationship with the physical location of gene, gene type, mutation rates, and guanine–cytosine (GC) content [3,4,5,6,7,8]. These studies also provided a basis for our comparisons of the functional characteristics of the orthologous genes between Pyrus bretschneideri Rehd. Dangshansuli and Pyrus communis L. Bartlett.
To further understand the gene frequencies under different selection patterns, previous studies were performed on the rate of divergence between Drosophila and its close relatives [9,10]. The evolution of non-reproductive-related proteins was relatively slower than reproductive proteins [9,10]. More than 10% of male reproductive proteins have higher Ka/Ks values (i.e., Ka/Ks > 1) [11], the best explanation of which is positive selection [12,13]. In primates, researchers also found similar results [14]. Other strong candidates for positive selection (i.e., fast-evolving genes) were found, such as immune system genes, major histocompatibility complex genes, and mammalian olfactory receptors [15,16,17,18]. In the genome, the overall PSGs accounted for only 0.5% to 5.3% of the whole gene [19]. This is reasonable because mutations in non-synonymous sites are largely considered harmful, so most of them will be rapidly lost during evolution, which leads to lower Ka and lower Ka/Ks ratio. This largely explains why most genes are always evolving under purification/negative selection [3,20,21,22,23]. Compared to animal studies, the genome-wide analysis of gene variation rates is still quite limited in plants, mainly because most higher plants have experienced one or more genome-wide duplication events [24], which leads to a difficult identification of the real orthologous gene [2]. So far, some studies have been conducted on evolutionary rates using orthologous genes of A. thaliana and A. lyrata [25,26], of Brassica rapa and Brassica oleracea [3], and of G. max and G. soja [4]. These results were helpful to understand the underlying mechanisms in which evolutionary rates and genes were interrelated. However, the functional divergence in orthologous genes of P. bretschneideri and P. communis has not been studied. Therefore, the evolutionary fate of these orthologous genes that evolved from the same ancestor is largely unknown.
As major members of the Rosaceae family, P. bretschneideri and P. communis are not only the third kind of fruit of economic plants after apple and grape, but also have important ornamental value. Recently, whole genome sequencing work for these two kinds of pears has been completed [27,28], providing useful data material for the comparative genomics research between similar species. P. bretschneideri and P. communis diverged between 6.6 and 3.3 million years ago (MYA) [29]. The genome size of P. bretschneideri [27] and P. communis [28] is 527 Mbp with 42,341 genes and 577 Mbp with 43,419 genes, respectively. Comparative genomics studies indicate that the pear genome has undergone two genome-wide duplication events [27]. Moreover, chromosomal evolution studies show that nine ancestral chromosomes are not only the origin of the Maloideae, but also the ancestors of the whole Rosaceae family [27]. In terms of fruit flesh quality, P. communis has melted flesh, while P. bretschneideri has crisp flesh. The pathways that affect their flesh may be lignin and sorbitol metabolic pathways [27,29,30,31,32]. Therefore, the identification of orthologous genes and the expression analysis of the pear during fruit development stage may help further understanding of the difference in fleshy qualities between P. communis and P. bretschneideri, and provide a new way to improve the quality of pear fruit.
2. Materials and Methods
2.1. Data Source and Orthologous Estimation
The genome sequences and gene function annotation files for Chinese pear (P. bretschneideri) and European pear (P. communis) were obtained from the Pear Genome Project (http://peargenome.njau.edu.cn/), and GDR databases (https://www.rosaceae.org), respectively. The P. communis genome was used as a reference, and then the orthologous genes of P. bretschneideri and P. communis were determined by MCScan (version 1.1) [33] with an E-value of 1 × 10⁻⁵. MUSCLE (version 3.8.31) was used to execute the protein alignments with default parameters [34]. Kaks_calculator (version 2.0) was used to estimate the Ka, Ks, and Ka/Ks values with NG method [35].
2.2. Gene Structure Analysis
Frequency of optimal codons (FOP) is the ratio of optimal codons to synonymous codons. Codon bias index (CBI) is a measure of codon usage bias according to the codon usage of a specific reference set of genes. Codon adaptation index (CAI) is a measure of the relative adaptiveness for each codon with respect to the codon usage of a reference set of highly expressed genes. We calculated statistics, including exon number, exon length, FOP, CBI, and the CAI, as estimated by CodonW (version 1.4.4) (http://www.mybiosoftware.com/codonw-1-4-4-codon-usage-analysis.html) with preferred codons in P. bretschneideri using default parameters.
2.3. Expression Profile Analysis
To further understand the functional divergence of orthologous gene pairs during pear fruit development, the raw RNA-seq reads from both of P. bretschneideri and P. communis fruit development were downloaded from the SRA (short-read archive) database of NCBI (PRJNA299117). The pipeline Fastq clean was used to remove low-quality base-calls (minimal mean Phred quality 20) of raw RNA-seq reads and trimmed [36]. The pipeline Tophat2 (version 2.1.0) was used to map clean readings to the P. bretschneideri and P. communis reference genome, respectively [37]. TopHat2 (version 2.1.0) parameters “read gap length”, “read edit distance” and “allowed mismatches” were set at 4. Cufflinks (version 2.2.1) was used to detect the differentially expressed genes using FPKM (Fragments Per Kilobase per Million) with default parameters [38]. R (version 3.4.1) was used to draw the heatmap of the orthologous gene pair expression [39].
2.4. Statistical Tests and Functional Divergence Analysis
SPASS (version 22.0) was used for statistical analysis. Pearson’s correlation coefficient was used to evaluate the similarity between the expression profiles of each orthologous gene pair. We proposed significant values to check the degree of expression diversity: i.e., r > 0.5 for non-divergence, 0.3 < r < 0.5 for ongoing-divergent, and r < 0.3 for divergence [40,41].
3. Results
3.1. Identification of Orthologous Gene Pairs
It is well known that orthologous gene pairs may have similar functions. To detect the orthologous gene pairs of P. bretschneideri and P. communis, MCScan software was executed with E-value cut off 10−5. Subsequently, we observed the near-linear distribution of homologous regions for all 17 corresponding chromosomes between both pear genome of P. bretschneideri and P. communis (Figure S1). Ultimately, we identified 6422 orthologous gene pairs (Figure S2) and found that they belong to 630 homologous blocks. Remarkably, we found that the nucleotide sequences of 259 orthologous gene pairs were identical, so these gene pairs were excluded from further analysis.
3.2. Distribution of Ka/Ks, Ks, and Ka, and Their Correlations in Pyrus
In the current study, 6163 orthologous gene pairs of both pear genome of P. bretschneideri and P. communis were used for analysis. We calculated the Ka, Ks, and Ka/Ks of these orthologous gene pairs by using KaKs_calculator software. The Ks values of 99 gene pairs were more significant than 0.3, so these gene pairs were discarded because of the risk of saturation or misalignment. According to the value of Ks and Ka, 6064 orthologous gene pairs were mainly divided into two categories: 5460 negatively selected genes (Ka/Ks < 1); 323 positively selected genes (Ka/Ks > 1); and no neutrally evolved genes (Ka/Ks = 1) (Table S1). The remaining orthologous gene pairs might represent a specific type of gene set in the Pyrus genome because either Ks or Ka, or both, were zero. Based on the values of Ka and Ks, we further speculate that there are three forms of selection of these genes: strongly negative selection (Ka = Ks = 0: meaning these genes are strongly constrained); positive selection (Ka ≠ 0; Ks = 0); and negative selection (Ka = 0; Ks ≠ 0).
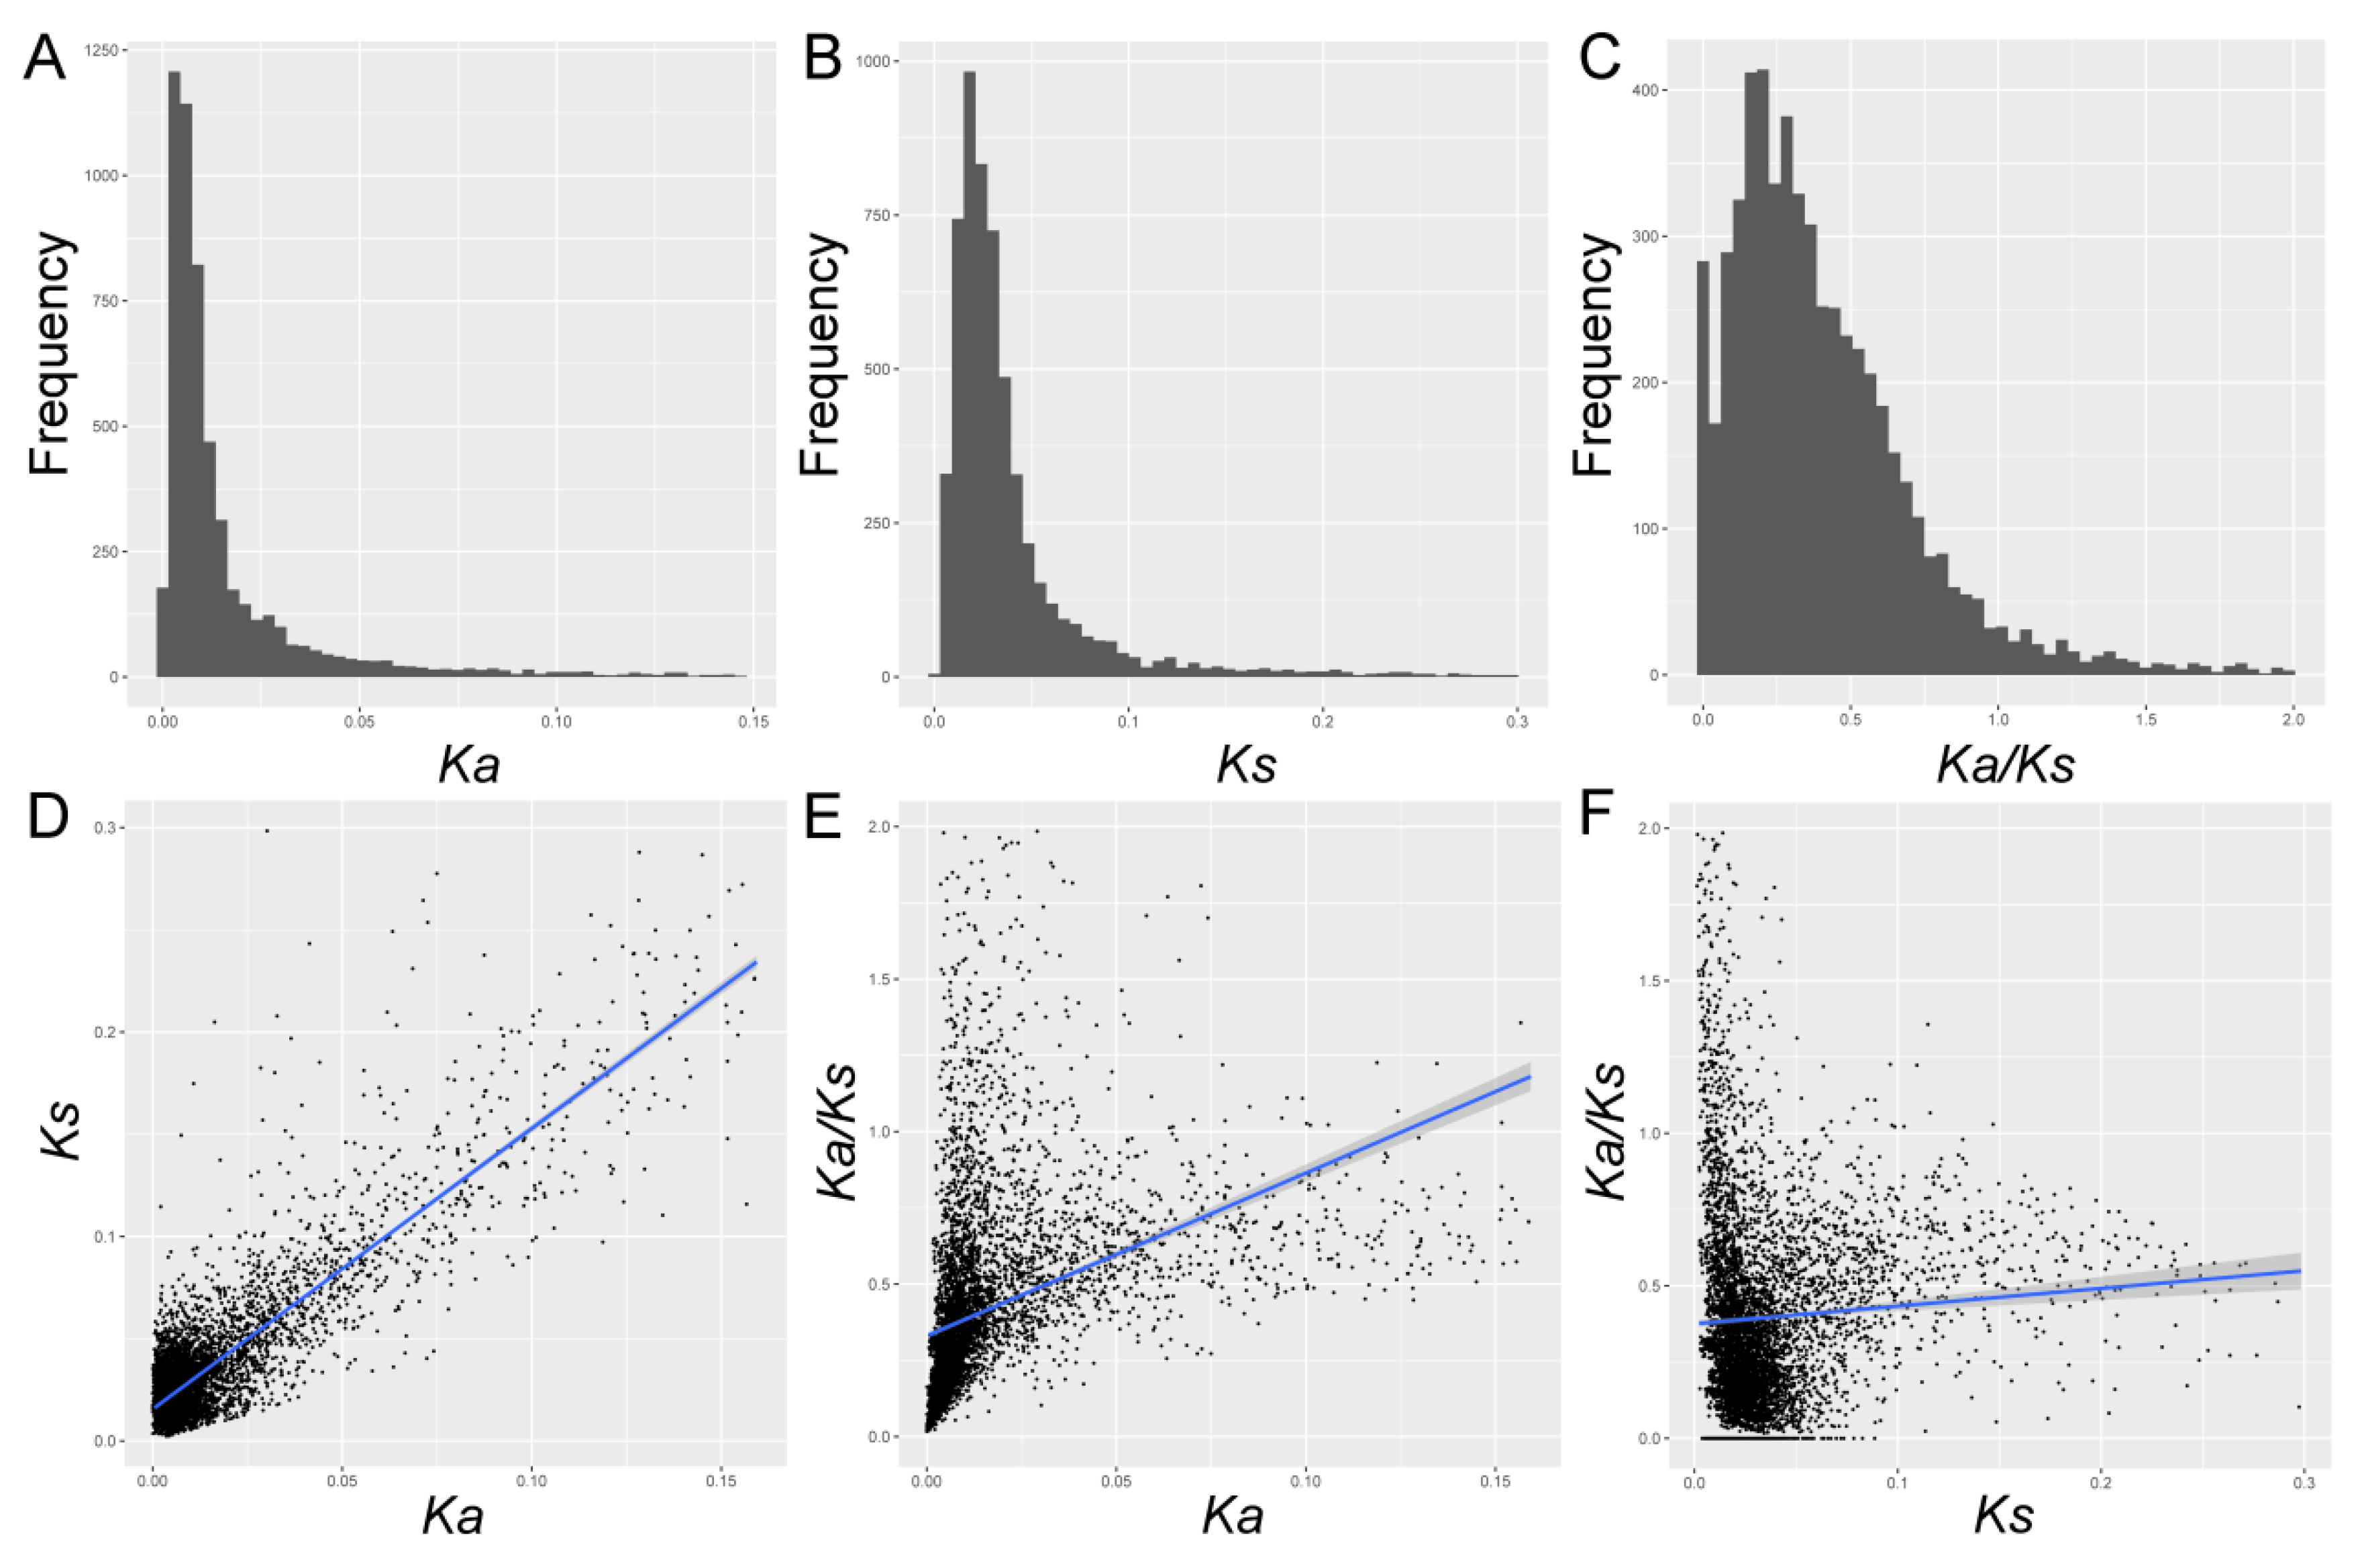
Ka/Ks, Ks, and Ka were estimated for each gene pair. To sum up, the average value of Ks was 0.019, with a range of 0 to 0.3. The Ka estimates varied from 0 to 0.15, with an average value of 0.011. 90% of Ka/Ks ranged from 0.003 to 0.920, with a mean of 0.271 (Figure 1 and Table S2). In this study, we found that both Ks and Ka values in Pyrus were significantly lower (Mann–Whitney U test, p < 0.001), while they contained higher Ka/Ks values. These results indicated that these genes might undergo lower selective pressure, evolving at a lower evolutionary rate. Additionally, we also established the relationships of Ka/Ks, Ka, and Ks in Pyrus. We found that the Ka increases gradually with the increase of Ks, as shown in Figure 1, with the r = 0.75, p < 10−10 (Spearman’s rank correlation). This data was basically consistent with that in Brassica (r = 0.14) [3], soybean (r = 0.22) [4], and Arabidopsis (r = 0.21) [26], although there was slight difference in their degree of correlation, suggesting that the mechanisms affecting both Ka and Ks sites might share in different genomes. Additionally, the Ka/Ks ratio was positively correlated with both Ks (r = 0.34, p < 10−10) and Ka (r = 0.13, p < 10−10). The correlation between Ka and Ka/Ks was greater than Ks, which indicated that Ka might be a determinant factor for Ka/Ks.
3.3. Ka, Ks, and Exon Characteristics Between PSGs and NSGs
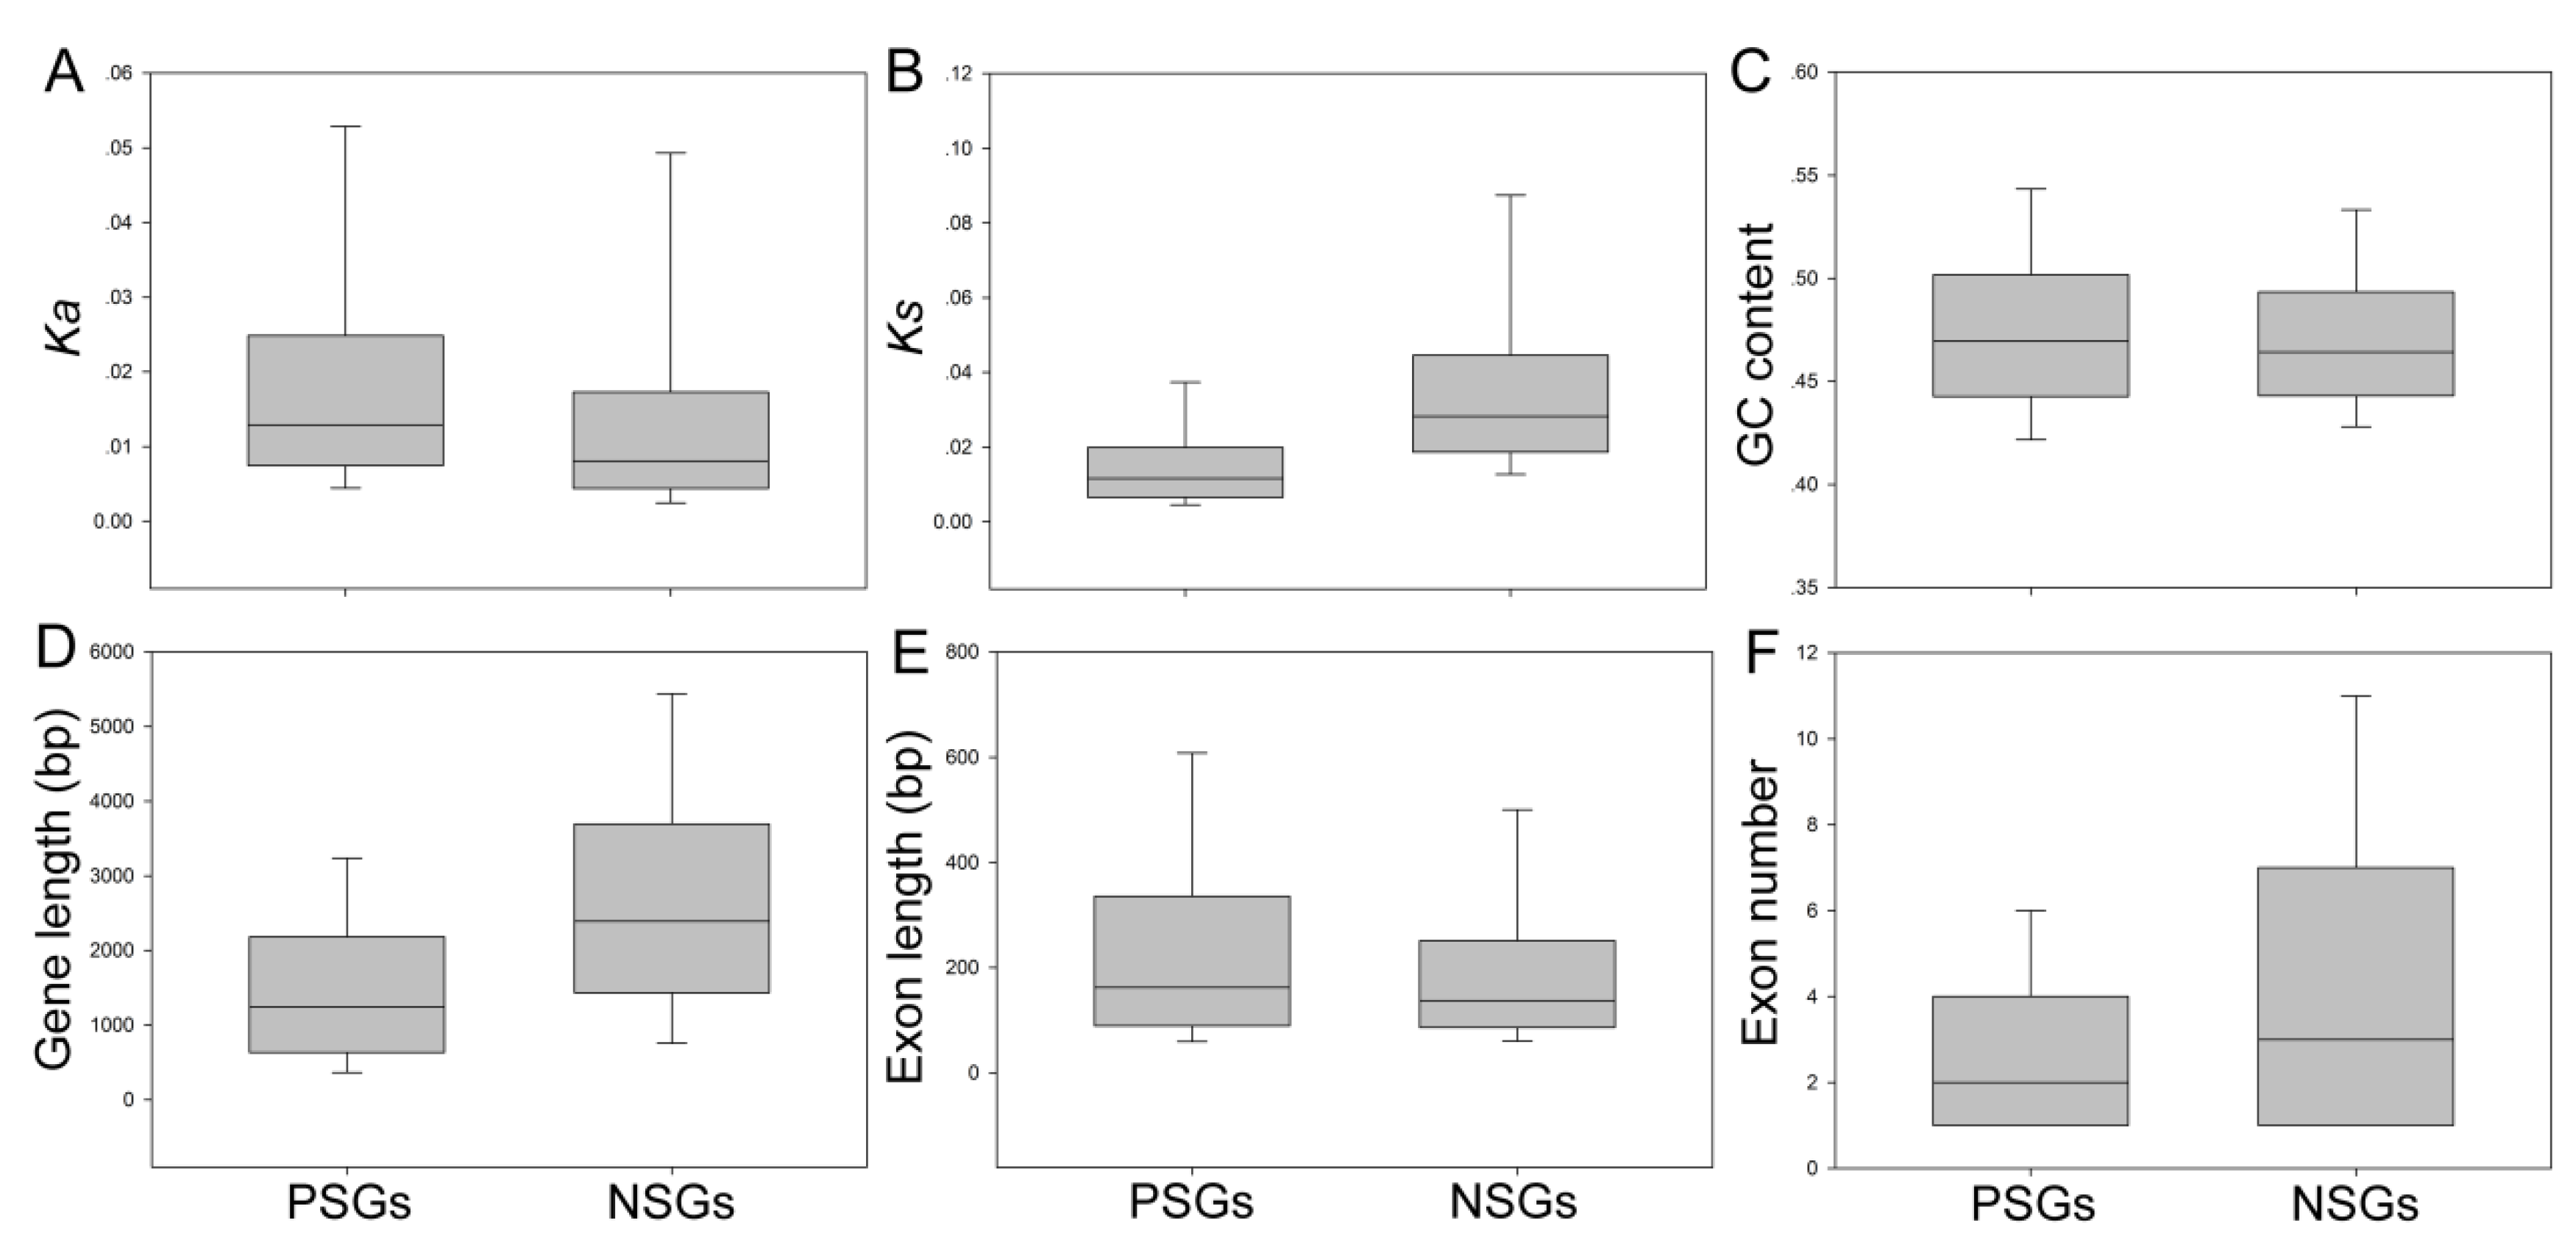
To understand the differences in evolutionary rates between PSGs and NSGs, the Ka and Ks values for each different gene set were estimated separately. The average ratio of Ks for NSGs in Pyrus was 0.0276 ± 0.0026, which was two-fold higher than the average ratio of PSGs of 0.0105 ± 0.0076 (Figure 2 and Table S3). On the contrary, we found that the overall Ka for NSGs was 0.0081, which was lower than the overall value of PSGs of 0.0130 ± 0.0083 (Figure 3 and Table S3). These results have also been supported by previous studies [3]. In the present study, to understand the evolutionary rates between NSGs and PSGs, we also investigated the distributions of Ks and Ka. We scanned that the NSGs and PSGs both contain a Ka peak, but the peak of NSGs was much than lower than that of PSGs (Figure S3). On the contrary, most of the Ks values of PSGs were close to 0.01, and most of the Ks values of NSGs are concentrated in the 0.04–0.14 range and some are even higher (Figure S3).
To determine whether gene structure is affected by selective modes and evolutionary rates, we characterized the genetic characteristics for individual Pyrus orthologs, such as GC content, exon number, exon length, and gene length (Figure 2). These results revealed that PSGs in P. bretschneideri contained fewer exons (average 2 versus 3), higher exon length (average 160.773 bp versus 132.007 bp), and a significantly shorter gene length (average 1255.88 bp versus 2352.33 bp; Mann–Whitney U test, p < 0.001) than NSGs (Figure 2 and Table S3). Remarkably, we did not detect any difference in GC content between PSGs and NSGs (Figure 2 and Table S3).
3.4. Lower Expression Level for PSGs Than NSGs
The evolutionary rates were usually associated with gene expression, such as the level of gene expression during pear fruit development. To further understand the difference in expression patterns between NSGs and PSGs, the RNA-seq data were used to estimate each gene expression level during pear fruit development [42]. Meanwhile, the previous studies had indicated that the orthologous genes were classified into two groups, including strongly expressed genes (i.e., FPKM ≧ 50) and weakly expressed genes (i.e., FPKM ≦ 3) [43]. These data indicated that the expression level of NSGs was overall much higher than PSGs (Figure S4). Subsequently, we found that 29.23% of NSGs were weakly expressed, and 9.97% of them contained a high expression level. On the contrary, only 4.26% of PSGs were highly expressed, and 55.4% of them were expressed at a very low level (Table S4). In general, the Ka/Ks values of both between PSGs and NSGs were different, so we have explored the correlation between the Ka/Ks values and the expression patterns. First, the Ka/Ks values from P. bretschneideri to P. communis orthologous and correlated them with expression level were collected. The significantly negatively correlated was found among the Ka/Ks values and expression level. Because the Ka/Ks has a certain relationship with Ka and Ks, so we concluded that the expression patterns were related to them (i.e., Ka, Ks and Ka/Ks). These results are also consistent with previous studies on Brassica and Arachis [3,44].
3.5. Codon Bias Analysis of PSGs and NSGs
Codon bias refers to the different use frequency of synonymous codons in a wide variety of organisms [45,46,47]. To gain insight into whether PSGs and NSGs contain codon bias, we estimated the CBI, the CAI, as well as frequency of optimal codons (FOP), respectively. Compared with NSGs, PSGs have shown consistently higher codon bias for the three codons (i.e., CBI, CAI, and FOP) bias parameters as shown in Table S5. To determine the relationship between codon bias and genetic characteristics, we performed correlation analysis between them. There was a correlation between CBI, CAI, and Ka/Ks. Exon length and/or gene length were negatively correlated with CAI, FOP, and/or CBI. There was a positive correlation between exon number and CAI but negatively correlated with CBI and FOP. GC content was negatively correlated with CAI but was positively correlated with CBI and FOP. There was a positive correlation between expression level and CBI but was negatively correlated with CAI and FOP (Table S6).
3.6. Gene Expression Patterns in Pyrus Fruit Revealed Subfunctionalization and Functional Redundancy for the Related to Fruit Quality Genes
Orthologous gene pairs may have similar expression profiles. To detect the degree of expression diversity between orthologous genes in P. bretschneideri and P. communis, their expression correlations were calculated. We found 25.6% orthologous gene pairs to be non-divergent, and 12.7% of orthologous gene pairs to be ongoing-divergent (Table S7). In combination with these analyses, it was found that significant functional divergence has occurred of orthologous genes between both P. bretschneideri and P, communis.
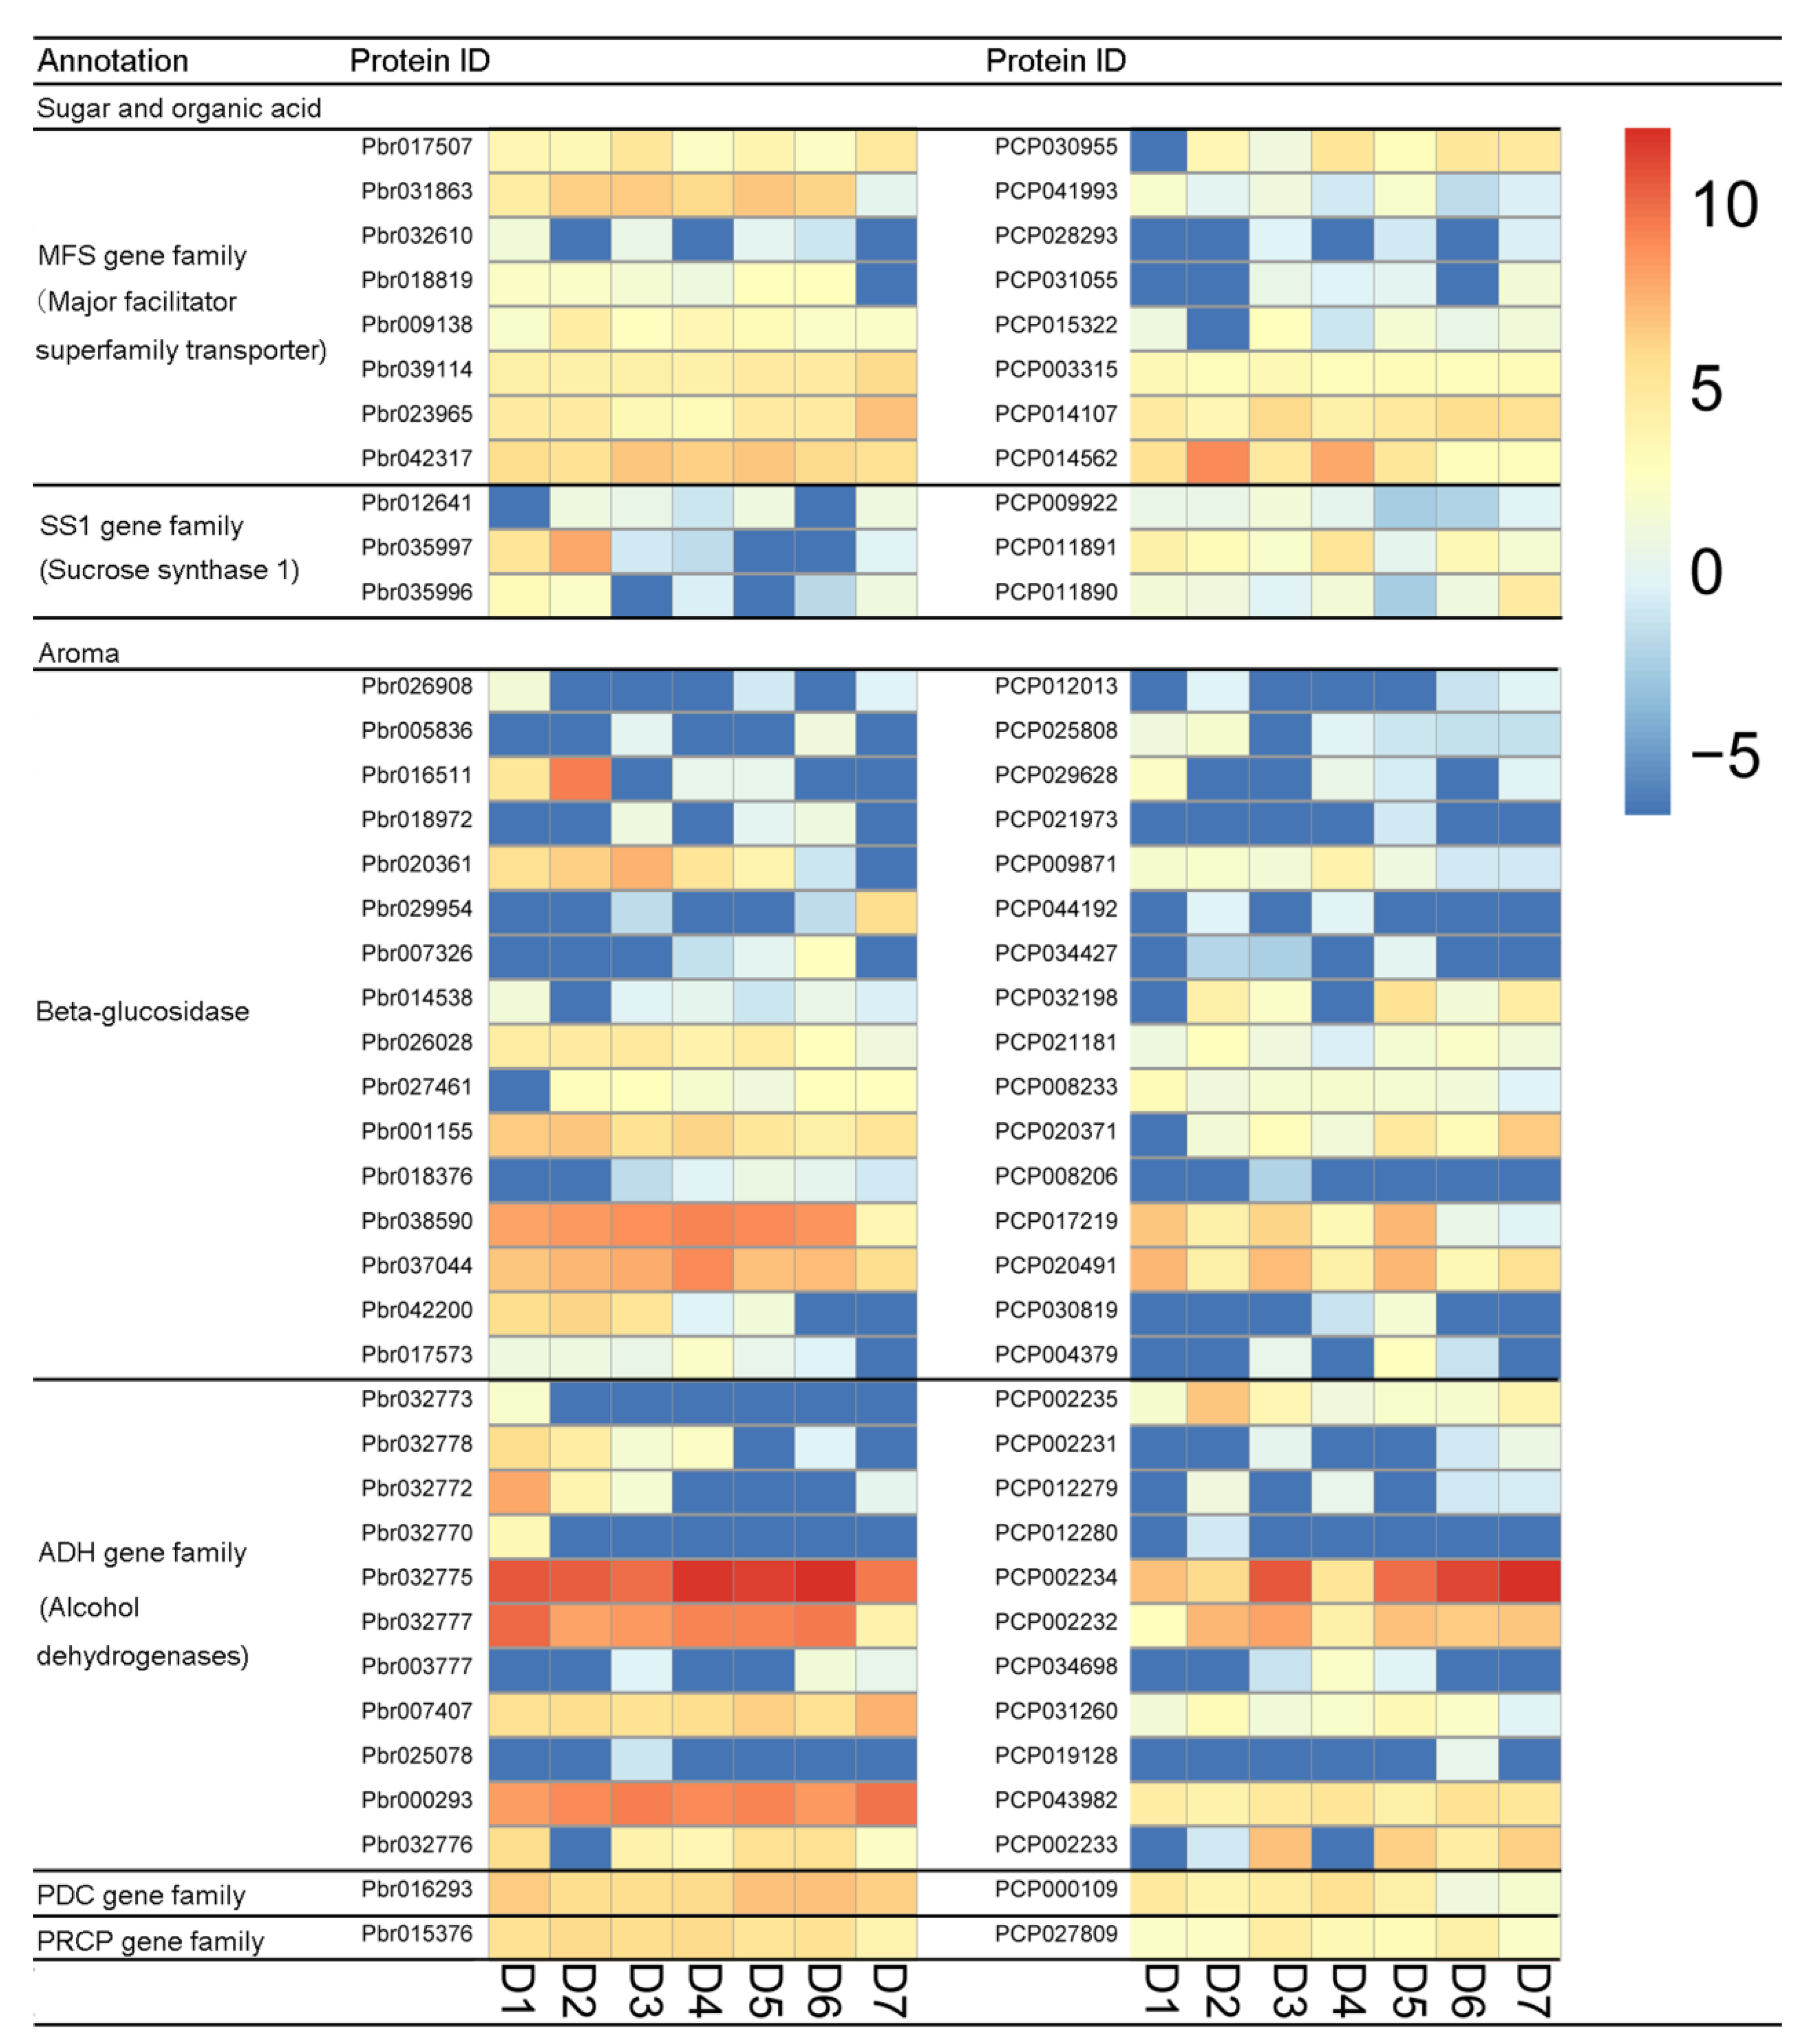
Previous studies have shown that sugar, aroma, organic acid, and lignin are important factors affecting the quality of pear fruit [32]. P. bretschneideri and P. communis fruit quality differs. For example, P. communis has melted flesh, and P. bretschneideri has crisp flesh. To explore the effect of orthologous genes on pear quality, this study identified the gene families related to pear quality, such as MFS gene family, ADH gene family, and PDC gene family (Table S8). Subsequently, the expression profiles of these gene family members were analyzed in both P. communis and P. bretschneideri fruit. In the MFS gene family, we found that all eight orthologous gene pairs were divergent (Figure 3). Remarkably, Pbr031863 has shown high expression levels in almost all periods, while its corresponding orthologous gene (PCP041993) exhibits low levels of expression. In the SS1 gene family, we found that all three orthologous gene pairs were divergent, and only one duplicate gene pair (Pbr037395/PCP029644) was found to be non-divergent. In the Beta-glucosidase gene family, three out of 16 orthologous gene pairs were ongoing-divergent, seven out of 17 orthologous gene pairs were non-divergent, but the remaining gene pairs were found to be divergent. In the ADH gene family, we found 11 out of 19 orthologous gene pairs to be divergent, with two orthologous gene pairs (Pbr32775/PCP002234 and Pbr032777/PCP002232) showing higher expression levels. Interestingly, the Pbr32775 and Pbr032777 were mainly expressed in the early or middle stage of fruit development, and its corresponding orthologous genes (PCP002234 and PCP002232) are mainly expressed at the later stage of fruit development. Additionally, Pbr016293/PCP000109 and Pbr015376/PCP027809 were also found to be divergent, which belong to the PDC gene family and PRCP gene family, respectively (Figure 3). The lignin content is also an essential factor affecting the taste of pear fruit [48,49], so we also analyzed the expression diversity of the gene family members involved in lignin biosynthesis, such as PAL, C3H, PRX, 4CL, HCT, CAD, COMT, CCoAOMT, and CCR genes. In the present study, we found Pbr008387/PCP019735 (which belong to PAL gene family members), Pbr022402/PCP013799 (which belong to CCR gene family members), Pbr024792/PCP008177 (which belong to HCT gene family members) and Pbr010872/PCP026787 (which belong to HCT gene family members) were also found to be divergent (Figure S5). Remarkably, PCP013799 were more highly expressed than Pbr022402 in almost all periods, indicating these genes that these genes may play an essential role during pear fruit development.
4. Discussion
Surprisingly, there are few studies to describe the evolutionary rate variation and gene expression diversity by comparing orthologous gene pairs, which closely related to plant nuclear genes. Several current studies on this aspect are relatively small samples, but small sample studies are exclusive. For example, Tiffin and Hanada (2009) analyzed 218 orthologous gene pairs between Brassica rapa and Arabidopsis thaliana [50]; Zhang et al. (2002) studied 242 paralogous gene pairs in Arabidopsis thaliana [2]; Wright et al. (2004) identified 83 orthologous between Arabidopsis thaliana and Arabidopsis lyrata [51]. Recently, several large sample studies have been implemented; for example, Guo et al. (2017) analyzed 23,817 orthologous gene pairs between Brassica rapa and Brassica oleracea [3]. Although several studies have characterized the functional relationships among multiple species of orthologous gene pairs [52]. Up to now, there have been no studies on the functional features of orthologous genes of P. bretschneideri and P. communis. Additionally, we also explored the reasons for the differences in the quality of pear fruit from the transcriptome level for the first time.
In the present study, the Pyrus species were used as a fruit model system, and 5978 orthologous gene pairs were identified between P. bretschneideri and P. communis. The Ka/Ks analysis showed that these genes could be divided into two types, namely NSG (Ka/Ks < 1) and PSG (Ka/Ks > 1). Subsequently, we observed several interesting phenomena, including: (a) PSGs in Pyurs demonstrated four-fold lower Ks values and two-fold higher Ka; (b) PSGs contained two-fold fewer exons and two-fold shorter gene/exon lengths than NSGs; (c) PSGs genes were very weakly expressed during pear fruit development than NSGs; (d) Gene expression patterns indicated that orthologous genes have different functions, which might be responsible for differences in fruit quality between P. bretschneideri and P. communis. Our results show that NSGs and PSGs were not only in the selection pressure but also in gene characteristics, evolutionary rates and expression patterns were also different and were consistent with the results of previously published papers [3]. These data indicate that such selective patterns might be shared in some plants, such as pear, Brassica rapa, and Arabidopsis thaliana.
Previous studies have shown that the Ks of NSGs is much higher than PSGs [3]. In the present study, this phenomenon was also found, which might be due to PSGs with strong codon bias being weakly expressed. These properties might reduce the synonymous mutation rates of PSGs, which ultimately lead to smaller Ks values. This might also be the stronger codon usage that could improve the efficiency of translation since the use of codons that match most tRNA can reduce the time between finding and binding the correct tRNA [53]. In addition, we found that PSGs contained much shorter exon length and gene length than NSGs. These results have also been verified in Brassica rapa, Arabidopsis thaliana, Caenorhabditis elegans, and Drosophila melanogaster [3,40,53]. Remarkably, there is a strong negative correlation between protein length and codon usage, further supporting the previous view that the selective model may be a key factor for gene properties. Some of the previous studies have explained the relationship between gene expression and gene structure. For example, these genes, which contained shorter, fewer introns/exons and shorter coding region, were highly expressed in humans [3,54,55,56,57]. According to these studies, three factors (i.e., genomic design, mutation bias and transcriptional efficiency) could explain the compact gene structure. In monocot species of O. sative and dicot species of A. thaliana, highly expressed genes were reported to contain longer gene transcripts [58]. The resulting contrasts between plants and animals could be explained by the outcome of selective forces and different turns after their splits [58]. Since the correlation of gene structure and gene expression was different among different genomes, the elective modes might serve as an alternative indicator for gene compactness, as proposed in the present study. As shown in Table S1, PSGs in P. bretschneideri contained shorter gene length and lower intron/exon numbers than NSGs. The pattern analyses of positive selection were carried out in mammalian genomes [59]. Previous studies have shown that expression patterns of PSGs in mammals and plant genomes were very similar, such as expressed at lower levels [3,59]. In fact, the relationship between gene characteristics and selective modes still requires more genomic data to verify. Fruit development and ripening involves a series of physiological and biochemical changes, which was a highly coordinated and irreversible biological process [32]. Previous studies reported that the composition and content of soluble sugars were significant factors affecting pear fruit quality [32,33,34]. It is well known that there are differences in fruit quality between P. bretschneideri and P. communis. To understand these differences, the related gene families of pear fruit quality were identified, such as MFS gene family, ADH gene family, and PDC gene family. Previous studies suggested that orthologous gene pairs might have similar expression patterns or functions [30,40]. In our research, the degree of expression diversity of orthologous gene pairs was estimated between P. bretschneideri and P. communis. Subsequently, we found that most orthologous gene pairs were diverged. Among them, some genes were expressed more highly in P. bretschneideri, compared to their orthologous genes in P. communis, such as Pbr000274 and Pbr024748 (which belong to MFS gene family members), Pbr007408 and Pbr000293 (which belong to ADH gene family members) etc. At the same time, similar genes are also found in P. communis, such as PCP020491, PCP041912 (which belong to MFS gene family members). These expression patterns revealed functional redundancy for some orthologous genes derived from a common ancestor and subfunctionalization for some of them. The present study also might help us to further explore the differences between the fruit quality of P. bretschneideri and P. communis. In conclusion, our finding provides a strong foundation for future research on gene function and breeding, which will help improve fruit quality.
Supplementary Materials
The following are available online at https://www.mdpi.com/2218-273X/9/9/490/s1, Figure S1: Inter-genome synteny for the Pyrus bretschneideri and Pyrus communis. Synteny between Pyrus bretschneideri and Pyrus communis shows 6422 gene pairs, Figure S2: Synteny relationships of orthologous gene pairs between Pyrus bretschneideri and Pyrus communis. Pyrus bretschneideri and Pyrus communis chromosomes were represented by yellow and green, respectively. The grey lines indicated orthologous relationships between Pyrus bretschneideri and Pyrus communis. Figure S3: Density distributions Ka (a), Ks (b), GC content (c) and gene length (d). Positively selected genes (PSGs) and negatively selected genes (NSGs) were represented by red and green lines, respectively. Figure S4: Frequency distributions of expression levels in Pyrus communis during fruit development. Figure S5: Expression divergence analysis of orthologous lignin-related genes among Pyrus bretschneideri and Pyrus communis. D1, D2, D3, D4, D5, D6 and D7 indicates 15 days after full blooming (15 DAB), 30 DAB, 55 DAB, 85 DAB, 115 DAB, mature stage, and fruit senescence stage. Table S1: Features of Ka/Ks in 6064 orthologs between Pyrus bretschneideri and Pyrus communis. Table S2: Evolutionary rates for 6064 orthologs between Pyrus bretschneideri and Pyrus communis. Table S3: Comparisons between positively selected genes (PSGs) and negatively selected genes (NSGs) in Pyrus bretschneideri. Table S4: Comparisons of expression patterns between positively selected genes (PSGs) and negatively selected genes (NSGs) in Pyrus bretschneideri. Table S5: Codon bias comparisons between PSGs and NSGs in Pyrus bretschneideri. Table S6: Correlation analysis between codon bias and gene properties in Pyrus bretschneideri. Table S7: Functional divergence analysis of orthologous genes among Pyrus bretschneideri and Pyrus communis. Table S8: Functional annotation of PSGs and NSGs in Pyrus bretschneideri.
Author Contributions
Y.C. (Yunpeng Cao) designed and performed the experiments; Y.C. (Yunpeng Cao), L.W., L.J. and Y.C. (Yongping Cai) analyzed the data; Y.C. (Yunpeng Cao) and L.J. contributed reagents/materials/analysis tools; Y.C. (Yunpeng Cao) and L.J. wrote the paper. All authors reviewed and approved this submission.
Funding
This study was supported by The National Natural Science Foundation of China (grant 31640068).
Acknowledgments
We extend our thanks to the reviewers and editors for their careful reading and helpful comments on this manuscript. The genome sequences of Pyrus bretschneideri and Pyrus communis were obtained from GigaDB database (http://gigadb.org/site/index), GDR database (www.rosaceae.org/), respectively.
Conflicts of Interest
The authors declare no commercial or financial conflict of interest. The Funding bodies were not involved in the design of the study and collection, analysis, and interpretation of data and in writing the manuscript.
References
- Yang, Z. The power of phylogenetic comparison in revealing protein function. Proc. Natl. Acad. Sci. USA 2005, 102, 3179–3180. [Google Scholar] [CrossRef] [PubMed] [Green Version]
- Zhang, L.; Vision, T.J.; Gaut, B.S. Patterns of nucleotide substitution among simultaneously duplicated gene pairs in Arabidopsis thaliana. Mol. Biol. Evol. 2002, 19, 1464–1473. [Google Scholar] [CrossRef] [PubMed]
- Guo, Y.; Liu, J.; Zhang, J.; Liu, S.; Du, J. Selective modes determine evolutionary rates, gene compactness and expression patterns in brassica. Plant J. 2017, 91, 34–44. [Google Scholar] [CrossRef] [PubMed]
- Du, J.; Tian, Z.; Sui, Y.; Zhao, M.; Song, Q.; Cannon, S.B.; Cregan, P.; Ma, J. Pericentromeric effects shape the patterns of divergence, retention, and expression of duplicated genes in the paleopolyploid soybean. Plant Cell 2012, 24, 21–32. [Google Scholar] [CrossRef] [PubMed]
- Nei, M. Molecular evolutionary genetics; Columbia university press: New York, NY, USA, 1987. [Google Scholar]
- Wolfe, K.H.; Sharp, P.M.; Li, W.-H. Mutation rates differ among regions of the mammalian genome. Nature 1989, 337, 283–285. [Google Scholar] [CrossRef]
- Ticher, A.; Graur, D. Nucleic acid composition, codon usage, and the rate of synonymous substitution in protein-coding genes. J. Mol. Evol. 1989, 28, 286–298. [Google Scholar] [CrossRef] [PubMed]
- Matassi, G.; Sharp, P.M.; Gautier, C. Chromosomal location effects on gene sequence evolution in mammals. Curr. Biol. 1999, 9, 786–791. [Google Scholar] [CrossRef] [Green Version]
- Civetta, A.; Singh, R.S. High divergence of reproductive tract proteins and their association with postzygotic reproductive isolation in drosophila melanogaster and drosophila virilis group species. J. Mol. Evol. 1995, 41, 1085–1095. [Google Scholar] [CrossRef]
- Coulthart, M.; Singh, R.S. High level of divergence of male-reproductive-tract proteins, between drosophila melanogaster and its sibling species, d. Simulans. Mol. Biol. Evol. 1988, 5, 182–191. [Google Scholar]
- Swanson, W.J.; Yang, Z.; Wolfner, M.F.; Aquadro, C.F. Positive darwinian selection drives the evolution of several female reproductive proteins in mammals. Proc. Natl. Acad. Sci. 2001, 98, 2509–2514. [Google Scholar] [CrossRef]
- Tsaur, S.-C.; Wu, C.-I. Positive selection and the molecular evolution of a gene of male reproduction, acp26aa of drosophila. Mol. Biol. Evol. 1997, 14, 544–549. [Google Scholar] [CrossRef] [PubMed]
- Begun, D.J.; Whitley, P.; Todd, B.L.; Waldrip-Dail, H.M.; Clark, A.G. Molecular population genetics of male accessory gland proteins in drosophila. Genetics 2000, 156, 1879–1888. [Google Scholar] [PubMed]
- Wyckoff, G.J.; Wang, W.; Chung, W. Rapid evolution of male reproductive genes in the descent of man. Nature 2000, 403, 304. [Google Scholar] [CrossRef] [PubMed]
- Buck, L.; Axel, R. A novel multigene family may encode odorant receptors: A molecular basis for odor recognition. Cell 1991, 65, 175–187. [Google Scholar] [CrossRef]
- Klein, J.; Figueroa, F. Evolution of the major histocompatibility complex. Crit. Rev. Immunol. 1986, 6, 295–386. [Google Scholar] [CrossRef]
- Hughes, A.L. Adapt. Evol. Genes Genomes; Oxford University Press: Oxford, UK, 1999. [Google Scholar]
- Hughes, A.L.; Nei, M. Pattern of nucleotide substitution at major histocompatibility complex class i loci reveals overdominant selection. Nature 1988, 335, 167–170. [Google Scholar] [CrossRef] [PubMed]
- Fay, J.C.; Wu, C.-I. The neutral theory in the genomic era. Curr. Opin. Genet. Dev. 2001, 11, 642–646. [Google Scholar] [CrossRef]
- Hurst, L.D. The ka/ks ratio: Diagnosing the form of sequence evolution. TRENDS Genet. 2002, 18, 486–487. [Google Scholar] [CrossRef]
- Kondrashov, F.A.; Rogozin, I.B.; Wolf, Y.I.; Koonin, E.V. Selection in the evolution of gene duplications. Genome Boil. 2002, 3, research0008. 0001. [Google Scholar]
- Nielsen, R.; Bustamante, C.; Clark, A.G.; Glanowski, S.; Sackton, T.B.; Hubisz, M.J.; Fledel-Alon, A.; Tanenbaum, D.M.; Civello, D.; White, T.J. A scan for positively selected genes in the genomes of humans and chimpanzees. PLoS Biol. 2005, 3, e170. [Google Scholar] [CrossRef]
- Nei, M.; Suzuki, Y.; Nozawa, M. The neutral theory of molecular evolution in the genomic era. Ann. Rev. Genomics Human Genet. 2010, 11, 265–289. [Google Scholar] [CrossRef] [PubMed]
- Jiao, Y.; Wickett, N.J.; Ayyampalayam, S.; Chanderbali, A.S.; Landherr, L.; Ralph, P.E.; Tomsho, L.P.; Hu, Y.; Liang, H.; Soltis, P.S. Ancestral polyploidy in seed plants and angiosperms. Nature 2011, 473, 97. [Google Scholar] [CrossRef] [PubMed]
- Beilstein, M.A.; Nagalingum, N.S.; Clements, M.D.; Manchester, S.R.; Mathews, S. Dated molecular phylogenies indicate a miocene origin for arabidopsis thaliana. Proc. Natl. Acad. Sci. 2010, 107, 18724–18728. [Google Scholar] [CrossRef] [PubMed]
- Yang, L.; Gaut, B.S. Factors that contribute to variation in evolutionary rate among arabidopsis genes. Mol. Biol. Evol. 2011, 28, 2359–2369. [Google Scholar] [CrossRef] [PubMed]
- Wu, J.; Wang, Z.; Shi, Z.; Zhang, S.; Ming, R.; Zhu, S.; Khan, M.A.; Tao, S.; Korban, S.S.; Wang, H. The genome of the pear (pyrus bretschneideri rehd.). Genome Res. 2013, 23, 396–408. [Google Scholar] [CrossRef] [PubMed]
- Chagné, D.; Crowhurst, R.N.; Pindo, M.; Thrimawithana, A.; Deng, C.; Ireland, H.; Fiers, M.; Dzierzon, H.; Cestaro, A.; Fontana, P. The draft genome sequence of european pear (pyrus communis l.‘Bartlett’). PloS ONE 2014, 9, e92644. [Google Scholar] [CrossRef] [PubMed]
- Wu, J.; Wang, Y.; Xu, J.; Korban, S.S.; Fei, Z.; Tao, S.; Ming, T.; Tai, S.; Khan, A.M.; Postman, J.D.; et al. Diversification and independent domestication of Asian and European pears. Genome Biol. 2018, 19, 77. [Google Scholar] [CrossRef] [PubMed]
- Cao, Y.; Han, Y.; Li, D.; Lin, Y.; Cai, Y. Systematic analysis of the 4-coumarate:Coenzyme a ligase (4cl) related genes and expression profiling during fruit development in the chinese pear. Genes 2016, 7, 89. [Google Scholar] [CrossRef]
- Cao, Y.; Han, Y.; Meng, D.; Li, D.; Jin, Q.; Lin, Y.; Cai, Y. Structural, evolutionary, and functional analysis of the class iii peroxidase gene family in chinese pear (pyrus bretschneideri). Front Plant Sci. 2016, 7, 1874. [Google Scholar] [CrossRef]
- Li, J.M.; San Huang, X.; Li, L.T.; Zheng, D.M.; Xue, C.; Zhang, S.L.; Wu, J. Proteome analysis of pear reveals key genes associated with fruit development and quality. Planta 2015, 241, 1363–1379. [Google Scholar] [CrossRef]
- Wang, Y.; Tang, H.; DeBarry, J.D.; Tan, X.; Li, J.; Wang, X.; Lee, T.-h.; Jin, H.; Marler, B.; Guo, H. Mcscanx: A toolkit for detection and evolutionary analysis of gene synteny and collinearity. Nucleic Acids Res. 2012, 40, e49. [Google Scholar] [CrossRef]
- Edgar, R.C. Muscle: Multiple sequence alignment with high accuracy and high throughput. Nucleic Acids Res. 2004, 32, 1792–1797. [Google Scholar] [CrossRef]
- Wang, D.; Zhang, Y.; Zhang, Z.; Zhu, J.; Yu, J. Kaks_calculator 2.0: A toolkit incorporating gamma-series methods and sliding window strategies. Genom., Proteom. Bioinform. 2010, 8, 77–80. [Google Scholar] [CrossRef]
- Van der Auwera, G.A.; Carneiro, M.O.; Hartl, C.; Poplin, R.; del Angel, G.; Levy-Moonshine, A.; Jordan, T.; Shakir, K.; Roazen, D.; Thibault, J. From fastq data to high-confidence variant calls: The genome analysis toolkit best practices pipeline. Current protocols in bioinformatics 2013, 11.10. 11–11.10. 33. [Google Scholar]
- Kim, D.; Pertea, G.; Trapnell, C.; Pimentel, H.; Kelley, R.; Salzberg, S.L. Tophat2: Accurate alignment of transcriptomes in the presence of insertions, deletions and gene fusions. Genome Biol. 2013, 14, R36. [Google Scholar] [CrossRef]
- Trapnell, C.; Roberts, A.; Goff, L.; Pertea, G.; Kim, D.; Kelley, D.R.; Pimentel, H.; Salzberg, S.L.; Rinn, J.L.; Pachter, L. Differential gene and transcript expression analysis of rna-seq experiments with tophat and cufflinks. Nat. Protoc. 2012, 7, 562. [Google Scholar] [CrossRef]
- Goff, L.A.; Trapnell, C.; Kelley, D. Cummerbund: Visualization and exploration of cufflinks high-throughput sequencing data. R Packag. Version 2012, 2. [Google Scholar]
- Blanc, G.; Wolfe, K.H. Functional divergence of duplicated genes formed by polyploidy during arabidopsis evolution. Plant Cell 2004, 16, 1679–1691. [Google Scholar] [CrossRef]
- Yim, W.C.; Lee, B.-M.; Jang, C.S. Expression diversity and evolutionary dynamics of rice duplicate genes. Mol. Genet. Genom. 2009, 281, 483–493. [Google Scholar] [CrossRef]
- Zhang, M.-Y.; Xue, C.; Xu, L.; Sun, H.; Qin, M.-F.; Zhang, S.; Wu, J. Distinct transcriptome profiles reveal gene expression patterns during fruit development and maturation in five main cultivated species of pear (pyrus l.). Sci. Rep. 2016, 6, 28130. [Google Scholar] [CrossRef]
- Chen, X.; Zhu, W.; Azam, S.; Li, H.; Zhu, F.; Li, H.; Hong, Y.; Liu, H.; Zhang, E.; Wu, H. Deep sequencing analysis of the transcriptomes of peanut aerial and subterranean young pods identifies candidate genes related to early embryo abortion. Plant biotechnol. J. 2013, 11, 115–127. [Google Scholar] [CrossRef] [PubMed]
- Song, H.; Gao, H.; Liu, J.; Tian, P.; Nan, Z. Comprehensive analysis of correlations among codon usage bias, gene expression, and substitution rate in arachis duranensis and arachis ipa?Nsis orthologs. Sci. Rep 2017, 7, 14853. [Google Scholar] [CrossRef] [PubMed]
- Hershberg, R.; Petrov, D.A. Selection on codon bias. Ann. Rev. Genet. 2008, 42, 287–299. [Google Scholar] [CrossRef]
- Larracuente, A.M.; Sackton, T.B.; Greenberg, A.J.; Wong, A.; Singh, N.D.; Sturgill, D.; Zhang, Y.; Oliver, B.; Clark, A.G. Evolution of protein-coding genes in drosophila. Trends Genet. 2008, 24, 114–123. [Google Scholar] [CrossRef]
- Plotkin, J.B.; Kudla, G. Synonymous but not the same: The causes and consequences of codon bias. Nat. Rev. Genet. 2011, 12, 32. [Google Scholar] [CrossRef]
- Cai, Y.; Li, G.; Nie, J.; Lin, Y.; Nie, F.; Zhang, J.; Xu, Y. Study of the structure and biosynthetic pathway of lignin in stone cells of pear. Sci. Hortic. 2010, 125, 374–379. [Google Scholar] [CrossRef]
- Jin, Q.; Yan, C.; Qiu, J.; Zhang, N.; Lin, Y.; Cai, Y. Structural characterization and deposition of stone cell lignin in dangshan su pear. Sci. Hortic. 2013, 155, 123–130. [Google Scholar] [CrossRef]
- Hanada, K.; Kuromori, T.; Myouga, F.; Toyoda, T.; Li, W.-H.; Shinozaki, K. Evolutionary persistence of functional compensation by duplicate genes in arabidopsis. Genome Biol. Evol. 2009, 1, 409–414. [Google Scholar] [CrossRef]
- Wright, S.I.; Yau, C.K.; Looseley, M.; Meyers, B.C. Effects of gene expression on molecular evolution in arabidopsis thaliana and arabidopsis lyrata. Mol. Biol. Evol. 2004, 21, 1719–1726. [Google Scholar] [CrossRef]
- Wang, Y.; Diehl, A.; Wu, F.; Vrebalov, J.; Giovannoni, J.; Siepel, A.; Tanksley, S.D. Sequencing and comparative analysis of a conserved syntenic segment in the solanaceae. Genetics 2008, 180, 391–408. [Google Scholar] [CrossRef]
- Duret, L.; Mouchiroud, D. Expression pattern and, surprisingly, gene length shape codon usage in caenorhabditis, drosophila, and arabidopsis. Proc. Natl. Acad. Sci. 1999, 96, 4482–4487. [Google Scholar] [CrossRef] [PubMed]
- Castillo-Davis, C.I.; Mekhedov, S.L.; Hartl, D.L.; Koonin, E.V.; Kondrashov, F.A. Selection for short introns in highly expressed genes. Nat. Genet. 2002, 31, 415. [Google Scholar] [CrossRef] [PubMed]
- Eisenberg, E.; Levanon, E.Y. Human housekeeping genes are compact. TRENDS Genet. 2003, 19, 362–365. [Google Scholar] [CrossRef] [Green Version]
- Urrutia, A.O.; Hurst, L.D. The signature of selection mediated by expression on human genes. Genome Res. 2003, 13, 2260–2264. [Google Scholar] [CrossRef] [PubMed]
- Vinogradov, A.E. Compactness of human housekeeping genes: Selection for economy or genomic design? TRENDS Genet. 2004, 20, 248–253. [Google Scholar] [CrossRef] [PubMed]
- Ren, X.-Y.; Vorst, O.; Fiers, M.W.; Stiekema, W.J.; Nap, J.-P. In plants, highly expressed genes are the least compact. Trends Genet. 2006, 22, 528–532. [Google Scholar] [CrossRef] [PubMed]
- Kosiol, C.; Vinař, T.; da Fonseca, R.R.; Hubisz, M.J.; Bustamante, C.D.; Nielsen, R.; Siepel, A. Patterns of positive selection in six mammalian genomes. PLoS Genet. 2008, 4, e1000144. [Google Scholar] [CrossRef]
Figure 1.
The frequency distributions (A–C) and correlation analyses (D–F) of Ka, Ks, and Ka/Ks. (A–C) The frequency displays of Ka, Ks, and Ka/Ks, respectively. (D) The correlation between Ka and Ks. (E) The correlation between Ka/Ks and Ka. (F) The correlation between Ka/Ks and Ks. The blue line represented the fitted curve, and the shaded part represented the confidence interval.

Figure 2.
Comparisons of genomic features among different types of negatively selected genes (NSGs) and positively selected genes (PSGs) in Pyrus. The top and the bottom of each box were the third (higher) and first (lower) quartiles. The line represented the median value in the box. Out of range, mild outliers are excluded in this figure. (A–F) The box plot displays of Ka, Ks, GC content, gene length, exon length, and exon number between two selections.

Figure 3.
Expression divergence analysis for the related to fruit quality orthologous genes among Pyrus bretschneideri and Pyrus communis. D1, D2, D3, D4, D5, D6, and D7 indicates 15 days after full blooming (15 DAB), 30 DAB, 55 DAB, 85 DAB, 115 DAB, mature stage, and fruit senescence stage. The higher expression of genes was shown using the red shades and lower expression of genes was shown with the blue shades.

© 2019 by the authors. Licensee MDPI, Basel, Switzerland. This article is an open access article distributed under the terms and conditions of the Creative Commons Attribution (CC BY) license (http://creativecommons.org/licenses/by/4.0/).
Share and Cite
MDPI and ACS Style
Cao, Y.; Jiang, L.; Wang, L.; Cai, Y. Evolutionary Rate Heterogeneity and Functional Divergence of Orthologous Genes in Pyrus. Biomolecules 2019, 9, 490. https://doi.org/10.3390/biom9090490
AMA Style
Cao Y, Jiang L, Wang L, Cai Y. Evolutionary Rate Heterogeneity and Functional Divergence of Orthologous Genes in Pyrus. Biomolecules. 2019; 9(9):490. https://doi.org/10.3390/biom9090490
Chicago/Turabian StyleCao, Yunpeng, Lan Jiang, Lihu Wang, and Yongping Cai. 2019. "Evolutionary Rate Heterogeneity and Functional Divergence of Orthologous Genes in Pyrus" Biomolecules 9, no. 9: 490. https://doi.org/10.3390/biom9090490
Note that from the first issue of 2016, this journal uses article numbers instead of page numbers. See further details here.