Determination of Major Endogenous FAHFAs in Healthy Human Circulation: The Correlations with Several Circulating Cardiovascular-Related Biomarkers and Anti-Inflammatory Effects on RAW 264.7 Cells

 , , , and
Abstract
:
1. Introduction
2. Materials and Methods
2.1. Participants
2.2. Biochemical Analysis
2.3. Standards Preparation and Calibration Curves
2.4. Extraction and Determination of the FAHFAs and Fatty Acids
2.5. Extraction and Determination of the l-Hcy, SAH, l-Car, and TMAO
2.6. LC-MS Conditions
2.7. Cell Culture
2.8. RNA Isolation and Quantitative Reverse Transcription–Polymerase Chain Reaction (RT-qPCR) Analysis
2.9. Statistical Analysis
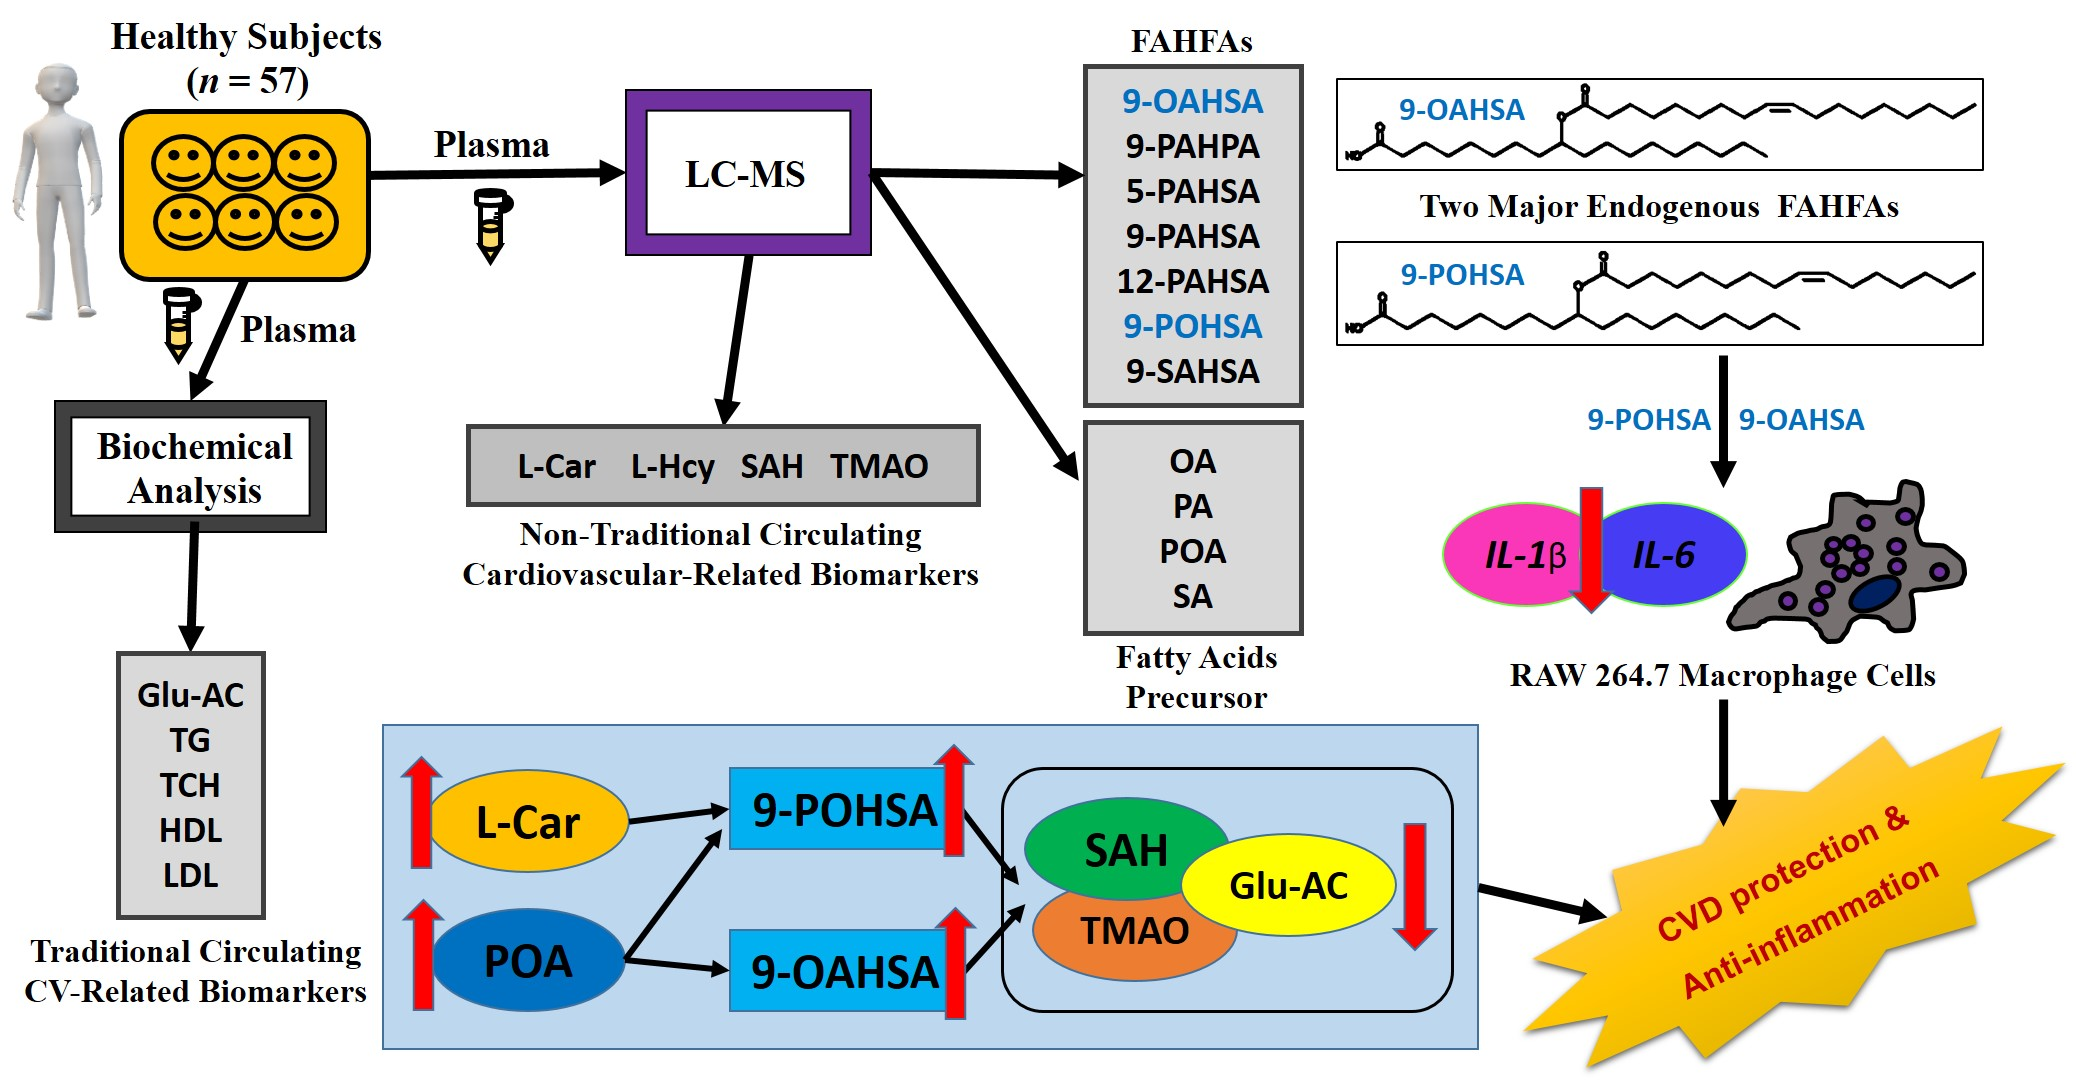
3. Results
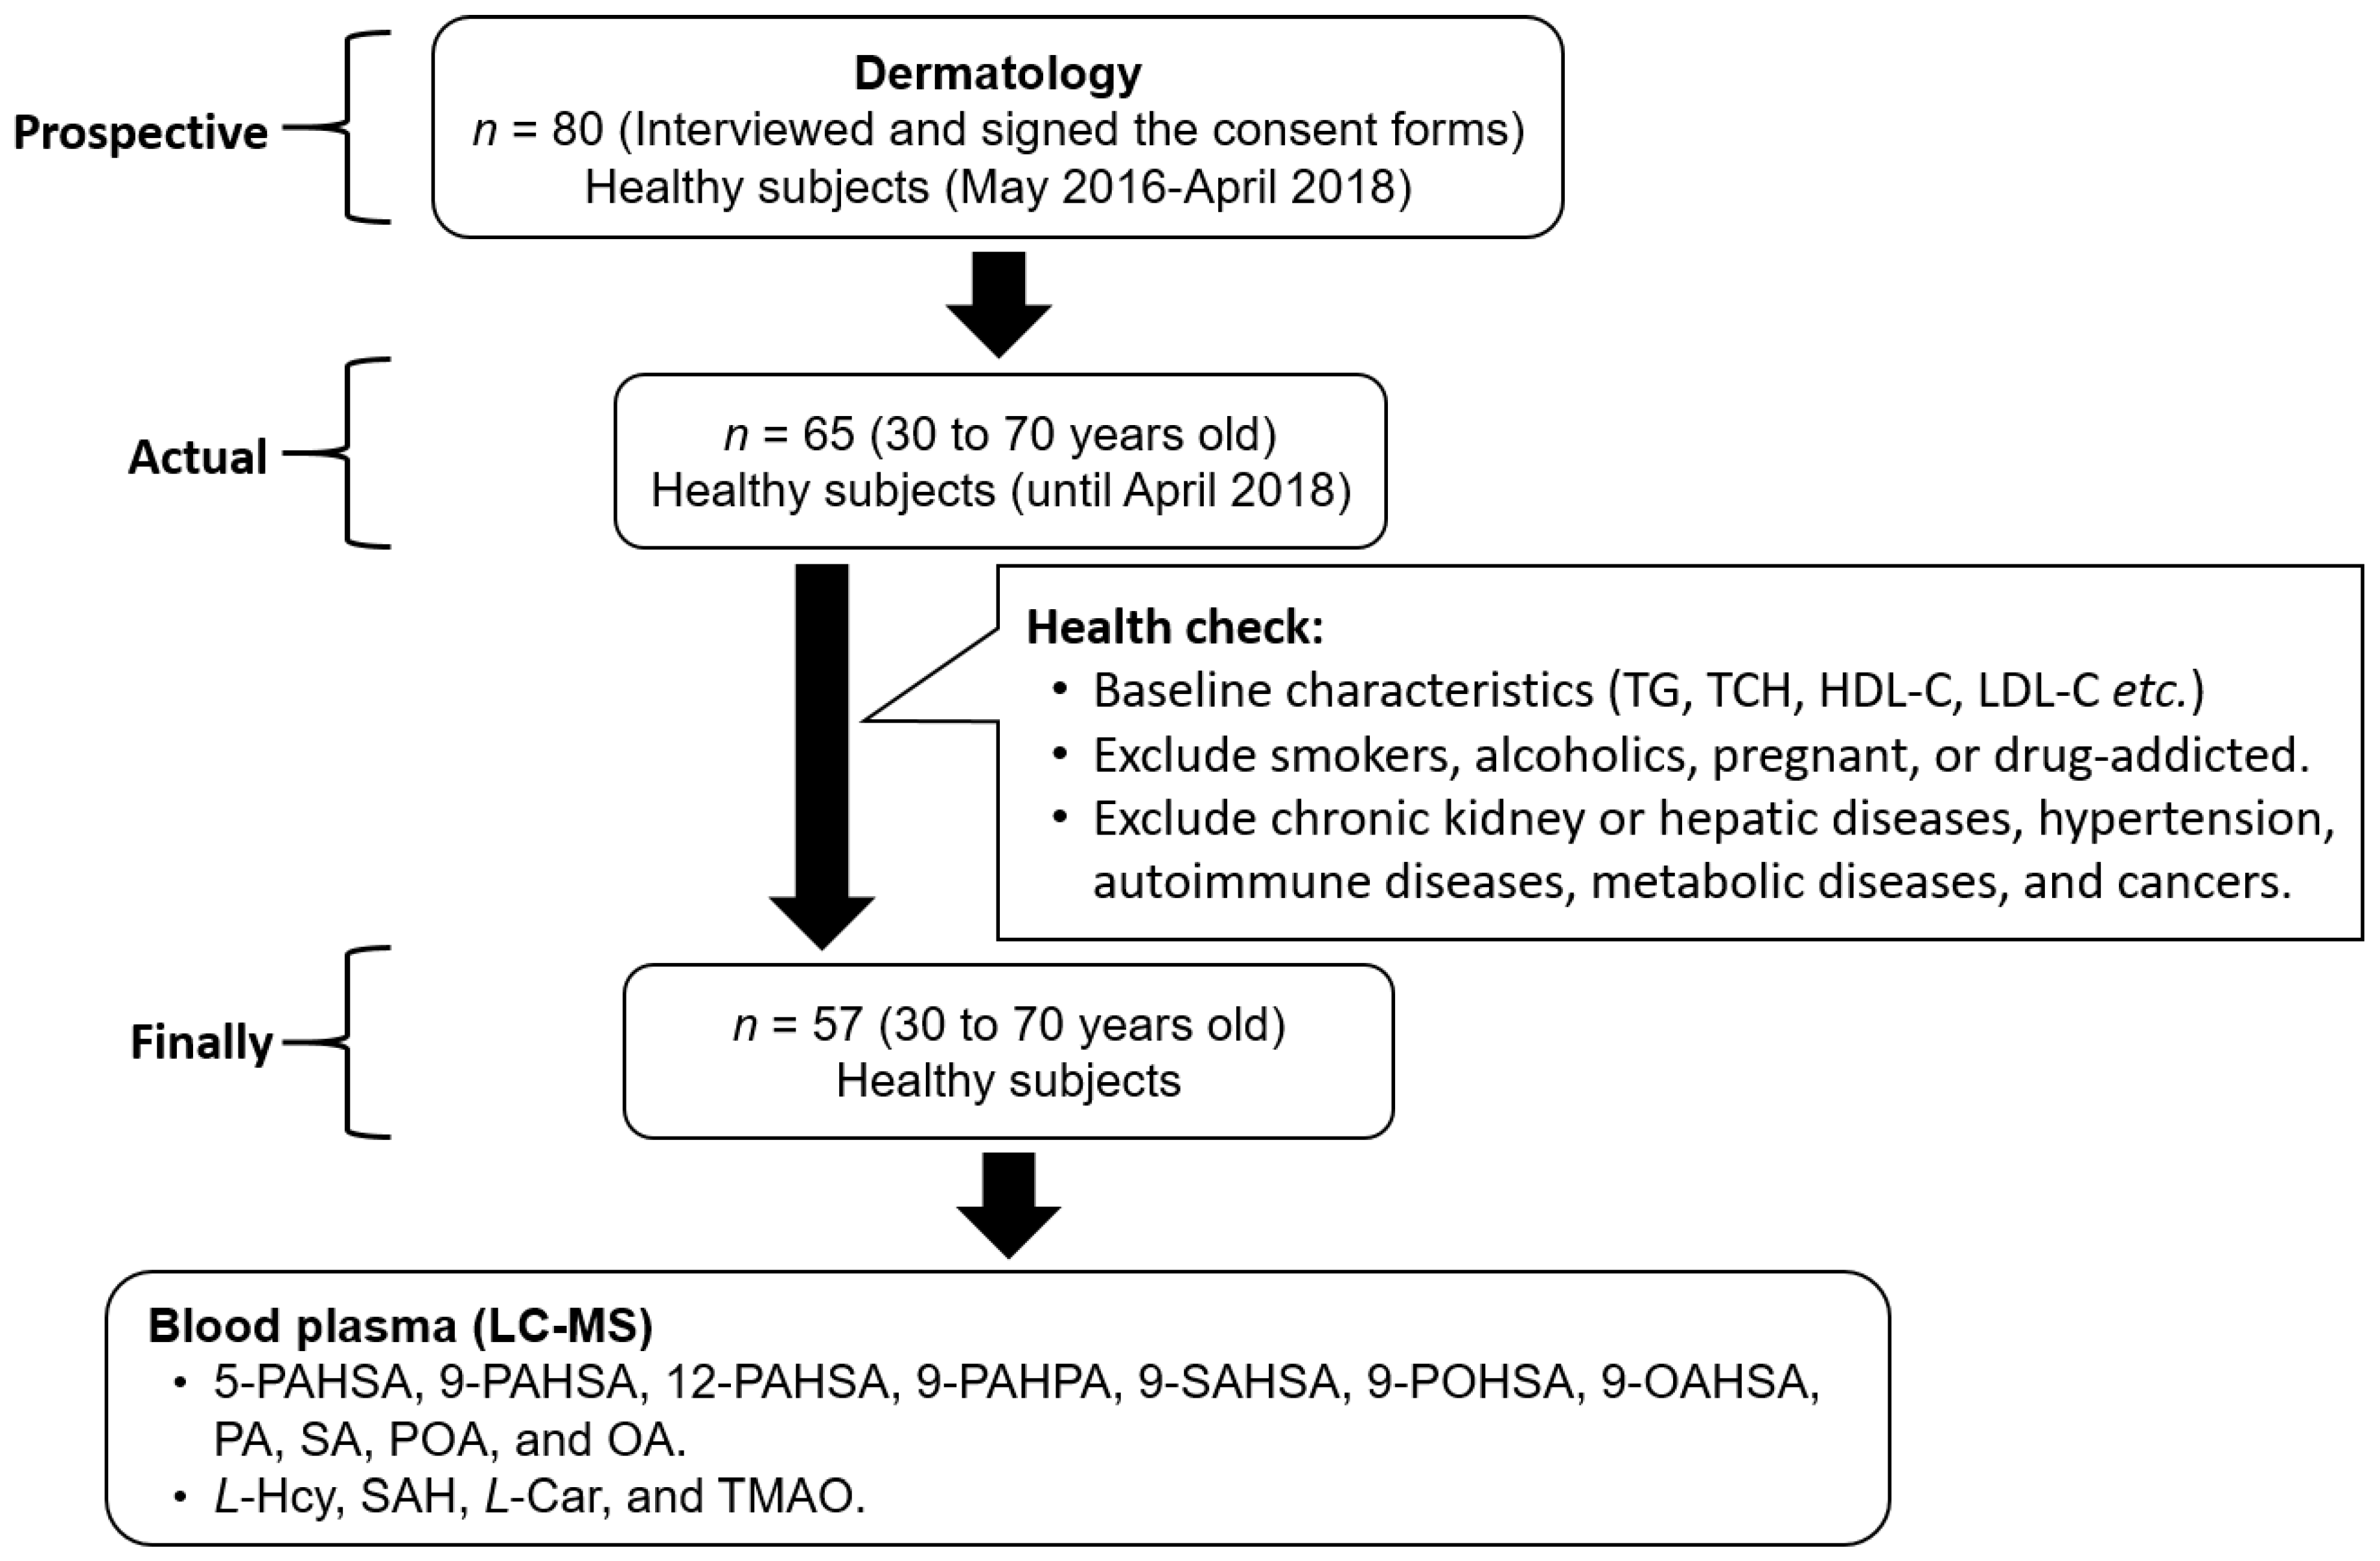
3.1. Enrollment and Characteristics of Healthy Subjects
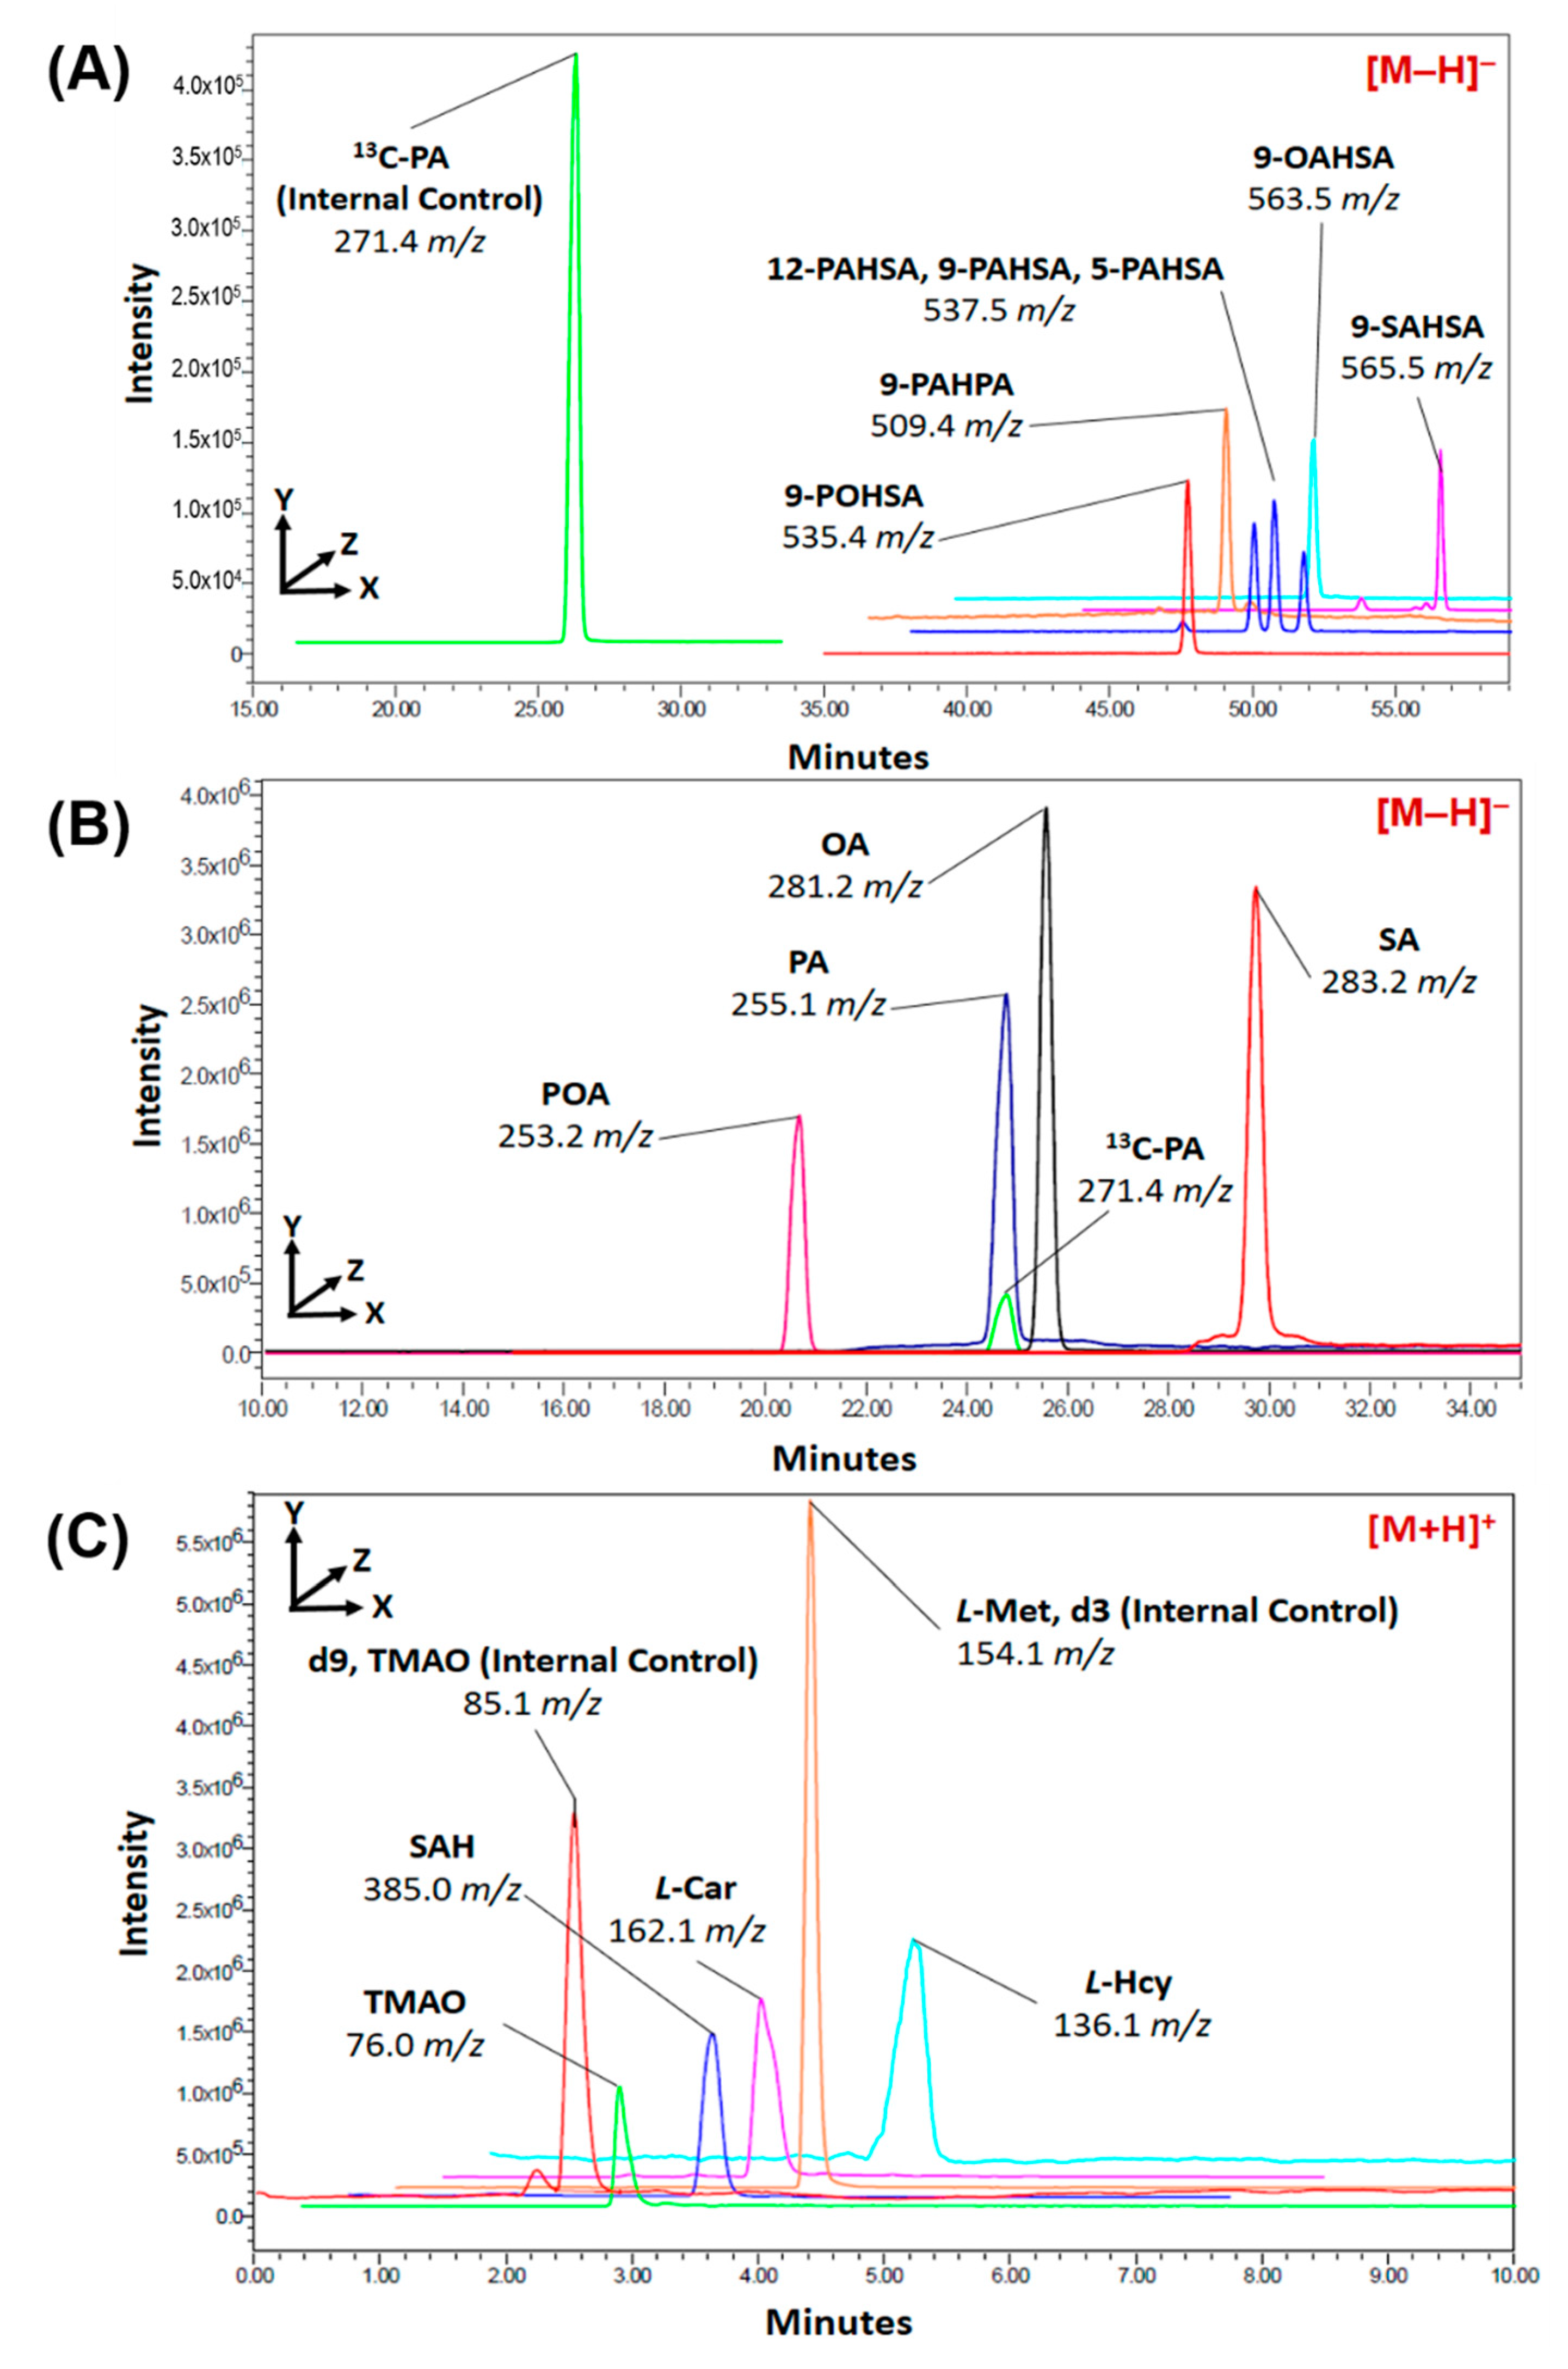
3.2. Linearity and Plasma Analysis
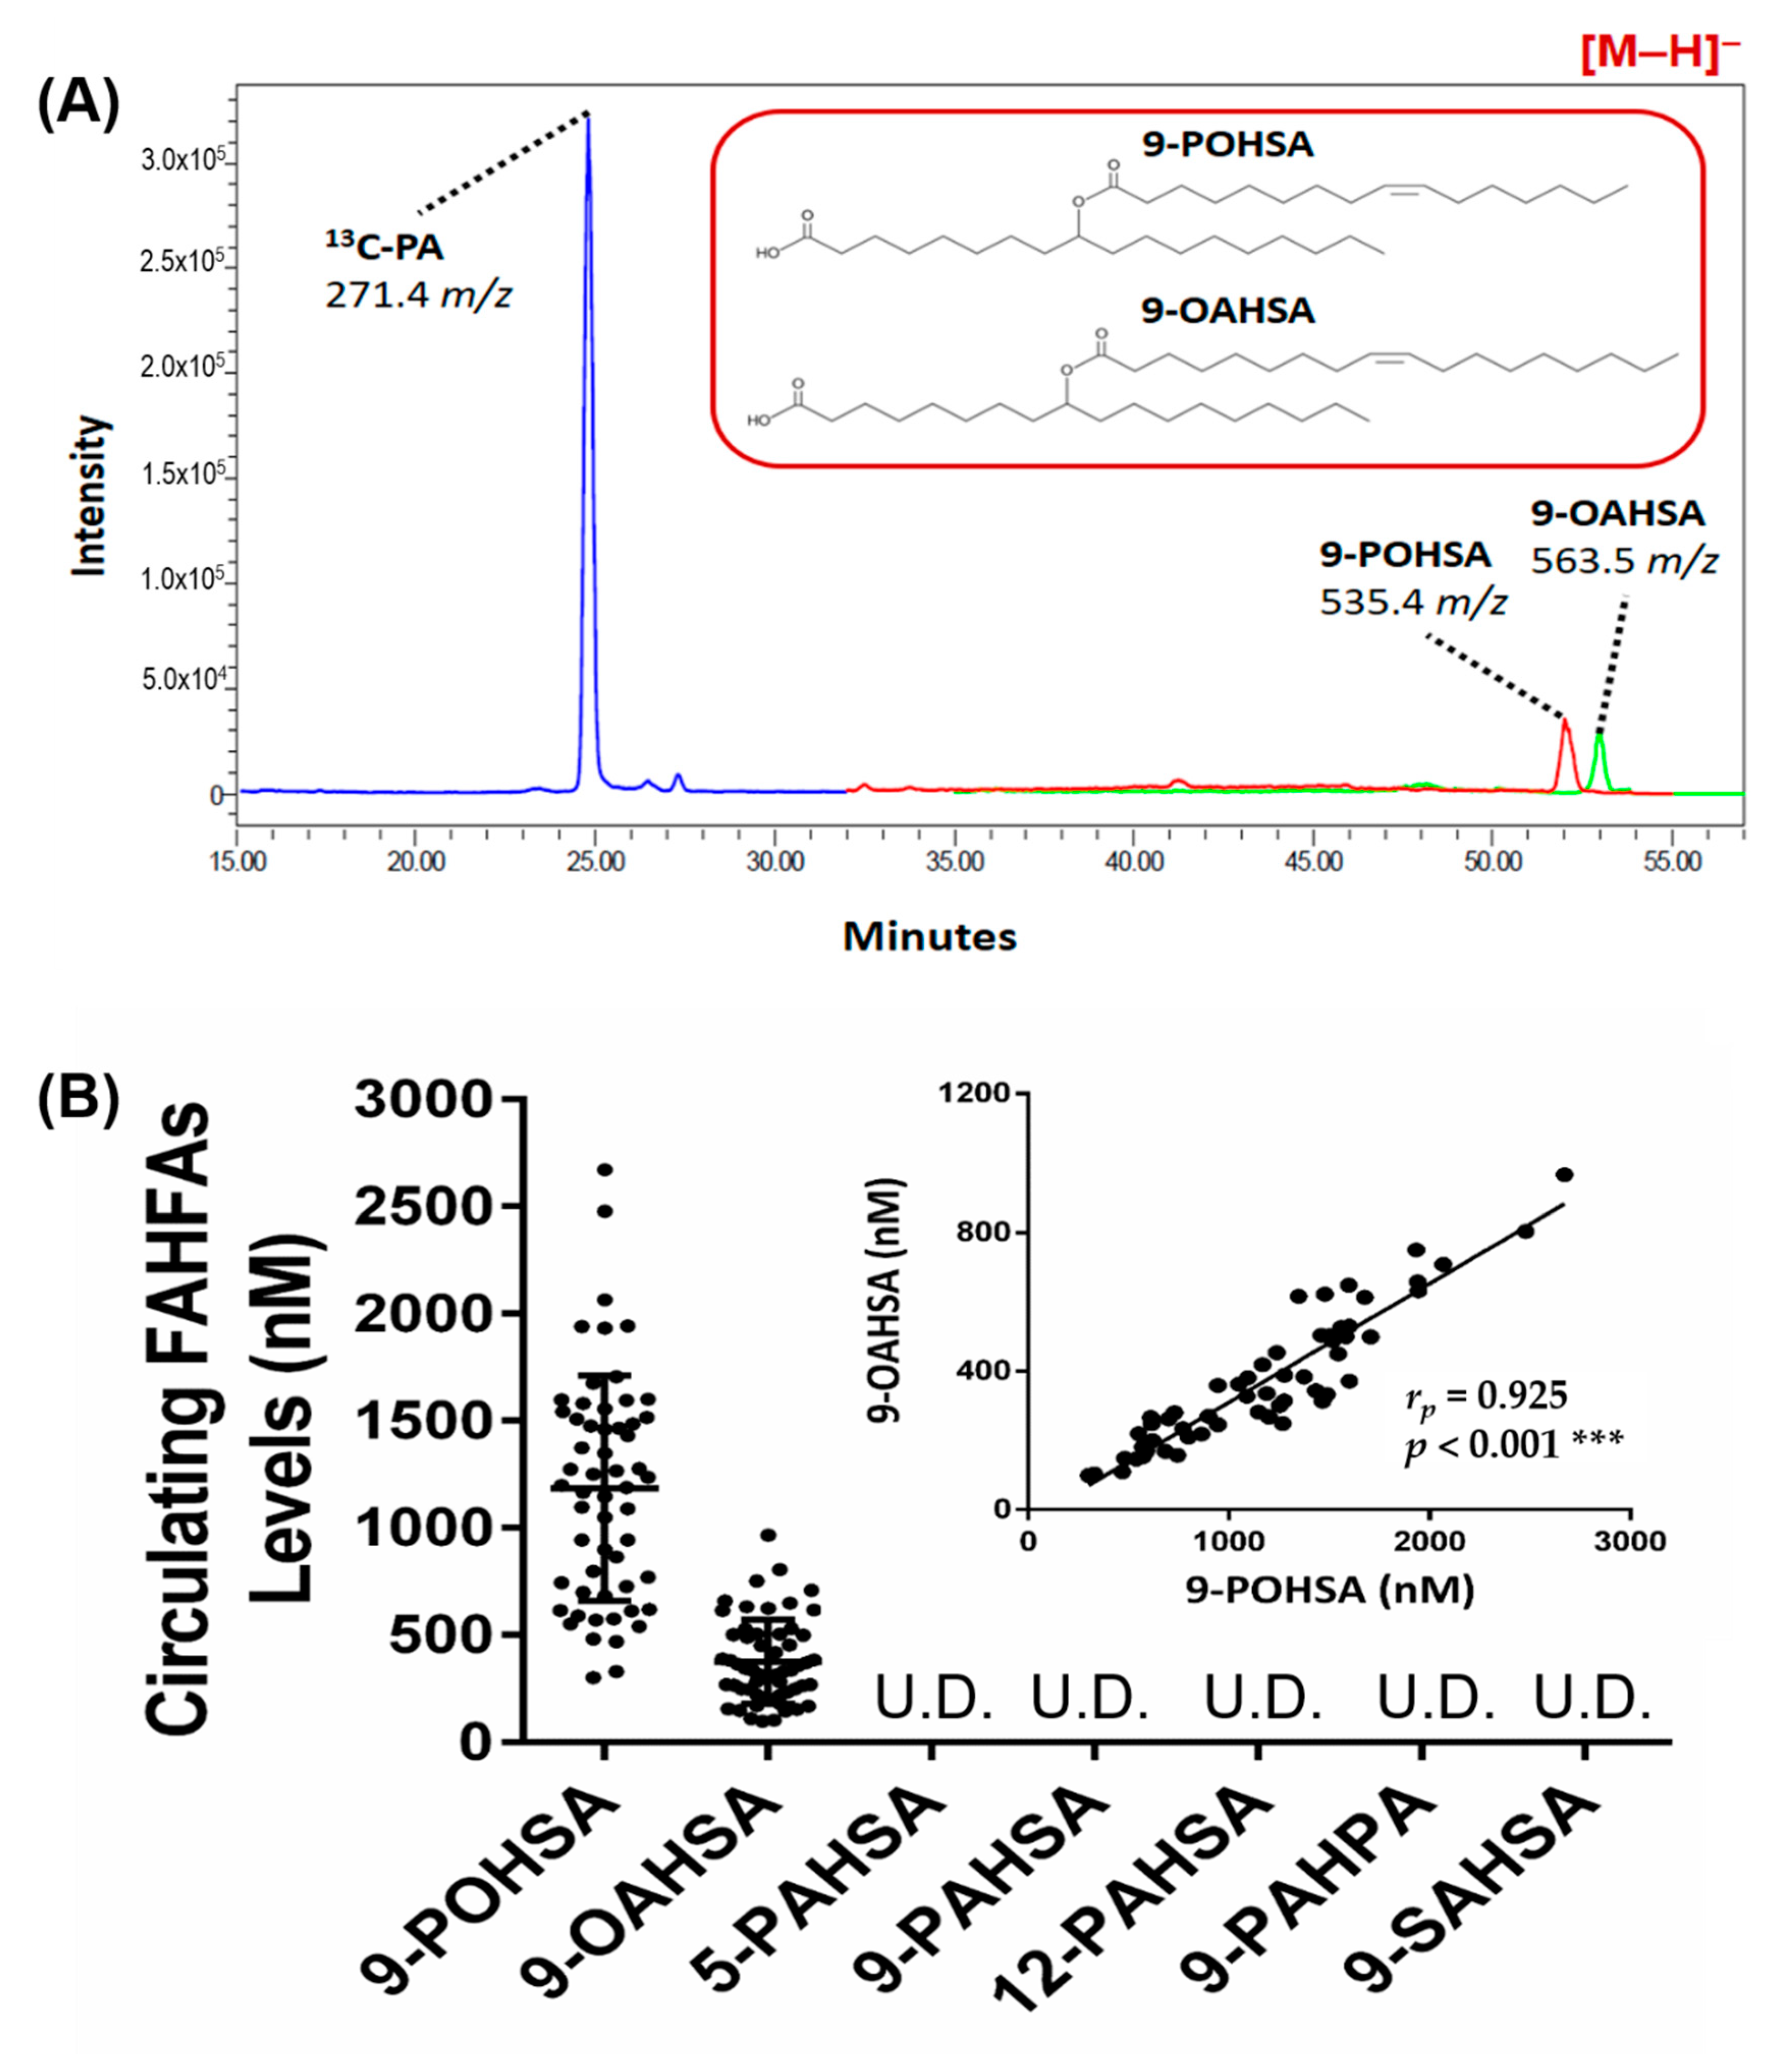
3.3. 9-POHSA and 9-OAHSA Were Major Endogenous FAHFAs in Healthy Subjects
3.4. The Correlation of FAHFAs with Fasting Blood Glucose and Lipid Profiles
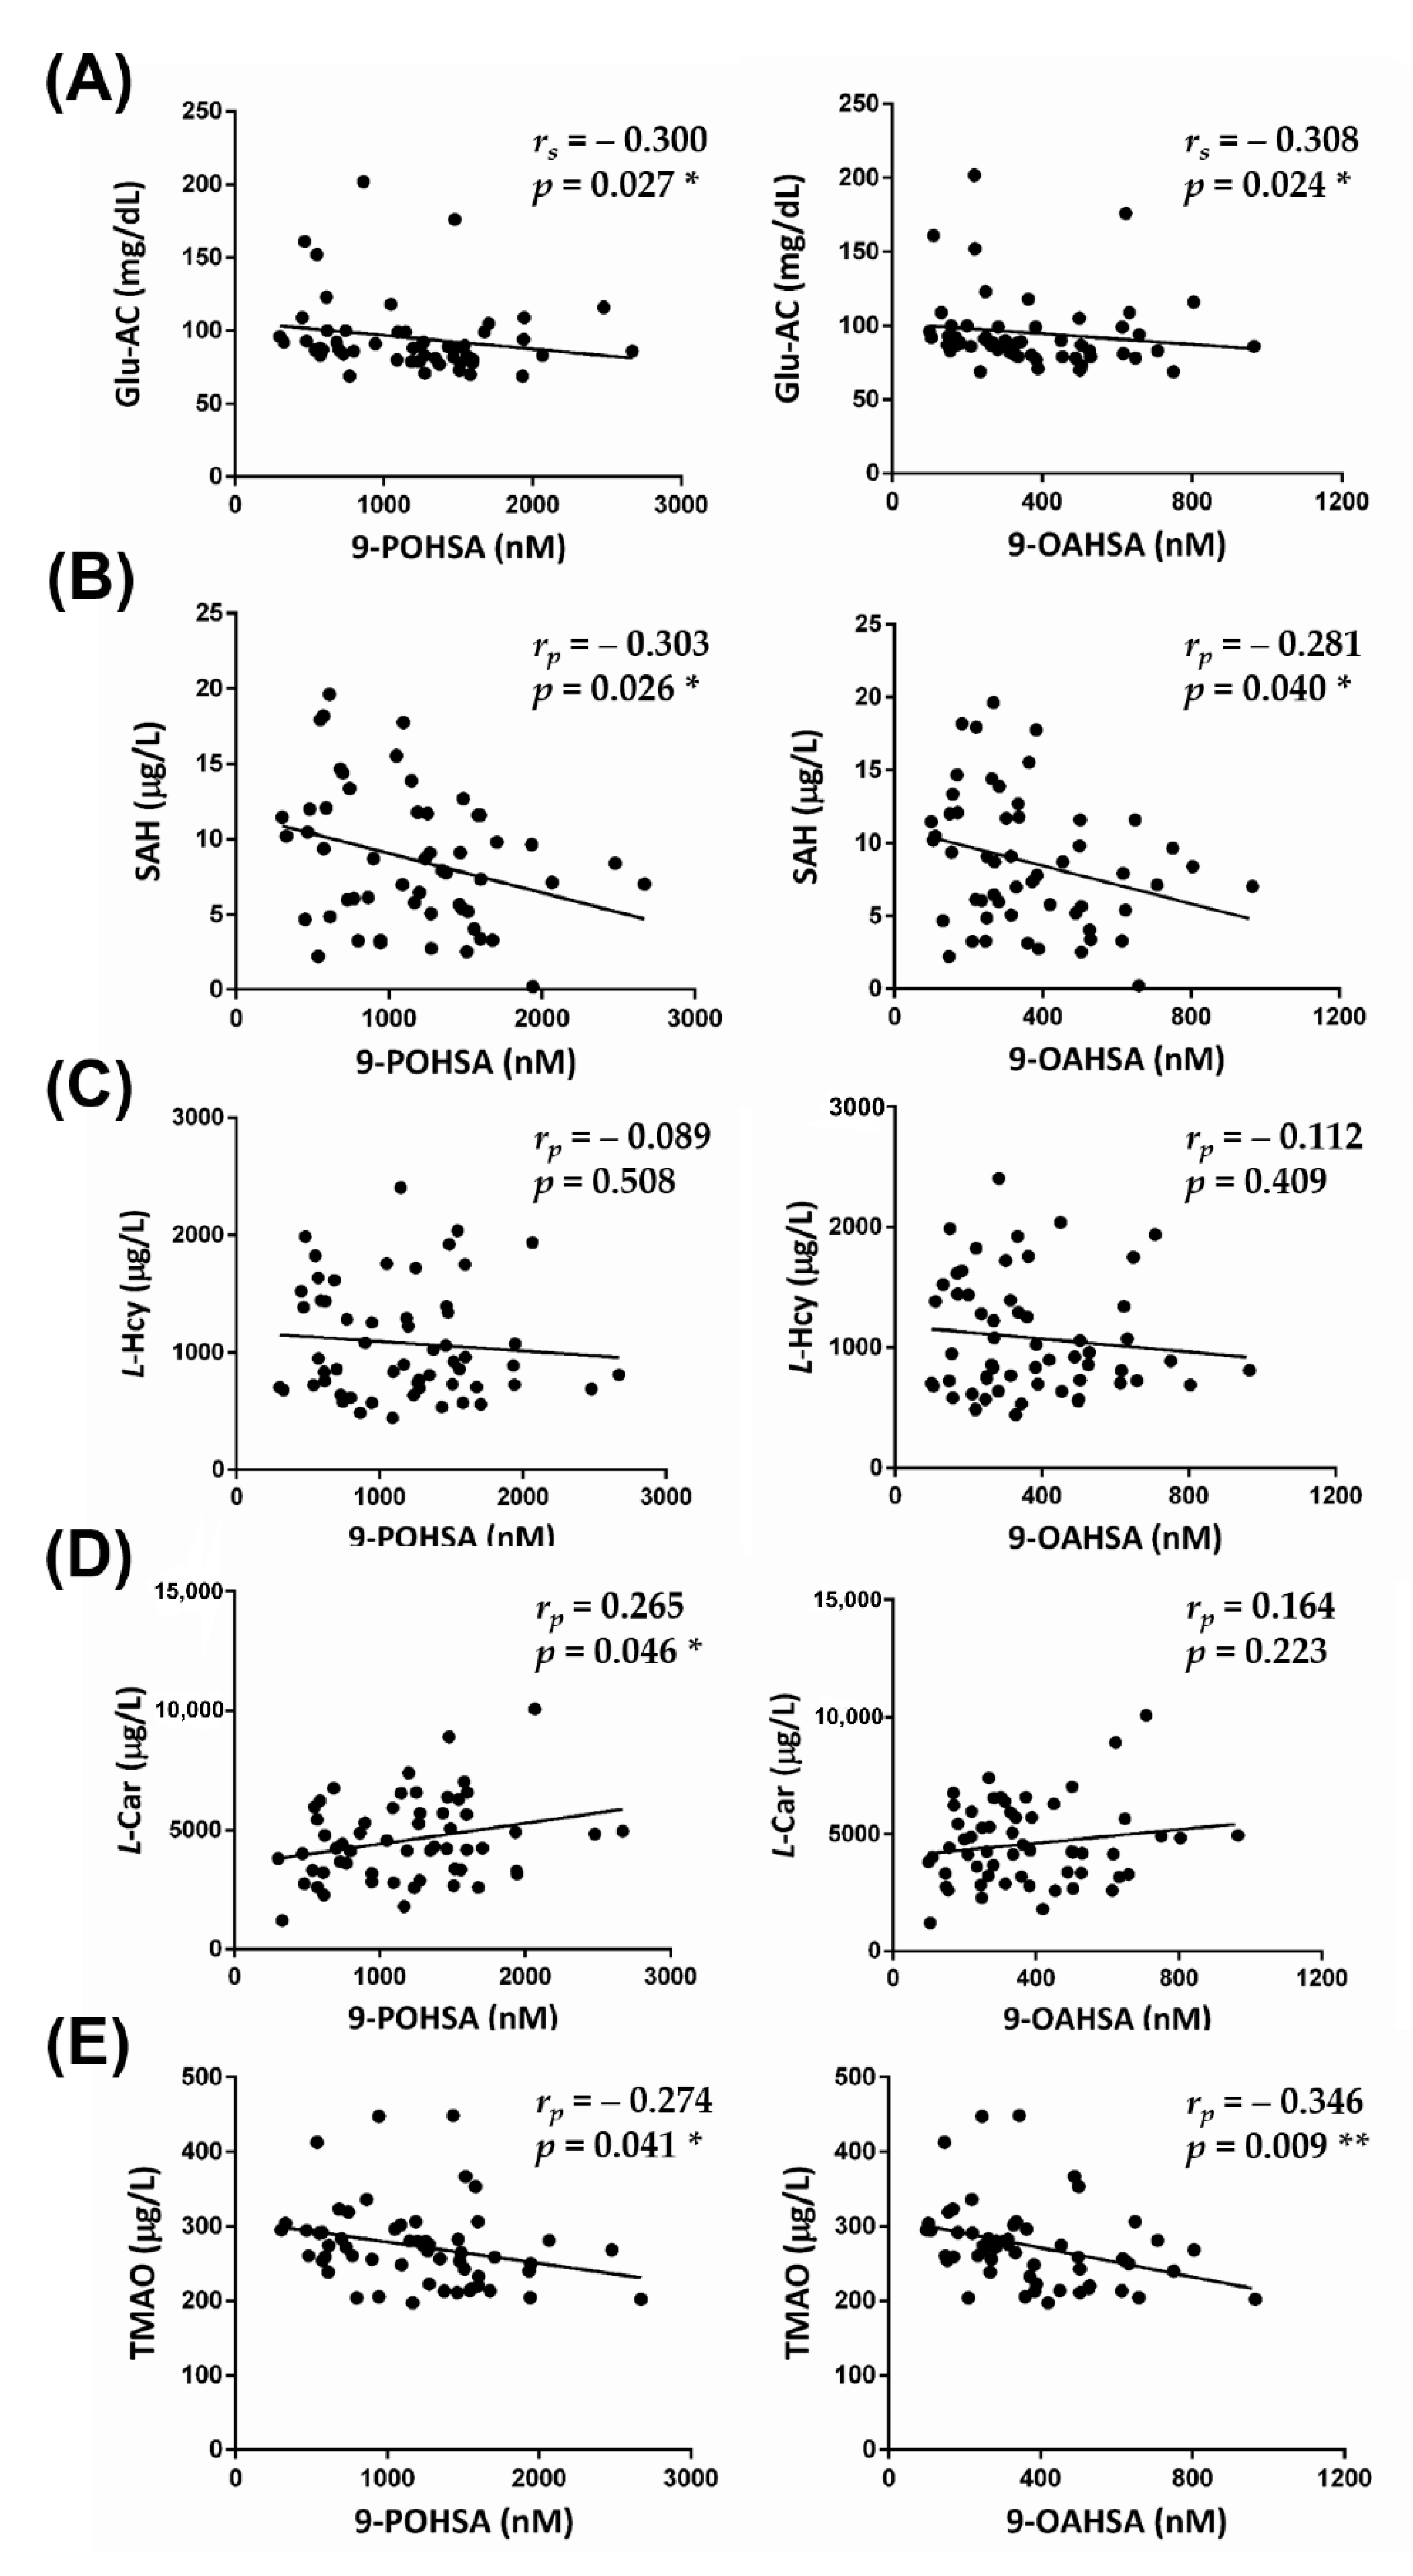
3.5. The Correlation of FAHFAs with Non-Traditional CV-Related Biomarkers
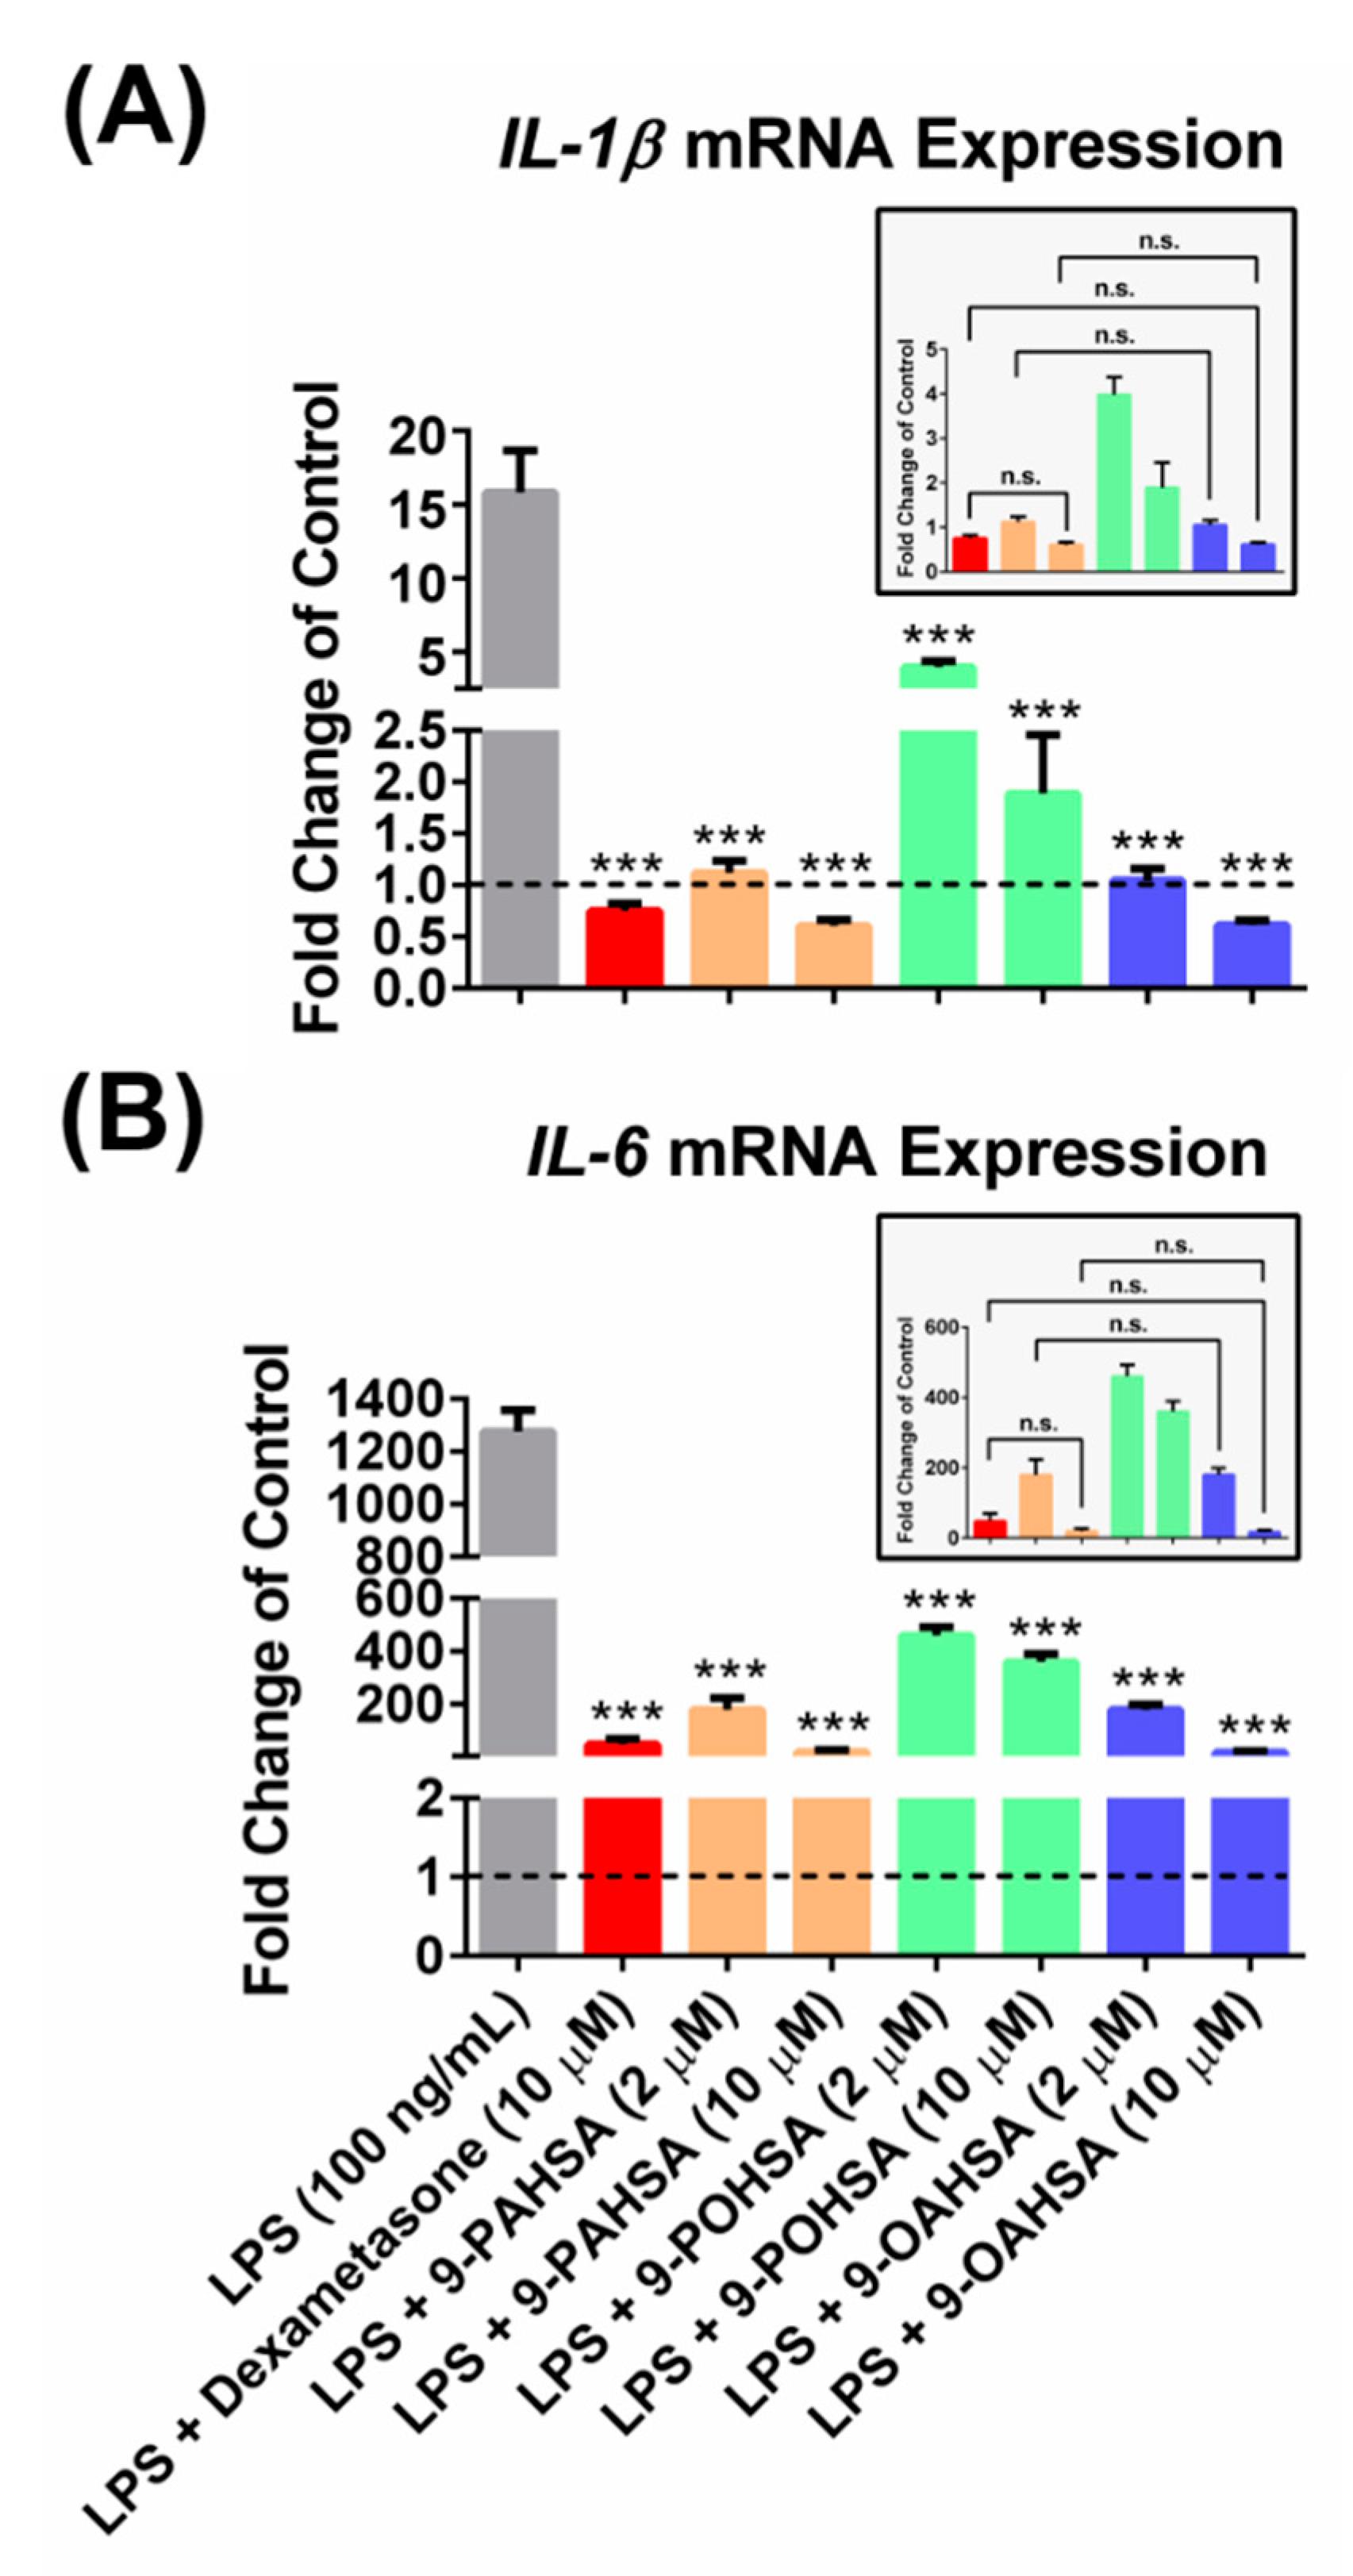
3.6. 9-POHSA and 9-OAHSA Possessed Anti-Inflammatory Effects on RAW 264.7 Cells
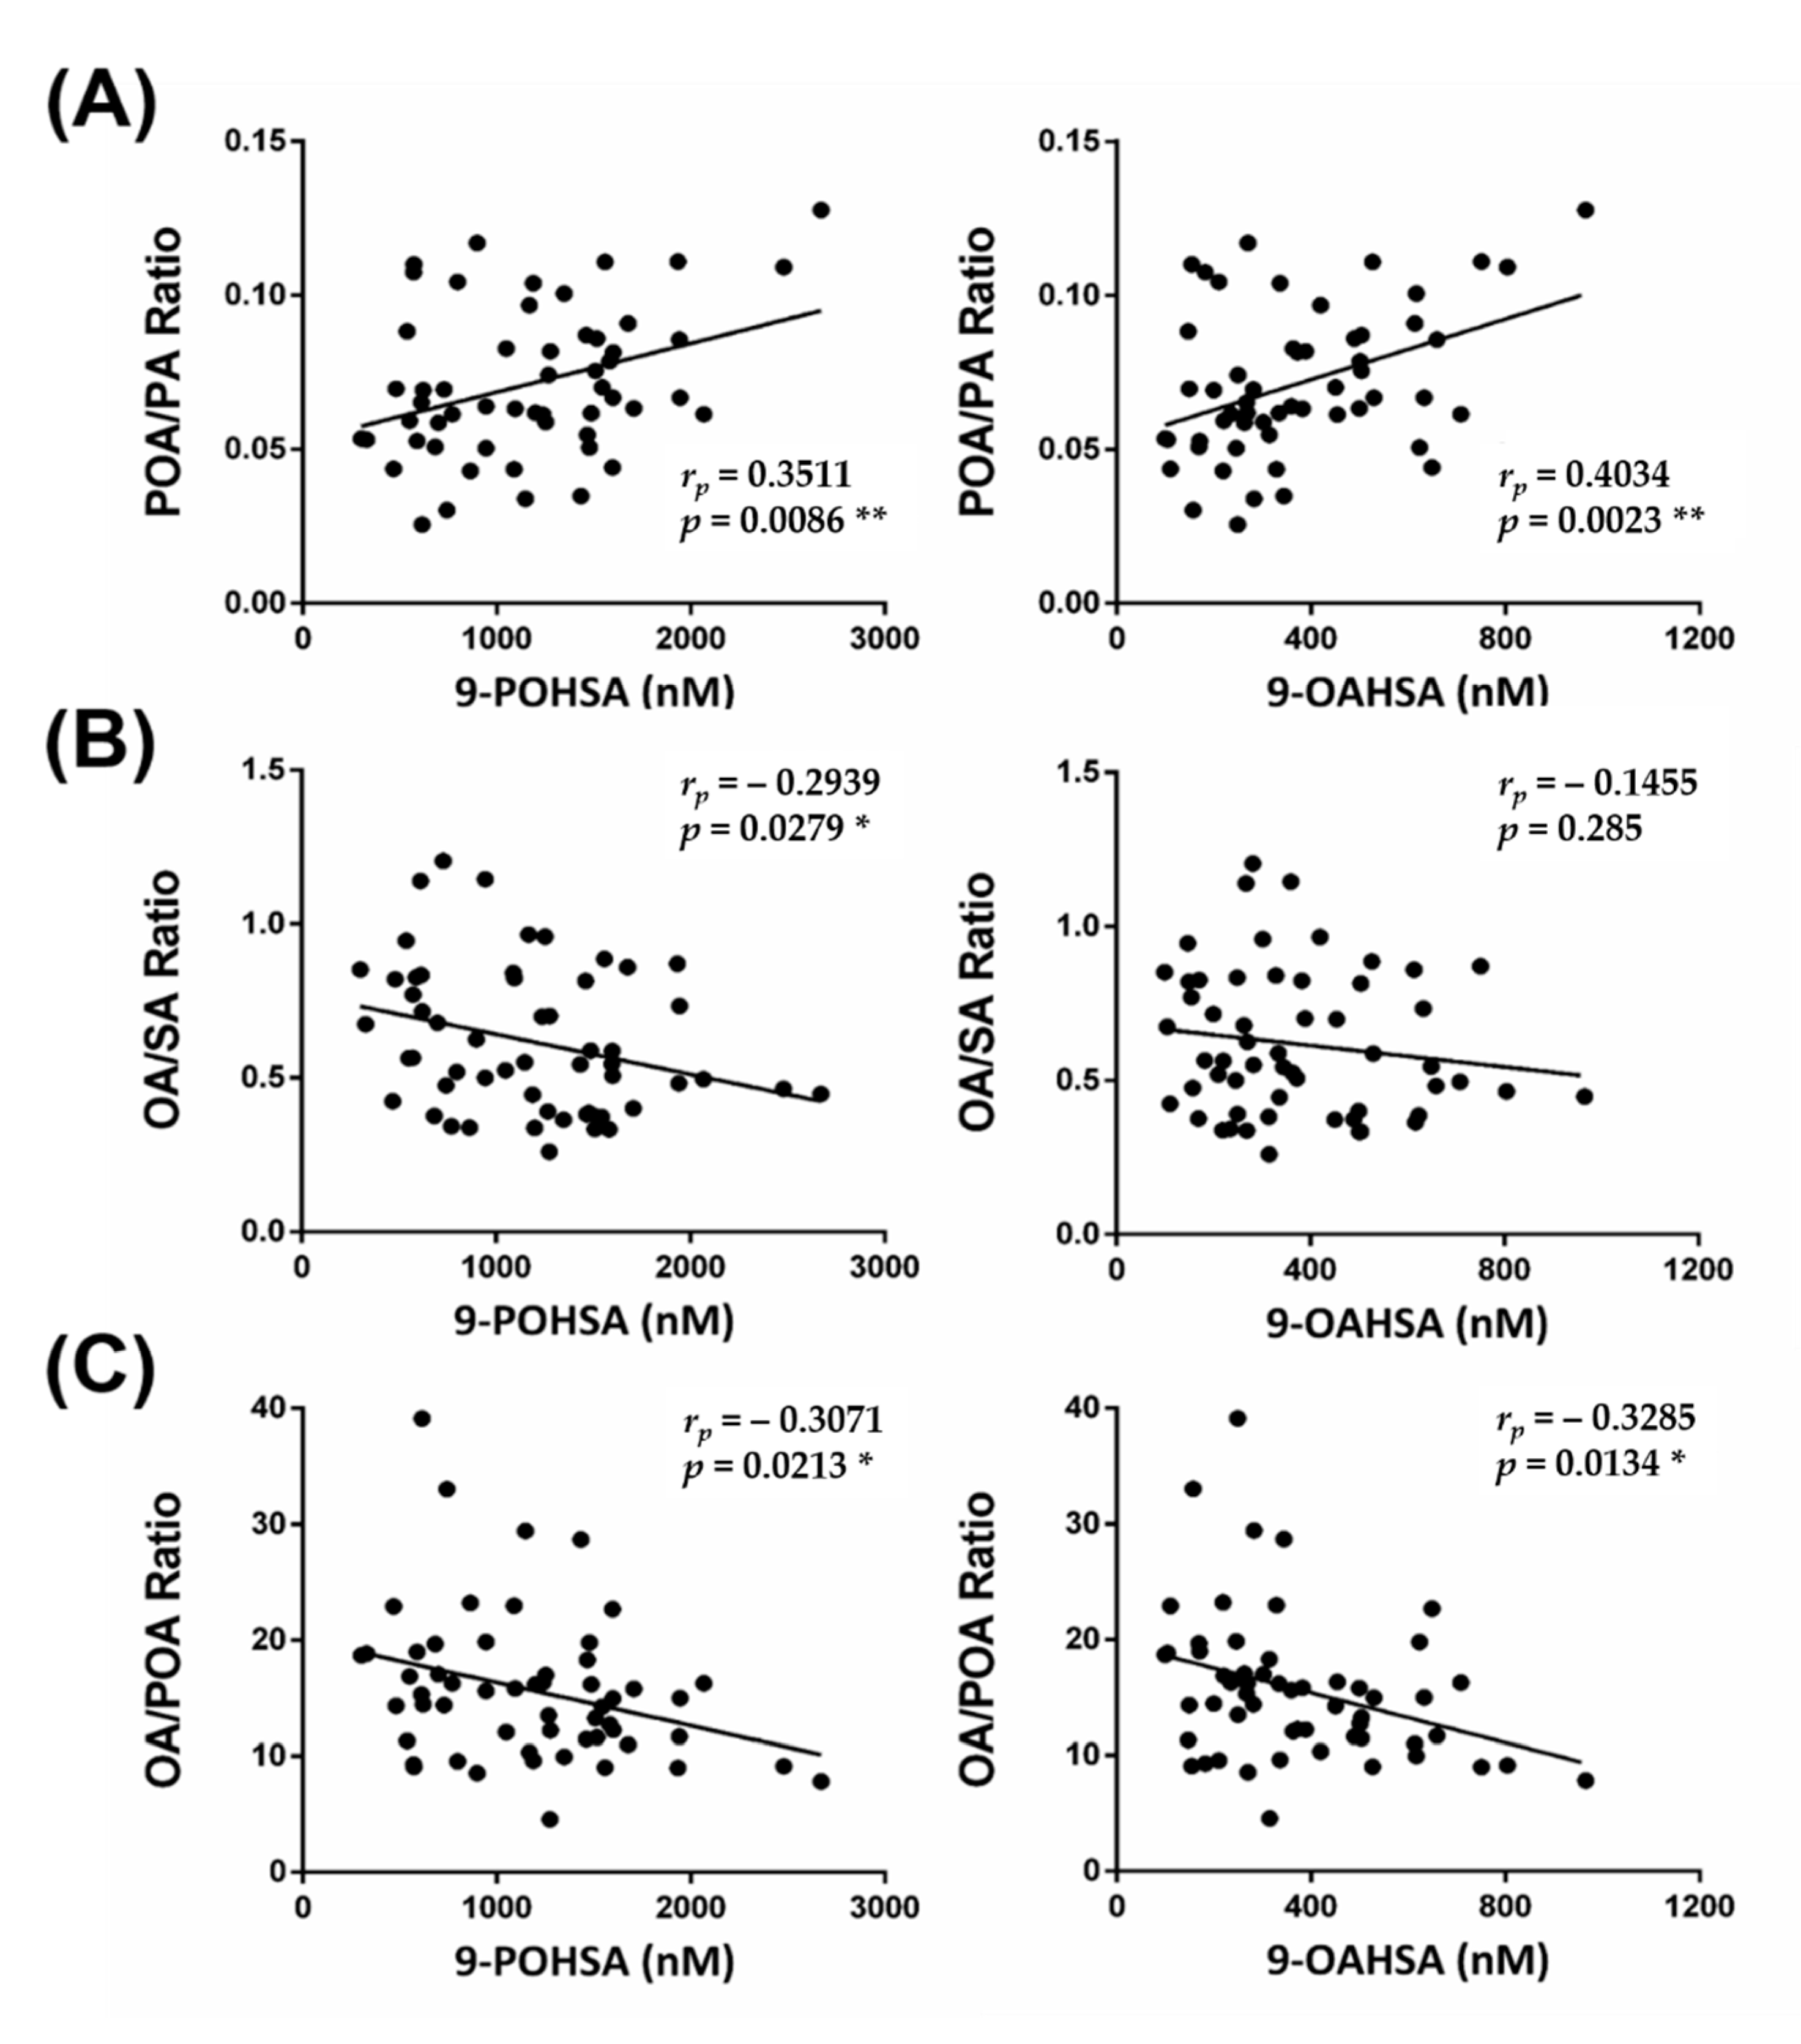
3.7. The Correlation of FAHFAs with Their Fatty Acid Precursors
4. Discussion
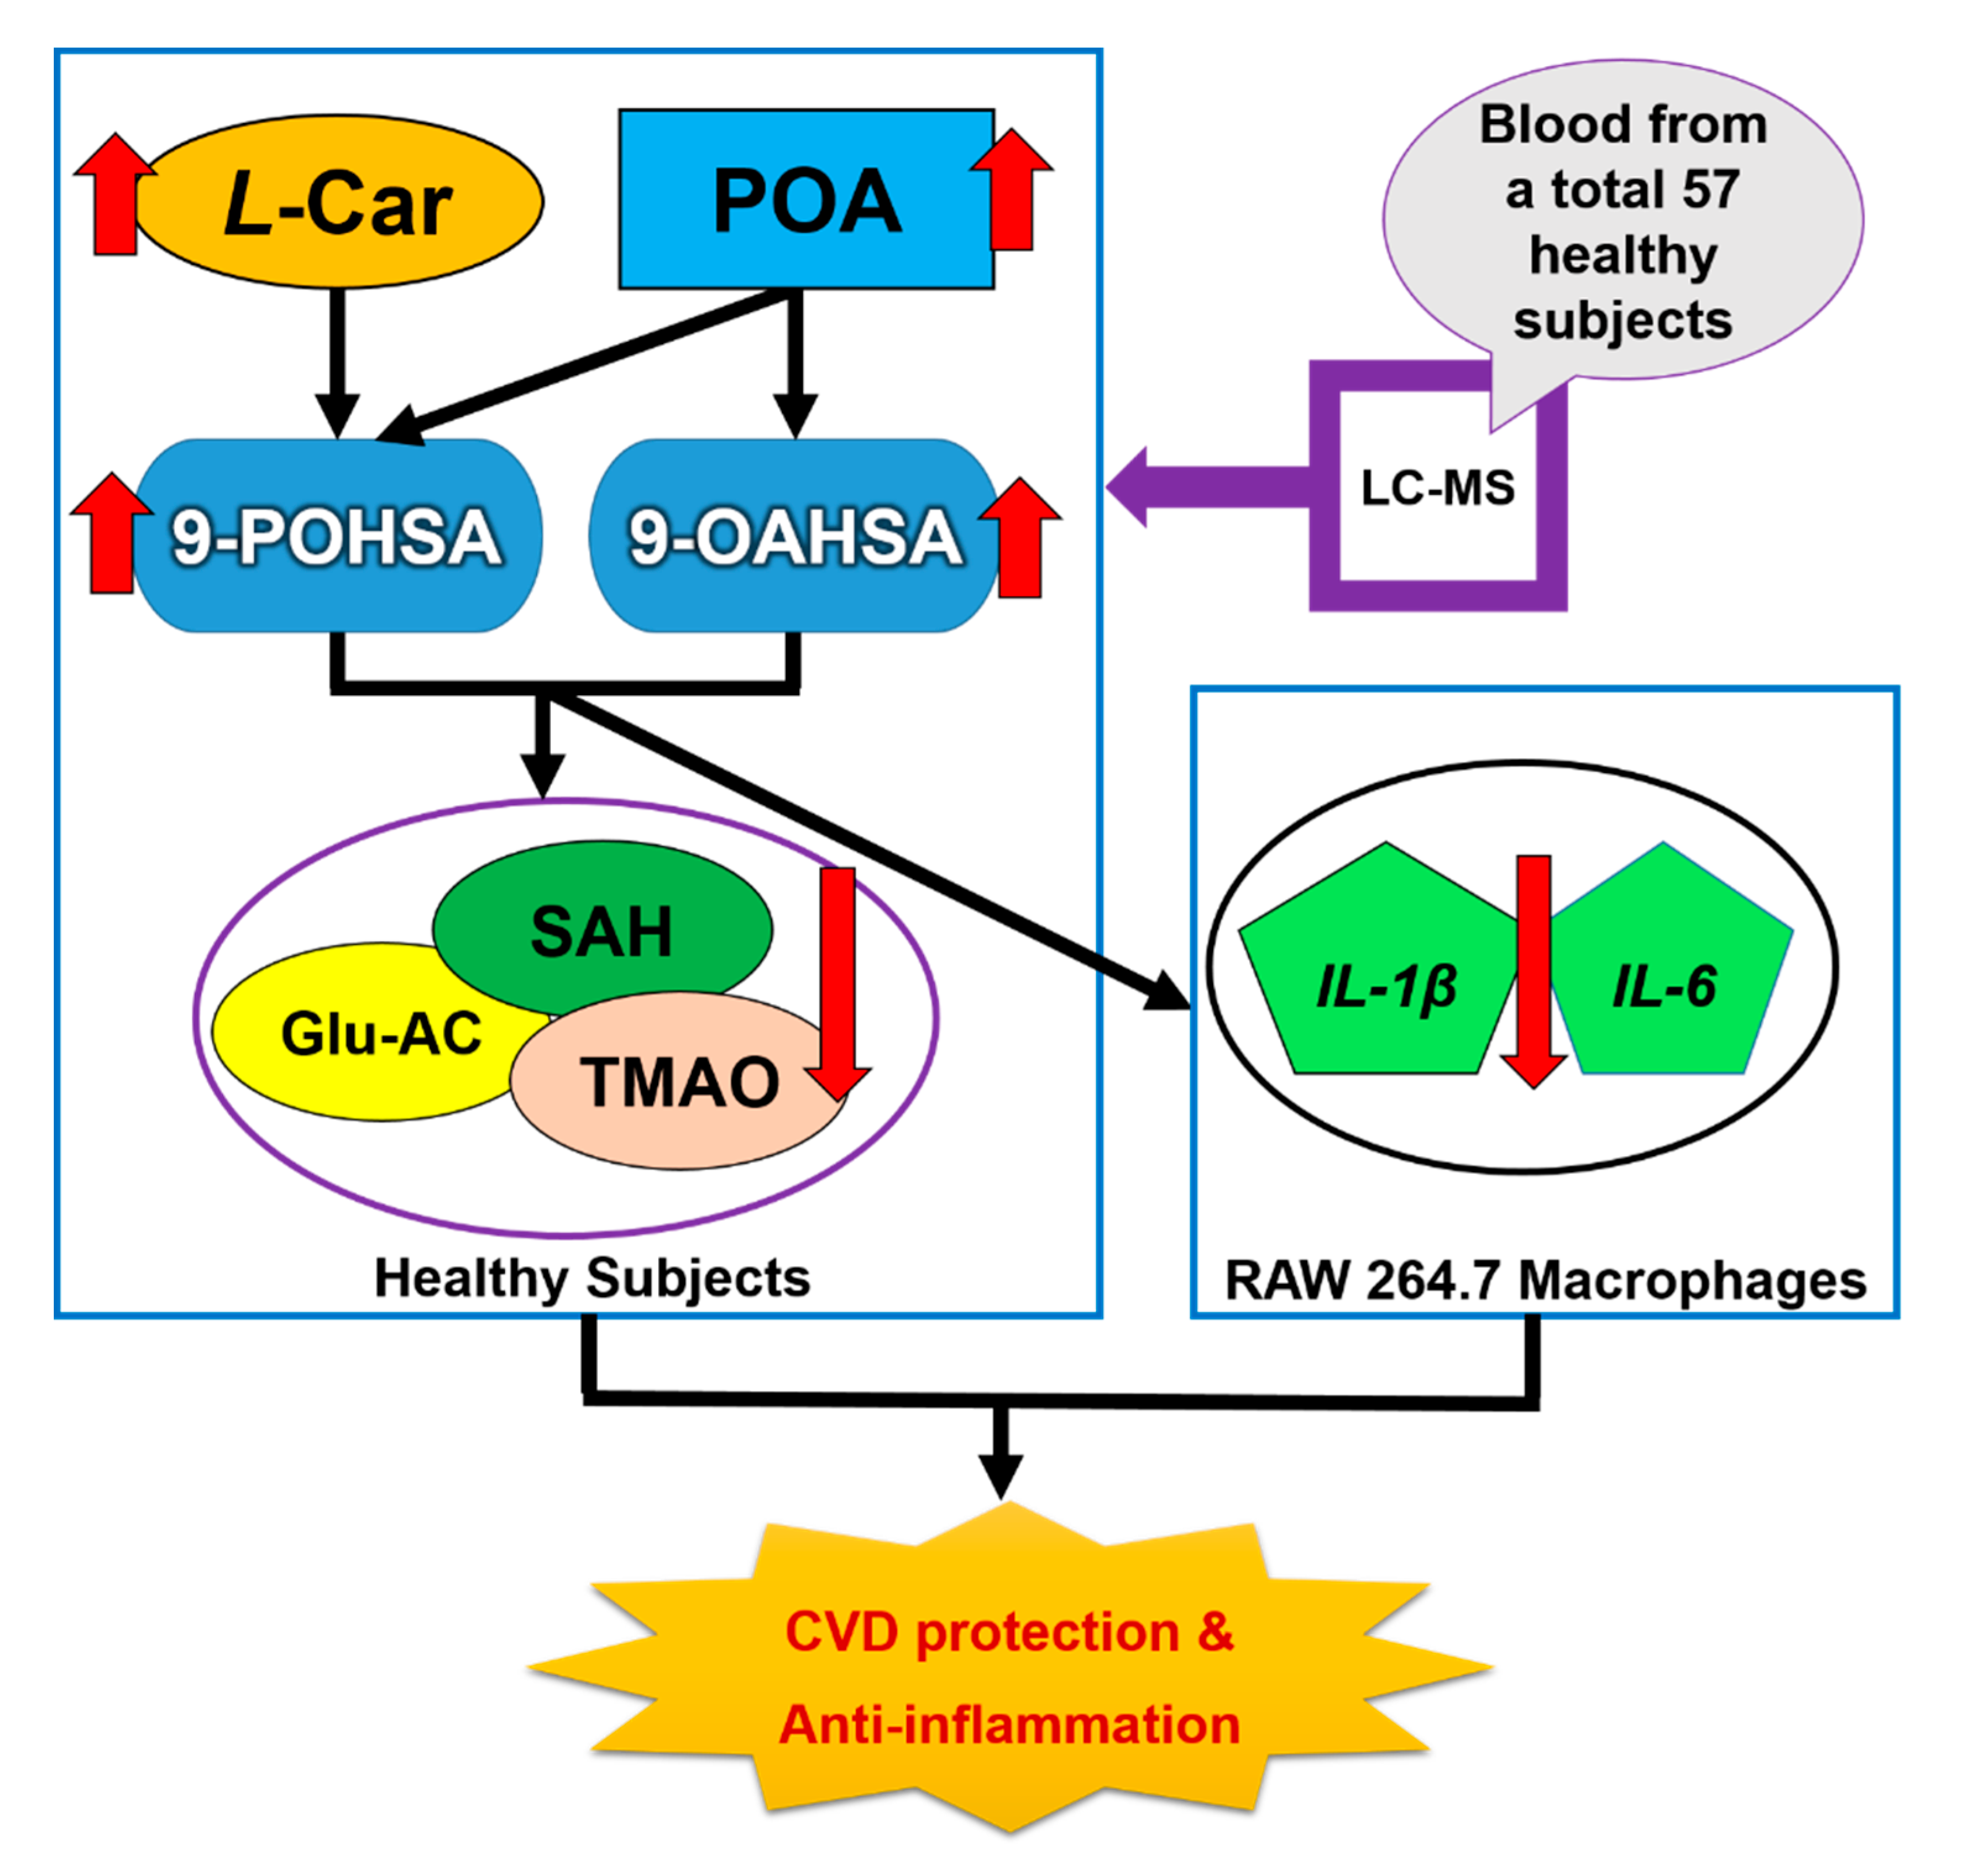
5. Conclusions
Supplementary Materials
Author Contributions
Funding
Acknowledgments
Conflicts of Interest
References
- Yore, M.M.; Syed, I.; Moraes-Vieira, P.M.; Zhang, T.; Herman, M.A.; Homan, E.A.; Patel, R.T.; Lee, J.; Chen, S.; Peroni, O.D.; et al. Discovery of a class of endogenous mammalian lipids with anti-diabetic and anti-inflammatory effects. Cell 2014, 159, 318–332. [Google Scholar] [CrossRef] [Green Version]
- Balas, L.; Feillet-Coudray, C.; Durand, T. Branched fatty acyl esters of hydroxyl fatty acids (FAHFAs), appealing beneficial endogenous fat against obesity and type-2 diabetes. Chemistry 2018, 24, 9463–9476. [Google Scholar] [CrossRef]
- Parsons, W.H.; Kolar, M.J.; Kamat, S.S.; Cognetta, A.B., III; Hulce, J.J.; Saez, E.; Kahn, B.B.; Saghatelian, A.; Cravatt, B.F. AIG1 and ADTRP are atypical integral membrane hydrolases that degrade bioactive FAHFAs. Nat. Chem. Biol. 2016, 12, 367–372. [Google Scholar] [CrossRef] [PubMed] [Green Version]
- Kolar, M.J.; Kamat, S.S.; Parsons, W.H.; Homan, E.A.; Maher, T.; Peroni, O.D.; Syed, I.; Fjeld, K.; Molven, A.; Kahn, B.B.; et al. Branched fatty acid esters of hydroxy fatty acids are preferred substrates of the MODY8 protein carboxyl ester lipase. Biochemistry 2016, 55, 4636–4641. [Google Scholar] [CrossRef] [PubMed] [Green Version]
- Kuda, O.; Brezinova, M.; Rombaldova, M.; Slavikova, B.; Posta, M.; Beier, P.; Janovska, P.; Veleba, J.; Kopecky, J., Jr.; Kudova, E.; et al. Docosahexaenoic acid-derived fatty acid esters of hydroxy fatty acids (FAHFAs) with anti-inflammatory properties. Diabetes 2016, 65, 2580–2590. [Google Scholar] [CrossRef] [PubMed] [Green Version]
- Brejchova, K.; Balas, L.; Paluchova, V.; Brezinova, M.; Durand, T.; Kuda, O. Understanding FAHFAs: From structure to metabolic regulation. Prog. Lipid Res. 2020, 79, 101053. [Google Scholar] [CrossRef] [PubMed]
- Lee, J.; Moraes-Vieira, P.M.; Castoldi, A.; Aryal, P.; Yee, E.U.; Vickers, C.; Parnas, O.; Donaldson, C.J.; Saghatelian, A.; Kahn, B.B. Branched fatty acid esters of hydroxy fatty acids (FAHFAs) protect against colitis by regulating gut innate and adaptive immune responses. J. Biol. Chem. 2016, 291, 22207–22217. [Google Scholar] [CrossRef] [PubMed] [Green Version]
- Pflimlin, E.; Bielohuby, M.; Korn, M.; Breitschopf, K.; Lohn, M.; Wohlfart, P.; Konkar, A.; Podeschwa, M.; Barenz, F.; Pfenninger, A.; et al. Acute and repeated treatment with 5-PAHSA or 9-PAHSA isomers does not improve glucose control in mice. Cell Metab. 2018, 28, 217–227. [Google Scholar] [CrossRef] [Green Version]
- Kolar, M.J.; Konduri, S.; Chang, T.; Wang, H.; McNerlin, C.; Ohlsson, L.; Harrod, M.; Siegel, D.; Saghatelian, A. Linoleic acid esters of hydroxy linoleic acids are anti-inflammatory lipids found in plants and mammals. J. Biol. Chem. 2019, 294, 10698–10707. [Google Scholar] [CrossRef]
- Benlebna, M.; Balas, L.; Bonafos, B.; Pessemesse, L.; Vigor, C.; Grober, J.; Bernex, F.; Fouret, G.; Paluchova, V.; Gaillet, S.; et al. Long-term high intake of 9-PAHPA or 9-OAHPA increases basal metabolism and insulin sensitivity but disrupts liver homeostasis in healthy mice. J. Nutr. Biochem. 2020, 79, 108361. [Google Scholar] [CrossRef]
- GBD 2019 Risk Factors Collaborators. Global burden of 87 risk factors in 204 countries and territories, 1990–2019: A systematic analysis for the Global Burden of disease Study 2019. Lancet 2020, 396, 1135–1159. [Google Scholar]
- The WHO CVD Risk Chart Working Group. World Health Organization Cardiovascular Disease Risk Charts: Revised models To Estimate Risk in 21 Global Regions. Lancet Glob. Health 2020, 7, e1332–e1345. [Google Scholar]
- D’Adamo, E.; Santoro, N.; Caprio, S. Metabolic syndrome in pediatrics: Old concepts revised, new concepts discussed. Curr. Probl. Pediatr. Adolesc. Health Care 2013, 43, 114–123. [Google Scholar] [CrossRef] [PubMed]
- Alberti, K.G.; Zimmet, P.; Shaw, J. Metabolic syndrome—A new world-wide definition. A consensus statement from the International Diabetes Federation. Diabet. Med. 2006, 23, 469–480. [Google Scholar] [CrossRef] [PubMed]
- Eckel, R.H.; Grundy, S.M.; Zimmet, P.Z. The metabolic syndrome. Lancet 2005, 365, 1415–1428. [Google Scholar] [CrossRef]
- Willeit, P.; Thompson, S.G.; Agewall, S.; Bergstrom, G.; Bickel, H.; Catapano, A.L.; Chien, K.L.; de Groot, E.; Empana, J.P.; Etgen, T.; et al. Inflammatory markers and extent and progression of early atherosclerosis: Meta-analysis of individual-participant-data from 20 prospective studies of the PROG-IMT collaboration. Eur. J. Prev. Cardiol. 2016, 23, 194–205. [Google Scholar] [CrossRef]
- Ogawa, Y. Homeostatic inflammation, an emerging concept. Endocr. J. 2010, 57, 657–658. [Google Scholar] [CrossRef] [Green Version]
- Healy, A.M.; Pickard, M.D.; Pradhan, A.D.; Wang, Y.; Chen, Z.; Croce, K.; Sakuma, M.; Shi, C.; Zago, A.C.; Garasic, J.; et al. Platelet expression profiling and clinical validation of myeloid-related protein-14 as a novel determinant of cardiovascular events. Circulation 2006, 113, 2278–2284. [Google Scholar] [CrossRef] [Green Version]
- Andersen, L.B.; Harro, M.; Sardinha, L.B.; Froberg, K.; Ekelund, U.; Brage, S.; Anderssen, S.A. Physical activity and clustered cardiovascular risk in children: A cross-sectional study (The European Youth Heart Study). Lancet 2006, 368, 299–304. [Google Scholar] [CrossRef]
- Gregor, M.F.; Hotamisligil, G.S. Inflammatory mechanisms in obesity. Annu. Rev. Immunol. 2011, 29, 415–445. [Google Scholar] [CrossRef] [Green Version]
- Hoogeveen, R.M.; Nahrendorf, M.; Riksen, N.P.; Netea, M.G.; de Winther, M.P.J.; Lutgens, E.; Nordestgaard, B.G.; Neidhart, M.; Stroes, E.S.G.; Catapano, A.L.; et al. Monocyte and haematopoietic progenitor reprogramming as common mechanism underlying chronic inflammatory and cardiovascular diseases. Eur. Heart J. 2018, 39, 3521–3527. [Google Scholar] [CrossRef] [PubMed]
- Kofler, S.; Nickel, T.; Weis, M. Role of cytokines in cardiovascular diseases: A focus on endothelial responses to inflammation. Clin. Sci. 2005, 108, 205–213. [Google Scholar] [CrossRef] [PubMed] [Green Version]
- Teixeira Silva, C.; Candido, A.P.C.; Pala, D.; Oliveira Barbosa, P.; Machado-Coelho, G.L.L.; Pereira de Oliveira, F.L.; Pinheiro Volp, A.C. Nascimento de Freitas, R. Clustered cardiovascular risk factors are associated with inflammatory markers in adolescents. Ann. Nutr. Metab. 2017, 70, 259–267. [Google Scholar] [CrossRef] [PubMed]
- Ridker, P.M. Anticytokine agents: Targeting interleukin signaling pathways for the treatment of atherothrombosis. Circ. Res. 2019, 124, 437–450. [Google Scholar] [CrossRef] [PubMed]
- Lin, T.J.; Tang, S.C.; Liao, P.Y.; Dongoran, R.A.; Yang, J.H.; Liu, C.H. A comparison of L-carnitine and several cardiovascular-related biomarkers between healthy vegetarians and omnivores. Nutrition 2019, 66, 29–37. [Google Scholar] [CrossRef]
- Lai, Y.H.; Lee, M.C.; Ho, G.J.; Liu, C.H.; Hsu, B.G. Association of low serum L-Carnitine levels with peripheral arterial stiffness in patients who undergo kidney transplantation. Nutrients 2019, 11, 2000. [Google Scholar] [CrossRef] [Green Version]
- Dongoran, R.A.; Wang, K.H.; Lin, T.J.; Yuan, T.C.; Liu, C.H. Anti-Proliferative effect of statins is mediated by DNMT1 inhibition and p21 expression in OSCC cells. Cancers 2020, 12, 2084. [Google Scholar] [CrossRef]
- Ma, Y.; Kind, T.; Vaniya, A.; Gennity, I.; Fahrmann, J.F.; Fiehn, O. An in silico MS/MS library for automatic annotation of novel FAHFA lipids. J. Cheminform. 2015, 7, 53. [Google Scholar] [CrossRef] [Green Version]
- Ng, D.P.; Salim, A.; Liu, Y.; Zou, L.; Xu, F.G.; Huang, S.; Leong, H.; Ong, C.N. A metabolomic study of low estimated GFR in non-proteinuric type 2 diabetes mellitus. Diabetologia 2012, 55, 499–508. [Google Scholar] [CrossRef] [Green Version]
- McCully, K.S. Homocysteine and the pathogenesis of atherosclerosis. Expert Rev. Clin. Pharmacol. 2015, 8, 211–219. [Google Scholar] [CrossRef]
- Su, T.C.; Jeng, J.S.; Wang, J.D.; Torng, P.L.; Chang, S.J.; Chen, C.F.; Liau, C.S. Homocysteine, circulating vascular cell adhesion molecule and carotid atherosclerosis in postmenopausal vegetarian women and omnivores. Atherosclerosis 2006, 184, 356–362. [Google Scholar] [CrossRef] [PubMed]
- Yang, A.N.; Zhang, H.P.; Sun, Y.; Yang, X.L.; Wang, N.; Zhu, G.; Zhang, H.; Xu, H.; Ma, S.C.; Zhang, Y.; et al. High-methionine diets accelerate atherosclerosis by HHcy-mediated FABP4 gene demethylation pathway via DNMT1 in ApoE(-/-) mice. FEBS Lett. 2015, 589, 3998–4009. [Google Scholar] [CrossRef] [PubMed] [Green Version]
- Liu, C.; Wang, Q.; Guo, H.; Xia, M.; Yuan, Q.; Hu, Y.; Zhu, H.; Hou, M.; Ma, J.; Tang, Z.; et al. Plasma S-adenosylhomocysteine is a better biomarker of atherosclerosis than homocysteine in apolipoprotein E-deficient mice fed high dietary methionine. J. Nutr. 2008, 138, 311–315. [Google Scholar] [CrossRef] [PubMed] [Green Version]
- Zawada, A.M.; Rogacev, K.S.; Hummel, B.; Berg, J.T.; Friedrich, A.; Roth, H.J.; Obeid, R.; Geisel, J.; Fliser, D.; Heine, G.H. S-adenosylhomocysteine is associated with subclinical atherosclerosis and renal function in a cardiovascular low-risk population. Atherosclerosis 2014, 234, 17–22. [Google Scholar] [CrossRef] [PubMed]
- Xiao, Y.; Su, X.; Huang, W.; Zhang, J.; Peng, C.; Huang, H.; Wu, X.; Huang, H.; Xia, M.; Ling, W. Role of S-adenosylhomocysteine in cardiovascular disease and its potential epigenetic mechanism. Int. J. Biochem. Cell Biol. 2015, 67, 158–166. [Google Scholar] [CrossRef]
- Huang, X.; Lv, X.; Song, H.; Yang, Q.; Sun, Y.; Zhang, W.; Yu, X.; Dong, S.; Yao, W.; Li, Y.; et al. The relationship between S-adenosylhomocysteine and coronary artery lesions: A case control study. Clin. Chim. Acta 2017, 471, 314–320. [Google Scholar] [CrossRef]
- Flanagan, J.L.; Simmons, P.A.; Vehige, J.; Willcox, M.D.; Garrett, Q. Role of carnitine in disease. Nutr. Metab. 2010, 7, 30. [Google Scholar] [CrossRef] [Green Version]
- Moghaddas, A.; Dashti-Khavidaki, S. Potential protective effects of l-carnitine against neuromuscular ischemia-reperfusion injury: From experimental data to potential clinical applications. Clin. Nutr. 2016, 35, 783–790. [Google Scholar] [CrossRef]
- Lee, B.J.; Lin, J.S.; Lin, Y.C.; Lin, P.T. Antiinflammatory effects of L-carnitine supplementation (1000 mg/d) in coronary artery disease patients. Nutrition 2015, 31, 475–479. [Google Scholar] [CrossRef]
- Lee, B.J.; Lin, J.S.; Lin, Y.C.; Lin, P.T. Effects of L-carnitine supplementation on lipid profiles in patients with coronary artery disease. Lipids Health Dis. 2016, 15, 107. [Google Scholar] [CrossRef] [Green Version]
- Cetinkaya, A.; Bulbuloglu, E.; Kantarceken, B.; Ciralik, H.; Kurutas, E.B.; Buyukbese, M.A.; Gumusalan, Y. Effects of L-carnitine on oxidant/antioxidant status in acetic acid-induced colitis. Dig. Dis. Sci. 2006, 51, 488–494. [Google Scholar] [CrossRef] [PubMed]
- Koc, A.; Ozkan, T.; Karabay, A.Z.; Sunguroglu, A.; Aktan, F. Effect of L-carnitine on the synthesis of nitric oxide in RAW 264.7 murine macrophage cell line. Cell Biochem. Funct. 2011, 29, 679–685. [Google Scholar] [CrossRef] [PubMed]
- Adeva-Andany, M.M.; Carneiro-Freire, N.; Seco-Filgueira, M.; Fernandez-Fernandez, C.; Mourino-Bayolo, D. Mitochondrial beta-oxidation of saturated fatty acids in humans. Mitochondrion 2019, 46, 73–90. [Google Scholar] [CrossRef] [PubMed]
- Koeth, R.A.; Wang, Z.; Levison, B.S.; Buffa, J.A.; Org, E.; Sheehy, B.T.; Britt, E.B.; Fu, X.; Wu, Y.; Li, L.; et al. Intestinal microbiota metabolism of L-carnitine, a nutrient in red meat, promotes atherosclerosis. Nat. Med. 2013, 19, 576–585. [Google Scholar] [CrossRef] [PubMed] [Green Version]
- Koeth, R.A.; Levison, B.S.; Culley, M.K.; Buffa, J.A.; Wang, Z.; Gregory, J.C.; Org, E.; Wu, Y.; Li, L.; Smith, J.D.; et al. gamma-Butyrobetaine is a proatherogenic intermediate in gut microbial metabolism of L-carnitine to TMAO. Cell Metab. 2014, 20, 799–812. [Google Scholar] [CrossRef] [Green Version]
- Wang, Z.; Roberts, A.B.; Buffa, J.A.; Levison, B.S.; Zhu, W.; Org, E.; Gu, X.; Huang, Y.; Zamanian-Daryoush, M.; Culley, M.K.; et al. Non-lethal Inhibition of Gut Microbial Trimethylamine Production for the Treatment of Atherosclerosis. Cell 2015, 163, 1585–1595. [Google Scholar] [CrossRef] [Green Version]
- Fukami, K.; Yamagishi, S.; Sakai, K.; Kaida, Y.; Yokoro, M.; Ueda, S.; Wada, Y.; Takeuchi, M.; Shimizu, M.; Yamazaki, H.; et al. Oral L-carnitine supplementation increases trimethylamine-N-oxide but reduces markers of vascular injury in hemodialysis patients. J. Cardiovasc. Pharmacol. 2015, 65, 289–295. [Google Scholar] [CrossRef]
- Cao, H.; Gerhold, K.; Mayers, J.R.; Wiest, M.M.; Watkins, S.M.; Hotamisligil, G.S. Identification of a lipokine, a lipid hormone linking adipose tissue to systemic metabolism. Cell 2008, 134, 933–944. [Google Scholar] [CrossRef] [Green Version]
- Yang, Z.H.; Pryor, M.; Noguchi, A.; Sampson, M.; Johnson, B.; Pryor, M.; Donkor, K.; Amar, M.; Remaley, A.T. Dietary palmitoleic acid attenuates atherosclerosis progression and hyperlipidemia in low-density lipoprotein receptor-deficient mice. Mol. Nutr. Food Res. 2019, 63, e1900120. [Google Scholar] [CrossRef]
- Guo, X.; Li, H.; Xu, H.; Halim, V.; Zhang, W.; Wang, H.; Ong, K.T.; Woo, S.L.; Walzem, R.L.; Mashek, D.G.; et al. Palmitoleate induces hepatic steatosis but suppresses liver inflammatory response in mice. PLoS ONE 2012, 7, e39286. [Google Scholar] [CrossRef]


| Variable | Subjects (Male n = 24, Female n = 33) Mean ± SD | Normal Range |
|---|---|---|
| Age (years old) | 49.9 ± 12.4 | n/a |
| Height (cm) | 162.2 ± 8.5 | n/a |
| Body weight (kg) | 63.2 ± 13.2 | n/a |
| Body mass index (BMI, kg/m2) | 23.6 ± 3.3 | n/a |
| Fasting blood glucose (mg/dL) | 95.0 ± 25.7 | <125 |
| Triglyceride (TG, mg/dL) | 122.4 ± 66.4 | <200 |
| Total cholesterol (TCH, mg/dL) | 174.2 ± 31.9 | <200 |
| High-density lipoprotein cholesterol (HDL-C, mg/dL) | 54.5 ± 13.7 | >40 |
| Low-density lipoprotein cholesterol (LDL-C, mg/dL) | 101.0 ± 25.7 | <130 |
| FAHFAs, CV-Related Biomarkers, and Fatty Acids | Subjects (Male n = 24, Female n = 33) Mean ± SD |
|---|---|
| 9-POHSA (nM) | 1184.4 ± 526.1 |
| 9-OAHSA (nM) | 374.0 ± 194.6 |
| l-homocysteine (l-Hcy, µg/L) | 1081.5 ± 479.8 |
| S-adenosyl-L- homocysteine (SAH, µg/L) | 8.7 ± 4.6 |
| l-carnitine (l-Car, µg/L) | 4576.0 ± 1724.5 |
| Trimethylamine N-oxide (TMAO, µg/L) | 273.5 ± 55.2 |
| Palmitic acid (PA, µM) | 322.1 ± 123.9 |
| Stearic acid (SA, µM) | 400.4 ± 190.6 |
| Palmitoleic acid (POA, µM) | 17.5 ± 11.0 |
| Oleic acid (OA, µM) | 226.1 ± 83.0 |
Publisher’s Note: MDPI stays neutral with regard to jurisdictional claims in published maps and institutional affiliations. |
© 2020 by the authors. Licensee MDPI, Basel, Switzerland. This article is an open access article distributed under the terms and conditions of the Creative Commons Attribution (CC BY) license (http://creativecommons.org/licenses/by/4.0/).
Share and Cite
Dongoran, R.A.; Lin, T.-J.; Byekyet, A.; Tang, S.-C.; Yang, J.-H.; Liu, C.-H. Determination of Major Endogenous FAHFAs in Healthy Human Circulation: The Correlations with Several Circulating Cardiovascular-Related Biomarkers and Anti-Inflammatory Effects on RAW 264.7 Cells. Biomolecules 2020, 10, 1689. https://doi.org/10.3390/biom10121689
Dongoran RA, Lin T-J, Byekyet A, Tang S-C, Yang J-H, Liu C-H. Determination of Major Endogenous FAHFAs in Healthy Human Circulation: The Correlations with Several Circulating Cardiovascular-Related Biomarkers and Anti-Inflammatory Effects on RAW 264.7 Cells. Biomolecules. 2020; 10(12):1689. https://doi.org/10.3390/biom10121689
Chicago/Turabian StyleDongoran, Rachmad Anres, Tsung-Jen Lin, Akhsholphan Byekyet, Sheau-Chung Tang, Jen-Hung Yang, and Chin-Hung Liu. 2020. "Determination of Major Endogenous FAHFAs in Healthy Human Circulation: The Correlations with Several Circulating Cardiovascular-Related Biomarkers and Anti-Inflammatory Effects on RAW 264.7 Cells" Biomolecules 10, no. 12: 1689. https://doi.org/10.3390/biom10121689