Physiological, Transcriptomic, and Metabolic Responses of Ginkgo biloba L. to Drought, Salt, and Heat Stresses


College of Horticulture and Plant Protection, Yangzhou University, Yangzhou 225009, China
*
Author to whom correspondence should be addressed.
†
These authors contributed equally to this paper.
Biomolecules 2020, 10(12), 1635; https://doi.org/10.3390/biom10121635
Submission received: 3 November 2020
/
Revised: 2 December 2020
/
Accepted: 2 December 2020
/
Published: 3 December 2020
(This article belongs to the Special Issue Biomolecules as Potential Growth Regulators in Plants Facing Abiotic Stress)
Abstract
:Ginkgo biloba L. is highly adaptable and resistant to a range of abiotic stressors, allowing its growth in various environments. However, it is unclear how G. biloba responds to common environmental stresses. We explored the physiological, transcriptomic, and metabolic responses of G. biloba to short-term drought, salt, and heat stresses. Proline, H2O2, and ABA contents, along with CAT activity, increased under all three types of stress. SOD activity increased under salt and heat stresses, while soluble protein and IAA contents decreased under drought and salt stresses. With respect to metabolites, D-glyceric acid increased in response to drought and salt stresses, whereas isomaltose 1, oxalamide, and threonine 2 increased under drought. Piceatannol 2,4-hydroxybutyrate and 1,3-diaminopropane increased under salt stress, whereas 4-aminobutyric acid 1 and galactonic acid increased in response to heat stress. Genes regulating nitrogen assimilation were upregulated only under drought, while the GRAS gene was upregulated under all three types of stressors. ARF genes were downregulated under heat stress, whereas genes encoding HSF and SPL were upregulated. Additionally, we predicted that miR156, miR160, miR172, and their target genes participate in stress responses. Our study provides valuable data for studying the multilevel response to drought, salinity, and heat in G. biloba.
Keywords:
Ginkgo biloba L.; drought stress; salt stress; heat stress; transcriptome; miRNA; metabolome1. Introduction
Plants frequently experience adverse growth conditions, including drought, salinity, and extreme temperatures. These stresses limit development primarily by affecting physiological and biochemical processes and cellular homeostasis. Drought and salinity impose osmotic stress, resulting in turgor loss in cells, and salinity may also induce an imbalance in cellular ion homeostasis [1,2]. Heat stress may reduce cell water content. In addition, environmental stress may lead to disorganization of cell membranes and excess reactive oxygen species (ROS) production, resulting in oxidative damage [3,4].
Plants have a remarkable capacity to cope with a variety of environmental stresses. Survival under environmental stress requires the integration of adaptive metabolic, physiological, and molecular responses [5,6]. For example, plants may control water flux and cellular osmotic adjustment via stomatal closure, activation of respiration, and biosynthesis of osmoprotectants to resist drought, salt, and heat stresses [1]. In addition, a range of protein kinases and transcription factors involved in stress signaling serve to regulate ionic and osmotic homeostasis [5]. Under salt stress, plants sense ionic (Na+) toxicity on the surface of the plasma membrane of cells, where SnRK3 SOS2-like protein kinases interact with SOS2-like protein kinases to activate the Na+/H+ antiporter SOS1 via the SOS pathway, thereby maintaining Na+ homeostasis in cells [2]. Drought may trigger production of abscisic acid (ABA), which in turn stimulates stomatal closure and expression of stress-related genes. For example, the ABA-activated SnRK2 protein kinase regulates stomatal closure [4,5]. In addition, Dehydration-responsive element binding protein 1 and 2 (DREB2) are induced by dehydration and may activate other genes involved in drought tolerance [5,7]. Heat stress induces heat shock proteins (HSPs, e.g., HSP70, HSP90, and HSP100) and complex transcriptional networks, including HEAT SHOCK TRANSCRIPTION FACTOR A1s (HSFA1s) and DREB2A. Among these, HSFA1s is the master regulator of the heat stress response, directly regulating important transcription factors such as DREB2A, HSFA2, and HSFBs [3]. Plants thus respond to different environmental stressors via a variety of pathways; however, different transcription factors may be involved in the responses to different types of stress. While such responses have been evaluated extensively and intensively in model species, studies on gymnosperms are lacking.
Ginkgo biloba L., sometimes referred to as a “living fossil”, is a relict gymnosperm species [8] that has been introduced in many countries [9]. G. biloba exhibits a high degree of environmental adaptability and resistance to pathogens and consequently has a very long lifespan [10]. Studies of abiotic stress in G. biloba have focused mainly on leaf morphology and observations of anatomical structures, osmotic regulators, secondary metabolites, and photosynthetic capacity [11,12,13]. The rapid development of omics technology in recent years has facilitated research on the molecular responses of G. biloba to abiotic stress. The v-myb avian myeloblastosis viral oncogene homolog transcription factor family plays an important role in development, defense, and flavonoid biosynthesis in G. biloba [14]. Cao et al. [15] isolated three HSP genes (GbHSP16.8, GbHSP17, and GbHSP70) from G. biloba leaves subject to cold stress. In addition, the flavonoid biosynthesis-related genes GbPALs and GbFLSs were found to be significantly upregulated under salt stress [16]. However, few reports have examined stress resistance mechanisms at the transcriptional, post-transcriptional, and metabolite levels. Therefore, we hypothesize that there are different biomolecules involved in the responses to different stresses in G. biloba.
In this study, we analyzed the physiological, transcriptomic, and metabolic responses of G. biloba leaves to drought, salt, and heat stresses at the transcriptional and post-transcriptional levels. We analyzed soluble sugar, soluble protein, proline, ROS, superoxide dismutase (SOD), catalase (CAT), ABA, and auxin (IAA) and identified key transcription factors and other proteins involved in the responses to the three types of stress. In addition, we identified several miRNAs and target genes implicated in stress responses. Finally, we constructed the mode pattern of the responses to the three types of stress. The identification of these physiological and biochemical indicators and genes, transcript factors, and miRNAs in response to stresses, provides valuable insights for elucidating the response mechanism to drought, salt, and heat stresses in gymnosperms.
2. Materials and Methods
2.1. Plant Growth and Treatments
We used 2-year-old seedlings in the stress experiments, as 1-year-old plants do not have mature woody stems. Seeds were collected from a single parent plant at the experimental base at Yangzhou University (32°20′ N, 119°30′ E). Seeds were sown in 650 mm × 650 mm × 750 mm nursery pots in a 1:1:1 v/v/v mixture of soil, vermiculite, and perlite. Following germination, we thinned seedlings to three per pot. G. biloba seedlings were grown in the natural environment under full sun. The potted seedlings were placed in the growth chambers (day 25 °C, 16 h/night 18 °C, 8 h) a week before experiments. Next, all the stress treatments were conducted in the growth chambers. Irrigation is usually carried out when the weight of the pots significantly decreased. Distilled water was added to trays for soaking pots. 2 h later, the surplus water was poured away. We irrigated the tray with 1/2 MS nutrient solution once per month after the leaf expanded (during the growing period). After leaf expansion in June of the following year, we selected seedlings exhibiting robust growth and a uniform size for use in the stress treatments, and the seedling sizes were about 18–22 cm high and 8–12 cm wide (Figure S1). All seedlings were divided into four groups with five pots per group, and each group contained at least 15 seedlings. One group was used as CK, and the other three were subjected to D (drought), S (salt), and H (heat) treatments. Based on preliminary experiments, we used 20% PEG6000 to simulate D, a 200 mmol/L NaCl solution to simulate S, and a temperature of 40 °C to simulate H. Infrared thermography (FLIR E8) indicated that the leaf temperatures had increased significantly after 24 h of exposure to the stress treatments. Based on these observations, a 24-h treatment period was chosen for the experiment.
Pots used for D treatment were irrigated and soaked in a 20% PEG6000 solution for 24 h. For S treatment, pots were irrigated and soaked in 200 mmol/L NaCl solution for 24 h. In the H treatment, pots were subjected to 40 °C in growth chambers for 24 h. Since the top of the leaves were too young to fully expand, and older leaves at the base may be insensitive to respond to stresses, thus we selected leaves in the middle of the plants with a full expand status. Considering the similar growth status and the size of sampled plants, we further selected three seedlings with plenty of leaves from the 15 seedlings as the samples for transcriptomic and metabolic analyses. We did five biological repetitions of the metabolic analysis, and selected another two seedlings (a total of five seedlings) as the samples for metabolic analysis. We sampled the leaves following the treatment applications, and the leaves were rinsed in distilled water, dried with paper towels, and immediately snap-frozen in liquid nitrogen. Samples were stored at −80 °C prior to analysis. The samples of physiological analyses were from the same batch samples used for transcriptomic and metabolic analyses.
2.2. RNA Extraction, Sequencing, and Analyses
Total RNA was isolated from the leaves of three biological replicates from each treatment for use in RNA extraction and sequencing. Total RNA was extracted using the Mini BEST Plant RNA Extraction Kit (TaKaRa Bio Inc., Beijing, China) and treated with a genomic DNA Eraser (TaKaRa Bio Inc.) to reduce or eliminate DNA contamination. RNA integrity was assessed using the RNA Nano 6000 Assay Kit and the Bioanalyzer 2100 system (Agilent Technologies, Santa Clara, CA, USA). A total of 12 RNA-seq libraries were prepared using the NEBNext Ultra RNA Library Prep Kit for Illumina (NEB, Ipswich, MA, USA). Illumina-based sequencing was conducted on the HiSeq 2500 platform (Illumina Inc., San Diego, CA, USA). Following removal of reads containing adapters or ploy-N and low-quality reads, filtered reads were mapped to the Arabidopsis thaliana genome (TAIR 10) using TopHat2. We then calculated reads per kilobase of transcript per million mapped reads for each gene, based on gene length and the number of reads mapped to each gene. Differential expression analysis was performed using the DESeq package (1.18.0) in R. A fold change ≥1.5 and an adjusted p-value <0.05 were used as thresholds to evaluate the significance of differences in transcript levels. Sequenced data were deposited in the Genome Sequence Archive (GSA) database under accession number CRA003339.
2.3. Metabolomic Analysis
As the internal standard, 0.48 mL of methanol: water (3:1, v/v) and 24 μL of adonitol (1 mg/mL stock in dH2O) were added to 0.06 g of each sample in a 2 mL Eppendorf tube. The mixture was homogenized in a ball mill for 4 min at 50 Hz, followed by sonication for 2 × 5 min, while incubating in ice water. After centrifugation at 13,000× g at 4 °C for 15 min, 350 μL of supernatant was transferred into fresh 2 mL GC–MS glass vials. After drying the samples with a vacuum concentrator, we added 80 μL methoxyamine hydrochloride (20 mg/mL in pyridine) to each sample and incubated at 80 °C for 30 min. We then added 100 μL of BSTFA regent (1% TMCS, v/v) and incubated at 70 °C for 1.5 h, mixing the mixture well prior to GC–TOF–MS analysis.
GC–TOF–MS analysis was performed using the 7890A gas chromatograph system coupled with the Pegasus HT time-of-flight mass spectrometer (Agilent Technologies). The system used a DB-5MS capillary column coated with 5% diphenyl cross-linked with 95% dimethylpolysiloxane (30 m × 250 μm inner diameter, 0.25 μm film thickness; J&W Scientific, Folsom, CA, USA). A 1 μL aliquot of the analyte was injected in the splitless mode. We used helium as the carrier gas, a front inlet purge flow rate of 3 mL/min, and a gas flow rate of 1 mL/min through the column. The temperature was maintained at 50 °C for 1 min, then rose to 310 °C at a rate of 10 °C/min, and maintained at 310 °C for 8 min. The injection, transfer line, and ion source temperatures were 280 °C, 270 °C, and 220 °C, respectively. Energy was −70 eV in the electron impact mode. Mass spectrometry data were acquired in the full-scan mode with an m/z range of 50–500 at a rate of 20 spectra/second after a solvent delay of 460 s. Analyses were conducted on a minimum of five biological replicates per treatment.
We used Chroma TOF 4.3X software (LECO Corporation, Saint-Joseph, MI, USA) and the LECO-Fiehn Rtx5 database for raw peak extraction, data baseline filtering, baseline calibration, peak alignment, deconvolution analysis, peak identification, and integration of peak areas. The retention time index method was used for peak identification, with a tolerance of 5000.
2.4. sRNA Sequencing and Bioinformatic Analysis
Total RNA was separated using 15% denaturing PAGE to recover sRNAs 18–30 nt in length. The sRNAs were then purified and used to synthesize cDNA, which in turn was sequenced on the HiSeq 2500 platform. Known miRNAs were identified by the BLASTN search against the miRBase 20.0 database, using the default parameters. Potential novel miRNAs were identified using MIREAP software. We used the Web-based program psRNATarget to identify putative targets for known and novel miRNAs. Networks (conjoint analysis of miRNAs and mRNAs) were drawn using Cytoscape.
2.5. Hormone Quantification
Leaves from each treatment were used to analyze the levels of endogenous ABA and IAA. Extraction and purification were conducted following the methods described in [9]. Briefly, samples were ground into a powder with a mortar and pestle, and 100 mg subsamples were transferred to precooled 2 mL screw-cap tubes and stored in liquid nitrogen. We added 500 µL of extraction solvent (2-propanol:H2O:concentrated HCl (2:1:0.002, v/v/v)) to each tube, along with varying volumes of internal standard solutions. Tubes were centrifuged on a shaker at 100 rpm for 30 min at 4 °C. We then added 1 mL of dichloromethane to each sample and shook the samples for 30 min at 4 °C. Tubes were further centrifuged at 13,000× g for 5 min at 4 °C, and 900 µL solvent from the lower phase was transferred into a screw-cap vial and concentrated using a nitrogen evaporator. Samples were then redissolved in 100 μL of methanol, and 50 µL of sample solution was injected into a reverse-phase C18 Gemini HPLC column for high-performance liquid chromatography/electrospray ionization tandem mass spectrometry analysis. Quantitative analysis of hormones followed [17].
2.6. H2O2 Concentration
Fresh leaf samples (0.1 g) in 0.9 mL 50 mmol/L phosphate buffer (pH = 7.8) were homogenized in an ice bath and centrifuged at 10,000× g for 10 min at 4 °C. The concentration of H2O2 in the supernatant was determined colorimetrically using a commercial kit (BCA assay, Nanjing Jiancheng Bioengineering Institute, Nanjing, China). We used 3–5 leaves from three biological replicates per treatment to ensure that sufficient amounts of tissue were sampled.
2.7. Soluble Sugar, Soluble Protein, and Proline Concentrations
Three biological replicates per treatment were sampled for each of the following analyses. To assess the concentration of soluble sugar, 0.1 g of fresh leaves in 1 mL distilled water were homogenized in an ice bath and then placed in a water bath at 95 °C for 10 min. After cooling, the samples were centrifuged at 8000× g for 10 min at 25 °C and diluted with distilled water to 10 mL. The soluble sugar concentration in the supernatant was determined using anthrone colorimetry with a commercial kit (Suzhou Comin Bioengineering, Suzhou, China).
For the soluble protein concentration, 0.1 g of fresh leaves in 1 mL of distilled water were homogenized in an ice bath and then centrifuged at 8000× g for 10 min at 4 °C. The soluble protein concentration in the supernatant was determined by the Coomassie brilliant blue method using a commercial kit (Suzhou Comin Bioengineering).
To assess the proline concentration, 0.1 g of fresh leaves in 1 mL of distilled water were homogenized in an ice bath and then placed in a water bath at 90 °C for 10 min. After cooling, the samples were centrifuged at 10,000× g for 10 min at 25 °C. The proline concentration in the supernatant was determined by spectrophotometry using a commercial kit (Suzhou Comin Bioengineering).
2.8. Antioxidant Enzyme Activity Assays
Three biological replicates per treatment were sampled for the following analyses. Fresh leaf samples (0.1 g) in 1 mL 50 mmol/L phosphate buffer (pH 7.8) were homogenized in an ice bath and centrifuged at 8000× g for 10 min at 4 °C. Activities of SOD and CAT were assessed using commercial kits (Suzhou Comin Bioengineering).
SOD activity was evaluated by measuring the rate at which the enzymes inhibited O2– production by xanthine morpholine with xanthine oxidase, as a function of the absorbance at 560 nm after 30 min. Measurements were conducted using a SOD assay kit. One unit of activity was defined as the quantity of SOD required to cause a 50% inhibition in the reduction of nitrotetrazolium blue chloride in 1 mL reaction solution.
CAT activity was measured by analyzing the decomposition rate of H2O2 expressed as a function of absorbance at 240 nm. One unit of enzyme was defined as the quantity required to break down 1 nmol of H2O2/min/mg tissue.
2.9. qRT-PCR
Total RNA was isolated from three biological replicates per treatment, as described above, for preparation and sequencing of the DEG library. Each RNA sample (approximately 1 μg of total RNA) was treated with gDNA Eraser (TaKaRa Bio Inc., Beijing, China) following the manufacturer instructions, to eliminate any contaminant gDNA. The treated RNA solution (10 μL) was reverse transcribed using the PrimeScript™ Reverse Transcriptase Reagent Kit with gDNA Eraser (Perfect Real Time; TaKaRa Bio Inc.) in accordance with the manufacturer’s protocols. Gene-specific primers were designed using Primer 5.0 and are listed in Table S5. GAPDH was used as the internal reference gene. qRT-PCR was performed on the Bio-Rad CFX96™ Real-Time System (Bio-Rad, Hercules, CA, USA) using the SYBR Premix Ex Taq™ Kit (Perfect Real Time; TaKaRa Bio Inc., Beijing, China) in accordance with the manufacturer’s protocols. qRT-PCR conditions were as follows: 30 s at 94 °C for denaturation, then 40 cycles of 5 s at 94 °C, 30 s at 56 °C, and 10 s at 72 °C. The relative expression levels of the target genes were calculated using the 2−ΔΔCt comparative threshold cycle method. All reactions were conducted on three biological replicates, and the results were analyzed using Bio-Rad CFX Manager software (V1.6.541.1028).
2.10. Statistical Analysis
The experimental data between control and treatments was analyzed using one-way ANOVA followed by Tukey’s post-hoc test with a significance level of 0.05 (p < 0.05; SPSS 18.0 software for Windows; SPSS, Chicago, IL, USA) [18].
3. Results
3.1. Physiological and Biochemical Changes
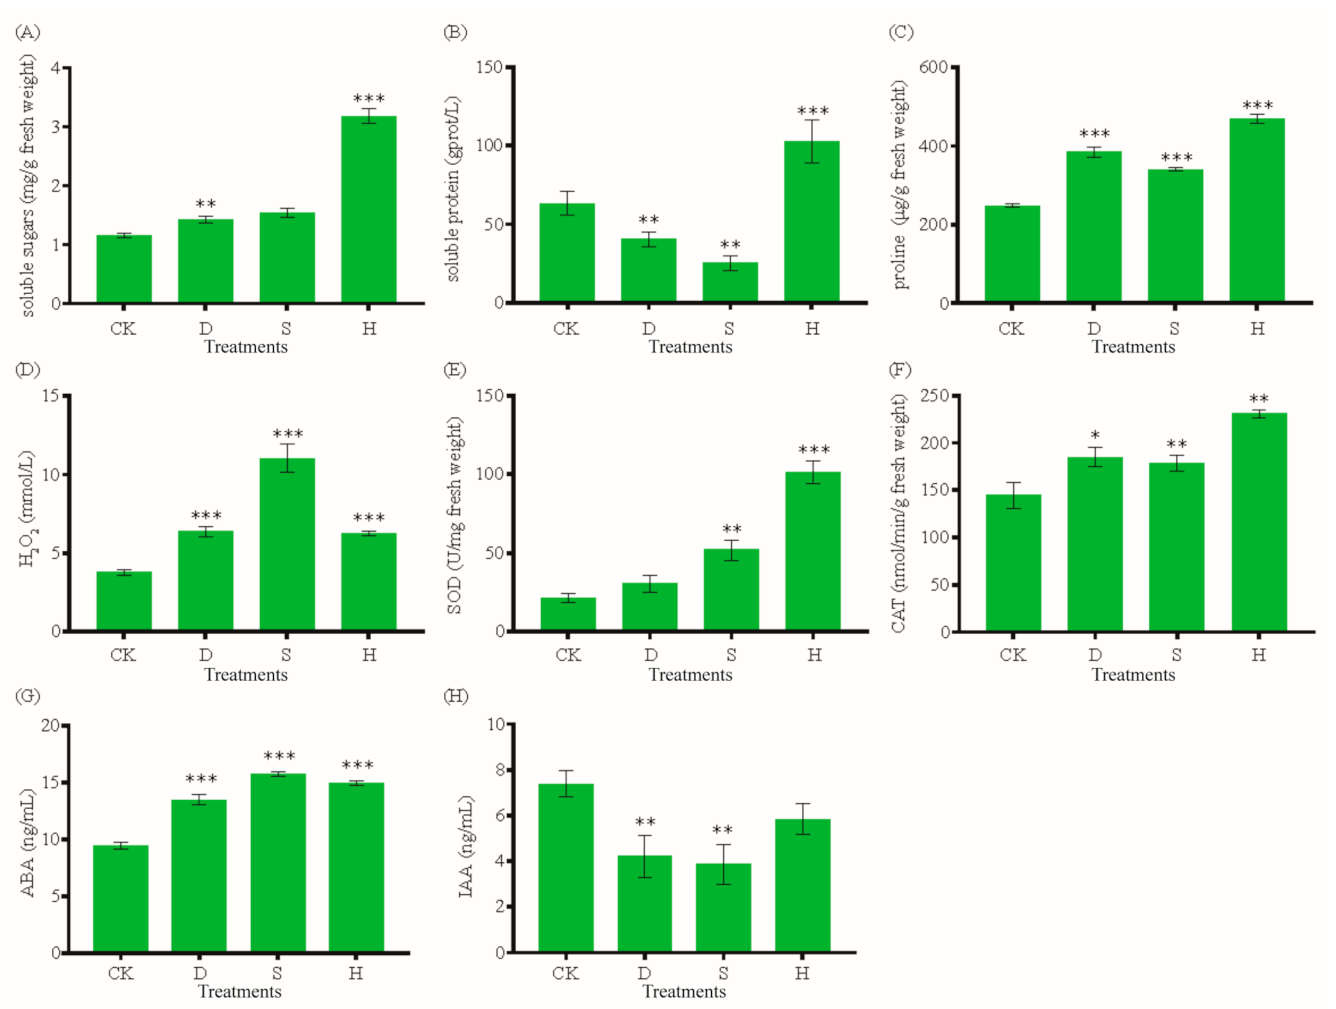
Drought (D), salt (S), and heat (H) stresses significantly affected the physiological and biochemical statuses of leaves. We examined the effects of D, S, and H on the concentrations of soluble proteins, soluble sugars, proline, and H2O2 and the activities of antioxidant enzymes (SOD and CAT), ABA, and IAA in leaves. The soluble sugar concentration increased significantly under H (Figure 1A). The soluble protein concentration decreased by 36% under D and 60% under S, but increased by 62% under H (Figure 1B). By contrast, the concentrations of both proline and H2O2 increased significantly under all stress treatments (Figure 1C,D). SOD activity was higher under S and H, and CAT activity increased under all stress treatments (Figure 1E,F). The leaf ABA concentration also increased under all stress treatments (Figure 1G), whereas IAA decreased by 42.84%, 47.71%, and 20.93% under D, S, and H, respectively (Figure 1H).
3.2. Changes in Metabolites
We determined changes in metabolites under D, S, and H using gas chromatography–time-of-flight–mass spectrometry (GC–TOF–MS). We identified 168 metabolites from seven categories, including carbohydrates, amino acids, lipids, organic acids, phenols, flavonoids, and others (Table S1). Next, using principal component analysis (Figure S2A, Table S2) and orthogonal projection to latent structure with discriminant analysis (Table S3), we classified metabolites by treatment group based on high-dimensional spectral measurements using GC–MS. Metabolites differed among treatments (a variable important in projection >1 and p < 0.05). The metabolome view map indicates that pathways enriched under D compared with the control group (CK; p < 0.05) included those involved in biosynthesis of valine, leucine, and isoleucine and metabolism of glycine, serine, and threonine (Figure S2B). Compared with CK, different metabolites involved in beta-alanine metabolism and the pentose phosphate pathway were enriched under S (Figure S2C), whereas metabolites associated with arginine and proline metabolism and the pentose phosphate pathway were enriched under H (Figure S2D).
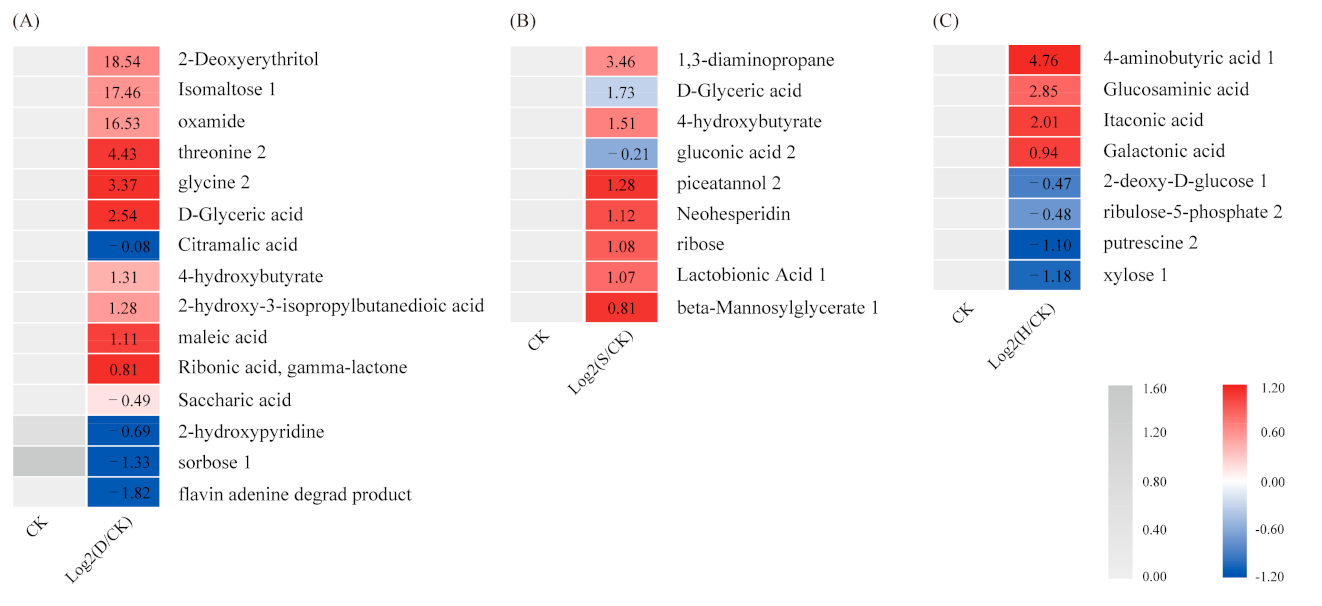
The major metabolites that accumulated under the stress treatments are listed in Table S1. The metabolite heat map (Figure 2) indicated that isomaltose 1, oxamide, threonine 2, glycine 2, D-glyceric acid, and 4-hydroxybutyrate all increased significantly under D compared with CK, whereas sorbose 1 decreased (Figure 2A). Piceatannol 2, D-glyceric acid, 1, 3-diaminopropane, 4-hydroxybutyrate, and lactobionic acid 1 all increased significantly under S (Figure 2B). In addition, 4-aminobutyric acid 1, glucosaminic acid, and galactonic acid all increased significantly under H, whereas putrescine 2 and xylose 1 decreased (Figure 2C).
3.3. Differentially Expressed Genes
We generated RNA-Seq data from leaves and obtained clean reads for three biological replicates from each treatment (Table S4). We used differential expression gene (DEG) analysis to examine the transcriptomic responses to D, S, and H (Supporting Information Figure S3). We filtered 397, 1007, and 4494 DEGs under D, S, and H, respectively (Figure S3A–C). Patterns in the heat map indicate that gene expression trends under D and S were similar but were significantly different from those under H (Figure S3D).
3.4. Respiratory Metabolism
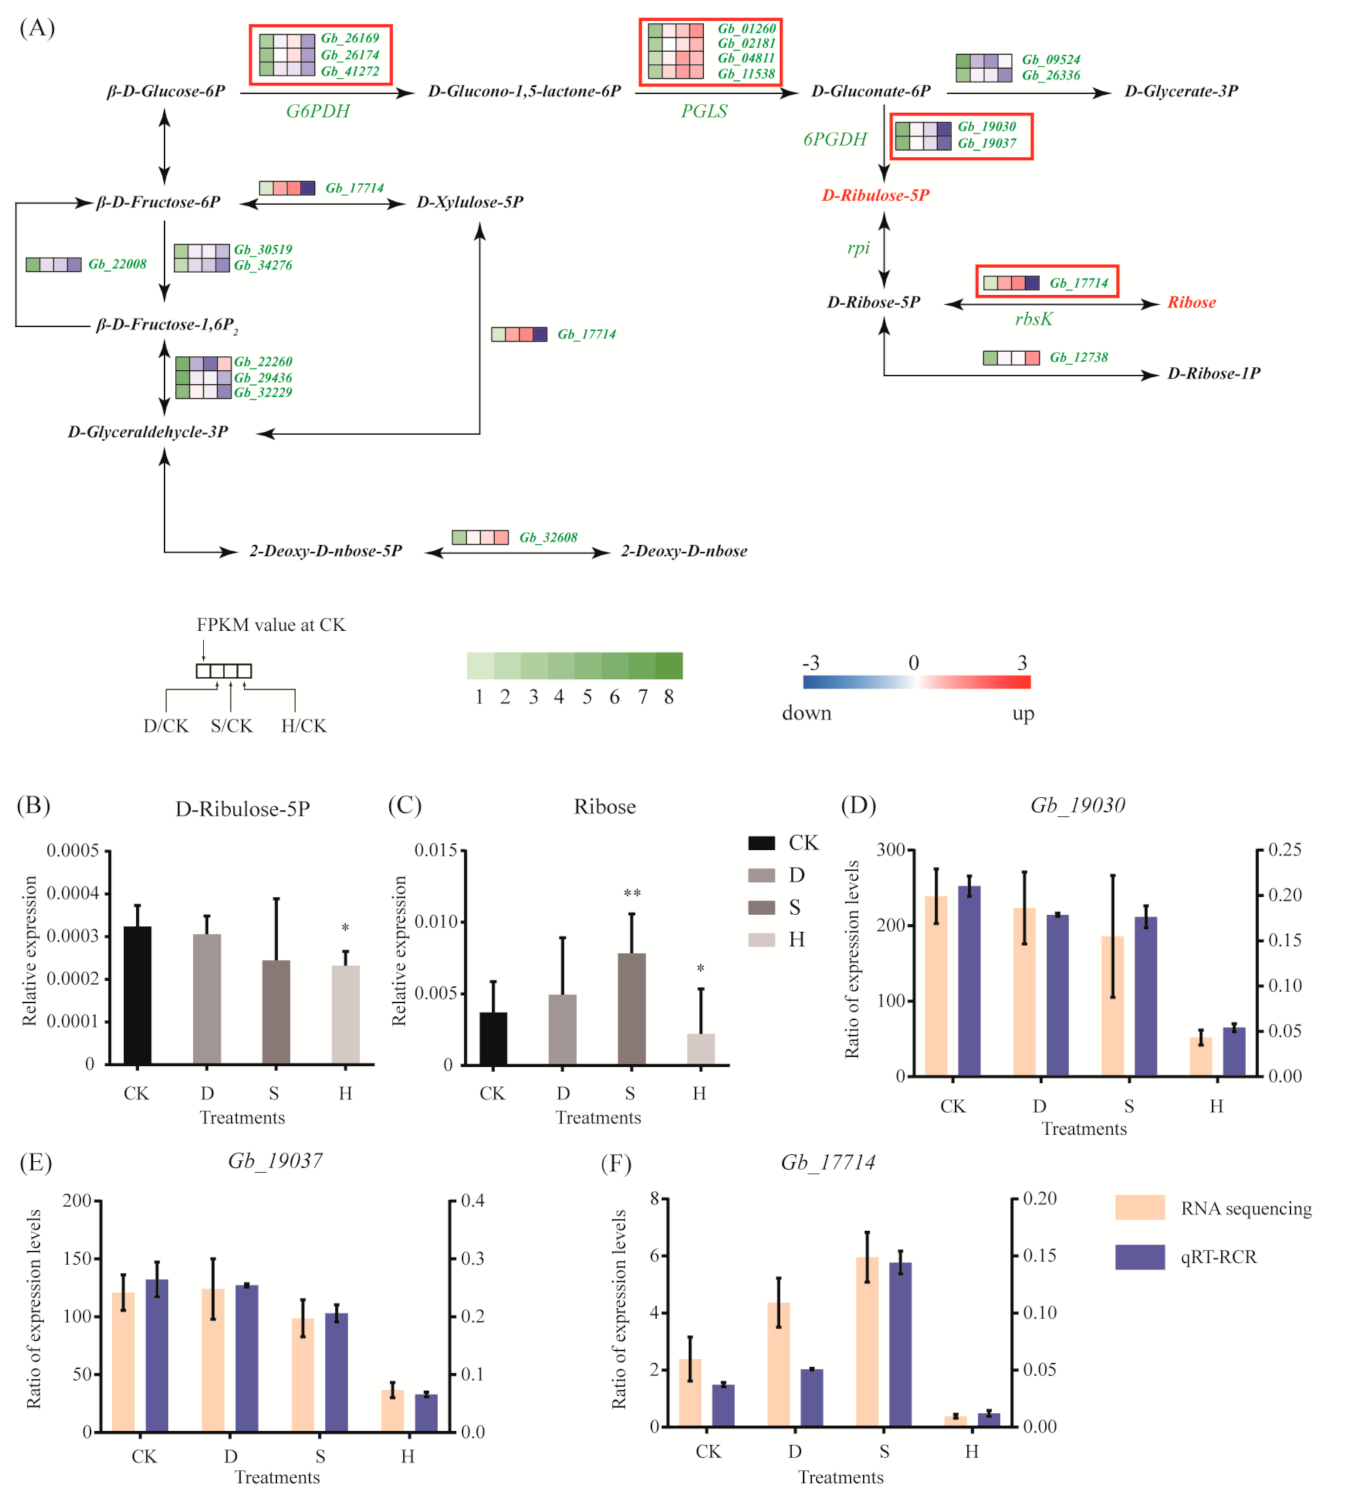
We analyzed the differential expression of genes that are key to the regulation of respiratory metabolism. In the pentose phosphate pathway, expression of PGLS, which regulates D-glucono-1,5-lactone-6P, hydrolyzed to D-gluconate-6P was upregulated under all three stress treatments, such as Gb_01260, Gb_02181, Gb_04811, and Gb_11538 (Figure 3A). However, expression of three genes (Gb_26169, Gb_26174, and Gb_41272) encoding glucose-6-phosphate dehydrogenase (G6PDH) and two genes (Gb_19030 and Gb_19037) encoding 6-phosphogluconate dehydrogenase (6PGDH) decreased significantly under H, but not under D or S. In addition, Gb_17714, which is involved in the metabolic link between D-ribose-5P and ribose, was upregulated under S but downregulated under H (Figure 3A). This is consistent with the metabolomic results, in which ribose content increased under S but D-ribulose-5P and ribose contents decreased under H (Figure 3B,C). In addition, we used quantitative reverse-transcription PCR (qRT-PCR) to verify key genes and confirmed that Gb_19030, Gb_19037, and Gb_17714 were downregulated under H (Figure 3D–F), whereas Gb_17714 was upregulated under S (Figure 3F).
3.5. Amino Acid Metabolism
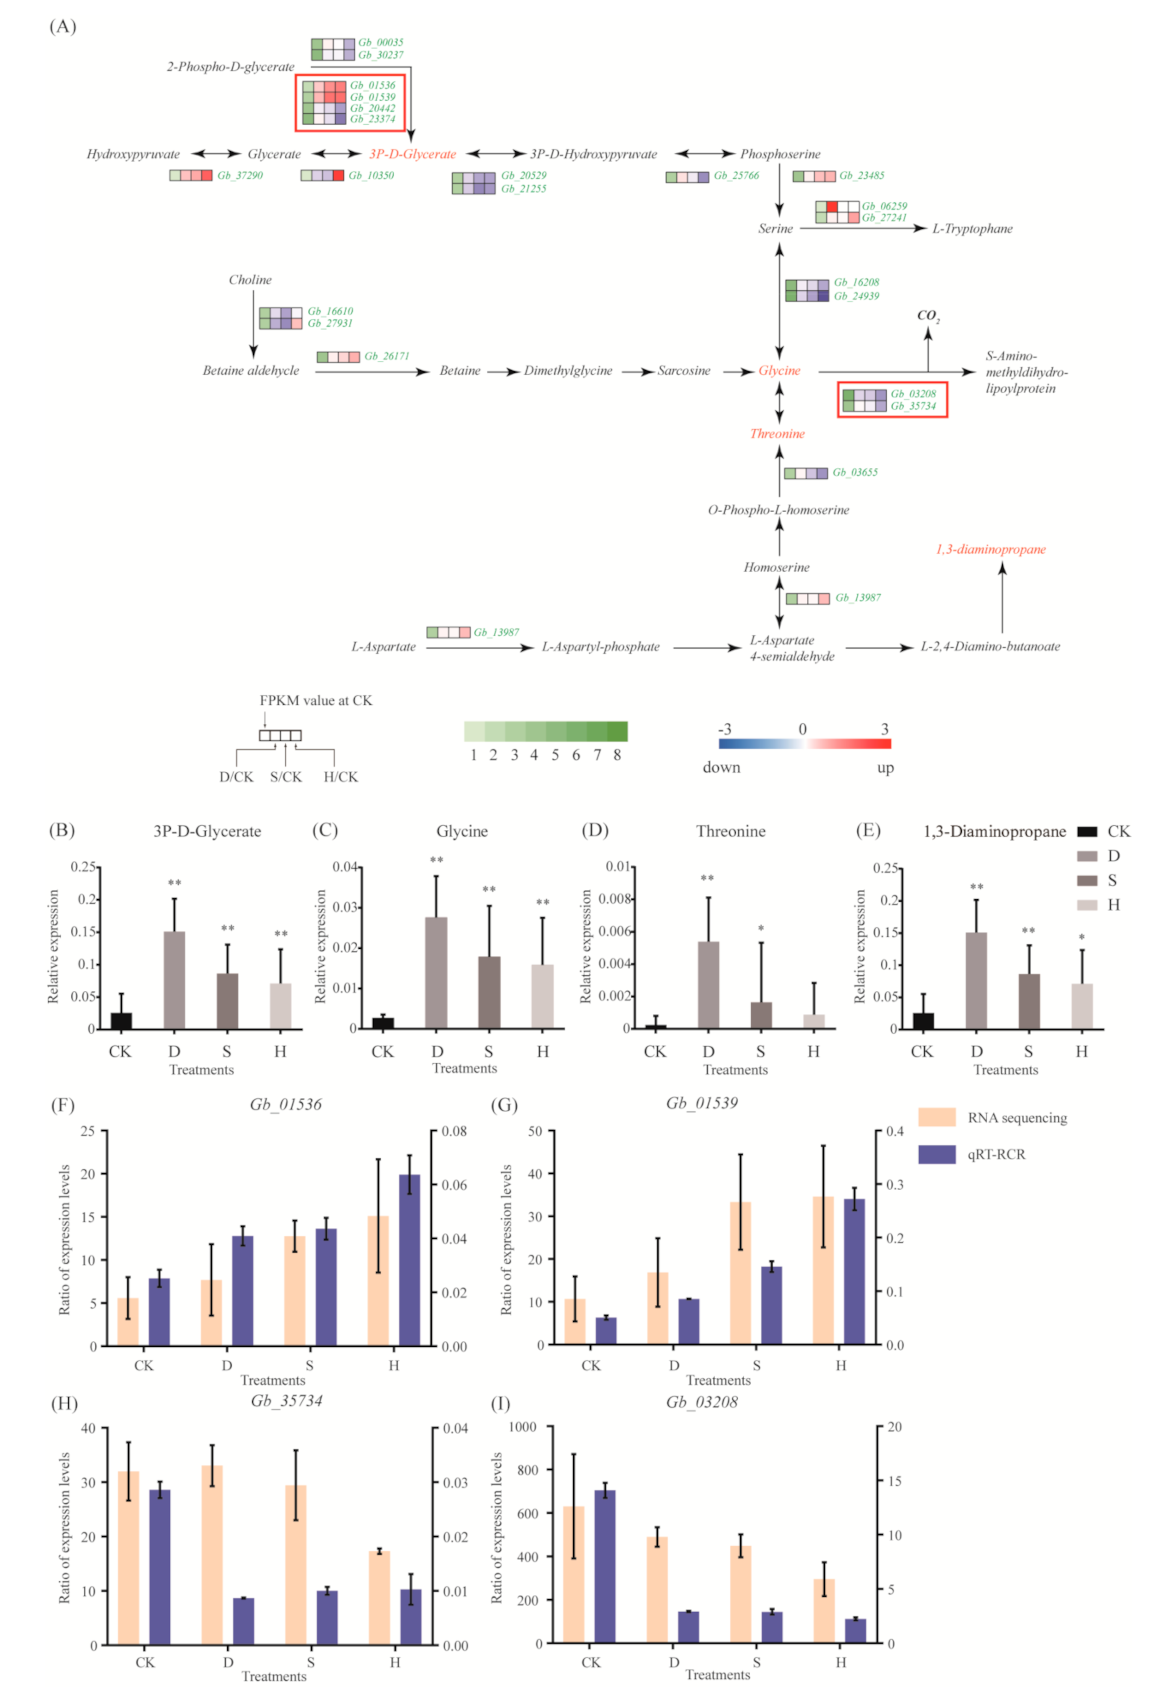
Most genes in the glycine, serine, and threonine metabolic pathway, including Gb_01536, Gb_01539, Gb_37290, Gb_23485, Gb_06259, and Gb_27241, were upregulated in response to all three treatments (Figure 4A). Two genes, Gb_03208 and Gb_35734, which are involved in the transformation of glycine into S-amino-methyldihydro-lipoylprotein and CO2, were downregulated under H (Figure 4A). Results of metabolomic analyses indicate that 3P-d-glycerate, glycine, threonine, and 1,3-diaminopropane levels increased in response to all three stress treatments (Figure 4B–E). Results of qRT-PCR confirmed the upregulation of Gb_01536 and Gb_01539 (Figure 4F,G) and the downregulation of Gb_35734 and Gb_03208 (Figure 4H,I).
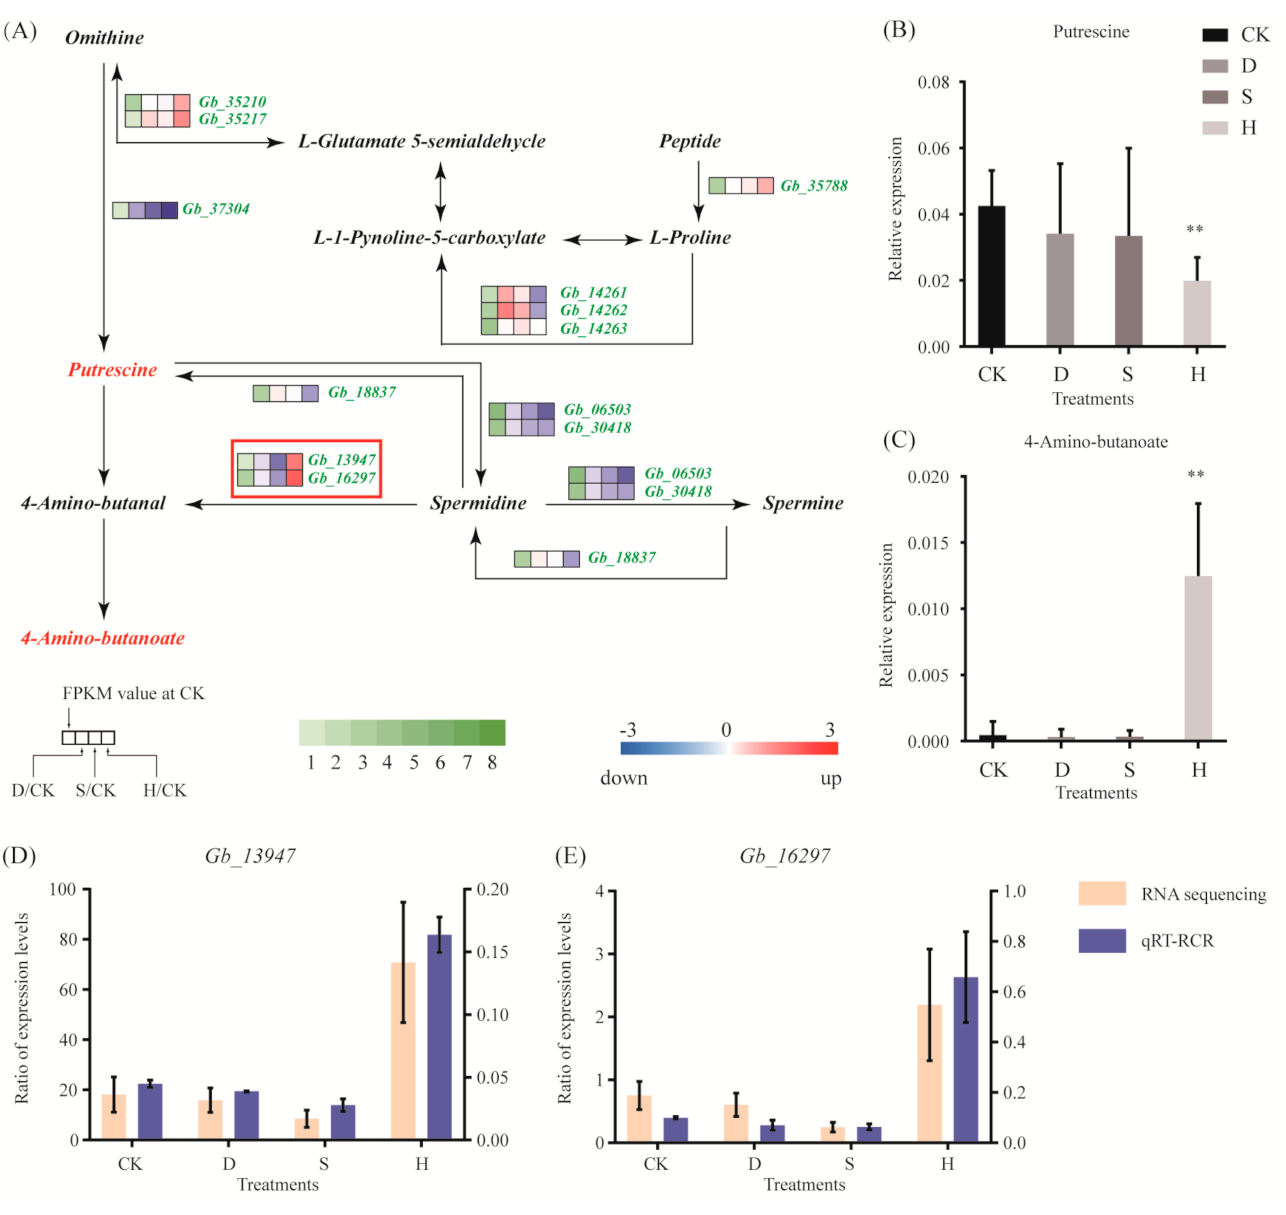
Few genes in the arginine and proline metabolic pathway exhibited significant changes in response to D or S; however, H triggered upregulation of Gb_13947 and Gb_16297, which were involved in the synthesis of 4-amino-butanoate (Figure 5A). The qRT-PCR results confirmed these results (Figure 5D). In addition, putrescine decreased (Figure 5B) and 4-amino-butanoate increased in response to H (Figure 5C).
3.6. Key Genes Responding to Drought, Salt, and Heat Stresses
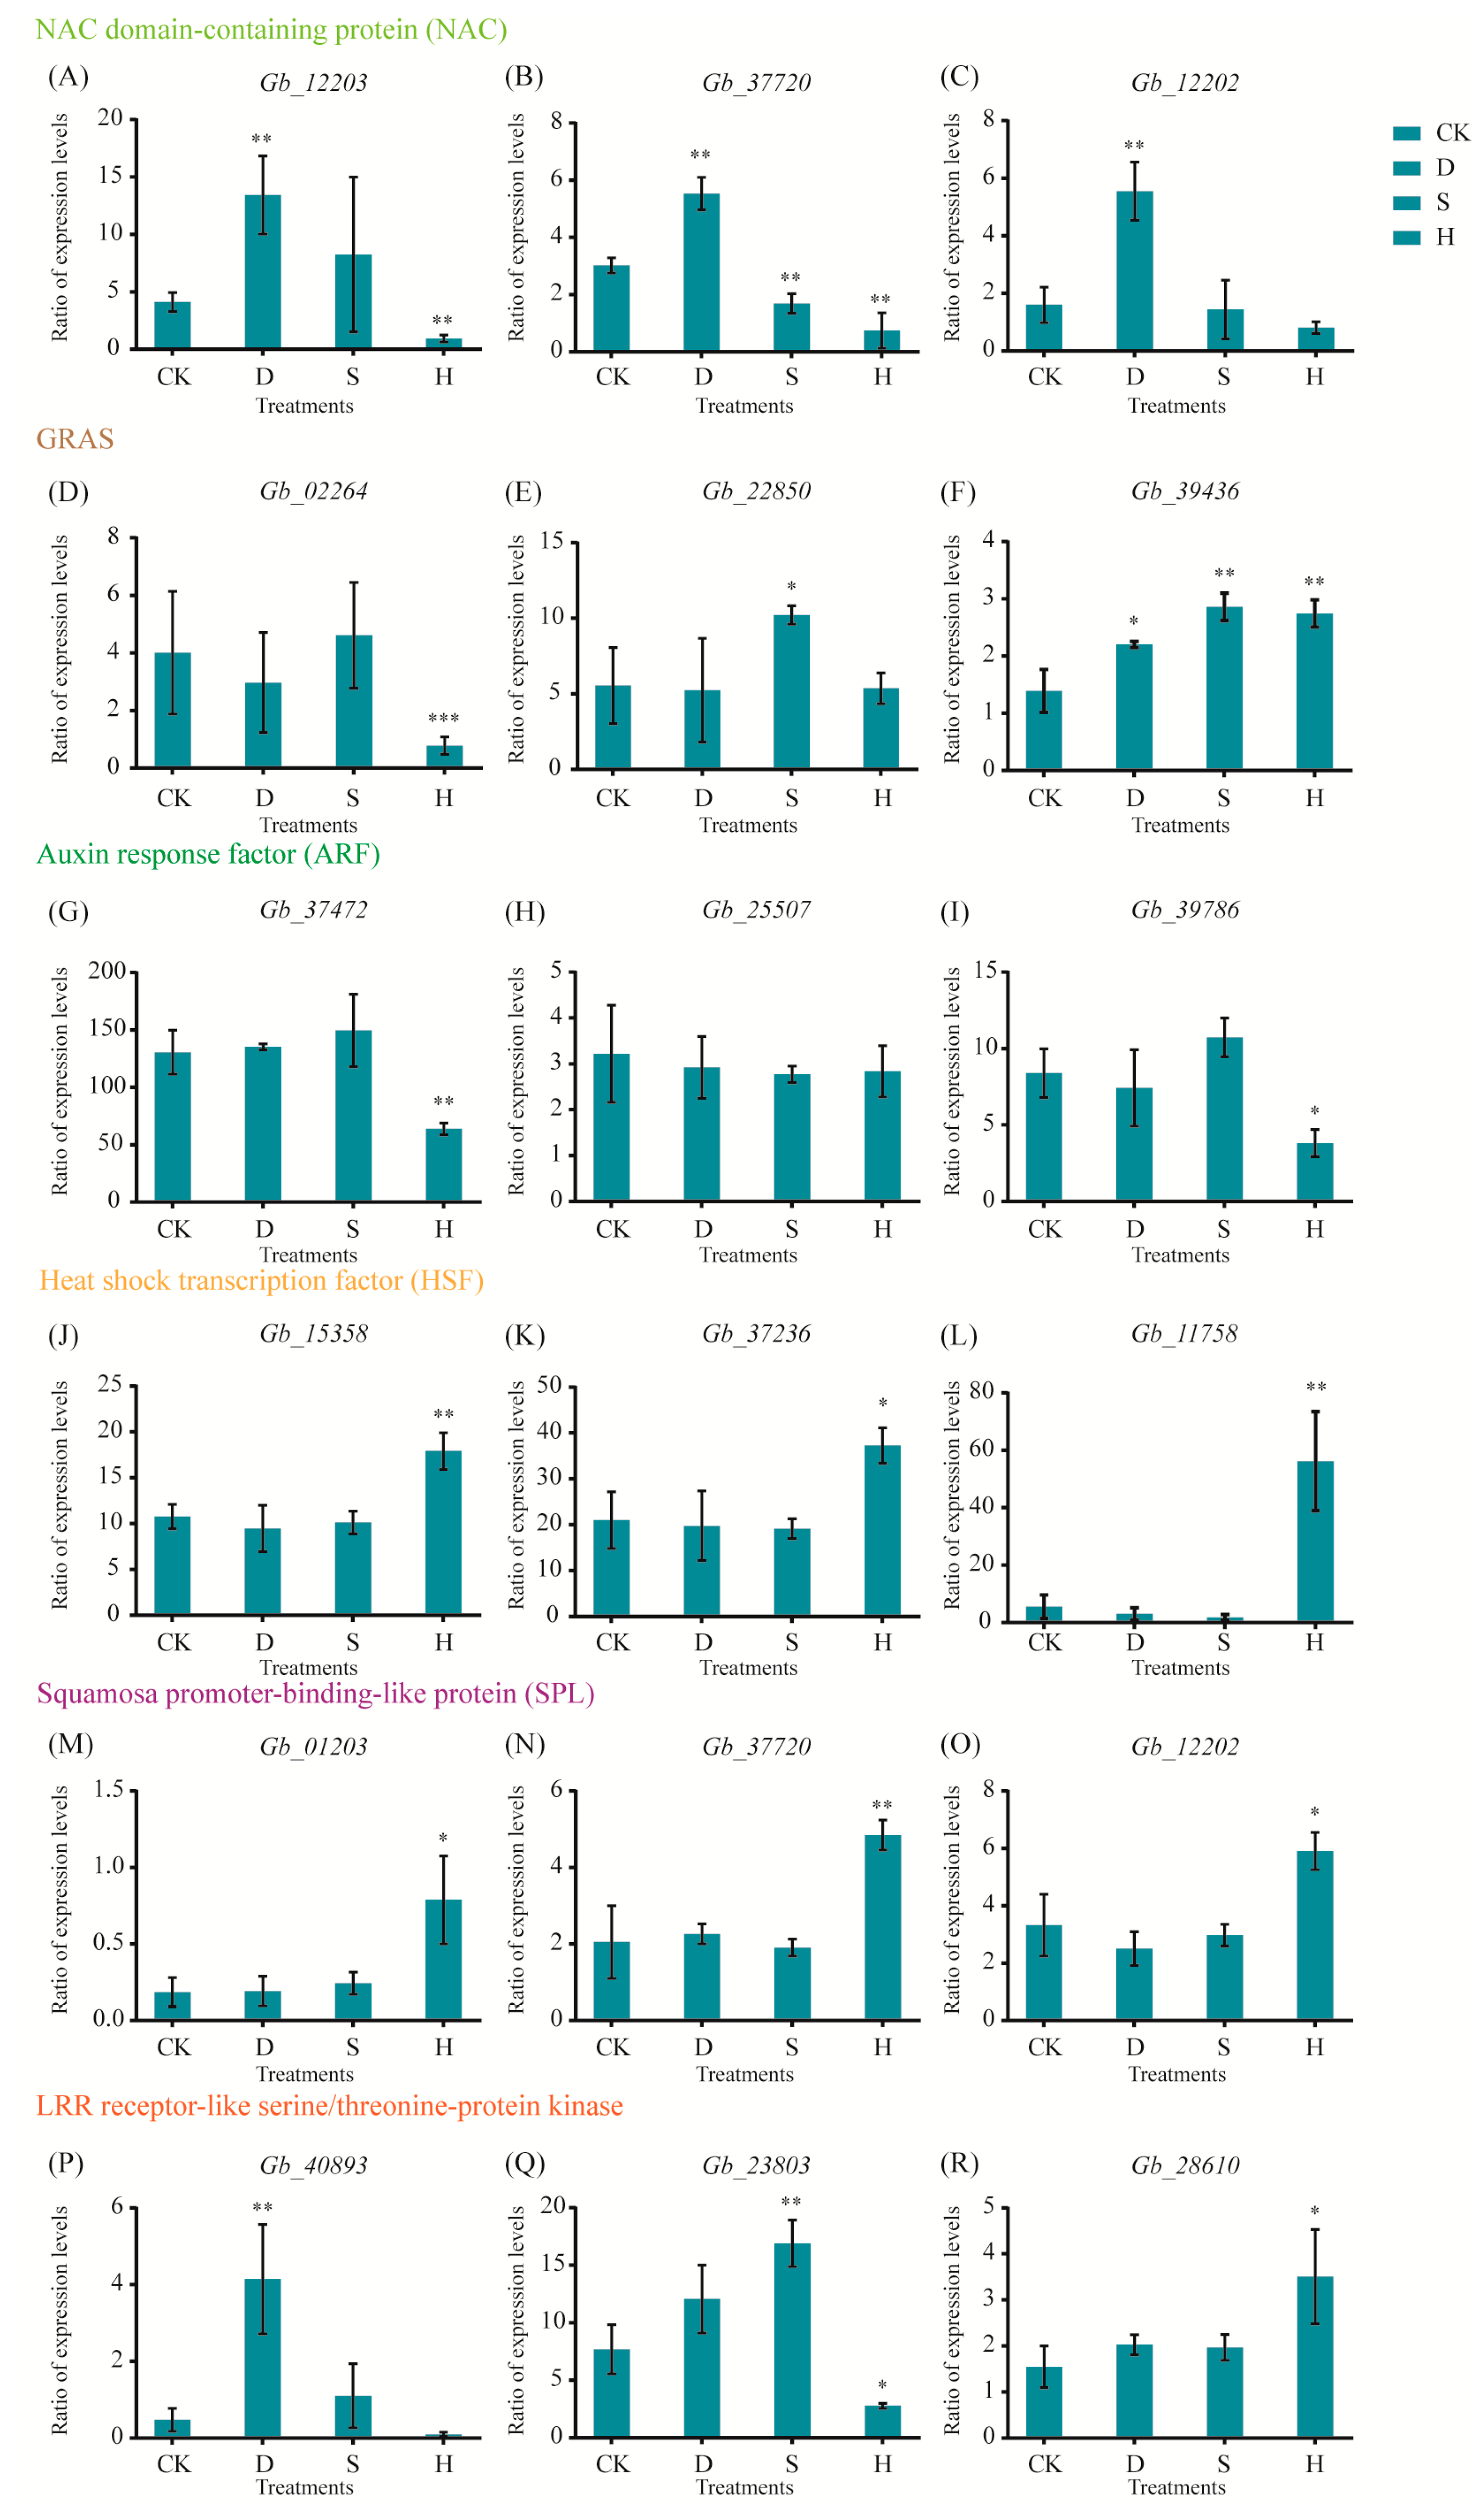
We performed transcriptome sequencing to identify critical genes in responses to drought, salt, and heat; these genes included nitrogen assimilation control (NAC), GRAS, auxin response factor (ARF), heat shock transcription factors, squamosa promoter-binding-like protein (SPL), and leucine-rich repeat (LRR) receptor-like serine/threonine protein kinase. NAC genes (Gb_12203, Gb_37720, and Gb_12202) were upregulated under D but downregulated or unaffected in response to S and H (Figure 6A–C). Genes related to GRAS responded differently to the three treatments; for example, Gb_02264 was downregulated under H, Gb_22850 was upregulated under S, and Gb_39436 was upregulated under all three treatments (Figure 6D–F). Under H, genes related to ARF (Gb_37472 and Gb_39786) were downregulated, whereas Gb_25507 was not significantly affected (Figure 6G–I). Similarly, genes related to HSF (Gb_15358, Gb_37236, and Gb_11758; Figure 6J–L) and SPL (Gb_01203, Gb_37720, and Gb_12202) were upregulated under H (Figure 6M–O). Genes encoding LRR receptor-like serine/threonine protein kinase exhibited different responses to the three treatments; for example, Gb_40893 was upregulated only in response to D, Gb_23803 only to S, and Gb_28610 only to H (Figure 6P–R).
3.7. Small RNAs and Corresponding Target Genes
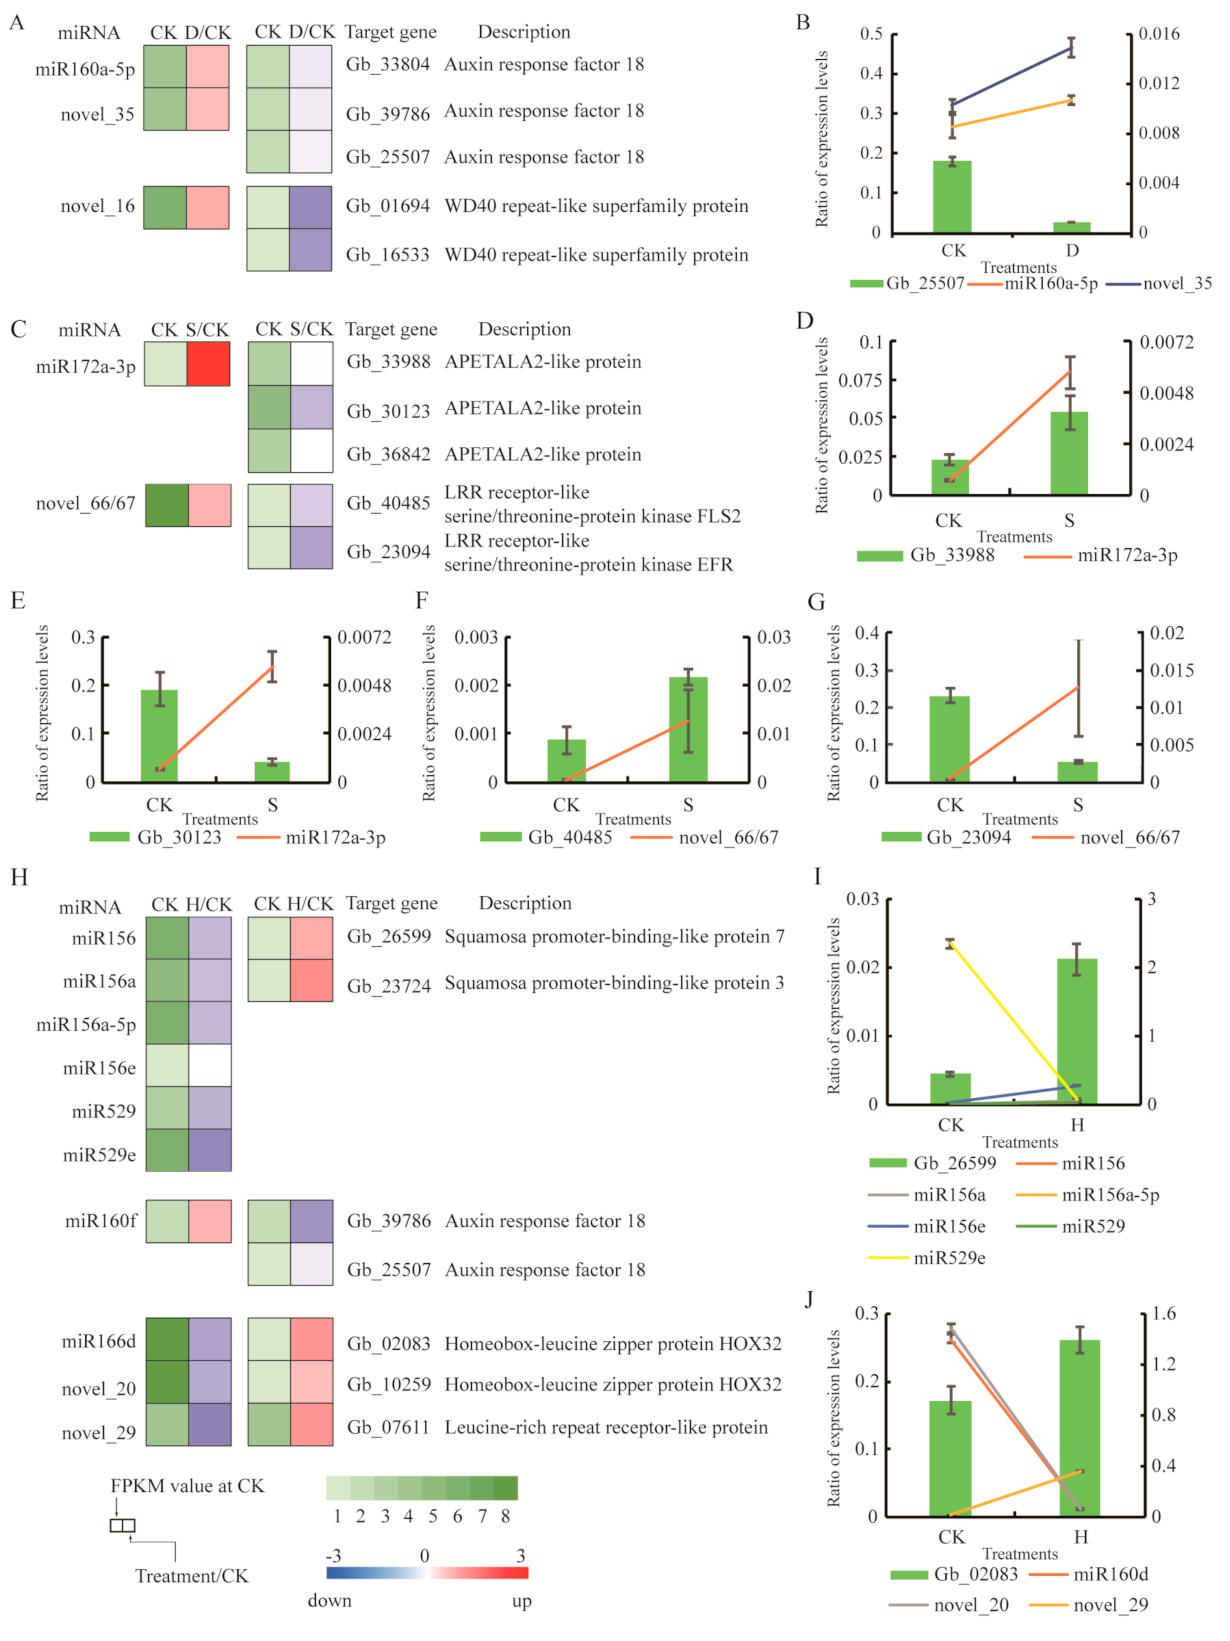
We sequenced small RNA (sRNA) libraries for all treatments to identify miRNAs involved in stress responses. Known miRNAs were annotated by aligning them to sequences from all plant species included in miRBase. Functional annotation was used to evaluate the potential functions of target genes. We selected several miRNA/target gene pairs from the three libraries and investigated their expression patterns using qRT-PCR. Under D, genes involved in ARF (Gb_33804, Gb_39786, and Gb_25507) were predicted targets of miR160a-5p, and Gb_01694 and Gb_16533 (WD40 repeat-like superfamily protein) were predicted targets of novel_35 and novel_16 (Figure 7A). These miRNAs were upregulated under D, whereas expression of their target genes was downregulated (Figure 7A). The expression profiles of miR160a-5p, novel_35, and their target genes were confirmed. The trend exhibited by Gb_25507 was the opposite of that exhibited by miR160a-5p and novel_35 (Figure 7B). Under S, Gb_33988, Gb_30123, and Gb_36842, all of which are related to APETALA2-like protein (AP2), were predicted targets of miR172a-3p, whereas Gb_40485 and Gb_23094 (LRR receptor-like serine/threonine-protein kinase, FLS2) were predicted targets of novel_66/67 (Figure 7C). These miRNAs were upregulated under S, whereas their target genes were downregulated (Figure 7C). Expression profiles of miR172a-3p, novel_66/67, and their target genes exhibited contrary trends in two pairs: Gb_30123 with miR172a-3p (Figure 7E), and Gb_23094 with novel_66/67 (Figure 7G). Under H, genes related to SPL (Gb_26599 and Gb_23724) were predicted targets of miR156, miR156a-5p, miR156e, miR529, and miR529e, whereas genes encoding leucine zipper proteins (Gb_02083, Gb_10259, and Gb_07611) were predicted targets of miR166d, novel_20, and novel_29 (Figure 7H). These miRNAs were downregulated in response to H, and expression of their target genes was upregulated (Figure 7H). The expression profiles of miR156, miR156a, miR156a-5p, miR156e, miR529, miR529e, miR166d, novel_20, novel_29, and their target genes exhibited opposite trends in two pairs: Gb_26599 with miR529e (Figure 7I) and Gb_02083 with miR160d and novel_20 (Figure 7J).
4. Discussion
4.1. Physiological and Biochemical Responses
Plant hormone levels typically vary upon exposure to strong light, high temperatures, salt, and drought. ABA and IAA are important signaling molecules that regulate metabolic processes related to stress adaptation and induce stress resistance in plants [19]. Numerous studies have shown that the ABA content increases under abiotic stress and induces the expression of downstream genes [20]. We found that leaf ABA content increased significantly under drought, salt, and heat stresses, while IAA content decreased significantly under drought and salt stresses. Given that stomatal closure is correlated with ABA accumulation, G. biloba leaves may regulate stomatal closure via ABA accumulation to maintain water content under conditions of osmotic stress associated with drought and salt, thereby reducing damage from osmotic stress and improving tolerance to drought and salt. In addition, increased ABA content induced upregulated expression of many downstream transcription factors and genes, thereby activating downstream metabolic pathways. IAA content decreased under drought and salt stresses, potentially inhibiting growth and thereby relieving the pressure that osmotic stress places on normal physiological activities.
Environmental stress results in excessive ROS production in plants. Due to their high activity and toxicity, ROS increase the susceptibility of cells to oxidative stress. Plants have an efficient system of antioxidant defenses, involving both enzymes (SOD, CAT, POD, APX, and GPX) and other compounds (ascorbic acid, glutathione, and alkaloids). These help control and eliminate ROS, thus protecting plant cells from oxidative damage [21]. Numerous studies have demonstrated that the antioxidant defense system is essential for cell protection during drought, salt, or heat stress [22]. SOD and CAT activities increased significantly under drought and salt stresses [12,23]. We found that H2O2 content in G. biloba leaves increased significantly under all three stress types, implying that the stress treatments induced ROS accumulation. Correspondingly, the increased activities of antioxidant enzymes, including SOD and CAT, imply that these enzymes may mitigate ROS damage. These results are similar to those of liquorice under salt and drought stresses [12] and chickpea under salt stress [23]. However, the degree to which SOD activity increased varied among the treatments; whereas SOD activity increased significantly under salt stress, the increase under heat stress was much more pronounced, suggesting that plants may respond to different stresses and scavenge excess ROS via different antioxidant enzymes.
Osmotic regulation is the physiological mechanism that allows plants to adapt to drought or salt stress and enhance their resistance to such stress. Proline is an osmotic regulatory solute, ROS scavenger, and molecular chaperone that stabilizes protein structure, thus protecting cells from stress-induced damage [24]. Under osmotic stress, most plants accumulate osmotic regulatory substances to maintain osmotic balance in cells, prevent cell dehydration, and protect the structure and function of biological macromolecules. For example, proline content increased significantly in poplar at 45 °C [25]. Soluble sugar and protein may also play important roles in osmotic stress [26]. In the study, contents of soluble sugar and proline increased significantly in response to all stress treatments, and soluble protein accumulated significantly under heat stress. These results are consistent with changes of the soluble sugar and protein in Arabidopsis under heat stress [26]. Our results indicate that G. biloba may synthesize large amounts of soluble sugars, proteins, and proline to improve stress tolerance, and that these compounds may protect the membrane system and maintain cell stability. Our study was based on the short-term treatments (24 h) of the mechanism to response to heat, drought, and salt stresses in G. biloba. However, longer term (a week, a month, etc.) stress responses are still unclear.
4.2. Key Metabolic Pathways and Metabolites
The pentose phosphate pathway is important for respiratory metabolism in plants, producing NADPH, and providing reducing power for biosynthesis of carbohydrates. The pentose phosphate pathway also plays a role in the responses to environmental stress. G6PDH and 6PGDH are key rate-limiting enzymes in the pentose phosphate pathway, controlling the metabolic rate of the pathway as a whole. Expression of G6PDH increased significantly in wheat under high salt stress [27], whereas it exhibited a downward trend in Arabidopsis under salt stress, osmotic stress, and low temperatures [28]. In rice, the expression of 6PGDH was upregulated under salt, PEG, and ABA treatments [29,30], whereas the expression of G6PDH exhibited no significant changes under high salinity or low temperatures [30]. We found that the expression of G6PDH genes (Gb_26169, Gb_26174, and Gb_41272) and 6PGDH genes (Gb_19030 and Gb_19037) was downregulated under heat stress but was not significantly affected by drought or salt stress. However, the expression trends of G6PDH and 6PGDH genes were significantly changed in wheat [27], Arabidopsis [28], and rice [30] under salt stress, indicating the different response mechanism compared with G. biloba. Three genes (Gb_19030, Gb_19037, and Gb_17714) involved in the regulation of 5-ribulose-5p and ribose were downregulated under heat stress, but Gb_17714 was upregulated under drought and salt stresses. In addition, the results of the metabolomic analysis indicated that ribulose 5-phosphate and ribulose were downregulated under heat stress. These results indicate that the pentose phosphate pathway may be inhibited under heat stress, but not under drought or salt stress, suggesting different response pathways under heat stress compared with drought and salt stresses.
Amino acids substantially affect plant growth and development via their roles in physiological metabolism. Amino acids, or substances synthesized with amino acids as precursors, may improve the adaptability of plants to adversity and stress. Glycine is an important amino acid and a synthetic substrate of glycine betaine [31], which in turn plays an active role in stress tolerance [32]. Aminobutyric acid, a non-protein amino acid, is a regulatory substance synthesized by glutamate, which may enhance the activities of peroxidase, CAT, and other antioxidant enzymes, thus reducing damage caused by peroxidation. High levels of 4-aminobutyric acid (GABA) may accumulate under a variety of adverse environmental conditions [33]. GABA metabolism is related to carbon–nitrogen metabolism balance and ROS scavenging and enhances the structural stability of the cell membrane while reducing damage to the photosynthetic system [34]. Stress treatments upregulated numerous genes involved in the glycine, serine, and threonine metabolic pathways, including Gb_01536, Gb_01539, Gb_37290, Gb_23485, Gb_06259, and Gb_27241; by contrast, genes involved in the degradation pathway, including Gb_03208 and Gb_35734, were downregulated, potentially promoting accumulation of glycine and threonine. Given that glycine and threonine may act as synthetic substrates of osmotic regulatory substances, accumulation of glycine and threonine plays a critical role in the response of G. biloba to abiotic stress. In addition, the putrescine content decreased, whereas GABA content increased significantly, in the arginine and proline metabolic pathway under heat stress, suggesting that accumulation of GABA may activate antioxidant defense reactions, thereby mitigating oxidative and heat damage by increasing osmotic regulatory substances.
4.3. Key Transcription Factors and Genes
Most plant species contain specific transcription factors and genes that respond to different stress conditions. NAC is a plant-specific transcription factor that plays a critical role in the response to abiotic stress. In Arabidopsis, genes encoding NAC transcription factors participate in the responses to drought, salt, and cold stress [35,36]. Similarly, in rice, OsNAC5 and OsNAC6 are involved in the responses to drought, high salinity, and low temperatures [37,38]. In addition, expression of TaNAC69 increases in wheat under drought stress [39]. In G. biloba, the expression of NAC transcription factor genes Gb_12203, Gb_37720, and Gb_12202 were significantly upregulated under drought, but were either significantly downregulated or unaffected under salt and heat stresses, indicating that these transcription factors are involved mainly in the drought response in G. biloba.
GRAS transcription factors are plant-specific transcription factors involved in the regulation of various biological processes, including growth and development, hormone interactions, and responses to biotic and abiotic stresses [40]. GRAS transcription factors are related to the development of roots and buds, which often suffer under abiotic stress. Previous studies have demonstrated that some GRAS transcription factors play a positive regulatory role in plant responses to abiotic stress. For example, in Arabidopsis, the GRAS protein SCL14 plays an important role in activating stress-induced promoters [41]. NtGRAS1 may increase ROS levels under different stress treatments in tobacco [42]. OsGRAS23 was also reported to be a positive regulator in rice [43]. The SlGRAS40 protein regulates IAA and gibberellin signaling pathways in tomato to mitigate the effects of abiotic stress during growth and development [44]. We observed significant upregulation of the GRAS transcription factor gene Gb_22850 under salt stress, while another GRAS gene (Gb_39436) was significantly upregulated in response to all three stress treatments, suggesting that Gb_22850 is involved predominantly in the response to salt stress, whereas Gb_39436 responds to a broader range of abiotic stressors.
HSFs are important for the response to heat stress. Reviews have summarized the transcriptional and post-transcriptional regulatory networks of heat stress responses [3,45]. HSFs are important in signal transduction cascades, activating heat-induced response genes and serving as key transcription factors in the network regulating heat-induced responses [3]. In Arabidopsis, HSFA1s was shown to play a central role in the heat stress response and therefore is generally regarded as a master regulator critical to the activation of transcriptional networks for the response to heat stress [46,47]. Many important heat-induced transcription factors, such as DREB2A, HSFA2, HSFA7a, and HSFBs, are thought to be regulated directly by HSFA1s [47]. We identified three HSF genes in G. biloba, including Gb_15358 (homologous with HSFA1), Gb_37236 (homologous with NnHSF24), and Gb_11758 (homologous with GrHSF8). These transcription factors were upregulated only under heat stress and did not respond significantly to drought or salt stress. Therefore, they may be important regulators of the response pathways to heat stress.
Receptor kinase proteins (RLKs) are located on plant cell membranes and can sense external signals and stimuli [48]. LRR receptor-like kinases are the largest subgroup of receptor kinases [49], playing an important role in the responses to biotic and abiotic stresses [50]. For example, LRR-RPK1 (RPK1) may enhance tolerance to drought and oxidative stress in Arabidopsis [51], while LRR receptor-like kinases may enhance drought tolerance in rice [52] and cold tolerance in wild soybean [53]. We identified numerous LRR genes in G. biloba that promote resistance to various stresses and contribute to the long life span of the species [10]. Some of these genes may be significantly upregulated in response to abiotic stresses, including Gb_40893 (drought stress), Gb_23803 (salt stress), and Gb_28610 (heat stress). These results suggest that certain LRR genes may be specific to the responses to particular stressors.
4.4. Key miRNAs and Functions of Target Genes
miRNAs regulate the metabolic processes of growth and development and are involved in the responses to abiotic stresses such as drought, salt, and heat [54,55,56]. For example, miR160 targets the ARF gene and participates in the IAA signal transduction pathway, hormone homeostasis, and plant morphogenesis. ARFs regulate the expression of IAA-induced genes by binding to IAA promoters. High or low expression of ARF10 can lead to severe developmental defects [57]. ARF2 is involved in the ABA signaling pathway, and ARF2 mutants exhibit high sensitivity to exogenous ABA [58]. In tomato under drought stress, miR160 targets ARF10 to regulate the ABA signaling pathway, maintain water balance in leaves, and ensure normal development [59]. We found that miR160a and novel_35 targeted three genes involved in the IAA signaling pathway. Expression of miR160a and novel_35 was upregulated under drought stress, while their corresponding target genes were downregulated. This negative feedback pattern was confirmed by qRT-PCR. An increased miR160a level inhibited the expression of its target gene, ARF, under drought stress, suggesting its involvement in the IAA signaling pathway. In addition, decreased IAA content in leaves under drought stress may slow growth rates, thereby mitigating the stress of water deficiency and alleviating the damage caused by dehydration.
Many plant species exhibit miRNA-mediated salt stress response networks. Studies have identified numerous miRNAs involved in salt stress responses in corn [60], rice [61], wheat [62,63], barley [64], and sugarcane [65]. AP2/ERF, the target gene of miR172, is part of an important family of transcription factors involved in the responses to biotic and abiotic stresses. For example, AP2/ERF (RAP2.6) in Arabidopsis is involved in the abiotic stress response via ABA-dependent pathways [66]. We found that miR172a targets three AP2 genes, Gb_33988, Gb_30123, and Gb_36842, which exhibit a negative feedback pattern under salt stress. qRT-PCR further identified Gb_30123 (apetala2-like protein) as a target of miR172a. Given that ABA content increased significantly under salt stress, these results suggest that miR172a may participate in the response to salt stress in G. biloba by inhibiting expression of Gb_30123 and thereby improving salt resistance.
Numerous miRNAs are also involved in the heat shock regulation network [45]. Studies have reported that miRNAs exhibit varying responses to abiotic stress. For example, miR166 may be induced and upregulated under drought stress in alfalfa, wheat, and barley [67,68], but it may also be downregulated under salt and cold stresses in maize and rice [60,69]. HD-zip, the target gene of miR166, plays an important role in the response to osmotic stress. In Arabidopsis, a drought- and ABA-induced HD-zip, AThb-6/7/12, was upregulated in response to dehydration [70]. We found that miR166d, novel_20, and novel_29 targeted three homeobox-leucine zipper protein genes, Gb_02083, Gb_10259, and Gb_07611, which exhibited opposite expression patterns under heat stress. Furthermore, we found that the expression of miR166d, novel_20, and their target gene Gb_02083 (homeobox-leucine zipper protein, HOX32) exhibited an opposite regulatory trend. Heat stress may result in water loss in G. biloba leaves, leading to dehydration. HD-zip may be involved in dehydration responses; thus, our results suggest that miR166d and novel_20 participate in the response to osmotic stress via regulation of HOX32.
5. Conclusions
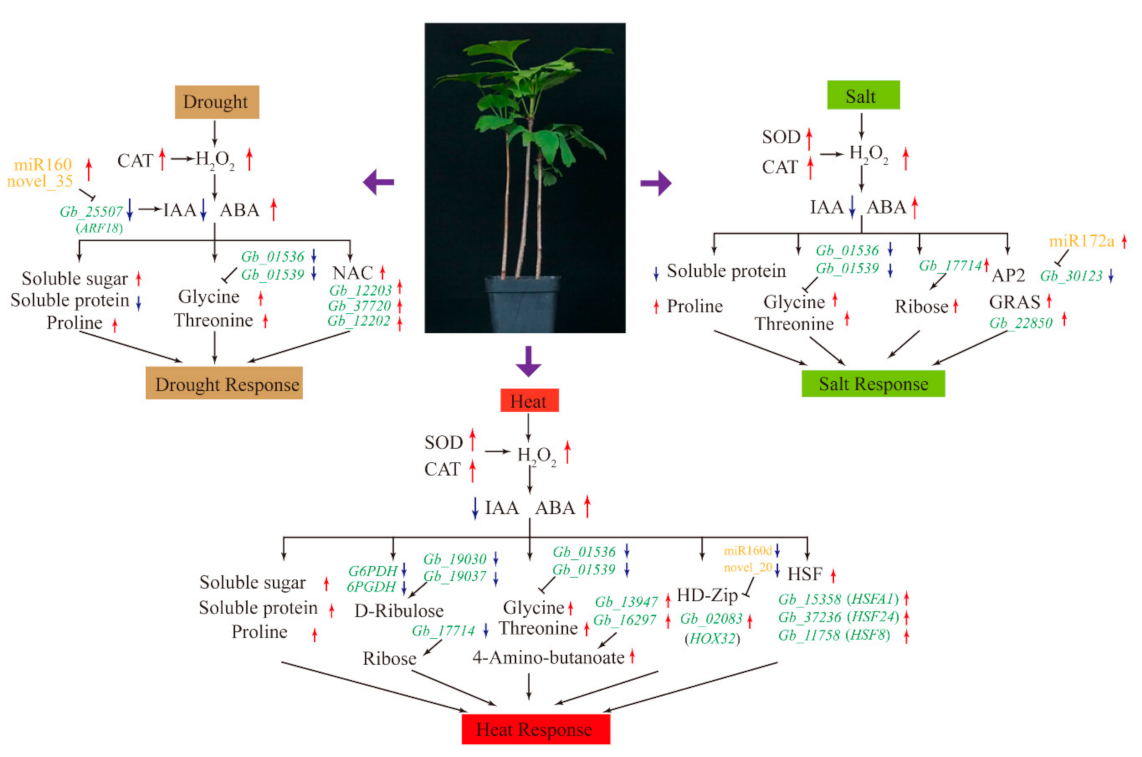
We provided detailed information on the multilevel responses of G. biloba to drought, salt, and heat stresses (Figure 8). G. biloba responds to drought stress primarily by increasing CAT activity, ROS production, the concentrations of ABA, soluble sugar, proline, glycine, and threonine, and the expression of miR160 and NAC. Under salt stress, we observed increased activities of SOD and CAT, increased concentrations of ABA, ROS, proline, glycine, threonine, and ribose, and increased expression of miRNA172a and GRAS. Under heat stress, in addition to increases in the concentrations of antioxidant enzymes, ABA, ROS, soluble sugar, proline, glycine, and threonine, we observed increases in soluble protein content and expression of HD-Zip and HSFs.
Supplementary Materials
The following are available online at https://www.mdpi.com/2218-273X/10/12/1635/s1, Figure S1: Two-year-old seedlings of G. biloba, Figure S2: Metabolomic analyses and changes in metabolite levels in the leaves of G. biloba under the stress treatments, Figure S3: Analysis of DEGs under stress treatments, Table S1: Major metabolites accumulated under stress treatments, Table S2: Accumulation interpretation rate of principal component analysis model, Table S3: Accumulation interpretation rate of the orthogonal projection to latent structure with discriminant analysis model, Table S4: Summary statistics of sequencing data quality and mapping to the reference genome, Table S5: Primer sequences used in qRT-PCR.
Author Contributions
Conceptualization, B.J. and L.W.; methodology, B.J., B.C. and K.M.; software, K.M. and B.C.; validation, K.M. and B.C.; formal analysis, K.M., B.C., Z.L., J.L. and J.C.; investigation, K.M., B.C., Z.L., J.L. and J.C.; resources, B.C. and K.M.; data curation, B.C. and K.M.; writing—original draft preparation, K.M. and B.C.; writing—review and editing, L.W., B.C. and B.J.; supervision, B.J.; funding acquisition, B.J. All authors have read and agreed to the published version of the manuscript.
Funding
This study was supported by the Natural Science Foundation of China (grant numbers 31670695).
Conflicts of Interest
The authors declare no conflict of interest.
References
- Acosta-Motos, J.; Ortuño, M.; Bernal-Vicente, A.; Diaz-Vivancos, P.; Sanchez-Blanco, M.; Hernandez, J. Plant responses to salt stress: Adaptive mechanisms. Agronomy 2017, 7, 18. [Google Scholar] [CrossRef] [Green Version]
- Muchate, N.S.; Nikalje, G.C.; Rajurkar, N.S.; Suprasanna, P.; Nikam, T.D. Plant salt stress: Adaptive responses, tolerance mechanism and bioengineering for salt tolerance. Bot. Rev. 2016, 82, 371–406. [Google Scholar] [CrossRef]
- Ohama, N.; Sato, H.; Shinozaki, K.; Yamaguchi-Shinozaki, K. Transcriptional regulatory network of plant heat stress response. Trends Plant Sci. 2017, 22, 53–65. [Google Scholar] [CrossRef] [PubMed]
- Golldack, D.; Li, C.; Mohan, H.; Probst, N. Tolerance to drought and salt stress in plants: Unraveling the signaling networks. Front. Plant Sci. 2014, 5, 151. [Google Scholar] [CrossRef] [Green Version]
- Shinozaki, K.; Yamaguchi-Shinozaki, K. Gene networks involved in drought stress response and tolerance. J. Exp. Bot. 2007, 58, 221–227. [Google Scholar] [CrossRef] [PubMed] [Green Version]
- Krasensky, J.; Jonak, C. Drought, salt, and temperature stress-induced metabolic rearrangements and regulatory networks. J. Exp. Bot. 2012, 63, 1593–1608. [Google Scholar] [CrossRef] [Green Version]
- Seki, M.; Umezawa, T.; Urano, K.; Shinozaki, K. Regulatory metabolic networks in drought stress responses. Curr. Opin. Plant Biol. 2007, 10, 296–302. [Google Scholar] [CrossRef]
- Shen, G.; Pang, Y.; Wu, W.; Liao, Z.; Zhao, L.; Sun, X.; Tang, K. Cloning and characterization of a root-specific expressing gene encoding 3-hydroxy-3-methylglutaryl coenzyme A reductase from Ginkgo biloba. Mol. Biol. Rep. 2006, 33, 117–127. [Google Scholar] [CrossRef]
- Li, W.; Yang, S.; Lu, Z.; He, Z.; Ye, Y.; Zhao, B.; Wang, L.; Jin, B. Cytological, physiological, and transcriptomic analyses of golden leaf coloration in Ginkgo biloba L. Hortic Res. 2018, 5, 12. [Google Scholar] [CrossRef] [Green Version]
- Wang, L.; Cui, J.; Jin, B.; Zhao, J.; Xu, H.; Lu, Z.; Li, W.; Li, X.; Li, L.; Liang, E.; et al. Multifeature analyses of vascular cambial cells reveal longevity mechanisms in old Ginkgo biloba trees. Proc. Natl. Acad. Sci. USA 2020, 117, 2201–2210. [Google Scholar] [CrossRef] [Green Version]
- Zlatev, Z.S.; Lidon, F.C.; Ramalho, J.C.; Yordanov, I.T. Comparison of resistance to drought of three bean cultivars. Biol. Plant. 2006, 50, 389–394. [Google Scholar] [CrossRef]
- Pan, Y.; Wu, L.J.; Yu, Z.L. Effect of salt and drought stress on antioxidant enzymes activities and SOD isoenzymes of liquorice (Glycyrrhiza uralensis Fisch). Plant Growth Regul. 2006, 49, 157–165. [Google Scholar] [CrossRef]
- Gapińska, M.; Skłodowska, M.; Gabara, B. Effect of short- and long-term salinity on the activities of antioxidative enzymes and lipid peroxidation in tomato roots. Acta Physiol. Plant. 2007, 30, 11–18. [Google Scholar] [CrossRef]
- Zhao, B.; Wang, L.; Pang, S.; Jia, Z.; Wang, L.; Li, W.; Jin, B. UV-B promotes flavonoid synthesis in Ginkgo biloba leaves. Ind. Crop. Prod. 2020, 151, 112483. [Google Scholar] [CrossRef]
- Cao, F.; Cheng, H.; Cheng, S.; Li, L.; Xu, F.; Yu, W.; Yuan, H. Expression of selected Ginkgo biloba heat shock protein genes after cold treatment could be induced by other abiotic stress. Int. J. Mol. Sci. 2012, 13, 5768–5788. [Google Scholar] [CrossRef] [PubMed]
- Xu, N.; Liu, S.; Lu, Z.; Pang, S.; Wang, L.; Wang, L.; Li, W. Gene expression profiles and flavonoid accumulation during salt stress in Ginkgo biloba seedlings. Plants 2020, 9, 1162. [Google Scholar] [CrossRef]
- Pan, X.; Welti, R.; Wang, X. Quantitative analysis of major plant hormones in crude plant extracts by high-performance liquid chromatography-mass spectrometry. Phytochemistry 2010, 5, 986–992. [Google Scholar] [CrossRef]
- Allen, P.J.; Bennett, K. PASW Statistics by SPSS: A Practical Guide: Version 18.0; Cengage Learning: South Melbourne, Australia, 2010. [Google Scholar]
- Agarwal, P.K.; Jha, B. Transcription factors in plants and ABA dependent and independent abiotic stress signalling. Biol. Plant. 2010, 54, 201–212. [Google Scholar] [CrossRef]
- Lee, S.C.; Luan, S. ABA signal transduction at the crossroad of biotic and abiotic stress responses. Plant Cell Environ. 2012, 35, 53–60. [Google Scholar] [CrossRef]
- Møller, I.M. Plant mitochondria and oxdative stress: Electron transport, NADPH turnover, and metabolism of reactive oxygen species. Annu. Rev. Plant Physiol. Plant Mol. Biol. 2001, 52, 561–591. [Google Scholar] [CrossRef] [Green Version]
- Tuteja, N. Mechanisms of high salinity tolerance in plants. Methods Enzymol. 2007, 29, 485–493. [Google Scholar] [CrossRef]
- Eyidogan, F.; Öz, M.T. Effect of salinity on antioxidant responses of chickpea seedlings. Acta Physiol. Plant. 2007, 29, 485–493. [Google Scholar] [CrossRef]
- Szabados, L.; Savoure, A. Proline: A multifunctional amino acid. Trends Plant Sci. 2010, 15, 89–97. [Google Scholar] [CrossRef] [PubMed]
- Ren, S.; Ma, K.; Lu, Z.; Chen, G.; Cui, J.; Tong, P.; Wang, L.; Teng, N.; Jin, B. Transcriptomic and metabolomic analysis of the heat-stress response of Populus tomentosa Carr. Forests 2019, 10, 383. [Google Scholar] [CrossRef] [Green Version]
- Wang, L.; Ma, K.B.; Lu, Z.G.; Ren, S.X.; Jiang, H.R.; Cui, J.W.; Chen, G.; Teng, N.J.; Lam, H.M.; Jin, B. Differential physiological, transcriptomic and metabolomic responses of Arabidopsis leaves under prolonged warming and heat shock. BMC Plant Biol. 2020, 20, 86. [Google Scholar] [CrossRef]
- Nemoto, Y.; Sasakuma, T. Specific expression of glucose-6-phosphate dehydrogenase (G6PDH) gene by salt stress in wheat (Triticum aestivum L.). Plant Sci. 2000, 158, 53–60. [Google Scholar] [CrossRef]
- Kreps, J.A.; Wu, Y.; Chang, H.S.; Zhu, T.; Wang, X.; Harper, J.F. Transcriptome changes for Arabidopsis in response to salt, osmotic, and cold stress. Plant Physiol. 2002, 130, 2129–2141. [Google Scholar] [CrossRef] [Green Version]
- Huang, J.; Zhang, H.; Wang, J.; Yang, J. Molecular cloning and characterization of rice 6-phosphogluconate dehydrogenase gene that is up-regulated by salt stress. Mol. Biol. Rep. 2003, 30, 223–227. [Google Scholar] [CrossRef]
- Hou, F.Y.; Huang, J.; Yu, S.L.; Zhang, H.S. The 6-phosphogluconate dehydrogenase genes are responsive to abiotic stresses in Rice. J. Integr. Plant Biol. 2007, 49, 655–663. [Google Scholar] [CrossRef]
- Chen, T.H.; Murata, N. Glycinebetaine protects plants against abiotic stress: Mechanisms and biotechnological applications. Plant Cell Environ. 2011, 34. [Google Scholar] [CrossRef]
- Goel, D.; Singh, A.K.; Yadav, V.; Babbar, S.B.; Murata, N.; Bansal, K.C. Transformation of tomato with a bacterial codA gene enhances tolerance to salt and water stresses. J. Plant Physiol. 2011, 168, 1286–1294. [Google Scholar] [CrossRef] [PubMed]
- Renault, H.; Roussel, V.; Amrani, A.E.; Arzel, M.; Renault, D.; Bouchereau, A.; Deleu, C. The Arabidopsis pop2-1 mutant reveals the involvement of GABA transaminase in salt stress tolerance. BMC Plant Biol. 2010, 10, 20. [Google Scholar] [CrossRef] [PubMed] [Green Version]
- Kinnersley, A.M.; Lin, F. Receptor modifiers indicate that 4-aminobutyric acid (GABA) is a potential modulator of ion transport in plants. Plant Growth Regul. 2000, 32, 65–76. [Google Scholar] [CrossRef]
- Tran, L.S.; Nakashima, K.; Sakuma, Y.; Simpson, S.D.; Fujita, Y.; Maruyama, K.; Fujita, M.; Seki, M.; Shinozaki, K.; Yamaguchi-Shinozaki, K. Isolation and functional analysis of Arabidopsis stress-inducible NAC transcription factors that bind to a drought-responsive cis-element in the early responsive to dehydration stress 1 promoter. Plant Cell 2004, 16, 2481–2498. [Google Scholar] [CrossRef] [Green Version]
- Fujita, M.; Fujita, Y.; Maruyama, K.; Seki, M.; Hiratsu, K.; Ohme-Takagi, M.; Tran, L.S.; Yamaguchi-Shinozaki, K.; Shinozaki, K. A dehydration-induced NAC protein, RD26, is involved in a novel ABA-dependent stress-signaling pathway. Plant J. 2004, 39, 863–876. [Google Scholar] [CrossRef]
- Nakashima, K.; Ito, Y.; Yamaguchi-Shinozaki, K. Transcriptional regulatory networks in response to abiotic stresses in Arabidopsis and grasses. Plant Physiol. 2009, 149, 88–95. [Google Scholar] [CrossRef] [Green Version]
- Takasaki, H.; Maruyama, K.; Kidokoro, S.; Ito, Y.; Fujita, Y.; Shinozaki, K.; Yamaguchi-Shinozaki, K.; Nakashima, K. The abiotic stress-responsive NAC-type transcription factor OsNAC5 regulates stress-inducible genes and stress tolerance in rice. Mol. Genet. Genom. 2010, 284, 173–183. [Google Scholar] [CrossRef]
- Xue, G.P.; Bower, N.I.; McIntyre, C.L.; Riding, G.A.; Kazan, K.; Shorter, R. TaNAC69 from the NAC superfamily of transcription factors is up-regulated by abiotic stresses in wheat and recognises two consensus DNA-binding sequences. Funct. Plant Biol. 2006, 33, 43–57. [Google Scholar] [CrossRef] [Green Version]
- Heo, J.O.; Chang, K.S.; Kim, I.A.; Lee, M.H.; Lee, S.A.; Song, S.K.; Lee, M.M.; Lim, J. Funneling of gibberellin signaling by the GRAS transcription regulator scarecrow-like 3 in the Arabidopsis root. Proc. Natl. Acad. Sci. USA 2011, 108, 2166–2171. [Google Scholar] [CrossRef] [Green Version]
- Fode, B.; Siemsen, T.; Thurow, C.; Weigel, R.; Gatz, C. The Arabidopsis GRAS protein SCL14 interacts with class II TGA transcription factors and is essential for the activation of stress-inducible promoters. Plant Cell 2008, 20, 3122–3135. [Google Scholar] [CrossRef] [Green Version]
- Mayrose, M.; Ekengren, S.K.; Melech-Bonfil, S.; Martin, G.B.; Sessa, G. A novel link between tomato GRAS genes, plant disease resistance and mechanical stress response. Mol. Plant Pathol. 2006, 7, 593–604. [Google Scholar] [CrossRef] [PubMed]
- Xu, K.; Chen, S.; Li, T.; Ma, X.; Liang, X.; Ding, X.; Liu, H.; Luo, L. OsGRAS23, a rice GRAS transcription factor gene, is involved in drought stress response through regulating expression of stress-responsive genes. BMC Plant Biol. 2015, 15, 141. [Google Scholar] [CrossRef] [PubMed] [Green Version]
- Liu, Y.; Huang, W.; Xian, Z.; Hu, N.; Lin, D.; Ren, H.; Chen, J.; Su, D.; Li, Z. Overexpression of SIGRAS40 in tomato enhances tolerance to abiotic stresses and influences auxin and gibberellin signaling. Front. Plant Sci. 2017, 8, 1659. [Google Scholar] [CrossRef] [PubMed]
- Zhao, J.; He, Q.; Chen, G.; Wang, L.; Jin, B. Regulation of non-coding RNAs in heat stress responses of plants. Front. Plant Sci. 2016, 7, 1213. [Google Scholar] [CrossRef] [PubMed] [Green Version]
- Yoshida, T.; Ohama, N.; Nakajima, J.; Kidokoro, S.; Mizoi, J.; Nakashima, K.; Maruyama, K.; Kim, J.M.; Seki, M.; Todaka, D.; et al. Arabidopsis HsfA1 transcription factors function as the main positive regulators in heat shock-responsive gene expression. Mol. Genet. Genom. 2011, 286, 321–332. [Google Scholar] [CrossRef]
- Liu, H.C.; Liao, H.T.; Charng, Y.Y. The role of class A1 heat shock factors (HSFA1s) in response to heat and other stresses in Arabidopsis. Plant Cell Environ. 2011, 34, 738–751. [Google Scholar] [CrossRef]
- Shiu, S.H.; Bleecker, A.B. Plant receptor-like kinase gene family: Diversity, functions, and signaling. STKE 2001, 18, 113–122. [Google Scholar] [CrossRef]
- Sun, X.; Wang, G.L. Genome-wide identification, characterization and phylogenetic analysis of the rice LRR-kinases. PLoS ONE 2011, 6, e16079. [Google Scholar] [CrossRef] [Green Version]
- Osakabe, Y.; Yamaguchi-Shinozaki, K.; Shinozaki, K.; Tran, L.S. Sensing the environment: Key roles of membrane-localized kinases in plant perception and response to abiotic stress. J. Exp. Bot. 2013, 64, 445–458. [Google Scholar] [CrossRef] [Green Version]
- Osakabe, Y.; Mizuno, S.; Tanaka, H.; Maruyama, K.; Osakabe, K.; Todaka, D.; Fujita, Y.; Kobayashi, M.; Shinozaki, K.; Yamaguchi-Shinozaki, K. Overproduction of the membrane-bound receptor-like protein kinase 1, RPK1, enhances abiotic stress tolerance in Arabidopsis. J. Biol. Chem. 2010, 285, 9190–9201. [Google Scholar] [CrossRef] [Green Version]
- Wu, F.; Sheng, P.; Tan, J.; Chen, X.; Lu, G.; Ma, W.; Heng, Y.; Lin, Q.; Zhu, S.; Wang, J.; et al. Plasma membrane receptor-like kinase leaf panicle 2 acts downstream of the DROUGHT AND SALT TOLERANCE transcription factor to regulate drought sensitivity in rice. J. Exp. Bot. 2015, 66, 271–281. [Google Scholar] [CrossRef] [PubMed] [Green Version]
- Yang, L.; Wu, K.; Gao, P.; Liu, X.; Li, G.; Wu, Z. GsLRPK, a novel cold-activated leucine-rich repeat receptor-like protein kinase from Glycine soja, is a positive regulator to cold stress tolerance. Plant Sci. 2014, 215–216, 19–28. [Google Scholar] [CrossRef] [PubMed]
- Zhao, B.; Liang, R.; Ge, L.; Li, W.; Xiao, H.; Lin, H.; Ruan, K.; Jin, Y. Identification of drought-induced microRNAs in rice. Biochem. Biophys. Res. Commun. 2007, 354, 585–590. [Google Scholar] [CrossRef] [PubMed]
- Liu, H.H.; Tian, X.; Li, Y.J.; Wu, C.A.; Zheng, C.C. Microarray-based analysis of stress-regulated microRNAs in Arabidopsis thaliana. RNA 2008, 14, 836–843. [Google Scholar] [CrossRef] [Green Version]
- Zhou, L.; Liu, Y.; Liu, Z.; Kong, D.; Duan, M.; Luo, L. Genome-wide identification and analysis of drought-responsive microRNAs in Oryza sativa. J. Exp. Bot. 2010, 61, 4157–4168. [Google Scholar] [CrossRef]
- Liu, P.P.; Montgomery, T.A.; Fahlgren, N.; Kasschau, K.D.; Nonogaki, H.; Carrington, J.C. Repression of AUXIN RESPONSE FACTOR10 by microRNA160 is critical for seed germination and post-germination stages. Plant J. 2007, 52, 133–146. [Google Scholar] [CrossRef]
- Wang, L.; Hua, D.; He, J.; Duan, Y.; Chen, Z.; Hong, X.; Gong, Z. Auxin Response Factor2 (ARF2) and its regulated homeodomain gene HB33 mediate abscisic acid response in Arabidopsis. PLoS Genetics 2011, 7, e1002172. [Google Scholar] [CrossRef] [Green Version]
- Liu, X.; Dong, X.; Liu, Z.; Shi, Z.; Jiang, Y.; Qi, M.; Xu, T.; Li, T. Repression of ARF10 by microRNA160 plays an important role in the mediation of leaf water loss. Plant Mol. Biol. 2016, 92, 313–336. [Google Scholar] [CrossRef]
- Ding, D.; Zhang, L.; Wang, H.; Liu, Z.; Zhang, Z.; Zheng, Y. Differential expression of miRNAs in response to salt stress in maize roots. Ann. Bot. 2009, 103, 29–38. [Google Scholar] [CrossRef] [Green Version]
- Sunkar, R.; Zhou, X.; Zheng, Y.; Zhang, W.; Zhu, J.K. Identification of novel and candidate miRNAs in rice by high throughput sequencing. BMC Plant Biol. 2008, 8, 25. [Google Scholar] [CrossRef] [Green Version]
- Gupta, O.P.; Meena, N.L.; Sharma, I.; Sharma, P. Differential regulation of microRNAs in response to osmotic, salt and cold stresses in wheat. Mol. Biol. Rep. 2014, 41, 4623–4629. [Google Scholar] [CrossRef] [PubMed]
- Eren, H.; Pekmezci, M.Y.; Okay, S.; Turktas, M.; Inal, B.; Ilhan, E.; Atak, M.; Erayman, M.; Unver, T. Hexaploid wheat (Triticum aestivum) root miRNome analysis in response to salt stress. Ann. Appl. Biol. 2015, 167, 208–216. [Google Scholar] [CrossRef]
- Deng, P.; Wang, L.; Cui, L.; Feng, K.; Liu, F.; Du, X.; Tong, W.; Nie, X.; Ji, W.; Weining, S. Global identification of microRNAs and their targets in barley under salinity stress. PLoS ONE 2015, 10, e0137990. [Google Scholar] [CrossRef] [PubMed] [Green Version]
- Bottino, M.C.; Rosario, S.; Grativol, C.; Thiebaut, F.; Rojas, C.A.; Farrineli, L.; Hemerly, A.S.; Ferreira, P.C. High-throughput sequencing of small RNA transcriptome reveals salt stress regulated microRNAs in sugarcane. PLoS ONE 2013, 8, e59423. [Google Scholar] [CrossRef]
- Zhu, Q.; Zhang, J.; Gao, X.; Tong, J.; Xiao, L.; Li, W.; Zhang, H. The Arabidopsis AP2/ERF transcription factor RAP2.6 participates in ABA, salt and osmotic stress responses. Gene 2010, 457. [Google Scholar] [CrossRef]
- Trindade, I.; Capitao, C.; Dalmay, T.; Fevereiro, M.P.; Santos, D.M. miR398 and miR408 are up-regulated in response to water deficit in Medicago truncatula. Planta 2010, 231, 705–716. [Google Scholar] [CrossRef]
- Kantar, M.; Lucas, S.J.; Budak, H. miRNA expression patterns of Triticum dicoccoides in response to shock drought stress. Planta 2011, 233, 471–484. [Google Scholar] [CrossRef]
- Lv, D.K.; Bai, X.; Li, Y.; Ding, X.D.; Ge, Y.; Cai, H.; Ji, W.; Wu, N.; Zhu, Y.M. Profiling of cold-stress-responsive miRNAs in rice by microarrays. Gene 2010, 459, 39–47. [Google Scholar] [CrossRef]
- Söderman, E.; Hjellström, M.; Fahleson, J.; Engström, P. The HD-Zip gene ATHB6 in Arabidopsis is expressed in developing leaves, roots and carpels and up-regulated by water deficit conditions. Plant Mol. Biol. 1999, 40, 1073–1083. [Google Scholar] [CrossRef]
Figure 1.
Physiological and biochemical characteristics of G. biloba under stress treatments. (A) Soluble sugars, (B) soluble proteins, (C) proline, (D) H2O2, (E) SOD, (F) CAT, (G) ABA, and (H) IAA. Error bars represent the mean ± SD; n = 3; */**/***, p < 0.05/0.01/0.001, respectively, compared with CK. CK: Control; D: Drought; S: Salt; H: Heat; SOD: Superoxide dismutase; CAT: Catalase; ABA: Abscisic acid; IAA: Indole-3-acetic acid.

Figure 2.
Heatmap of metabolites. (A) D vs. CK, (B) S vs. CK, and (C) H vs. CK. D: Drought; S: Salt; H: Heat; CK: Control.
Figure 2.
Heatmap of metabolites. (A) D vs. CK, (B) S vs. CK, and (C) H vs. CK. D: Drought; S: Salt; H: Heat; CK: Control.

Figure 3.
Gene expression and metabolites involved in respiratory metabolism. (A) DEGs associated with the respiratory pathway. Red and blue indicate upregulation and downregulation, respectively. Red frames indicate the upregulated or downregulated genes discussed in the main text. (B,C) Expression of (B) D-ribose-5P and (C) ribose. Error bars represent the mean ± SD; n = 5; */**, p < 0.05/0.01, respectively, compared with CK. (D–F) Expression of (D) Gb_19030 (6PGDH), (E) Gb_19037 (6PGDH), and (F) Gb_17714 (rbsK), as determined by qRT-PCR. Error bars represent the mean ± SD; n = 3. CK: Control; D: Drought; S: Salt; H: Heat.

Figure 4.
Gene expression and metabolites involved in the glycine, serine, and threonine metabolic pathways. (A) DEGs associated with these pathways. Red and blue indicate upregulation and downregulation, respectively. Red frames indicate the upregulated or downregulated genes discussed in the main text. (B–D) Expression of (B) 3P-D-glycerate, (C) glycine, (D) threonine, and (E) 1,3-diaminopropane. Error bars represent the mean ± SD; n = 5; */**, p < 0.05/0.01, respectively, compared with CK. (F–I) Expression of (F) Gb_01536, (G) Gb_01539, (H) Gb_35734, and (I) Gb_03208, as determined by qRT-PCR. Error bars represent the mean ± SD; n = 3. CK: Control; D: Drought; S: Salt; H: Heat.

Figure 5.
Gene expression and metabolites involved in the arginine and proline metabolic pathways. (A) DEGs associated with these pathways. Red and blue indicate upregulation and downregulation, respectively. Red frames indicate the upregulated or downregulated genes discussed in the main text. (B,C) Expression of (B) putrescine and (C) 4-amino-butanoate. Error bars represent the mean ± SD; n = 5; **, p < 0.01, compared with CK. (D,E) Expression of (D) Gb_13947 and (E) Gb_16297, as determined by qRT-PCR. Error bars represent the mean ± SD; n = 3. CK: Control; D: Drought; S: Salt; H: Heat.

Figure 6.
Expression of key genes under drought, salt, and heat stresses based on qRT-PCR. (A–C) NAC genes: (A) Gb_12203, (B) Gb_37720, and (C) Gb_12202. (D–F) GRAS genes: (D) Gb_02264, (E) Gb_22850, and (F) Gb_39436. (G–I) ARF genes: (G) Gb_37472, (H) Gb_25507, and (I) Gb_39786. (J–L) HSF genes: (J) Gb_15358, (K) Gb_37236, and (L) Gb_11758. (M–O) SPL genes: (M) Gb_01203, (N) Gb_37720, and (O) Gb_12202. (P–R) LRR receptor-like serine/threonine-protein kinase genes: (P) Gb_40893, (Q) Gb_23803, and (R) Gb_28610. Error bars represent the mean ± SD; n = 3; */**, p < 0.05/0.01, respectively, compared with CK. CK: Control; D: Drought; S: Salt; H: Heat.

Figure 7.
Expression of small RNAs and their corresponding targets in response to stress treatments. (A) Differential expression of miRNAs and their target genes under drought. (B) qRT-PCR analysis of miR160a, novel_35, and their target genes under drought stress. (C) Differential expression of miRNAs and their target genes under salt stress. (D,E) qRT-PCR analysis of miR172a-3p and their target genes under salt stress. (F,G) qRT-PCR analysis of novel_66/67 and their target genes under salt stress. (H) Differential expression of miRNAs and their target genes under heat stress. (I) qRT-PCR analysis of miR156, miR156a, miR156a-5p, miR156e, miR529, miR529e, and their target genes under heat stress. (J) qRT-PCR analysis of miR160d, novel_20, novel_29, and their target genes under heat stress. CK: Control; D: Drought; S: Salt; H: Heat.

Figure 8.
Schematic diagram of stress responses, showing major changes in physiology, biochemistry, metabolism, and transcription. Red and blue represent upregulation and downregulation, respectively. CAT: Catalase; SOD: Superoxide dismutase; ABA: Abscisic acid; IAA: Indole-3-acetic acid; NAC: NAC transcription factor; HSF: Heat shock transcription factor.

Publisher’s Note: MDPI stays neutral with regard to jurisdictional claims in published maps and institutional affiliations. |
© 2020 by the authors. Licensee MDPI, Basel, Switzerland. This article is an open access article distributed under the terms and conditions of the Creative Commons Attribution (CC BY) license (http://creativecommons.org/licenses/by/4.0/).
Share and Cite
MDPI and ACS Style
Chang, B.; Ma, K.; Lu, Z.; Lu, J.; Cui, J.; Wang, L.; Jin, B. Physiological, Transcriptomic, and Metabolic Responses of Ginkgo biloba L. to Drought, Salt, and Heat Stresses. Biomolecules 2020, 10, 1635. https://doi.org/10.3390/biom10121635
AMA Style
Chang B, Ma K, Lu Z, Lu J, Cui J, Wang L, Jin B. Physiological, Transcriptomic, and Metabolic Responses of Ginkgo biloba L. to Drought, Salt, and Heat Stresses. Biomolecules. 2020; 10(12):1635. https://doi.org/10.3390/biom10121635
Chicago/Turabian StyleChang, Bang, Kaibiao Ma, Zhaogeng Lu, Jinkai Lu, Jiawen Cui, Li Wang, and Biao Jin. 2020. "Physiological, Transcriptomic, and Metabolic Responses of Ginkgo biloba L. to Drought, Salt, and Heat Stresses" Biomolecules 10, no. 12: 1635. https://doi.org/10.3390/biom10121635
Note that from the first issue of 2016, this journal uses article numbers instead of page numbers. See further details here.