Article

Changes in Peptaibol Production of Trichoderma Species during In Vitro Antagonistic Interactions with Fungal Plant Pathogens

1
Department of Plant Protection, Bu Ali Sina University, Hamedan 6517833131, Iran
2
Department of Microbiology, Faculty of Science and Informatics, University of Szeged, H-6726 Szeged, Hungary
*
Author to whom correspondence should be addressed.
Biomolecules 2020, 10(5), 730; https://doi.org/10.3390/biom10050730
Submission received: 22 March 2020 / Revised: 5 May 2020 / Accepted: 5 May 2020 / Published: 7 May 2020

Abstract

:
Trichoderma species are widely used as biofungicides for the control of fungal plant pathogens. Several studies have been performed to identify the main genes and compounds involved in Trichoderma–plant–microbial pathogen cross-talks. However, there is not much information about the exact mechanism of this profitable interaction. Peptaibols secreted mainly by Trichoderma species are linear, 5–20 amino acid residue long, non-ribosomally synthesized peptides rich in α-amino isobutyric acid, which seem to be effective in Trichoderma–plant pathogenic fungus interactions. In the present study, reversed phase (RP) high-performance liquid chromatography (HPLC) coupled with electrospray ionization (ESI) mass spectrometry (MS) was used to detect peptaibol profiles of Trichoderma strains during interactions with fungal plant pathogens. MS investigations of the crude extracts deriving from in vitro confrontations of Trichoderma asperellum and T. longibrachiatum with different plant pathogenic fungi (Fusarium moniliforme, F. culmorum, F. graminearum, F. oxysporum species complex, Alternaria solani and Rhizoctonia solani) were performed to get a better insight into the role of these non-ribosomal antimicrobial peptides. The results revealed an increase in the total amount of peptaibols produced during the interactions, as well as some differences in the peptaibol profiles between the confrontational and control tests. Detection of the expression level of the peptaibol synthetase tex1 by qRT-PCR showed a significant increase in T. asperellum/R. solani interaction in comparison to the control. In conclusion, the interaction with plant pathogens highly influenced the peptaibol production of the examined Trichoderma strains.

Graphical Abstract

1. Introduction

Various approaches are used to reduce the economic and aesthetic damages caused by plant pathogens, but most of them are not efficient enough. Due to microbial resistance to traditional antibiotics and chemical compounds, as well as the environmental and health risks of chemicals, scientists’ attempts are focused on finding safe and eco-friendly alternatives. In recent years, biological-based methods have been noticed to deal with these challenges [1]. The application of biofertilizers and biopesticides is a promising alternative for plant protection against the attack of different pathogens [2]. Trichoderma spp. are popular due to their visible direct effects on fungal pathogens and their capability to induce resistance in plants [3]. The genus Trichoderma was identified by Christiaan Hendrik Persoon in 1794, but its biocontrol ability as a mycoparasite on Rhizoctonia and Sclerotinia was described firstly by Weindling in 1934. Now, more than 300 Trichoderma species have been identified morphologically and genetically [4,5].
Trichoderma species (Hypocreales, Ascomycota) are widespread in different ecosystems [2]. During the past years, several studies have identified the mycoparasitic responses of Trichoderma species, including the direct attack and lysis of the plant pathogens [6]. Trichoderma species are powerful tools for the purposes of biological control due to the production and secretion of lytic cell-wall-degrading enzymes (CWDEs) [7], root colonization, nutrient competition, the induction of systemic resistance in plants [8] and the production of a broad spectrum of secondary metabolites such as peptaibols [9]. Investigation of gene expressions during mycoparasitic interactions with Rhizoctonia solani proved the upregulation of genes related to metabolism, especially the production of antibiotic metabolites [10].
Peptaibols are linear peptides with 5 to 20 amino acid residues produced by peptaibol synthetases, which are non-ribosomal peptide synthetase (NRPS) enzymes [11,12]. The presence of the unusual amino acids α-aminoisobutyric acid (Aib) and isovaline (Iva) means that the hydroxylated C-terminus and the N-terminal acetylated amino acids are unique characteristics of this group of antimicrobial peptides [11]. The structure of the NRPS enzymes is responsible for the amino acid order of the peptaibols [13]. The modules of the NRPSs are semiautonomous and capable of the activation, elongation and assembly of the amino acids. These modules contain adenylation (A), thiolation (T) and condensation (C) domains, which together represent one minimal repeating unit of the NRPSs [12,14]. The order of these units finally determines the primary structure of the peptaibols. The first reported Trichoderma NRPS was tex1 described from Trichoderma virens [15]. Although Trichoderma species are known as the main peptaibol producers, peptaibols have also been reported from Acremonium, Tylopilus, Boletus, Bionectria, Paecilomyces, Emericellopsis, Cephalosporium, Stilbella, Gliocladium and Tolypocladium species [16].
Antimicrobial activities of peptaibols were reported against a number of fungi and Gram-positive bacteria, as well as viruses. Trichorzianines A and B [17], trichorzins HA and harzianines HC [18] from T. harzianum, trichokonins from T. koningii [19], tricholongins BI, BII [20] and longibrachins [21] from T. longibrachiatum, or trichotoxins from T. asperellum [22] are some examples showing the antimicrobial activity of Trichoderma peptaibols.
Trichotoxins are 18-residue peptaibols with trichotoxin-A-40s being firstly identified from T. viride NRRL5242 [23]. Later, trichotoxin-A-50s and other trichotoxin sequences were also described from T. viride [24] and T. harzianum [25], respectively. Brückner and Przybylski [23] classified the trichotoxins into the two subgroups of neutral (A-50) and acidic (A-40) trichotoxins separated based on their Gln17/Glu17 residue which defines the molecule to be neutral or acidic. Longibrachins are 20-residue peptaibols identified from T. longibrachiatum [26] which are also classified based on the Gln18/Glu18 exchange into neutral (longibrachin-A) and acidic (longibrachin-B) subgroups.
The mode of action of peptaibols is based on their physical, chemical and biological properties [11]. They are capable of forming voltage-dependent ion channels in plasma membranes [27], increasing membrane permeability [28] and consequently inducing cell death by cytoplasmic leakage [29]. The exogenous application of peptaibols enhances plant resistance against pathogens via triggering plant defence responses [30], e.g., trichokonins induced resistance in tobacco against tobacco mosaic virus (TMV) [31]. Moreover, on cucumber seedlings, the application of two synthetic 18-residue peptaibol isoforms (TvBI and TvBII) from T. virens Gv29-8 triggered responses of induced systemic resistance against leaf pathogenic bacteria, suggesting that 18-mer peptaibols act as inducers of non-cultivar-specific defence responses [32].
The synergistic effect between peptaibols and cell wall hydrolytic enzymes of Trichoderma during the antagonistic reaction against Botrytis cinerea has also been reported [33,34]. These data showed that peptaibols inhibit β-glucan synthase activity in the host fungus and act synergistically with β–glucanases; therefore, the destruction of the pathogen cell walls by Trichoderma species can be explained. In addition, peptaibols were considered as plant defense elicitors [35].
In this study, peptaibol profiles were analyzed during Trichoderma–fungal plant pathogen interactions in order to investigate the role of peptaibols in the antagonistic effect of Trichoderma species.

2. Materials and Methods

2.1. Fungal Strains and Culture Conditions

T. asperellum IRAN 3062C and T. longibrachiatum IRAN 3067C were derived from the Fungal Collection of Bu-Ali Sina University of Hamedan/Iran (BASUFC). To confirm the identity of the species, the translation elongation factor 1 alpha gene (tef1) was amplified and sequenced as described by Druzhinina et al. [36]. The amplified fragments contain partial sequence of the 4th large intron (first 207 nucleotides), the complete sequence of the 5th exon and partial sequence of the 5th short intron (last 71 nucleotides) of tef1. The 399 bp fragment of T. asperellum IRAN 3062C showed 100% sequence identity with T. asperellum strains GJS 06-294 [37] and NAIMCC-F-1763 [38], and the fragment of T. longibrachiatum IRAN 3067C with T. longibrachiatum strain CNM-CM 1798 [36].
Fusarium moniliforme SZMC 11046, F. culmorum SZMC 6239J, F. graminearum SZMC 6236J, F. oxysporum species complex (FOSC) SZMC 6237J, Alternaria solani SZMC 6241J and Rhizoctonia solani SZMC 21048 strains were derived from the Szeged Microbiology Collection (SZMC, www.szmc.hu). Different Trichoderma–plant pathogen combinations were used for direct dual interaction assays. All isolates were maintained on yeast extract-glucose agar media (10 g L−1 glucose, 10 g L−1 KH2PO4, 5 g L−1 yeast extract, 20 g L−1 agar).

2.2. Direct Confrontation Assays

In vitro antagonistic properties of the two Trichoderma strains were investigated based on the method described by Szekeres et al. [39]. Briefly, the experiments were performed in three parallel inoculations for Trichoderma–plant pathogenic fungus combinations. Plates containing plant pathogenic fungi or the Trichoderma strains (T. asperellum IRAN 3062C or T. longibrachiatum IRAN 3067C) alone were used as controls. Single agar plugs from the freshly growing mycelium of the particular plant pathogen were inoculated onto the surface of Petri plates (9 cm in diameter) containing malt extract agar medium (MEA) (5 g L−1 malt extract, 2.5 g L−1 yeast extract, 10 g L−1 glucose and 20 g L−1 agar) into a position 1.5 cm from the center of the plate. After 48 h in the case of the slower growing fungi like R. solani, A. solani, F. moniliforme and F. graminearum, or 24 h for the isolates with fast growing ability, such as F. culmorum and FOSC, a plug containing freshly grown mycelia of T. asperellum or T. longibrachiatum was inoculated in the same way, 3 cm apart from the plant pathogen’s inoculation position (Figure 1). The plates were kept at 25 °C for 16 h light and 8 h darkness per day. After 7 days the visible area of the Trichoderma colony and the total area occupied by both the colonies of Trichoderma and the plant pathogenic fungus were measured. Colony areas were used as a measurement tool to evaluate the antagonistic capacity of each isolate against the different plant pathogenic fungi using the free hand selection tool in Image J (https://imagej.nih.gov/ij/). Biocontrol index (BCI) values (area of the Trichoderma colony divided by the total area occupied by both Trichodema and the plant pathogen × 100) were used for calculating the antagonistic ability of each strain.

2.3. Peptaibol Extraction

Solvents used for extraction were methanol and chloroform (VWR International, Debrecen, Hungary). The surface of each plate (Trichoderma colony as control, plant pathogen colonies as controls, and Trichoderma plus plant pathogen in confrontational tests) was flooded twice with 5 mL chloroform, washed several times, collected in clean test tubes and shaken at room temperature for 2 h. After that, chloroform was evaporated to dryness by a rotary evaporator (IKA RV 10; IKA Works, Wilmington, NC, USA). The crude extracts were dissolved in methanol and collected in new tubes. Trichoderma spores and mycelia were pelleted by centrifuging at 10,000 rpm for 10 min (Biofuge Primo centrifuge, Heraeus, Hanau, Germany). The supernatant was transferred into new tubes and evaporated under nitrogen. The remaining dry material was dissolved in 200 µL methanol and kept at −20 °C for further analysis [40].

2.4. Biological Activity of the Crude Extracts

Approximate total amounts of peptaibols produced by each Trichoderma isolate were estimated by the rapid pre-screening method described by Marik et al. [41]. Antimicrobial activities of the crude extracts from strains T. asperellum IRAN 3062C and T. longibrachiatum IRAN 3067C were evaluated against Micrococcus luteus strain SZMC 0264. The inhibition zone was measured after 2 days and the total amount of peptaibols was estimated according to the calibration curve of alamethicin standard (Sigma-Aldrich, Budapest, Hungary) [41].
To evaluate antifungal activity of the crude extract, 1 mL of spore suspension (5 × 10⁵ spore per mL) of F. moniliforme, F. culmorum, F. graminearum, FOSC, A. solani and R. solani strains was spread on the surface of the plate containing MEA and 5 mm diameter wells were bored into the agar circularly. Twenty µL of the series dilution of the crude extract (200, 100, 50 and 10 µg mL−1 crude peptaibol extracts) was poured into the well and methanol was used as negative control. The plates were incubated at 25 °C for one week. Three parallel experiments were set up to measure the inhibition zones [33].

2.5. Identification and Semi-Quantitation of Peptaibols

The measurements were carried out with an Agilent 1100 modular reversed phase (RP) high-performance liquid chromatography (HPLC) system (Agilent, Palo Alto, CA, USA) coupled to a Varian 500 (Agilent, Palo Alto, CA, USA) ion trap mass spectrometer equipped with electrospray ion source (ESI-MS). Chemstation B.02.01 and MS Workstation 6.6 softwares controlled the HPLC and the MS, respectively. The extracts were separated and their full scan and MS2 spectra were acquired, and microheterogenous mixtures of peptaibols were sequenced using consecutive fragmentation in ESI-MSn according to the method described by Marik et al. [42]. The total peptaibol production of each measurement was calculated based on the summarized integrated area of the sodiated molecular ions [M + Na]+ proportionated with their respective BCI values. For the identified peptaibols, the previously defined nomenclature was applied, where the relative amount of each peptaibol was expressed in percentages based on the peak area of the [M + Na]+ appearing in the full scan measurements [42].

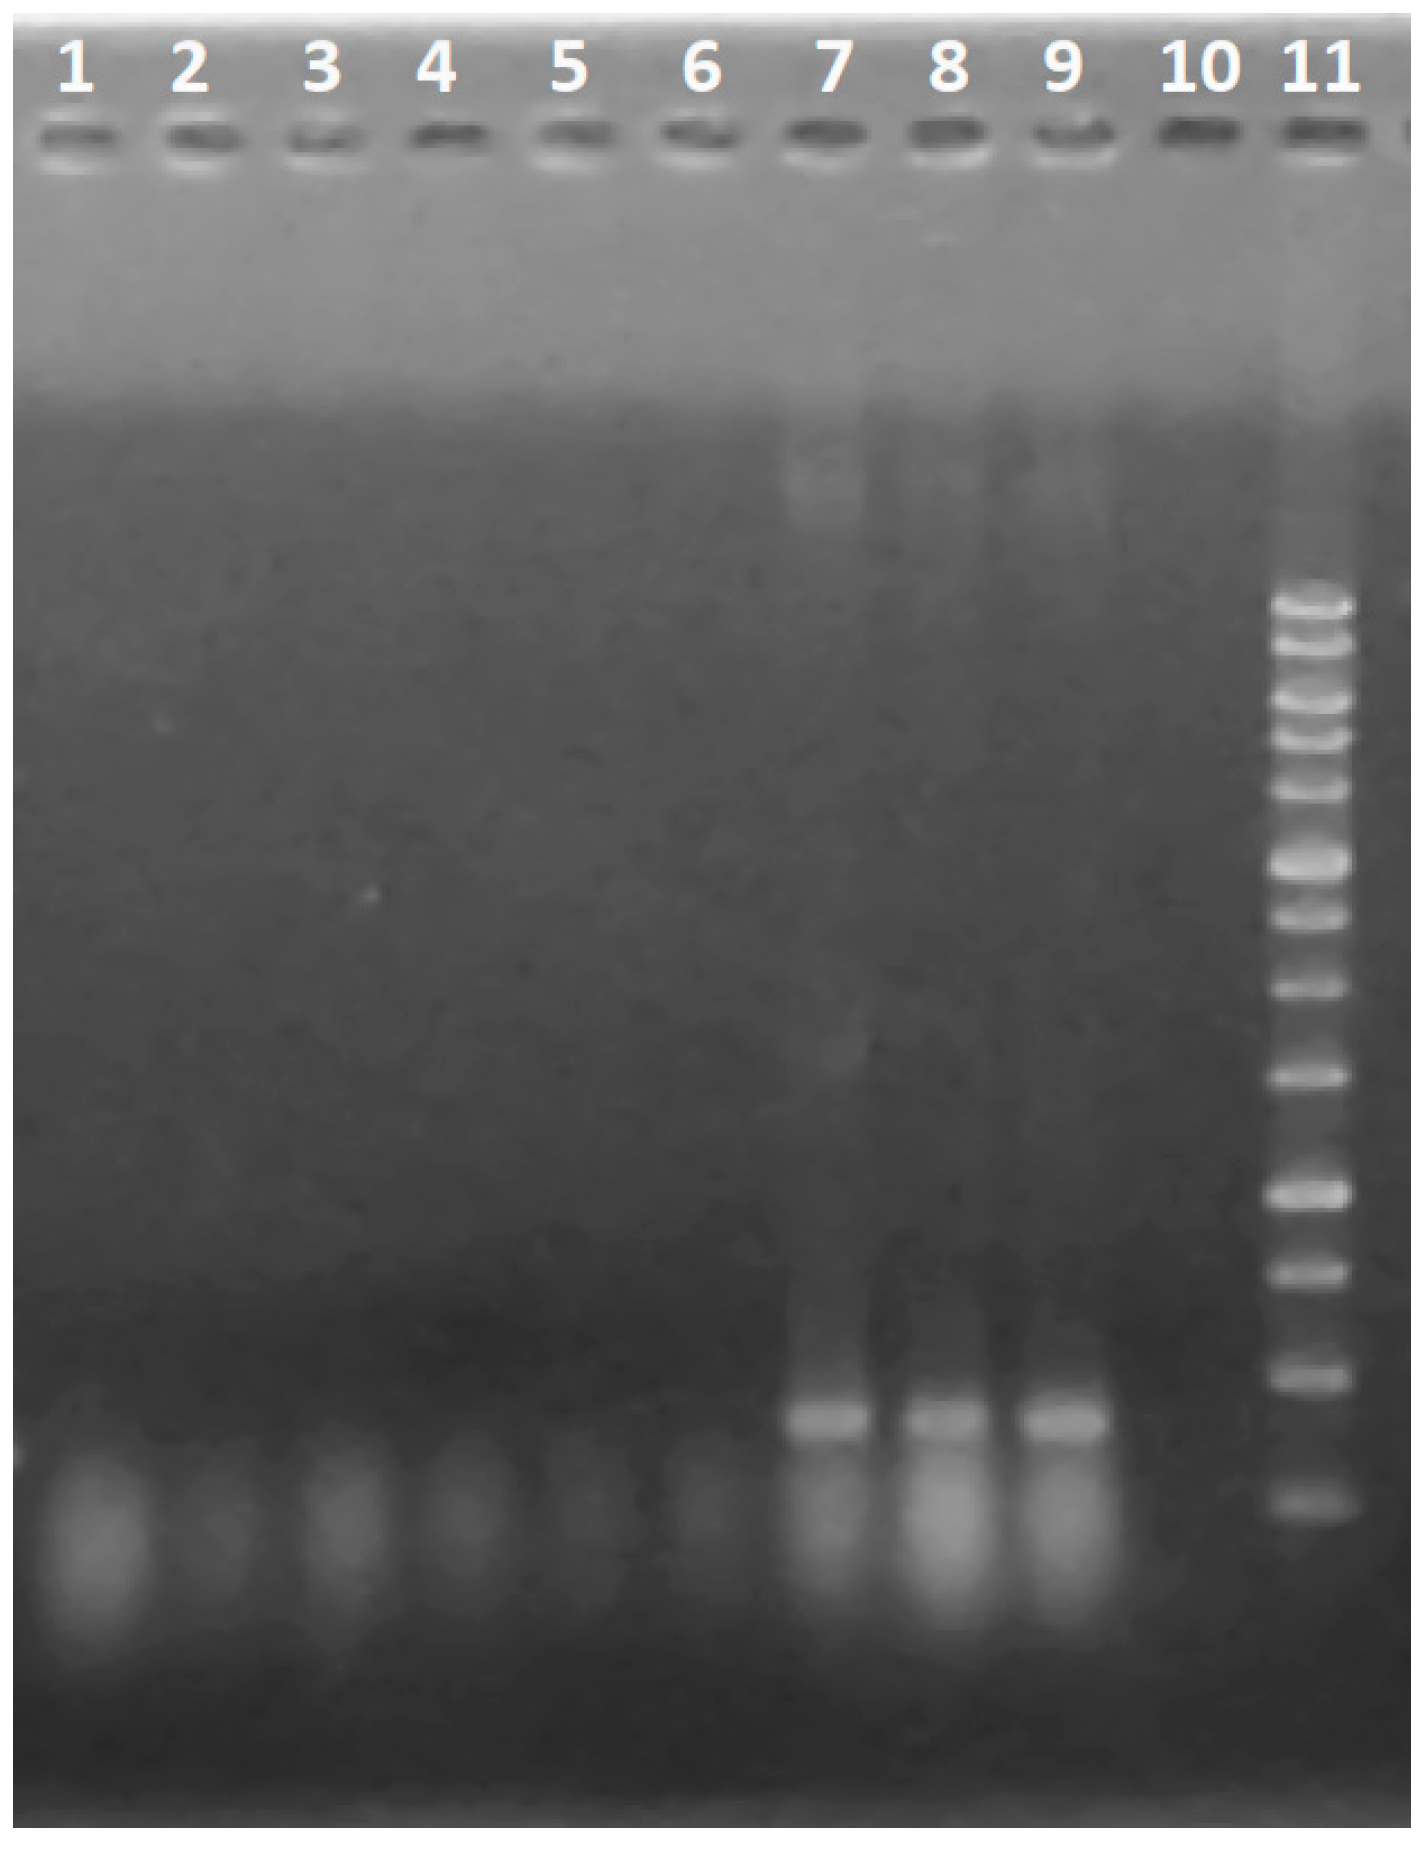
2.6. RNA Extraction and qRT-PCR for Detection of tex1 Gene Expression

Total RNA was extracted by the method described by Orek [43] from T. asperellum (both as control and in confrontation with R. solani) with some modifications. RNA quality and quantity were checked by Nano drop (NanoPhotometer® N120, IMPLEN, München, Germany), considering the ideal absorbance ratio (1.8 ≤ A260/280 ≤ 2.0). Total extracted RNA was also electrophoresed on 1% agarose gel to visualize the RNA integrity. For cDNA synthesis, approximately 5 mg of RNA was treated with DNase I, RNase-free (Pub. No. MAN0012000, Thermo Fisher Scientific Inc., Waltham, MA, USA) according to the manufacturer’s instructions. cDNA was synthesized using High-Capacity cDNA Reverse Transcription kit and Oligo dT primers (Yekta Tajhiz Azma, Tehran, Iran, Cat No. YT4500) according to the manufacturer’s manual. Real-time quantitative PCR was performed with gene-specific primers for tex1: TEX1F 5’-TTTCAGCGACGTTTTGCCAG-3’ and TEX1R 5’-TGGTGCAAAAATCGCACAGG-3’ amplifying a 186 bp fragment of the tex1 NRPS gene were designed based on the sequence of T. virens Gv29-8 non-ribosomal peptide synthetase (tex1) (NCBI Reference Sequence: XM_014097635.1). qPCR reactions were carried out with 48 wells StepOne Real-Time PCR System (Applied Biosystems StepOne, Foster City, CA, USA), using SYBR® Green. Each reaction was performed in 20 µL containing 1× Power SYBR Green PCR Master Mix (Yekta Tajhiz Azma, Tehran, Iran, Cat No. YT2552), 120 nM of primers (Pishgaman Co., Tehran, Iran) and 2 µL diluted (1/20) cDNA sample. PCR was performed using the thermal cycling parameters as follows: 95 °C, 10 min; and 40 cycles of 95 °C, 15 s; 58 °C, 25 s and 72 °C, 35 s. The qPCR data were analyzed by the 2−ΔΔCT method [44]. The β-tubulin gene was used to determine the relative expression level of the tex1 gene analyzed in this work. For the determination of qPCR efficiency of each primer pair, a standard curve was performed using cDNA dilutions of 1:5, 1:25, 1:125 and 1:625. Each sample was examined in duplicate. The corresponding qPCR efficiencies (E) were calculated for each primer pair with the LinRegPCR software [45]. In this way, the Real-time PCR Data Markup Language (RDML) file of fluorescence change data by StepOne software was analyzed by LinRegPCR software and qPCR efficiencies (E) were calculated. The efficiency obtained in both methods was approximately similar.

2.7. Statistical Analysis

In order to determine the significant differences between the peptaibol production of Trichoderma isolates in the confrontation assays with plant pathogens in comparison to the respective controls, peptaibol percentage level (the graph area of specific peptaibol compound divided by the area of the total peptaibol production) changes were calculated by each peptaibol peak area with the MS Data Review software. All data were analyzed for statistical significance by Graphpad Prism software version 6.01 (GraphPad Software, San Diego, CA, USA; www.graphpad.com). Comparative studies of different isolates were done by multiple t test analysis. The statistical significance was determined using the Holm–Šidak method with alpha = 5.00%. The statistical analysis of qPCR results was performed in SAS 9.4 (www.sas.com) in a completely randomized design with one-way ANOVA and Duncan’s test (p < 0.05).

3. Results

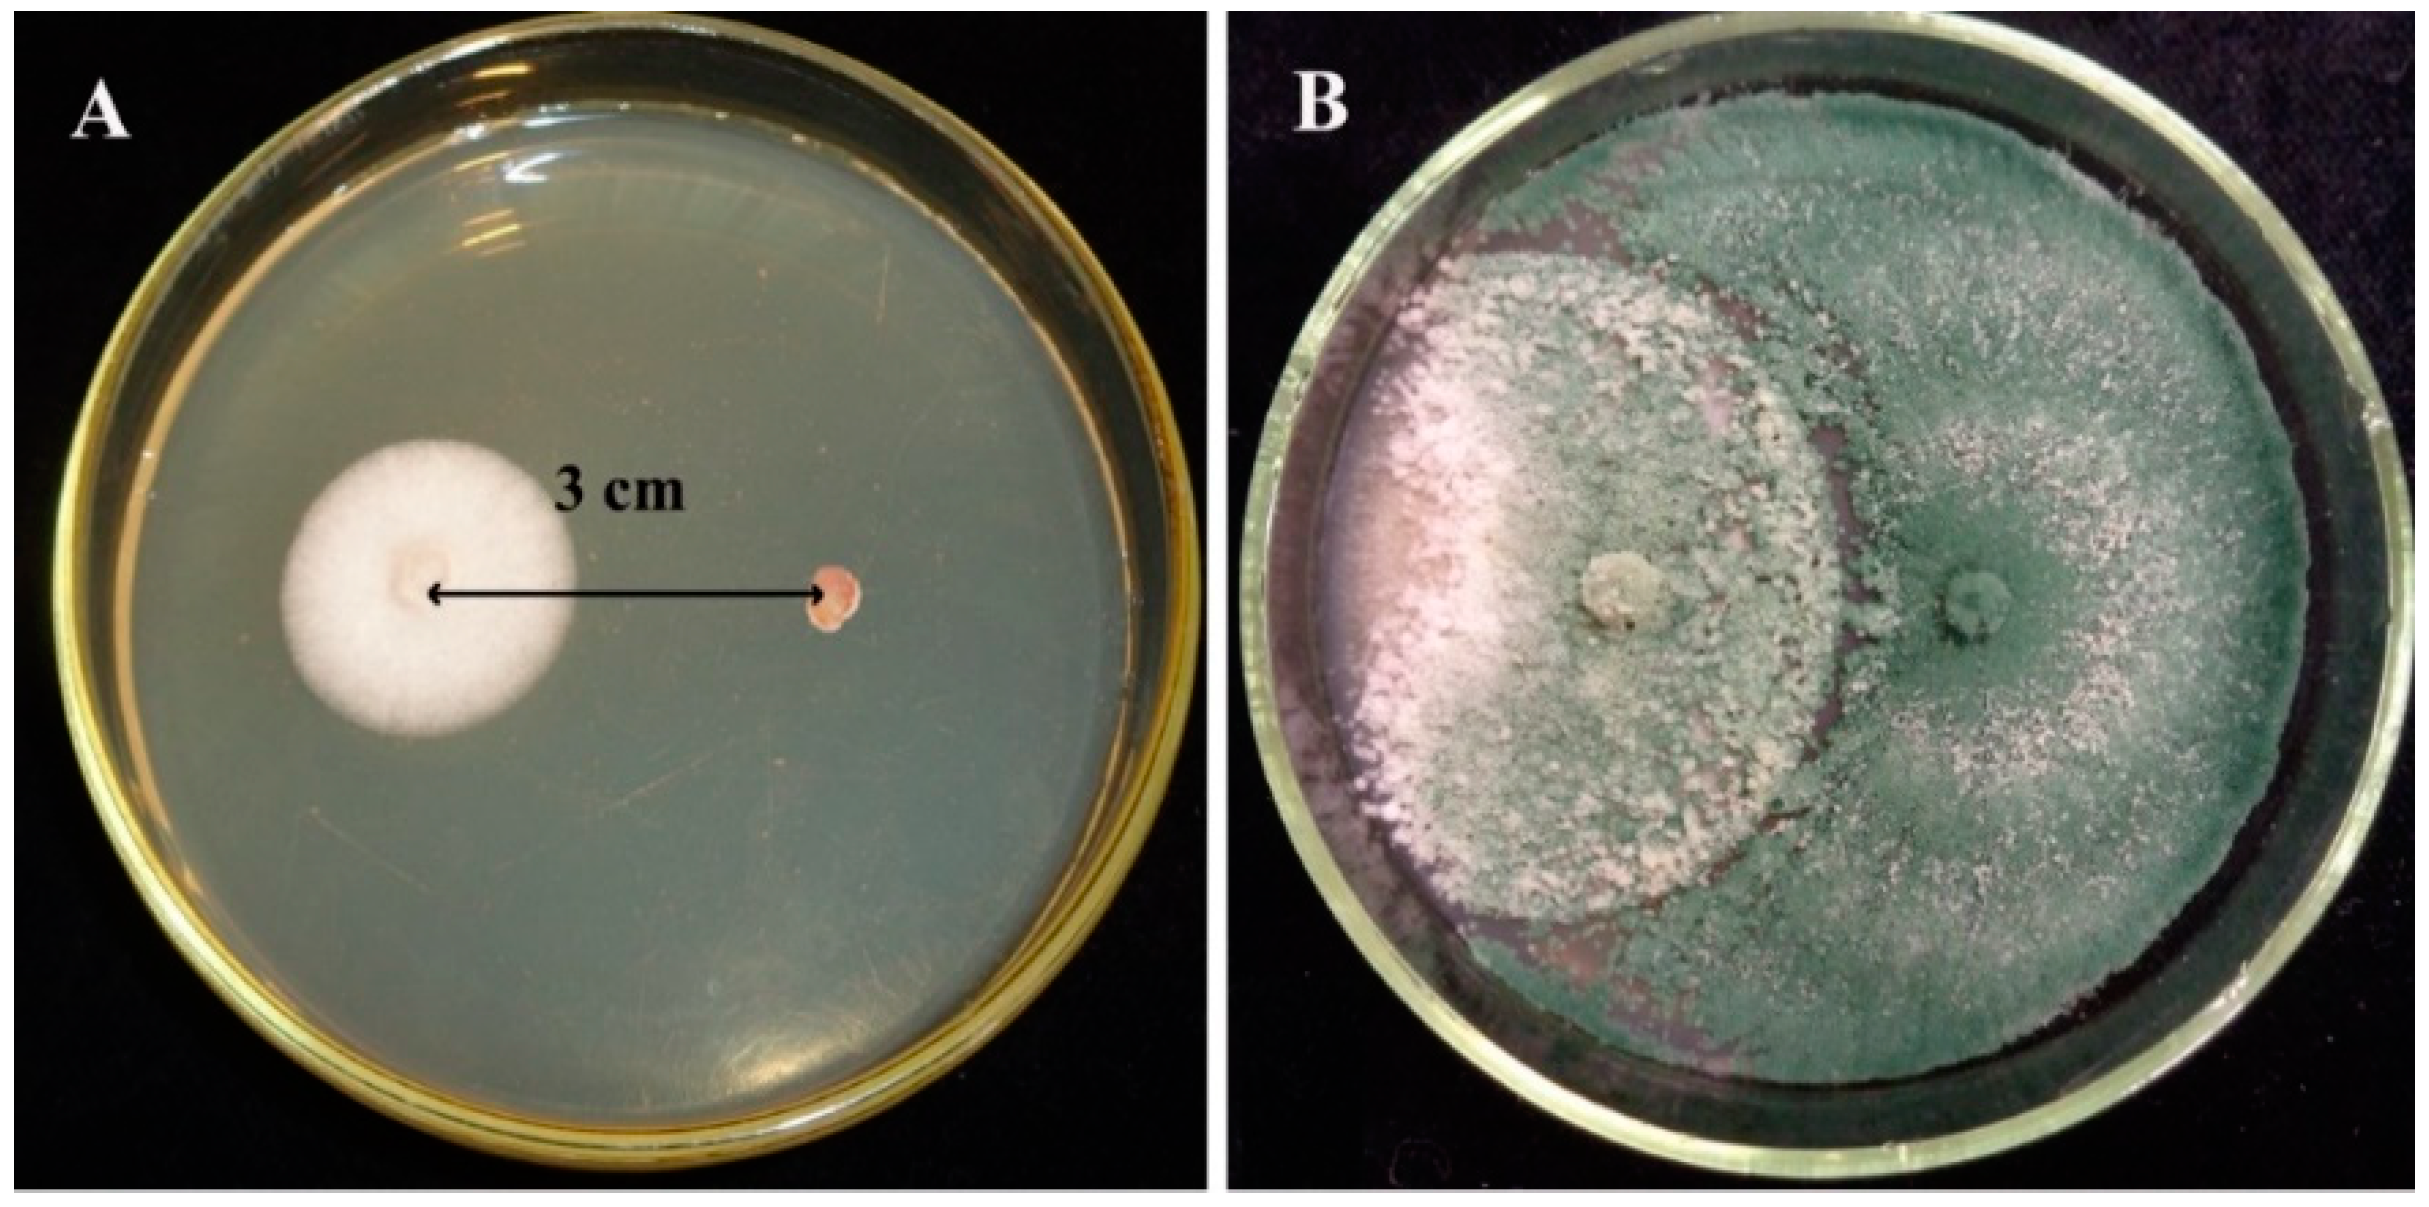
3.1. Inhibitory Activity of Peptaibol Extracts

The crude extracts of Trichoderma isolates used in this study showed antibacterial activities towards M. luteus (Figure 2A). T. asperellum IRAN 3062C had a larger inhibition zone (22 mm in diameter) than T. longibrachiatum IRAN 3067C. The alamethicin equivalent concentrations of the average amount of peptaibols in the crude extracts were 604.28 and 230.1 µg mL−1 for T. asperellum IRAN 3062C and T. longibrachiatum IRAN 3067C, respectively.
According to the results of the antifungal assay, the crude extract of T. asperellum inhibited spore germination and its effect started from the concentration of 100 µg mL−1 for all plant pathogenic fungi. The largest inhibition zones were seen in the case of A. solani (Figure 2B), R. solani and F. moniliforme. The results were in conformity with the findings of the BCI index assay described below.

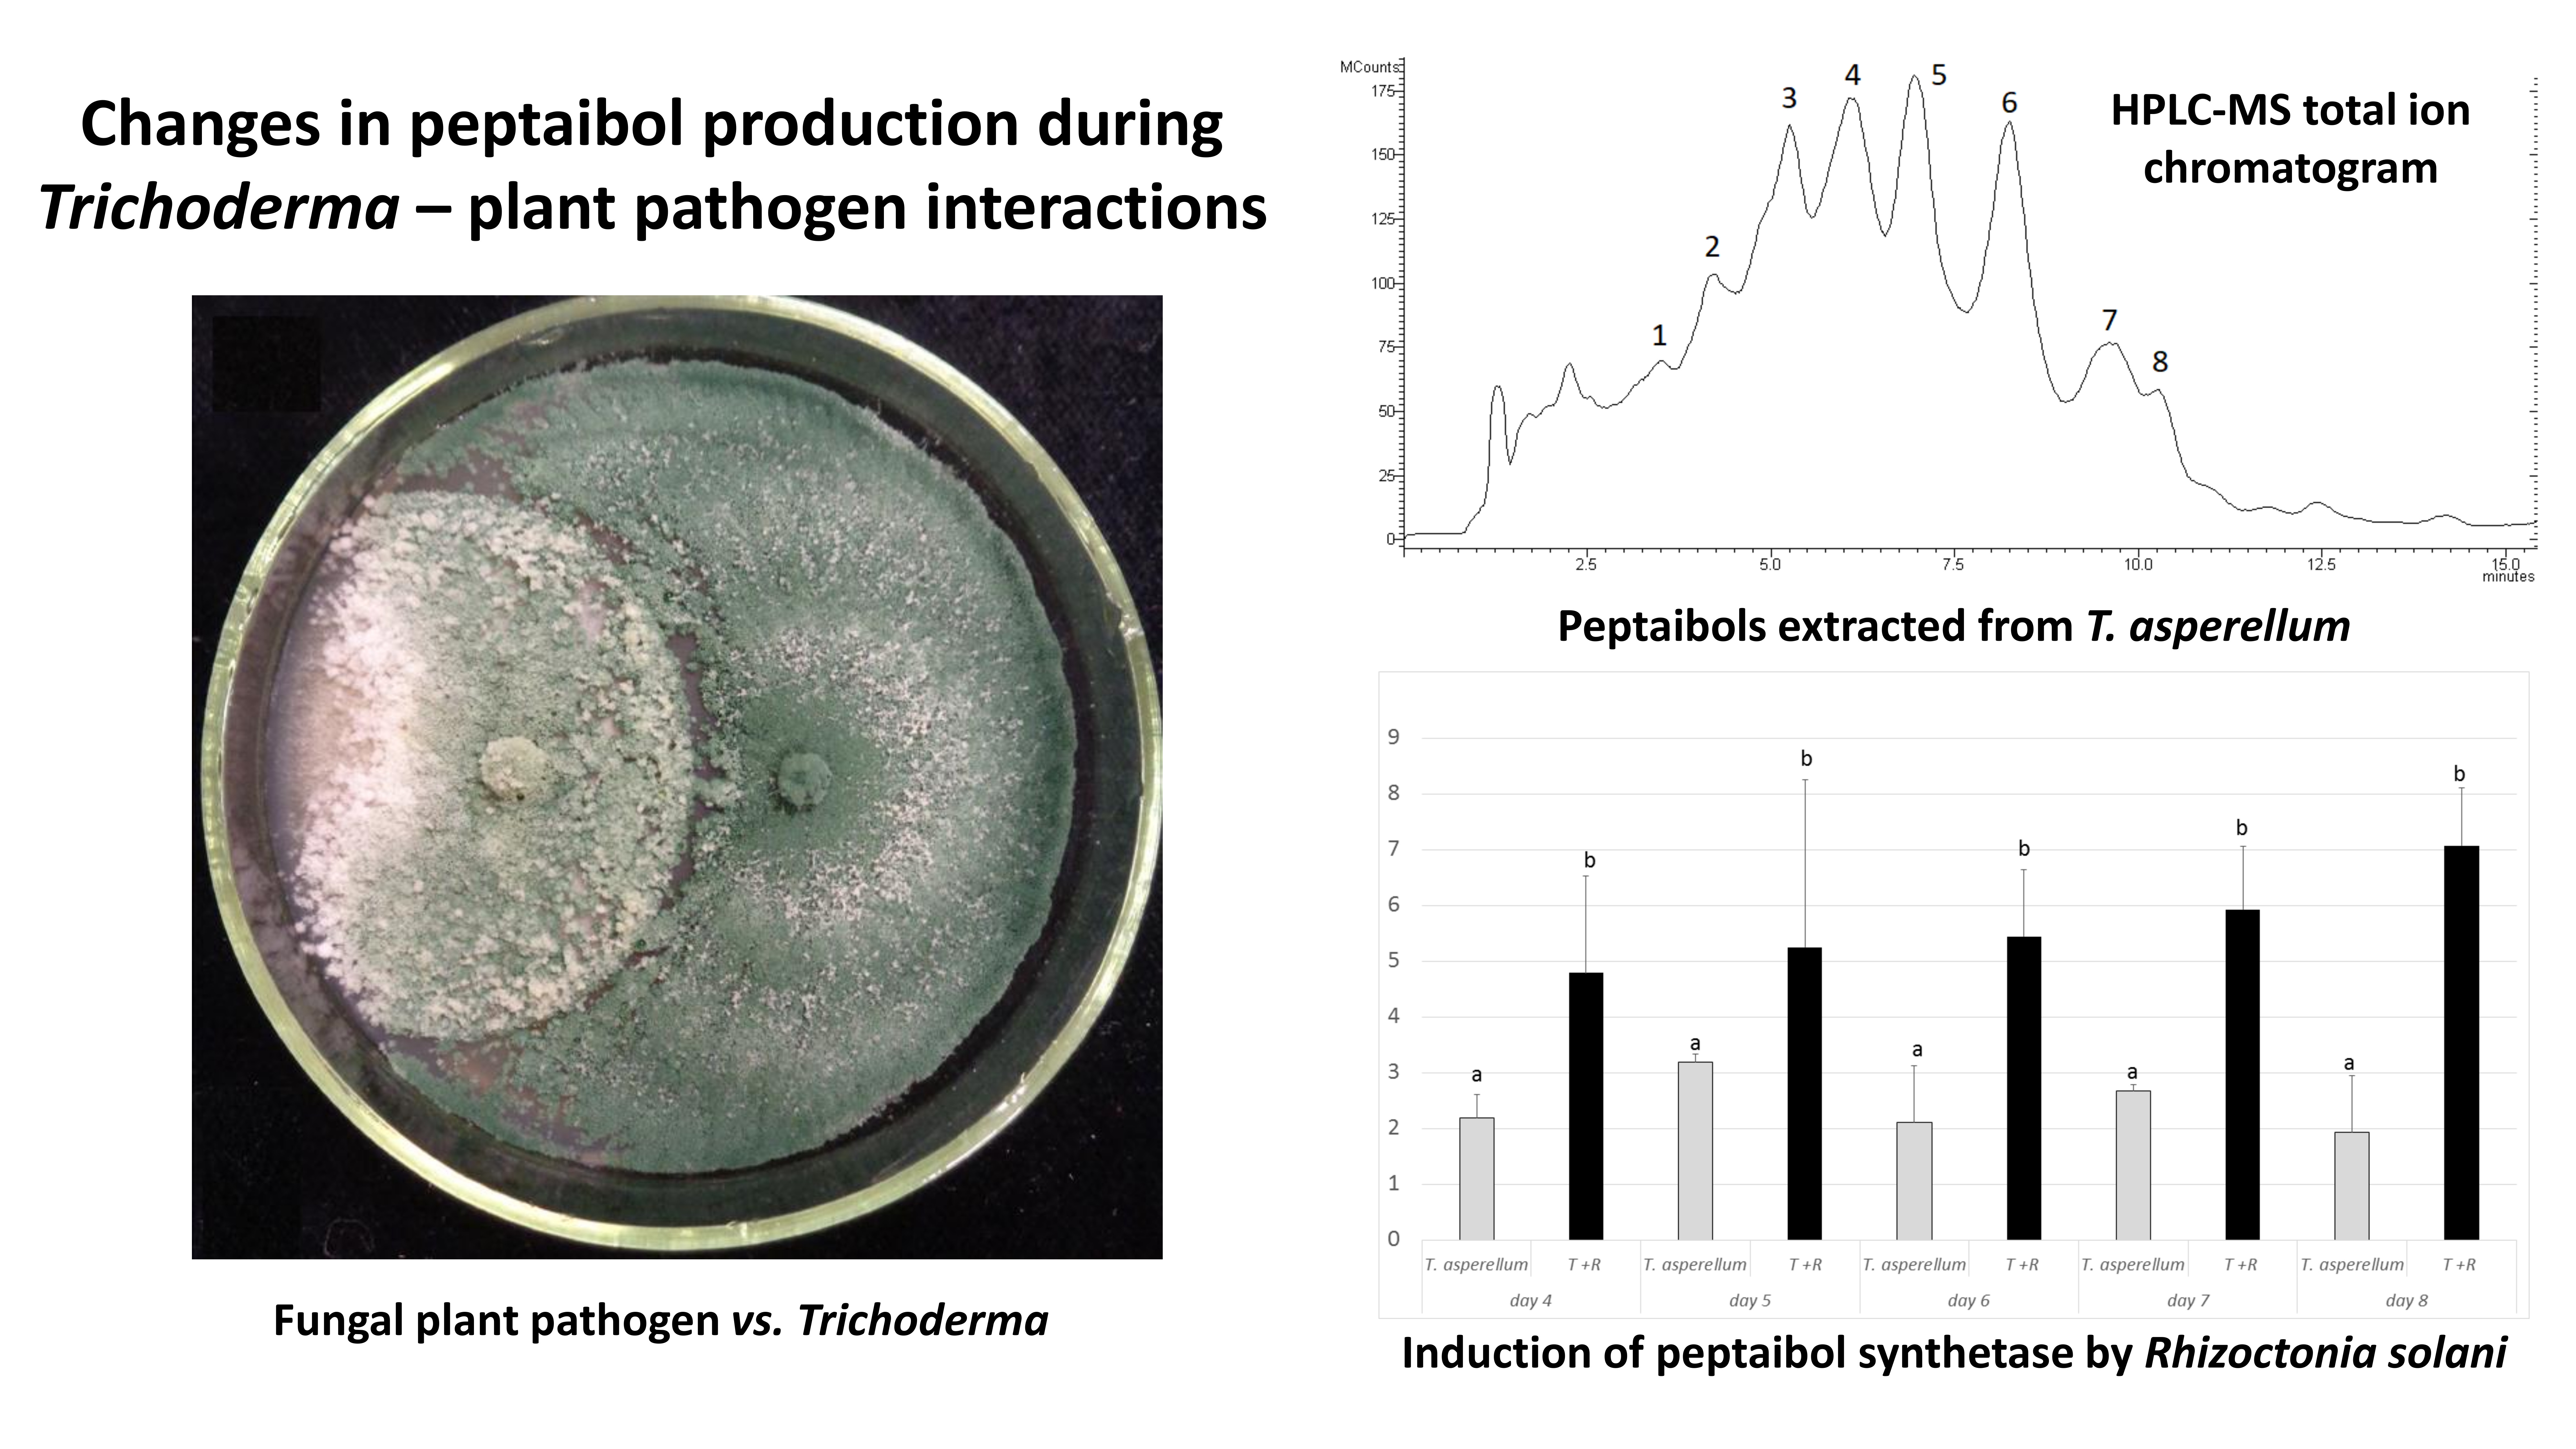
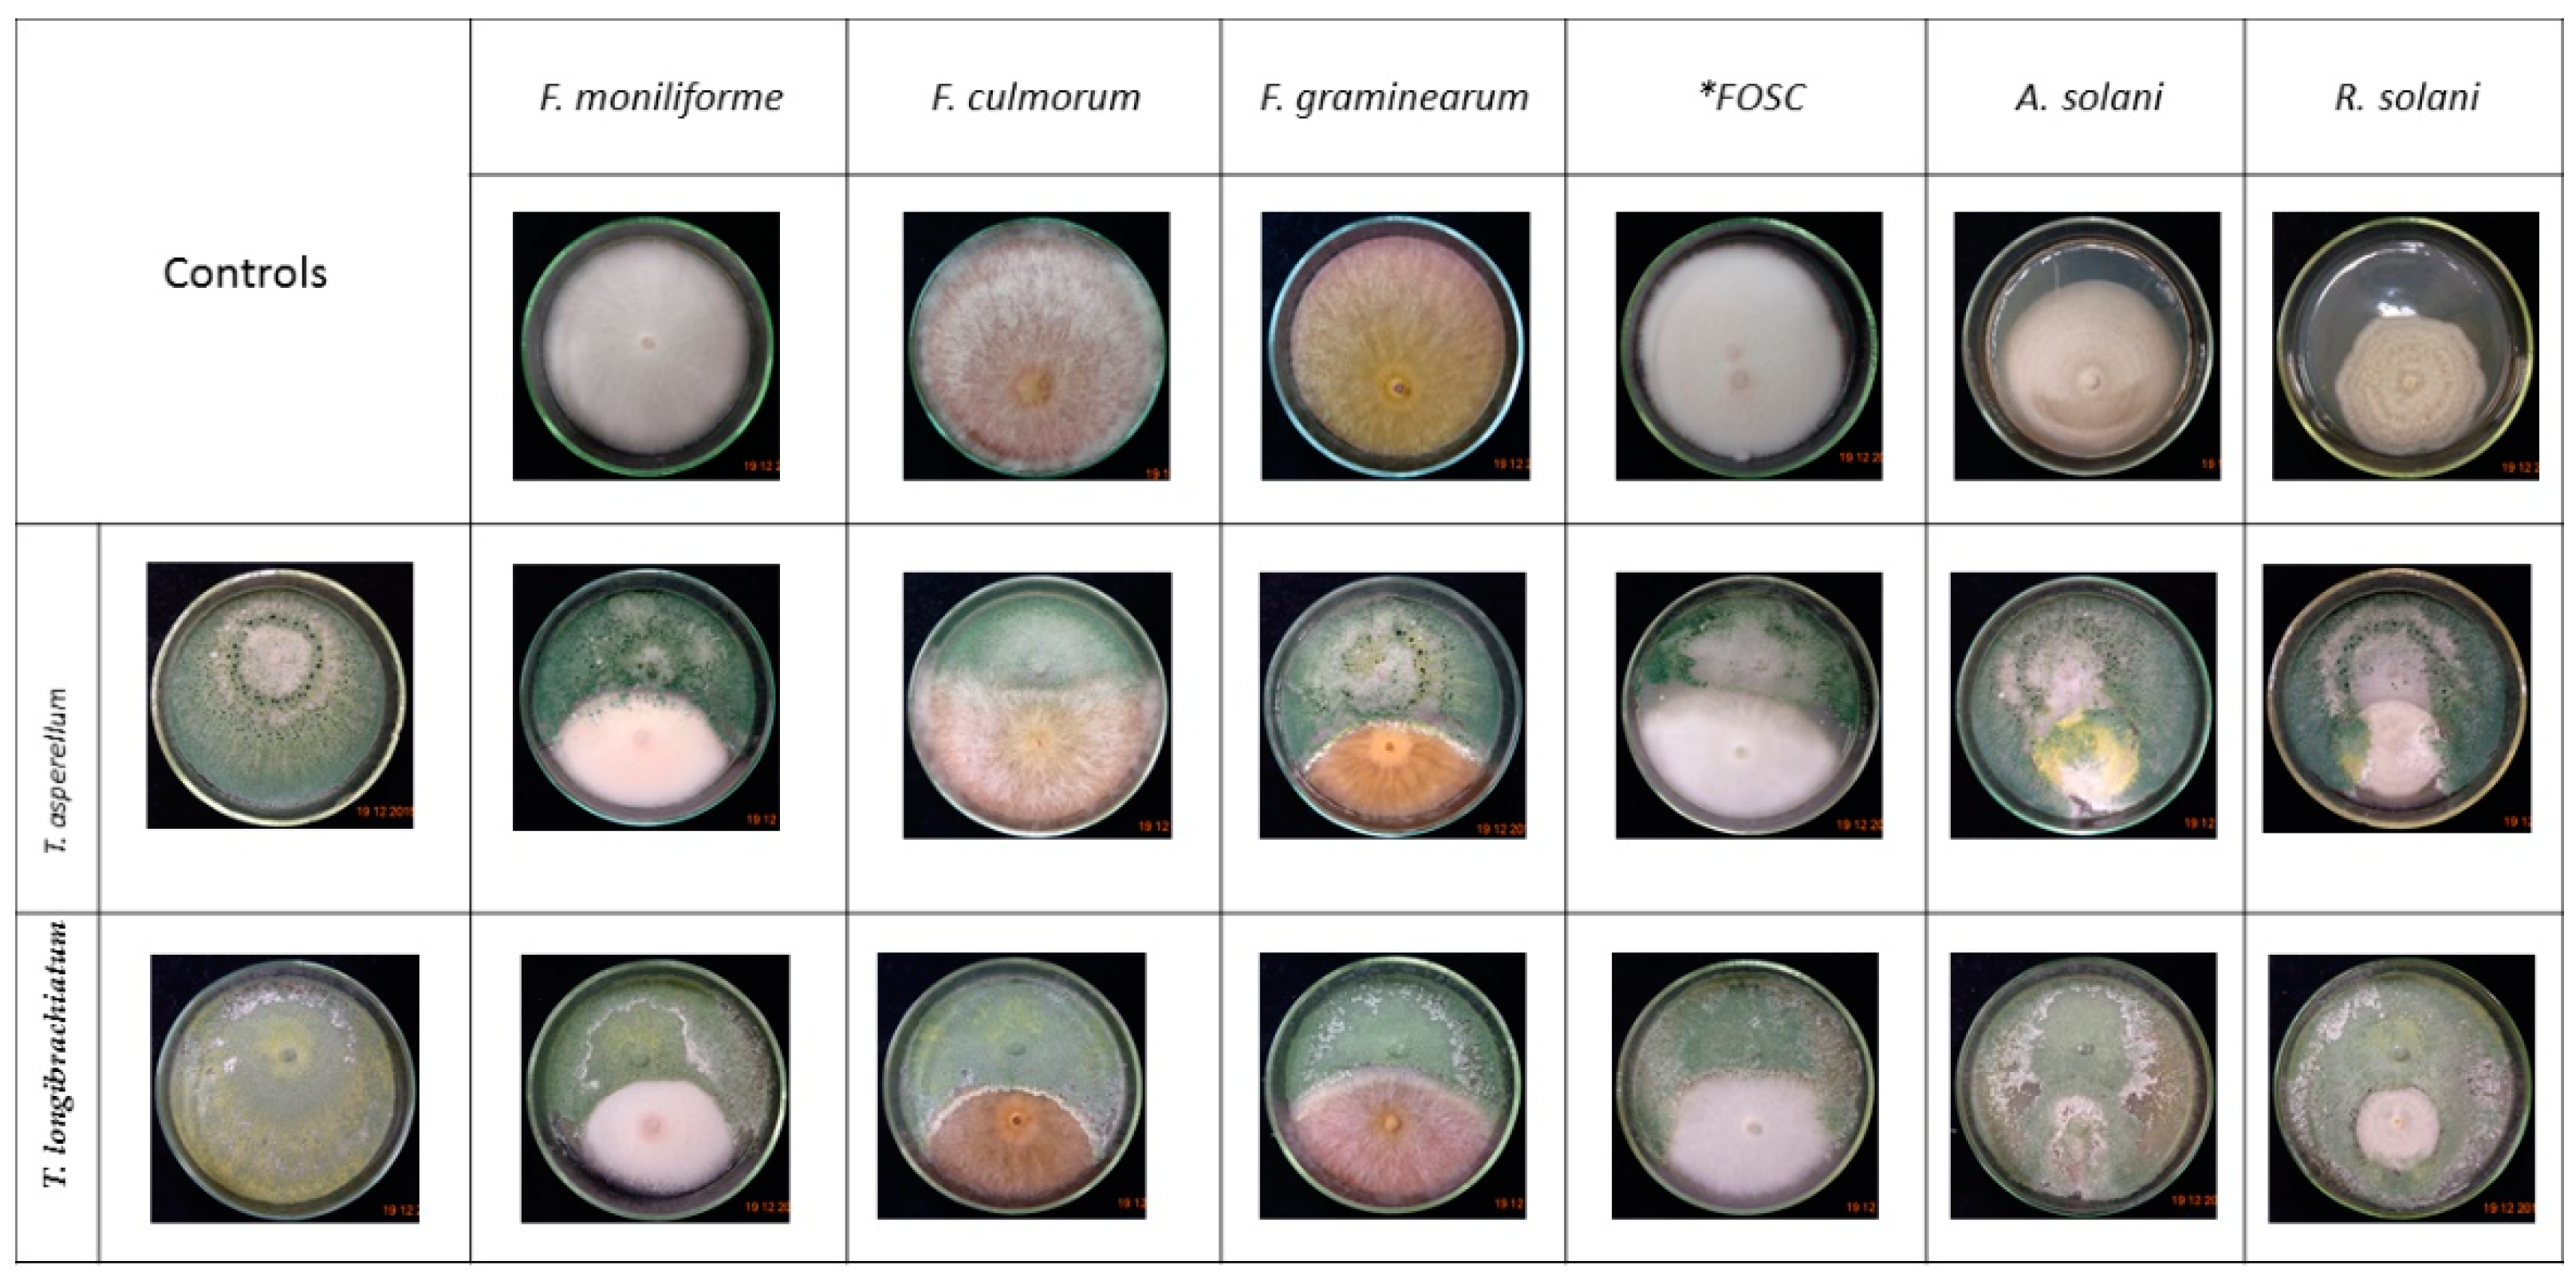
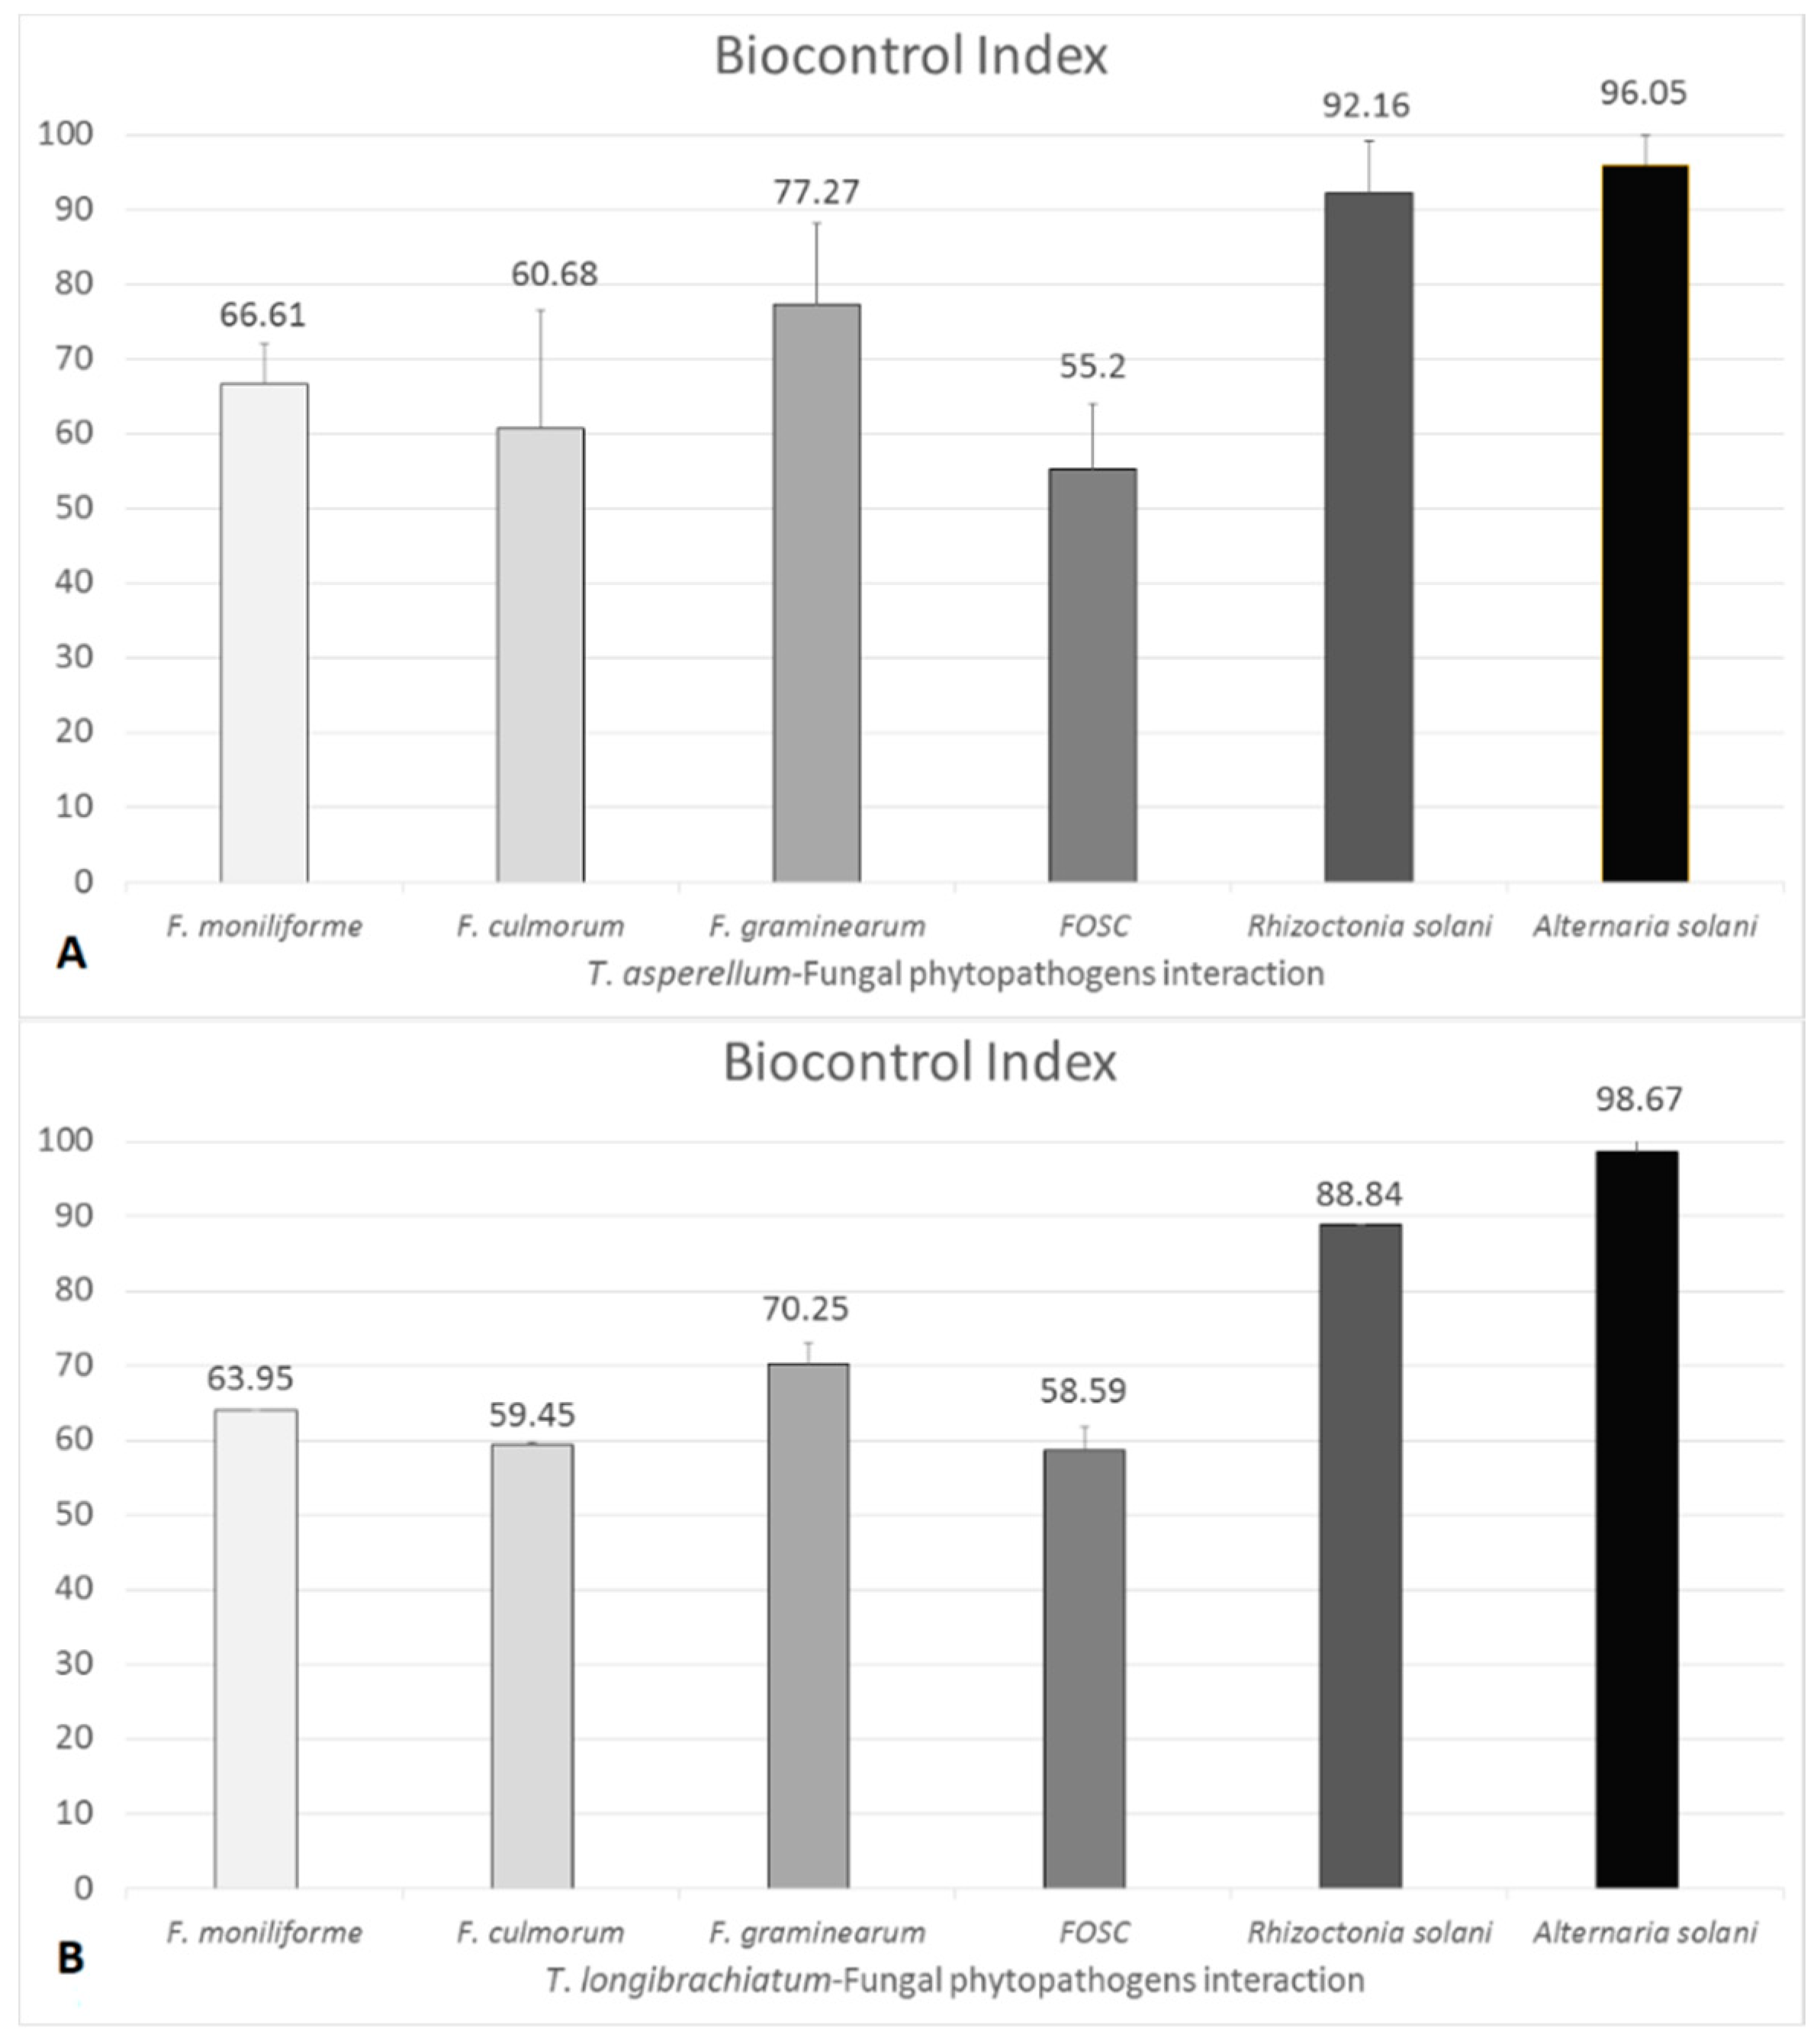
3.2. Confrontation Experiments

The dual culture technique (Figure 1) revealed that the examined Trichoderma strains were capable of overgrowing the examined plant pathogenic fungi. The mycelial growth of the plant pathogens was mitigated and a reduction of the colony diameter extension appeared in the presence of Trichoderma isolates (Figure 3).
BCI values showed diversity for each Trichoderma–plant pathogen interaction according to the plant pathogenic fungus and could reach up to 100%. BCI values showed that T. asperellum IRAN 3062C has efficient antagonistic abilities against A. solani and R. solani with BCI values of 96.05% ± 3.8% and 92.16% ± 6.94%, respectively. The T. longibrachiatum strain IRAN 3067C used in this study showed lower antagonistic capacities than T. asperellum IRAN 3062C against the various plant pathogens. The interactions of T. asperellum and T. longibrachiatum producing trichotoxins and longibrachins, respectively, revealed BCI values in decreasing order against A. solani, R. solani, F. graminearum, F. moniliforme, F. culmorum and FOSC (Figure 4).

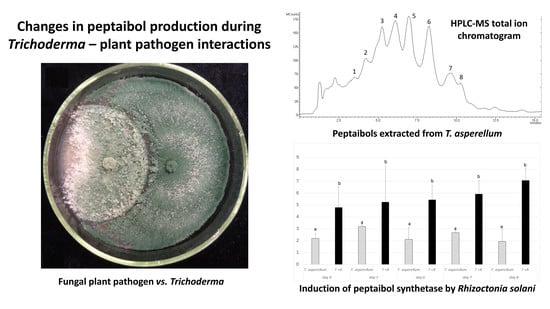
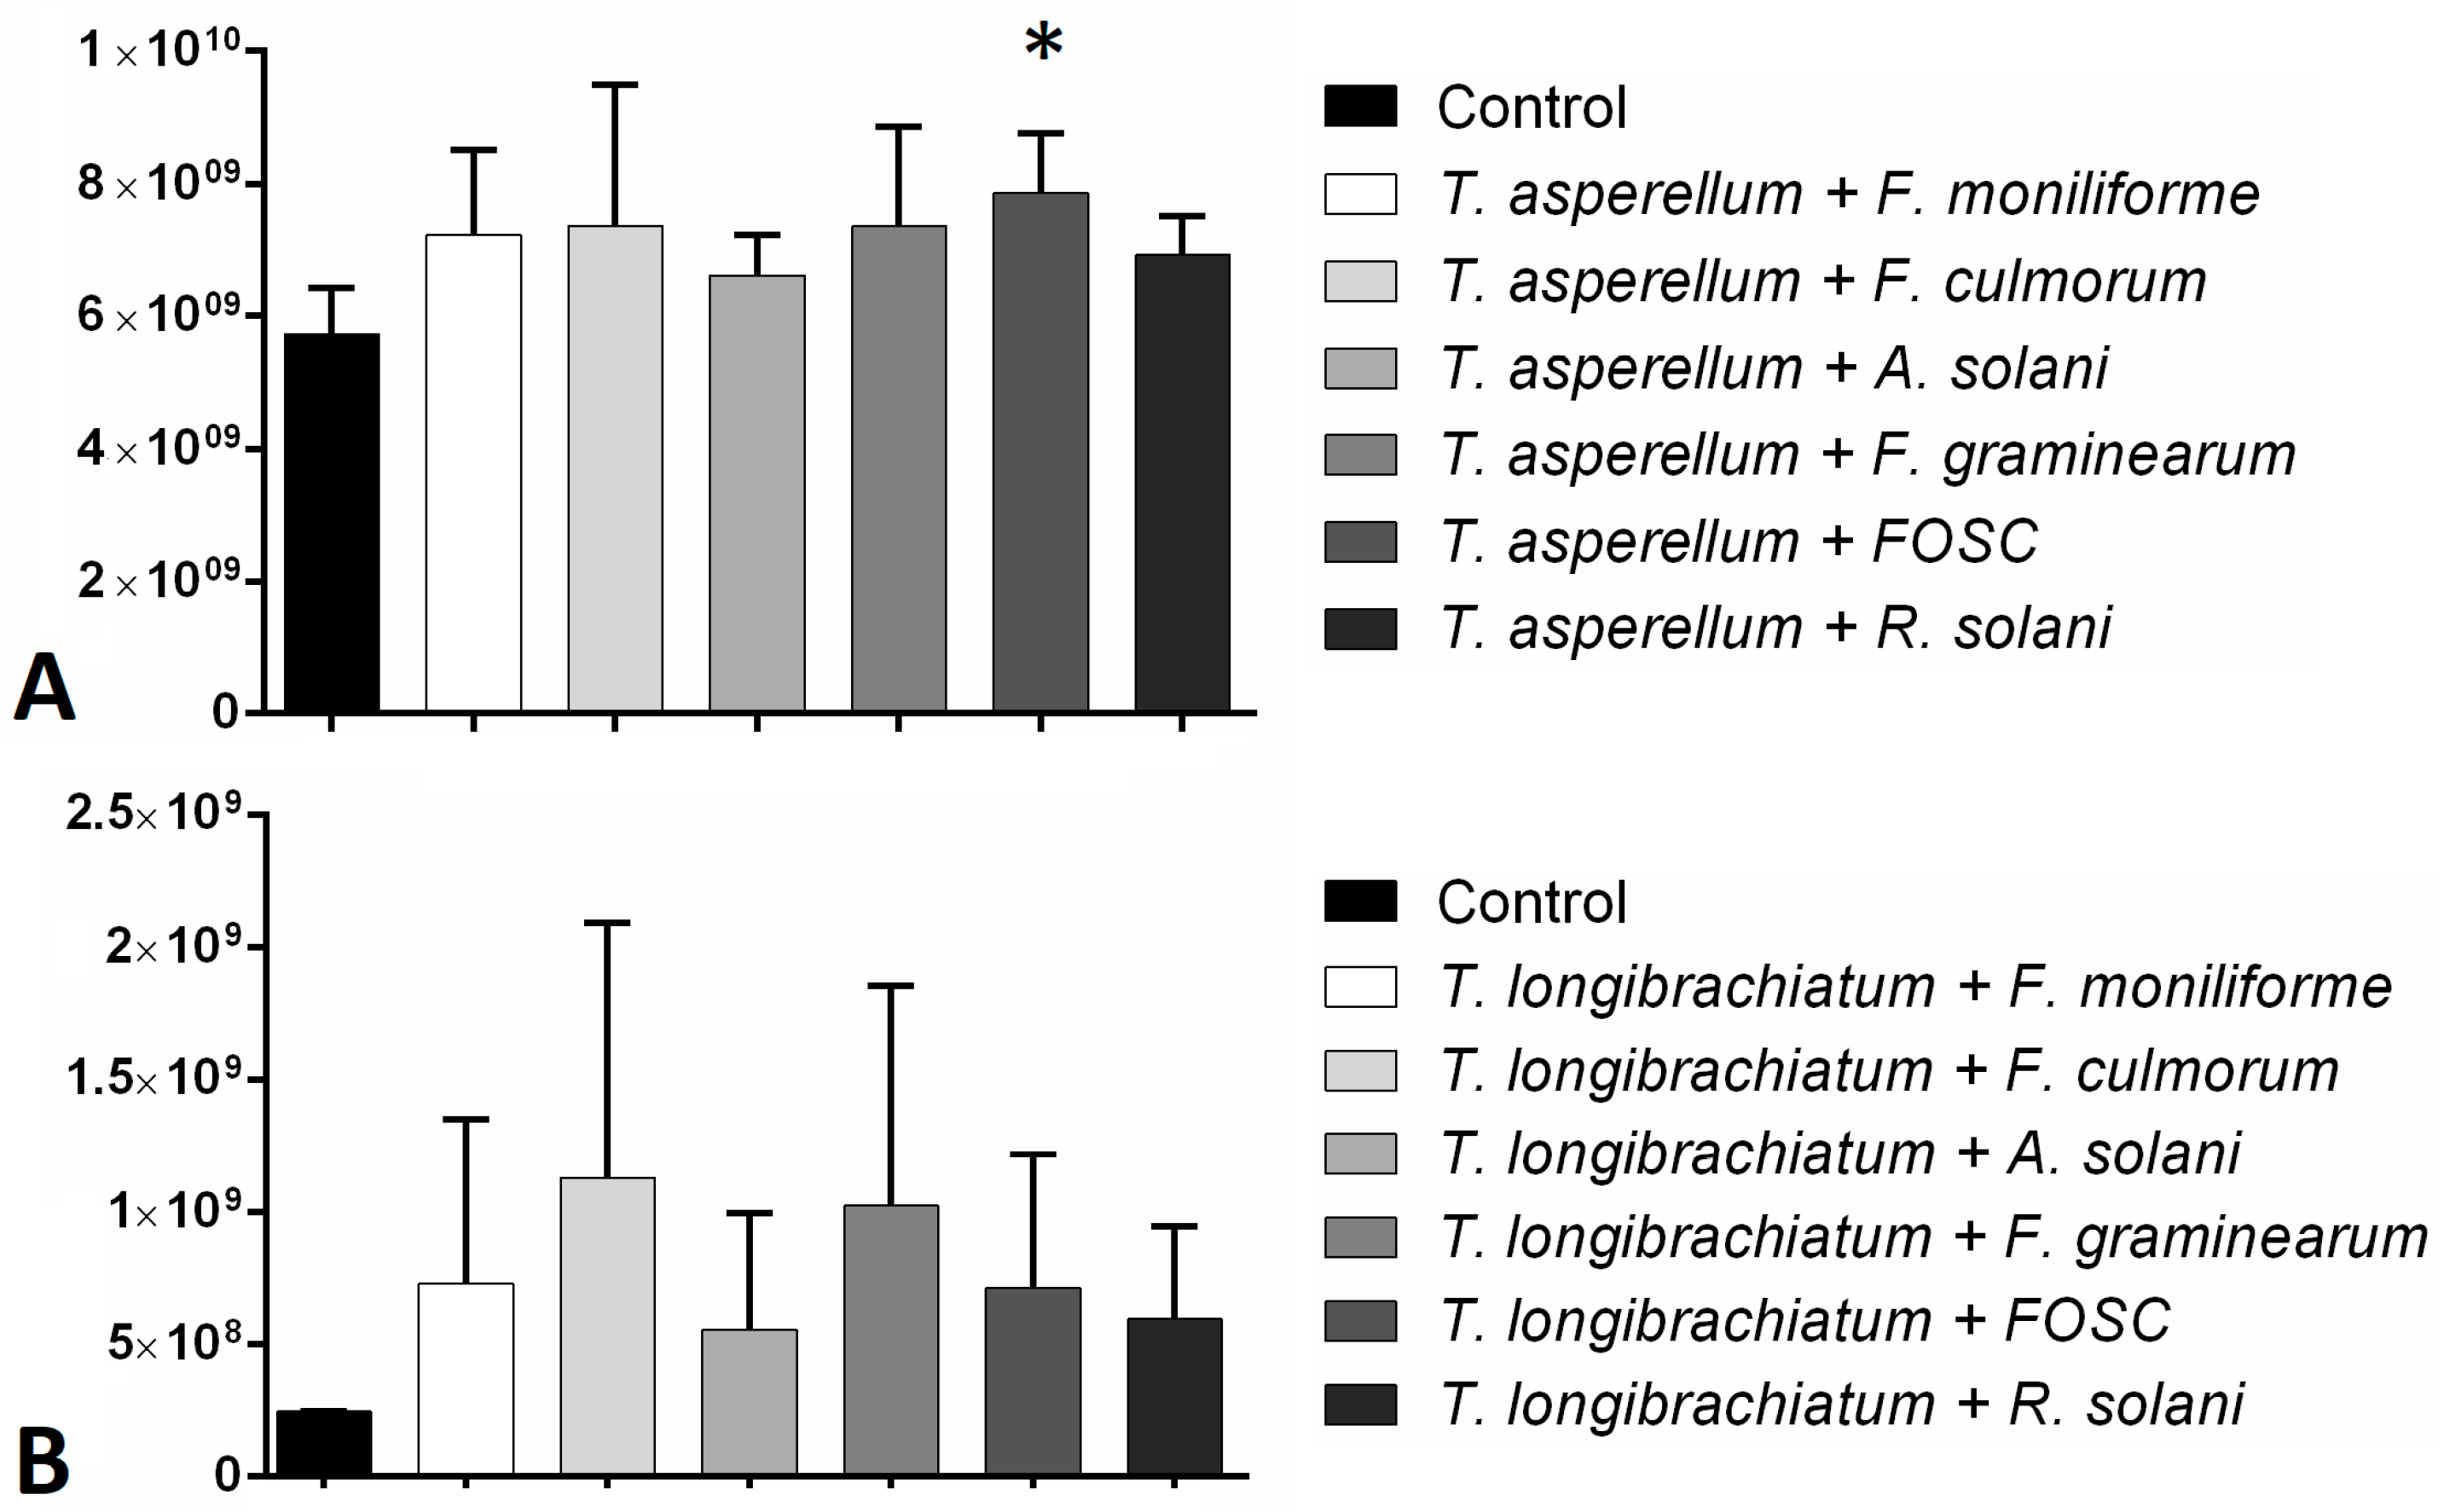
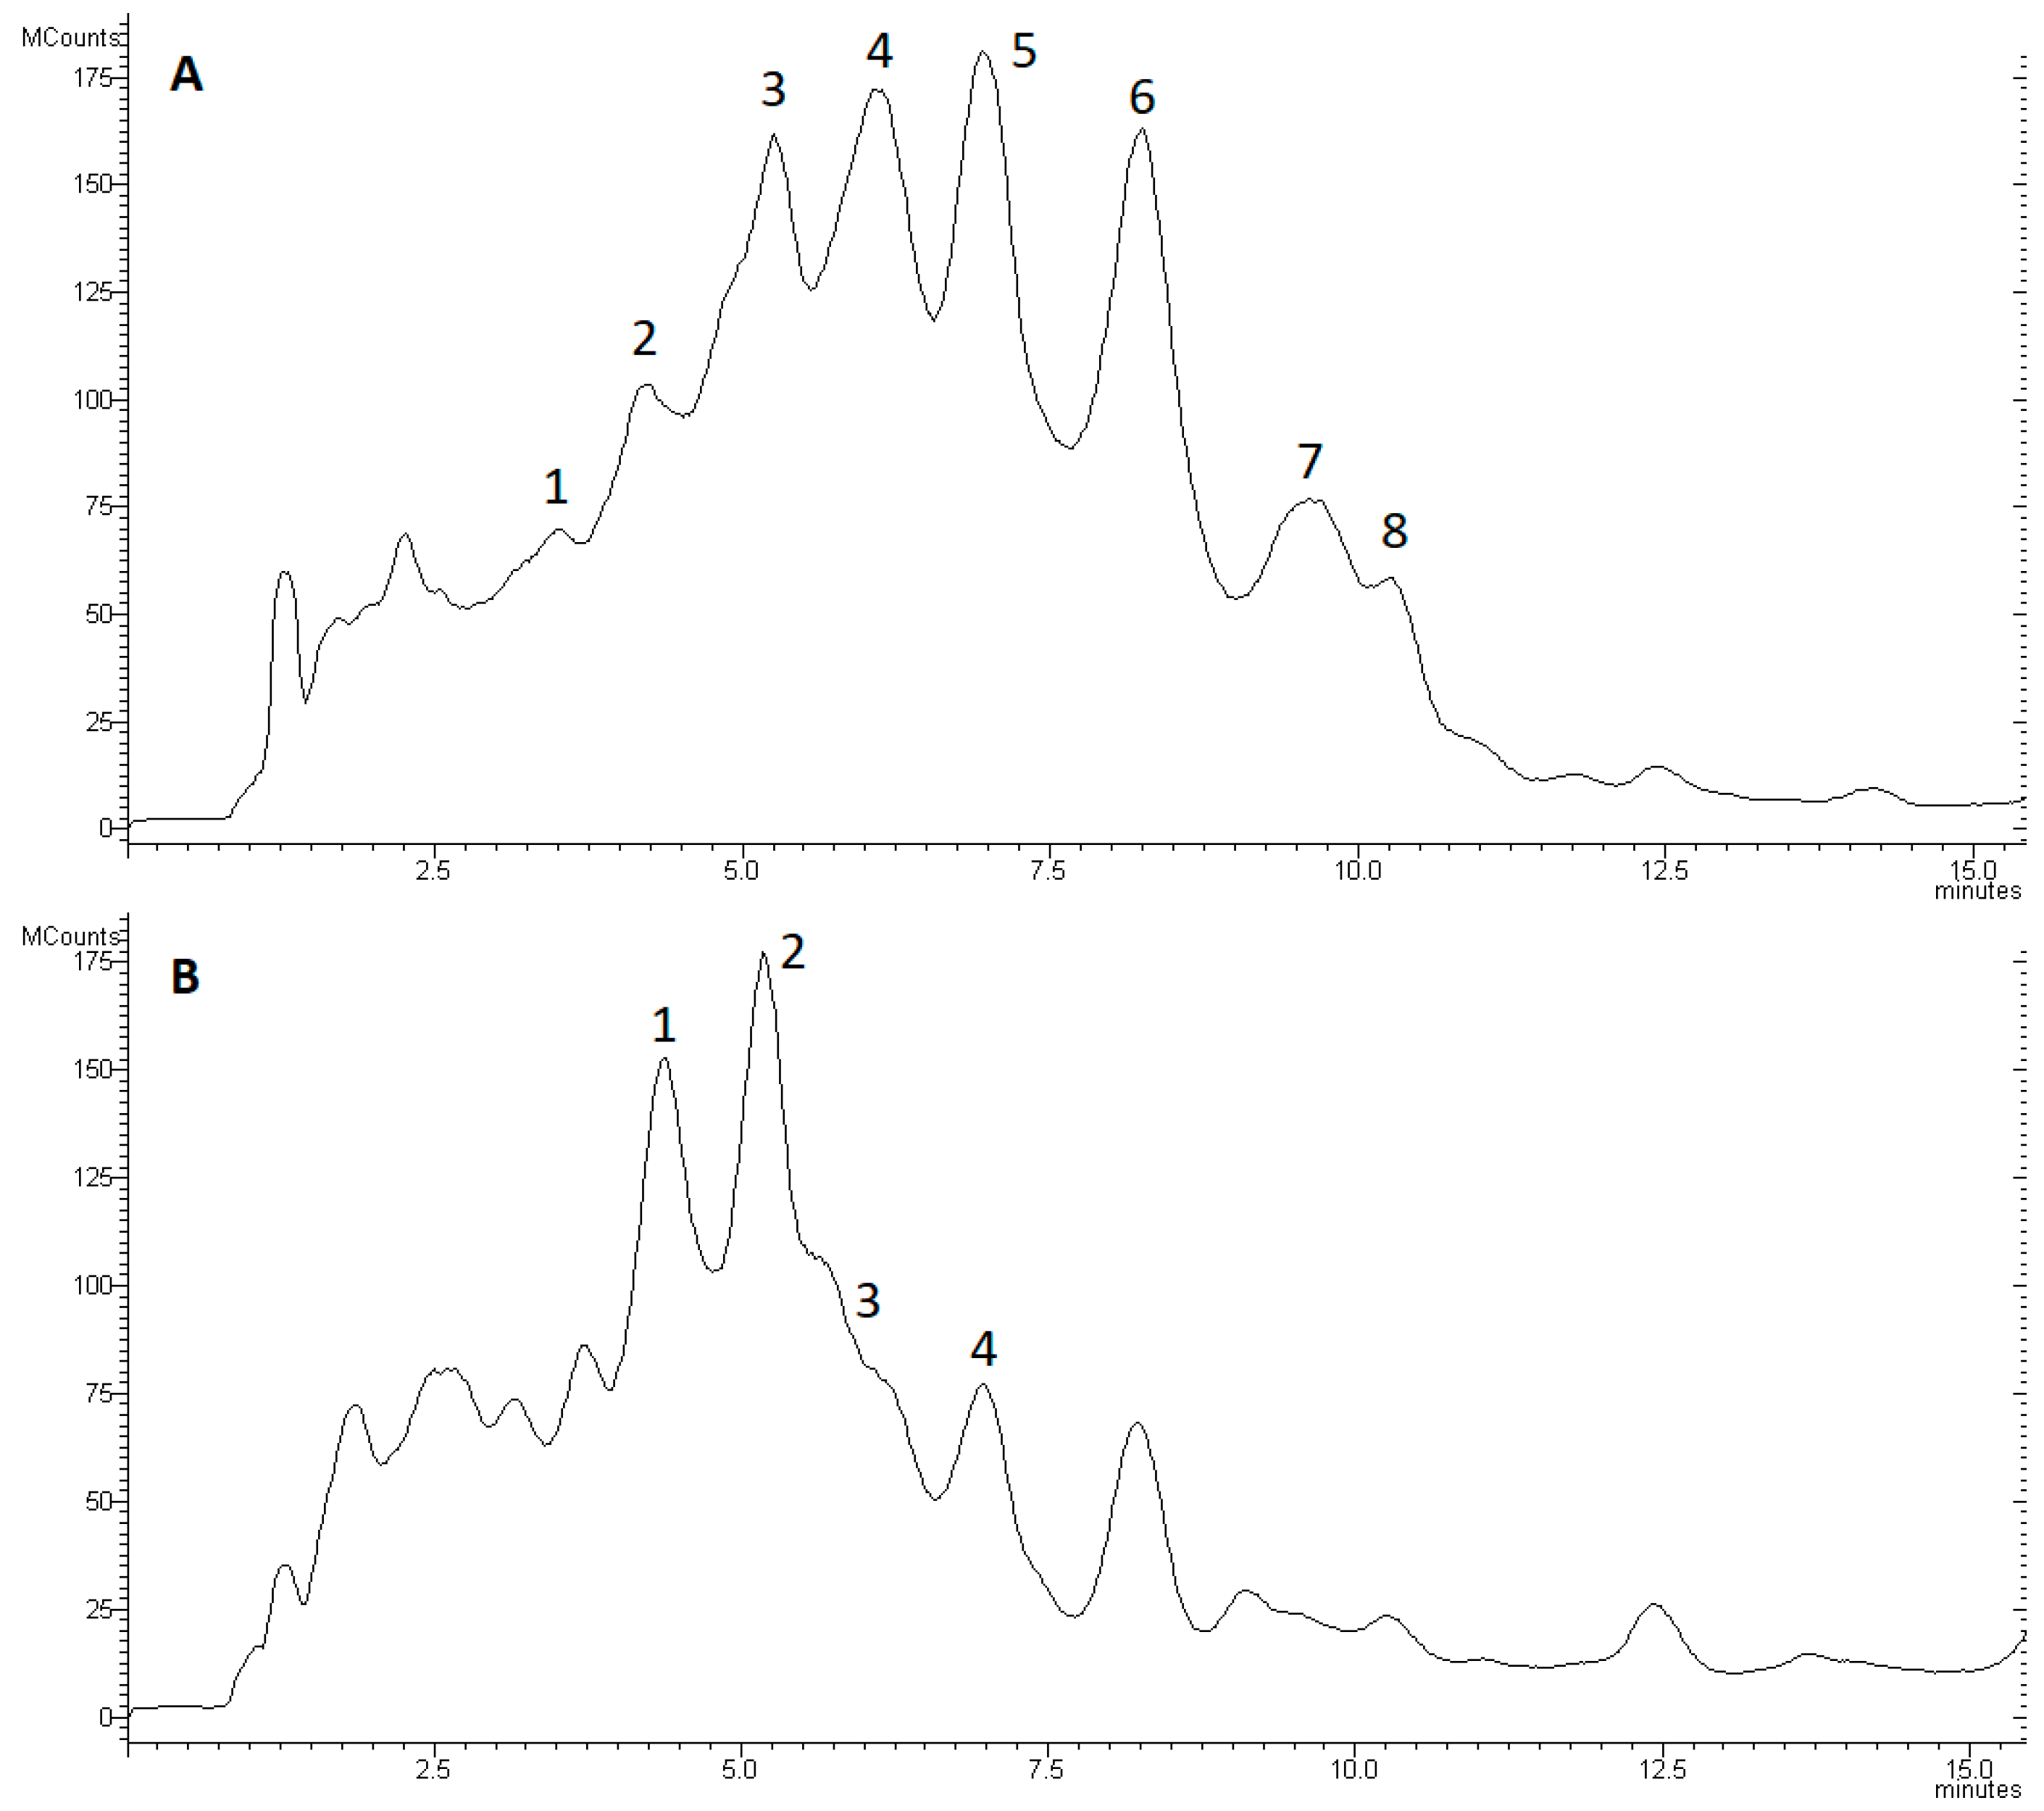
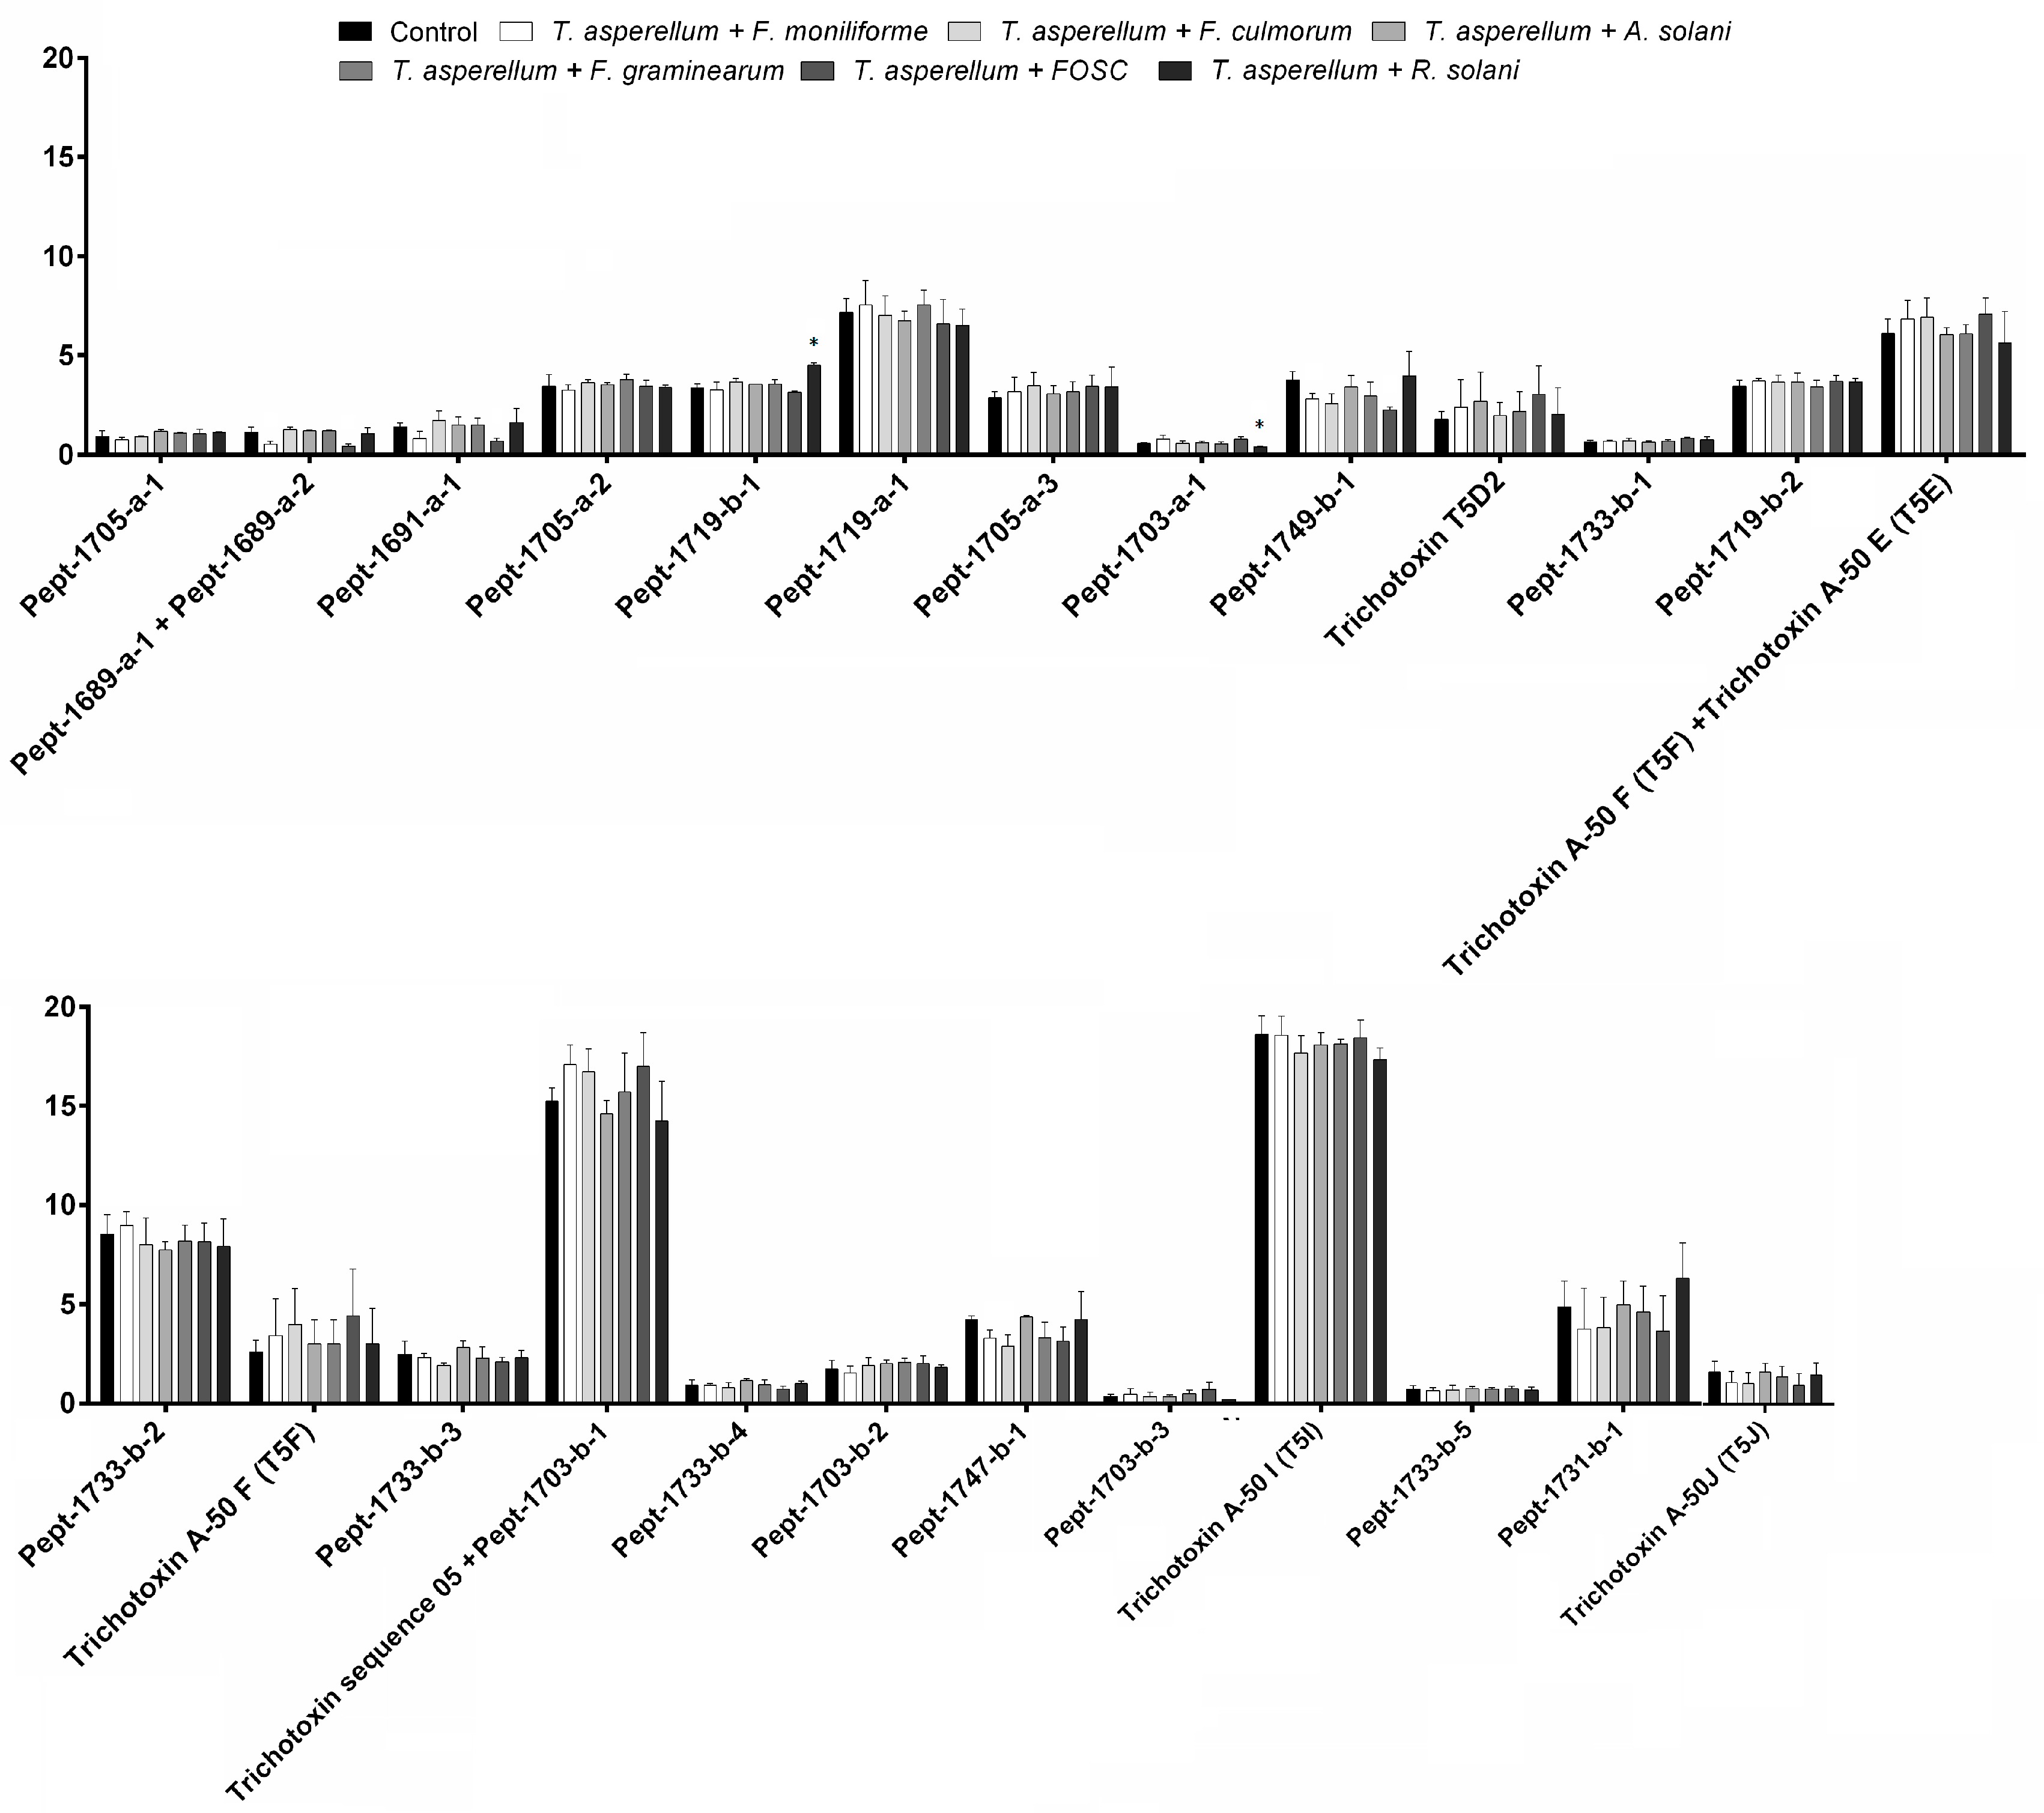
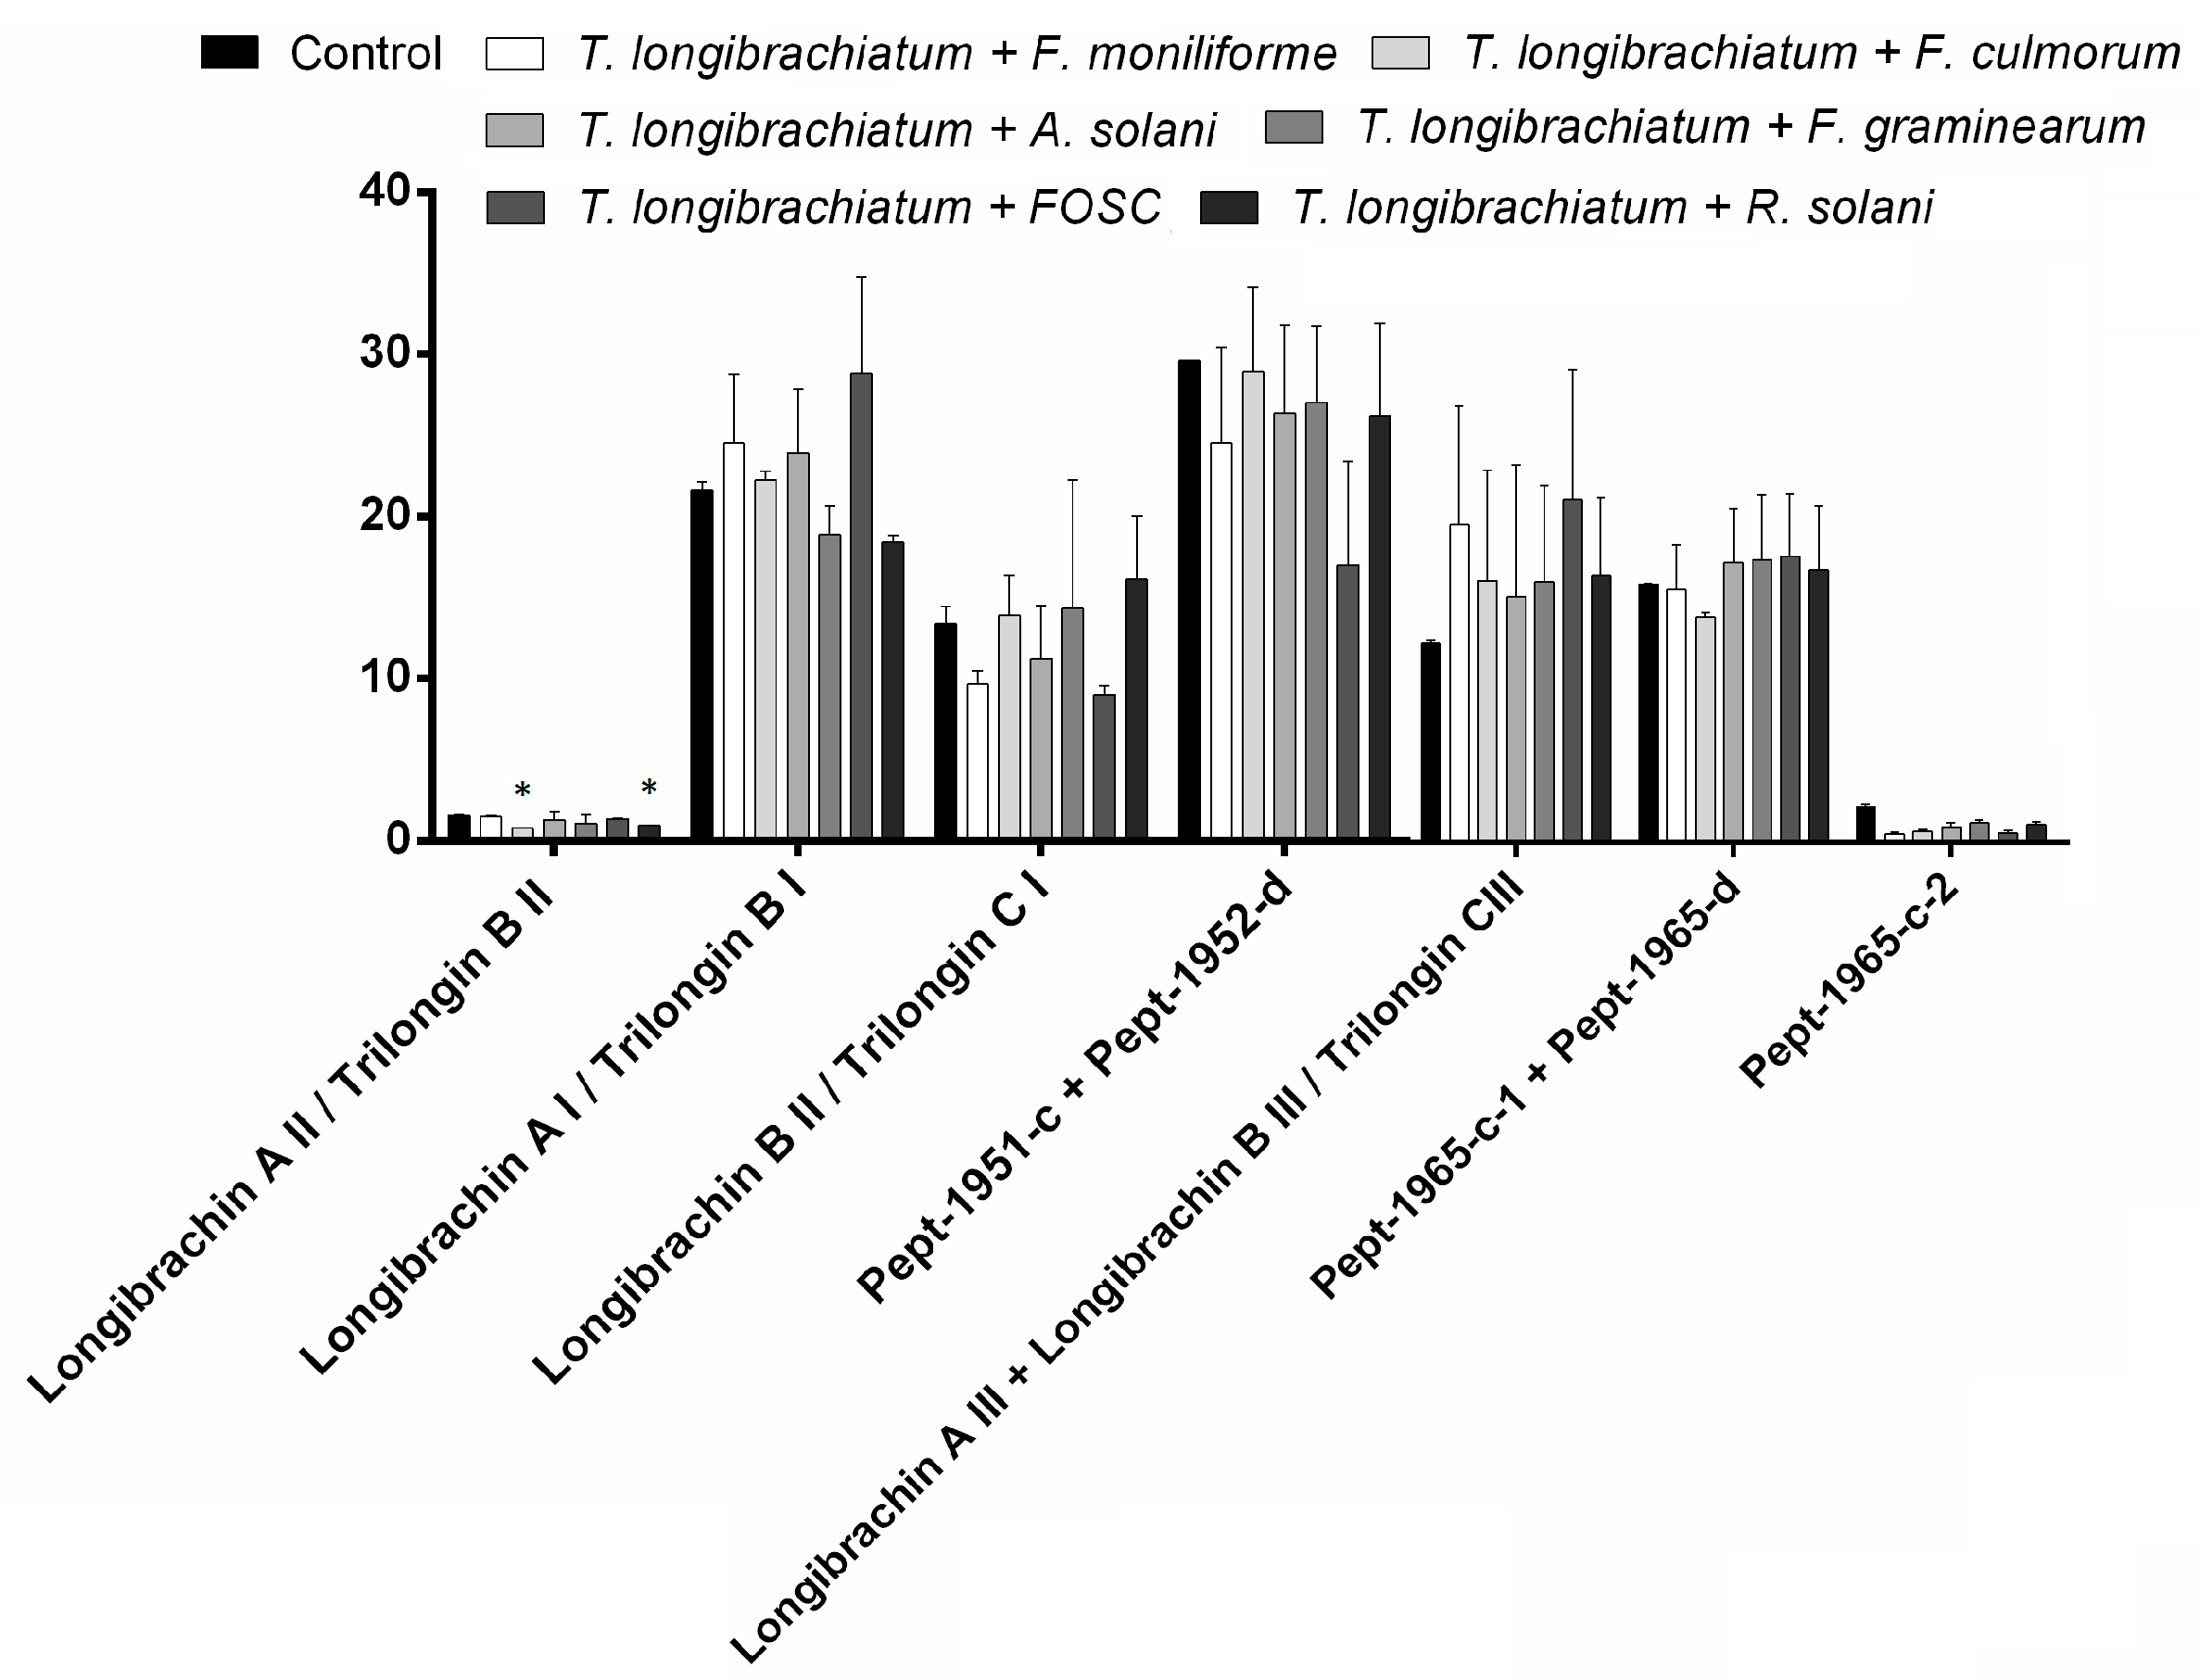
3.3. Changes in Peptaibol Production during Different In Vitro Trichoderma–Plant Pathogen Interactions

The total amount of peptaibols proved to be elevated during the interaction of T. asperellum with the tested plant pathogens and the increase proved to be significant in the case of the interaction with FOSC (Figure 5). The peptaibol production of T. longibrachiatum–plant pathogen interactions was also increased, although significant differences could not be observed.
Eight main peaks including the trichotoxin peptaibol group [22] as complex mixture of isoforms (Table 1) were detected in the chromatograms of T. asperellum IRAN 3062C (Figure 6A).
Analysing the mass spectrum of peak 1 revealed the presence of Pept-1705-a-1 [46] (Figure 6A). In peak 2, the peptaibols named Pept-1689-a-1 and a-2 [46] were different from the previously reported trichotoxins such as T5F [23] in the Aib residue at position 10. These two compounds were shown on the chromatograms (extracted to their [M + Na]+ ions) in one merged peak and their relative amounts have not significantly changed in any of the interactions. This peak also contains Pept-1691-a-1. In peak 3, signals related to five peptaibols, Pept-1719-a-1, Pept-1719-b-1, Pept-1705-a-3, Pept-1703-a-1 and Pept-17049-b-1 [46] were detected. These peptaibols were different from other detected trichotoxins with the presence of Ser in position 10. Pept-1705-a-2 proved to be different from Pept-1705-a-1 in Aib-Ala residues in positions 9 and 11 instead of Ala-Aib [25]. The production of Pept-1719-b-1 increased, while the amount of Pept-1703-a-1 decreased significantly (p < 0.05) in the T. asperellumR. solani interaction. The analysis of peak 4 enabled the identification of Pept-1719-b-2, Pept-1733-b-1 and -b-2 [46], as well as trichotoxin T5D2, trichotoxin A50 E and F (Pept-1689-b-1 and -a-3) [25]. On the [M + Na]+ extracted chromatograms of trichotoxin A50 E and F, the peptides were also merged in one peak similarly to Pept-1689-a-1 and a-2 mentioned above. In peak 5, the signals related to trichotoxin A-50 F (Pept-1689-b-2), trichotoxin sequence 05 (Pept-1703-a-2) [25], Pept-1733-b-3, Pept-1703-b-1 and Pept-33-b-4 [46] were detected. Trichotoxin sequence 05 and Pept-1703-b-1 were also seen together in the same extracted [M + Na]+ peaks. In peak 6, five peptaibols were observed: Pept-1703-b-2, Pept-1747-b-1, Pept-1703-b-3, Pept-1733-b-5 [46] and trichotoxin A-50I (Pept-1717-b-1) [25]. Pept-1731-b-1 was found in peak 7, while peak 8 contained trichotoxin A50J (Pept-1731-b-2) [46] (Figure 7). No significant differences (p < 0.05) could be detected in the relative amounts of peptaibols in peaks 4–8 in any of the interactions.
As T. longibrachiatum is clinically important, it is not suggested to be used as a biocontrol agent [47]. The T. longibrachiatum strain was involved in this study as a producer of 20-residue long peptaibols (Figure 8). Longibrachins AI and AII were found in peak 1, while AIII was observed in peak 2 [48]. The relative amount of longibrachin AII was significantly decreased in interactions with F. culmorum and R. solani. Longibrachin BII and BIII could be identified in peaks 1 and 2, respectively [26,49]. Pept-1951-c and Pept-1952-d [46] could also be observed in the same merged extracted [M + Na]+ ion peak, similarly to longibrachin AIII and BIII, and Pept-1965-c-1 and Pept-1965-d. Pept-1966-d [46] and Pept-1965-c-1 [46] were found in peak 3 while Pept-1965-c-2 [46] could be observed in peak 4 (Figure 8).

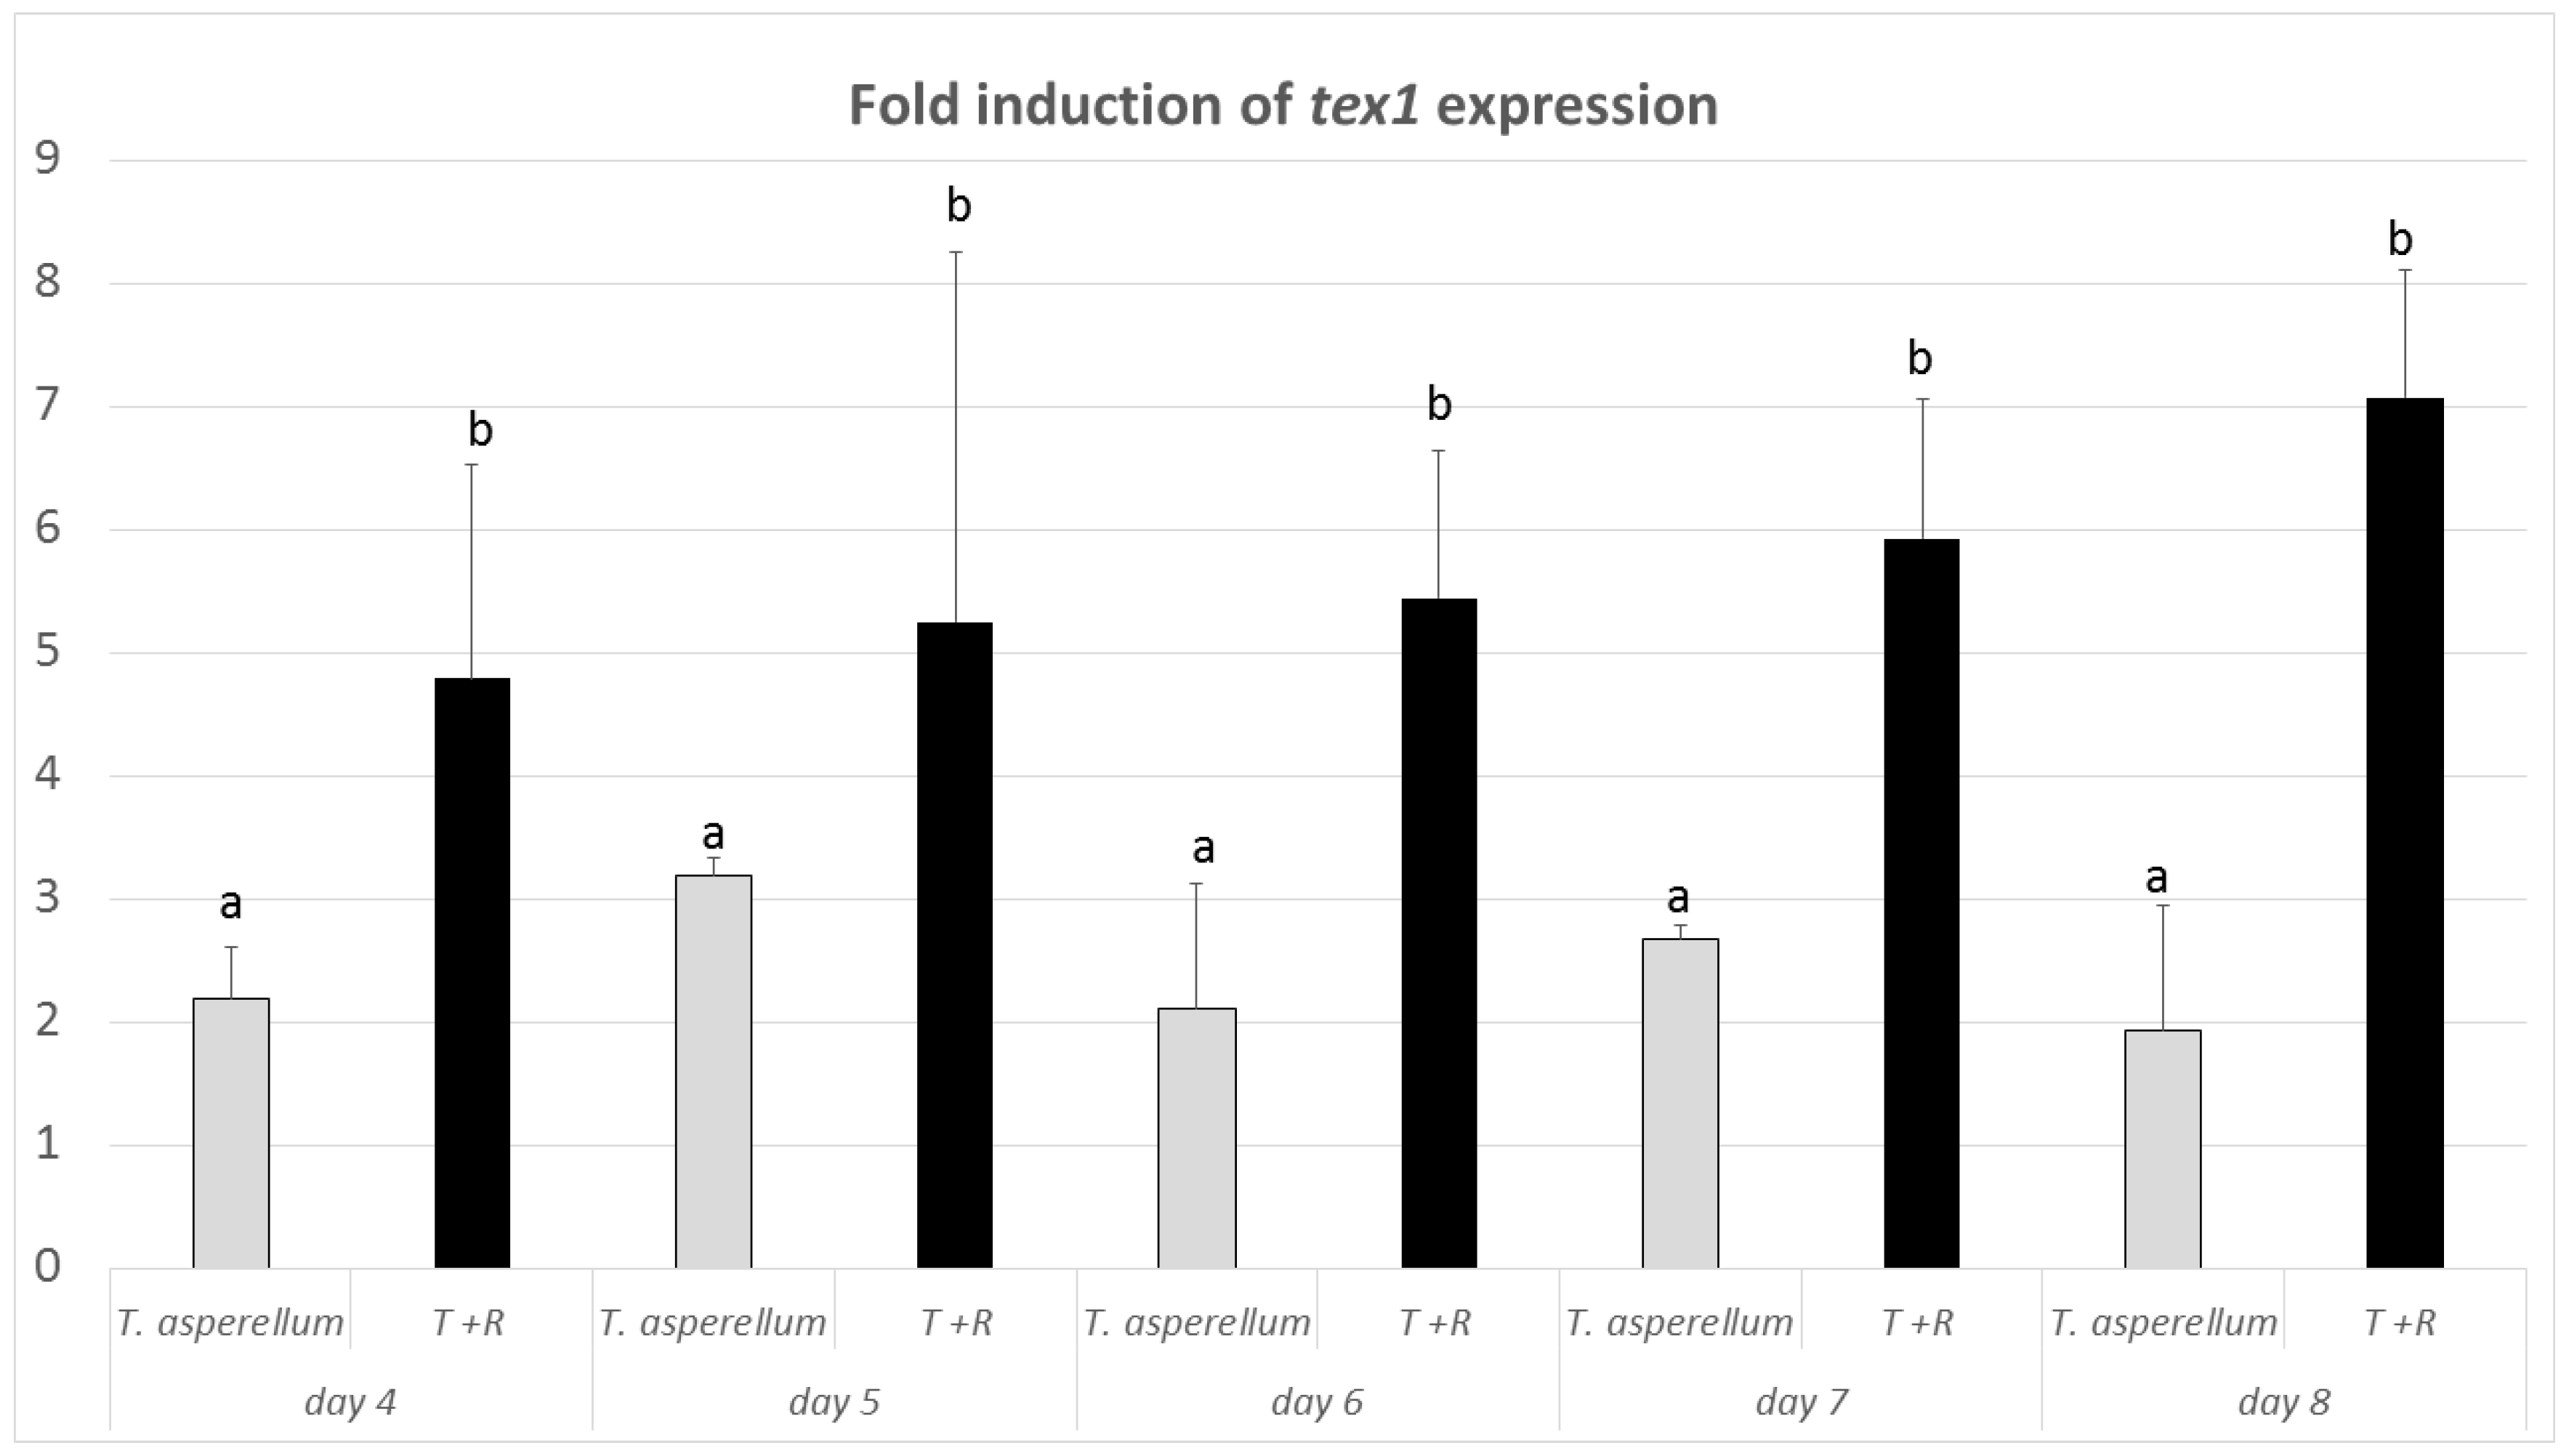
3.4. Expression of the tex1 Gene during T. asperellum–R. solani Interaction

The results of DNA amplification from T. asperellum IRAN 3062C using the designed primers showed that the desired fragment (186 bp) of the tex1 peptaibol synthetase gene could be amplified, while it was absent in the tested plant pathogenic fungi (Figure 9). The qRT PCR revealed that the mRNA level of tex1 had been increased in T. asperellum IRAN 3062C in contact with R. solani in comparison to the control (T. asperellum IRAN 3062C alone) (Figure 10).

4. Discussion

Trichoderma species are prolific producers of secondary metabolites including peptaibols, epipolythiodioxopiperazines (ETPs), volatile and nonvolatile terpenes, pyrones, polyketides, and siderophores [12]. A genomic comparison performed between both saprophytic and parasitic species of Trichoderma revealed that the presence of some special compounds may be involved in rhizosphere competence and interactions of Trichoderma with plants [51] or in the killing of other microorganisms, and may also affect the plant–pathogen interactions and mycoparasitism [52].
Peptaibols are dominant secondary metabolites of filamentous fungi, including the ones exhibiting a mycoparasitic lifestyle, especially Trichoderma species [53,54]. They play an important role in the mycoparasitic interactions as well as in induction of induced systemic resistance (ISR) in plants via upregulation of the jasmonic acid and salicylic acid synthesis [30,32]. This study was conducted to survey the changes in the peptaibol production during mycoparasitic interactions.
Even though the BCI values are not able to precisely reflect the antagonistic abilities of a particular strain, using the dual culture confrontation tests in order to get analysable data for comparison of fungal biocontrol isolates is very popular [55]. By this method, the antagonistic potential of each Trichoderma isolate can be evaluated, as the most important mechanisms of antagonism, especially competition for space and nutrients, production of antifungal metabolites and mycoparasitism may all potentially occur on the confrontation plates [39]. Most of the Trichoderma strains involved in this study attacked the examined plant pathogenic fungi and overgrew their mycelia. In other cases, the observation of an inhibition zone between the two fungi indicated the production of certain antifungal metabolites by the Trichoderma isolates. In all the interaction tests, the growth rate of the plant pathogen was reduced in contact with Trichoderma. Strain T. asperellum IRAN 3062C had the highest BCI values against R. solani and A. solani, thus it can be considered as a promising biocontrol agent (BCA) against these plant pathogens. Among the four taxa of Fusarium tested in this study, the highest BCI values were determined for T. asperellum IRAN 3062C against F. graminearum. Regarding the results against the two other taxa, F. culmorum and FOSC, which are both soil-borne plant pathogenic fungi, it seems that T. asperellum had lower BCI values in interaction with soil-borne Fusarium species.
The antibiotic activity of a peptaibol designated as U-21963 from T. viride (later reidentified as T. arundinaceum [56]) against several species of fungi and bacteria was firstly reported in 1966 by Meyer and Reusser [57]. Peptaibols are mostly effective against a range of Gram-positive bacteria and fungal phytopathogens [58]. Previous work on the diversity profiles of peptaibols produced by T. aggressivum and T. pleuroti in interactions with Agaricus bisporus and Pleurotus ostreatus showed that peptaibols potentially inhibit the growth of mushroom mycelia. Furthermore, significant changes could be observed in the peptaibol profile of the Trichoderma strains during the interaction with their respective hosts [59]. In the present study, analysing the effect of crude peptaibol extract on spore germination showed that 200 µg mL−1 of total peptaibol concentration inhibited the spore germination of all tested phytopathogenic fungi. Regarding the role of cAMP-dependent protein kinase polarity and signal transduction in spore germination and formation of germ tube [60], it is necessary to focus on the effect of peptaibols in these processes. A study performed on trichorzin HA V (Ac-Aib-Gly-Ala-Aib-Iva-Gln-Aib-Val-Aib-Gly-Leu-Aib-Pro-Leu-Aib-Iva-Gln-Leuol) and alamethicin (Ac-Aib-Pro-Aib-Ala-Aib-Ala-Gln-Aib-Val-Aib-Gly-Leu-Aib-Pro-Val-Aib-Aib-Glu-Gln- Pheol) revealed that trichorzin HA V elevates cAMP levels and selectively interacts with the calcitonin receptor [61], while alamethicin does not. Since cAMP signaling is necessary for many cellular physiological processes such as spore germination in Schizosaccharomyces pombe [62], as well as growth, germination, mycoparasitism and secondary metabolism in Trichoderma [63], it seems that even a single amino acid difference in a sequence may completely change the biological activity of a peptaibol.
It was shown in another study [46] that the 18-residue peptaibols produced by T. asperellum IRAN 3062C generally belong to the A50 group of trichotoxins [22]. Trichotoxins have a unique general structure with Gly followed by Aib in positions 2 and 3 [53]. Trichotoxins differ from each other in Ala/Aib in positions 9 and 11 (Table 1). This group of peptaibols was firstly isolated in 1984 [64] and distinguished from peptaibols such as alamethicin by the different primary structure. This group of peptaibols shorter than alamethicin has been isolated from different species of Trichoderma in acidic or neutral forms based on the presence of Glu/Gln at the end of the sequence in position 17 [23]. The C-terminal alcohol residue of these groups of peptaibols is valinol. Acidic (TT-A40) and neutral (TT-A50) trichotoxins have different polarization [24]. All the isolated peptaibols detected in this study belong to the neutral trichotoxins. Trichotoxins belong to the sub-family 1 of peptaibols. The high number of Aib residues in the sequence is evidence of α-helical structure [65]. It was noted in the literature that one Gln residue near the middle of the sequence (frequently in position 6 or 7) and another one in the C-terminal play a conducting role in the pore lumen [66]. Another amino acid proposed to be involved in the mechanism of insertion into membrane bilayers is Pro in position 13 [29]. In the present study, Pept-1703-b-2 was the only detected trichotoxin with Gly in position 11 (Table 1). Helix bending, flexibility and insertion are the functions proposed for this residue [29]. However, based on our data the amount of this peptaibol did not show any considerable changes during the interactions, furthermore, it was produced in very small quantities.
Analysis of the MS chromatograms of crude extracts from control and confronted cultures revealed that T. longibrachiatum IRAN 3067C produced 20-residue peptaibols belonging to the longibrachin group from subfamily 1 of peptaibols [46]. These long peptaibols were firstly described by Leclerc et al. [21] from a liquid culture medium of T. longibrachiatum and have a high proportion of Aib, therefore conforming to an α-helical structure [67]. The high mean hydrophobicity of the primary structure gives them the ability to form channels in membrane bilayers [17]. The Glu residue in the C-terminus and the Pro-2 residue in the N-terminus of the peptide helix have the major role in bilayer interface [68]. All the isolated peptaibols from T. longibrachiatum have the amino acid Gly in position 11. This is the same position two steps before the unstable Aib–Pro bond as in Pept-1703-b-2 produced by T. asperellum IRAN 3062C, which also has Gly at this position and is unique among the peptaibols produced by this strain. Out of the 10 identified peptaibols of T. longibrachiatum IRAN 3067C, the 5 longibrachins have the general formula of [Ac-Aib-Ala-Aib-Ala-Aib-(Aib/Ala)-Gln-Aib-Vxx-Aib-Gly-Lxx-Aib-Pro-Vxx-Aib-(Aib/Vxx)-(Gln/Glu)-Gln-Pheol] and they are differing from each other in positions 6, 17 and 18, while Pept-1951-c and -d share the same general structure with an Aib/Vxx exchange in positions 9/10 (Table 1). Pept-1965-c-1, -c-2 and Pept-1966-d follow the same pattern as Pept-1951-c and -d with Ala and Lxx instead of Aib and Vxx in positions 9 and 10, respectively (Table 1). Regarding the Glu or Gln in position 18, acidic or neutral forms of these peptaibols were identified. Neutral longibrachin (LGB) A I-IV (18-Gln) [46] and acidic LGB II and III have been sequenced, and their antimicrobial activities against Acholeplasma, Mycoplasma and Spiroplasma cells as well as their strong membrane-permeabilizing action were described [26]. Trilongins BI–BIV and trilongin AI were also isolated from T. longibrachiatum by Mikkola et al. [48], who proved that there is a synergistic effect between the 11-residue and the 20-residue mitochondriotoxic trilongins of T. longibrachiatum. This opportunistically human pathogenic species has always been popular for its peptaibol production, which resulted in several studies naming the same compounds differently (longibrachins, trilongins or trichobrachins). Other species such as T. aureoviride, T. koningii, T. polysporum, T. viride, T. orientale, T. phellinicola and Gliocladium deliquescens can also produce peptaibols identical to compounds of T. longibrachiatum: trichoaureocins, trichokonins, trichosporins, suzukacillins, hyporientalins, hypophellins and gliodeliquescin A, respectively [49,53].
Since the differences in chemical structures and conformations of the peptaibols determine their variety of biological activities by the formation of pores in bilayer lipid membranes [9], we focused on the changes in the amounts of each peptaibol in the microheterogenous mixture to have a better insight into the correlation between the sequences of the peptaibols and their role in mycoparasitism. A previous work on the diversity profile of peptaibols produced by T. aggressivum and T. pleuroti in interactions with A. bisporus and P. ostreatus showed that the attacked host may also have an influence on the peptaibol profiles of Trichoderma [56]. In the recent study, monitoring the changes in the peptaibol profiles produced by Trichoderma species exposed to a pathogenic fungus in comparison with the unexposed control revealed a few differences in the amounts of some unique peptaibols, however the profiles of sequences within the particular microheterogenous mixtures remained similar in most of the cases. Tata et al. [69] monitored the secondary metabolites during the antagonistic interaction of T. harzianum and Moniliophthora roreri by desorption electrospray ionization mass spectrometry (DESI-MS) imaging, but the study did not focus on peptaibols, as it was assumed based on a previous work that peptaibol production is not pathogen-dependent [70]. In another study, matrix-assisted laser desorption/ionization mass spectrometry (MALDI-MS) has been established for the visualization of secondary metabolites in the mycoparasitic interaction between T. atroviride and R. solani by a thin layer of agar, and some signals related to peptaibols could be detected in the borders of fungal interaction [71]. However, this technique could not separately detect peptaibols with the same molecular weight but different sequences, which are usually present in the microheterogenous mixtures of these molecules.
Peptaibols and peptaibiotics, with their unusual amino acid content, are the products of non-ribosomal biosynthesis, and are assembled by the multienzyme thiotemplate mechanism [12,15]. Peptaibiotic NRPS genes are restricted to mycoparasitic lineages of Hypocreales. These genes are less conserved between species of Tolypocladium, but more conserved within the genus Trichoderma [72]. Since the comparison of the distribution of NRPS genes between saprophytic and parasitic species of Trichoderma supported the relevance of peptaibols in rhizosphere competition and biological control [51], the mRNA level of tex1 was followed in T. asperellum both under control and confrontational conditions, which revealed an increasing expression during the interaction of T. asperellum with R. solani.

5. Conclusions

Several trichotoxins and longibrachins are produced by T. asperellum and T. longibrachiatum, respectively. The results of this study indicate that the total quantity of the detected peptaibol mixtures changes during in vitro confrontation of Trichoderma species with phytopathogenic fungi, which implicates the impact of the host on Trichoderma peptaibol metabolism. Such comparative studies will provide intriguing new insights into the physiology of Trichoderma species during mycoparasitism. It is conceivable that the amount of peptaibols may be involved in the regulation of biological control. The results provided a challenging opportunity to develop a deeper understanding of the underlying processes by which the amounts of peptaibol mixtures change during Trichoderma–plant pathogen interactions.

Author Contributions

Conceptualization, P.R.T., D.Z., C.V. and L.K.; data curation, D.B., T.M. and A.S.; funding acquisition, L.K.; investigation, P.R.T., T.M., D.B. and D.Z.; methodology, P.R.T., T.M. and A.S.; project administration, L.K.; resources, D.Z., A.S., C.V. and L.K.; supervision, D.Z.; validation, T.M., D.B. and A.S.; writing—original draft, P.R.T., T.M. and L.K.; writing—review and editing, T.M., D.Z., C.V., A.S. and L.K. All authors have read and agreed to the published version of the manuscript.

Funding

This research was funded by the Hungarian Government and the European Union within the frames of the Széchenyi 2020 Programme (GINOP-2.3.2-15-2016-00052). L.K. is a grantee of the János Bolyai (Hungarian Academy of Sciences) and Bolyai Plus (New National Excellence Programme, Hungary) research scholarships.

Acknowledgments

The authors wish to acknowledge the Plant Pathology Lab of Bu Ali Sina University of Hamedan-Iran for providing the Trichoderma strains. We also thank Khabat Vahabi for his excellent technical guides.

Conflicts of Interest

The authors declare no conflict of interest.

References

  1. Dawson, C.J.; Hilton, J. Fertiliser availability in a resource-limited world: Production and recycling of nitrogen and phosphorus. Food Policy 2011, 36, S14–S22. [Google Scholar] [CrossRef]
  2. Hermosa, R.; Viterbo, A.; Chet, I.; Monte, E. Plant-beneficial effects of Trichoderma and of its genes. Microbiology 2012, 158, 17–25. [Google Scholar] [CrossRef] [Green Version]
  3. Nawrocka, J.; Małolepsza, U. Diversity in plant systemic resistance induced by Trichoderma. Biol. Control 2013, 67, 149–156. [Google Scholar] [CrossRef]
  4. Bissett, J.; Gams, W.; Jaklitsch, W.; Samuels, G.J. Accepted Trichoderma names in the year 2015. IMA Fungus 2015, 6, 263–295. [Google Scholar] [CrossRef] [Green Version]
  5. Zhang, Y.B.; Zhuang, W.Y. New species of Trichoderma in the Harzianum, Longibrachiatum and Viride clades. Phytotaxa 2018, 379, 131–142. [Google Scholar] [CrossRef]
  6. Zeilinger, S.; Omann, M. Trichoderma biocontrol: Signal transduction pathways involved in host sensing and mycoparasitism. Gene Regul. Syst. Biol. 2007, 1, 227–234. [Google Scholar] [CrossRef] [PubMed] [Green Version]
  7. Reithner, B.; Ibarra-Laclette, E.; Mach, R.L.; Herrera-Estrella, A. Identification of mycoparasitism-related genes in Trichoderma atroviride. Appl. Environ. Microbiol. 2011, 77, 4361–4370. [Google Scholar] [CrossRef] [PubMed] [Green Version]
  8. Harman, G.E.; Howell, C.R.; Viterbo, A.; Chet, I.; Lorito, M. Trichoderma species—Opportunistic, avirulent plant symbionts. Nat. Rev. Microbiol. 2004, 2, 43–56. [Google Scholar] [CrossRef] [PubMed]
  9. Daniel, J.F.S.; Filho, E.S. Peptaibols of Trichoderma. Nat. Prod. Rep. 2007, 24, 1128–1141. [Google Scholar] [CrossRef] [PubMed]
  10. Kullnig, C.; Mach, R.L.; Lorito, M.; Kubicek, C.P. Enzyme diffusion from Trichoderma atroviride (=T. harzianum P1) to Rhizoctonia solani is a prerequisite for triggering of Trichoderma ech42 gene expression before mycoparasitic contact. Appl. Environ. Microbiol. 2000, 66, 2232–2234. [Google Scholar] [CrossRef] [Green Version]
  11. Szekeres, A.; Leitgeb, B.; Kredics, L.; Antal, Z.; Hatvani, L.; Manczinger, L.; Vágvölgyi, C. Peptaibols and related peptaibiotics of Trichoderma. Acta Microbiol. Immunol. Hung. 2005, 52, 137–168. [Google Scholar] [CrossRef] [PubMed]
  12. Zeilinger, S.; Gruber, S.; Bansal, R.; Mukherjee, P. Secondary metabolism in Trichoderma—Chemistry meets genomics. Fungal Biol. Rev. 2016, 30, 74–90. [Google Scholar] [CrossRef]
  13. Bushley, K.E.; Turgeon, B.G. Phylogenomics reveals subfamilies of fungal nonribosomal peptide synthetases and their evolutionary relationships. BMC Evol. Biol. 2010, 10, 26. [Google Scholar] [CrossRef] [PubMed] [Green Version]
  14. Marahiel, M.A.; Stachelhaus, T.; Mootz, H.D. Modular peptide synthetases involved in nonribosomal peptide synthesis. Chem. Rev. 1997, 97, 2651–2674. [Google Scholar] [CrossRef] [PubMed]
  15. Wiest, A.; Grzegorski, D.; Xu, B.-W.; Goulard, C.; Rebuffat, S.; Ebbole, D.J.; Bodo, B.; Kenerley, C. Identification of peptaibols from Trichoderma virens and cloning of a peptaibol synthetase. J. Biol. Chem. 2002, 277, 20862–20868. [Google Scholar] [CrossRef] [PubMed] [Green Version]
  16. Degenkolb, T.; Berg, A.; Gams, W.; Schlegel, B.; Gräfe, U. The occurrence of peptaibols and structurally related peptaibiotics in fungi and their mass spectrometric identification via diagnostic fragment ions. J. Pept. Sci. 2003, 9, 666–678. [Google Scholar] [CrossRef]
  17. El-Hajji, M.E.; Rebuffat, S.; Doan, T.L.; Klein, G.; Satre, M.; Bodo, B. Interaction of trichorzianines A and B with model membranes and with the amoeba Dictyostelium. Biochim. Biophys. Acta 1989, 978, 97–104. [Google Scholar] [CrossRef]
  18. Rebuffat, S.; Goulard, C.; Bodo, B. Antibiotic peptides from Trichoderma harzianum: Harzianins HC, proline-rich 14-residue peptaibols. J. Chem. Soc. Perkin Trans. 1995, 1, 1849–1855. [Google Scholar] [CrossRef]
  19. Shi, M.; Chen, L.; Wang, X.W.; Zhang, T.; Zhao, P.B.; Song, X.Y.; Sun, C.Y.; Chen, X.L.; Zhou, B.C.; Zhang, Y.Z. Antimicrobial peptaibols from Trichoderma pseudokoningii induce programmed cell death in plant fungal pathogens. Microbiology 2012, 158, 166–175. [Google Scholar] [CrossRef] [Green Version]
  20. Rebuffat, S.; Prigent, Y.; Auvin-Guette, C.; Bodo, B. Tricholongins BI and BII, 19-residue peptaibols from Trichoderma longibrachiatum. Solution structure from two-dimensional NMR spectroscopy. Eur. J. Biochem. 1991, 201, 661–674. [Google Scholar] [CrossRef]
  21. Leclerc, G.; Goulard, C.; Prigent, Y.; Bodo, B.; Wróblewski, H.; Rebuffat, S. Sequences and antimycoplasmic properties of longibrachins LGB II and LGB III, two novel 20-residue peptaibols from Trichoderma longibrachiatum. J. Nat. Prod. 2001, 64, 164–170. [Google Scholar] [CrossRef] [PubMed]
  22. Chutrakul, C.; Alcocer, M.; Bailey, K.; Peberdy, J.F. The production and characterization of trichotoxin peptaibols of Trichoderma asperellum. Chem. Biodivers. 2008, 5, 1694–1706. [Google Scholar] [CrossRef] [PubMed]
  23. Brückner, H.; Przybylski, M. Isolation and structural characterization of polypeptide antibiotics of the peptaibol class by high-performance liquid chromatography with field desorption and fast atom bombardment mass spectrometry. J. Chromatogr. A 1984, 296, 263–275. [Google Scholar] [CrossRef]
  24. Jaworski, A.; Brückner, H. Detection of new sequences of peptaibol antibiotics trichotoxins A-40 by on-line liquid chromatography–electrospray ionization mass spectrometry. J. Chromatogr. A 1999, 862, 179–189. [Google Scholar] [CrossRef]
  25. Suwan, S.; Isobe, M.; Kanokmedhakul, S.; Lourit, N.; Kanokmedhakul, K.; Soytong, K.; Koga, K. Elucidation of high micro-heterogeneity of an acidic–neutral trichotoxin mixture from Trichoderma harzianum by electrospray ionization quadrupole time-of-flight mass spectrometry. J. Mass Spectrom. 2000, 35, 1438–1451. [Google Scholar] [CrossRef]
  26. Leclerc, G.; Rebuffat, S.; Goulard, C.; Bodo, B. Directed biosynthesis of peptaibol antibiotics in two Trichoderma strains. J. Antibiot. 1998, 51, 170–177. [Google Scholar] [CrossRef]
  27. Mueller, P.; Rudin, D.O. Action potentials induced in biomolecular lipid membranes. Nature 1968, 217, 713–719. [Google Scholar] [CrossRef]
  28. Castro, T.G.; Micaêlo, N.M. Modelling of peptaibol analogues incorporating nonpolar α,α-dialkyl glycines shows improved α-helical preorganization and spontaneous membrane permeation. J. Phys. Chem. B 2014, 118, 649–658. [Google Scholar] [CrossRef]
  29. Chugh, J.K.; Wallace, B.A. Peptaibols: Models for ion channels. Biochem. Soc. Trans. 2001, 29, 565–570. [Google Scholar] [CrossRef]
  30. Engelberth, J.; Koch, T.; Kuhnemann, F.; Boland, W. Channel-forming peptaibols are potent elicitors of plant secondary metabolism and tendril coiling. Angew. Chem. Int. Ed. Engl. 2000, 39, 1860–1862. [Google Scholar] [CrossRef]
  31. Luo, Y.; Zhang, D.D.; Dong, X.W.; Zhao, P.B.; Chen, L.L.; Song, X.Y.; Wang, X.J.; Chen, X.L.; Shi, M.; Zhang, Y.Z. Antimicrobial peptaibols induce defense responses and systemic resistance in tobacco against tobacco mosaic virus. FEMS Microbiol. Lett. 2010, 313, 120–126. [Google Scholar] [CrossRef] [PubMed] [Green Version]
  32. Viterbo, A.; Wiest, A.; Brotman, Y.; Chet, I.; Kenerley, C. The 18 mer peptaibols from Trichoderma virens elicit plant defence responses. Mol. Plant Pathol. 2007, 8, 737–746. [Google Scholar] [CrossRef] [PubMed]
  33. Schirmböck, M.; Lorito, M.; Wang, Y.L.; Hayes, C.K.; Arisan-Atac, I.; Scala, F.; Harman, G.E.; Kubicek, C.P. Parallel formation and synergism of hydrolytic enzymes and peptaibol antibiotics, molecular mechanisms involved in the antagonistic action of Trichoderma harzianum against phytopathogenic fungi. Appl. Environ. Microbiol. 1994, 60, 4364–4370. [Google Scholar] [CrossRef] [Green Version]
  34. Lorito, M.; Farkas, V.; Rebuffat, S.; Bodo, B.; Kubicek, C.P. Cell wall synthesis is a major target of mycoparasitic antagonism by Trichoderma harzianum. J. Bacteriol. 1996, 178, 6382–6385. [Google Scholar] [CrossRef] [PubMed] [Green Version]
  35. Vinale, F.; Sivasithamparam, K.; Ghisalberti, E.L.; Woo, S.L.; Nigro, M.; Marra, R.; Lombardi, N.; Pascale, A.; Ruocco, M.; Lanzuise, S.; et al. Trichoderma secondary metabolites active on plants and fungal pathogens. Open Mycol. J. 2014, 8, 127–139. [Google Scholar] [CrossRef] [Green Version]
  36. Druzhinina, I.S.; Komoń-Zelazowska, M.; Kredics, L.; Hatvani, L.; Antal, Z.; Belayneh, T.; Kubicek, C.P. Alternative reproductive strategies of Hypocrea orientalis and genetically close but clonal Trichoderma longibrachiatum, both capable of causing invasive mycoses of humans. Microbiology 2008, 154, 3447–3459. [Google Scholar] [CrossRef] [Green Version]
  37. Samuels, G.J.; Ismaiel, A.; Bon, M.C.; De Respinis, S.; Petrini, O. Trichoderma asperellum sensu lato consists of two cryptic species. Mycologia 2010, 102, 944–966. [Google Scholar] [CrossRef]
  38. Solanki, M.K.; Singh, N.; Singh, R.K.; Singh, P.; Srivastava, A.K.; Kumar, S.; Kashyap, P.L.; Arora, D.K. Plant defense activation and management of tomato root rot by a chitin-fortified Trichoderma/Hypocrea formulation. Phytoparasitica 2011, 39, 471–481. [Google Scholar] [CrossRef]
  39. Szekeres, A.; Leitgeb, B.; Kredics, L.; Manczinger, L.; Vágvölgyi, C. A novel, image analysis-based method for the evaluation of in vitro antagonism. J. Microbiol. Meth. 2006, 65, 619–622. [Google Scholar] [CrossRef]
  40. Marik, T.; Várszegi, C.; Kredics, L.; Vágvölgyi, C.; Szekeres, A. Mass spectrometric investigation of alamethicin. Acta Biol. Szeged. 2013, 57, 109–112. [Google Scholar]
  41. Marik, T.; Szekeres, A.; Várszegi, C.; Czifra, D.; Vágvölgyi, C.; Kredics, L. Rapid bioactivity based pre-screening method for the detection of peptaibiotic-producing Trichoderma strains. Acta Biol. Szeged. 2013, 57, 1–7. [Google Scholar]
  42. Marik, T.; Tyagi, C.; Racic, G.; Rakk, D.; Szekeres, A.; Vágvölgyi, C.; Kredics, L. New 19-residue peptaibols from Trichoderma clade Viride. Microorganisms 2018, 6, 85. [Google Scholar] [CrossRef] [PubMed] [Green Version]
  43. Orek, C.O. An optimised cetyltrimethylammonium bromide (CTAB)-based protocol for extracting RNA from young and old cassava leaves. J. Adv. Biol. Biotechnol. 2018, 19, 1–7. [Google Scholar] [CrossRef]
  44. Pfaffl, M.W. A new mathematical model for relative quantification in real-time RT–PCR. Nucleic Acids Res. 2001, 29, e45. [Google Scholar] [CrossRef] [PubMed]
  45. Ruijter, J.M.; Ramakers, C.; Hoogaars, W.M.; Karlen, Y.; Bakker, O.; van den Hoff, M.J.; Moorman, A.F. Amplification efficiency: Linking baseline and bias in the analysis of quantitative PCR data. Nucleic Acids Res. 2009, 37, e45. [Google Scholar] [CrossRef] [Green Version]
  46. Rahimi Tamandegani, P.; Zafari, D.; Marik, T.; Szekeres, A.; Vágvölgyi, C.; Kredics, L. Peptaibol profiles of Iranian Trichoderma isolates. Acta Biol. Hung. 2016, 67, 431–441. [Google Scholar] [CrossRef] [Green Version]
  47. Hatvani, L.; Homa, M.; Chenthamara, K.; Cai, F.; Kocsubé, S.; Atanasova, L.; Mlinaric-Missoni, E.; Manikandan, P.; Revathi, R.; Dóczi, I.; et al. Agricultural systems as potential sources of emerging human mycoses caused by Trichoderma: A successful, common phylotype of Trichoderma longibrachiatum in the frontline. FEMS Microbiol. Lett. 2019, 366, fnz246. [Google Scholar] [CrossRef]
  48. Mikkola, R.; Andersson, M.A.; Kredics, L.; Grigoriev, P.A.; Sundell, N.; Salkinoja-Salonen, M.S. 20-Residue and 11-residue peptaibols from the fungus Trichoderma longibrachiatum are synergistic in forming Na+/K+-permeable channels and adverse action towards mammalian cells. FEBS J. 2012, 279, 4172–4190. [Google Scholar] [CrossRef]
  49. Marik, T.; Tyagi, C.; Balázs, D.; Urbán, P.; Szepesi, Á.; Bakacsy, L.; Endre, G.; Rakk, D.; Szekeres, A.; Andersson, M.A.; et al. Structural diversity and bioactivities of peptaibol compounds from the Longibrachiatum clade of the filamentous fungal genus Trichoderma. Front. Microbiol. 2019, 10, 1434. [Google Scholar] [CrossRef] [Green Version]
  50. Naeimi, S.; Okhovvat, S.M.; Javan-Nikkhah, M.; Vágvölgyi, C.; Khosravi, V.; Kredics, L. Biological control of Rhizoctonia solani AG1-1A, the causal agent of rice sheath blight with Trichoderma strains. Phytopathol. Med. 2010, 49, 287–300. [Google Scholar] [CrossRef]
  51. Kubicek, C.P.; Herrera-Estrella, A.; Seidl-Seiboth, V.; Martinez, D.A.; Druzhinina, I.S.; Thon, M.; Zeilinger, S.; Casas-Flores, S.; Horwitz, B.A.; Mukherjee, P.K.; et al. Comparative genome sequence analysis underscores mycoparasitism as the ancestral life style of Trichoderma. Genome Biol. 2011, 12, R40. [Google Scholar] [CrossRef] [PubMed] [Green Version]
  52. Mukherjee, P.K.; Horwitz, B.A.; Herrera-Estrella, A.; Schmoll, M.; Kenerley, C.M. Trichoderma research in the genome era. Annu. Rev. Phytopathol. 2013, 51, 105–129. [Google Scholar] [CrossRef] [PubMed]
  53. Neumann, N.K.N.; Stoppacher, N.; Zeilinger, S.; Degenkolb, T.; Brückner, H.; Schuhmacher, R. The peptaibiotics database—A comprehensive online resource. Chem. Biodivers. 2015, 12, 743–751. [Google Scholar] [CrossRef] [PubMed]
  54. Degenkolb, T.; Fog Nielsen, K.; Dieckmann, R.; Branco-Rocha, F.; Chaverri, P.; Samuels, G.J.; Thrane, U.; von, D.H.; Vilcinskas, A.; Brückner, H. Peptaibol, secondary-metabolite, and hydrophobin pattern of commercial biocontrol agents formulated with species of the Trichoderma harzianum complex. Chem. Biodivers. 2015, 12, 662–684. [Google Scholar] [CrossRef]
  55. Pakdaman, B.S.; Mohammadi Goltapeh, E.; Mohammad Soltani, B.; Talebi, A.A.; Nadepoor, M.; Kruszewska, J.S.; Piłsyk, S.; Sarrocco, S.; Vannacci, G. Toward the quantification of confrontation (dual culture) test: A case study on the biological control of Pythium aphanidermatum with Trichoderma asperelloides. J. Biofertil. Biopestic. 2013, 4, 1000137. [Google Scholar] [CrossRef] [Green Version]
  56. Degenkolb, T.; Dieckmann, R.; Nielsen, K.F.; Gräfenhan, T.; Theis, C.; Zafari, D.; Chaverri, P.; Ismaiel, A.; Brückner, H.; von Döhren, H.; et al. The Trichoderma brevicompactum clade: A separate lineage with new species, new peptaibiotics, and mycotoxins. Mycol. Progress 2008, 7, 177–219. [Google Scholar] [CrossRef] [Green Version]
  57. Meyer, C.E.; Reusser, F. A polypeptide antibacterial agent isolated from Trichoderma viride. Experientia 1967, 23, 85–86. [Google Scholar] [CrossRef]
  58. Fuji, K.; Fujita, E.; Takaishi, Y.; Fujita, T.; Arita, I.; Komatsu, M.; Hiratsuka, N. New antibiotics, trichopolyns A and B: Isolation and biological activity. Experientia 1978, 34, 237–239. [Google Scholar] [CrossRef]
  59. Marik, T.; Urbán, P.; Tyagi, C.; Szekeres, A.; Leitgeb, B.; Vágvölgyi, M.; Manczinger, L.; Druzhinina, I.S.; Vágvölgyi, C.; Kredics, L. Diversity profile and dynamics of peptaibols produced by green mould Trichoderma species in interactions with their hosts Agaricus bisporus and Pleurotus ostreatus. Chem. Biodivers. 2017, 14, e1700033. [Google Scholar] [CrossRef]
  60. d’Enfert, C. Fungal spore germination: Insights from the molecular genetics of Aspergillus nidulans and Neurospora crassa. Fungal Genet. Biol. 1997, 21, 163–172. [Google Scholar] [CrossRef]
  61. Katayama, T.; Miyagawa, K.; Kodama, T.; Oikawa, S. Trichorzin HA V, a member of the peptaibol family, stimulates intracellular cAMP formation in cells expressing the calcitonin receptor. Biol. Pharm. Bull. 2001, 24, 1420–1422. [Google Scholar] [CrossRef] [PubMed] [Green Version]
  62. Hatanaka, M.; Shimoda, C. The cyclic AMP/PKA signal pathway is required for initiation of spore germination in Schizosaccharomyces pombe. Yeast 2000, 18, 207–217. [Google Scholar] [CrossRef]
  63. Mukherjee, M.; Mukherjee, P.K.; Kale, S.P. cAMP signaling is involved in growth, germination, mycoparasitism and secondary metabolism in Trichoderma virens. Microbiology 2007, 153, 1734–1742. [Google Scholar] [CrossRef] [PubMed] [Green Version]
  64. Przybylski, M.; Dietrich, I.; Manz, I.; Brückner, H. Elucidation of structure microheterogeneity of the polypeptide antibiotics paracelsin and trichotoxin A-50 by fast atom bombardment mass spectrometry in combination with selective in situ hydrolysis. Biomed. Mass Spectrom. 1984, 11, 569–582. [Google Scholar] [CrossRef]
  65. Tyagi, C.; Marik, T.; Szekeres, A.; Vágvölgyi, C.; Kredics, L.; Ötvös, F. Tripleurin XIIc: Peptide folding dynamics in aqueous and hydrophobic environment mimic using accelerated molecular dynamics. Molecules 2019, 24, 358. [Google Scholar] [CrossRef] [PubMed] [Green Version]
  66. Whitmore, L.; Wallace, B.A. Analysis of peptaibol sequence composition: Implications for in vivo synthesis and channel formation. Eur. Biophys. J. 2004, 33, 233–237. [Google Scholar] [CrossRef]
  67. Agarwalla, S.; Mellor, I.R.; Sansom, M.S.; Karle, I.L.; Flippen-Anderson, J.L.; Uma, K.; Krishna, K.; Sukumar, M.; Balaram, P. Zervamicins, a structurally characterised peptide model for membrane ion channels. Biochem. Biophys. Res. Commun. 1992, 186, 8–15. [Google Scholar] [CrossRef]
  68. Cosette, P.; Rebuffat, S.; Bodo, B.; Molle, G. The ion-channel activity of longibrachins LGA I and LGB II: Effects of Pro-2/Ala and Gln-18/Glu substitutions on the alamethicin voltage-gated membrane channels. Biochim. Biophys. Acta 1999, 1461, 113–122. [Google Scholar] [CrossRef] [Green Version]
  69. Tata, A.; Perez, C.; Campos, M.L.; Bayfield, M.A.; Eberlin, M.N.; Ifa, D.R. Imprint desorption electrospray ionization mass spectrometry imaging for monitoring secondary metabolites production during antagonistic interaction of fungi. Anal. Chem. 2015, 87, 12298–12305. [Google Scholar] [CrossRef]
  70. Vinale, F.; Ghisalberti, E.L.; Sivasithamparam, K.; Marra, R.; Ritieni, A.; Ferracane, R.; Woo, S.; Lorito, M. Factors affecting the production of Trichoderma harzianum secondary metabolites during the interaction with different plant pathogens. Lett. Appl. Microbiol. 2009, 48, 705–711. [Google Scholar]
  71. Holzlechner, M.; Reitschmidt, S.; Gruber, S.; Zeilinger, S.; Marchetti-Deschmann, M. Visualizing fungal metabolites during mycoparasitic interaction by MALDI mass spectrometry imaging. Proteomics 2016, 16, 1742–1746. [Google Scholar] [CrossRef] [PubMed] [Green Version]
  72. Quandt, C.A.; Bushley, K.E.; Spatafora, J.W. The genome of the truffle-parasite Tolypocladium ophioglossoides and the evolution of antifungal peptaibiotics. BMC Genomics 2015, 16, 553. [Google Scholar] [CrossRef] [PubMed] [Green Version]
Figure 1. Direct confrontation test between Trichoderma asperellum IRAN 3062C and Alternaria solani SZMC 6241J after (A) 2 days and (B) 7 days on malt extract agar (MEA) medium.
Biomolecules 10 00730 g001
Figure 2. Biological activity assay of crude extracts from Trichoderma species against (A) Micrococcus luteus; 1, 2, 4 and 5: Trichoderma asperellum IRAN 3062C (604.28 µg mL−1), 3 and 6: Trichoderma longibrachiatum IRAN 3067C (230.1 µg mL−1) and (B) Alternaria solani; 1: methanol as control, 2: 10, 3: 50, 4: 100, 5: 200 µg mL−1 of peptaibol extract from T. asperellum IRAN 3062C.
Biomolecules 10 00730 g002
Figure 3. In vitro confrontation experiments between Trichoderma asperellum IRAN 3062C, Trichoderma longibrachiatum IRAN 3067C and plant pathogenic fungi on MEA after 7 days. * FOSC: Fusarium oxysporum species complex.
Biomolecules 10 00730 g003
Figure 4. Biocontrol index (BCI) values of Trichoderma asperellum IRAN 3062C (A) and Trichoderma longibrachiatum IRAN 3067C (B) towards different plant pathogenic fungi. Bars represent standard deviation.
Biomolecules 10 00730 g004
Figure 5. Total amounts of peptaibols produced by Trichoderma asperellum IRAN 3062C (A) and T. longibrachiatum IRAN 3067C (B) in interaction with plant pathogenic fungi (Fusarium moniliforme, F. culmorum, F. graminearum, FOSC, Alternaria solani, Rhizoctonia solani) compared with the control (Trichoderma without plant pathogen) in confrontation tests. Asterisks indicate significant differences, as determined by Student’s t test (p < 0.05) corrected with the Holm–Šidak method.
Biomolecules 10 00730 g005
Figure 6. Total ion chromatogram of peptaibols extracted from (A) Trichoderma asperellum IRAN 3062C and (B) Trichoderma longibrachiatum IRAN 3067C. Kromasil C18; 5 µm, 1.6 × 250 mm; MeOH/H2O (86:14), flow rate 1 mL min−1. Numbers indicate peaks containing peptaibols (see Table 1).
Biomolecules 10 00730 g006
Figure 7. Relative amounts of peptaibols by Trichoderma asperellum IRAN 3062C in interaction with plant pathogenic fungi (Fusarium moniliforme, F. culmorum, F. graminearum, FOSC, Alternaria solani, Rhizoctonia solani) compared with the control (Trichoderma without plant pathogen) in confrontation tests. Asterisks indicate significant differences, as determined by Student’s t test (* p < 0.05) corrected with the Holm–Šidak method.
Biomolecules 10 00730 g007
Figure 8. Relative amounts of peptaibols identified from Trichoderma longibrachiatum IRAN 3067C in interaction with plant pathogens compared with the control (Trichoderma without plant pathogens) in confrontation tests. Asterisks indicate significant differences, as determined by Student’s t test (* p < 0.05) corrected with the Holm–Šidak method.
Biomolecules 10 00730 g008
Figure 9. Amplification of tex1 by PCR from Fusarium moniliforme SZMC 11046 (1), 2. Fusarium culmorum SZMC 6239J (2), Fusarium graminearum SZMC 6236J (3), FOSC SZMC 6237J (4), Alternaria solani SZMC 6241J (5), Rhizoctonia solani SZMC 21048 (6) Trichoderma asperellum IRAN 3062C (7) T. asperellum BS3-8 [50] (8), Trichoderma longibrachiatum IRAN 3067C (9), and H2O as negative control (10). Molecular weight marker: 100 bp ladder (11).
Biomolecules 10 00730 g009
Figure 10. Quantitative RT-PCR analysis of tex1. Values (2−ΔΔCT) correspond to relative measurements against the tex1 transcript in Trichoderma asperellum IRAN 3062C (T) and T. asperellum IRAN 3062C challenged with Rhizoctonia solani (T + R). β-tubulin was used as an internal reference gene. Bars represent standard deviations of the mean values of three biological replicates. Different letters (a and b) indicate significantly different values (p < 0.05).
Biomolecules 10 00730 g010
Table 1. Peptaibol sequences produced by T. asperellum IRAN 3062C and T. longibrachiatum IRAN 3067C [46].
T. asperellum IRAN 3062CPeakMb12y6RR1R2R3R4R5R6R7R8R9R10R11R12R13R14R15R16R17R18
Pept-1705-a-1117051094612AcAibGlyAibLxxAibGlnAibAibAlaSerAibAibProLxxAibAibGlnVxxol
Pept-1689-a-1216891079612AcAibGlyAibLxxAibGlnAibAibAlaAibAlaAibProLxxAibAibGlnVxxol
Pept-1689-a-2216891079612AcAibGlyAibLxxAibGlnAibAibAlaAibAlaAibProLxxAibAibGlnVxxol
Pept-1691-a-1216911081612AcAibGlyAibLxxAibGlnAibAibAlaSerAlaAibProLxxAibAibGlnVxxol
Pept-1705-a-2217051094612AcAibGlyAibLxxAibGlnAibAibAibSerAlaAibProLxxAibAibGlnVxxol
Pept-1719-b-1317191094626AcAibGlyAibLxxAibGlnAibAibAibSerAlaAibProLxxAibVxxGlnVxxol
Pept-1719-a-1317191108612AcAibGlyAibLxxAibGlnAibAibAibSerAibAibProLxxAibAibGlnVxxol
Pept-1705-a-3317051094612AcAibGlyAibLxxAibGlnAibAibAibSerAlaAibProLxxAibAibGlnVxxol
Pept-1703-a-1317031092612AcAibGlyAibLxxAibGlnAibAibAibAibAlaAibProLxxAibAibGlnVxxol
Pept-1749-b-1317491123626AcAibGlyAibLxxAibGlnAibAibAibSerVxxAibProLxxAibVxxGlnVxxol
Trichotoxin T5D2/Pept-1675-a-1416751064612AcAibGlyAibLxxAibGlnAibAibAlaAlaAlaAibProLxxAibAibGlnVxxol
Pept-1719-b-2417191094626AcAibGlyAibLxxAibGlnAibAibAibSerAlaAibProLxxAibVxxGlnVxxol
Pept-1733-b-1417331108626AcAibGlyAibLxxAibGlnAibAibAibSerAibAibProLxxAibVxxGlnVxxol
Trichotoxin A-50 F (T5F)/Pept-1689-b-1416891064626AcAibGlyAibLxxAibGlnAibAibAlaAlaAlaAibProLxxAibVxxGlnVxxol
Trichotoxin A-50 E (T5E)/Pept-1689-a-3416891079612AcAibGlyAibLxxAibGlnAibAibAibAlaAlaAibProLxxAibAibGlnVxxol
Pept-1733-b-2417331108626AcAibGlyAibLxxAibGlnAibAibAibSerAibAibProLxxAibVxxGlnVxxol
Trichotoxin A-50 F (T5F)/Pept-1689-b-2516891064626AcAibGlyAibLxxAibGlnAibAibAlaAlaAlaAibProLxxAibVxxGlnVxxol
Pept-1733-b-3517331108626AcAibGlyAibLxxAibGlnAibAibAibSerAibAibProLxxAibVxxGlnVxxol
Trichotoxin sequence 05/Pept-1703-a-2517031092612AcAibGlyAibLxxAibGlnAibAibAibAlaAibAibProLxxAibAibGlnVxxol
Pept-1703-b-1517031078626AcAibGlyAibLxxAibGlnAibAlaAibAlaAibAibProLxxAibVxxGlnVxxol
Pept-1733-b-4517331108626AcAibGlyAibLxxAibGlnAibAibAibSerAibAibProLxxAibVxxGlnVxxol
Pept-1703-b-2617031078626AcAibGlyAibGlnAibGlnAibAibAibGlyAlaAibProLxxAibVxxGlnVxxol
Pept-1747-b-1617471122626AcAibGlyAibGlnAibGlnAibAibAibAibAibAibProLxxAibVxxGlnVxxol
Pept-1703-b-3617031078626AcAibGlyAibLxxAibGlnAibAlaAibAlaAibAibProLxxAibVxxGlnVxxol
Pept-1733-b-5617331108626AcAibGlyAibLxxAibGlnAibAibAibSerAibAibProLxxAibVxxGlnVxxol
Trichotoxin A-50 I (T5I)/Pept-1717-b-1617171092626AcAibGlyAibLxxAibGlnAibAibAibAlaAibAibProLxxAibVxxGlnVxxol
Pept-1731-b-1717311106626AcAibAlaAibLxxAibGlnAibAibAibAlaAibAibProLxxAibVxxGlnVxxol
Trichotoxin A-50J (T5J)/Pept-1731-b-2817311106626AcAibGlyAibLxxAibGlnAibAibAibAibAibAibProLxxAibVxxGlnVxxol
General structure ---AcAibAibAibGlnAib🟄AibProLxxAibGlnVxxol
T. longibrachiatum IRAN 3067CPeakMb13y7RR1R2R3R4R5R6R7R8R9R10R11R12R13R14R15R16R17R18R19R20
Longibrachin A II/Trilongin B II/Pept-1951-d119511974789AcAibAlaAibAlaAibAlaGlnAibVxxAibGlyLxxAibProVxxAibVxxGluGlnPheol
Longibrachin A I/Trilongin B I/Pept-1936-a119361959774AcAibAlaAibAlaAibAlaGlnAibVxxAibGlyLxxAibProVxxAibAibGlnGlnPheol
Longibrachin B II/Trilongin C I/Pept-1938-b119381961775AcAibAlaAibAlaAibAlaGlnAibVxxAibGlyLxxAibProVxxAibAibGluGlnPheol
Pept-1951-c119511974788AcAibAlaAibAlaAibAlaGlnAibAibVxxGlyLxxAibProVxxAibVxxGlnGlnPheol
Pept-1952-d119521975789AcAibAlaAibAlaAibAlaGlnAibAibVxxGlyLxxAibProVxxAibVxxGluGlnPheol
Longibrachin A III/Pept-1951-a219511974774AcAibAlaAibAlaAibAibGlnAibVxxAibGlyLxxAibProVxxAibAibGlnGlnPheol
Longibrachin B III/Trilongin C III/Pept-1951-b219511974775AcAibAlaAibAlaAibAibGlnAibVxxAibGlyLxxAibProVxxAibAibGluGlnPheol
Pept-1965-c-1319651988788AcAibAlaAibAlaAibAibGlnAibAlaLxxGlyLxxAibProVxxAibVxxGlnGlnPheol
Pept-1966-d319661988789AcAibAlaAibAlaAibAibGlnAibAlaLxxGlyLxxAibProVxxAibVxxGluGlnPheol
Pept-1965-c-2419651988788AcAibAlaAibAlaAibAibGlnAibAlaLxxGlyLxxAibProVxxAibVxxGlnGlnPheol
General structure ---AcAibAlaAibAlaAibGlnAib🟎GlyLxxAibProVxxAibGlnPheol
●: Lxx/Gln; ■: Aib/Ala; ▲: Vxx/Aib; ▼: Gln/Glu; ◆: Vxxol/Lxxol; ⬟: Aib/Ala/Vxx; 🟎: Aib/Vxx/Lxx; 🟄: Ser/Aib/Ala/Gly.

