Differential Effects of Empagliflozin on Microvascular Complications in Murine Models of Type 1 and Type 2 Diabetes

 , , , , ,
  and
and 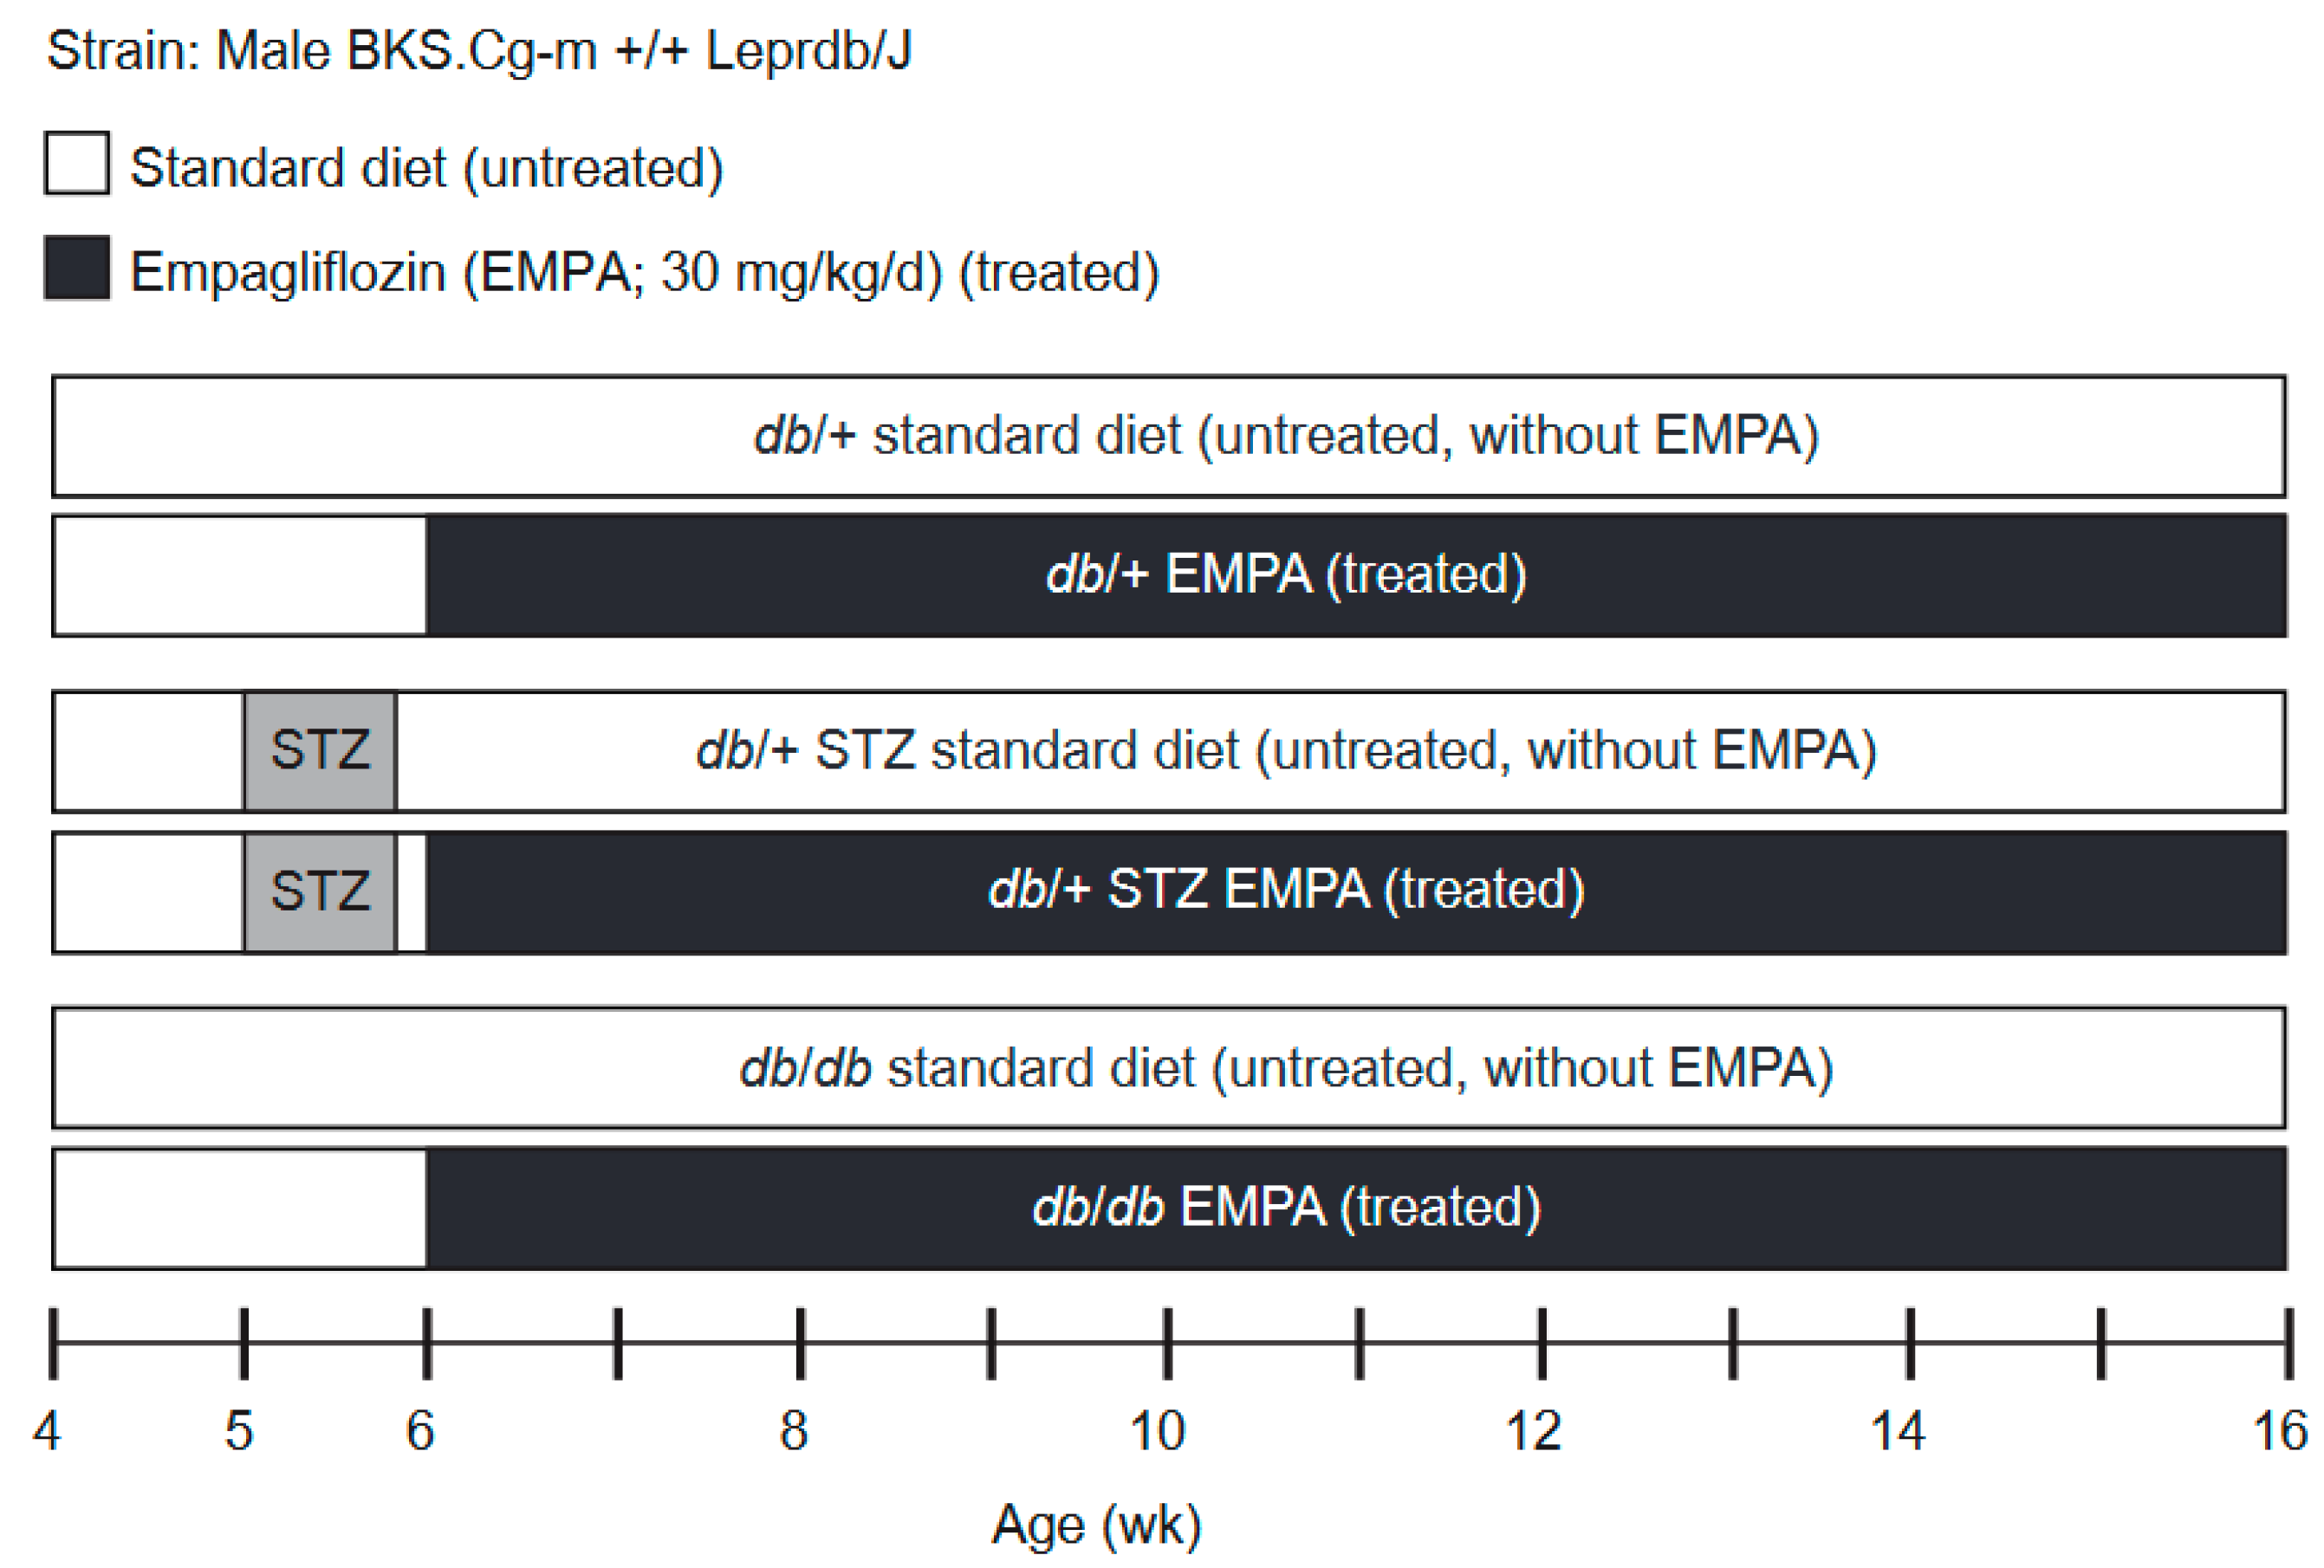
Abstract
:Simple Summary
Abstract
1. Introduction
2. Materials and Methods
2.1. Animals
2.2. Model Choice Metabolic Phenotyping
2.3. Study Scheme and T1D and T2D Models
2.4. Metabolic Phenotyping
2.5. DPN Phenotyping
2.6. DR Phenotyping
2.7. DKD Phenotyping
2.8. Nitrotyrosine and Dityrosine Levels
2.9. Data Analysis and Statistical Analysis
3. Results
3.1. Model Choice: db/+ Mice on HFD Are Prone to Metabolic Impairment
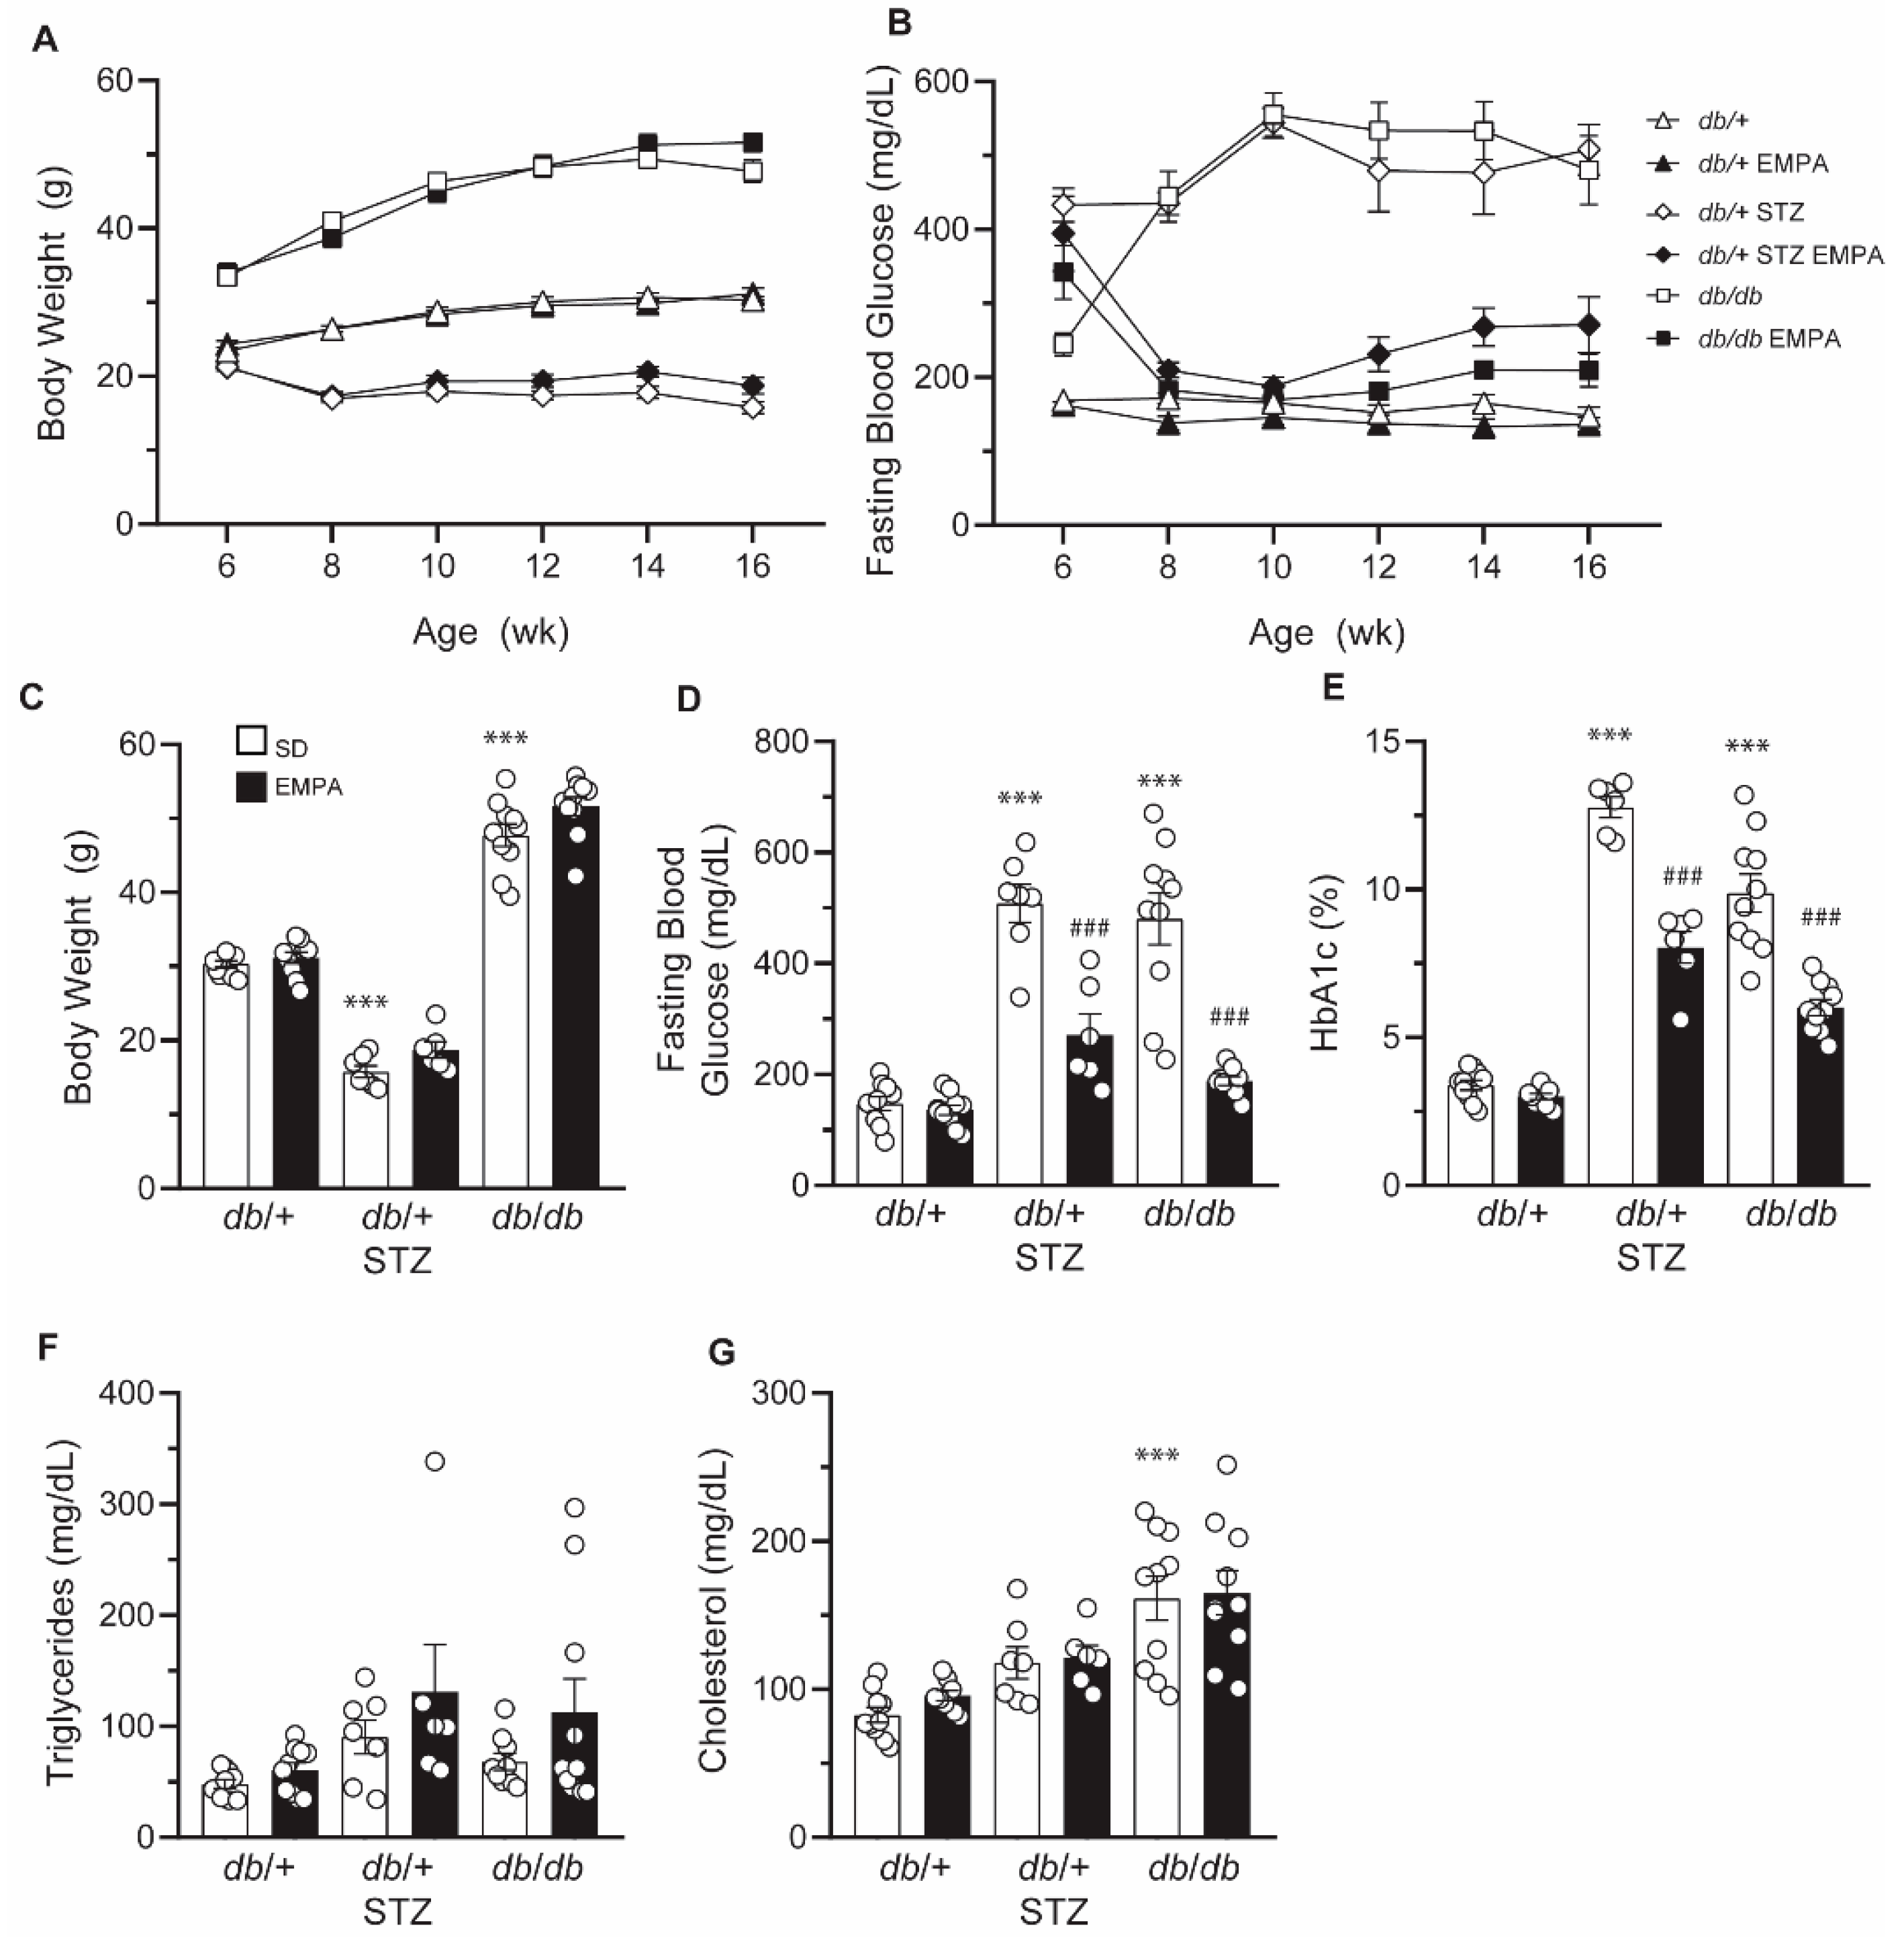
3.2. EMPA Improves Glycemic Control in T1D and T2D Mouse Models
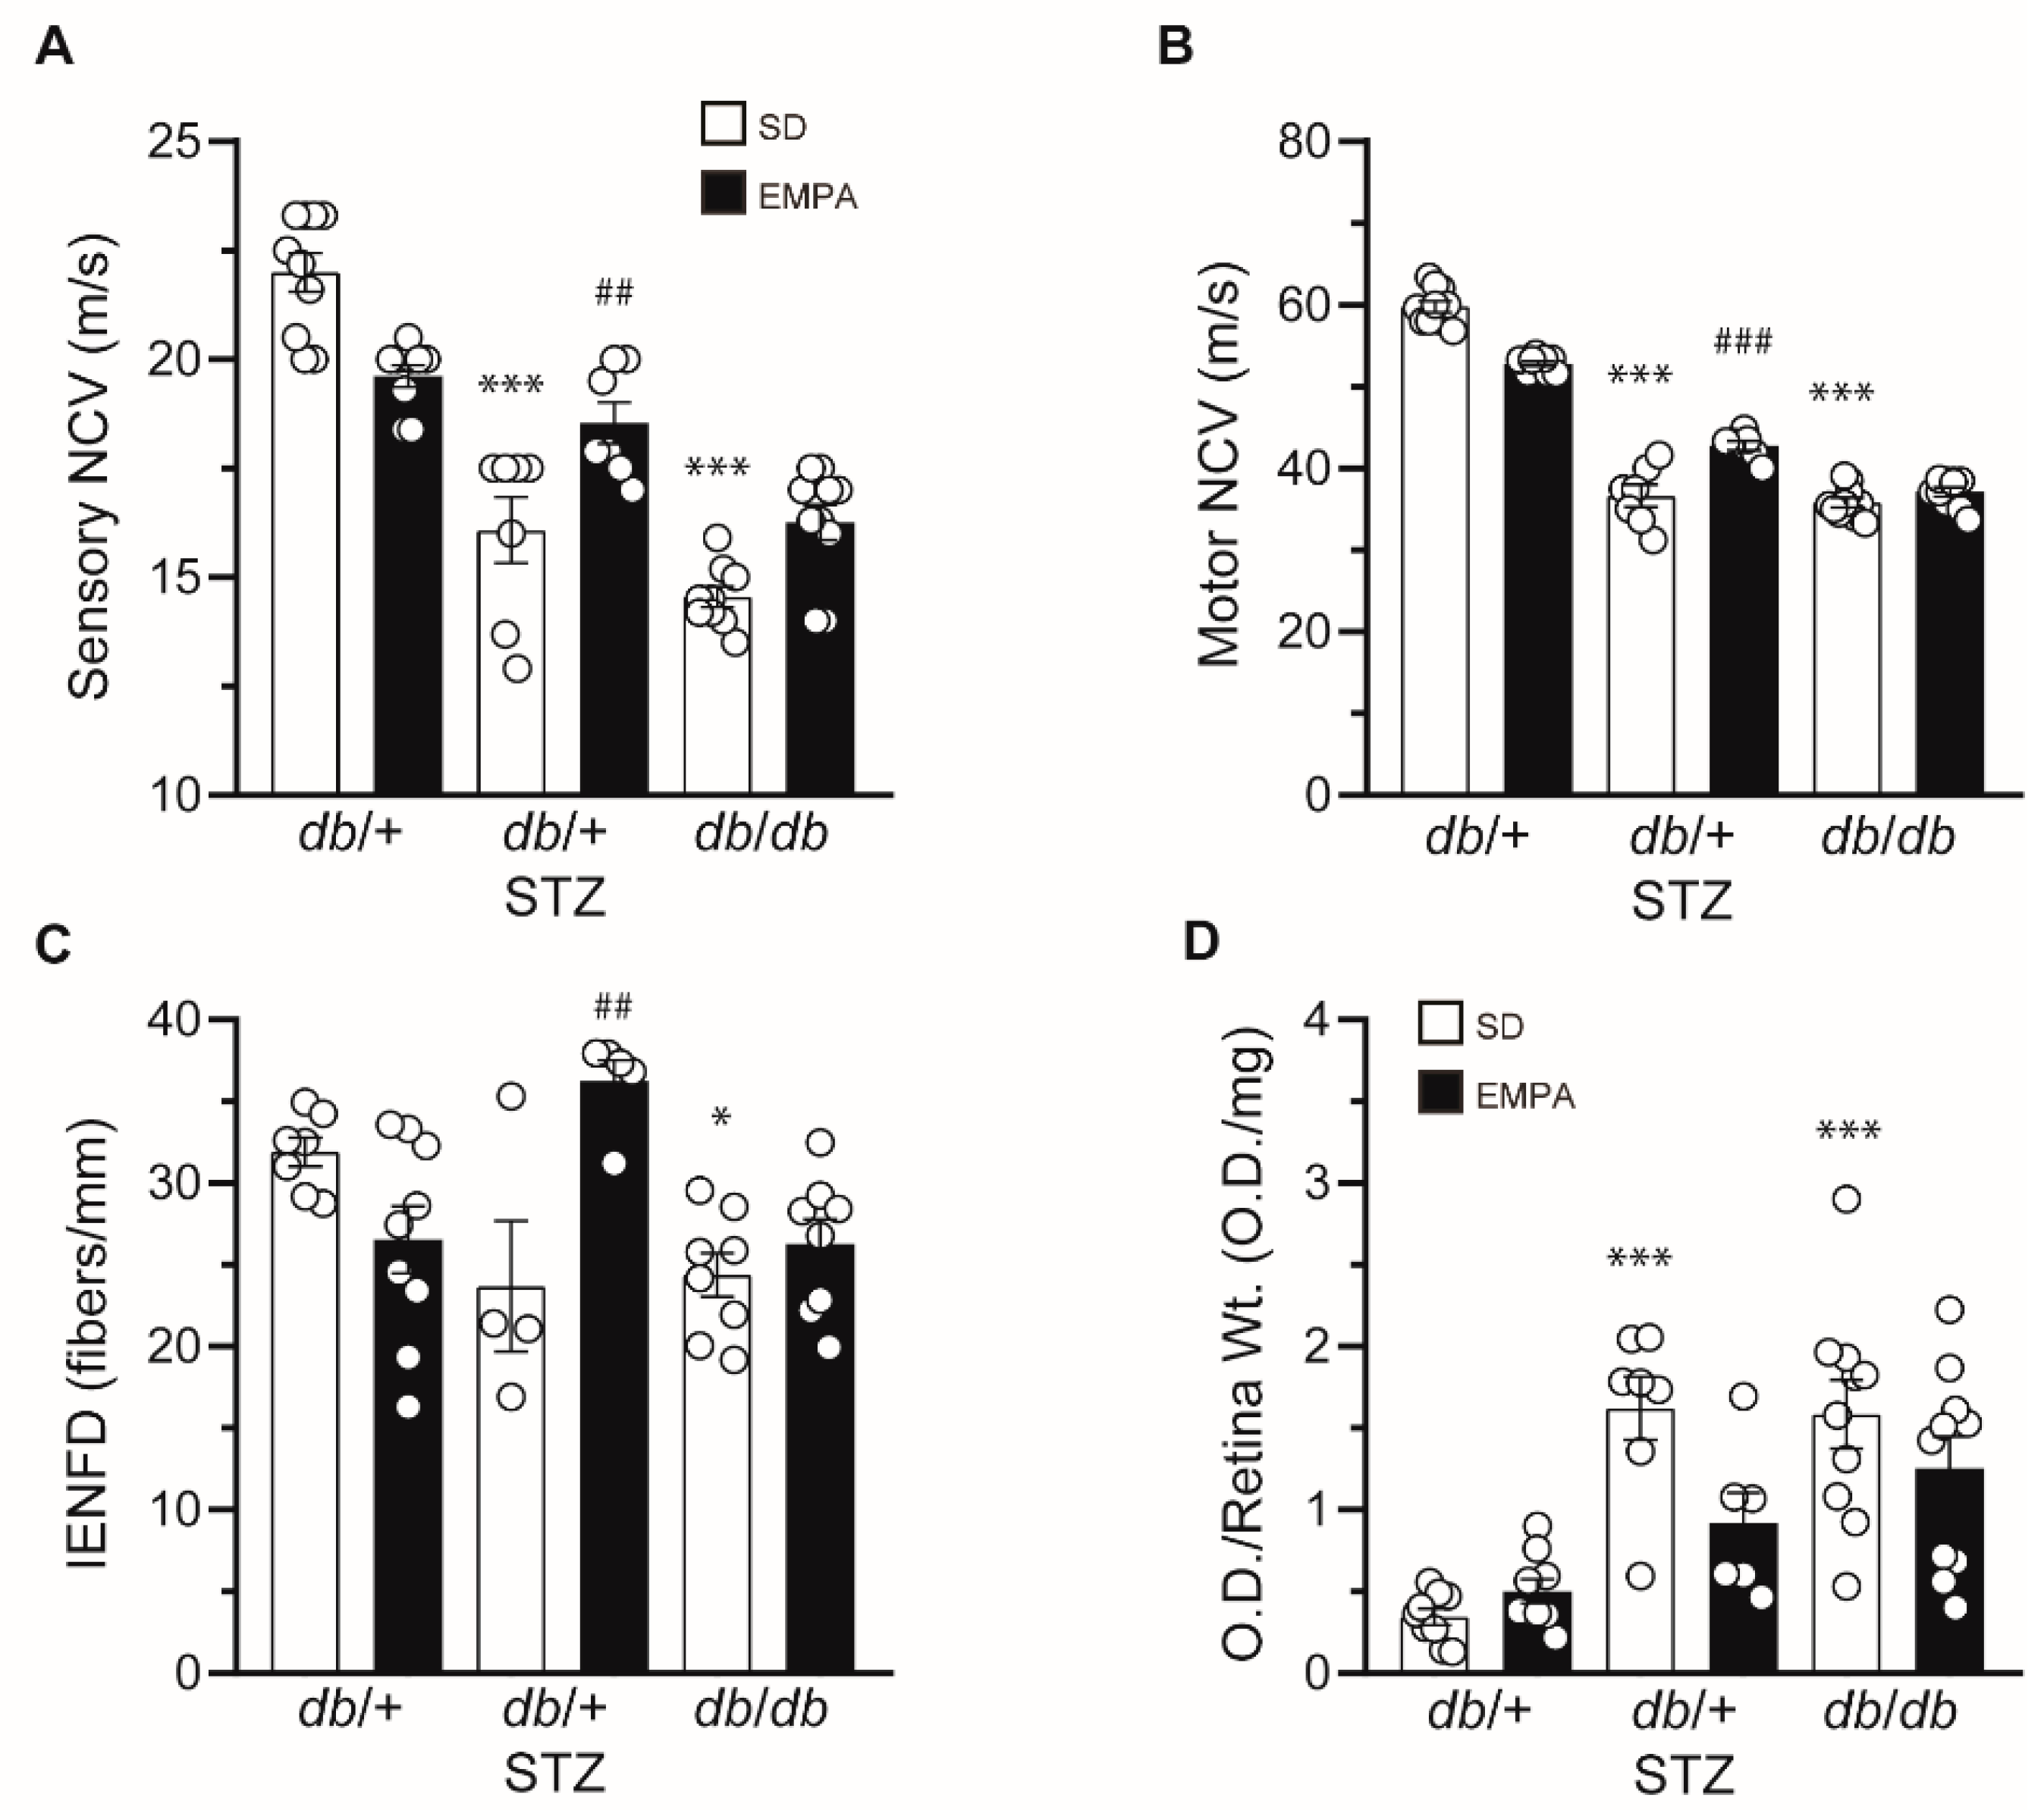
3.3. EMPA Ameliorates DPN and DR in T1D but Not T2D Mouse Models
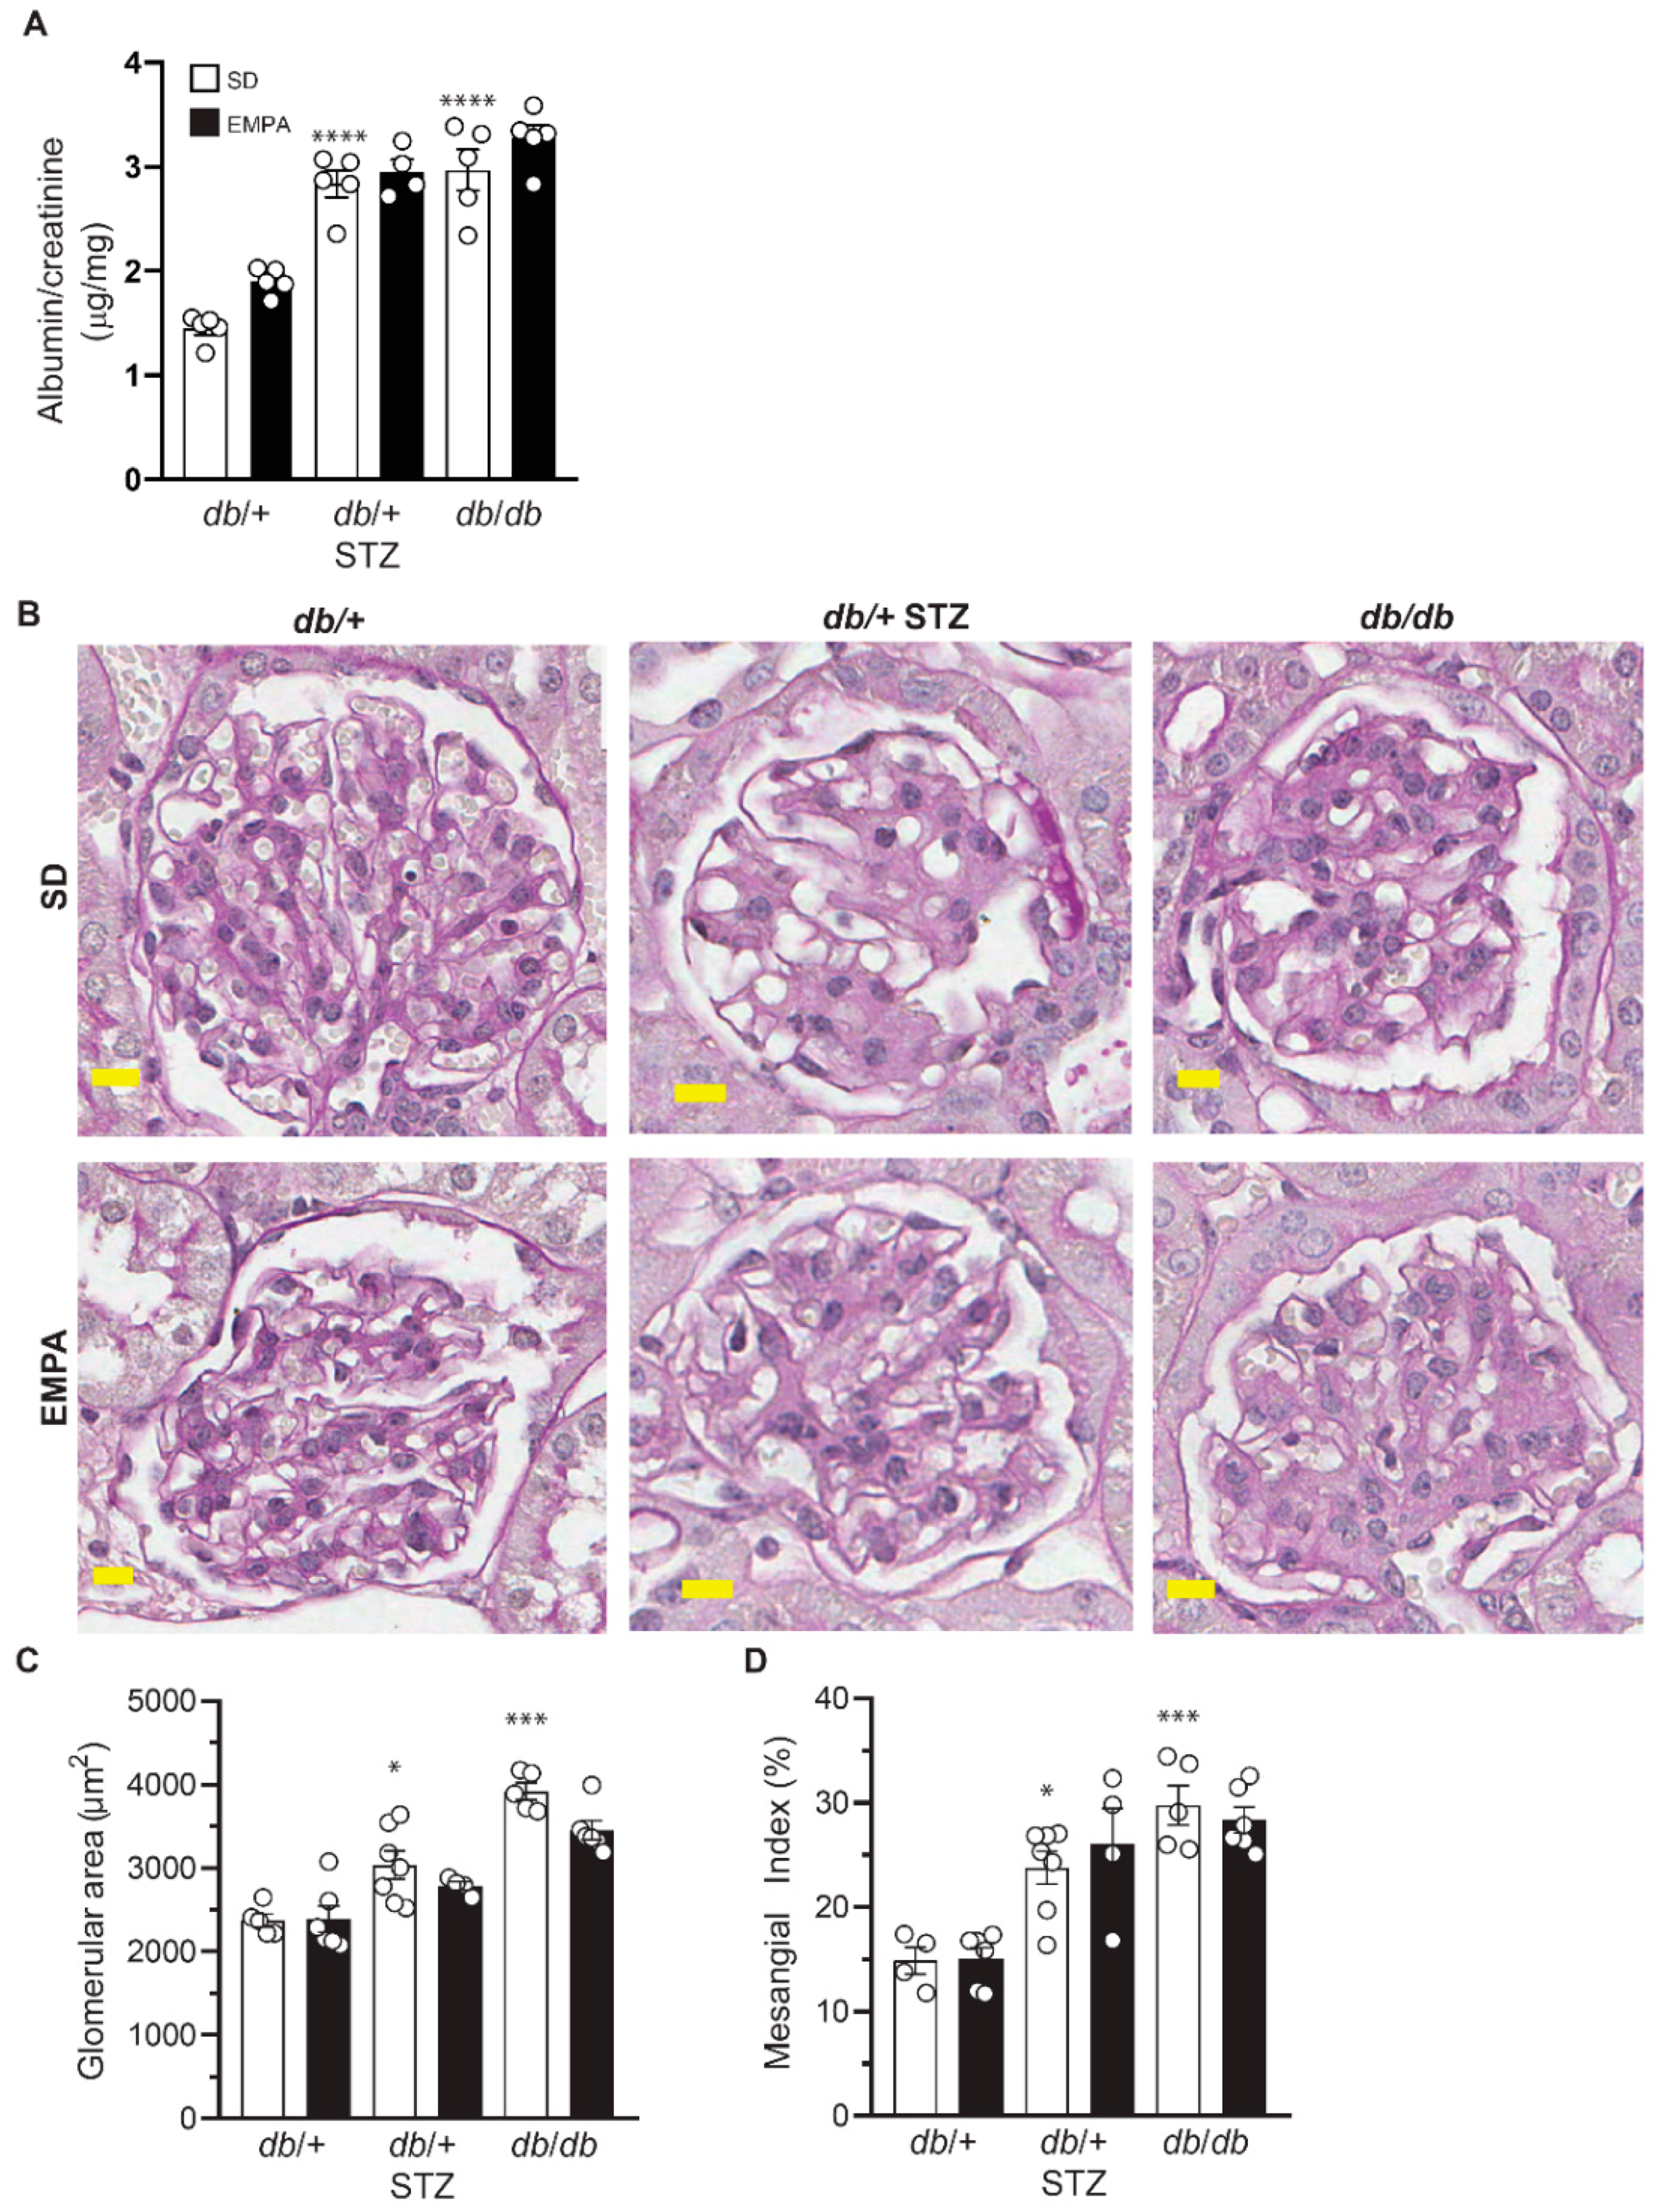
3.4. EMPA Does Not Improve DKD in T1D and T2D Mouse Models
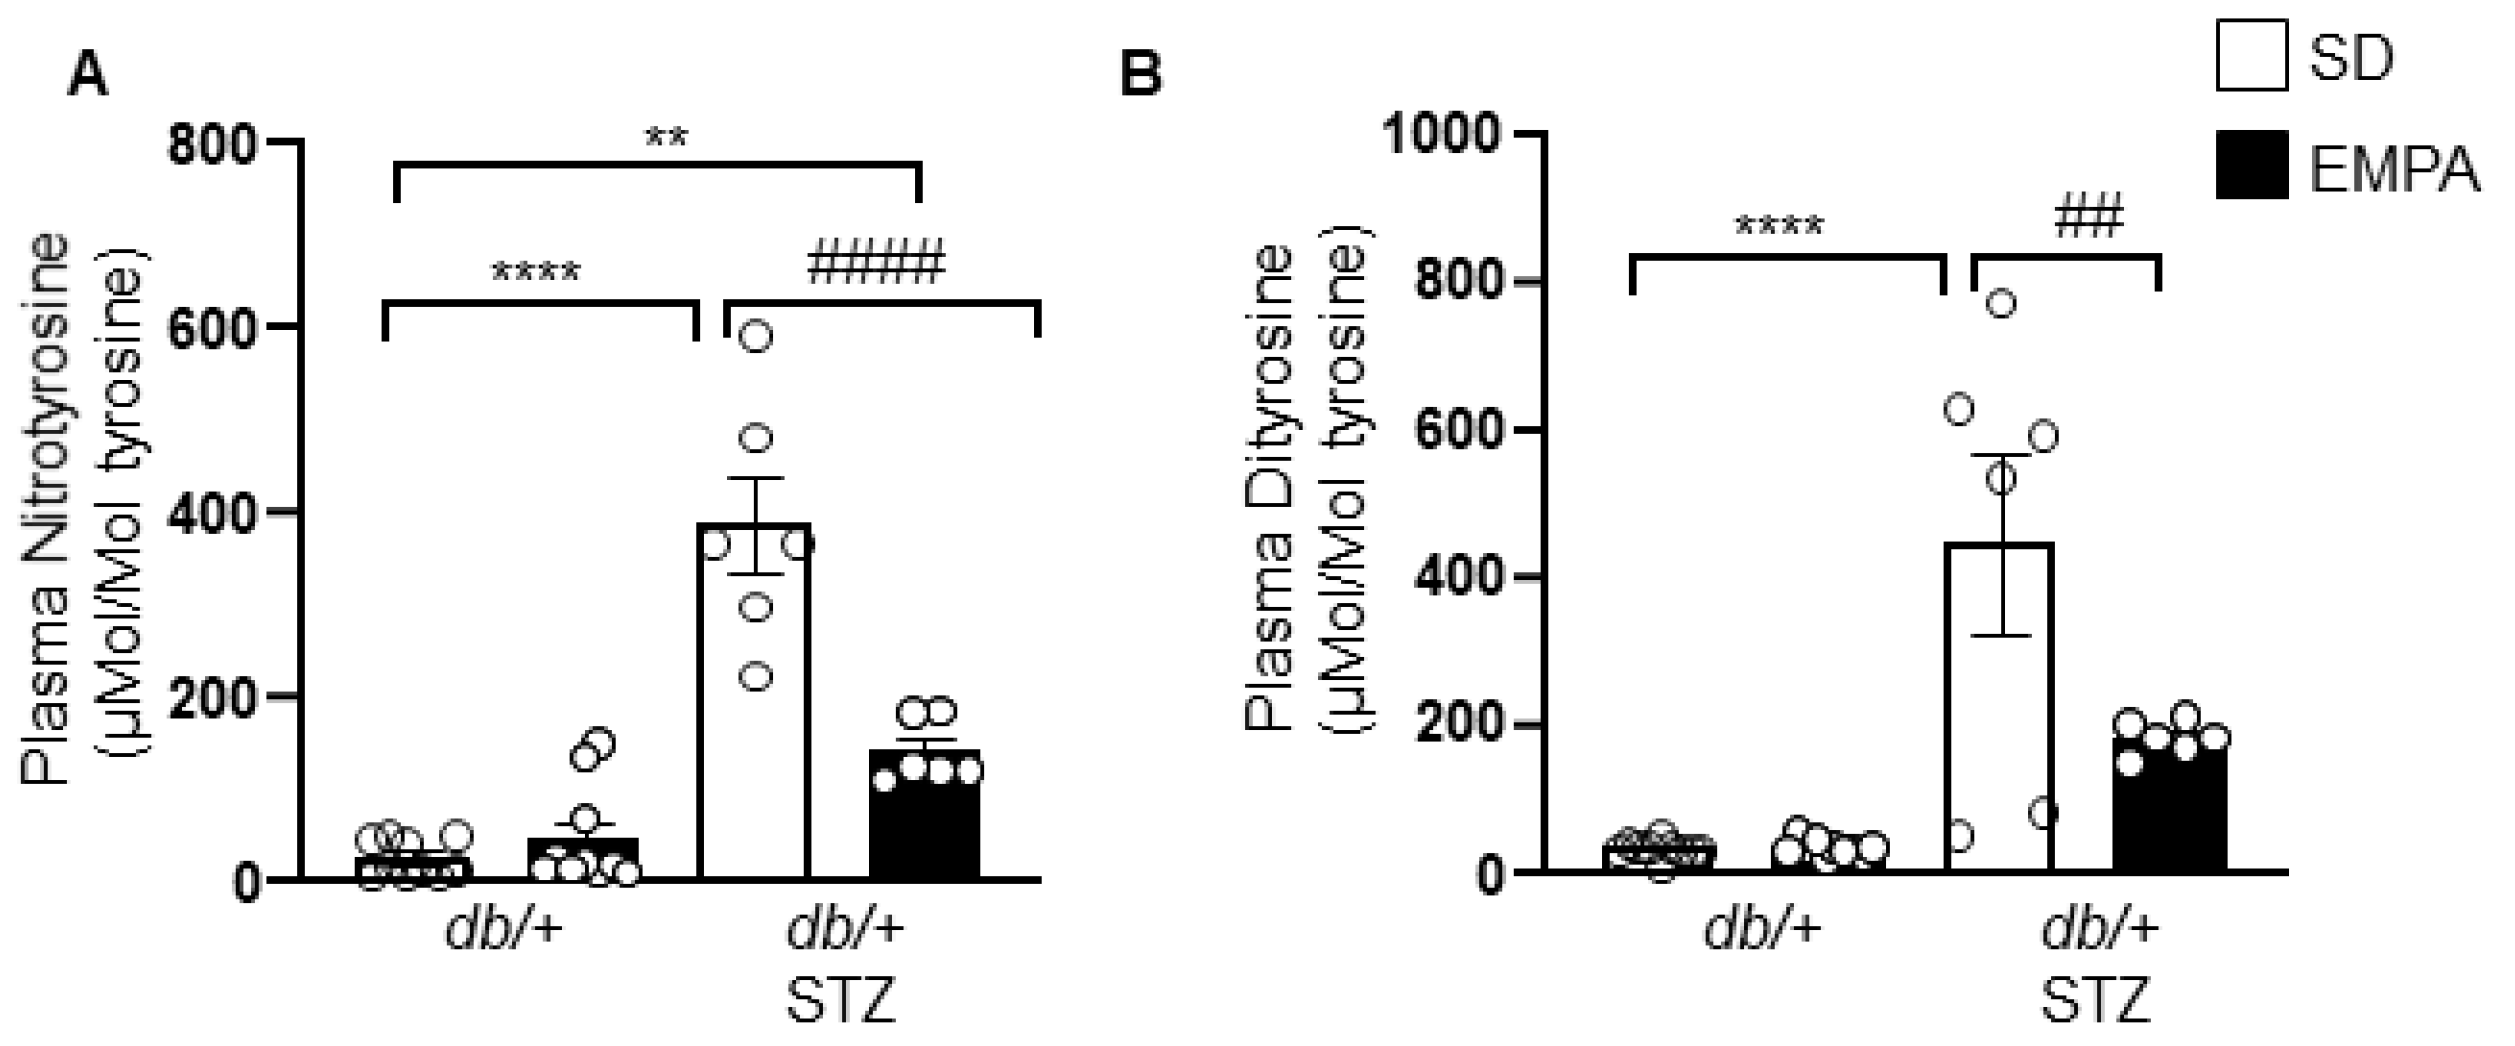
3.5. EMPA Lowers Systemic Oxidative Stress in T1D Mouse Models
4. Discussion
5. Conclusions
Supplementary Materials
Author Contributions
Funding
Acknowledgments
Conflicts of Interest
References
- Saeedi, P.; Petersohn, I.; Salpea, P.; Malanda, B.; Karuranga, S.; Unwin, N.; Colagiuri, S.; Guariguata, L.; Motala, A.A.; Ogurtsova, K.; et al. Global and regional diabetes prevalence estimates for 2019 and projections for 2030 and 2045: Results from the International Diabetes Federation Diabetes Atlas, 9(th) edition. Diabetes Res. Clin. Pract. 2019, 157, 107843. [Google Scholar] [CrossRef] [Green Version]
- Feldman, E.L.; Callaghan, B.C.; Pop-Busui, R.; Zochodne, D.W.; Wright, D.E.; Bennett, D.L.; Bril, V.; Russell, J.W.; Viswanathan, V. Diabetic neuropathy. Nat. Rev. Dis. Primers 2019, 5, 41. [Google Scholar] [CrossRef] [PubMed]
- Ting, D.S.; Cheung, G.C.; Wong, T.Y. Diabetic retinopathy: Global prevalence, major risk factors, screening practices and public health challenges: A review. Clin. Exp. Ophthalmol. 2016, 44, 260–277. [Google Scholar] [CrossRef] [PubMed] [Green Version]
- Winocour, P.H. Diabetes and chronic kidney disease: An increasingly common multi-morbid disease in need of a paradigm shift in care. Diabet. Med. 2018, 35, 300–305. [Google Scholar] [CrossRef] [PubMed]
- Frampton, J.E. Empagliflozin: A Review in Type 2 Diabetes. Drugs 2018, 78, 1037–1048. [Google Scholar] [CrossRef]
- Zelniker, T.A.; Wiviott, S.D.; Raz, I.; Im, K.; Goodrich, E.L.; Bonaca, M.P.; Mosenzon, O.; Kato, E.T.; Cahn, A.; Furtado, R.H.M.; et al. SGLT2 inhibitors for primary and secondary prevention of cardiovascular and renal outcomes in type 2 diabetes: A systematic review and meta-analysis of cardiovascular outcome trials. Lancet 2019, 393, 31–39. [Google Scholar] [CrossRef]
- Gembardt, F.; Bartaun, C.; Jarzebska, N.; Mayoux, E.; Todorov, V.T.; Hohenstein, B.; Hugo, C. The SGLT2 inhibitor empagliflozin ameliorates early features of diabetic nephropathy in BTBR ob/ob type 2 diabetic mice with and without hypertension. Am. J. Physiol. Ren. Physiol. 2014, 307, F317–F325. [Google Scholar] [CrossRef] [Green Version]
- Vallon, V.; Gerasimova, M.; Rose, M.A.; Masuda, T.; Satriano, J.; Mayoux, E.; Koepsell, H.; Thomson, S.C.; Rieg, T. SGLT2 inhibitor empagliflozin reduces renal growth and albuminuria in proportion to hyperglycemia and prevents glomerular hyperfiltration in diabetic Akita mice. Am. J. Physiol. Ren. Physiol. 2014, 306, F194–F204. [Google Scholar] [CrossRef] [Green Version]
- Gallo, L.A.; Ward, M.S.; Fotheringham, A.K.; Zhuang, A.; Borg, D.J.; Flemming, N.B.; Harvie, B.M.; Kinneally, T.L.; Yeh, S.M.; McCarthy, D.A.; et al. Once daily administration of the SGLT2 inhibitor, empagliflozin, attenuates markers of renal fibrosis without improving albuminuria in diabetic db/db mice. Sci. Rep. 2016, 6, 26428. [Google Scholar] [CrossRef]
- Aroor, A.R.; Das, N.A.; Carpenter, A.J.; Habibi, J.; Jia, G.; Ramirez-Perez, F.I.; Martinez-Lemus, L.; Manrique-Acevedo, C.M.; Hayden, M.R.; Duta, C.; et al. Glycemic control by the SGLT2 inhibitor empagliflozin decreases aortic stiffness, renal resistivity index and kidney injury. Cardiovasc. Diabetol. 2018, 17, 108. [Google Scholar] [CrossRef]
- Tahara, A.; Takasu, T.; Yokono, M.; Imamura, M.; Kurosaki, E. Characterization and comparison of SGLT2 inhibitors: Part 3. Effects on diabetic complications in type 2 diabetic mice. Eur. J. Pharmacol. 2017, 809, 163–171. [Google Scholar] [CrossRef]
- Ojima, A.; Matsui, T.; Nishino, Y.; Nakamura, N.; Yamagishi, S. Empagliflozin, an Inhibitor of Sodium-Glucose Cotransporter 2 Exerts Anti-Inflammatory and Antifibrotic Effects on Experimental Diabetic Nephropathy Partly by Suppressing AGEs-Receptor Axis. Horm. Metab. Res. 2015, 47, 686–692. [Google Scholar] [CrossRef] [PubMed] [Green Version]
- Jigheh, Z.A.; Haghjo, A.G.; Argani, H.; Roshangar, L.; Rashtchizadeh, N.; Sanajou, D.; Ahmad, S.N.S.; Rashedi, J.; Dastmalchi, S.; Abbasi, M.M. Empagliflozin alleviates renal inflammation and oxidative stress in streptozotocin-induced diabetic rats partly by repressing HMGB1-TLR4 receptor axis. Iran. J. Basic Med. Sci. 2019, 22, 384–390. [Google Scholar] [CrossRef]
- Wanner, C.; Inzucchi, S.E.; Lachin, J.M.; Fitchett, D.; von Eynatten, M.; Mattheus, M.; Johansen, O.E.; Woerle, H.J.; Broedl, U.C.; Zinman, B. Empagliflozin and Progression of Kidney Disease in Type 2 Diabetes. N. Engl. J. Med. 2016, 375, 323–334. [Google Scholar] [CrossRef] [PubMed]
- Perkovic, V.; Jardine, M.J.; Neal, B.; Bompoint, S.; Heerspink, H.J.L.; Charytan, D.M.; Edwards, R.; Agarwal, R.; Bakris, G.; Bull, S.; et al. Canagliflozin and Renal Outcomes in Type 2 Diabetes and Nephropathy. N. Engl. J. Med. 2019, 380, 2295–2306. [Google Scholar] [CrossRef] [PubMed] [Green Version]
- Inzucchi, S.E.; Wanner, C.; Hehnke, U.; Zwiener, I.; Kaspers, S.; Clark, D.; George, J.T.; Zinman, B. Retinopathy Outcomes with Empagliflozin Versus Placebo in the EMPA-REG OUTCOME Trial. Diabetes Care 2019, 42, e53–e55. [Google Scholar] [CrossRef] [Green Version]
- Lee, K.A.; Jin, H.Y.; Lee, N.Y.; Kim, Y.J.; Park, T.S. Effect of Empagliflozin, a Selective Sodium-Glucose Cotransporter 2 Inhibitor, on Kidney and Peripheral Nerves in Streptozotocin-Induced Diabetic Rats. Diabetes Metab. J. 2018, 42, 338–342. [Google Scholar] [CrossRef] [PubMed]
- O’Brien, P.D.; Sakowski, S.A.; Feldman, E.L. Mouse models of diabetic neuropathy. ILAR J. 2014, 54, 259–272. [Google Scholar] [CrossRef]
- Polsky, S.; Ellis, S.L. Obesity, insulin resistance, and type 1 diabetes mellitus. Curr. Opin. Endocrinol. Diabetes Obes. 2015, 22, 277–282. [Google Scholar] [CrossRef]
- Leiter, E.H. Selecting the “right” mouse model for metabolic syndrome and type 2 diabetes research. Methods Mol. Biol. 2009, 560, 1–17. [Google Scholar] [CrossRef]
- McGovern, T.J. Jardiance® (Empagliflozin); Center for Drug Evaluation and Research: Silver Spring, MD, USA, 2013. [Google Scholar]
- Hinder, L.M.; Sas, K.M.; O’Brien, P.D.; Backus, C.; Kayampilly, P.; Hayes, J.M.; Lin, C.M.; Zhang, H.; Shanmugam, S.; Rumora, A.E.; et al. Mitochondrial uncoupling has no effect on microvascular complications in type 2 diabetes. Sci. Rep. 2019, 9, 881. [Google Scholar] [CrossRef] [PubMed]
- Abcouwer, S.F.; Lin, C.M.; Wolpert, E.B.; Shanmugam, S.; Schaefer, E.W.; Freeman, W.M.; Barber, A.J.; Antonetti, D.A. Effects of ischemic preconditioning and bevacizumab on apoptosis and vascular permeability following retinal ischemia-reperfusion injury. Investig. Ophthalmol. Vis. Sci. 2010, 51, 5920–5933. [Google Scholar] [CrossRef] [PubMed]
- Sas, K.M.; Nair, V.; Byun, J.; Kayampilly, P.; Zhang, H.; Saha, J.; Brosius, F.C., III; Kretzler, M.; Pennathur, S. Targeted Lipidomic and Transcriptomic Analysis Identifies Dysregulated Renal Ceramide Metabolism in a Mouse Model of Diabetic Kidney Disease. J. Proteom. Bioinform. 2015, Suppl. 14. [Google Scholar] [CrossRef] [Green Version]
- Vivekanandan-Giri, A.; Byun, J.; Pennathur, S. Quantitative analysis of amino Acid oxidation markers by tandem mass spectrometry. Methods Enzymol. 2011, 491, 73–89. [Google Scholar] [CrossRef] [PubMed] [Green Version]
- Festing, M.F.; Altman, D.G. Guidelines for the design and statistical analysis of experiments using laboratory animals. ILAR J. 2002, 43, 244–258. [Google Scholar] [CrossRef] [PubMed]
- King, A.J.F. The use of animal models in diabetes research. Br. J. Pharmacol. 2012, 166, 877–894. [Google Scholar] [CrossRef] [PubMed] [Green Version]
- Yamashita, H.; Shao, J.; Qiao, L.; Pagliassotti, M.; Friedman, J.E. Effect of spontaneous gestational diabetes on fetal and postnatal hepatic insulin resistance in Lepr(db/+) mice. Pediatric Res. 2003, 53, 411–418. [Google Scholar] [CrossRef] [Green Version]
- Nadif, R.; Dilworth, M.R.; Sibley, C.P.; Baker, P.N.; Davidge, S.T.; Gibson, J.M.; Aplin, J.D.; Westwood, M. The maternal environment programs postnatal weight gain and glucose tolerance of male offspring, but placental and fetal growth are determined by fetal genotype in the Leprdb/+ model of gestational diabetes. Endocrinology 2015, 156, 360–366. [Google Scholar] [CrossRef] [Green Version]
- Kahkoska, A.R.; Nguyen, C.T.; Jiang, X.; Adair, L.A.; Agarwal, S.; Aiello, A.E.; Burger, K.S.; Buse, J.B.; Dabelea, D.; Dolan, L.M.; et al. Characterizing the weight-glycemia phenotypes of type 1 diabetes in youth and young adulthood. BMJ Open Diabetes Res. Care 2020, 8. [Google Scholar] [CrossRef] [Green Version]
- Eid, S.; Sas, K.M.; Abcouwer, S.F.; Feldman, E.L.; Gardner, T.W.; Pennathur, S.; Fort, P.E. New insights into the mechanisms of diabetic complications: Role of lipids and lipid metabolism. Diabetologia 2019, 62, 1539–1549. [Google Scholar] [CrossRef] [Green Version]
- Feldman, E.L.; Nave, K.A.; Jensen, T.S.; Bennett, D.L.H. New Horizons in Diabetic Neuropathy: Mechanisms, Bioenergetics, and Pain. Neuron 2017, 93, 1296–1313. [Google Scholar] [CrossRef] [PubMed] [Green Version]
- Li, C.; Zhang, J.; Xue, M.; Li, X.; Han, F.; Liu, X.; Xu, L.; Lu, Y.; Cheng, Y.; Li, T.; et al. SGLT2 inhibition with empagliflozin attenuates myocardial oxidative stress and fibrosis in diabetic mice heart. Cardiovasc. Diabetol. 2019, 18, 15. [Google Scholar] [CrossRef] [PubMed]
- Steven, S.; Oelze, M.; Hanf, A.; Kroller-Schon, S.; Kashani, F.; Roohani, S.; Welschof, P.; Kopp, M.; Godtel-Armbrust, U.; Xia, N.; et al. The SGLT2 inhibitor empagliflozin improves the primary diabetic complications in ZDF rats. Redox Biol. 2017, 13, 370–385. [Google Scholar] [CrossRef]
- Cherney, D.Z.; Perkins, B.A.; Soleymanlou, N.; Har, R.; Fagan, N.; Johansen, O.E.; Woerle, H.J.; von Eynatten, M.; Broedl, U.C. The effect of empagliflozin on arterial stiffness and heart rate variability in subjects with uncomplicated type 1 diabetes mellitus. Cardiovasc. Diabetol. 2014, 13, 28. [Google Scholar] [CrossRef] [Green Version]
- Cherney, D.Z.; Perkins, B.A.; Soleymanlou, N.; Maione, M.; Lai, V.; Lee, A.; Fagan, N.M.; Woerle, H.J.; Johansen, O.E.; Broedl, U.C.; et al. Renal hemodynamic effect of sodium-glucose cotransporter 2 inhibition in patients with type 1 diabetes mellitus. Circulation 2014, 129, 587–597. [Google Scholar] [CrossRef] [Green Version]
- Kern, M.; Klöting, N.; Mark, M.; Mayoux, E.; Klein, T.; Blüher, M. The SGLT2 inhibitor empagliflozin improves insulin sensitivity in db/db mice both as monotherapy and in combination with linagliptin. Metab. Clin. Exp. 2016, 65, 114–123. [Google Scholar] [CrossRef]
- Hinder, L.M.; Vincent, A.M.; Hayes, J.M.; McLean, L.L.; Feldman, E.L. Apolipoprotein E knockout as the basis for mouse models of dyslipidemia-induced neuropathy. Exp. Neurol. 2013, 239, 102–110. [Google Scholar] [CrossRef] [PubMed] [Green Version]
- Oppi, S.; Luscher, T.F.; Stein, S. Mouse Models for Atherosclerosis Research-Which Is My Line? Front. Cardiovasc. Med. 2019, 6, 46. [Google Scholar] [CrossRef] [PubMed] [Green Version]
- Storgaard, H.; Gluud, L.L.; Bennett, C.; Grøndahl, M.F.; Christensen, M.B.; Knop, F.K.; Vilsbøll, T. Benefits and Harms of Sodium-Glucose Co-Transporter 2 Inhibitors in Patients with Type 2 Diabetes: A Systematic Review and Meta-Analysis. PLoS ONE 2016, 11, e0166125. [Google Scholar] [CrossRef]
- Rosenblit, P.D. Common medications used by patients with type 2 diabetes mellitus: What are their effects on the lipid profile? Cardiovasc. Diabetol. 2016, 15, 95. [Google Scholar] [CrossRef] [Green Version]
- Halimi, S.; Verges, B. Adverse effects and safety of SGLT-2 inhibitors. Diabetes Metab. 2014, 40, S28–S34. [Google Scholar] [CrossRef]
- Hodgin, J.B.; Nair, V.; Zhang, H.; Randolph, A.; Harris, R.C.; Nelson, R.G.; Weil, E.J.; Cavalcoli, J.D.; Patel, J.M.; Brosius, F.C., III; et al. Identification of cross-species shared transcriptional networks of diabetic nephropathy in human and mouse glomeruli. Diabetes 2013, 62, 299–308. [Google Scholar] [CrossRef] [PubMed] [Green Version]
- Kluger, A.Y.; Tecson, K.M.; Lee, A.Y.; Lerma, E.V.; Rangaswami, J.; Lepor, N.E.; Cobble, M.E.; McCullough, P.A. Class effects of SGLT2 inhibitors on cardiorenal outcomes. Cardiovasc. Diabetol. 2019, 18, 99. [Google Scholar] [CrossRef] [PubMed] [Green Version]
- Callaghan, B.C.; Little, A.A.; Feldman, E.L.; Hughes, R.A. Enhanced glucose control for preventing and treating diabetic neuropathy. Cochrane Database Syst. Rev. 2012. [Google Scholar] [CrossRef]
- Callaghan, B.C.; Hur, J.; Feldman, E.L. Diabetic neuropathy: One disease or two? Curr. Opin. Neurol. 2012, 25, 536–541. [Google Scholar] [CrossRef] [PubMed]
- Hur, J.; Dauch, J.R.; Hinder, L.M.; Hayes, J.M.; Backus, C.; Pennathur, S.; Kretzler, M.; Brosius, F.C., III; Feldman, E.L. The Metabolic Syndrome and Microvascular Complications in a Murine Model of Type 2 Diabetes. Diabetes 2015, 64, 3294–3304. [Google Scholar] [CrossRef] [Green Version]
- Callaghan, B.C.; Xia, R.; Reynolds, E.; Banerjee, M.; Rothberg, A.E.; Burant, C.F.; Villegas-Umana, E.; Pop-Busui, R.; Feldman, E.L. Association Between Metabolic Syndrome Components and Polyneuropathy in an Obese Population. JAMA Neurol. 2016, 73, 1468–1476. [Google Scholar] [CrossRef] [Green Version]
- Callaghan, B.C.; Gao, L.; Li, Y.; Zhou, X.; Reynolds, E.; Banerjee, M.; Pop-Busui, R.; Feldman, E.L.; Ji, L. Diabetes and obesity are the main metabolic drivers of peripheral neuropathy. Ann. Clin. Transl. Neurol. 2018, 5, 397–405. [Google Scholar] [CrossRef]
- Famulla, S.; Pieber, T.R.; Eilbracht, J.; Neubacher, D.; Soleymanlou, N.; Woerle, H.J.; Broedl, U.C.; Kaspers, S. Glucose Exposure and Variability with Empagliflozin as Adjunct to Insulin in Patients with Type 1 Diabetes: Continuous Glucose Monitoring Data from a 4-Week, Randomized, Placebo-Controlled Trial (EASE-1). Diabetes Technol. Ther. 2017, 19, 49–60. [Google Scholar] [CrossRef] [PubMed]


Publisher’s Note: MDPI stays neutral with regard to jurisdictional claims in published maps and institutional affiliations. |
© 2020 by the authors. Licensee MDPI, Basel, Switzerland. This article is an open access article distributed under the terms and conditions of the Creative Commons Attribution (CC BY) license (http://creativecommons.org/licenses/by/4.0/).
Share and Cite
Eid, S.A.; O’Brien, P.D.; Hinder, L.M.; Hayes, J.M.; Mendelson, F.E.; Zhang, H.; Zeng, L.; Kretzler, K.; Narayanan, S.; Abcouwer, S.F.; et al. Differential Effects of Empagliflozin on Microvascular Complications in Murine Models of Type 1 and Type 2 Diabetes. Biology 2020, 9, 347. https://doi.org/10.3390/biology9110347
Eid SA, O’Brien PD, Hinder LM, Hayes JM, Mendelson FE, Zhang H, Zeng L, Kretzler K, Narayanan S, Abcouwer SF, et al. Differential Effects of Empagliflozin on Microvascular Complications in Murine Models of Type 1 and Type 2 Diabetes. Biology. 2020; 9(11):347. https://doi.org/10.3390/biology9110347
Chicago/Turabian StyleEid, Stephanie A., Phillipe D. O’Brien, Lucy M. Hinder, John M. Hayes, Faye E. Mendelson, Hongyu Zhang, Lixia Zeng, Katharina Kretzler, Samanthi Narayanan, Steven F. Abcouwer, and et al. 2020. "Differential Effects of Empagliflozin on Microvascular Complications in Murine Models of Type 1 and Type 2 Diabetes" Biology 9, no. 11: 347. https://doi.org/10.3390/biology9110347