Article

Current Genetic Structure Analysis of Leopard Cats Reveals a Weak Disparity Trend in Subpopulations in Beijing, China

1
College of Biological Sciences and Technology, Beijing Forestry University, Beijing 100083, China
2
Institute of Zoology, Chinese Academy of Sciences, Beijing 100084, China
3
Ecological Environment Management Center of Pearl Spring Township, Beijing 102107, China
4
Management Office of Yunmengshan Nature Reserve, Beijing 101513, China
*
Author to whom correspondence should be addressed.
Biology 2022, 11(10), 1478; https://doi.org/10.3390/biology11101478
Submission received: 2 August 2022 / Revised: 2 October 2022 / Accepted: 5 October 2022 / Published: 9 October 2022

Abstract

:

Simple Summary

Habitat fragmentation is an important factor leading to the decline in the leopard cat population in Beijing. Habitat loss may further result in population shrinkage, which increases the risk of inbreeding and genetic decline. To reveal the segregation effects of highway construction and infrastructure expansion on population genetic variation, this study analyzed the genetic structure of leopard cats in five nature reserves in the mountain surroundings of Beijing. The results showed that a mild disparity trend exists in Baihuashan and Songshan subpopulations, due to habitat segregation and dispersal difficulties. We suggest that the genetic structures of the leopard cat population be monitored every 5 years to detect any changes. If needed, individuals can be artificially exchanged among different subpopulations to maintain the viability of this wild cat in Beijing.

Abstract

In the face of habitat shrinkage and segregation, the survival of wild cats looks bleak. Interpreting their population genetic structure during habitat fragmentation is critical in planning effective management strategies. To reveal the segregation effects of road construction and human settlements on the population genetic structure, we analyzed non-invasive fecal DNA samples from leopard cats (Prionailurus bengalensis) from five nature reserves in mountainous areas around Beijing. We focused on microsatellite markers. A total of 112 individual leopard cats were identified among 601 samples of scat, and moderate population genetic diversity was detected. Microsatellite-marker-based genetic differentiation (Fst) and gene flow (Nm) showed a weak trend toward discrepancies in the Baihuashan and Songshan subpopulations, which indicated habitat fragmentation effects on individual dispersal. Because the segregated subpopulations may suffer a high risk of genetic diversity loss, we suggest that their genetic structure be monitored with more molecular markers to detect any changes, and that female individuals be artificially introduced as needed to maintain the viability of the leopard cat subpopulations in Beijing.

1. Introduction

Variation in population genetic structure can influence the interactions between a species and its environment, and populations with higher genetic diversity are more adaptable to risks brought by changing environments [1]. Moreover, genetic diversity may reflect species’ evolutionary potential, and it can supply important information about their current status and conservation strategies to be implemented [2]. When habitat fragmentation occurs, wild animals are threatened by population isolation and genetic loss that may increase the risk of extinction among segregated populations [3]. Thus, analyses of genetic structure are becoming an important part of effective conservation [4]. Studies on genetic variation may identify subpopulations’ differentiations, which would help create different management units to maintain the long-term survival of local populations [5,6].
Although small in number, wild feline species are important predators with various body types, diverse dietary habits, and great adaptability to the surrounding environment. These species play key roles in the natural ecosystem [7,8]. As a result of severe disturbance due to human activity, suitable habitats for wild cats are gradually being lost, and their prey are also decreasing, which further threatens their survival [9]. Most feline species are secretive and highly vigilant, which makes them very difficult targets for field research and conservation [10,11]. With the rapid development of non-invasive sampling among wild animals, fecal samples are becoming informative objects in research on wild cats [12,13]. Sex ratio determination, individual identification, and relatedness analysis enable the accurate evaluation of population genetic diversity and contribute much to the conservation of wild cats [14,15].
The leopard cat (Prionailurus bengalensis) is a small wild cat native to and widely distributed in East Asia, South Asia, and Southeast Asia [16]. This small cat appears almost everywhere in China, except at high altitudes in the Tibetan plateau and in the severe dry lands of the northwest [17]. Although it is assessed as Least Concern for China in the International Union for Conservation of Nature (IUCN) Red List of Threatened Species [18], the leopard cat population is decreasing as a result of habitat loss and illegal hunting [19]. It is listed in the second category of the CITES Appendices to strengthen protection [20]. Moreover, subspecies of the leopard cat are classified differently in the IUCN Red List; for example, P. b. rabori is considered Vulnerable [21] and P. b. iriomotensis as Critically Endangered [22]. The leopard cat in China is classified as Vulnerable [23].
Most genetic studies of the leopard cat are from East Asia. The populations living on the islands of Japan have been classified into two subspecies: P. b. euptilurus and P. b. iriomotensis [24,25]. A study on their population genetic structure revealed low levels of DRB allelic variation in MHC class II genes among subpopulations from the islands of Tsushima and Iriomote in Japan [26], which are in line with findings of decreased genetic diversity, based on the DNA of the mitochondrial control region [27].
Studies of leopard cats from Korea using microsatellite markers showed that this species had lower genetic diversity than 12 other feline species in the world [28] and other mammalian species in Korea [29]. However, there has been little research of this kind on species in China. One study found five management units for leopard cat populations, based on genetic diversity and phylogenetic analysis using RAPD and variation in mitochondrial DNA [30]. Another study using the mitochondrial DNA of Cyt B and the control region sequence analyzed genetic diversity among populations from five geographic areas and detected independent trends in evolution between northern and southern branches in China [31].
It was estimated that there were 1500 leopard cats in the Beijing region in the first national wildlife survey from 1995 to 2000 (Report on resources survey on the terrestrial wild animals in Beijing, unpublished data, 2012). However, few studies focused on leopard cats, except studies on food components by scat residue identification [32,33], camera trapping monitoring, and activity pattern analysis in nature reserves [34,35,36,37]. The only genetic study on mammals in Beijing was on the Chinese goral (Naemorhedus griseus), from the Songshan national nature reserve, which detected moderate population genetic diversity [38]. There is a lack of research on the baseline genetic information for the conservation of mammalian species in Beijing. Thus, we aimed to (1) clarify the genetic background of the leopard cat in Beijing through non-invasive fecal sampling and (2) detect genetic differentiation among the subpopulations due to the segregation effects of infrastructure development and the expansion of human settlements. Given the high dispersal ability of the leopard cat and the fact that the influences of infrastructure development have only been at play for several decades, we assumed that there would be no genetic discrepancy among the subpopulations sampled.

2. Materials and Methods

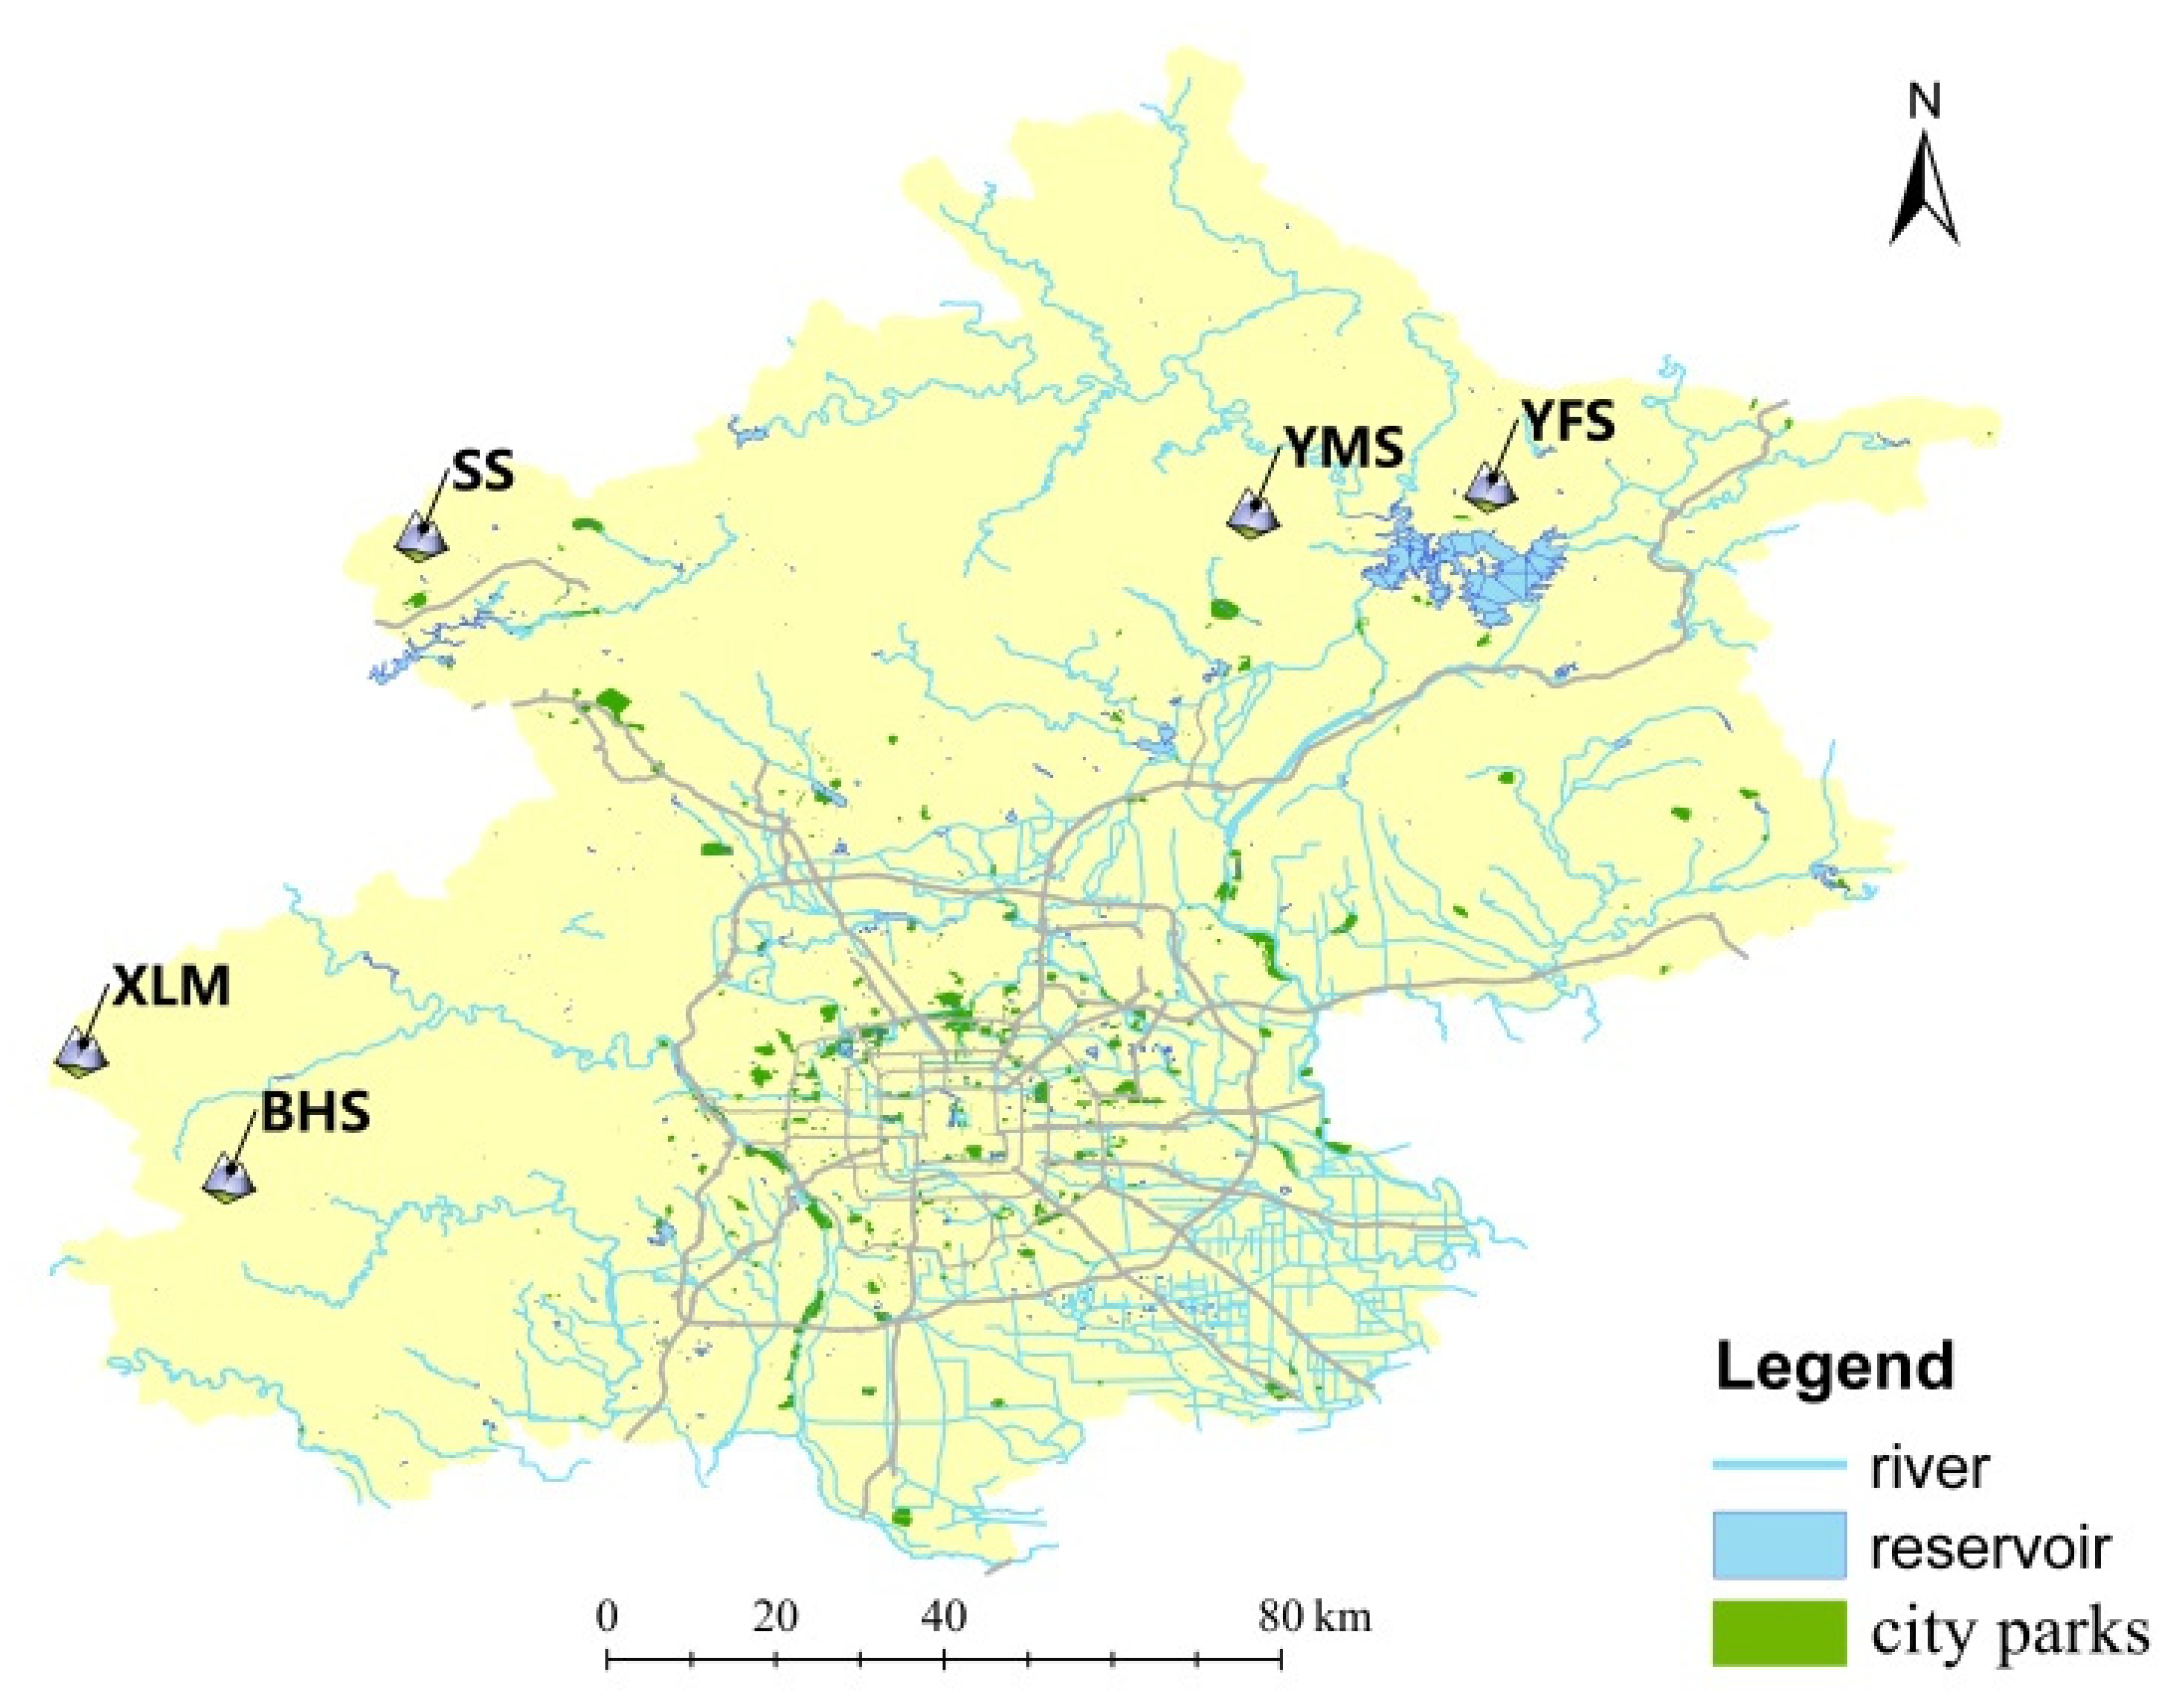
2.1. Sampling Procedure and DNA Extraction

We used the non-invasive analytical method and did not violate animal ethics issues. From September 2017 to October 2018, we collected 601 fecal samples of suspected leopard cat origin by surveying transect lines from the Songshan (n = 315), Yunmengshan (n = 43), Yunfengshan (n = 45), Xiaolongmen (n = 75), and Baihuashan (n = 123) nature reserves in Beijing (hereafter, SS, YMS, YFS, XLM, and BHS, respectively; Figure 1). Fecal samples were put into sealed plastic bags, fixed with ethanol, and maintained at −20 °C in the laboratory. We extracted the total DNA from the fecal samples using the Stool DNA Kit (D4015-01; Omega, Dorivalle, GA, USA), according to the manufacturer’s protocol. The multiple-tube approach was used to obtain the host DNA by sampling three to five surface parts of one scat, and after the DNA had been extracted separately, they were mixed into one tube to obtain enough DNA for testing the quality using an ultra-micro spectrophotometer (NanoDrop One; Thermo Scientific, Waltham, MA, USA), which was then used in the following analysis.
BHS represents the Baihuashan reserve, XLM represents the Xiaolongmen reserve, SS represents the Songshan reserve, YMS represents the Yunmengshan reserve, and YFS represents the Yunfengshan reserve. They are the same designations in the following figures.

2.2. Species and Sex Identification

The universal primer of the carnivore species ATP6 hypervariable region of mitochondrial DNA was used in species identification [39]. PCR amplification was set to the following conditions: an initial denaturation at 94 °C for 5 min; thirty-five cycles at 94 °C for 30 s, at 60 °C for 30 s, and at 72 °C for 45 s; and final extension at 72 °C for 8 min. Each 30 µL PCR reaction volume contained 15 µL of Premix Ex Taq enzyme (Takara Biomedical Technology, Beijing, China), 0.2 µL of bovine serum albumin (BSA), 1 µL of forward or reverse primer, and 2 µL (~50 ng) of genomic DNA. The PCR products were purified before Sanger sequencing, and afterward, one sequence was obtained (TsingKe Biotech, Beijing, China). The species was identified from a BLAST search of the NCBI database according to the degree of sequence matching. Each experiment included a positive and negative control (DNase/RNase-free deionized water template, rather than DNA).
The zinc-finger regions of the X and Y chromosomes were used to identify the sex of the leopard cat from the fecal samples (Table 1) [40]. The PCR products of the female samples were 165 bp, and the products of the male samples were 162 and 165 bp. The 20 µL PCR reaction volume included 10 µL of Premix Ex Taq enzyme (Takara Biomedical Technology), 0.2 µL of BSA, 0.8 µL of forward or reverse primer, and 2 µL (~50 ng) of genomic DNA. The PCR conditions were an initial denaturation at 95 °C for 10 min; forty cycles at 95 °C for 30 s, at 58 °C for 40 s, and at 72 °C for 30 s; and final extension at 72 °C for 8 min. Genotyping of the samples was performed with an ABI 3730xl DNA analyzer (Applied Biosystems, Foster City, CA, USA) supplied by TsingKe Biotech. Each sample was analyzed using capillary electrophoresis at least three times until the exact genotype was obtained; samples without amplification products were excluded from the analysis.

2.3. Microsatellite Loci Selection and Amplification

We repeatedly tried several reaction conditions and annealing temperatures with the fecal DNA samples, based on 20 pairs of microsatellite loci for leopard cats that were used in different studies [28,29]. Only six of them (Pbe03, Pbe05, Pbe13, Pbe28, Pbe32, and Pbe33) worked properly for our fecal samples (Table 1). The conditions for the PCR reaction were retrieved from Ko et al. 2018 [29]. We genotyped the samples using the ABI 3730xl DNA analyzer supplied by TsingKe Biotech (the forward primer was labeled with FAM dye at the 5′ end). Each sample was analyzed at least three times to reduce error. If no effective DNA was detected from the heavy degradation, the scat was discarded to ensure the reliability of the three genotyping repeats. Samples amplified with all six loci were considered to be successful and were used in the following analysis.

2.4. Data Analysis

The microsatellite data were organized in Microsoft Excel, and the MS tools plugin in Excel was used to find matching genotypes in the database. The reliability of the typing results was tested with the implementation criteria [41]. Samples were considered to originate from the same individual if the genotypes of all loci were identical or there was a difference in only one locus [42].
We tested the Hardy–Weinberg equilibrium and linkage disequilibrium of each target microsatellite locus using Arlequin v3.5 [43] and Genepop v4.3 [44] with the Bonferroni correction. The number of alleles (Na), effective number of alleles (Ne), observed and expected heterozygosity (Ho and He, respectively), polymorphism information content (PIC), probability of identity (PID), and probability of identity between siblings (PID-sibs) were calculated with GenAlEx v6.5 (Peakall R and Smouse P E, Canberra, Australia) [45]. STRUCTURE v2.3.4 (Pritchard Lab., Palo Alto, CA, USA) was used to verify and analyze the genetic differentiation among leopard cat subpopulations with Bayesian clustering. The Evanno ad hoc ΔK statistic was used to determine the most probable clustering number of subgroups [46]. We set the number of clusters (K) from 1 to 5 (10 times for each K) for accurate assignments of accessions. For each run, a burn-in period of 50,000 iterations and a run length of 500,000 MCMC replications were implemented, and the data were processed with the Harvester online software (http://tayloro.biology.ucla.edu/structureHarvester/) (accessed on 12 September 2019).
The non-Bayesian method, DAPC (Discriminant Analysis of Principal Components), was used to compare to the results from STRUCTURE analysis. This method adopted the R software platform to perform a linear discrimination analysis by running the Adegent data-analysis module and the parameter as the main number of factors was set to N ≤ N/3 (n is the total number of individuals) [47].

3. Results

3.1. Species and Individual Identification

There were 601 carnivore fecal samples collected in the five sampling nature reserves. After a BLAST search of the NCBI database, 550 of the samples were identified as those of leopard cats, with a matching rate of ≥ 98%. Of those 550 samples, 508 were discriminated by sex, with 383 from females and 125 from males. The 508 samples successfully identified by sex were amplified using the microsatellite loci; 96 samples that could not be amplified at the six sites were removed. Micro-Checker detected no null alleles at any of the six loci. After microsatellite-genotype-sharing analysis and sex identification, we identified 53 individuals (33 females and 20 males) in SS, 17 individuals (10 females and 7 males) in YMS, 17 individuals (14 females and 3 males) in YFS, 13 individuals (10 females and 3 males) in XLM, and 12 individuals (9 females and 3 males) in BHS.

3.2. Microsatellite Analysis of Genetic Diversity

None of the six microsatellite loci used for the analysis of genetic diversity deviated from the Hardy–Weinberg equilibrium (p > 0.05), and no linkage disequilibrium was detected. There were 31 alleles detected for the six microsatellite loci and the allele frequency was unevenly distributed; some of them were null in the five subpopulations (Table 2).
The average Na of the six microsatellite loci was 3.400; the average Ne was 2.288; the average Ho was 0.392; the average He was 0.514; and the average PIC was 0.449. The combined population probability of identity for PID was 1.2 × 10⁻³ in YMS, while it was over 2.5 × 10⁻⁴ in other areas, and the PID-sibs was in the 10−2 level, which indicated that the six microsatellite loci were reliable for individual leopard cat identification in this study (Table 3).
The Fst values of the leopard cat subpopulations in the five sampling areas ranged from 0.011 to 0.082; those Fst values larger than 0.05 were the BHS and SS, BHS and YFS, YMS and SS, and BHS and YMS pairs, showing a mild genetic differentiation among these subpopulations (Table 4). Meanwhile, the Nm was in a large range from 2.799 to 22.478, among which the pairs of BHS and SS, BHS and YFS, YMS and SS, and BHS and YMS were relatively small, displaying normal gene flow for these subpopulations.
The results of the STRUCTURE analyses showed that when k = 5, the average value of ln-likelihood was higher (when k = 1, ln-likelihood = −1371.9; when k = 2, ln-likelihood = −1291.3; when k = 3, ln-likelihood = −1255.9; when k = 4, ln-likelihood = −1241.7; when k = 5, ln-likelihood = −1233.5). There was no significant genetic differentiation among the subpopulations in the five sampling areas. This indicates that the leopard cats in Beijing share more common genetic background and less genetic differentiation in nuclear DNA diversity (Figure 2).
The results of the DAPC analysis showed that there was no significant genetic differentiation among the five subpopulations (Figure 3). However, if individual 9 was excluded (dot 9 in the upper left of the plot), most of the individuals in the BHS group were clustered in the lower right, which may indicate that this subpopulation intended to separate from other groups.
BHS represents Baihuashan in red, SS represents Songshan in blue, XLM represents Xiaolongmen in green, YFS represents Yunfengshan in gray, and YMS represents Yunmengshan in orange.

4. Discussion

Accurate evaluation of the population abundance and sex structure is critical to assessing the current status and future development of local populations [48]. From large samples of scat, we identified 112 leopard cats from five nature reserves in mountainous habitats around Beijing. Most individuals were from the SS reserve. The 53 leopard cats in the 45 km2 SS reserve [49] may approximate the real state of the population, whereas the abundance in other reserves may be underestimated, due to the lack of successfully DNA-extracted scat samples.
The sex ratio is an important indicator of the population structure and development trends for the effective management of endangered species [50]. There was a general trend toward a female-biased sex ratio in the five sampling areas (the female-to-male ratio was 1.65:1 at SS, 1.43:1 at YMS, 4.67:1 at YFS, 3.33:1 at XLM, and 3:1 at BHS). This is in line with the female-biased sex structures of other feline species, such as the jungle cat (Felis chaus) in India at 1.59:1 [51]. This phenomenon is more obvious among large cats such as the snow leopard (Panthera uncia) and the African lion (Panthera leo) [52,53] because males die at higher rates than females from injuries during hunting, dispersal, and individual competition [52,54]. However, this female-biased sex ratio may help the population recover quickly from low numbers [55]. Our study provides valuable reference information for the future monitoring of the leopard cat sex ratio in the Beijing region.

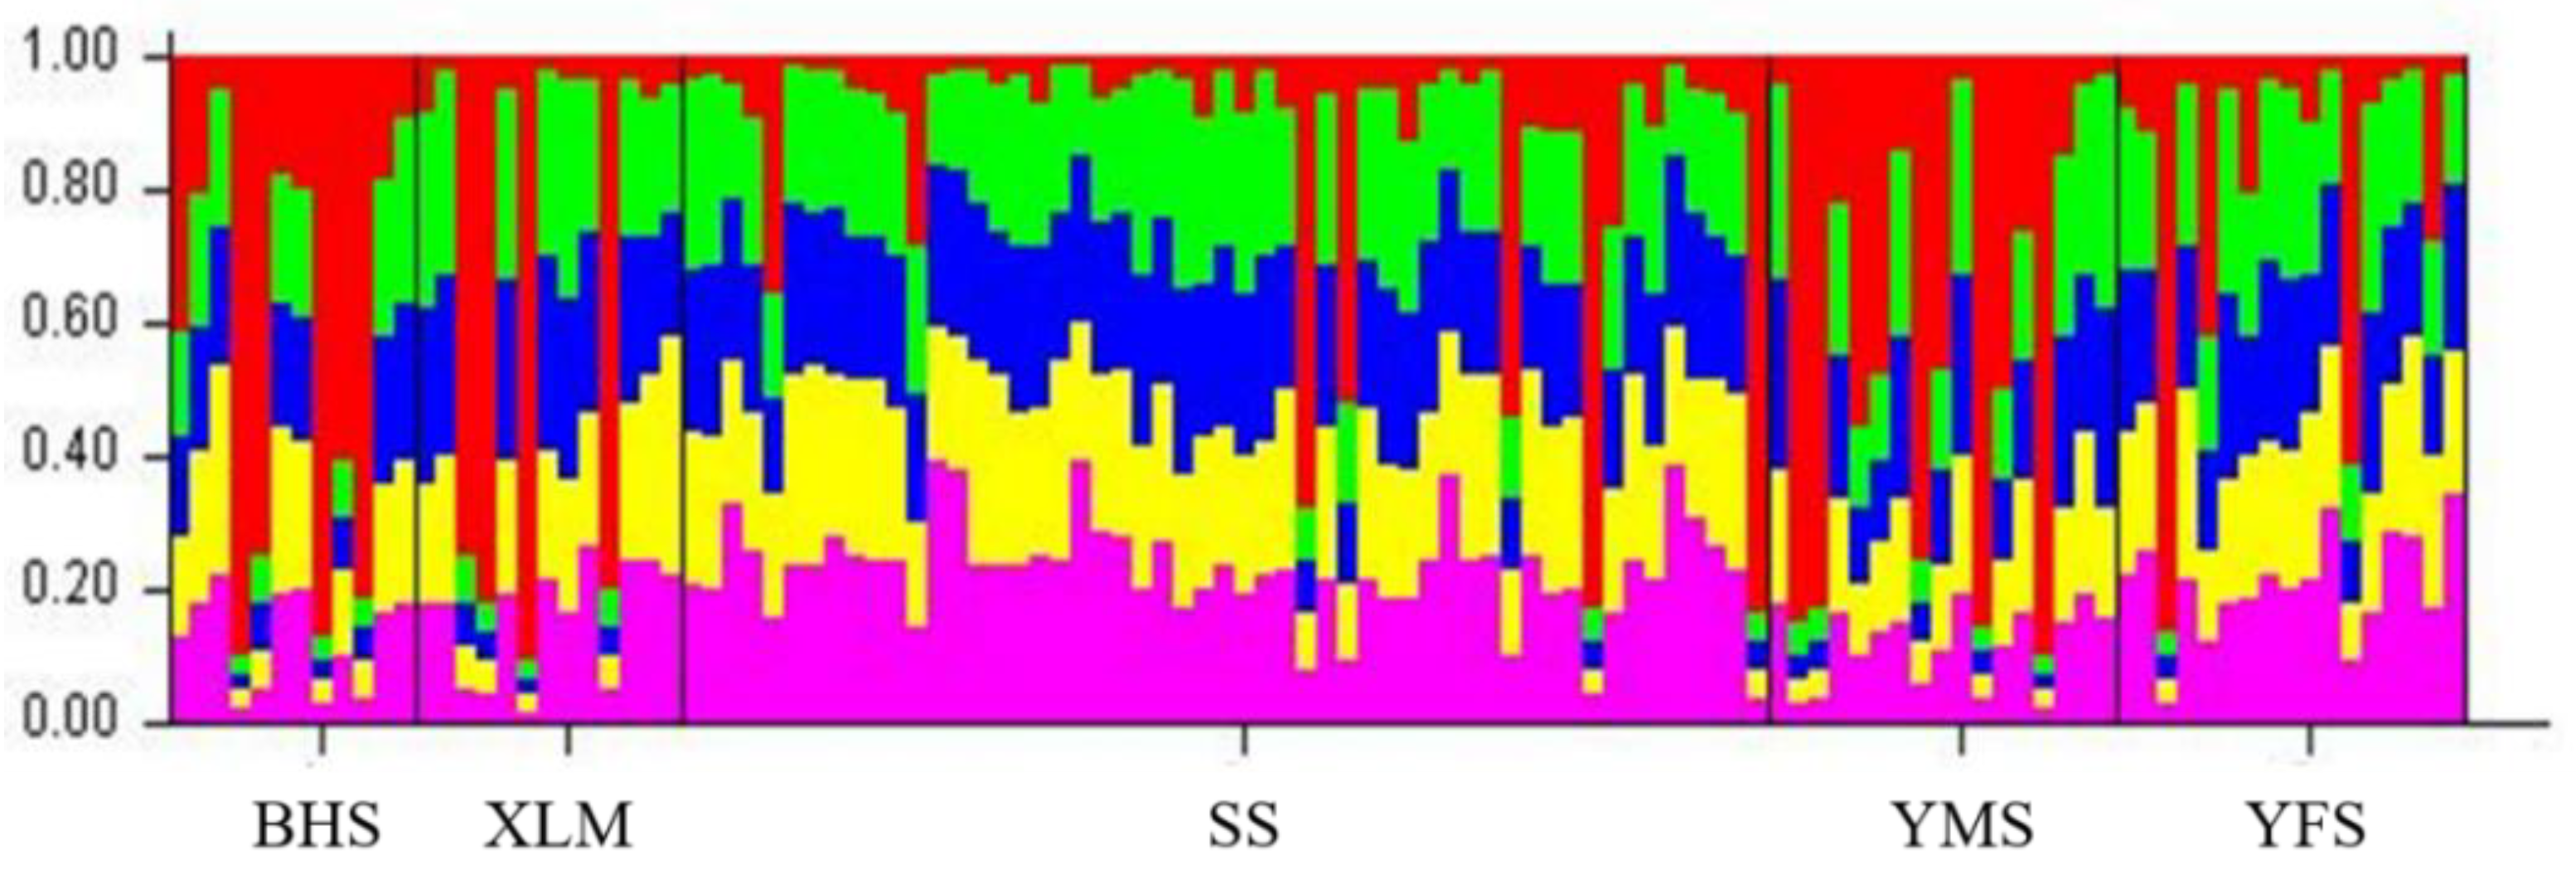
4.1. Genetic Structure Based on Microsatellite Diversity

Analyzing the genetic structure of local populations through molecular approaches may reveal clues to their genetic diversity and adaptability to the environment [56]. Microsatellites are frequently selected as nuclear markers for their high polymorphism, low requirements for DNA in PCR amplification, and accuracy in assessing population genetic diversity [28]. The combined population probabilities of identity, PID and PID-sibs, were in the levels of 10−4 and 10−2, respectively. Considering there were less than 100 wild cats in each sampling area [57], the six microsatellite loci were reliable in identifying leopard cat individuals in our study [58]. The average PIC at all six microsatellite loci was above 0.4 (Table 3), which indicated the moderate diversification of the alleles according to the standards of Botstein [59]. In this study, the average effective number of alleles (Ne = 2.288) was lower than the index for leopard cats in Korea (Na = 3.8) [29] but higher than that of the Iriomote leopard cat population in Japan (Na = 1.33) [26]. Moreover, the average observed heterozygosity was lower than for leopard cats in Korea (Ho = He = 0.41) [29], but the average expected heterozygosity was higher (Table 3), and, compared to the Tsushima leopard cat population in Japan (Ho = 0.77, He = 0.66) [26], our parameters were much lower. Thus, total genetic diversity was moderate for the leopard cats in this study, in concordance with their wide distribution and small population size in the Beijing region [57].

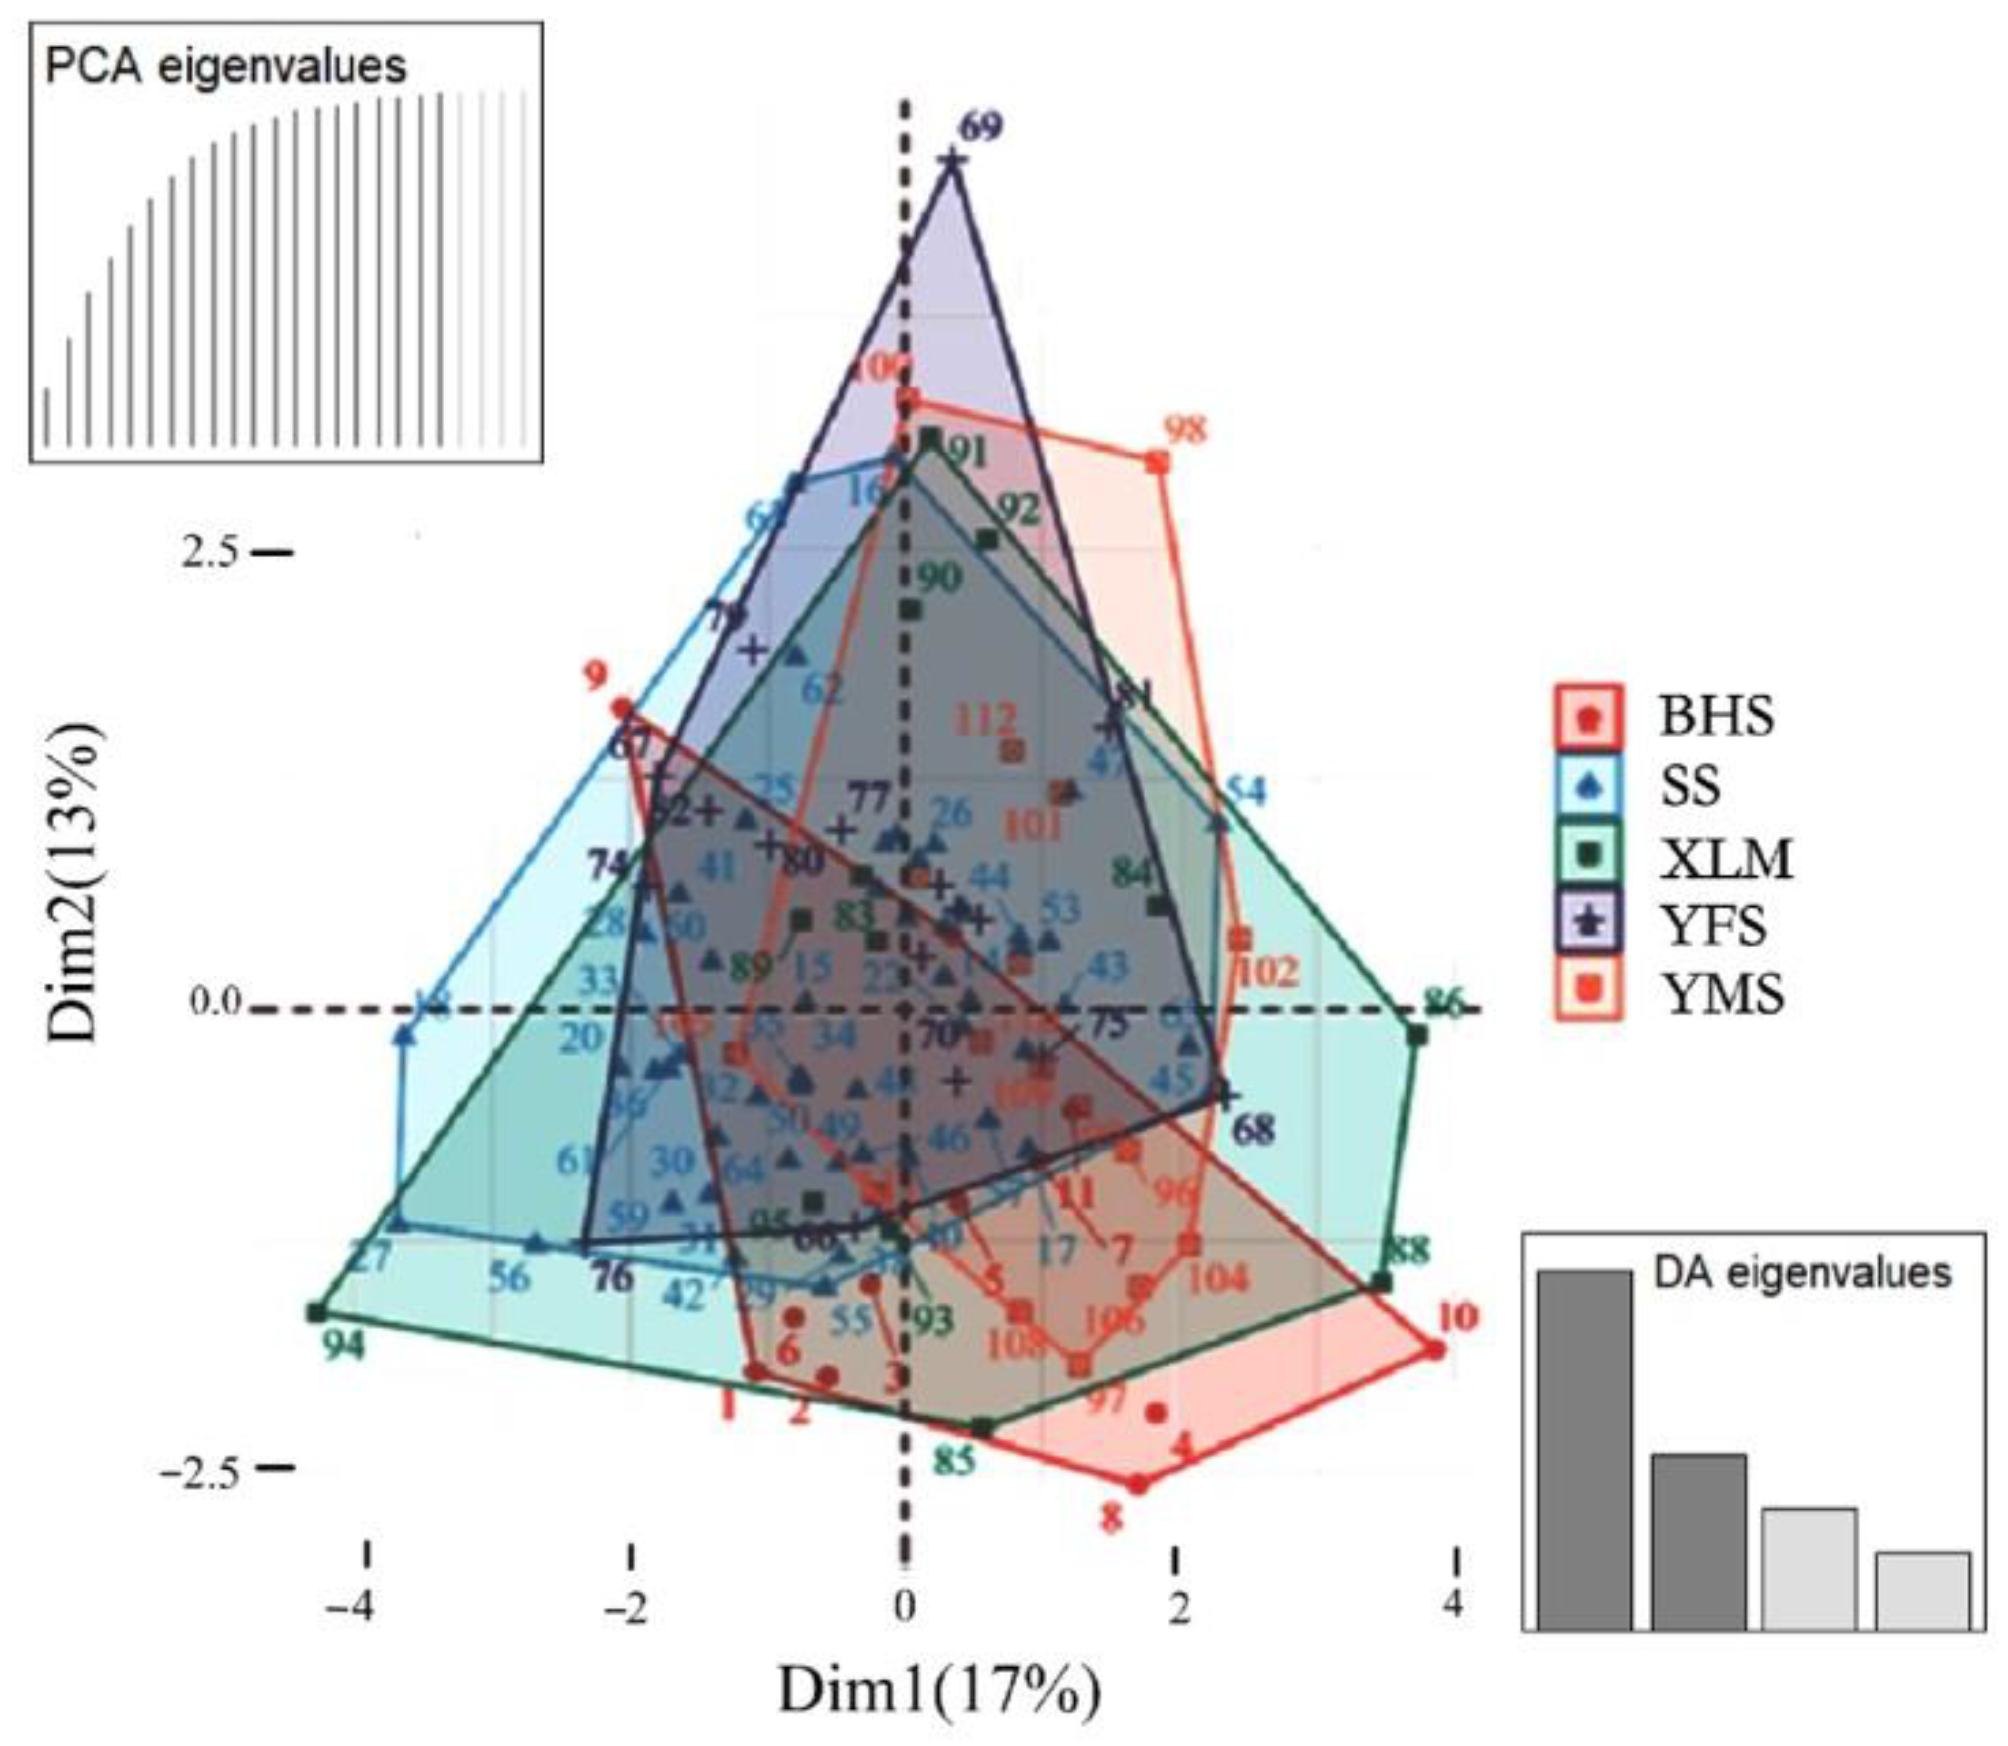
4.2. Population Genetic Differentiation

Habitat loss and fragmentation increase the chance for inbreeding and pose an extinction risk for the local populations, which are becoming major threats to biodiversity conservation [53]. In general, wild animals must have a high rate of dispersal to reduce this risk and maintain a diversified population genetic structure [14]. Based on the analysis of the diversity using microsatellite loci, we found the genetic differentiation index of Fst values was larger than 0.05 for BHS and SS (0.082), BHS and YFS (0.072), YMS and SS (0.057), and BHS and YMS (0.053), indicating a moderate genetic differentiation among these subpopulations. However, the values of Nm indicate a normal gene flow among the subpopulations, although the value pairs of BHS and SS (2.799), BHS and YFS (3.222), YMS and SS (4.136), and BHS and YMS (4.467) were relatively small (Table 4). Meanwhile, the STRUCTURE diagram and DAPC analysis revealed the five sampling groups shared most of the ancestral gene, indicating no obvious genetic discrepancy (Figure 2 and Figure 3). Our results implied that more work is needed to clarify the genetic discrepancy for these separated subpopulations, such as by using mitochondrial markers. However, cautions regarding the effects of female philopatry should be taken into consideration, as the variations in the mitochondrial DNA were mainly dominated by the maternal lineages. For example, female philopatry detected in the Scandinavian brown bear (Ursus arctos) demostrated low number of mtDNA haplotypes and high microsatellite diversity among four analyzed subpopulations. It is suggested that this is a result of gene flow mediated by male dispersal and geographical distance [60]. Similar outcomes were detected in an Australian bird (the eastern yellow robin Eopsaltria australis) [61]. Thus, if the mitochondrial markers be applied in leopard cat in Beijing, enough samples in different sex should be included to clarify the influence of sex biased dispersal.

5. Conclusions

From the point of view of conservation genetics, the Beijing region is in a relatively narrow geographic range with no marked differences in weather or altitude. In addition, the leopard cat has a strong dispersal ability. We postulated at the beginning of our study that there would be no genetic differentiation among subpopulations. However, the mild discrepancy trend in the BHS and SS subpopulations was different from our expectation. We assume that this is due to female-dominated philopatry traits of the leopard cat, as well as segregation effects from natural rivers, major roads, and the expansion of human residential sites. Thus, we suggest that greater attention should be paid to the BHS and SS subpopulations in future monitoring programs, and they should each be taken as an independent conservation unit for the planning of further conservation strategies. If needed, female individuals from other areas could be introduced to maintain the integrity of genetic diversity. We also suggest further field sampling and more molecular markers be utilized to obtain a clearer genetic variation of the leopard cat population in the Beijing region.

Author Contributions

Y.T., L.-F.J., W.-H.H., X.Z. and W.-D.B. designed the experiments; Y.T. and J.Y. performed the experiments and wrote the draft manuscript; J.Y. and F.-L.G. analyzed the data. All authors have read and agreed to the published version of the manuscript.

Funding

This research was funded by Beijing Science and Technology Plan (Z181100005318004). And the APC was funded by Wildlife Diversity Survey of Miyun District (662004104).

Institutional Review Board Statement

Not applicable.

Informed Consent Statement

Not applicable.

Data Availability Statement

This study did not report any data.

Acknowledgments

We thank the staff of the nature reserves for their help with collecting the fecal samples. We would express our gratitude to the three anonymous reviewers for their insightful comments and suggestions in revising the manuscript.

Conflicts of Interest

The authors declare that they have no competing interest.

References

  1. Hogbin, P.M.; Peakall, R. Evaluation of the contribution of genetic research to the management of the endangered plant Zieria prostrata. Conserv. Biol. 2010, 13, 514–522. [Google Scholar] [CrossRef]
  2. Romiguier, J.; Gayral, P.; Ballenghien, M.; Bernard, A.; Cahais, V.; Chenuil, A.; Chiari, A.; Dernat, Y.; Duret, L.; Faivre, N.; et al. Comparative population genomics in animals uncovers the determinants of genetic diversity. Nature 2014, 515, 261–263. [Google Scholar] [CrossRef]
  3. Sharma, R.; Stuckas, H.; Bhaskar, R.; Khan, I.; Goyal, S.P.; Tiedemann, R. Genetically distinct population of Bengal tiger (Panthera tigris tigris) in Terai Arc landscape (TAL) of India. Mamm. Biol. 2011, 76, 484–490. [Google Scholar] [CrossRef]
  4. Lino, A.; Fonseca, C.; Rojas, D.; Fischer, E.; Pereira, M.J.R. A meta-analysis of the effects of habitat loss and fragmentation on genetic diversity in mammals. Mamm. Biol. 2018, 94, 69–76. [Google Scholar] [CrossRef]
  5. Mukherjee, S.; Krishnan, A.; Tamma, K.; Home, C.; Navya, R.; Joseph, S.; Das, A.; Ramakrishnan, U. Ecology Driving Genetic Variation: A Comparative Phylogeography of Jungle Cat (Felis chaus) and Leopard Cat (Prionailurus bengalensis) in India. PLoS ONE 2010, 5, e13724. [Google Scholar] [CrossRef] [PubMed]
  6. Fernández, N.; Delibes, M.; Palomares, F. Landscape evaluation in conservation: Molecular sampling and habitat modeling for the Iberian lynx. Ecol. Appl. 2006, 16, 1037–1049. [Google Scholar] [CrossRef] [Green Version]
  7. Sunquist, M.; Sunquist, F. Leopard Cat (Prionailurus bengalensis) Kerr, 1792, Wild Cats of the World; University of Chicago Press: Chicago, IL, USA, 2002; pp. 1–14. [Google Scholar]
  8. Farrell, L.E.; Roman, J.; Sunquist, M.E. Dietary separation of sympatric carnivores identified by molecular analysis of scats. Mol. Ecol. 2000, 9, 1583–1590. [Google Scholar] [CrossRef] [PubMed]
  9. Ripple, W.J.; Estes, J.A.; Beschta, R.L.; Wilmers, C.C.; Ritchie, E.G.; Hebblewhite, M.; Berger, J.; Elmhagen, B.; Letnic, M.; Nelson, M.P.; et al. Status and ecological effects of the world’s largest carnivores. Science 2014, 343, 1241484. [Google Scholar] [CrossRef] [PubMed] [Green Version]
  10. Rodgers, T.W.; Janečka, J.E. Applications and techniques for non-invasive faecal genetics research in felid conservation. Eur. J. Wildl. Res. 2012, 59, 1–16. [Google Scholar] [CrossRef]
  11. Macdonald, D.; Loveridge, A. The Biology and Conservation of Wild Felids; Oxford University Press: London, UK, 2010; pp. 11–23. [Google Scholar]
  12. Caragiulo, A.; Kang, Y.; Rabinowitz, S.; Freedman, I.D.; Simone, L.; Zhou, X.W.; Bao, W.D.; Amato, G. Presence of the endangered Amur tiger Panthera tigris altaica in Jilin Province, China, detected using non-invasive genetic techniques. Oryx 2015, 49, 632–635. [Google Scholar] [CrossRef]
  13. Kurose, N.; Masuda, R.; Tatara, M. Fecal DNA analysis for identifying species and sex of sympatric carnivores: A noninvasive method for conservation on the Tsushima islands, Japan. J. Hered. 2005, 96, 688–697. [Google Scholar] [CrossRef] [Green Version]
  14. Janecka, J.E.; Jackson, R.; Munkhtsog, B.; Murphy, W.J. Characterization of 9 microsatellites and primers in snow leopards and a species-specific PCR assay for identifying noninvasive samples. Conserv. Genet. Resour. 2014, 6, 369–373. [Google Scholar] [CrossRef]
  15. Miotto, R.A.; Cervini, M.; Begotti, R.A.; Galetti, P.M., Jr. Monitoring a puma (Puma concolor) population in a fragmented landscape in southeast Brazil. Biotropica 2012, 44, 98–104. [Google Scholar] [CrossRef]
  16. Sicuro, F.L.; Oliveira, L.F.B. Variations in leopard cat (Prionailurus bengalensis) skull morphology and body size: Sexual and geograhic influences. PeerJ 2015, 3, e1309. [Google Scholar] [CrossRef] [PubMed] [Green Version]
  17. Smith, A.T.; Xie, Y. A Guide to the Mammals of China; Princeton University Press: Princeton, NJ, USA, 2008; pp. 5–13. [Google Scholar]
  18. Ross, J.; Brodie, J.; Cheyne, S. Prionailurus bengalensis. The IUCN Red List of Threatened Species. 2015. Available online: www.iucnredlist.org (accessed on 15 January 2021).
  19. Wang, Y.X.; Jiang, X.L.; Feng, Q.; Chen, Z.P. Abundance, sustainable utilization and conservation of leopard cat in Yunnan. Acta Theriol. Sin. 1997, 1, 32–43. [Google Scholar]
  20. Seto, K.C.; Güneralp, B.; Hutyra, L.R. Global forecasts of urban expansion to 2030 and direct impacts on biodiversity and carbon pools. Proc. Nat. Acad. Sci. USA 2012, 109, 16083–16088. [Google Scholar] [CrossRef] [PubMed] [Green Version]
  21. Lorica, R. Prionailurus bengalensis ssp. rabori. The IUCN Red List of Threatened Species. 2008. Available online: www.iucnredlist.org (accessed on 15 January 2021).
  22. Izawa, M.; Doi, T. Prionailurus bengalensis ssp. Iriomotensis (Errata Version Published in 2016). The IUCN Red List of Threatened Species 2015. Available online: www.iucnredlist.org (accessed on 15 January 2021).
  23. Jiang, Z.G.; Jiang, J.P.; Wang, Y.Z.; Zhang, E.; Zhang, Y.Y.; Li, L.L.; Xie, F.; Cai, B.; Cao, L.; Zheng, G.M.; et al. Red list of China’s vertebrates. Biodiv. Sci. 2016, 24, 500–551. [Google Scholar]
  24. Izawa, M.; Nakanishi, N. Prionailurus bengalensis euptilurus (Elliot, 1871). In The Wild Mammals of Japan; Ohdachi, S.D., Ishibashi, Y., Iwasa, M.A., Saitoh, T., Eds.; Soukadoh Book Sellers and the Mammalogical Society of Japan: Kyoto, Japan, 2009; pp. 226–227. [Google Scholar]
  25. Nakanishi, N.; Izawa, M. Prionailurus bengalensis iriomotensis (Imaizumi, 1967). In The Wild Mammals of Japan; Ohdachi, S.D., Ishibashi, Y., Iwasa, M.A., Saitoh, T., Eds.; Soukadoh Book Sellers and the Mammalogical Society of Japan: Kyoto, Japan, 2009; pp. 228–229. [Google Scholar]
  26. Saka, T.; Nishita, Y.; Masuda, R. Low genetic variation in the MHC class II DRB gene and MHC-linked microsatellites in endangered island populations of the leopard cat (Prionailurus bengalensis) in Japan. Immunogenetics 2018, 70, 115–124. [Google Scholar] [CrossRef]
  27. Tamada, T.; Siriaroonrat, B.; Subramaniam, V. Molecular diversity and phylogeography of the Asian leopard cat, Felis bengalensis, inferred from mitochondrial and Y-chromosomal DNA sequences. Zool. Sci. 2008, 25, 154–163. [Google Scholar] [CrossRef] [PubMed]
  28. Eo, S.H.; Ko, B.J.; Lee, B.J.; Seomun, H.; Kim, S.; Kim, M.J.; Kim, J.H.; An, J. A set of microsatellite markers for population genetics of leopard cat (Prionailurus bengalensis) and cross-species amplification in other felids. Biochem. Syst. Ecol. 2016, 66, 196–200. [Google Scholar] [CrossRef]
  29. Ko, B.J.; An, J.; Seomun, H.; Lee, M.-Y.; Eo, S.H. Microsatellite DNA analysis reveals lower than expected genetic diversity in the threatened leopard cat (Prionailurus bengalensis) in South Korea. Genes Genom. 2018, 40, 521–530. [Google Scholar] [CrossRef]
  30. Bai, S.Y. Genetic Diversity and Phylogenetic Relationships among Populations of the Leopard Cat Felis bengalensis; Northeast Forestry University: Harbin, China, 2001; pp. 45–49. (In Chinese) [Google Scholar]
  31. Wei, D.Q. Study on the Genetic Structure and Geographical Differentiation of Leopard Cat Population; Northeast Forestry University: Harbin, China, 2006; pp. 33–41. (In Chinese) [Google Scholar]
  32. Fan, Y.Q.; Yang, J.; Zhang, H.L.; Jiang, J.; Jiang, W.J.; Tang, S.P.; Bao, W.D. Food composition of medium sized carnivores in Beijing Songshan nature reserve. J. Biol. 2020, 37, 59–62. [Google Scholar]
  33. Bao, W.D.; Li, X.J.; Shi, Y. Comparative analysis of food habits in carnivores from three areas of Beijing. Zool. Res. 2005, 26, 118–122. [Google Scholar]
  34. Tang, X.M.; Zhang, D.H.; Ma, Z.H.; Wu, T.L.; Zhang, Y.S.; Bao, W.D. Camera trapping survey on ground-dwelling birds and mammals of spring and winter in Beijing Wulingshan nature reserve. Chinese J. Zool. 2019, 51, 751–760. [Google Scholar]
  35. Zhang, Y.S.; Jaing, W.J.; Jiang, J.; Dan, W.; Wu, J.; Liu, F.; Bao, W.D. Biodiversity monitoring of understory birds and mammals in Beijing Songshan national nature reserve. Chin. J. Wildl. 2017, 38, 367–375. [Google Scholar]
  36. Lan, H.; Jin, K. Infrared-triggered camera technology application in the investigation of mammals in Beijing Wulingshan national nature reserve. Acta Theriol. Sin. 2016, 36, 322–329. [Google Scholar]
  37. Liu, F.; Li, D.Q.; Wu, J.G. Using infra-red cameras to survey wildlife in Beijing Songshan national nature reserve. Acta Ecol. Sin. 2012, 32, 730–739. [Google Scholar]
  38. Yang, J.; Zhu, G.F.; Jiang, J.; Xiang, C.L.; Gao, F.L.; Bao, W.D. Non-invasive genetic analysis indicates low population connectivity in the vulnerable Chinese gorals: Concerns for segregated population management. Zool. Res. 2019, 40, 39–448. [Google Scholar] [CrossRef] [PubMed]
  39. Chaves, P.B.; Graeff, V.G.; Lion, M.B.; Oliveira, L.R.; Eizirik, E. DNA barcoding meets molecular scatology: Short mtDNA sequences for standardized species assignment of carnivore noninvasive samples. Mol. Ecol. Resour. 2012, 12, 18–35. [Google Scholar] [CrossRef]
  40. Pilgrim, K.L.; McKelvey, K.S.; Riddle, A.E.; Schwartz, M.K. Felid sex identification based on noninvasive genetic samples. Mol. Ecol. Notes 2005, 5, 60–61. [Google Scholar] [CrossRef]
  41. Mondol, S.; Karanth, K.U.; Kumar, N.S.; Andheria, A.; Ramakrishnan, U. Evaluation of non-invasive genetic sampling methods for estimating tiger population size. Biol. Conserv. 2009, 142, 2350–2360. [Google Scholar] [CrossRef]
  42. Bellemain, E.V.A.; Swenson, J.E.; Tallmon, D.; Brunberg, S.; Taberlet, P. Estimating population size of elusive animals with DNA from hunter-collected feces: Four methods for brown bears. Conserv. Biol. 2005, 19, 150–161. [Google Scholar] [CrossRef]
  43. Excoffier, L.; Lischer, H.E.L. Arlequin suite ver 3.5: A new series of programs to perform population genetics analyses under Linux and Windows. Mol. Ecol. Resour. 2010, 10, 564–567. [Google Scholar] [CrossRef] [PubMed]
  44. Rousset, F. GENEPOP’007: A complete re-implementation of the GENEPOP software for Windows and Linux. Mol. Ecol. Resour. 2008, 8, 103–106. [Google Scholar] [CrossRef]
  45. Peakall, R.; Smouse, P.E. GenAlEx 6.5: Genetic analysis in Excel. Population genetic software for teaching and research—An update. Bioinformatics 2012, 28, 2537–2539. [Google Scholar] [CrossRef] [Green Version]
  46. Evanno, G.; Regnaut, S.; Goudet, J. Detecting the number of clusters of individuals using the software STRUCTURE: A simulation study. Mol. Ecol. 2005, 14, 2611–2620. [Google Scholar] [CrossRef] [PubMed] [Green Version]
  47. Jombart, T.; Devillard, S.; Balloux, F. Discriminant analysis of principal components: A new method for the analysis of genetically structured populations. BMC Genet. 2010, 11, 2156–2171. [Google Scholar] [CrossRef] [PubMed] [Green Version]
  48. Miller, C.R.; Joyce, P.; Waits, L.P. A new method for estimating the size of small populations from genetic mark–recapture data. Mol. Ecol. 2005, 14, 1991–2005. [Google Scholar] [CrossRef] [PubMed]
  49. Du, L.H.; Wang, X.P.; Chen, J.Q. A Comprehensive Scientific Investigation Report of Beijing Songshan National Nature Reserve; China Forestry Publishing House: Beijing, China, 2012; pp. 56–59. [Google Scholar]
  50. Zinn, H.C.; Pierce, C.L. Values, gender, and concern about potentially dangerous wildlife. Envi. Behav. 2002, 34, 239–256. [Google Scholar] [CrossRef]
  51. Sharma, S.; Dutta, T.; Maldonado, J.E.; Wood, T.C.; Panwar, H.S.; Seidensticker, J. A highly informative microsatellite panel for individual identification and sex determination of jungle cats (Felis chaus). Conserv. Genet. Resour. 2013, 5, 863–866. [Google Scholar] [CrossRef]
  52. Sharma, K.; Bayrakcismith, R.; Tumursukh, L. Vigorous dynamics underlie a stable population of the endangered snow leopard (Panthera uncia) in Tost Mountains, South Gobi, Mongolia. PLoS ONE 2014, 9, e101319. [Google Scholar] [CrossRef] [Green Version]
  53. Björklund, M. The risk of inbreeding due to habitat loss in the lion (Panthera leo). Conserv. Genet. 2003, 4, 515–523. [Google Scholar] [CrossRef]
  54. Barthold, J.A.; Loveridge, A.J.; Macdonald, D.W.; Packer, C.; Colchero, F. Bayesian estimates of male and female African lion mortality for future use in population management. J. Appl. Ecol. 2016, 53, 295–304. [Google Scholar] [CrossRef] [Green Version]
  55. Aziz, M.A.; Tollington, S.; Barlow, A.; Greenwood, C.; Goodrich, J.M.; Smith, O.; Shamsuddoha, M.; Islam, M.A.; Groombridge, J.J. Using non-invasively collected genetic data to estimate density and population size of tigers in the Bangladesh Sundarbans. Glob. Ecol. Conserv. 2017, 12, 272–282. [Google Scholar] [CrossRef]
  56. Reed, D.H.; Frankham, R. Correlation between fitness and genetic diversity. Conserv. Biol. 2003, 17, 230–237. [Google Scholar] [CrossRef]
  57. Chen, W.; Gao, W.; Fu, B.Q. Mammals of Beijing; Beijing Publishing House: Beijing, China, 2002; pp. 5–14. [Google Scholar]
  58. Waits, L.P.; Luikart, G.; Taberlet, P. Estimating the probability of identity among genotypes in natural populations: Cautions and guidelines. Mol. Ecol. 2001, 10, 249–256. [Google Scholar] [CrossRef] [PubMed]
  59. Botstein, D.; White, R.L.; Skolnick, M.H.; Davis, R. Construction of a genetic linkage map in man using restriction fragment length polymorphisms. Am. J. Hum. Genet. 1980, 32, 314–331. [Google Scholar]
  60. Waits, L.; Taberlet, P.; Swenson, J.E.; Sandegren, F.; Franzen, R. Nuclear DNA microsatellite analysis of genetic diversity and gene flow in the Scandinavian brown bear (Ursus arctos). Mol. Ecol. 2000, 9, 421–431. [Google Scholar] [CrossRef]
  61. Pavlova, A.; Amos, J.N.; Joseph, L.; Loynes, K.; Austin, J.J.; Keogh, J.S.; Stone, G.N.; Nicholls, J.A.; Sunnucks, P. Perched at the mito-nuclear crossroads: Divergent mitochondrial lineages correlate with environment in the face of ongoing nuclear gene flow in an Australian bird. Evolution 2013, 67, 3412–3428. [Google Scholar] [CrossRef]
Figure 1. Fecal sampling areas for analyses of the genetic structure of leopard cats in Beijing.
Biology 11 01478 g001
Figure 2. Genetic structure based on microsatellite genotypes in leopard cat subpopulations in the five sampling areas (k = 5). BHS represents Baihuashan in red, XLM represents Xiaolongmen in yellow, SS represents Songshan in green, YMS represents Yunmengshan in magenta, and YFS represents Yunfengshan in blue.
Biology 11 01478 g002
Figure 3. Genetic similarity based on DAPC analysis of microsatellite genotypes in leopard cat subpopulations in the five sampling areas.
Biology 11 01478 g003
Table 1. Primer pairs for amplifying the sex chromosomes and microsatellites of the leopard cat.
LocusPrimer Sequence (5′-3′)Ta (°C)Size (bp)
Zn-fingerF: AAGTTTACACAACCACCTGG56X162/Y165
R: CACAGAATTTACACTTGTGCA
Pbe03F: M13FCTGCCTTTGACTGCTCCAC58131–163
R: TGCTTACCATGTGACCTCC
Pbe05F: M13FTCACCTCTGGGCTCTTG60181–193
R: AGGGACACGGAAAGGCATC
Pbe13F: M13FTGCGGATGTTGGGAAAGAAC60210–218
R: AGGCCGAGACCAGTTAAGG
Pbe28F: M13FGGGAGACCTTGCCTCATTTC56233–241
R: TGCTTCCCTAACAGGCATC
Pbe32F: M13FAGCACTAGGCCAGAACACC64174–178
R: CCAGACCCTCTTTGCCTTG
Pbe33F:M13FAGAGGCACTTGGAGTTAGGG58248–252
R: GAG TCGGCA AACCTGGAAC
The sequence of M13F is 5′- CACGACGTTGTAAAACGAC -3′ added to the 5′ end of the forward primer labeling with 5-HEX for Pbe03, 05, and 13; 5-FAM for Pbe28, 32, and 33.
Table 2. Allele frequencies of six microsatellites in leopard cat subpopulations in the five sampling areas.
Microsatellites LociAlleleAllele Frequency
SSYMSYFSXLMBHS
Pbe031310.1420.0590.0880.1150.042
1350.0940.1470.0000.0380.167
1390.0570.0000.0590.0000.292
1430.3300.5590.3530.5000.417
1470.0190.0000.0590.0000.000
1510.1130.0000.0590.0000.000
1550.0380.0000.0590.0000.000
1590.1790.2350.3240.3460.083
1630.0280.0000.0000.0000.000
1310.1420.0000.0000.0000.000
Pbe051770.0000.0000.0000.1540.000
1810.2740.5000.1180.1920.250
1850.6980.5000.8820.6540.708
1890.0000.0000.0000.0000.042
1930.0280.0000.0000.0000.000
Pbe132020.0000.0000.0000.1150.083
2060.0380.0000.0290.0000.000
2100.3680.0000.1760.1540.083
2140.3770.5880.4710.5000.625
2180.2080.4120.3240.0770.125
2220.0090.0000.0000.1540.083
Pbe282330.0280.2350.0880.2310.542
2370.6230.4410.5000.5380.208
2410.3490.3240.4120.2310.250
Pbe321700.0190.0290.0000.0000.000
1740.2920.1760.3240.2690.250
1780.6790.7940.6760.7310.750
1820.0090.0000.0000.0000.000
Pbe332400.0000.0000.0590.0000.000
2480.2170.2940.2940.2690.125
2520.7830.7060.6470.7310.875
SS represents Songshan reserve, YMS represents Yunmengshan reserve, YFS represents Yunfengshan reserve, XLM represents Xiaolongmen reserve, and BHS represents Baihuashan reserve. They are the same designations in the following tables.
Table 3. Genetic diversity and probability of identity of six microsatellite loci detected in leopard cat subpopulations in the five sampling areas.
Microsatellite LociMicrosatellite IndexSS
(N = 53)
YMS
(N = 17)
YFS
(N = 17)
XLM
(N = 13)
BHS
(N = 12)
Pbe03Na9.0004.0007.0004.0005.000
Ne5.3002.5463.9862.6003.388
Ho0.6980.5880.5880.4620.583
He0.8110.6070.7490.6150.705
PIC0.8190.5540.7130.5440.655
PID0.05760.20740.09930.21880.1360
PID-sibs0.35870.49820.40030.49700.4316
Pbe05Na3.0002.0002.0003.0003.000
Ne1.7762.0001.2622.0481.767
Ho0.4150.2940.2350.3850.583
He0.4370.5000.2080.5120.434
PIC0.4410.3750.1860.4580.369
PID0.039080.37500.67940.29190.3850
PID-sibs0.62920.59380.80860.56710.6292
Pbe13Na5.0002.0004.0005.0005.000
Ne3.1021.9402.7923.1592.341
Ho0.6420.3530.5290.4620.250
He0.6780.4840.6420.6830.573
PIC0.6840.3670.5750.6470.544
PID0.16740.38310.19550.13660.2118
PID-sibs0.45300.60360.47800.44240.5165
Pbe28Na3.0003.0003.0003.0003.000
Ne1.9602.8202.3402.5222.504
Ho0.5660.4710.4120.1540.667
He0.4900.6450.5730.6040.601
PIC0.4940.5710.4810.5360.533
PID0.35570.19970.27390.22460.2270
PID-sibs0.59410.47730.53210.50440.5064
Pbe32Na4.0003.0002.0002.0002.000
Ne1.8271.5091.7781.6491.600
Ho0.5470.1760.2940.2310.167
He0.4530.3370.4380.3930.375
PIC0.4570.2970.3420.3160.305
PID0.37900.47950.41200.44530.4609
PID-sibs0.61840.70120.63410.66460.6777
Pbe33Na2.0002.0003.0002.0002.000
Ne1.5151.7101.9661.6491.280
Ho0.3210.2350.2940.0770.083
He0.3400.4150.4910.3930.219
PIC0.3430.3290.4150.3160.195
PID0.49360.42820.33470.44530.6343
PID-sibs0.70350.64940.58800.66460.7992
AverageNa4.3332.6673.5003.1673.333
Ne2.5802.0872.3542.2712.147
Ho0.5310.3530.3920.2950.389
He0.5350.4980.5170.5340.484
PIC0.4700.4180.4520.4700.434
combined PID2.5 × 10−41.2 × 10−34.7 × 10−43.9 × 10−47.3 × 10−4
combined PID-sibs2.6 × 10−23.8 × 10−23.0 × 10−22.7 × 10−23.8 × 10−2
Table 4. Fst and Nm based on analyses of the diversity of microsatellite loci in leopard cat subpopulations in the five sampling areas.
Sampling AreaSSYMSYFSXLMBHS
SS 4.13618.98111.6552.799
YMS0.057 4.8529.3664.467
YFS0.0130.049 22.4783.222
XLM0.0210.0260.011 6.695
BHS0.0820.0530.0720.036
Fst appears below the diagonal, and Nm appears above the diagonal.
Publisher’s Note: MDPI stays neutral with regard to jurisdictional claims in published maps and institutional affiliations.

