Article

Morphometric and Genetic Description of Trophic Adaptations in Cichlid Fishes

1
Department of Biological Sciences, Clemson University, Clemson, SC 29634, USA
2
Department of Biological Sciences and Genetics and Genomics Academy, North Carolina State University, Raleigh, NC 27695, USA
3
Department of Biology, Warren Wilson College, Swannanoa, NC 28778, USA
*
Author to whom correspondence should be addressed.
Biology 2022, 11(8), 1165; https://doi.org/10.3390/biology11081165
Submission received: 17 June 2022 / Revised: 28 July 2022 / Accepted: 30 July 2022 / Published: 3 August 2022
(This article belongs to the Special Issue Craniofacial Development and Evolution)

Abstract

:

Simple Summary

Skull and jaw shape are critical to how an animal eats. The goal of this work was to examine how facial variation evolves and the genetic basis of these changes. We used two species of Lake Malawi cichlids with different facial shapes, one which has evolved to eat prey by suction feeding, a second that bites algae from rocks, as well as hybrid individuals generated by artificial mating of the two species. We found a series of changes in craniofacial structure including the shape of the lower jaw and throat region that impact how animals perform at suction feeding and biting. We then identified genetic regions that regulate these facial shapes. These genetic regions suggested that evolution of the senses, among other traits, may play an important role in facial evolution. Also, evolution of different parts of the face are controlled by distinct genetic regions. Despite this, cichlids that eat similar ways have similar facial shapes, suggesting that the function of jaw movement places certain limits on facial evolution in cichlid fishes. Overall, this work provides insights into how the face evolves, how these changes relate to feeding, and the genes and molecules that regulate craniofacial variation.

Abstract

Since Darwin, biologists have sought to understand the evolution and origins of phenotypic adaptations. The skull is particularly diverse due to intense natural selection on feeding biomechanics. We investigated the genetic and molecular origins of trophic adaptation using Lake Malawi cichlids, which have undergone an exemplary evolutionary radiation. We analyzed morphological differences in the lateral and ventral head shape among an insectivore that eats by suction feeding, an obligate biting herbivore, and their F2 hybrids. We identified variation in a series of morphological traits—including mandible width, mandible length, and buccal length—that directly affect feeding kinematics and function. Using quantitative trait loci (QTL) mapping, we found that many genes of small effects influence these craniofacial adaptations. Intervals for some traits were enriched in genes related to potassium transport and sensory systems, the latter suggesting co-evolution of feeding structures and sensory adaptations for foraging. Despite these indications of co-evolution of structures, morphological traits did not show covariation. Furthermore, phenotypes largely mapped to distinct genetic intervals, suggesting that a common genetic basis does not generate coordinated changes in shape. Together, these suggest that craniofacial traits are mostly inherited as separate modules, which confers a high potential for the evolution of morphological diversity. Though these traits are not restricted by genetic pleiotropy, functional demands of feeding and sensory structures likely introduce constraints on variation. In all, we provide insights into the quantitative genetic basis of trophic adaptation, identify mechanisms that influence the direction of morphological evolution, and provide molecular inroads to craniofacial variation.

1. Introduction

Understanding the patterns and origins of variation is a key challenge within both developmental and evolutionary biology. A structure with significant morphological diversity is the skull, with variation across and within many clades of vertebrates including fishes [1,2,3], birds [4,5,6], reptiles [7,8], and mammals [9,10,11,12,13]. A critical selective pressure faced by craniofacial structures is trophic niche specialization, with skull morphology directly feeding into biomechanical performance and fitness [14]. These forces shape a complex geometry of the skull, with morphological variation deriving from the cumulative effects of genetics, developmental processes, environmental effects, and functional interactions [15,16,17,18,19,20].
An iconic system for studying morphological variation is cichlid fishes, which have undergone one of the most rapid diversifications in vertebrates [21,22]. The largest radiations of cichlids occurred independently in the African Rift Lakes of Lakes Malawi, Tanganyika, and Victoria, with further radiations occurring throughout smaller lakes and rivers in the African Rift Valley, Central America, and South America [21,23,24,25]. A hallmark of their adaptive radiation is the diversity of craniofacial structures, which are intimately connected to their feeding niche and ecology [2,26,27]. Cichlids, like other teleost fishes, have evolved multiple disparate feeding strategies including suction feeding, biting, and ram feeding, each of which is associated with a suite of phenotypic adaptations [27]. Despite this range of craniofacial morphologies in cichlids, a major ecomorphological axis of variation in cichlids distinguishes two of these strategies, suction feeding and biting [2,28]. On one end of this axis are suction feeders. These animals eat from the water column by generating a high rate of flow into the mouth that overcome any flow in the opposite direction or attempts by mobile prey to swim away [29,30,31,32]. Morphologically, this is accomplished through a large buccal cavity and restricted mouth size that confer an ability to generate pressure differentials in the oral cavity [29,30]. Production of the pressure differential is enhanced through a relatively long mandible that allows quick movements of the jaw [31,33,34,35,36]. Furthermore, large eyes in suction feeders may increase vision to provide an advantage in hunting prey [37], but may also constrain the size of jaw muscles needed for mandible movement [38]. On the alternate end of this morphological spectrum are fishes that feed by scraping/biting attached algae or crushing shelled invertebrates. These fish trade off speed in mandible movements for power with jaw closing, primarily conferred by a shorter lower jaw [31,33,34,35].
Cichlids from independent radiations have undergone similar divergences in craniofacial morphology between fish that suction feed versus bite [28,39,40], and this trend extends more broadly across fishes as well [41,42,43]. This pattern suggests that genetic, developmental, or functional constraints are limiting or biasing the direction of morphological evolution in the skull [44,45,46,47]. Furthermore, specific regions of the face may evolve autonomously as independent modules, or as coordinated units [47]. For example, coordinated changes could be driven by “supergene” regions [48,49,50] or biomechanical demands of ecological niches may cause convergent evolution of form (e.g., [51]). Previous analysis of the strengths and patterns of covariation (i.e., modularity) in cichlid craniofacial structures [52] found that the pre-orbital and post-orbital regions act as independent modules. However, studies in mammals, birds, and the Archosaur group have identified modularity within the skull based on developmental origins [53,54,55] or function and articulation [54,56]. A full understanding of the patterns of morphological variation, as well as the number and effects of genes that underlie these shapes, is necessary to clarify which aspects of head anatomy demonstrate covariation, have increased evolutionary flexibility, or are simpler versus more complex phenotypes.
Here, we use two species of cichlids to investigate the adaptation of craniofacial morphology and the genetic basis of this variation. Both Labidochromis caeruleus and Labeotropheus trewavasae live in rocky habitats of Lake Malawi, but feed by suction feeding and scraping, respectively [26]. Fishes of the Labidochromis genus are typically insectivores that suction feed or pluck their prey from the water column [26]. Alternatively, fishes of the Labeotropheus genus strictly feed by biting algae that is attached to rocky substrates [26]. We had three goals of this study. First, we sought to quantify a series of morphological adaptations in the lateral and ventral craniofacial head anatomy in these species, relating these morphologies to feeding mechanics of these fishes. Second, we aimed to identify the genetic basis underlying these morphologies utilizing quantitative trait loci (QTL) mapping in a population of Labidochromis × Labeotropheus F2 hybrids. The resulting data allowed us to use gene ontology (GO) term analysis of candidate genes to uncover enriched molecular mechanisms and pathways that may influence craniofacial morphological diversity. Third and finally, we sought to determine if these traits are inherited independently or as sets of traits through examination of both morphological and genetic data, with important implications for the direction and patterns of morphological evolution of these craniofacial structures. Overall, these data should elucidate genetic factors that influence diversity in trophic adaptations of the craniofacial skeleton and drive major morphological variation in the skull.

2. Materials and Methods

2.1. Fishes and Pedigree

All work was completed under animal protocol 140-101-O approved by the Institutional Animal Care and Use Committee (IACUC) at North Carolina State University. All animal rearing and breeding described below occurred in laboratory aquatic systems; original stocks were wild caught in Lake Malawi and subsequently bred in the aquarium trade. Lab aquarium conditions were designed to mimic the natural environment of these fishes in Lake Malawi in terms of water quality parameters and substrate in the aquaria to mimic a rocky habitat. Three distinct groups were analyzed for this study. The first group was a set of 10 Labidochromis caeruleus specimens, hereafter referred to Labidochromis parentals as they represent the shape of the granddam used in the cross described below. The second group was a set of Labeotropheus trewavasae specimens, hereafter referred to as Labeotropheus parentals as they represent the shape of the grandsire used in the cross described below. The third set of animals were F2 hybrids generated from a cross between Labidochromis and Labeotropheus, generated as described below. A single Labidochromis female was crossed with a single Labeotropheus male to create one F1 family. These F1 siblings mated with each other to produce a hybrid F2 population of 447 fishes. Fish were reared in lab aquaria under standard feeding with flake food for five months, at which time they were euthanized with buffered MS-222 for morphological analysis. F2 hybrids ranged in weight from 0.35–3.19 g (mean = 1.21 g, standard deviation = 0.47 g). Sex in Lake Malawi cichlids is genetically determined by multiple loci, with the specific interaction dependent on the species [57,58]. In the F2 hybrids, sex was called based on gonad dissection for 354 of the 447 animals, with 92.9% being male. Given this imbalance, specimens were not analyzed separately for males versus females. Lateral and ventral images of each specimen were taken using an Olympus digital camera under standardized lighting conditions in a lightbox. A color standard and scale were included in each picture.

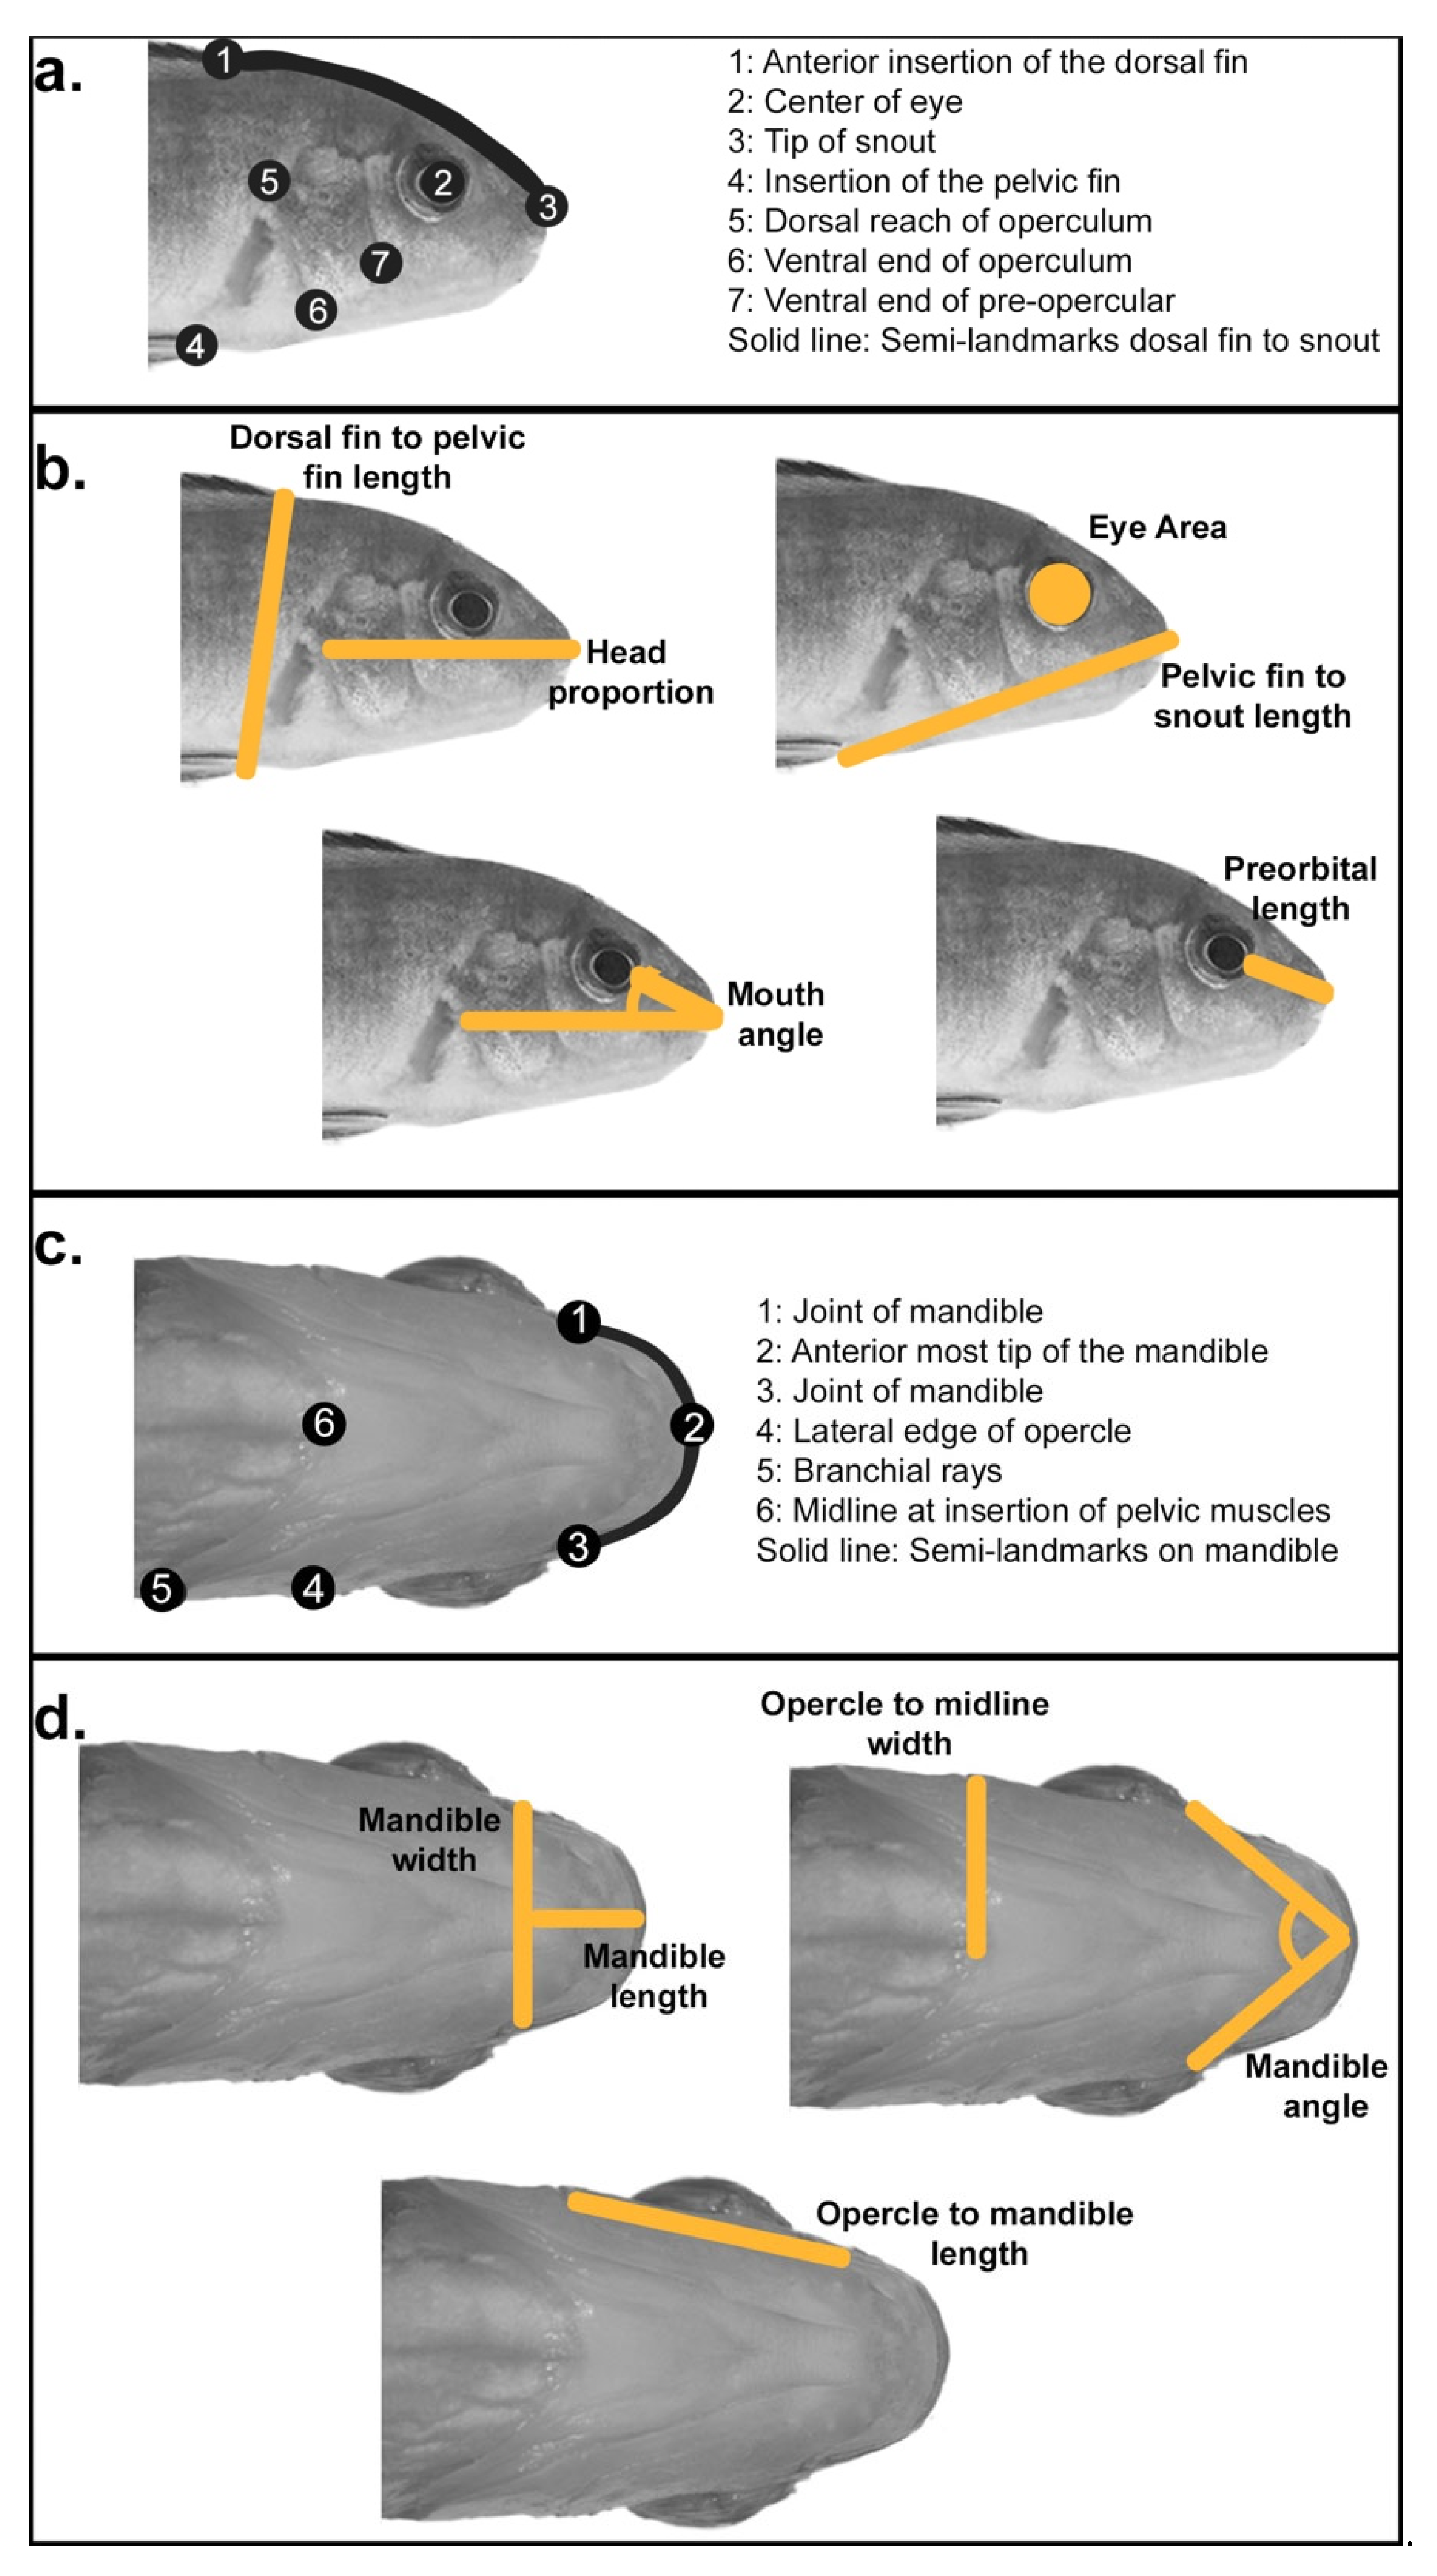
2.2. Linear Measures of Head Shape Variation

Measures were taken from photographs of 10 parental specimens per species of Labidochromis and Labeotropheus, and either 447 F2 hybrids for lateral analysis or 319 F2 hybrids for ventral analysis. From photographs of the lateral body, we measured standard length (snout to caudal peduncle), head length (snout to opercle), head depth (anterior insertion of the dorsal fin to the insertion of the pelvic fin), length from the snout to the insertion of the pelvic fin, preorbital length (snout to anterior edge of the eye), eye diameter, and mouth angle (Figure 1b). Eye area was calculated from eye diameter measurements using the formula π*(diameter/2)2. Measures of the ventral anatomy included mandible width, mandible length, width from the posterior of the opercle to midline, length from the posterior of the opercle to the joint of the mandible and palatoquadrate, and mandible angle (Figure 1d). Measurements were taken using ImageJ software (version 2.0.0) [59,60] as number of pixels and were then converted into centimeters using the scale in each photo. To remove the effects of allometry, all measures were normalized to the standard length of each specimen. After linear regression to standard length measurements, the resulting residual values were used for further analysis. This size correction was carried out on a dataset with both parental species and their hybrids. Statistical analyses were conducted in R (version 3.5.2) [61], including ANOVAs followed by Tukey’s honest significant difference post-hoc tests (Table S1), and Pearson’s correlations (Table S2).

2.3. Geometric Morphometric Shape Analysis

Geometric morphometric shape analysis was used to further quantify head shape variation. A series of homologous landmarks were chosen highlighting lateral and ventral craniofacial anatomy important to feeding mechanics (Figure 1a,c). In both cases, we only analyzed one side of the specimen, avoiding the side in which there were body dissections posterior to the pectoral fins. Landmark positions were recorded from photos using the tpsDig2 software package (version 2.31) [62]. These data were uploaded into the R package geomorph (version 3.1.3) [63], in which Procrustes superimposition was used to remove variation due to size, rotation, and position of landmarks to leave variation only due to shape. As with the linear data, the effects of allometry were removed through size correction and regression of shape on standard length. One step of geometric morphometric analysis is a principal component analysis that reduces dimensionality of the morphological data into principal component (PC) scores. The geometric morphometric analyses described above were conducted on a dataset including both parental species and their hybrids. Statistical significance in overall shape among parentals and hybrids was confirmed by calculating Procrustes distances between mean shapes of the three groups using the procD.lm function in geomorph, followed by pairwise comparisons using the pairwise function in geomorph. Statistical analyses for individual principal component scores were conducted in R (version 3.5.2) [61], including ANOVAs followed by Tukey’s honest significant difference post-hoc tests (Table S1). Statistical strength and patterns of modularity among landmarks was determined using the modularity.test function in geomorph using 9999 iterations, omitting semi-landmarks as these potentially were in more than one module, and a priori landmark groupings based on facial regions, development, and function (further detailed in Figure S4).

2.4. Genotyping with ddRAD Sequencing

Genomic DNA was extracted from caudal fin tissue using DNeasy blood and tissue kits (Qiagen). RADseq libraries were prepared as previously described [64], including double digestion and indexing, then sequenced on Illumina Hiseq with 100 bp paired end reads (North Carolina State University Genomic Sciences Laboratory core facility). The program process_radtags (Stacks, version 2), was used to process raw sequencing data including demultiplexing, truncating reads to 150 bp, and filtering of low-quality reads. Processed reads were aligned to the Maylandia zebra UMD2a reference genome using BWA with the mem algorithm. The programs pstacks, cstacks, and sstacks (Stacks, version 1) were used to identify and catalogue RAD markers in the parental and F2 hybrid samples. Finally, markers with alternative alleles in the parental species were called as AA or BB genotypes using the program genotypes (Stacks, version 1), requiring a minimum stack depth of 3 to export a maker in a specific individual. The A allele was inherited from the Labidochromis granddam and the B allele from the Labeotropheus grandsire.

2.5. Generation of the Linkage Map

The genetic map was generated using the package R/qtl [65] and in-house R scripts available at https://github.com/kpowder/Biology2022 (accessed on 15 June 2022). Markers were first sorted into linkage groups according to their position in the reference genome for another Lake Malawi cichlid, Maylandia zebra, M. zebra UMD2a assembly. Markers were removed from the dataset if they were located on unplaced scaffolds with more than 40% of missing data, or in linkage groups with more than 20% missing data. A chi-square test was performed on the remaining markers using the geno.table function. Those markers with a distorted segregation pattern and a Bonferroni-corrected p-value < 0.01 were discarded from the dataset. The initial map was generated based on estimated pairwise recombination frequencies using est.map and est.rf functions. Markers in linkage groups that were not initially flagged as misplaced were removed if they increased the size of the map by at least six centimorgans (cM) and flanking markers were < 3 Mb apart. Markers that were in unplaced scaffolds were integrated into a linkage group if they had a recombination frequency < 0.15 with at least five markers from that linkage group. Any other markers that were in unplaced scaffolds that did not meet the above criteria were removed. If markers had irregular relationships between their recombination frequency and position in the genetic map, they were rearranged manually to minimize crossover events; these are likely due to being located in structural variants or misassembled sections of the reference genome. Genotyping errors were identified using the function calc.errorlod and set as missing data if they had a LOD score of ≥ 3. The linkage map was refined with a non-overlapping window algorithm that selected one marker in a 2 cM window with the least amount of missing data. Finally, the function est.map was used to estimate the final map and the maximum likelihood estimate of the genotyping error rate (0.0001). The final map was 1239.5 cM in total size, with 22 linkage groups, 1180 total markers, and 42–81 markers per each linkage group.

2.6. Quantitative Trait Loci (QTL) Mapping

We conducted multiple-QTL mapping (MQM) using the R/qtl package [65,66,67] following [68]. Scripts are described and available in [69]. First, an initial scan for QTL was carried out using the onescan function in R/qtl [65]. Putative QTL with a LOD approaching or above 2.5 were used to build a more robust statistical model. The MQM method uses these putative QTL as cofactors in follow-up scans and verifies each cofactor by backward elimination. The use of cofactors in the final model aids in the accurate detection of QTL and assessment of their effects [68]. The statistical significance of each QTL was determined using 1000 permutations on the final model. For QTL peaks meeting 5% (significance) or 10% (suggestive) level, 95% confidence intervals were calculated using Bayes analysis. Details of QTL mapping including cofactors used in the model, significance levels, confidence intervals, and allelic effects are in Table S3. QTL analysis was conducted on both linear and geometric morphometric measures of shape for both lateral and ventral anatomy.

2.7. Candidate Gene Annotation and Enrichment Analysis

Markers are named based on contig and nucleotide positions in the Maylandia zebra reference genome, M. zebra UMD2a assembly. Gene symbols, ID, and chromosomal positions for candidate genes in each QTL interval were retrieved from the NCBI genome data viewer (https://www.ncbi.nlm.nih.gov/genome/gdv (accessed on 15 June 2022)) gene track for M. zebra annotation release 104. If the upper and lower limits of a QTL interval were mapped to unplaced scaffolds, the closest marker that mapped to a placed scaffold was used to determine candidate gene information. Gene names for each candidate were retrieved using the NCBI gene ID and the Database for Visualization and Integrated Discovery (DAVID) [70].
Gene ontology (GO) term enrichment analysis was performed with the functional annotation tool in the Database for Visualization and Integrated Discovery (DAVID) [70,71]. NCBI gene ID (entrez gene ID) for candidate genes in QTL intervals were used as a query. Analysis was run for each individual trait, pooling multiple QTL as applicable, as well as bulk analysis of all lateral QTL and all ventral QTL. A p-value of 0.05 with a Fishers exact probability test was used to denote significance for terms in GO analysis.

3. Results and Discussion

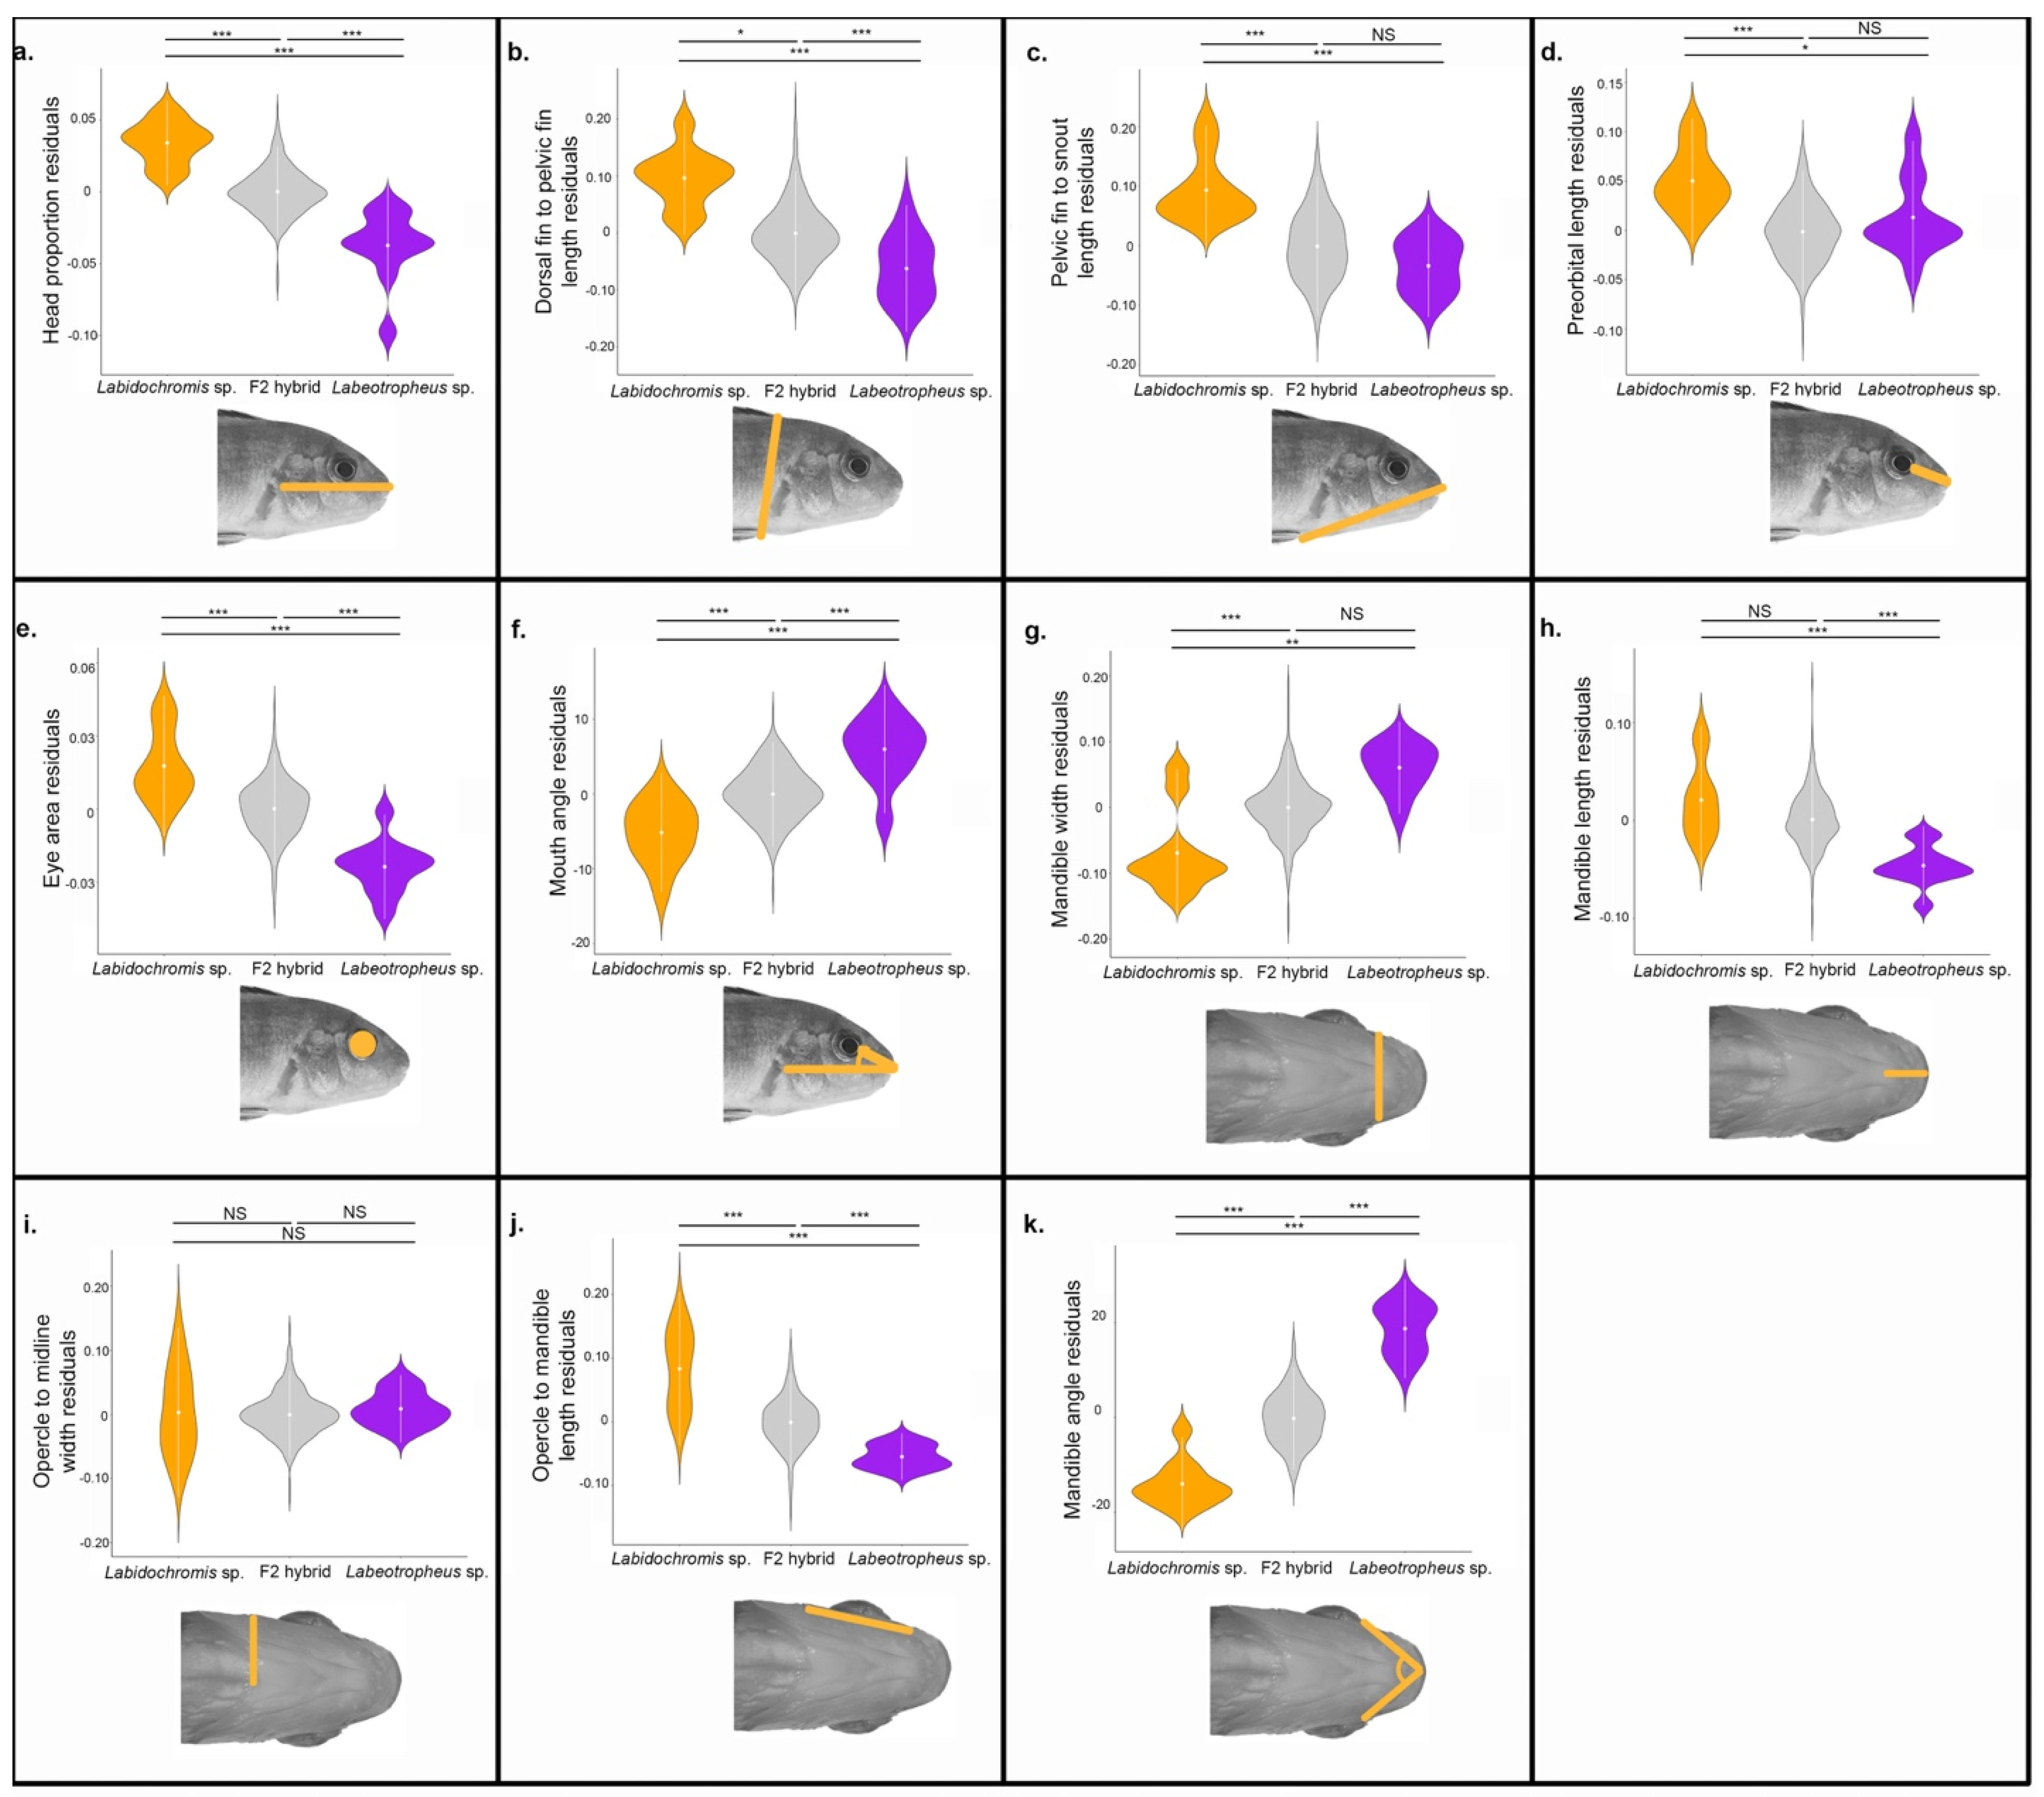
3.1. Lateral Head Shape Variation

Lateral skull shape is distinct between parental species Labidochromis and Labeotropheus for all linear measures (Figure 2a–f and statistics provided in Table S1). Their F2 hybrids are largely intermediate in phenotype, though in some cases such as length of the preorbital region (Figure 2d) surpass the range of the parental species. Labidochromis fish have an overall longer and deeper head than Labeotropheus given a similar body size. Specifically, Labidochromis compared to Labeotropheus parentals have an increased proportion of the body that is the head (p < 1e−7, Figure 2a), a longer distance between the dorsal fin and pelvic fin (p < 1e−7, Figure 2b), and larger eye (p < 1e−7, Figure 2e). Furthermore, the mouth of Labidochromis fish is angled towards the front, rather than towards the ventral side of the body as in Labeotropheus (p < 1e−7, Figure 2f). Finally, Labidochromis showed an increased length between the snout and pelvic fin (p = 2.2e−6, Figure 2c). Coupled with a more modest, though still significant, enlargement of the preorbital region (p = 0.018, Figure 2d), this suggests that the opercular region of Labidochromis fishes is also distinctly larger than in Labeotropheus.
Geometric morphometrics provided more detailed insights into shape differences, including within the opercular region of the head. Global lateral shape is statistically distinct among Labidochromis sp., Labeotropheus sp., and their F2 hybrids when calculated as Procrustes distances between mean shapes for each group (p = 1e−4 for all pairwise comparisons between Labidochromis parentals, Labeotropheus parentals, and F2 hybrids, Figure 3a). Overall, Labeotropheus has a shorter pre-opercle region, opercular region, and dorsally shifted eye than in Labidochromis, leading to a compressed craniofacial region with a steeper profile (Figure 3c).
The first five principal components (PCs) described (75.2% total shape variation [TSV]) in lateral shape (Figure 3a,c and Figure S1). PC1 lateral (22.4% TSV) differentiated the two parental species (p < 1e−7). The Labidochromis species associated with a positive PC1 lateral score that describes a longer head with a more posterior eye placement (Figure 3a,c and Figure S1b). Based on linear measures, this shift in eye position is due to both a larger preorbital region (Figure 2d) and a larger eye area (Figure 2e). As suggested by linear measures, PC1 lateral shape differences show that Labidochromis has a larger opercular region, while the operculum in Labeotropheus only extends about halfway between the eye and insertion of the pelvic fin (Figure 3c). PC2 lateral, PC3 lateral, and PC4 lateral shape were not significantly different between the parentals (p = 0.071, p = 0.99, and p = 0.77, respectively, Table S1) and thus represent shape variation largely present in the F2 hybrids. PC2 lateral (17.2% TSV) predominantly described the relative length of the head, with a negative PC2 lateral score characterizing head anatomy that has a longer profile from snout to dorsal fin and a pelvic fin that is inserted closer to the opercle (Figure S1c). PC3 lateral (13.3% TSV) depicted coordinated changes in both head length and depth, with a negative score representing a deep, short head with a steep craniofacial profile and reduced opercular region (Figure S1d). Notably, a steep craniofacial profile in cichlids (see solid line in Figure 1a) has been associated with an ability for the skull to withstand increased biting forces [72]. PC4 lateral (11.4% TSV) describes differences in the dorsal–ventral depth of the opercular region, as well as the dorsal–ventral positioning of the eye (Figure S1e). Finally, PC5 lateral (11.0% TSV) distinguishes the two parental species (p = 0.012). Labidochromis parentals are associated with a more negative PC5 lateral score and a reduced opercle bone (Figure S1f).

3.2. Ventral Head Shape Variation

Compared to Labeotropheus, Labidochromis parental fish have a decreased mandible width (p < 1e−7, Figure 2g), increased mandible length (p = 4e−7, Figure 2h), and longer length of the opercular region (p < 1e−7, Figure 2j). Mandible angle assesses the relative proportions of the lower jaw, with an increased measure indicating increased width, decreased length, or both, in the case of Labeotropheus (p < 1e−7 compared to Labidochromis, Figure 2k). These shape changes combine with a similar width at the opercle (p = 0.93), Figure 2i), the only measure that was not distinct between parentals. This results in a more triangular ventral shape for Labidochromis and a more rectangular shape for Labeotropheus parentals (Figure 3d).
Relative mandible length and width also dominated geometric morphometric analysis of the ventral skeleton. Overall ventral shape is statistically distinct among Labidochromis sp., Labeotropheus sp., and their F2 hybrids when calculated as Procrustes distances between mean shapes for each group (p = 1e−4 for all pairwise comparisons between Labidochromis parentals, Labeotropheus parentals, and F2 hybrids, Figure 3b). The Labidochromis ventral shape features a narrow mandibular shape, relatively wide opercle region, and overall longer face compared to Labeotropheus (Figure 3d).
The first three ventral principal components cumulatively describe 76.2% TSV in ventral craniofacial anatomy. PC1 ventral describes 43.6% TSV, with the parental species defining the extremes (p < 1e−7, Figure 3b), emphasizing the relevance of this single metric of shape variation on global shape variation between the species. Labidochromis parents are associated with a positive PC1 ventral score and a narrower, arched mandible versus the wide and flat mandible shape of Labeotropheus (Figure 3b,d and Figure S1g). PC2 ventral (18.7% TSV) is also distinct between parentals (p = 8.2e−5, Figure 3b), reflecting the biological relevance of this axis of shape variation. Labidochromis and positive scores are associated with a narrow mandible, increased distance of the opercular region, and pectoral fin musculature shifted to the anterior (Figure S1h). PC3 ventral (13.9% TSV) describes relative mandible length without an accompanying change in the width (Figure S1i) and is not significantly different between Labidochromis and Labeotropheus parentals (p = 0.31).
Combining both lateral and ventral shape variation demonstrates the multiple ways Labidochromis and Labeotropheus have craniofacial biomechanics that are adapted to their feeding niches. Labidochromis sp. pluck or suction feed insects within Lake Malawi [26]. Their longer mandibles (Figure 2h) allow more velocity transmission during jaw movement [35], critical for capturing mobile prey. This is combined with a narrow mandible (Figure 2g) that opens into a longer and wider opercular and buccal region (Figure 2i,j), forming a triangular ventral shape (Figure 3d). The large expansion possible in the buccal cavity of Labidochromis causes high velocity and acceleration of water flowing into the mouth, containing the invertebrate prey; this water flow is increased by a narrow mouth opening (Figure 2g and Figure 3d) [29,73,74]. On the other hand, Labeotropheus sp. are herbivorous grazers that scrape or shear immobile algae from rocks or other substrate using their mandible [26]. The short mandible (Figure 2h) of Labeotropheus represents a tradeoff of speed of jaw movement for high transmission of force with jaw closing [35]. This is combined with a downturned mouth (Figure 2f) and a short, wide, and flat preorbital and mandibular region (Figure 2d,g and Figure 3c,d). Together, these are thought to enhance foraging efficiency for Labeotropheus by providing a large oral area and structures that are used as a fulcrum to leverage attached algae from their substrate [26].

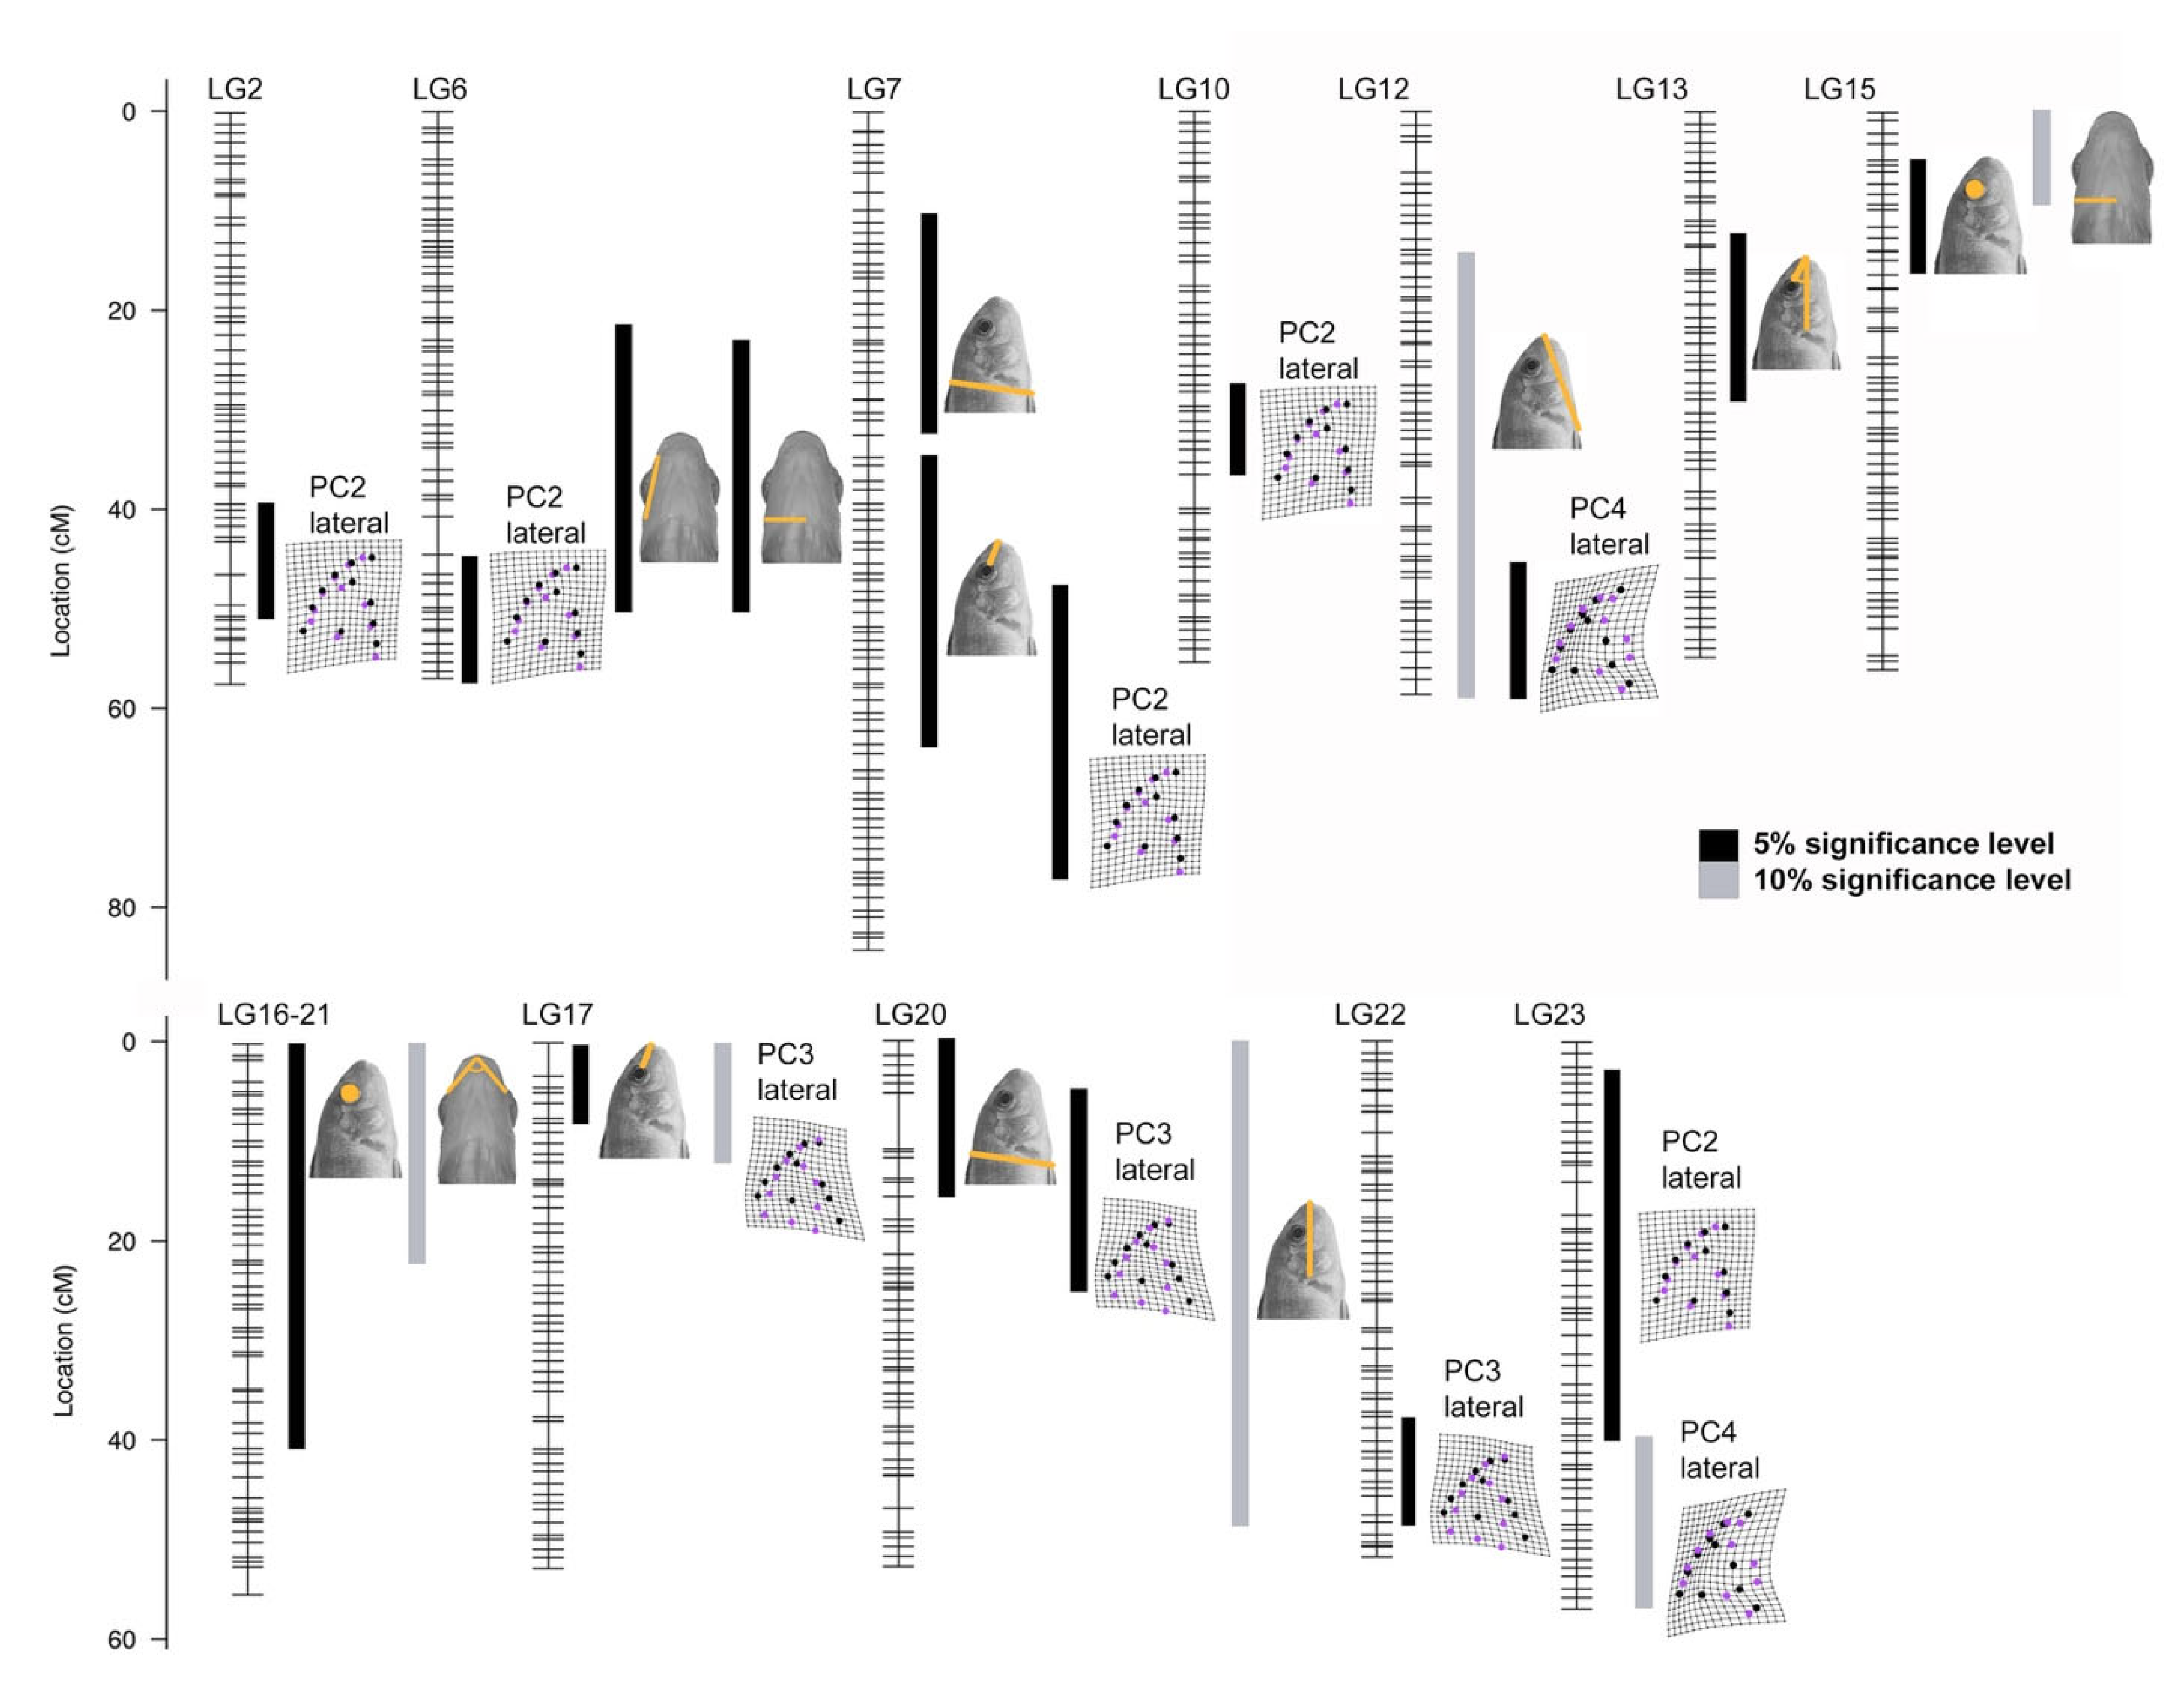
3.3. Genetic Basis of Head Shape

Quantitative trait loci (QTL) mapping was used to assess the genetic architecture that underlie these adaptive morphologies. We mapped 11 lateral and 8 ventral traits including both linear measures of shape (Figure 2) and principal component scores from geometric morphometric analysis (Figure 3 and Figure S1). This identified 23 genetic intervals that contribute to phenotypic differences in head shape in Labidochromis × Labeotropheus hybrids (Figure 4, Figures S2 and S3, and Table S3). Between one and three QTL mapped to 12 of the 22 linkage groups. These QTL explained 3.3–7.0% of the total variation for each trait (Figure S3 and Table S3), indicating that each of these traits is controlled by many genes of small effects. Even for the trait with the most QTL, PC2 lateral shape, the five QTL combine to explain only 23.8% of the total coordinated variation (Figure S3) in head length, craniofacial profile, and pelvic fin insertion (Figure S1c). The allelic effects within this QTL (Figure S3) further suggest a complex genetic architecture, with the allele inherited from the Labidochromis parent contributing to a higher PC2 lateral score for QTL on LG7 and LG10, the Labeotropheus allele associated with a higher value for the QTL on LG2, and heterozygous animals having the largest PC2 lateral score for the QTL on LG6 and LG23. Given that cichlid species continue to segregate and exchange a set of ancestral polymorphisms [75,76,77,78,79], this genetic variation is all likely to contribute to craniofacial divergence and feeding adaptation within the cichlid flock.
While QTL were distributed across linkage groups, seven linkage groups had overlapping QTL intervals (Figure 4 and Table S3). Four of these overlapping regions included a linear measure and a principal component from geometric morphometrics, where the principal component also includes variation in that linear measure. For instance, there are three overlapping QTL intervals on LG20 which describe relative head length, depth of the head from the dorsal fin to the pelvic fin, and PC3 lateral shape (Figure 4). PC3 lateral shape includes major variation in the anterior–posterior length and dorsal–ventral depth of the head (Figure S1d), explaining why these phenotypes map to a common genetic interval. Likewise, preorbital length varies in both PC2 lateral and PC3 lateral shape (Figure S1c,d). QTL for the preorbital region overlap with QTL for PC2 lateral and PC3 lateral on LG7 and LG17, respectively (Figure 4 and Table S3). Finally, the length of the pelvic fin insertion point to the tip of the snout is part of PC4 lateral shape (Figure S1e), and QTL for these traits overlap on LG12 (Figure 4 and Table S3).

3.4. Patterns of Covariation and Modularity

To understand the genetic, developmental, or functional factors that may be limiting morphological variation, we examined the patterns of covariation within our data using three different approaches.
We first examined the degree of covariation among our linear measures of shape. Aside from effects of allometry (i.e., correlation with standard length, Table S2), no phenotypes showed correlation (0.8 < Pearson’s r coefficient < −0.8) with each other in the F2 hybrids. Covariation for each pair of phenotypes ranged from −0.65 to 0.78 with a mean of 0.027 (Table S2). This suggests that the morphological traits are largely inherited as modular units rather than as a set of coordinated phenotypes.
Second, we formally tested patterns of modularity using our geometric morphometric landmarks (Figure S4) and hybrid dataset. For the lateral skeleton, none of our modularity models were significant, with p = 0.273–0.977 for models based on pre/post orbital regions, developmental origins, and function (respiratory versus vision versus feeding). The ventral anatomy had a p-value of 0.0508 for a model assessing pre- versus post-orbital regions, though we note the model cannot differentiate between modules based on these facial regions, developmental origins (anterior versus posterior neural crest streams), and respiratory versus feeding function. While our data could not confirm previous analysis of the cichlid lateral craniofacial anatomy that identified pre-orbital and post-orbital regions acting as independent modules [52] in lateral facial structures, this may be due to the sample size, or the different locations and number of landmarks used.
Finally, we examined the degree to which morphological traits had a common versus distinct genetic basis. A common genetic basis, observed here as overlapping QTL, may also lead to coordinated changes in shape. We noted linkage groups that have overlapping QTL for both lateral and ventral shape variation. LG6 contains a QTL cluster for PC2 lateral shape, opercle-to-mandible length, and opercle-to-midline ventral width (Figure 4 and Table S3). Genetic intervals associated with eye area overlap with opercle-to-midline width on LG15 and mandible angle on LG16-21 (Figure 4 and Table S3); for all these QTL, the allele inherited from Labidochromis increases each of these measurements (Figure S3, Table S3). This common genetic basis, and even sometimes common allelic effects, indicate that a single gene or linked genes in this interval may have pleiotropic effects on feeding adaptations. However, the fact that phenotypes were largely controlled by distinct QTL and showed minimal correlations (Table S2) means that distinct feeding morphologies could theoretically evolve independently and recombine into new patterns. This modular pattern would increase the morphological variability possible in cichlids (i.e., be more evolvable) [47,80,81,82,83]. Despite this, three independent, large-scale radiations of cichlids in the African Rift Lakes have generated animals with comparable trophic specializations that share remarkable similarities in their craniofacial morphologies [28,39,40]. Thus, despite largely being independent in terms of genetic structure, morphological disparity is constrained. Our data suggest this is predominantly due to functional demands of feeding and strong natural selection on feeding performance, rather than a genetic constraint [84,85,86].

3.5. Gene Ontology (GO) Analysis

To begin to understand the trends and molecular pathways enriched in these candidate genes, GO analysis was performed on candidate genes within QTL intervals (Table S4). Members of the Wnt signaling pathway were significantly enriched (p = 0.046, Table S5) for mouth angle including the secreted Wnt antagonist sfrp5 [87,88], the beta-catenin interacting gene lzts2a [89], and the deubiquinitase zranb1, which alters Wnt signaling activity [90,91]. We note this is only a single QTL on LG13. There is a strong relationship between the mouth angle and the steepness of the craniofacial profile (see solid line in Figure 1a), with a shallow profile leading to a narrow mouth angle and jaw facing forward. Alternatively, a steep profile is associated with Labeotropheus sp. [92], an increased mouth angle (Figure 2f), and ventrally angled jaws. Wnt signaling plays a pivotal role in shape of the craniofacial profile, with increased Wnt signaling causing a retention of larval phenotypes and a steep facial profile in cichlids [92,93]. Based on the function of Wnt signaling in craniofacial development across vertebrates, this is likely through alteration of cellular proliferation and outgrowth [4,92,94,95,96] and precocious bone deposition [92,97,98].
Four traits are statistically significant for changes in potassium transport: head proportion (p = 0.018, including various potassium voltage-gated channels such as kcnc4, kcnd3, kcng1, and kcnk15), the distance between the dorsal and pelvic fins (p = 0.018, including kcna1a, kcnc1b, kcnc4, and kcnd3), PC2 lateral shape (p = 0.031, including solute transporters slc9a6a, slc12a2, slc13a2, and slc34a2b), and PC4 lateral shape (p = 0.024, including multiple loci related to sodium/potassium-transporting ATPase subunit alpha-1 and atp1b1b) (Table S5, which has a full list of enriched genes). This common signal for head proportion and dorsal-to-pelvic fin length is likely driven by the fact that these traits have an overlapping QTL on LG20, though the genes included are not entirely overlapping. Furthermore, both PC2 lateral (Figure S1c) and PC4 lateral (Figure S1e) include variation in both of these linear measures. Potassium could have numerous influences on craniofacial morphology as this mineral regulates cell proliferation [99], chondrogenesis [100], osteoclast [101] and osteoblast [100,102] differentiation, and bone mineralization [100,102]. Potassium can also influence pathways critical for facial and bone development such as Bmp signaling [94,100,103], which is also associated with mandibular adaptation in cichlids [35]. Finally, mutation of potassium channels can lead to a series of developmental syndromes that include craniofacial morphologies that mimic evolved variation in cichlids. For example, Andersen–Tawil syndrome is characterized by a broad facial width and mandibular hypoplasia [104,105,106], while Birk–Barel syndrome results in a narrow forehead, micrognathia, and cleft or high-arched palate [105,107] (see Figure 2g–i for comparable phenotypes in cichlids).
It is perhaps unsurprising that eye area was enriched for the GO terms olfaction and sensory transduction (p = 1.25e−6 and p = 5.5e−5, respectively, Table S5), given the common developmental origin of sensory structures [108,109]. However, both mandible angle and a combined analysis of all ventral skeletal morphologies were also enriched for genes associated with these terms (p = 3.1e−4 to p = 2.26e−8, Table S5). These include various olfactory receptors, as well as genes such as cone rhodopsin subunits and myo3b, which mediates mechanosensory neuron response [110]. This may be due to coordinated adaptations for feeding strategies as olfaction and sight are important for identifying mobile prey prior to suction feeding [37,111,112]. However, this may also be due to functional and spatial constraints, wherein a narrow face or large jaw musculature restricts the space available to develop large eyes [38].

3.6. Candidate Genes in QTL Intervals

More work is needed to narrow down and determine the specific effects of candidate genes within QTL intervals (Table S4), for instance through fine mapping of intervals that contain hundreds of genes. That said, we highlight in Table 1 several candidate genes for QTL intervals associated with craniofacial development, such as members of Fgf, Wnt, Bmp, and Hedgehog signaling pathways. We discuss below some of these genes, including potential ways in which these genes may mediate the observed phenotypic variation between Labidochromis and Labeotropheus. We focus this discussion on two genes (ptch1 and crocc2) that have been previously associated with facial variation in cichlids, and two developmental processes (bone remodeling and neural crest cell migration) that highlight the varied ways craniofacial shape can be altered.
Two of our QTL intervals contain genes previously associated with trophic adaptation in cichlid fishes. First is the gene ptch1 on LG12, within the QTL for pelvic fin to snout length. Regulatory variation in ptch1 in cichlids has previously been associated with the relative proportions of the mandible, dermal bone development, and the trade-off between speed and power of jaw movements [113]. The mandible variation regulated by ptch1 includes the length of this bone, which would directly affect the snout length measured here. Ptch1 may also affect facial length through outgrowth at the midline of the face. Hedgehog signaling, including ptch1, is associated with cell survival and coordinated changes in the bones of the upper face and the brain [114,115,116].
Primary cilia are essential for Hedgehog signaling, and the second example is related to a different aspect of cilia function. Primary cilia have been proposed as a critical signaling center for detection of shear stress and mechanotransduction [117]. As cichlids feed by suction feeding or biting (i.e., like Labidochromis and Labeotropheus, respectively), this stimulates bone remodeling and variation in the overall length and profile of the lateral craniofacial shape [92], similar to PC2 lateral variation in this study. The LG23 QTL for PC2 lateral shape includes the gene crocc2, a structural component of primary cilia. In cichlids, coding variation in crocc2 is associated with the ability to have this mechanic response to feeding, as well as with rates of bone deposition [118]. Thus, PC2 lateral shape may at least partially occur through bone remodeling based on feeding biomechanics.
Shape changes in cichlid facial structures may reflect alteration of late developmental events, such as bone remodeling, or early events in craniofacial development. Within the QTL on LG7 for the distance between the dorsal fin and pelvic fin are three components of semaphorin signaling. Members of this signaling pathway—including candidate genes sema3a, sema3d, and sema3e—are critical regulators of migration of neural crest cells, the precursors of much of the facial skeleton [119,120]. In particular, semaphorin activity controls the cell cycle in migratory neural crest cells [121] and their route of migration [122,123,124]. Given the path of neural crest cell migration from the dorsal side of the neural tube to the ventral pharyngeal arches, alteration of semaphorin signaling may result in more or fewer cells in ventral regions and thus affect overall dorsal–ventral length measured here as dorsal fin to pelvic fin length.

4. Conclusions

Craniofacial variation is prodigious across cichlids, with direct impact on feeding strategy and fitness [2,26,27]. Here, we identify the genetic basis for a series of adaptations related to suction feeding versus biting, including overall head proportions, mandible shape, ventral width, and dimensions of the buccal cavity. These phenotypes are not correlated and largely share independent genetic architecture. Our data thus suggest that craniofacial morphologies are likely constrained due to functional demands rather than similar genetics.

Supplementary Materials

The following supporting information can be downloaded at: https://www.mdpi.com/article/10.3390/biology11081165/s1, Figure S1: Shapes indicated by PC scores following geometric morphometric analysis; Figure S2: Genome-wide QTL scans; Figure S3: QTL scans and allelic effects for QTL; Figure S4: Analysis of modularity; Table S1: Statistical significance for phenotypic measures; Table S2: Correlations between all pairs of phenotypic traits in Labidochromis × Labeotropheus F2 hybrids; Table S3: Details of quantitative trait loci (QTL); Table S4: Candidate genes for head shape variation QTL; Table S5: Gene ontology (GO) analysis for enriched processes in candidate genes for QTL.

Author Contributions

K.E.P. and R.B.R. conceptualized the research. A.C.B., P.J.C., E.N.P., C.S. and N.B.R. performed animal husbandry, photography, and collections. N.B.R. prepared sequencing libraries. K.E.P., L.D. and V.D. performed phenotypic measurements. K.E.P., L.D., V.D., A.C.B. and R.B.R. analyzed data. K.E.P. and L.D. wrote the initial paper with edits and review from all authors. K.E.P. and R.B.R. administered the project and acquired funding. All authors have read and agreed to the published version of the manuscript.

Funding

This work was supported by NSF CAREER IOS-1942178 (K.E.P.), NIH P20GM121342 (K.E.P.), NIH R15DE029945 (K.E.P.), NSF IOS-1456765 (R.B.R.), and an Arnold and Mabel Beckman Institute Young Investigator Award (R.B.R.).

Institutional Review Board Statement

The animal study protocol was approved by the Institutional Animal Care and Use Committee (IACUC) of North Carolina State University (protocol 140-101-O initially approved on 22 July 2014).

Informed Consent Statement

Not applicable.

Data Availability Statement

Data are accessible at Dryad https://doi.org/10.5061/dryad.4mw6m90cz (accessed on 15 June 2022). These files include phenotypic measures, TPS files for geometric morphometric analysis, and genotypes used for quantitative trait loci mapping.

Acknowledgments

We thank three anonymous reviewers for useful edits and suggestions that improved this manuscript.

Conflicts of Interest

The authors declare no conflict of interest. Funding sponsors had no role in the design, execution, interpretation, or writing of the study.

References

  1. Evans, K.M.; Waltz, B.; Tagliacollo, V.; Chakrabarty, P.; Albert, J.S. Why the short face? Developmental disintegration of the neurocranium drives convergent evolution in neotropical electric fishes. Ecol. Evol. 2017, 7, 1783–1801. [Google Scholar] [CrossRef]
  2. Powder, K.E.; Albertson, R.C. Cichlid fishes as a model to understand normal and clinical craniofacial variation. Dev. Biol. 2016, 415, 338–346. [Google Scholar] [CrossRef]
  3. McGirr, J.; Martin, C. Few fixed variants between trophic specialist pupfish species reveal candidate cis-regulatory alleles underlying rapid craniofacial divergence. Mol. Biol. Evol. 2021, 38, 405–423. [Google Scholar] [CrossRef]
  4. Brugmann, S.; Powder, K.E.; Young, N.M.; Goodnough, L.H.; Hahn, S.M.; James, A.W.; Helms, J.A.; Lovett, M. Comparative gene expression analysis of avian embryonic facial structures reveals new candidates for human craniofacial disorders. Hum. Mol. Genet. 2010, 19, 920–930. [Google Scholar] [CrossRef] [Green Version]
  5. Grant, P.R.; Grant, B.R. Unpredictable evolution in a 30-year study of Darwin’s finches. Science 2002, 296, 707–711. [Google Scholar] [CrossRef] [PubMed] [Green Version]
  6. Navalón, G.; Marugán-Lobón, J.; Bright, J.A.; Cooney, C.R.; Rayfield, E.J. The consequences of craniofacial integration for the adaptive radiations of Darwin’s finches and Hawaiian honeycreepers. Nat. Ecol. Evol. 2020, 4, 270–278. [Google Scholar] [CrossRef] [PubMed]
  7. Stayton, C.T. Morphological evolution of the lizard skull: A geometric morphometrics survey. J. Morphol. 2005, 263, 47–59. [Google Scholar] [CrossRef] [PubMed]
  8. Sanger, T.J.; Mahler, D.L.; Abzhanov, A.; Losos, J.B. Roles for modularity and constraint in the evolution of cranial diversity among Anolis lizards. Evolution 2011, 66, 1525–1542. [Google Scholar] [CrossRef] [PubMed]
  9. Cardini, A.; Polly, P. Larger mammals have longer faces because of size-related constraints on skull form. Nat. Commun. 2013, 4, 2458. [Google Scholar] [CrossRef] [PubMed]
  10. Porto, A.; Shirai, L.T.; de Oliveira, F.B.; Marroig, G. Size variation, growth strategies, and the evolution of modularity in the mammalian skull. Evolution 2013, 67, 3305–3322. [Google Scholar] [CrossRef]
  11. Schoenebeck, J.J.; Ostrander, E.A. The genetics of canine skull shape variation. Genetics 2013, 193, 317–325. [Google Scholar] [CrossRef] [Green Version]
  12. Sears, K.E. Differences in growth generate the diverse palate shapes of New World leaf-nosed bats (order Chiroptera, family Phyllostomidae). Evol. Biol. 2014, 41, 12–21. [Google Scholar] [CrossRef]
  13. Arbour, J.H.; Curtis, A.A.; Santana, S.E. Signatures of echolocation and dietary ecology in the adaptive evolution of skull shape in bats. Nat. Commun. 2019, 10, 2036. [Google Scholar] [CrossRef] [PubMed] [Green Version]
  14. Arnold, S. Morphology, performance and fitness. Amer. Zool. 1983, 23, 347–361. [Google Scholar] [CrossRef]
  15. Hallgrímsson, B.; Jamniczky, H.; Young, N.M.; Rolian, C.; Parsons, T.E.; Boughner, J.C.; Marcucio, R.S. Deciphering the Palimpsest: Studying the Relationship Between Morphological Integration and Phenotypic Covariation. Evol. Biol. 2009, 36, 355–376. [Google Scholar] [CrossRef] [PubMed] [Green Version]
  16. Hallgrimsson, B.; Mio, W.; Marcucio, R.S.; Spritz, R. Let’s Face It-Complex Traits Are Just Not That Simple. PLoS Genet. 2014, 10, e1004724. [Google Scholar] [CrossRef] [PubMed] [Green Version]
  17. Hochheiser, H.; Aronow, B.J.; Artinger, K.; Beaty, T.H.; Brinkley, J.F.; Chai, Y.; Clouthier, D.; Cunningham, M.L.; Dixon, M.; Donahue, L.R.; et al. The FaceBase Consortium: A comprehensive program to facilitate craniofacial research. Dev. Biol. 2011, 355, 175–182. [Google Scholar] [CrossRef] [PubMed] [Green Version]
  18. Fish, J.; Sklar, R.S.; Woronowicz, K.C.; Schneider, R.A. Multiple developmental mechanisms regulate species-specific jaw size. Development 2014, 141, 674–684. [Google Scholar] [CrossRef] [PubMed] [Green Version]
  19. Glazier, A.M.; Nadeau, J.H.; Aitman, T.J. Finding genes that underlie complex traits. Science 2002, 298, 2345–2349. [Google Scholar] [CrossRef] [PubMed] [Green Version]
  20. Hirschhorn, J.N.; Daly, M.J. Genome-wide association studies for common diseases and complex traits. Nat. Rev. Genet. 2005, 6, 95–108. [Google Scholar] [CrossRef] [PubMed]
  21. Turner, G.F.; Seehausen, O.; Knight, M.E.; Allender, C.J.; Robinson, R.L. How many species of cichlid fishes are there in African lakes? Mol Ecol. 2008, 10, 793–806. [Google Scholar] [CrossRef]
  22. Salzburger, W.; Meyer, A. The species flocks of East African cichlid fishes: Recent advances in molecular phylogenetics and population genetics. Naturwissenschaften 2004, 91, 277–290. [Google Scholar] [CrossRef] [PubMed] [Green Version]
  23. Turner, G.F. Adaptive radiation of cichlid fish. Curr. Biol. 2007, 17, R827–R831. [Google Scholar] [CrossRef] [PubMed] [Green Version]
  24. Elmer, K.R.; Kusche, H.; Lehtonen, T.K.; Meyer, A. Local variation and parallel evolution: Morphological and genetic diversity across a species complex of neotropical crater lake cichlid fishes. Philos. Trans. R. Soc. Lond. B Biol. Sci. 2010, 365, 1763–1782. [Google Scholar] [CrossRef] [Green Version]
  25. Kornfield, I.; Smith, P.F. African cichlid fishes: Model systems for evolutionary biology. Annu. Rev. Ecol. Syst. 2000, 31, 163–196. [Google Scholar] [CrossRef]
  26. Konings, A. Malawi Cichlids in Their Natural Habitat, 5th ed.; Cichlid Press: El Paso, TX, USA, 2016. [Google Scholar]
  27. Liem, K.J. Adaptive significance of intra- and interspecific differences in the feeding repertoires of cichlid fishes. Amer. Zool. 1980, 20, 295–314. [Google Scholar] [CrossRef]
  28. Cooper, W.J.; Parsons, K.; McIntyre, A.; Kern, B.; McGee-Moore, A.; Albertson, R.C. Bentho-pelagic divergence of cichlid feeding architecture was prodigious and consistent during multiple adaptive radiations within African rift-lakes. PLoS ONE 2010, 5, e9551. [Google Scholar] [CrossRef]
  29. Wainwright, P.; Carroll, A.M.; Collar, D.C.; Day, S.W.; Higham, T.E.; Holzman, R.A. Suction feeding mechanics, performance, and diversity in fishes. Integr. Comp. Biol. 2007, 47, 96–106. [Google Scholar] [CrossRef] [PubMed] [Green Version]
  30. Wainwright, P.C.; Day, S.W. The forces exerted by aquatic suction feeders on their prey. J. R. Soc. Interface 2007, 4, 553–560. [Google Scholar] [CrossRef] [PubMed] [Green Version]
  31. Westneat, M.W. Skull biomechanics and suction feeding in fishes. In Fish Biomechanics. Fish Physiology; Shadwick, R., Lauder, G., Eds.; Academic: San Diego, CA, USA, 2005; pp. 29–75. [Google Scholar]
  32. Ferry-Graham, L.A.; Lauder, G.V. Aquatic prey capture in ray-finned fishes: A century of progress and new directions. J. Morphol. 2001, 248, 99–119. [Google Scholar] [CrossRef]
  33. Westneat, M.W. Evolution of levers and linkages in the feeding mechanisms of fishes. Integr. Comp. Biol. 2004, 44, 378–389. [Google Scholar] [CrossRef]
  34. Westneat, M.W. A biomechanical model for analysis of muscle force, power output and lower jaw motion in fishes. J. Theor. Biol. 2003, 223, 269–281. [Google Scholar] [CrossRef]
  35. Albertson, R.C.; Streelman, J.T.; Kocher, T.D.; Yelick, P.C. Integration and evolution of the cichlid mandible: The molecular basis of alternate feeding strategies. Proc. Natl. Acad. Sci. USA 2005, 102, 16287–16292. [Google Scholar] [CrossRef] [Green Version]
  36. Carroll, A.M.; Wainwright, P.C.; Huskey, S.H.; Collar, D.C.; Turingan, R.G. Morphology predicts suction feeding performance in centrarchid fishes. J. Exp. Biol. 2004, 207, 3873–3881. [Google Scholar] [CrossRef] [Green Version]
  37. Meer, H.; van Der, J.; Anker, G.C. Retinal resolving power and sensitivity of the photopic system in seven haplochromine species (Pisces, Teleostei). Neth. J. Zool. 1984, 34, 197–209. [Google Scholar] [CrossRef]
  38. Hulsey, C.D.; Mims, M.C.; Streelman, J.T. Do constructional constraints influence cichlid craniofacial diversification? Proc. R. Soc. B 2007, 274, 1867–1875. [Google Scholar] [CrossRef] [Green Version]
  39. Albertson, R.C.; Markert, J.A.; Danley, P.D.; Kocher, T.D. Phylogeny of a rapidly evolving clade: The cichlid fishes of Lake Malawi, East Africa. Proc. Natl. Acad. Sci. USA 1999, 96, 5107–5110. [Google Scholar] [CrossRef] [Green Version]
  40. Young, K.A.; Snoeks, J.; Seehausen, O. Morphological diversity and the roles of contingency, chance and determinism in african cichlid radiations. PLoS ONE 2009, 4, e4740. [Google Scholar] [CrossRef] [Green Version]
  41. Cooper, W.J.; Westneat, M.W. Form and function of damselfish skulls: Rapid and repeated evolution into a limited number of trophic niches. BMC Evol. Biol. 2009, 9, 24. [Google Scholar] [CrossRef] [Green Version]
  42. Westneat, M.W.; Alfaro, M.E.; Wainwright, P.C.; Bellwood, D.R.; Grubich, J.R.; Fessler, J.L.; Clements, K.D.; Smith, L.L. Local phylogenetic divergence and global evolutionary convergence of skull function in reef fishes of the family Labridae. Proc. Biol. Sci. 2005, 272, 993–1000. [Google Scholar] [CrossRef] [Green Version]
  43. Collar, D.C.; Wainwright, P.C. Ecomorphology of the Centrarchidae. In Centrarchid Fishes: Diversity, Biology and Conservation; Cook, S., Phillipp, D., Eds.; Blackwell Scientific: Cambridge, MA, USA, 2009; pp. 70–89. [Google Scholar]
  44. Arnold, S.J. Constraints on phenotypic evolution. Am. Nat. 1992, 140 (Suppl. S1), S85–S107. [Google Scholar] [CrossRef] [PubMed]
  45. Futuyma, D.J. Evolutionary constraint and ecological consequences. Evolution 2010, 64, 1865–1884. [Google Scholar] [CrossRef] [PubMed]
  46. Smith, J.M.; Burian, R.; Kauffman, S.; Alberch, P.; Campbell, J.; Goodwin, B.; Lande, R.; Raup, D.; Wolpert, L. Developmental Constraints and Evolution: A Perspective from the Mountain Lake Conference on Development and Evolution. Q. Rev. Biol. 1985, 60, 265–287. [Google Scholar] [CrossRef]
  47. Wagner, G.P.; Pavlicev, M.; Cheverud, J.M. The road to modularity. Nat. Rev. Genet. 2007, 8, 921–931. [Google Scholar] [CrossRef]
  48. Thompson, M.J.; Jiggins, C.D. Supergenes and their role in evolution. Heredity 2014, 113, 1–8. [Google Scholar] [CrossRef] [PubMed] [Green Version]
  49. Saenko, S.V.; Chouteau, M.; Piron-Prunier, F.; Blugeon, C.; Joron, M.; Llaurens, V. Unravelling the genes forming the wing pattern supergene in the polymorphic butterfly Heliconius numata. Evodevo 2019, 10, 16. [Google Scholar] [CrossRef] [Green Version]
  50. Reid, K.; Bell, M.A.; Veeramah, K.R. Threespine stickleback: A model system for evolutionary genomics. Annu. Rev. Genom. Hum. Genet. 2021, 22, 357–383. [Google Scholar] [CrossRef] [PubMed]
  51. Fabre, A.-C.; Dowling, C.; Miguez, R.P.; Fernandez, V.; Noirault, E.; Goswami, A. Functional constraints during development limit jaw shape evolution in marsupials. Proc. Biol. Sci. 2021, 288, 20210319. [Google Scholar] [CrossRef] [PubMed]
  52. Parsons, K.J.; Cooper, W.J.; Albertson, R.C. Albertson, Modularity of the oral jaws is linked to repeated changes in the craniofacial shape of african cichlids. Int. J. Evol. Biol. 2011, 2011, 641501. [Google Scholar] [CrossRef] [PubMed] [Green Version]
  53. Newton, A.H.; Weisbecker, V.; Pask, A.J.; Hipsley, C.A. Ontogenetic origins of cranial convergence between the extinct marsupial thylacine and placental gray wolf. Commun. Biol. 2021, 4, 51. [Google Scholar] [CrossRef] [PubMed]
  54. Goswami, A. Cranial modularity shifts during mammalian evolution. Am. Nat. 2006, 168, 270–280. [Google Scholar] [CrossRef]
  55. Felice, R.N.; Goswami, A. Developmental origins of mosaic evolution in the avian cranium. Proc. Natl. Acad. Sci. USA 2018, 115, 555–560. [Google Scholar] [CrossRef] [Green Version]
  56. Felice, R.N.; Watanabe, A.; Cuff, A.R.; Noirault, E.; Pol, D.; Witmer, L.M.; Norell, M.A.; O’Connor, P.M.; Goswami, A. Evolutionary integration and modularity in the Archosaur cranium. Integr. Comp. Biol. 2019, 59, 371–382. [Google Scholar] [CrossRef] [PubMed]
  57. Gammerdinger, W.J.; Kocher, T.D. Unusual diversity of sex chromosomes in African cichlid fishes. Genes 2018, 9, 480. [Google Scholar] [CrossRef] [PubMed] [Green Version]
  58. Ser, J.R.; Roberts, R.B.; Kocher, T.D. Multiple interacting loci control sex determination in lake Malawi cichlid fish. Evolution 2010, 64, 486–501. [Google Scholar] [CrossRef] [Green Version]
  59. Schneider, C.A.; Rasband, W.S.; Eliceiri, K.W. NIH Image to ImageJ: 25 years of image analysis. Nat. Methods 2012, 9, 671–675. [Google Scholar] [CrossRef] [PubMed]
  60. ImageJ Software. Available online: https://imagej.nih.gov/ij/ (accessed on 15 June 2022).
  61. R Core Team. R: A Language and Environment for Statistical Computing. 2021. Available online: https://www.R-project.org/ (accessed on 16 June 2022).
  62. TpsDig2. Available online: https://sbmorphometrics.org/ (accessed on 15 June 2022).
  63. Adams, D.C.; Otarola-Castillo, E. Geomorph: An r package for the collection and analysis of geometric morphometric shape data. Methods Ecol. Evol. 2013, 4, 393–399. [Google Scholar] [CrossRef]
  64. Burford Reiskind, M.O.; Coyle, K.; Daniels, H.V.; Labadie, P.; Reiskind, M.H.; Roberts, N.B.; Roberts, R.B.; Schaff, J.; Vargo, E.L.; Schaff, J. Development of a universal double-digest RAD sequencing approach for a group of non-model, ecologically and economically important insect and fish taxa. Mol. Ecol. Resour. 2016, 16, 1303–1314. [Google Scholar] [CrossRef]
  65. Broman, K.W. A Guide to QTL Mapping with R/qtl; Springer: New York, NY, USA, 2009. [Google Scholar]
  66. Arends, D.; Prins, P.; Jansen, R.C.; Broman, K.W. R/qtl: High-throughput multiple QTL mapping. Bioinformatics 2010, 26, 2990–2992. [Google Scholar] [CrossRef] [Green Version]
  67. Broman, K.W.; Wu, H.; Sen, Ś.; Churchill, G.A. R/qtl: QTL mapping in experimental crosses. Bioinformatics 2003, 19, 889–890. [Google Scholar] [CrossRef] [PubMed] [Green Version]
  68. Jansen, R.C. Controlling the type I and type II errors in mapping quantitative trait loci. Genetics 1994, 138, 871–881. [Google Scholar] [CrossRef]
  69. Powder, K.E. Quantitative Trait Loci (QTL) Mapping. In eQTL Analysis; Methods in Molecular Biology; Shi, X.M., Ed.; Humana: New York, NY, USA, 2020; Volume 2082. [Google Scholar]
  70. Huang, D.W.; Sherman, B.T.; Lempicki, R.A. Systematic and integrative analysis of large gene lists using DAVID bioinformatics resources. Nat. Protoc. 2009, 4, 44–57. [Google Scholar] [CrossRef]
  71. Huang, D.W.; Sherman, B.T.; Lempicki, R.A. Bioinformatics enrichment tools: Paths toward the comprehensive functional analysis of large gene lists. Nucleic. Acids. Res. 2009, 37, 1–13. [Google Scholar] [CrossRef] [PubMed] [Green Version]
  72. Cooper, W.J.; Wernle, J.; Mann, K.; Albertson, R.C. Functional and genetic integration in the skulls of Lake Malawi cichlids. Evol. Biol. 2011, 38, 316–334. [Google Scholar] [CrossRef]
  73. Holzman, R.; Day, S.W.; Mehta, R.S.; Wainwright, P.C. Jaw protrusion enhances forces exerted on prey by suction feeding fishes. J. R. Soc. Interface 2008, 5, 1445–1457. [Google Scholar] [CrossRef] [PubMed] [Green Version]
  74. Van Wassenbergh, S.; Aerts, P. Aquatic suction feeding dynamics: Insights from computational modelling. J. R. Soc. Interface 2009, 6, 149–158. [Google Scholar] [CrossRef] [Green Version]
  75. Moran, P.; Kornfield, I. Retention of ancestral polymorphism in the Mbuna species flock of Lake Malawi. Mol. Biol. Evol. 1993, 10, 1015–1029. [Google Scholar]
  76. Smith, P.F.; Konings, A.; Kornfield, I. Hybrid origin of a cichlid population in Lake Malawi: Implications for genetic variation and species diversity. Mol. Ecol. 2003, 12, 2497–2504. [Google Scholar] [CrossRef] [PubMed]
  77. Nagl, S.; Tichy, H.; Mayer, W.E.; Takahata, N.; Klein, J. Persistence of neutral polymorphisms in Lake Victoria cichlid fish. Proc. Natl. Acad. Sci. USA 1998, 95, 14238–14243. [Google Scholar] [CrossRef] [PubMed] [Green Version]
  78. Loh, Y.H.; Katz, L.S.; Mims, M.C.; Kocher, T.D.; Yi, S.V.; Streelman, J.T. Comparative analysis reveals signatures of differentiation amid genomic polymorphism in Lake Malawi cichlids. Genome Biol. 2008, 9, R113. [Google Scholar] [CrossRef]
  79. Malinsky, M.; Svardal, H.; Tyers, A.M.; Miska, E.A.; Genner, M.J.; Turner, G.F.; Durbin, R. Whole-genome sequences of Malawi cichlids reveal multiple radiations interconnected by gene flow. Nat. Ecol. Evol. 2018, 2, 1940–1955. [Google Scholar] [CrossRef] [Green Version]
  80. Pigliucci, M.; Muller, G.B. Evolution, the Extended Synthesis; MIT Press: Cambridge, MA, USA, 2010. [Google Scholar]
  81. Melo, D.; Porto, A.; Cheverud, J.M.; Marroig, G. Modularity: Genes, development and evolution. Annu. Rev. Ecol. Evol. Syst. 2016, 47, 463–486. [Google Scholar] [CrossRef] [PubMed] [Green Version]
  82. Hendrikse, J.L.; Parsons, T.E.; Hallgrímsson, B. Evolvability as the proper focus of evolutionary developmental biology. Evol. Dev. 2007, 9, 393–401. [Google Scholar] [CrossRef] [PubMed]
  83. Fish, J.L. Evolvability of the vertebrate craniofacial skeleton. Semin. Cell Dev. Biol. 2019, 91, 13–22. [Google Scholar] [CrossRef] [PubMed]
  84. Breuker, C.J.; Debat, V.; Klingenberg, C.P. Functional evo-devo. Trends Ecol. Evol. 2006, 21, 488–492. [Google Scholar] [CrossRef]
  85. Klingenberg, C.P. Evolution and development of shape: Integrating quantitative approaches. Nat. Rev. Genet. 2010, 11, 623–635. [Google Scholar] [CrossRef]
  86. Holzman, R.; Collar, D.C.; Price, S.A.; Hulsey, C.D.; Thomson, R.C.; Wainwright, P.C. Biomechanical trade-offs bias rates of evolution in the feeding apparatus of fishes. Proc. Biol. Sci. 2012, 279, 1287–1292. [Google Scholar] [CrossRef] [PubMed] [Green Version]
  87. Satoh, W.; Matsuyama, M.; Takemura, H.; Aizawa, S.; Shimono, A. Sfrp1, Sfrp2, and Sfrp5 regulate the Wnt/beta-catenin and the planar cell polarity pathways during early trunk formation in mouse. Genesis 2008, 46, 92–103. [Google Scholar] [CrossRef]
  88. Kawano, Y.; Kypta, R. Secreted antagonists of the Wnt signaling pathway. J. Cell Sci. 2003, 116, 2627–2634. [Google Scholar] [CrossRef] [Green Version]
  89. Thyssen, G.; Li, T.H.; Lehmann, L.; Zhuo, M.; Sharma, M.; Sun, Z. LZTS2 is a novel beta-catenin-interacting protein and regulates the nuclear export of beta-catenin. Mol. Cell Biol. 2006, 26, 8857–8867. [Google Scholar] [CrossRef] [PubMed] [Green Version]
  90. Miao, D.; Wang, Y.; Jia, Y.; Tong, J.; Jiang, S.; Liu, L. ZRANB1 enhances stem-cell-like features and accelerates tumor progression by regulating Sox9-mediated USP22/Wnt/beta-catenin pathway in colorectal cancer. Cell Signal 2022, 90, 110200. [Google Scholar] [CrossRef]
  91. Wei, M.; Li, L.; Zhang, Y.; Zhang, M.; Su, Z. Downregulated circular RNA zRANB1 mediates Wnt5a/beta-Catenin signaling to promote neuropathic pain via miR-24-3p/LPAR3 axis in CCI rat models. Gene 2020, 761, 145038. [Google Scholar] [CrossRef] [PubMed]
  92. Parsons, K.J.; Taylor, A.T.; Powder, K.E.; Albertson, R.C. Wnt signalling underlies the evolution of new phenotypes and craniofacial variability in Lake Malawi cichlids. Nat. Commun. 2014, 5, 3629. [Google Scholar] [CrossRef] [PubMed] [Green Version]
  93. Powder, K.E.; Milch, K.; Asselin, G.; Albertson, R.C. Constraint and diversification of developmental trajectories in cichlid facial morphologies. Evodevo 2015, 6, 25. [Google Scholar] [CrossRef] [PubMed] [Green Version]
  94. Liu, B.; Rooker, S.M.; Helms, J.A. Molecular control of facial morphology. Semin. Cell Dev. Biol. 2010, 21, 309–313. [Google Scholar] [CrossRef] [PubMed] [Green Version]
  95. Brugmann, S.A.; Goodnough, L.H.; Gregorieff, A.; Leucht, P.; ten Berge, D.; Fuerer, C.; Clevers, H.; Nusse, R.; Helms, J.A. Wnt signaling mediates regional specification in the vertebrate face. Development 2007, 134, 3283–3295. [Google Scholar] [CrossRef] [Green Version]
  96. Alexander, C.; Piloto, S.; Le Pabic, P.; Schilling, T.F. Wnt signaling interacts with bmp and edn1 to regulate dorsal-ventral patterning and growth of the craniofacial skeleton. PLoS Genet. 2014, 10, e1004479. [Google Scholar] [CrossRef] [PubMed] [Green Version]
  97. Long, F. Building strong bones: Molecular regulation of the osteoblast lineage. Nat. Rev. Mol. Cell Biol. 2011, 13, 27–38. [Google Scholar] [CrossRef]
  98. Zhong, Z.; Ethen, N.J.; Williams, B.O. WNT signaling in bone development and homeostasis. Wiley Interdiscip. Rev. Dev. Biol. 2014, 3, 489–500. [Google Scholar] [CrossRef] [PubMed]
  99. Urrego, D.; Tomczak, A.P.; Zahed, F.; Stühmer, W.; Pardo, L.A. Potassium channels in cell cycle and cell proliferation. Philos. Trans. R. Soc. Lond. B Biol. Sci. 2014, 369, 20130094. [Google Scholar] [CrossRef] [PubMed] [Green Version]
  100. Pini, J.; Giuliano, S.; Matonti, J.; Gannoun, L.; Simkin, D.; Rouleau, M.; Bendahhou, S. Osteogenic and chondrogenic master genes expression is dependent on the Kir2.1 potassium channel through the Bone Morphogenetic Protein pathway. J. Bone. Miner. Res. 2018, 33, 1826–1841. [Google Scholar] [CrossRef]
  101. Grössinger, E.M.; Kang, M.; Bouchareychas, L.; Sarin, R.; Haudenschild, D.R.; Borodinsky, L.N.; Adamopoulos, I.E. Ca(2+)-dependent regulation of NFATc1 via KCa3.1 in inflammatory osteoclastogenesis. J. Immunol. 2018, 200, 749–757. [Google Scholar] [CrossRef] [PubMed] [Green Version]
  102. Yang, J.E.; Song, M.S.; Shen, Y.; Ryu, P.D.; Lee, S.Y. The role of KV7.3 in regulating osteoblast maturation and mineralization. Int. J. Mol. Sci. 2016, 17, 407. [Google Scholar] [CrossRef] [PubMed] [Green Version]
  103. George, L.F.; Isner, T.; Bates, E.A. Ion channels in Bone Morphogenetic Protein signaling. Bioelectricity 2019, 1, 46–48. [Google Scholar] [CrossRef] [PubMed] [Green Version]
  104. Tristani-Firouzi, M.; Etheridge, S.P. Kir 2.1 channelopathies: The Andersen-Tawil syndrome. Pflug. Arch. 2010, 460, 289–294. [Google Scholar] [CrossRef] [PubMed]
  105. Hamilton, M.J.; Suri, M. “Electrifying dysmorphology”: Potassium channelopathies causing dysmorphic syndromes. Adv. Genet. 2020, 105, 137–174. [Google Scholar] [PubMed]
  106. Adams, D.S.; Uzel, S.G.; Akagi, J.; Wlodkowic, D.; Andreeva, V.; Yelick, P.C.; Devitt-Lee, A.; Pare, J.-F.; Levin, M. Bioelectric signalling via potassium channels: A mechanism for craniofacial dysmorphogenesis in KCNJ2-associated Andersen-Tawil Syndrome. J. Physiol. 2016, 594, 3245–3270. [Google Scholar] [CrossRef] [PubMed] [Green Version]
  107. Graham, J.M., Jr.; Zadeh, N.; Kelley, M.; Tan, E.S.; Liew, W.; Tan, V.; Deardorff, M.A.; Wilson, G.N.; Sagi-Dain, L.; Shalev, S.A. KCNK9 imprinting syndrome-further delineation of a possible treatable disorder. Am. J. Med. Genet. A 2016, 170, 2632–2637. [Google Scholar] [CrossRef] [PubMed] [Green Version]
  108. Saint-Jeannet, J.-P.; Moody, S.A. Establishing the pre-placodal region and breaking it into placodes with distinct identities. Dev. Biol. 2014, 389, 13–27. [Google Scholar] [CrossRef] [Green Version]
  109. Lleras-Forero, L.; Streit, A. Development of the sensory nervous system in the vertebrate head: The importance of being on time. Curr. Opin. Genet. Dev. 2012, 22, 315–322. [Google Scholar] [CrossRef] [PubMed]
  110. Desban, L.; Prendergast, A.; Roussel, J.; Rosello, M.; Geny, D.; Wyart, C.; Bardet, P.-L. Regulation of the apical extension morphogenesis tunes the mechanosensory response of microvilliated neurons. PLoS Biol. 2019, 17, e3000235. [Google Scholar] [CrossRef] [PubMed] [Green Version]
  111. Atta, K.I. Morphological, anatomical and histological studies on the olfactory organs and eyes of teleost fish: Anguilla anguilla in relation to its feeding habits. J. Basic App. Zool. 2013, 66, 101–108. [Google Scholar] [CrossRef] [Green Version]
  112. Kasumyan, A.O. The olfactory system in fish: Structure, function, and role in behavior. J. Ichthy 2004, 44, S180. [Google Scholar]
  113. Roberts, R.B.; Hu, Y.; Albertson, R.C.; Kocher, T.D. Craniofacial divergence and ongoing adaptation via the hedgehog pathway. Proc. Natl. Acad. Sci. USA 2011, 108, 13194–13199. [Google Scholar] [CrossRef] [PubMed] [Green Version]
  114. Aoto, K.; Trainor, P.A. Co-ordinated brain and craniofacial development depend upon Patched1/XIAP regulation of cell survival. Hum. Mol. Genet. 2015, 24, 698–713. [Google Scholar] [CrossRef] [Green Version]
  115. Abrams, S.R.; Reiter, J.F. Ciliary Hedgehog signaling regulates cell survival to build the facial midline. Elife 2021, 10, e68558. [Google Scholar] [CrossRef] [PubMed]
  116. Andreu-Cervera, A.; Catala, M.; Schneider-Maunoury, S. Cilia, ciliopathies and hedgehog-related forebrain developmental disorders. Neurobiol. Dis. 2021, 150, 105236. [Google Scholar] [CrossRef] [PubMed]
  117. Yavropoulou, M.P.; Yovos, J.G. The molecular basis of bone mechanotransduction. J. Musculoskelet. Neuronal. Interact. 2016, 16, 221–236. [Google Scholar] [PubMed]
  118. Gilbert, M.C.; Tetrault, E.; Packard, M.; Navon, D.; Albertson, R.C. Ciliary Rootlet Coiled-Coil 2 (crocc2) Is Associated with Evolutionary Divergence and Plasticity of Cichlid Jaw Shape. Mol. Biol. Evol. 2021, 38, 3078–3092. [Google Scholar] [CrossRef] [PubMed]
  119. Santagati, F.; Rijli, F.M. Cranial neural crest and the building of the vertebrate head. Nat. Rev. Neurosci. 2003, 4, 806–818. [Google Scholar] [CrossRef]
  120. Schilling, T.F. Genetic analysis of craniofacial development in the vertebrate embryo. Bioessays 1997, 19, 459–468. [Google Scholar] [CrossRef] [PubMed]
  121. Berndt, J.D.; Halloran, M.C. Semaphorin 3d promotes cell proliferation and neural crest cell development downstream of TCF in the zebrafish hindbrain. Development 2006, 133, 3983–3992. [Google Scholar] [CrossRef] [Green Version]
  122. Yu, H.-H.; Moens, C.B. Semaphorin signaling guides cranial neural crest cell migration in zebrafish. Dev. Biol. 2005, 280, 373–385. [Google Scholar] [CrossRef] [PubMed] [Green Version]
  123. Liu, Z.Z.; Guo, J.; Lu, Y.; Liu, W.; Fu, X.; Yao, T.; Zhou, Y.; Xu, H.A. Sema3E is required for migration of cranial neural crest cells in zebrafish: Implications for the pathogenesis of CHARGE syndrome. Int. J. Exp. Pathol. 2019, 100, 234–243. [Google Scholar] [CrossRef] [PubMed]
  124. Theveneau, E.; Mayor, R. Neural crest migration: Interplay between chemorepellents, chemoattractants, contact inhibition, epithelial-mesenchymal transition, and collective cell migration. Wiley Interdiscip. Rev. Dev. Biol. 2012, 1, 435–445. [Google Scholar] [CrossRef] [PubMed]
Figure 1. Measures used to analyze lateral and ventral head shape. (a,c) Geometric and (b,d) linear measures were used to assess head shape changes with functional implications for feeding biomechanics.
Biology 11 01165 g001
Figure 2. Phenotypic differences among Labidochromis sp., Labeotropheus sp., and their F2 hybrids. Phenotypes measured are indicated by the illustration and include (a) head proportion, measured as head length/standard length, (b) dorsal-to-pelvic fin length, (c) snout-to-pelvic fin length, (d) length of the preorbital region of the head, (e) eye area, (f) mouth angle, (g) mandible width, (h) mandible length, (i) opercle-to-midline width, (j) length from the opercle to the mandible, and (k) angle formed from posterior ends of the mandible to the midline. Significance in violin plots is based on ANOVA analysis followed by Tukey’s HSD (data in Table S1; p-values indicated by * <0.05, ** <0.01, *** <0.005, NS > 0.05).
Biology 11 01165 g002
Figure 3. Geometric morphometric phenotypes among parentals and hybrids. Multivariate analysis of shape quantifies differences in overall morphology in the (a,c) lateral and (b,d) ventral anatomy. Shapes described by each principal component are detailed in the text and visualized in Figure S1. Average shape (c,d) of Labidochromis sp. (orange) and Labeotropheus sp. (purple) based on (a,b) highlights phenotypic variation between alternate feeding strategies.
Biology 11 01165 g003
Figure 4. Quantitative trait loci (QTL) mapping identifies 23 intervals associated with head shape variation in hybrids of Labidochromis and Labeotropheus. Each linkage group (LG, i.e., chromosome) is indicated with genetic markers noted by hash marks. The phenotype related to each QTL region is indicated by illustrations. Black bars are significant at the 5% genome-wide level, while gray bars are suggestive, meeting the 10% genome-wide level. Bar widths indicate 95% confidence interval for the QTL, as calculated by Bayes analysis. QTL scans at the genome and linkage group level are in Figures S2 and S3. Details of the QTL scan including markers and physical locations defining each region are in Table S3.
Biology 11 01165 g004
Table 1. Candidate genes within quantitative trait loci (QTL) intervals. For each interval in Figure 4, we highlight top candidate genes such as transcription factors or components of common developmental signaling pathways. As appropriate, we highlight syndromes that result from mutation of these genes and include craniofacial phenotypes. See Table S4 for a full list of all genes in the interval and text for further explanation of putative roles of some of these genes.
QTL PhenotypeLGNumber of Genes in IntervalCandidate Genes related to Craniofacial Development or Disease
PC2 lateral2117fgf13, zic3
Opercle-to-mandible Length6573fgf8b, fgf20a, p300 (Rubinstein-Taybi syndrome)
Opercle-to-midline width6510fgf8b, fgf20a, p300 (Rubinstein-Taybi syndrome)
PC2 lateral 6193axin2, smarce1
Dorsal–pelvic length7424alx4, hdac10, sema3a, sema3d, sema3e, smad3, smad6, wnt7bb
PC2 lateral7635bmpr1bb, foxd1, lhx6, notch1a, pax8, smad4a, smad7, tbx3a
Preorbital length7702apc, bmp1, bmp10-like, lhx6, nodal2, fgfr1a, smad2, smad4a, smad7, pax8, tbx3a, tbx5a, tcf4
PC2 lateral10149fgf1, fgf13b, spry4, tcf7
Pelvic–snout length12782bmp3, fgf10, fgf5, foxd4, lhx6b, ptch1, smarcad1, tbx5
PC4 lateral12246dlx5a, dlx6a, hoxa gene cluster, smarcc1b, sp8a, twist1a
Mouth angle13300dkk1, grem2a, pax2a, sufu, wnt8b
Eye area15158bmp2, dll4, med23
Opercle-to-midline width1510fzd3a
Eye area16824acvr1, acvr1c, bbs5 (Bardet-Biedl ciliopathy), dlx1a, dlx2a, epha3, evx2, frzb, fzd5, hoxd gene cluster, pou3f3 (Williams–Beuren syndrome), satb2, shox, tbx15, tgfbr2l, zic2 (Holoprosencephaly), zic5
Mandible angle16504frzb, fzd5, pou3f3 (Williams–Beuren syndrome), satb2, shox, tbx15, tgfbr2l, zic2 (Holoprosencephaly), zic5
PC3 lateral17248dkk2
Preorbital length173ephrin type-B receptor 1-B
Head proportion20972alx3, hes4, hoxC gene cluster, irx7, wnt1, wnt10b, wnt2ba, wnt5a, wnt7a
Dorsal–pelvic length20351alx3, hes4, hoxC gene cluster, wnt1, wnt10b, wnt2ba, wnt5a
PC3 lateral20226hes4
PC3 lateral22246col1a2, dlx5, dlx6, hoxA gene cluster, smarcc1b
PC2 lateral23556crocc2, fgf22, foxd2, lhx8, notch2, prdm5, tgfbr3
PC4 lateral23683acvr2a, bmpr2, fgf14, spry2, zeb2 (Mowat-Wilson neurocristopathy)
Publisher’s Note: MDPI stays neutral with regard to jurisdictional claims in published maps and institutional affiliations.

