Article

Development of a Rapid Method to Assess Beer Foamability Based on Relative Protein Content Using RoboBEER and Machine Learning Modeling

by
Claudia Gonzalez Viejo
1,*,
Christopher H. Caboche
2,
Edward D. Kerr
2,
Cassandra L. Pegg
2,
Benjamin L. Schulz
2,
Kate Howell
1 and
Sigfredo Fuentes
1
1
School of Agriculture and Food, Faculty of Veterinary and Agricultural Sciences, University of Melbourne, Parkville, VIC 3010, Australia
2
School of Chemistry and Molecular Biosciences, The University of Queensland, St. Lucia, QLD 4072, Australia
*
Author to whom correspondence should be addressed.
Beverages 2020, 6(2), 28; https://doi.org/10.3390/beverages6020028
Submission received: 18 March 2020 / Revised: 1 April 2020 / Accepted: 21 April 2020 / Published: 3 May 2020
(This article belongs to the Special Issue Beer Quality and Flavour)

Abstract

:
Foam-related parameters are associated with beer quality and dependent, among others, on the protein content. This study aimed to develop a machine learning (ML) model to predict the pattern and presence of 54 proteins. Triplicates of 24 beer samples were analyzed through proteomics. Furthermore, samples were analyzed using the RoboBEER to evaluate 15 physical parameters (color, foam, and bubbles), and a portable near-infrared (NIR) device. Proteins were grouped according to their molecular weight (MW), and a matrix was developed to assess only the significant correlations (p < 0.05) with the physical parameters. Two ML models were developed using the NIR (Model 1), and RoboBEER (Model 2) data as inputs to predict the relative quantification of 54 proteins. Proteins in the 0–20 kDa group were negatively correlated with the maximum volume of foam (MaxVol; r = −0.57) and total lifetime of foam (TLTF; r = −0.58), while those within 20–40 kDa had a positive correlation with MaxVol (r = 0.47) and TLTF (r = 0.47). Model 1 was not as accurate (testing r = 0.68; overall r = 0.89) as Model 2 (testing r = 0.90; overall r = 0.93), which may serve as a reliable and affordable method to incorporate the relative quantification of important proteins to explain beer quality.

1. Introduction

Foam is an important attribute to determine beer quality as it is related to its chemical composition and directly affects the sensory descriptors, such as aroma release, color, and mouthfeel [1,2]. Proteins are an essential component for foamability and foam stability because they act as surfactant substances, which are able to reduce the interfacial tension and increase the viscosity and elasticity of the liquid [3,4]. This is due to the hydrophilic and hydrophobic properties of their structure. When proteins unfold at the bubble interphase, the hydrophobic molecules make contact with the air and the hydrophilic stay in the liquid phase; this promotes the development of a layer in the interface and increases the stability of foam [4,5,6]. Furthermore, proteins, along with polyphenols, are responsible for chill haze formation; this happens when the beer is cooled at temperatures <0 °C and is the result of protein aggregation and oxidized flavonoids [7,8].
Some of the traditional methods that have been used to assess the beer proteome include gel-free top-down analysis of intact proteins with high-resolution instruments based on Fourier transform ion cyclotron resonance and the bottom-up strategies, which identify the peptides after enzymatic digest, which is usually performed using trypsin [9]. Other methods that have been used in beer are two-dimensional (2-D) gel electrophoresis, coupled with mass spectrometry [10,11], high-performance liquid chromatography (HPLC) [12], enzyme-linked immunosorbent assay (ELISA) [9], matrix-assisted laser desorption/ionization mass spectrometry (MALDI-TOF MS) [13], and liquid-chromatography mass-spectroscopy (LC-MS) [14,15]. However, these techniques often require expensive equipment, consumables for every test, a large laboratory space, personnel with specialized training, and are often time-consuming.
Emerging techniques derived from artificial intelligence, such as machine learning, robotics, and computer vision, have been used in the food and beverage industries to overcome most of the drawbacks of traditional methods to assess different components in food products and beverages. Some examples of these are the use of a robotic pourer along with computer vision to evaluate 15 physical parameters (color, foam, and bubbles) in beer using a 5-min video [1,16], and the use of low-cost electronic noses along with machine learning to assess aromas and alcohol content in brewages as an alternative method to gas chromatography-mass spectrometry [17,18], among others. However, there are no known publications proposing affordable and rapid methods to assess proteomics or related parameters using any of the emerging techniques mentioned.
This study aimed to assess the role of relative proteins and their molecular weight pattern for different beer samples and to construct a machine learning model to predict the relative pattern quantification of those proteins as well as their effect on foamability and beer quality. To achieve this, significant correlations (p < 0.05) between the identified proteins grouped by molecular weight and physical parameters (color, foam, and bubbles) measured using an automatic pourer (RoboBEER; The University of Melbourne, Melbourne, Vic, Australia) were assessed. Furthermore, all samples were measured using a near-infrared (NIR) portable device to obtain their chemical fingerprinting in the 1600–2400 nm range. Two machine learning models were constructed and compared to predict the relative quantification of 54 proteins identified in the beer samples (i) using the absorbance values of the chemical fingerprinting as inputs for Model 1, and (ii) using the physical parameters (color, foam, and bubbles) as inputs for Model 2.

2. Materials and Methods

2.1. Samples Description

A total of 24 beers from various types and countries (Table 1) were used for this study to ensure a broad range of protein profiles were analyzed. Samples were also selected from three fermentation types, (i) spontaneous, (ii) bottom, and (iii) top, as these have different foaming characteristics and, therefore, a distinct chemical composition. Replicate bottles (N = 3) of each beer were analyzed.

2.2. Proteomics Description

2.2.1. Sample Preparation

Samples were prepared as detailed by Kerr et al. [19]. To desalt proteins by precipitation, 50 µL of each sample was added to 1 mL of 1:1 methanol/acetone and incubated at −20 °C for 16 h. Precipitated proteins were centrifuged at room temperature at 18,000 rcf for 10 min, the supernatant was discarded, and proteins resuspended in 100 µL of 100 mM ammonium acetate, 10 mM dithiothreitol (DTT), and 1 µg trypsin (Proteomics grade, Sigma-Aldrich, St. Louis, MO, USA). Proteins were digested by incubation at 37 °C for 16 h. Trypsin was added at equal amounts to all samples to allow normalization of the relative protein abundance. SWATH-MS was implemented as described below, using triplicates to reduce retention time variation and improve data quality.

2.2.2. Mass Spectrometry

Peptides were desalted with C18 ZipTips (Millipore) and analyzed by liquid chromatography-electrospray ionization tandem mass spectrometry (LC-ESI-MS/MS) using a Prominence nanoLC system (Shimadzu Corporation, Kyoto, Japan) and TripleTof 5600 instrument with a Nanospray III interface (SCIEX, Mulgrave, Victoria, Australia) essentially as previously described by Xu et al. [20]. Approximately, 2 µg or 0.4 µg of desalted peptides, as estimated by the ZipTip binding capacity, were injected for data-dependent acquisition (DDA) or data-independent acquisition (DIA), respectively. LC parameters were identical for DDA and DIA, and LC-MS/MS was performed essentially as previously described by Zacchi and Schulz [21]. Peptides were separated on a VYDAC EVEREST reversed-phase C18 HPLC column (300 Å pore size, 5 µm particle size, 150 µm i.d. × 150 mm) at a flow rate of 1 µL/min with buffer A (1% acetonitrile and 0.1% formic acid) and buffer B (80% acetonitrile with 0.1% formic acid) using a gradient of 10–60% buffer B over 48 min, for a total run time of 70 min per sample. Gas and voltage settings were adjusted as required. For DDA analyses, an MS TOF scan from m/z of 350–1800 was performed for 0.5 s followed by DDA of MS/MS in high sensitivity mode with automated CE selection of the top 20 peptides from m/z of 100–1800 for 0.05 s per spectrum and dynamic exclusion of peptides for 5 s after 2 selections. Identical LC conditions were used for DIA SWATH, with an MS-TOF scan from an m/z of 350–1800 for 0.05 s followed by high-sensitivity DIA of MS/MS from m/z of 100–1800 with 26 m/z isolation windows with 1 m/z window overlap each for 0.1 s across an m/z range of 400–1250. The collision energy was automatically assigned by the Analyst software (SCIEX, Mulgrave, Victoria, Australia) based on the m/z window ranges.

2.2.3. Proteomics Data Analysis

Peptides and proteins were identified using ProteinPilot 5.1 (SCIEX, Mulgrave, Victoria, Australia), searching against all eukaryotic proteins in UniProtKB (downloaded 14 June 2018; 557485 total entries), with settings: sample type, identification; instrument, TripleTof 5600; species, none; ID focus, biological modifications; enzyme, trypsin; search effort, thorough ID. The results from ProteinPilot were used as an ion library to measure the abundance of peptides and proteins using PeakView 2.1 (SCIEX, Mulgrave, Victoria, Australia), with settings: shared peptides, allowed; peptide confidence threshold, 99%; false discovery rate, 1%; XIC extraction window, 6 min; XIC width, 75 ppm. PeakView output was reformatted with a Python script (Python Software Foundation, Wilmington, DE, USA) that also applied a peptide FDR cut-off of 1% to remove low-quality ion measurements for that peptide from each sample (https://github.com/bschulzlab/reformatMS). For protein-centric analyses, protein abundances were normalized to the sum of all protein intensities in a sample, as previously described [22].

2.3. Physical Parameters (Color, Foam, and Bubbles)—RoboBEER

The beer samples were evaluated with an automatic pourer (RoboBEER) to get the physical parameters (color, foam, and bubbles). This robot is able to automatically and constantly pour 80 ± 10 mL of the sample while being recorded for 5 min using a smartphone camera. Furthermore, it is integrated with an ethanol gas MQ3 (Henan Hanwei Electronics Co., Ltd., Zhengzhou, China) and carbon dioxide (CO2; MG811; Henan Hanwei Electronics Co., Ltd., China) sensors that record values in real-time during the pouring and video recording, as well as an infrared temperature sensor MLX90614 (Melxis NV, Ieper, Belgium) to make sure all the beers are evaluated at similar conditions. Furthermore, the videos were analyzed with computer vision algorithms developed in Matlab® R2019b (Mathworks Inc., Natick, MA, USA) to obtain the maximum volume of foam (MaxVol), lifetime of foam (LTF), total lifetime of foam (TLTF), foam drainage (FDrain), color in both CIELab and RGB scales, and bubble size distribution grouped as small (SmBubb), medium (MedBubb), and large (LgBubb). A more detailed description of the technique may be obtained in the papers published by Gonzalez Viejo et al. [1,23,24,25].

2.4. Near-Infrared Analysis

A portable NIR device microPHAZIR™ (RX Analyzer; Thermo Fisher Scientific, Waltham, MA, USA) was used to evaluate the samples. This device can read the NIR spectra within the 1600–2400 nm range, recording a value every 7–9 nm. A Whatman® filter paper (Whatman plc. Maidstone, UK; qualitative grade 3, 7.0 cm) was submerged in each of the beer samples (20–23 °C) to be measured by placing a white background in the top to avoid signal noise from the environment. Then, a dry filter paper was read to subtract the values from the sample results and eliminate the cellulose present in the paper. Three readings from each bottle of each sample were recorded and averaged to reduce variability. This method was validated by Gonzalez Viejo et al. [6].

2.5. Statistical Analysis

An ANOVA was conducted for the protein values to assess significant differences (p < 0.05) between samples using XLSTAT software (Addinsoft Inc. New York, NY, USA). Furthermore, a correlation matrix was developed using an algorithm developed in Matlab® R2019b to assess the significant correlations (p < 0.05) between the physical parameters (color, foam, and bubbles) and the identified proteins categorized into five groups based on their molecular weight (MW; 0–20 kDa, 20–40 kDa, 40–60 kDa, 60–80 kDa and >80 kDa).
Two artificial neural network (ANN) regression models were constructed using a Matlab® R2019b code to test in a loop 17 different training algorithms. The best models based on the best performance, correlation coefficients, and no signs of overfitting were obtained using the Bayesian regularization algorithm. Model 1 consisted of using the absorbance values obtained with NIR within the 1600–2400 nm spectra as inputs, while Model 2 was constructed with the 15 physical parameters (color, foam, and bubbles); both models were used to predict the relative quantification of 54 proteins found in the beer samples (Table 2). For both models, samples were divided using a random data division (dividerand) algorithm as 70% for the training stage, and 30% for testing using a performance algorithm based on mean squared error (MSE). As shown in Supplementary Material (Figure S1), the models consisted of a feedforward network with two layers, a tan-sigmoid and a linear transfer function for the hidden and output layers, respectively. Furthermore, a trimming exercise was performed using 3, 5, and 10 neurons to assess the best performance, with 10 being the most accurate and with no overfitting.

3. Results and Discussion

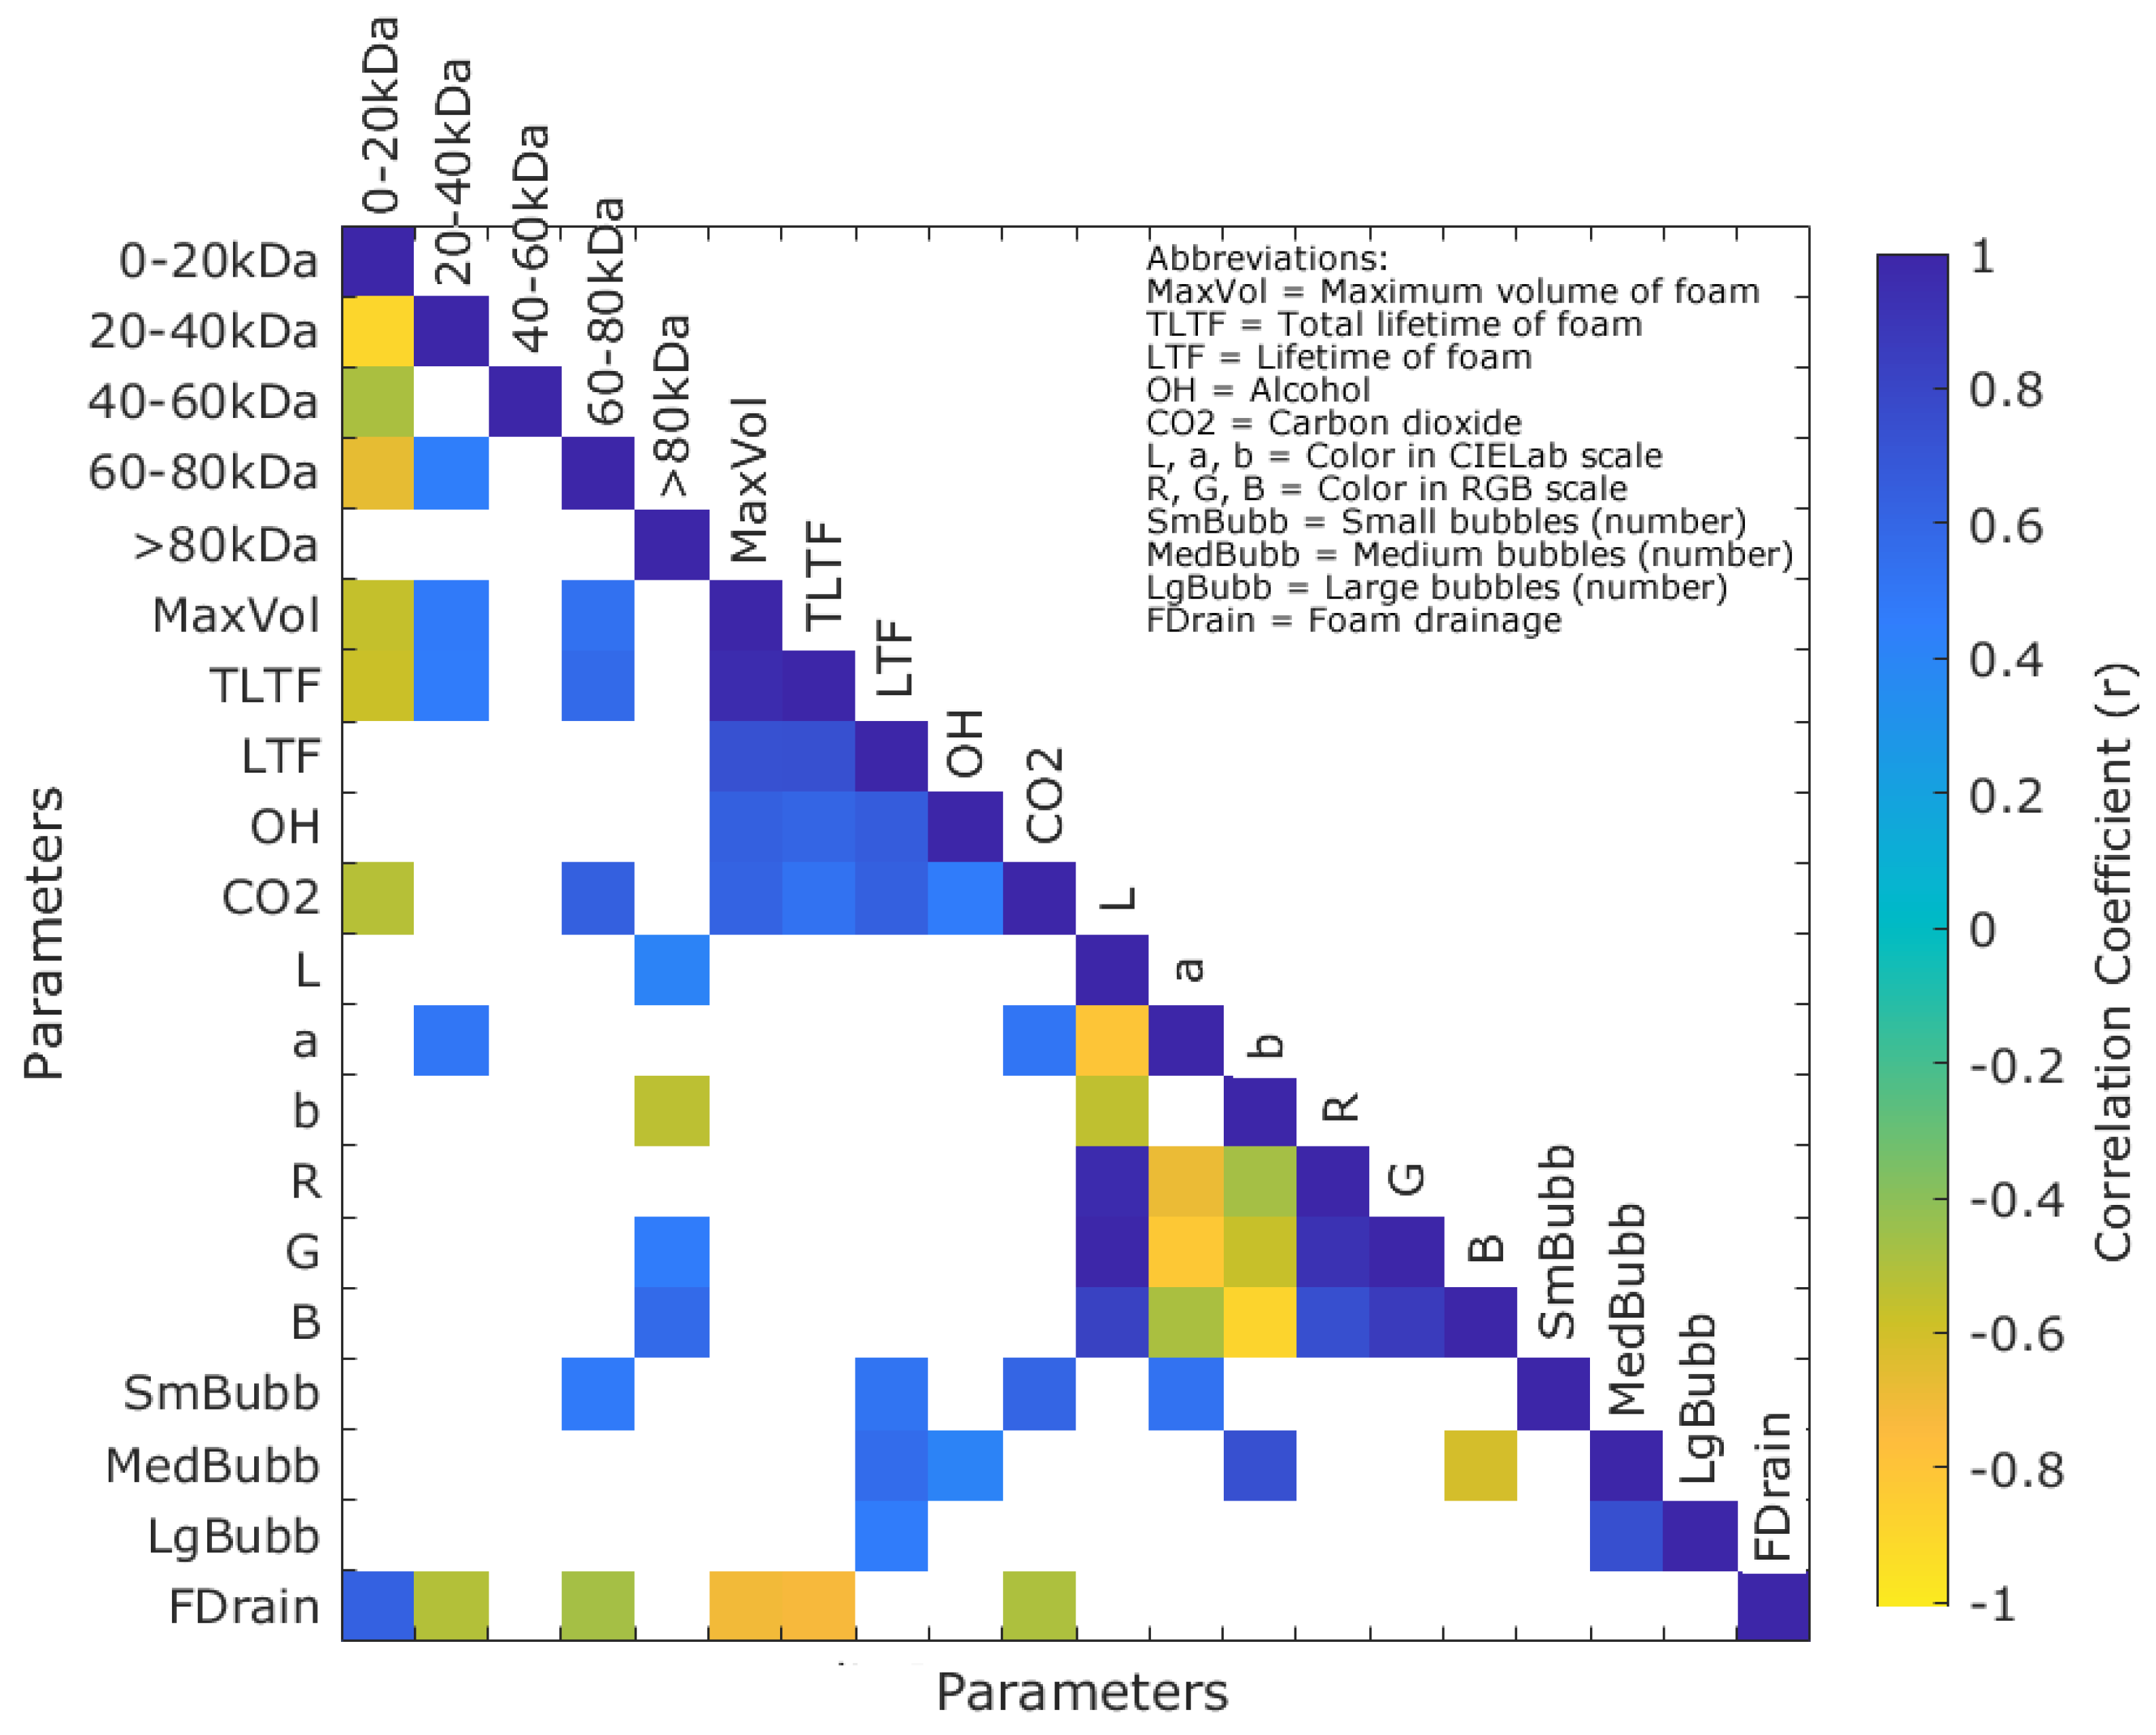
3.1. Physicochemical Measurements (Proteomics, RoboBEER, and NIR)

The analysis results showed that 150 proteins were found in the beers, the origins of most of these are cereals (barley, wheat, and maize) and yeast mainly from Saccharomyces cerevisiae and Schizosaccharomyces pombe. Specific proteins, such as LTP1, enolase 2, γ-hordein-1, γ-hordein-3, B1-hordein, avenin-like a3, Barwin, alpha-amylase/trypsin inhibitor CMb, and proteins Z4 and Z7, which are characteristic of beer [13,26,27], were found in all samples (Table S1).
The ANOVA results showed that there were significant differences (p < 0.05) between samples in 136 out of 150 proteins identified in the beers (data not shown). Regarding the NIR measurements, all beers presented the highest peak at 1940 nm (Figure S2) in which the water overtone is found [28]. Even though all beers had a similar trend up to 2200 nm, the different samples vary from 2200 to 2400 nm, at which most proteins and carbohydrates are detected [29]. These differences found in proteins with both the proteomics and NIR methods are due to the variations in the raw material, type of fermentation, and production process, which produce a different composition in the distinct beer styles.
Figure 1 shows the correlations (p < 0.05) between the physical parameters (color, foam, and bubbles) and the 150 proteins grouped by MW. It can be observed that proteins with MW within 0–20 kDa were negatively correlated with MaxVol (r = −0.57), TLTF (r = −0.58), and CO2 (r = −0.52), and positively correlated with FDrain (r = 0.62). Proteins in the 20–40 kDa group had a positive correlation with “a” from the CIELab color scale (r = 0.49), MaxVol (r = 0.47), and TLTF (r = 0.47), and a negative correlation with FDrain (r = −0.51). Those proteins with MW between 40 and 60 kDa did not have any significant correlations with any of the parameters, while the 60–80 kDa group was negatively correlated with FDrain (r = −0.48) and positively correlated with SmBubb (r = 0.47), CO2 (r = 0.64), TLTF (r = 0.57), and MaxVol (r = 0.53). On the other hand, the proteins above 80 kDa had a positive correlation with “G” (r = 0.46) and “B” (r = 0.57) from the RGB color scale and “L” (r = 0.42), and a negative correlation with “b” (r = −0.54) from the CIELab scale.
It is well known that the proteins associated with foamability and foam stability are mainly the LTP1 (MW 12 kDa), proteins Z4 (MW 43 kDa), and Z7 (MW 43 kDa), and hordeins (MW 30–35 kDa) [2,30,31,32]. However, their correlation with foaming parameters varies according to different studies, Lusk et al. [33] found that LTP1 increased foam stability; however, Evans et al. [34,35] observed that LTP1 and protein Z7 did not present a correlation with foam stability. The latter was also observed in this study, as no correlation was found between the foam parameters and the proteins within 40–60 kDa. As previously mentioned, in the present study, proteins with low MW (0–20 kDa), in which LTP1 is categorized (Table S1), had a negative correlation with MaxVol and TLTF, but a positive correlation with FDrain. This may be owing to the capacity of LTP1 to bind lipids, which contributes to the differences in its influence in foam [30]. Furthermore, no positive effect of LTP1 on foamability for high-carbonated beers has been reported [35]. Hordeins are within the 20–40 kDa MW group (Table S1), which was positively correlated with MaxVol and TLTF; this confirms that these proteins may promote foam formation and stability. Proteins with higher MW (60–80 kDa) presented similar results to the 20–40 kDa group, although there are no known published studies identifying this positive correlation; however, in the present study, it was shown to contribute to smaller bubbles in the foam (SmBubb).

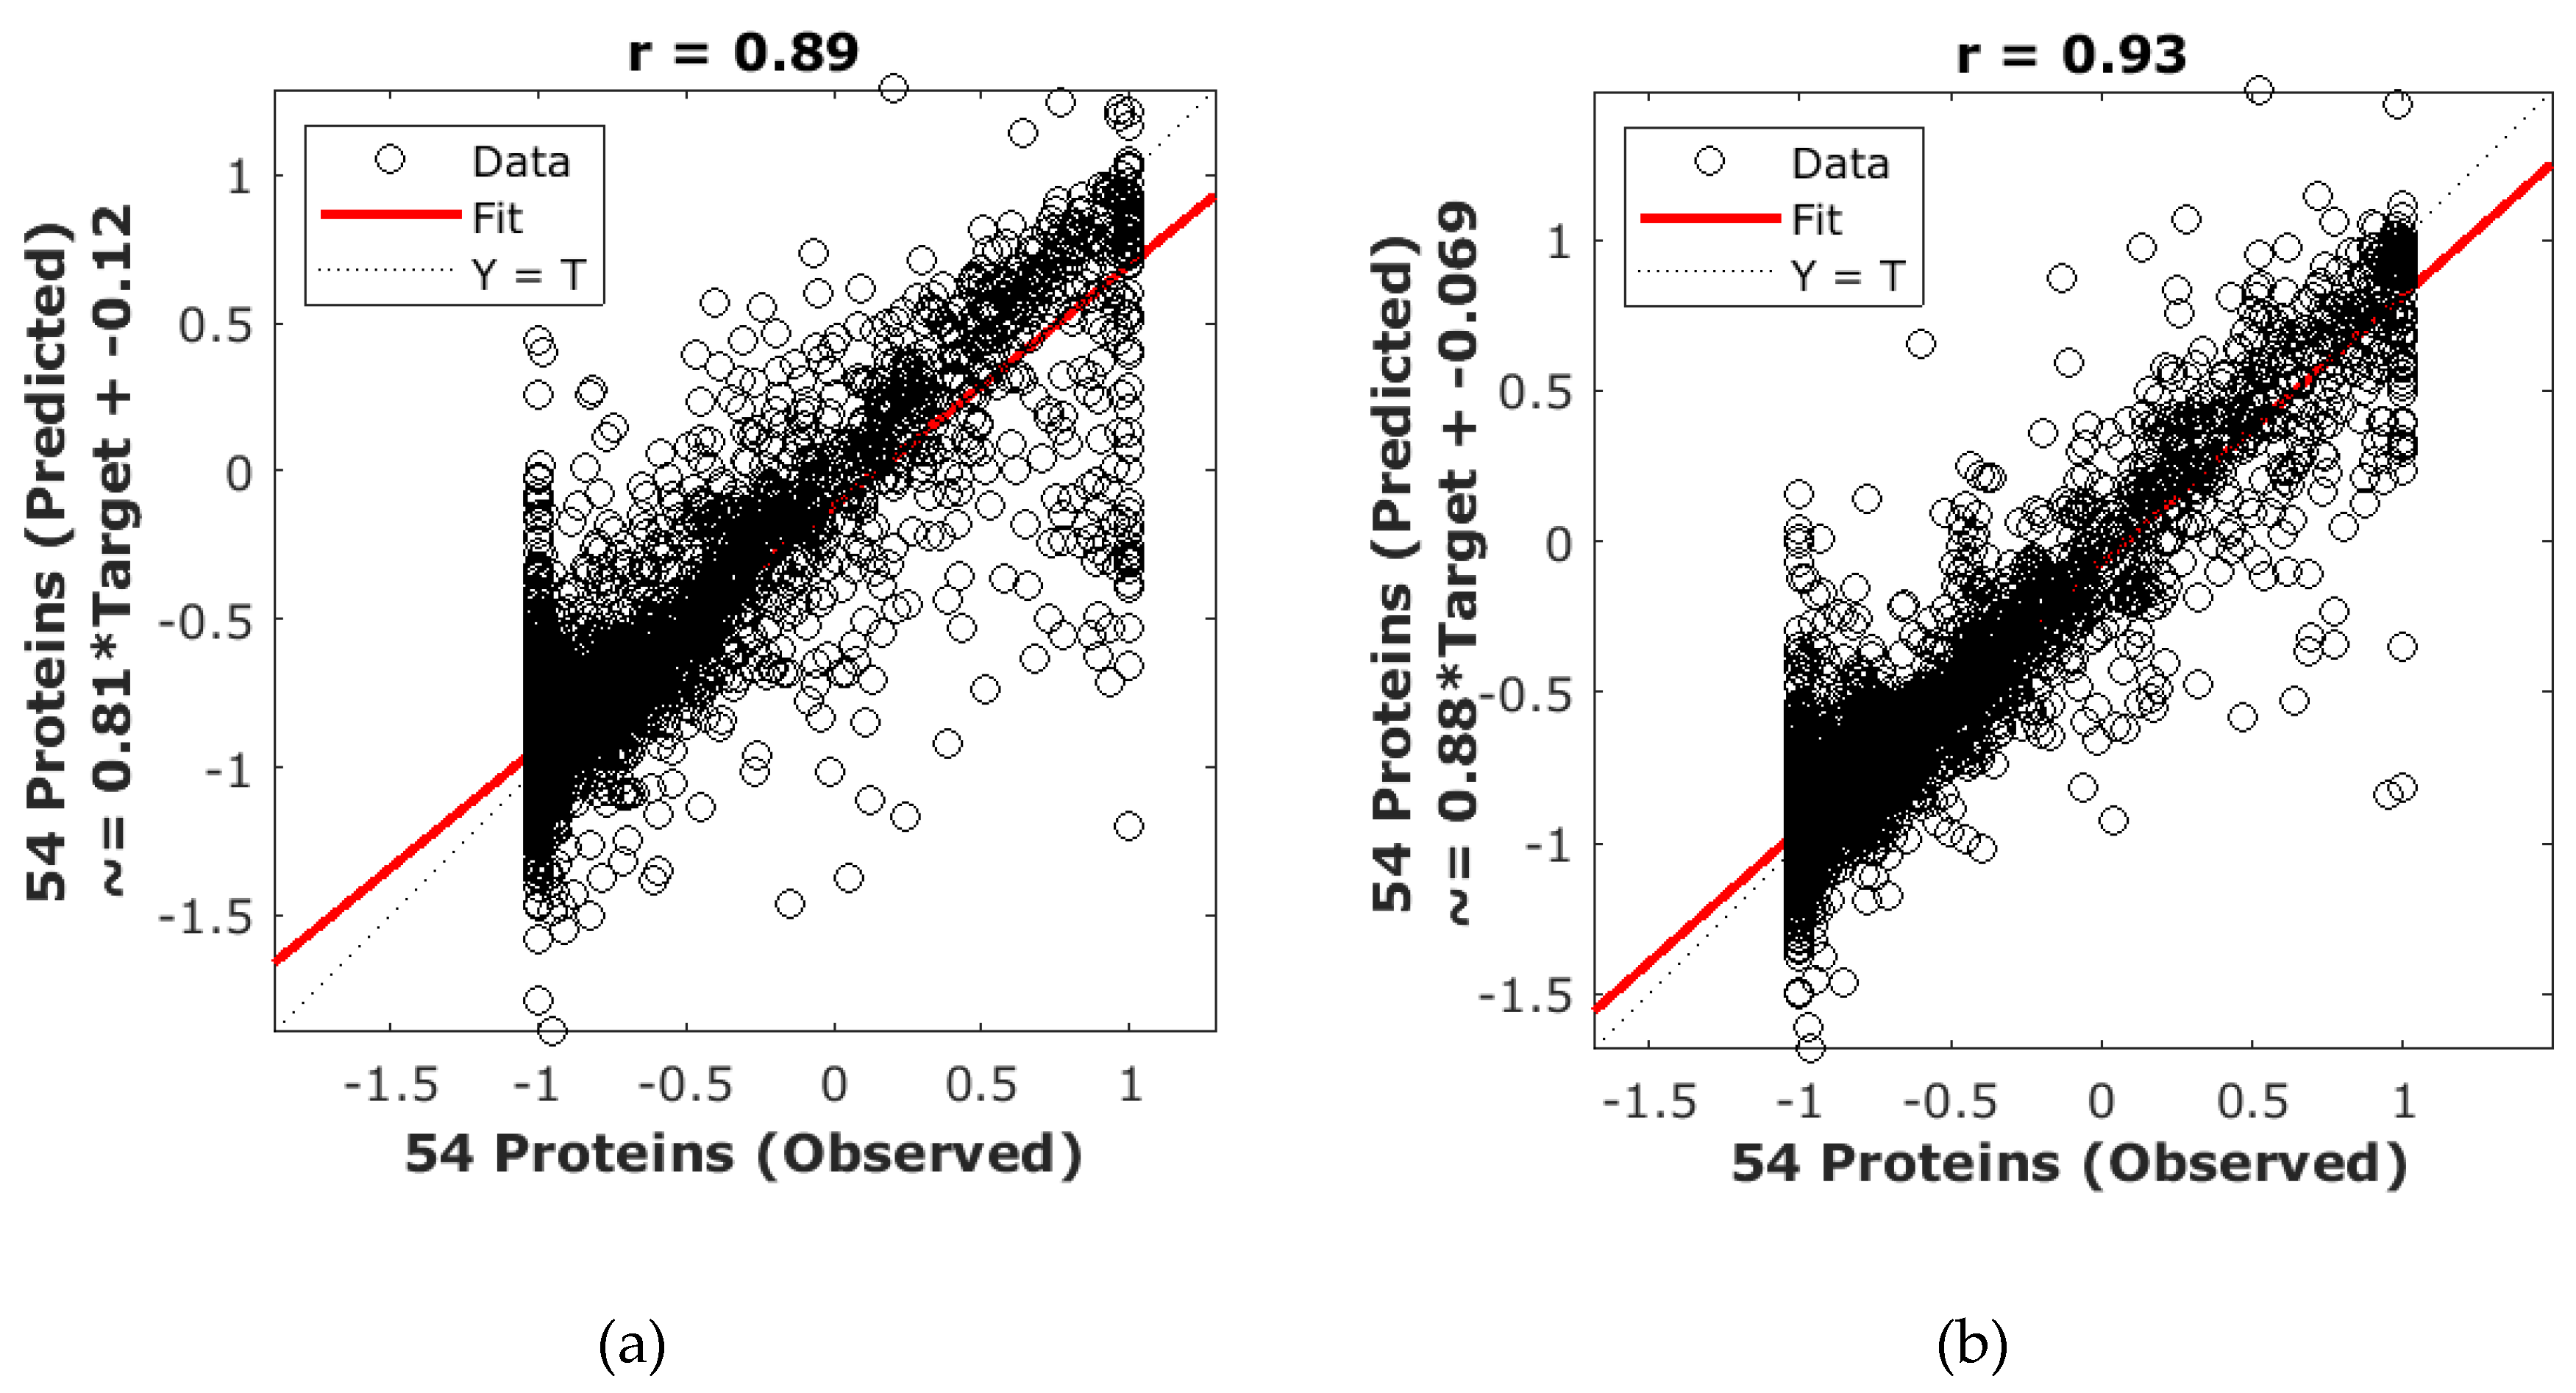
3.2. Machine Learning Modeling

Table 3 depicts the results of the ANN models. Model 1 presented a high overall correlation coefficient (r = 0.89) to predict 54 proteins with the chemical fingerprinting measured using NIR (1600–2400 nm). However, the r value (r = 0.68) for the testing stage was moderate and much lower than the training stage. Additionally, the slope of the testing stage was low. In contrast, Model 2 had higher overall accuracy (r = 0.93) to predict the same 54 proteins but using the physical parameters (color, foam, and bubbles) measured using RoboBEER. This model presented similar results for the three stages (training, testing, and overall) with high slope values (b ≈ 0.90). Furthermore, the performance shows there are no signs of overfitting of the model as the MSE value of the training was lower than the testing stage. On the other hand, Figure 2 shows the overall models in which a higher dispersion of the data can be observed for Model 1 compared to Model 2.
Despite the chemical fingerprinting from NIR spectra within 1600–2400 nm presenting several overtones, which are related to the protein content, it was found in this study that these are not appropriate for the prediction of specific proteins in beer as the model (Model 1; Table 3) did not show a high correlation coefficient for the testing stage. Furthermore, this model (Model 1) presented underfitting of values along the entire scale, which makes it unsuitable for the prediction of proteins. However, the physical parameters (color, foam, and bubbles) were able to predict the 54 proteins with high accuracy (Model 2; Figure 2). The latter may be due to the significant contribution of proteins to foamability and, according to Figure 1, the color and lightness (L) of beer. This model presented underfitting focused on the lowest values (normalized: −1, real value: 0); in this particular case, this is not an issue as it is easy to detect given a good performance metric of the general model and known minimum values. Furthermore, this may be easily solved by using a simple rule to assign the logical 0 values on negative values for proteins on the model deployment after the denormalization of the output values.
Even though proteins within 40–60 kDa did not present significant correlations with the physical parameters (color, foam, and bubbles), some of these proteins were included in the model (Table 2) as they contributed to its high accuracy. This may be explained since the ANN is a non-linear modeling method that can find complex relationships within the inputs and targets for their prediction [6], in contrast with the matrix in Figure 1, which only shows linear correlations.
Although some studies have successfully developed predictive models for proteins using NIR data as inputs using partial least squares regression (PLS), these only predict the total protein content; therefore, it is not able to provide more specific and multitarget results [36,37,38,39]. Other results with higher accuracy and performance of ANN modeling using calculated parameters rather than raw data (such as NIR spectra) have been reported for different purposes, such as other beer quality parameters, such as sensory attributes [23] and type of fermentation, using the physical parameters (color, foam, and bubbles) [1] and from different studies related to the classification of grapevine leaves into cultivars based on morphometric and colorimetric parameters [40] and prediction of cocoa aromas from canopy architecture parameters of cacao trees obtained using remote sensing and computer vision algorithms [41].

4. Conclusions

The high accuracy obtained by Model 2 showed that the proposed method might be the first reliable, objective, affordable, and rapid technique to evaluate the influence of specific proteins on beer foamability and quality using an artificial intelligence approach with the aid of robotics and machine learning. Therefore, it may potentially be utilized to predict the influence of different proteins on beer quality traits within the production line of both large- and small-scale breweries to assess beer quality. Furthermore, this method allowed a total of 69 physicochemical parameters [15 physical parameters (color, foam, and bubbles), and 54 protein] to be obtained, which is beyond the number of analyses that breweries are able to conduct to assess beer quality in every batch; this will allow the offering of products with higher quality.

Supplementary Materials

The following are available online at https://www.mdpi.com/2306-5710/6/2/28/s1, Table S1: Identified proteins showing their molecular weight (MW) and in which beer samples they were found (Y = detected; X = not detected); Figure S1: Diagram of the two-layer feedforward models showing the inputs, number of neurons, and outputs/targets used to construct both models; Figure S2: Absorbance values of the near-infrared spectra of 24 different beer samples.

Author Contributions

Conceptualization, C.G.V.; Data curation, C.G.V., and S.F.; Formal analysis, C.G.V.; Investigation, C.G.V.; Methodology, C.G.V., C.H.C., E.D.K., C.L.P., and B.L.S.; Supervision, K.H., and S.F.; Validation, C.G.V., and S.F.; Visualization, C.G.V., K.H., and S.F.; Writing—original draft, C.G.V.; Writing—review and editing, C.H.C., E.D.K., C.L.P., B.L.S., K.H., and S.F. All authors have read and agreed to the published version of the manuscript.

Funding

This research received no external funding.

Acknowledgments

C.G.V. was supported by the Melbourne Research Scholarship from the University of Melbourne.

Conflicts of Interest

The authors declare no conflict of interest.

References

  1. Gonzalez Viejo, C.; Fuentes, S.; Li, G.; Collmann, R.; Condé, B.; Torrico, D. Development of a robotic pourer constructed with ubiquitous materials, open hardware and sensors to assess beer foam quality using computer vision and pattern recognition algorithms: RoboBEER. Food Res. Int. 2016, 89, 504–513. [Google Scholar] [CrossRef] [PubMed]
  2. Bamforth, C.; Russell, I.; Stewart, G. Beer: A Quality Perspective; Elsevier Science: Burlington, MA, USA, 2011. [Google Scholar]
  3. Zayas, J.F. Functionality of Proteins in Food; Springer Science & Business Media: Berlin, Germany, 2012. [Google Scholar]
  4. Badui, S. Química de los Alimentos; Pearson Education: Ciudad de México, México, 2006. [Google Scholar]
  5. Campbell, G.M.; Mougeot, E. Creation and characterisation of aerated food products. Trends Food Sci. Technol. 1999, 10, 283–296. [Google Scholar] [CrossRef]
  6. Gonzalez Viejo, C.; Fuentes, S.; Torrico, D.; Howell, K.; Dunshea, F. Assessment of beer quality based on foamability and chemical composition using computer vision algorithms, near infrared spectroscopy and machine learning algorithms. J. Sci. Food Agric. 2018, 98, 618–627. [Google Scholar] [CrossRef] [PubMed]
  7. Mastanjević, K.; Krstanović, V.; Lukinac, J.; Jukić, M.; Vulin, Z.; Mastanjević, K. Beer–The Importance of colloidal stability (non-biological haze). Fermentation 2018, 4, 91. [Google Scholar] [CrossRef] [Green Version]
  8. Asano, K.; Shinagawa, K.; Hashimoto, N. Characterization of haze-forming proteins of beer and their roles in chill haze formation. J. Am. Soc. Brew. Chem. 1982, 40, 147–154. [Google Scholar] [CrossRef]
  9. Colgrave, M.L.; Goswami, H.; Howitt, C.A.; Tanner, G.J. Proteomics as a tool to understand the complexity of beer. Food Res. Int. 2013, 54, 1001–1012. [Google Scholar] [CrossRef]
  10. Iimure, T.; Takoi, K.; Kaneko, T.; Kihara, M.; Hayashi, K.; Ito, K.; Sato, K.; Takeda, K. Novel prediction method of beer foam stability using protein Z, barley dimeric α-amylase inhibitor-1 (BDAI-1) and yeast thioredoxin. J. Agric. Food Chem. 2008, 56, 8664–8671. [Google Scholar] [CrossRef]
  11. Berner, T.S.; Jacobsen, S.; Arneborg, N. The impact of different ale brewer’s yeast strains on the proteome of immature beer. BMC Microbiol. 2013, 13, 215. [Google Scholar] [CrossRef] [Green Version]
  12. Picariello, G.; Mamone, G.; Cutignano, A.; Fontana, A.; Zurlo, L.; Addeo, F.; Ferranti, P. Proteomics, Peptidomics, and Immunogenic Potential of Wheat Beer (Weissbier). J. Agric. Food Chem. 2015, 63, 3579–3586. [Google Scholar] [CrossRef]
  13. Picariello, G.; Bonomi, F.; Iametti, S.; Rasmussen, P.; Pepe, C.; Lilla, S.; Ferranti, P. Proteomic and peptidomic characterisation of beer: Immunological and technological implications. Food Chem. 2011, 124, 1718–1726. [Google Scholar] [CrossRef]
  14. Wu, M.J.; Rogers, P.J.; Clarke, F.M. 125th Anniversary Review: The role of proteins in beer redox stability. J. Inst. Brew. 2012, 118, 1–11. [Google Scholar] [CrossRef]
  15. Grochalová, M.; Konečná, H.; Stejskal, K.; Potěšil, D.; Fridrichová, D.; Srbová, E.; Ornerová, K.; Zdráhal, Z. Deep coverage of the beer proteome. J. Proteom. 2017, 162, 119–124. [Google Scholar] [CrossRef] [PubMed]
  16. Condé, B.C.; Fuentes, S.; Caron, M.; Xiao, D.; Collmann, R.; Howell, K.S. Development of a robotic and computer vision method to assess foam quality in sparkling wines. Food Control 2017, 71, 383–392. [Google Scholar] [CrossRef]
  17. Men, H.; Shi, Y.; Jiao, Y.; Gong, F.; Liu, J. Electronic nose sensors data feature mining: A synergetic strategy for the classification of beer. Anal. Methods 2018, 10, 2016–2025. [Google Scholar] [CrossRef]
  18. Voss, H.G.J.; Mendes Júnior, J.J.A.; Farinelli, M.E.; Stevan, S.L. A Prototype to Detect the Alcohol Content of Beers Based on an Electronic Nose. Sensors 2019, 19, 2646. [Google Scholar] [CrossRef] [Green Version]
  19. Kerr, E.D.; Caboche, C.H.; Schulz, B.L. Post-translational modifications drive protein stability to control the dynamic beer brewing proteome. Mol. Cell. Proteom. 2019, 18, 1721–1731. [Google Scholar] [CrossRef]
  20. Xu, Y.; Bailey, U.M.; Schulz, B.L. Automated measurement of site-specific N-glycosylation occupancy with SWATH-MS. Proteomics 2015, 15, 2177–2186. [Google Scholar] [CrossRef]
  21. Zacchi, L.F.; Schulz, B.L. SWATH-MS glycoproteomics reveals consequences of defects in the glycosylation machinery. Mol. Cell. Proteom. 2016, 15, 2435–2447. [Google Scholar] [CrossRef] [Green Version]
  22. Kerr, E.D.; Phung, T.K.; Caboche, C.H.; Fox, G.P.; Platz, G.J.; Schulz, B.L. The intrinsic and regulated proteomes of barley seeds in response to fungal infection. Anal. Biochem. 2019, 580, 30–35. [Google Scholar] [CrossRef] [Green Version]
  23. Gonzalez Viejo, C.; Fuentes, S.; Torrico, D.; Howell, K.; Dunshea, F. Assessment of Beer Quality Based on a Robotic Pourer, Computer Vision, and Machine Learning Algorithms Using Commercial Beers. J. Food Sci. 2018, 83, 1381–1388. [Google Scholar] [CrossRef]
  24. Gonzalez Viejo, C.; Fuentes, S.; Howell, K.; Torrico, D.; Dunshea, F. Robotics and computer vision techniques combined with non-invasive consumer biometrics to assess quality traits from beer foamability using machine learning: A potential for artificial intelligence applications. Food Control 2018, 92, 72–79. [Google Scholar] [CrossRef]
  25. Gonzalez Viejo, C.; Fuentes, S.; Godbole, A.; Widdicombe, B.; Unnithan, R.R. Development of a low-cost e-nose to assess aroma profiles: An artificial intelligence application to assess beer quality. Sens. Actuators B: Chem. 2020, 308, 127688. [Google Scholar] [CrossRef]
  26. Hao, J.; Li, Q.; Dong, J.; Yu, J.; Gu, G.; Fan, W.; Chen, J. Identification of the major proteins in beer foam by mass spectrometry following sodium dodecyl sulfate-polyacrylamide gel electrophoresis. J. Am. Soc. Brew. Chem. 2006, 64, 166–174. [Google Scholar] [CrossRef]
  27. Iimure, T.; Nankaku, N.; Hirota, N.; Tiansu, Z.; Hoki, T.; Kihara, M.; Hayashi, K.; Ito, K.; Sato, K. Construction of a novel beer proteome map and its use in beer quality control. Food Chem. 2010, 118, 566–574. [Google Scholar] [CrossRef]
  28. Rantanen, J.; Räsänen, E.; Antikainen, O.; Mannermaa, J.-P.; Yliruusi, J. In-line moisture measurement during granulation with a four-wavelength near-infrared sensor: An evaluation of process-related variables and a development of non-linear calibration model. Chemom. Intell. Lab. Syst. 2001, 56, 51–58. [Google Scholar] [CrossRef]
  29. Burns, D.A.; Ciurczak, E.W. Handbook of Near-Infrared Analysis; CRC Press: Boca Raton, FL, USA, 2007. [Google Scholar]
  30. Blasco, L.; Viñas, M.; Villa, T.G. Proteins influencing foam formation in wine and beer: The role of yeast. Int. Microbiol. 2011, 14, 61–71. [Google Scholar]
  31. Bamforth, C. 125th Anniversary Review: The Non-Biological Instability of Beer. J. Inst. Brew. 2011, 117, 488–497. [Google Scholar] [CrossRef]
  32. Bamforth, C. The foaming properties of beer. J. Inst. Brew. 1985, 91, 370–383. [Google Scholar] [CrossRef]
  33. Lusk, L.T.; Goldstein, H.; Ryder, D. Independent role of beer proteins, melanoidins and polysaccharides in foam formation. J. Am. Soc. Brew. Chem. 1995, 53, 93–103. [Google Scholar] [CrossRef]
  34. Evans, D.E.; Sheehan, M.; Stewart, D. The impact of malt derived proteins on beer foam quality. Part II: The influence of malt foam-positive proteins and non-starch polysaccharides on beer foam quality. J. Inst. Brew. 1999, 105, 171–178. [Google Scholar] [CrossRef]
  35. Evans; Sheehan, M.C. Don’t be fobbed off: The substance of beer foam—A review. J. Am. Soc. Brew. Chem. 2002, 60, 47–57. [Google Scholar] [CrossRef]
  36. Optics, O. NIR Analysis of Fat and Protein Content in Milk. Available online: https://oceanoptics.com/nir-analysis-of-fat-and-protein-content-in-milk/ (accessed on 19 November 2019).
  37. Schönbrodt, T.; Mohl, S.; Winter, G.; Reich, G. NIR spectroscopy—a non-destructive analytical tool for protein quantification within lipid implants. J. Control. Release 2006, 114, 261–267. [Google Scholar] [CrossRef]
  38. Ingle, P.D.; Christian, R.; Purohit, P.; Zarraga, V.; Handley, E.; Freel, K.; Abdo, S. Determination of protein content by NIR spectroscopy in protein powder mix products. J. Aoac Int. 2016, 99, 360–363. [Google Scholar] [CrossRef]
  39. Wu, D.; He, Y.; Feng, S.; Sun, D.-W. Study on infrared spectroscopy technique for fast measurement of protein content in milk powder based on LS-SVM. J. Food Eng. 2008, 84, 124–131. [Google Scholar] [CrossRef]
  40. Fuentes, S.; Hernández-Montes, E.; Escalona, J.; Bota, J.; Viejo, C.G.; Poblete-Echeverría, C.; Tongson, E.; Medrano, H. Automated grapevine cultivar classification based on machine learning using leaf morpho-colorimetry, fractal dimension and near-infrared spectroscopy parameters. Comput. Electron. Agric. 2018, 151, 311–318. [Google Scholar] [CrossRef]
  41. Fuentes, S.; Chacon, G.; Torrico, D.D.; Zarate, A.; Gonzalez Viejo, C. Spatial Variability of Aroma Profiles of Cocoa Trees Obtained through Computer Vision and Machine Learning Modelling: A Cover Photography and High Spatial Remote Sensing Application. Sensors 2019, 19, 3054. [Google Scholar] [CrossRef] [Green Version]
Figure 1. Matrix showing the correlations (p < 0.05) between the physical parameters (color, foam, and bubbles) and the proteins grouped by molecular weight (0–20 kDa, 20–40 kDa, 40–60 kDa, 60–80 kDa and >80 kDa).
Beverages 06 00028 g001
Figure 2. Overall artificial neural network models to predict 54 proteins in beer (Table 2), showing the correlation coefficient (r) for (a) Model 1 using the absorbance values of near-infrared spectra (1600–2400 nm), and (b) Model 2 using the 15 physical parameters (color, foam, and bubbles) measured using RoboBEER (Figure 1).
Beverages 06 00028 g002
Table 1. Beer samples analyzed, and their labels utilized for the analyses.
Beer StyleCountryFermentationLabel
Abbey AleBelgiumTopL
India Pale AleAustraliaTopWIP
Blonde AleAustraliaTopWB
PorterPolandTopZ
KolschAustraliaTopP
Red AleUSATopRT
Steam AleAustraliaTopSA
Aged AleScotlandTopIG
Sparkling AleAustraliaTopCS
SaisonAustraliaTopLS
Pale LagerMexicoBottomC
Pale LagerMexicoBottomXX
Vienna LagerUSABottomBL
Pale LagerNetherlandsBottomH
Pale LagerCzech RepublicBottomBC
German PilsnerCzech RepublicBottomPU
Lambic CassisBelgiumSpontaneousLC
Lambic FramboiseBelgiumSpontaneousLF
Lambic GueuzeBelgiumSpontaneousLG
Lambic KriekBelgiumSpontaneousLK
Lambic KriekBelgiumSpontaneousOK
Lambic GueuzeBelgiumSpontaneousOG
Lambic GueuzeBelgiumSpontaneousOT
Wild SaisonAustraliaSpontaneousLW
Table 2. Names of the 54 proteins used to develop the artificial neural network model.
ProteinMW
(kDa)
Protein Name
NLTP1_HORVU12.3Non-specific lipid-transfer protein 1 (LTP 1)
IAAE_HORVU16.1Trypsin inhibitor CMe
NLTP2_HORVU10.4Probable non-specific lipid-transfer protein (LTP)
HOG3_HORVU33.1Gamma-hordein-3
AVLA3_WHEAT19.3Avenin-like a3
IAAD_HORVU18.5Alpha-amylase/trypsin inhibitor CMd
GLT3_WHEAT70.9Glutenin subunit 12
G3P1_YEAST35.8Glyceraldehyde-3-phosphate dehydrogenase 1 (GAPDH 1)
IAAA_HORVU15.5Alpha-amylase/trypsin inhibitor CMa
HOG1_HORVU34.7Gamma-hordein-1
G3P1_CANGA35.9Glyceraldehyde-3-phosphate dehydrogenase 1 (GAPDH 1)
HOR1_HORVU33.4B1-hordein
NLT2P_WHEAT7.0Non-specific lipid-transfer protein 2P (LTP2P)
PAU5_YEAST12.8Seripauperin-5
ENO2_YEAST46.9Enolase 2
HINB1_HORVU16.1Hordoindoline-B1 (Puroindoline-B)
BARW_HORVU13.7Barwin
AMYB_HORVS59.6Beta-amylase
AVLA4_WHEAT18.9Avenin-like a4
YGP1_YEAST37.3Protein YGP1 (GP38)
HS16B_WHEAT16.916.9 kDa class I heat shock protein 2
EF1A_MAIZE49.2Elongation factor 1-alpha (EF-1-alpha)
PGK_YEAST44.7Phosphoglycerate kinase
PDC1_YEAST61.5Pyruvate decarboxylase isozyme 1
NLT2G_WHEAT9.8Non-specific lipid-transfer protein 2G (LTP2G)
ICIC_HORVU8.3Subtilisin-chymotrypsin inhibitor CI-1C
KPYK1_YEAST54.5Pyruvate kinase 1 (PK 1)
HINA_HORVU16.5Hordoindoline-A
TPIS_YEAST26.8Triosephosphate isomerase (TIM)
LEA1_HORVU21.8ABA-inducible protein PHV A1
LAS1_ARATH86.5Lanosterol synthase
ACT2_SCHCO41.8Actin-2
CIS3_YEAST23.2Cell wall mannoprotein CIS3
GDA7_WHEAT36.1Alpha/beta-gliadin clone PW8142 (Prolamin)
PST1_YEAST45.8Cell wall mannoprotein PST1 (Haze protective factor 2)
TRX2_YEAST11.2Thioredoxin-2 (Thioredoxin II)
NDK1_SACOF16.6Nucleoside diphosphate kinase 1
HINB2_HORVU16.1Hordoindoline-B2 (Puroindoline-B)
PR13_HORVU17.7Pathogenesis-related protein PRB1-3
ENO1_YEAST46.8Enolase 1
AWA1_YEASK166.9Cell wall protein AWA1
PDI_HORVU56.5Protein disulfide-isomerase (PDI)
G3PC2_ARATH36.9Glyceraldehyde-3-phosphate dehydrogenase GAPC2, cytosolic
ENO_YARLI47.3Enolase
RLA2_PSEMZ1.060S acidic ribosomal protein P2 (Fragment)
HS17A_ORYSJ17.917.9 kDa class I heat shock protein
RL8B_YEAST28.160S ribosomal protein L8-B (L4)
ENO_ASHGO46.6Enolase
RS19B_YEAST15.940S ribosomal protein S19-B
EXG1_YEAST51.3Glucan 1,3-beta-glucosidase I/II
MY119_ARATH48.5Transcription factor MYB119
ALF_YEAST39.6Fructose-bisphosphate aldolase
RIP1_HORVU30.0Protein synthesis inhibitor I
ACBP_YEAST10.1Acyl-CoA-binding protein (ACBP)
Abbreviations: MW = Molecular weight.
Table 3. Statistical results from the two machine learning models.
StageSamplesObservations
(Samples × Targets)
rSlopePerformance
(MSE)
Model 1: Near-infrared inputs
Training5027000.970.930.02
Testing2211880.680.560.20
Overall7238880.890.81--
Model 2: RoboBEER inputs
Training5027000.960.900.02
Testing2211880.900.850.07
Overall7238880.930.88--
Abbreviations: MSE = mean squared error, r = correlation coefficient.

