Article

Understanding Aqueous Organic Redox Flow Batteries: A Guided Experimental Tour from Components Characterization to Final Assembly

by
Juan Asenjo-Pascual
1,*,
Ivan Salmeron-Sanchez
1,
Juan Ramón Avilés-Moreno
1,
Pablo Mauleón
1,2,
Petr Mazur
3,4 and
Pilar Ocón
1
1
Departamento de Química Física Aplicada, Universidad Autónoma de Madrid (UAM), C/Francisco Tomás y Valiente 7, 28049 Madrid, Spain
2
Departamento de Química Orgánica, Universidad Autónoma de Madrid (UAM), C/Francisco Tomás y Valiente 7, 28049 Madrid, Spain
3
Faculty of Chemical Engineering, University of Chemistry and Technology, Prague 6, 166 28 Prague, Czech Republic
4
New Technologies—Research Centre, University of West Bohemia, Univerzitní 8, 306 14 Plzeň, Czech Republic
*
Author to whom correspondence should be addressed.
Batteries 2022, 8(10), 193; https://doi.org/10.3390/batteries8100193
Submission received: 12 September 2022 / Revised: 10 October 2022 / Accepted: 13 October 2022 / Published: 19 October 2022

Abstract

:
The implementation of renewable energies into the electrical grid is one of our best options to mitigate the climate change. Redox flow batteries (RFB) are one of the most promising candidates for energy storage due to their scalability, durability and low cost. Despite this, just few studies have explained the basic concepts of RFBs and even fewer have reviewed the experimental conditions that are crucial for their development. This work aspired to be a helpful guide for beginner researchers who want to work in this exciting field. This guided tour aimed to clearly explain all the components and parameters of RFBs. Using a well-studied chemistry of anthraquinone (AQDS)-based anolyte and Na4[Fe(CN)6] catholyte, different techniques for the characterization of RFBs were described. The effects of some experimental parameters on battery performance such as electrolyte pH, O2 presence, membrane pretreatment and the capacity limiting side, were demonstrated. Furthermore, this analysis served to introduce different electrochemical techniques, i.e., load curve measurements, electrochemical impedance spectroscopy and charge–discharge cycling tests. This work aimed to be the nexus between the basic concepts and the first experimental steps in the RFB field merging theory and experimental data.

1. Introduction

The constant increase in greenhouse gas concentration in the atmosphere is forcing the implementation of renewable energies into the electrical grid. However, the intrinsic intermittent nature of these energy sources (solar, wind, etc.) is delaying their implementation. Efficient and sustainable energy storage systems are crucial within this approach, but the available technologies are not currently capable of fulfilling the actual and future demand at a viable cost and environmental impact, making this currently the biggest bottleneck. In this sense, electrochemical energy storage systems (EESS) are considered as the most practical system to deploy clean energy in a significant magnitude within the next decades [1]. Among the different devices studied, RFBs are attracting the attention of the industry due to their ability to store large amounts of energy and to decouple power and energy capacity, which makes them a powerful candidate to overcome the global energy storage problem. Hundreds of RFBs have been studied and tested over the last decades. The aim of this paper was not to review the different systems evaluated in the literature, although many examples will be cited [2,3].
An RFB is an electrochemical energy storage device where chemical energy (stored in two or more chemical components) is reversibly and directly transformed into electrical energy. They have become one of the most promising options for large-scale energy storage systems [4]. In an RFB (see Figure 1), there are two active redox materials named electrolytes, which may be solubilised in aqueous or organic solvents, located in external tanks, which are continuously pumped through an electrochemical cell. The electrochemical reactions of redox species take place on the surface of inert porous electrodes, most often carbonaceous-based materials. The electrodes are typically separated by ion-exchange membranes (IEMs), which prevent their electronic connection and mutual mixing of the electrolytes, while providing the passage of ions to preserve the electrolyte electroneutrality. The electrolytes contain one (typically) or more redox-active materials (RAM) used for energy storage and typically also some dissolved salts, acid or alkaline as a supporting electrolyte to provide ionic conductivity and/or required pH to the solution. Ion transport through IEMs is essential and rather important for completing the electrical circuit of the whole battery and determines good battery performance [5,6]. In this paper, an aqueous hybrid organic–inorganic RFB based on AQDS-Ferrocyanide active materials were used to highlight the main characteristics, thermodynamics and kinetic considerations during the battery operation mode to provide a useful introductory guide for unexperienced readers in the field of RFBs.
During the charging process (see Scheme 1), the one step two-electron reduction of AQDS takes place in the negative electrolyte (anolyte, negolyte). In this process, electrons move from the positive electrode to the negative one by the external circuit and sodium ions migrate through the IEM in the same direction as the electrons to maintain the electroneutrality of the system. By contrast, in the positive electrolyte (catholyte, posolyte), a ferrocyanide ion releases one electron to the inert electrode, oxidizing ferricyanide to form.
During the discharging process, the opposite reactions occur spontaneously, delivering typically a lower amount of energy than was used during the charging process. RFB technology is an example of a very complex multiphase system and, therefore, its final technical parameters (such as performance, efficiency, durability and cost) are highly dependent on many variable parameters, such as electrolyte composition, internal cell components, stack design and operating conditions [7]. In this publication, we aimed to show for a beginner reader the fundamental relationships between these parameters and properties in an RFB single cell using the well-known and inexpensive organic–inorganic RAM of AQDS-Ferrocyanide [8,9]. Despite some works having focused on these materials and their derivates, they still attract the interest of the RFB community due to their promising characteristics [10,11]. We believe that this illustrative “guided tour” of a flow battery will be useful for less-experienced researchers who are interested in this technology. In addition, the RAM seemed to be more stable at a neutral pH than basic and acid media where side reactions could lead to higher capacity decay. We are aware that this work does not constitute any significant step forward in terms of novel or promising results but, according to its aims, it provides a complex view where the basic concepts and experimental parameters merge to understand RFBs.

1.1. Redox-Active Materials—Requirements and Basic Characterization

Redox-active materials are chemical compounds capable of transforming chemical energy into electrical energy. When this process is reversible, these materials can return to their initial state by applying electrical energy. Hundreds of chemicals have been tested as redox-active materials such as metal ions [12,13], organic compounds [14], metal complexes [15], organometallic compounds [16], polymers [17], peptides [18], etc. Among them, each candidate presents some advantages and disadvantages, but nowadays, organic compounds are promising materials and have reached the attention of chemists due to their high tunability, potential low costs and independency on metal mining.
These RAMs can be dissolved in water, in the case of aqueous RFBs [19], or in organic solvents, in case of non-aqueous RFBs [20]. Among the different types of RFBs, non-aqueous systems present wider solvent electrochemical stability windows than aqueous media, where the potential window is limited by the decomposition of water. On the other hand, aqueous systems provide significantly higher ionic conductivities due to the much higher mobility of the charge carriers, i.e., water-soluble ions (such as hydronium, hydroxyl, sodium, potassium, chloride or bromide ions), when compared with those soluble in organic solvents (cations such as teteramethylammonium, tetrabutylammonium and anions such as hexafluorophosphate and tetrafluoroborate). In addition, aqueous RFBs represent a more environmentally friendly, safer and cost-effective possibility for energy storage technology. There are many important characteristics of RAMs that must be consider before choosing the optimal one for the system such as: (i) electrochemical reversibility in the selected media (acid, basic, neutral or even organic solvents) and (ii) high solubility, which determines the energy density of the battery.
Please note that by reversibility, we refer here to the ability of the compound to be repeatedly reduced and oxidized at the surface of an inert electrode that does not participate in the redox reaction but provides a site for charge transfer and also the fast kinetics of electrode reaction, which will be discussed later. Reversibility can be assessed by standard electrochemical characterization direct current (DC) methods such as cyclic voltammetry (CV) on planar glassy carbon electrodes. The presence of both forward and reverse peaks in the cyclovoltammetries of comparable intensity is one of the diagnostic criteria for the reversibility process, while the absence of large differences in potentials of anodic and cathodic peaks indicates fast charge transfer kinetics. However, further inspection of the RAM electrochemical stability after repeated oxidation and reduction, ideally in a flow single-cell, is required to fully assess the suitability for the application.

1.1.1. Solubility

Solubility determines the theoretical volumetric charge capacity of the electrolyte as given in Equation (1). It indicates the amount of charge that can be stored in a certain volume of electrolyte. It depends on the number of electrons that participate in the redox process n, the active material molecular mass M and mass m, Faraday’s constant F and the tank volume V. The most used unit to express the volumetric capacity is Ah/L. The volumetric energy density includes the voltage displayed (U at open circuit potential) between the utilized couples and the volumetric capacity (Q), thus it is measured in Wh/L (Equation (2)).
Q = m · n · F M · V  
E = Q   ·   U
The maximum solubility can be measured as a concentration of saturated solution under given conditions (temperature, pH, supporting electrolyte compositions and pressure) and can be evaluated by different analysis methods, such as: voltammetry, UV-vis spectroscopy, or nuclear magnetic resonance (1H NMR). Organic RAMs are often organic salts and are dissolved after ionic bond breaking and ion solvation, making these solutions different to other dissolved species and making it more difficult to measure the solubility of these species [21]. In the case of AQDS, if the product is a mixture of anthraquinones, the determination of the solubility is even harder due to the formation of complexes, which leads to deviation in the reported values [10,11,22]. However, for many compounds, the solubility of the reduced and oxidised form may significantly differ, which can lead to precipitation of the RAMs during battery charging, which should be strictly avoided, as it may irreversibly block the felt electrodes. The increase in solubility of the active species for both organic and inorganic materials is a key issue in this application as it determines the maximum capacity that can be extracted from the RFB. Different strategies have been worked out to reach this goal, such as the choice of the appropriate counterion, the functionalization of the redox moiety with solubilising groups that facilitate the solubility of the active matter and others [23].

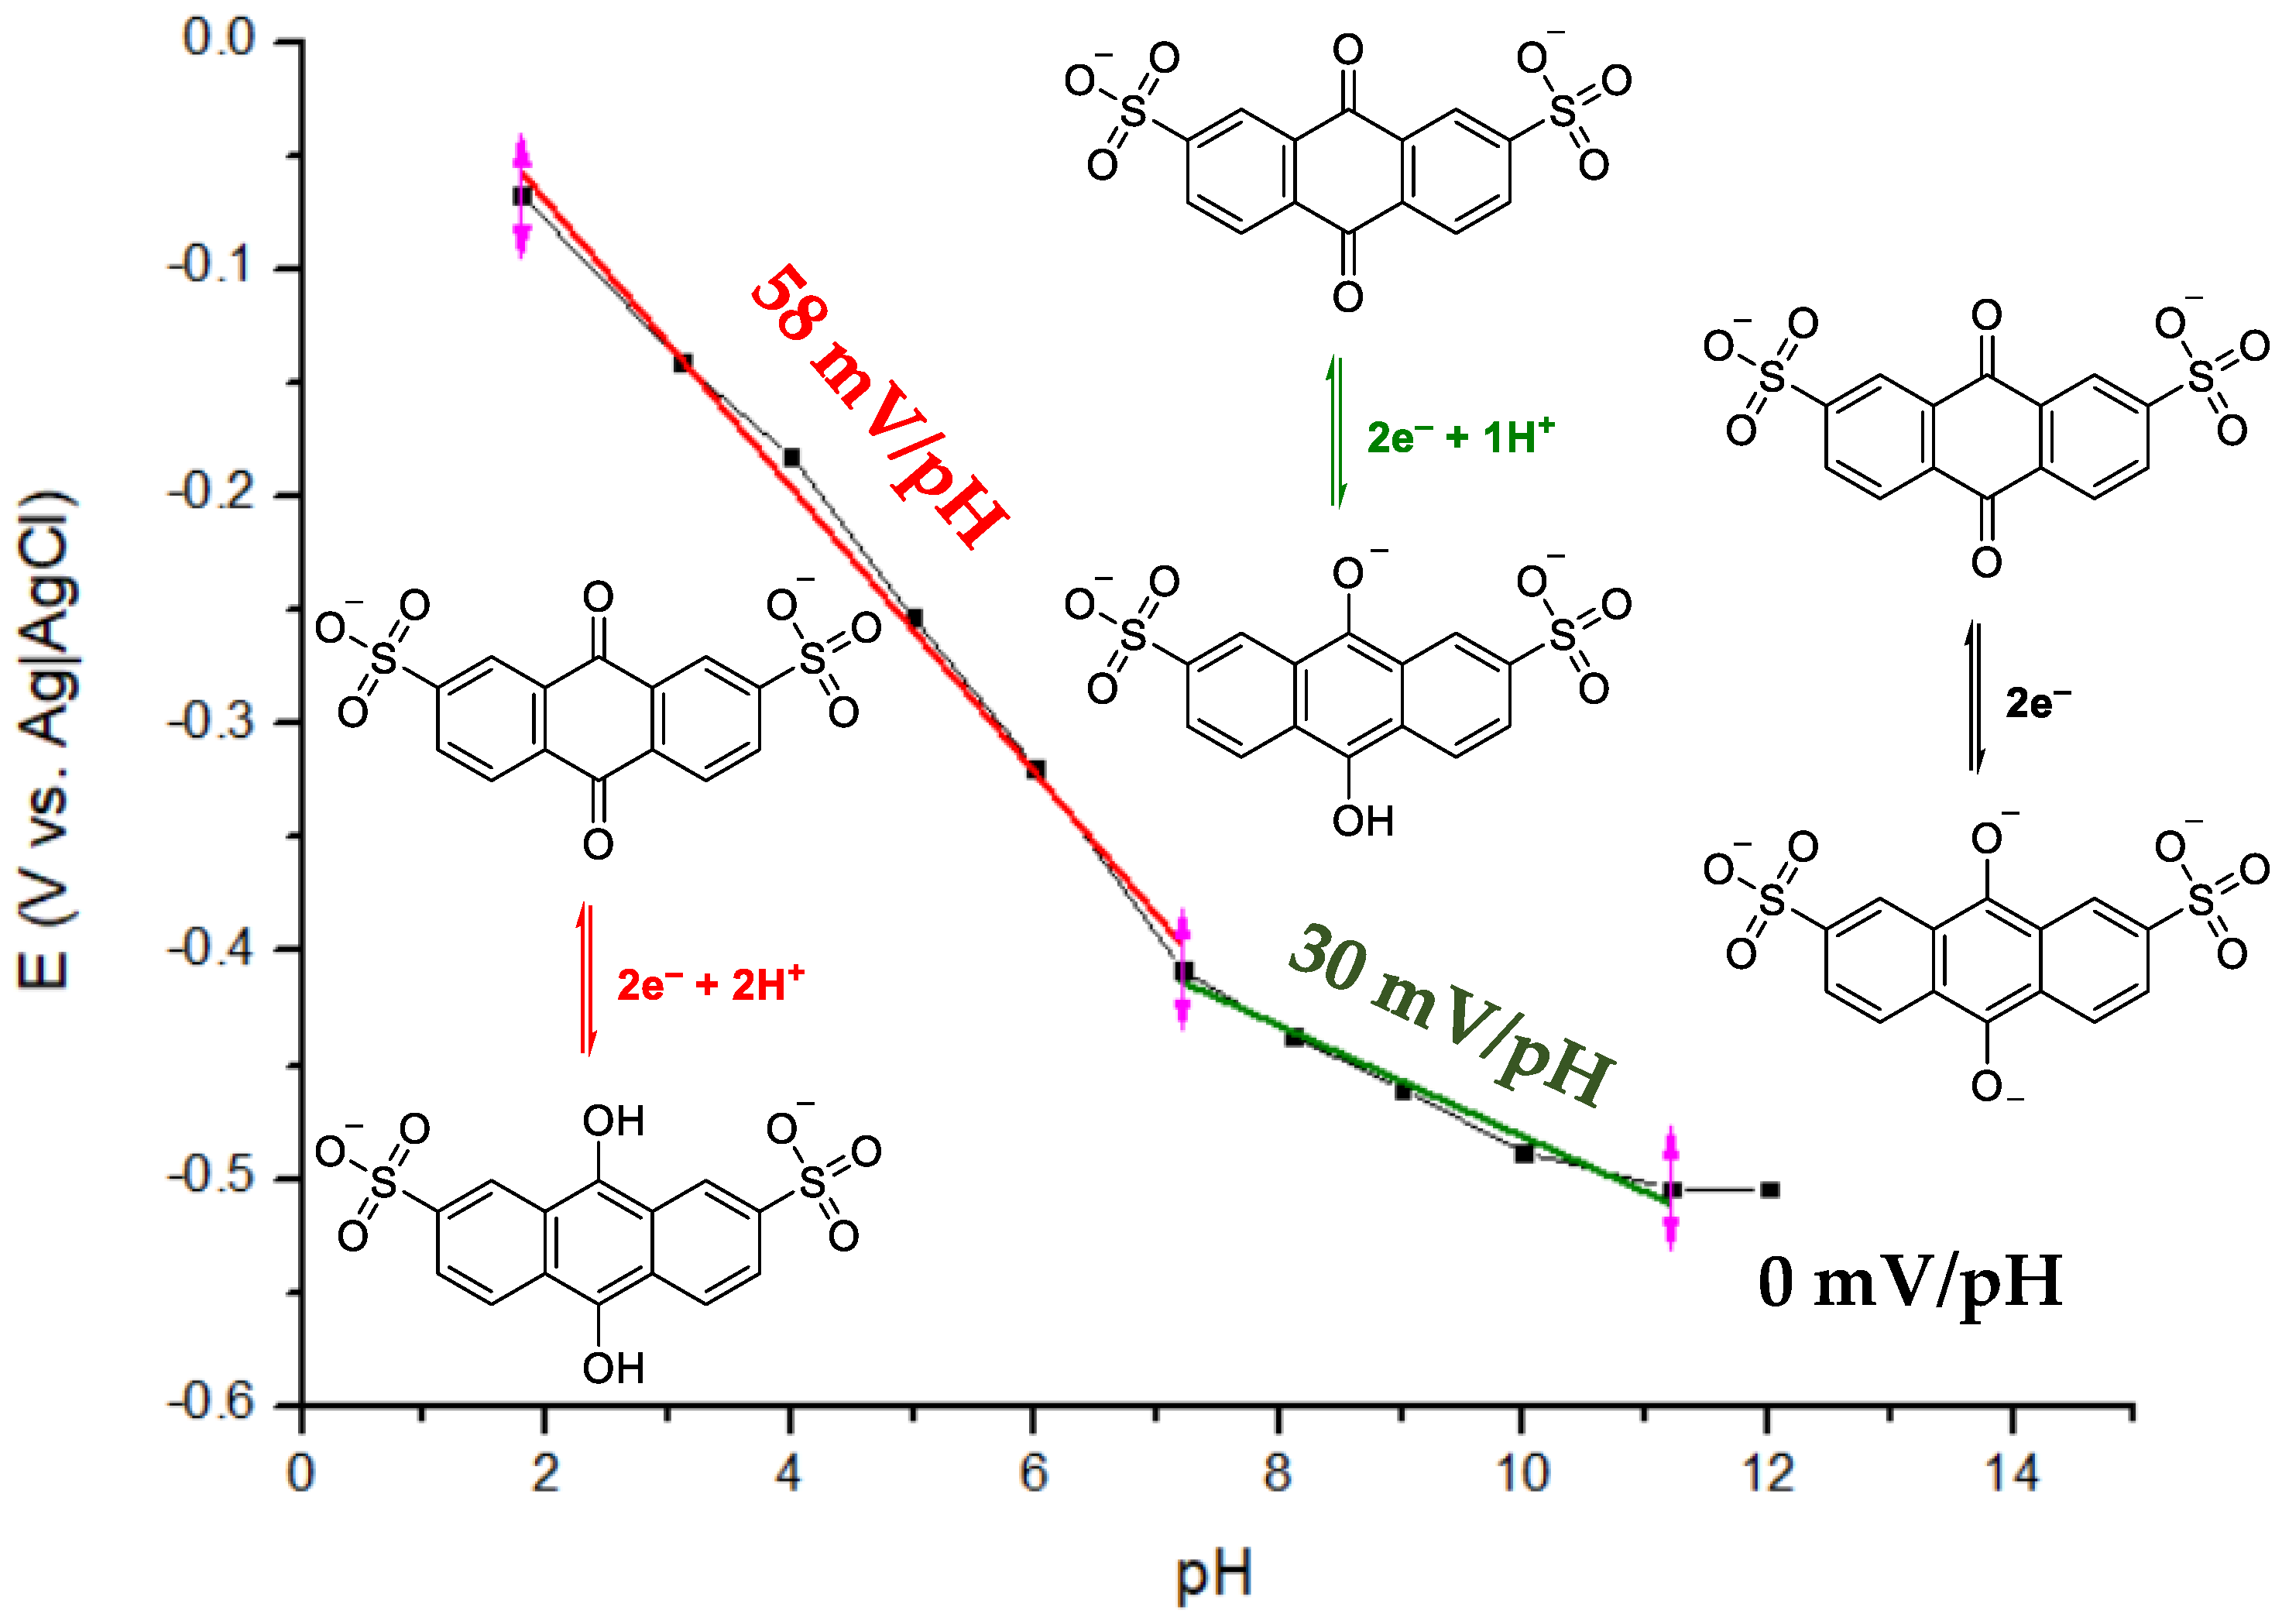
1.1.2. Redox Potential, E°

The redox potential of a specie is usually given by Nernst equation and represents the tendency to gain or lose electrons (reduction and oxidation reactions, respectively). Depending on the redox potential, the electrolytes can be divided in two groups; the species which present negative values of redox potential tend to be oxidized and are called anolytes or negolytes. On the other hand, catholytes or posolytes are the species which present positive values of redox potential and present an affinity to be reduced. The bigger the number (absolute value), greater the affinity to accept or release electrons. The redox potential is one of the key parameters of redox-active materials and different works have focused on their optimization due to this directly affecting the battery equilibrium voltage, the so-called open circuit voltage. Furthermore, the use of quantum mechanics, more in concrete DFTs, represents a good strategy for guiding this screening among the thousands of possibilities [24]. The redox potentials of organic molecules can be modified by adding different moieties or substituents to the core of the redox-active material or tuning the pH (in the case that the redox process is proton-coupled) of the electrolyte and other parameters [25]. When the redox reaction is pH-dependant (protons or hydroxyl ions are released or consumed within the redox reaction), the potential consequently varies with the pH of the media. Such a dependency of E° on the electrolyte pH is reflected by Pourbaix diagram. Furthermore, the RAM should present a high kinetic constant and diffusion coefficients to be implemented in the RFB system, otherwise both high charge transfer and mass transfer resistances will be present in the system, which may ultimately impact the efficiency of the device.
E = E ° R T n F ln [ A Q D S ] · [ H + ] 2 [ D H A Q D S ]  

1.1.3. Chemical and Electrochemical Stability

The chemical and electrochemical stability of the different redox states of the selected molecule to be employed as the active material of the RFB is also a very important parameter to be considered. To date, the most common method to determine the stability of a redox-active material is evaluating it in a symmetric cell. By using the same electrolyte on both sides of the battery, the effect of the crossover is negligible, and the capacity decay only can be ascribed to the precipitation or decomposition of the material [26]. Usually, charged species present lower chemical stabilities due to their reactivity. The stability should be tested over time in a flow cell during battery cycling. Aziz et al. reported a useful method for checking the stability of an electrolyte at different states of charge (SOC, i.e., the different concentration of the oxidized and reduced form) [27]. Ideally, the best way to study and register the electrolyte degradation is using in situ and in operando analysis, which could reveal the degradation pathways [28]. Unfortunately, these techniques are complex in being adapted in the RFB system and usually are not available in all laboratories worldwide. A post mortem analysis of the electrolytes merges as a good and simple alternative and should be performed after the battery test to elucidate the mechanism of degradation as well as the structure of the by-products.

1.1.4. Electrochemical Kinetics and Mass Transport

It has been previously mentioned that suitable electrolytes should present high kinetic constant and high diffusion coefficients. The kinetics of the redox processes are crucial for optimum battery performance. The overpotential and power density of the cell are inherently bonded to the kinetics of the redox processes. Based on the kinetics of the process, three cases can be studied, namely fast electron transfer reactions for reversible processes, where the heterogeneous electron transfer rate constant is higher and slow redox reactions, which are considered as irreversible, and among both extremes there are quasi-reversible systems. If the kinetics of the redox processes are important, the diffusion of the redox species is not less important and slow diffusion could restrict the current density and lead to larger overpotentials. Based on the importance of these parameters, different methods to determine it have been developed [29].

1.1.5. Further Optimization of Electrolyte Formulation

Although in a small lab-scale cell and for short-term experiments it is not so relevant, for industrial kWh-scale batteries or long-term experiments, the formulation of the electrolyte could be crucial and should be carefully optimised. Just to understand this, it is necessary to think that an RFB is a dynamic system, where the transport of active materials and water through the membrane can take place causing a decrease in the performance and capacity of the battery. Water transport across the membrane due to osmotic pressure misbalance could concentrate or dilute the active species in one of the tanks. The consequent change in important electrolyte properties such as viscosity and ionic conductivity can substantially decrease the battery efficiency due to increased energy losses associated to electrolyte pumping or increased cell resistance. For these reasons, the formulation of the supporting electrolytes in addition to the active material must be optimized to adjust the ionic strength of both solutions, and the selection of an appropriate ion-exchange membrane is mandatory.

1.2. RFB Cell Components

Once the composition of both electrolytes is properly selected, providing reasonable compromise between high OCV, solubility and ionic conductivity on the one hand and low viscosity and electrolyte stability (chemical and electrochemical) on the other hand, it is necessary to choose the internal components such as the membrane and 3D inert electrodes to reach the maximum offered by the whole system.

1.2.1. Ion-Exchange Membrane

The ion-exchange membrane separates the anolyte and catholyte as well as allowing for the passage of ions (anions and/or cations) through it to balance the charges during the redox processes. In general, homogeneous membranes consist of polymeric structures with different grafted ionic groups that facilitate ionic movement and endow the membrane by selectivity to preferentially transfer ions with a positive or negative charge [30]. Porous non-ionic separators have also been used when the redox active materials are so large that they cannot go through the pores of the separators, allowing only ions to pass through [31]. The main characteristic parameters of ion-exchange membranes are as follows: ion-exchange capacity, water uptake, swelling ratio, ionic conductivity, permeability and permselectivity, among others. The ion-exchange capacity (IEC) represents the concentration of ion-exchange groups (typically related to the mass of dry membrane), which allows ions to pass through the membrane. Different methods have been reported to measure the IEC such as ion exchange with acid–basic titration or pH measurement [32]. An ideal membrane should exhibit high IEC values, but this value cannot be too high because the membrane could become mechanically unstable or less selective and could compromise the battery’s performance [33]. It should be noted that the membranes must have good chemical and mechanical stability under the battery’s operating conditions. The ionic conductivity of the membrane is one of the most important parameters, since by increasing this the cell performance improves in terms of voltage efficiency by reducing the ohmic resistance. At the same time, the membrane must be electronically insulating, otherwise the battery will short-circuit. The ionic conductivity can be measured by different methods, either in an in-plane or through-plane direction, and the ohmic resistance can be determined as the intercept of the Nyquist diagram with the real axis in the high-frequency zone of the electrochemical impedance spectroscopy (EIS), this being the most used technique. In addition, by measuring the polarization curves (also referred to as load curves) of the battery cell at different SOCs, the area-specific resistance of the cell can be determined, which typically includes a significant contribution of the membrane’s ohmic resistance. The membrane should exhibit suitable physical properties in terms of reasonable water uptake and swelling ratio (typically found < 35%). Highly hydrophilic membranes would likely dissolve in the operation media, compromising their mechanical characteristics, especially those with a low degree of grafting [34], and thus may lead to potential battery failure. In this way, in order to improve the ion-exchange membrane performance, different pretreatments or conditioning methods have been implemented. This conditioning step could play a vital role affecting the battery’s resistance, self-discharge-time, coulombic efficiency and permeability [35,36].

1.2.2. Porous Inert Electrodes

In case of electrodes, the main difference with conventional batteries (e.g., Li and Na ion batteries [37]) is that the energy is not stored in the electrodes but in the electrolyte solutions. The electrodes just provide the surface sites where the charge transfer of the electrode reactions takes place. In contrast, in batteries where the electrode participates in the electrochemical reaction, the electrode is transformed and even undergoes phase and/or structural transformations.
Carbon felt electrodes prepared from polymeric precursors by carbonization/graphitization are typically employed in RFBs due to their relative low cost, good electrical conductivity, suitable textural properties and high overpotentials for parasitic water-splitting reactions. Some works have modified the structure of these electrodes to increase the surface hydrophilicity and enhance the charge transfer kinetics and the diffusion of the redox-active materials. In past decades, different conditioning procedures have been reported and employed (typically thermal methods) to clean and activate the surface [38,39].

1.3. RFB Parameters

The understanding of the different parameters as well as the experimental protocols is mandatory for further progress in the development of this technology. One of the most important things in this field is to understand the different parameters that show the quality of the battery performance [40,41,42]. In this sense, a brief but concise explanation of the different RFB parameters can be found in the Supporting Information.

1.4. Capacity Fade Mechanisms

RFBs are not ideal devices, so a lot of work must be conducted to implement them into the electrical grid. All batteries present some inefficiencies, which make them unsuitable to be implemented worldwide. Each component that is incorporated in the device presents different way of leading to inefficiencies. The most common parameters that cause efficiency losses are shown below.
In the case of electrolytes, different side reactions can cause a capacity fade, compromising the lifetime of the battery. Aziz et al. reported that, in general, redox-active materials undergo faster degradation at a higher SOC [27]. This is consistent because charged species are more reactive, so a higher SOC means a higher amount of these sensitive species. It is worth mentioning the electrochemical degradation that an RFB could undergo in any SOC during charging due to H2 and O2 generation, among other phenomena. Different mechanisms for the side reactions have been studied over the last ten years, e.g., the precipitation of inorganic electrolytes, π–π stacking, dealkalization of viologen derivatives, self-oxidation and ring opening or TEMPO derivatives, Michael addition and the dimerization of quinones [43]. The loss of stability of an RAM leads to a decrease in the battery’s capacity (capacity decay or capacity fade). The capacity loss per each cycle is typically evaluated from the charge–discharge cycling and can be expressed in absolute values (mAh/cycle or per day) or in relative values, typically a percentage of the theoretical capacity (Equations (4) and (5), respectively). It is true that the time-related capacity decay provides more information because the duration of the cycle depends on the battery capacity. So, the longer the cycles, the more significant the negative effect of crossover and degradation will be. When high CU values are available, higher concentrations of charged species are presented, and therefore the probability of having large decomposition or secondary reactions is higher. Here, the formula used to calculate the capacity decay is included:
C a p a c i t y   D e c a y   ( C D ) = d Q d i s c h a r g e c y c l e s   ( m A h / c y c l e ) ;
C a p a c i t y   D e c a p y ( C D ) = d Q d i s c h a r g e Q t h e o r e t i c a l · c y c l e s · 100 ( % / c y c l e )
Another parameter related to the capacity decay is the capacity retention, which represents the relationship of the remaining capacity after a given number of cycles and/or some time. It can be expressed as a percentage of the initial capacity.
Besides active species degradation, the cross-mixing of active species from one tank to the other one across the ion-exchange membrane can also significantly contribute to capacity fade. This process is called crossover and leads to self-discharge and also, most critically, to capacity fade. Cross-contamination, in the case of asymmetric (non-mixed) electrolytes, leads to a change in various crucial parameters such as conductivity, viscosity and redox potential of the electrolytes. In addition, the interaction of the charged species and the ion-exchange groups from the membrane with the opposite charge can promote adsorption or fouling through the IEM, and this may increase the membrane’s resistivity.
The last significant origin of capacity fade may be related to parasitic electrode reactions such as hydrogen and oxygen evolution reactions on the negative and positive electrodes, respectively. These, in principle, can proceed whenever the electrode potential extends into the water stability potential window (1.23 V), and their range can be enhanced at a higher SOC and high charging currents [44].
Herein, after a brief but clear description of all the components and the main parameters of RFBs, the paper serves as an introduction to this guided tour along the different pitfalls that a researcher can face. So, showing the effect of the influence of the electrolyte pH, the presence of O2, the pretreatment of the membrane and the capacity-limiting side on the battery’s performance, the reader can take an overview of the different characterization techniques and the methods of analysing the results.

2. Experimental Methods

With the purpose of maintaining the manuscript as concise as possible, detailed information regarding the electrolyte composition, methodologies and techniques employed in this work can be found in the Supporting Information section. Na4[Fe(CN)6] and AQDS compounds were used as redox-active materials for battery performance and were purchased from Sigma-Aldrich. Nafion® 212 was used as the exchange membrane and purchased from the Fuel Cell store. Membrane pre-treatment was used considering the well-established reported methodology for Nafion®. Different electrochemical techniques were employed for electrolyte and battery evaluation, including EIS, CV, LSV and RDE. Concerning the membrane evaluation, permeability experiments and UV-Vis spectroscopy were used for crossover determination. For battery evaluation, the cell was galvanostatically charged/discharged at room temperature using a Biologic multichannel potentiostatic–galvanostaic device coupled with an impedance module BSC-815 in the voltage range of 0–1.1 V at various current densities (20, 40, 60, 80 and 100 mA/cm2, 5 cycles) and cycled for 100 cycles at 80 mA/cm2. The battery was also evaluated considering the effects of pH ranging from 4, 7 and 10. The cell was first charged to 50% SOC, and load curves were carried out to obtain the area-specific resistance at the given conditions. In this process, a current density scan of 1 mA/cm2s was applied until the desired current cut-off ±125 mA/cm2 was reached.

3. Results and Discussion

Having already presented some of the general aspects concerning each component and the proper RFB, here we will begin understanding some aspects of our redox-active materials chemistry by analysing the Pourbaix diagram, its kinetics and diffusion process. Then, we will move a step forward to depict the main pitfalls that a researcher can face. Using different characterization methods such as EIS, load curves (LC) and galvanostatic cycling of the RFB, the influence of some operating parameters such as electrolyte pH, O2 concentration, membrane pretreatment and capacity-limiting side on the RFB’s performance will be highlighted.

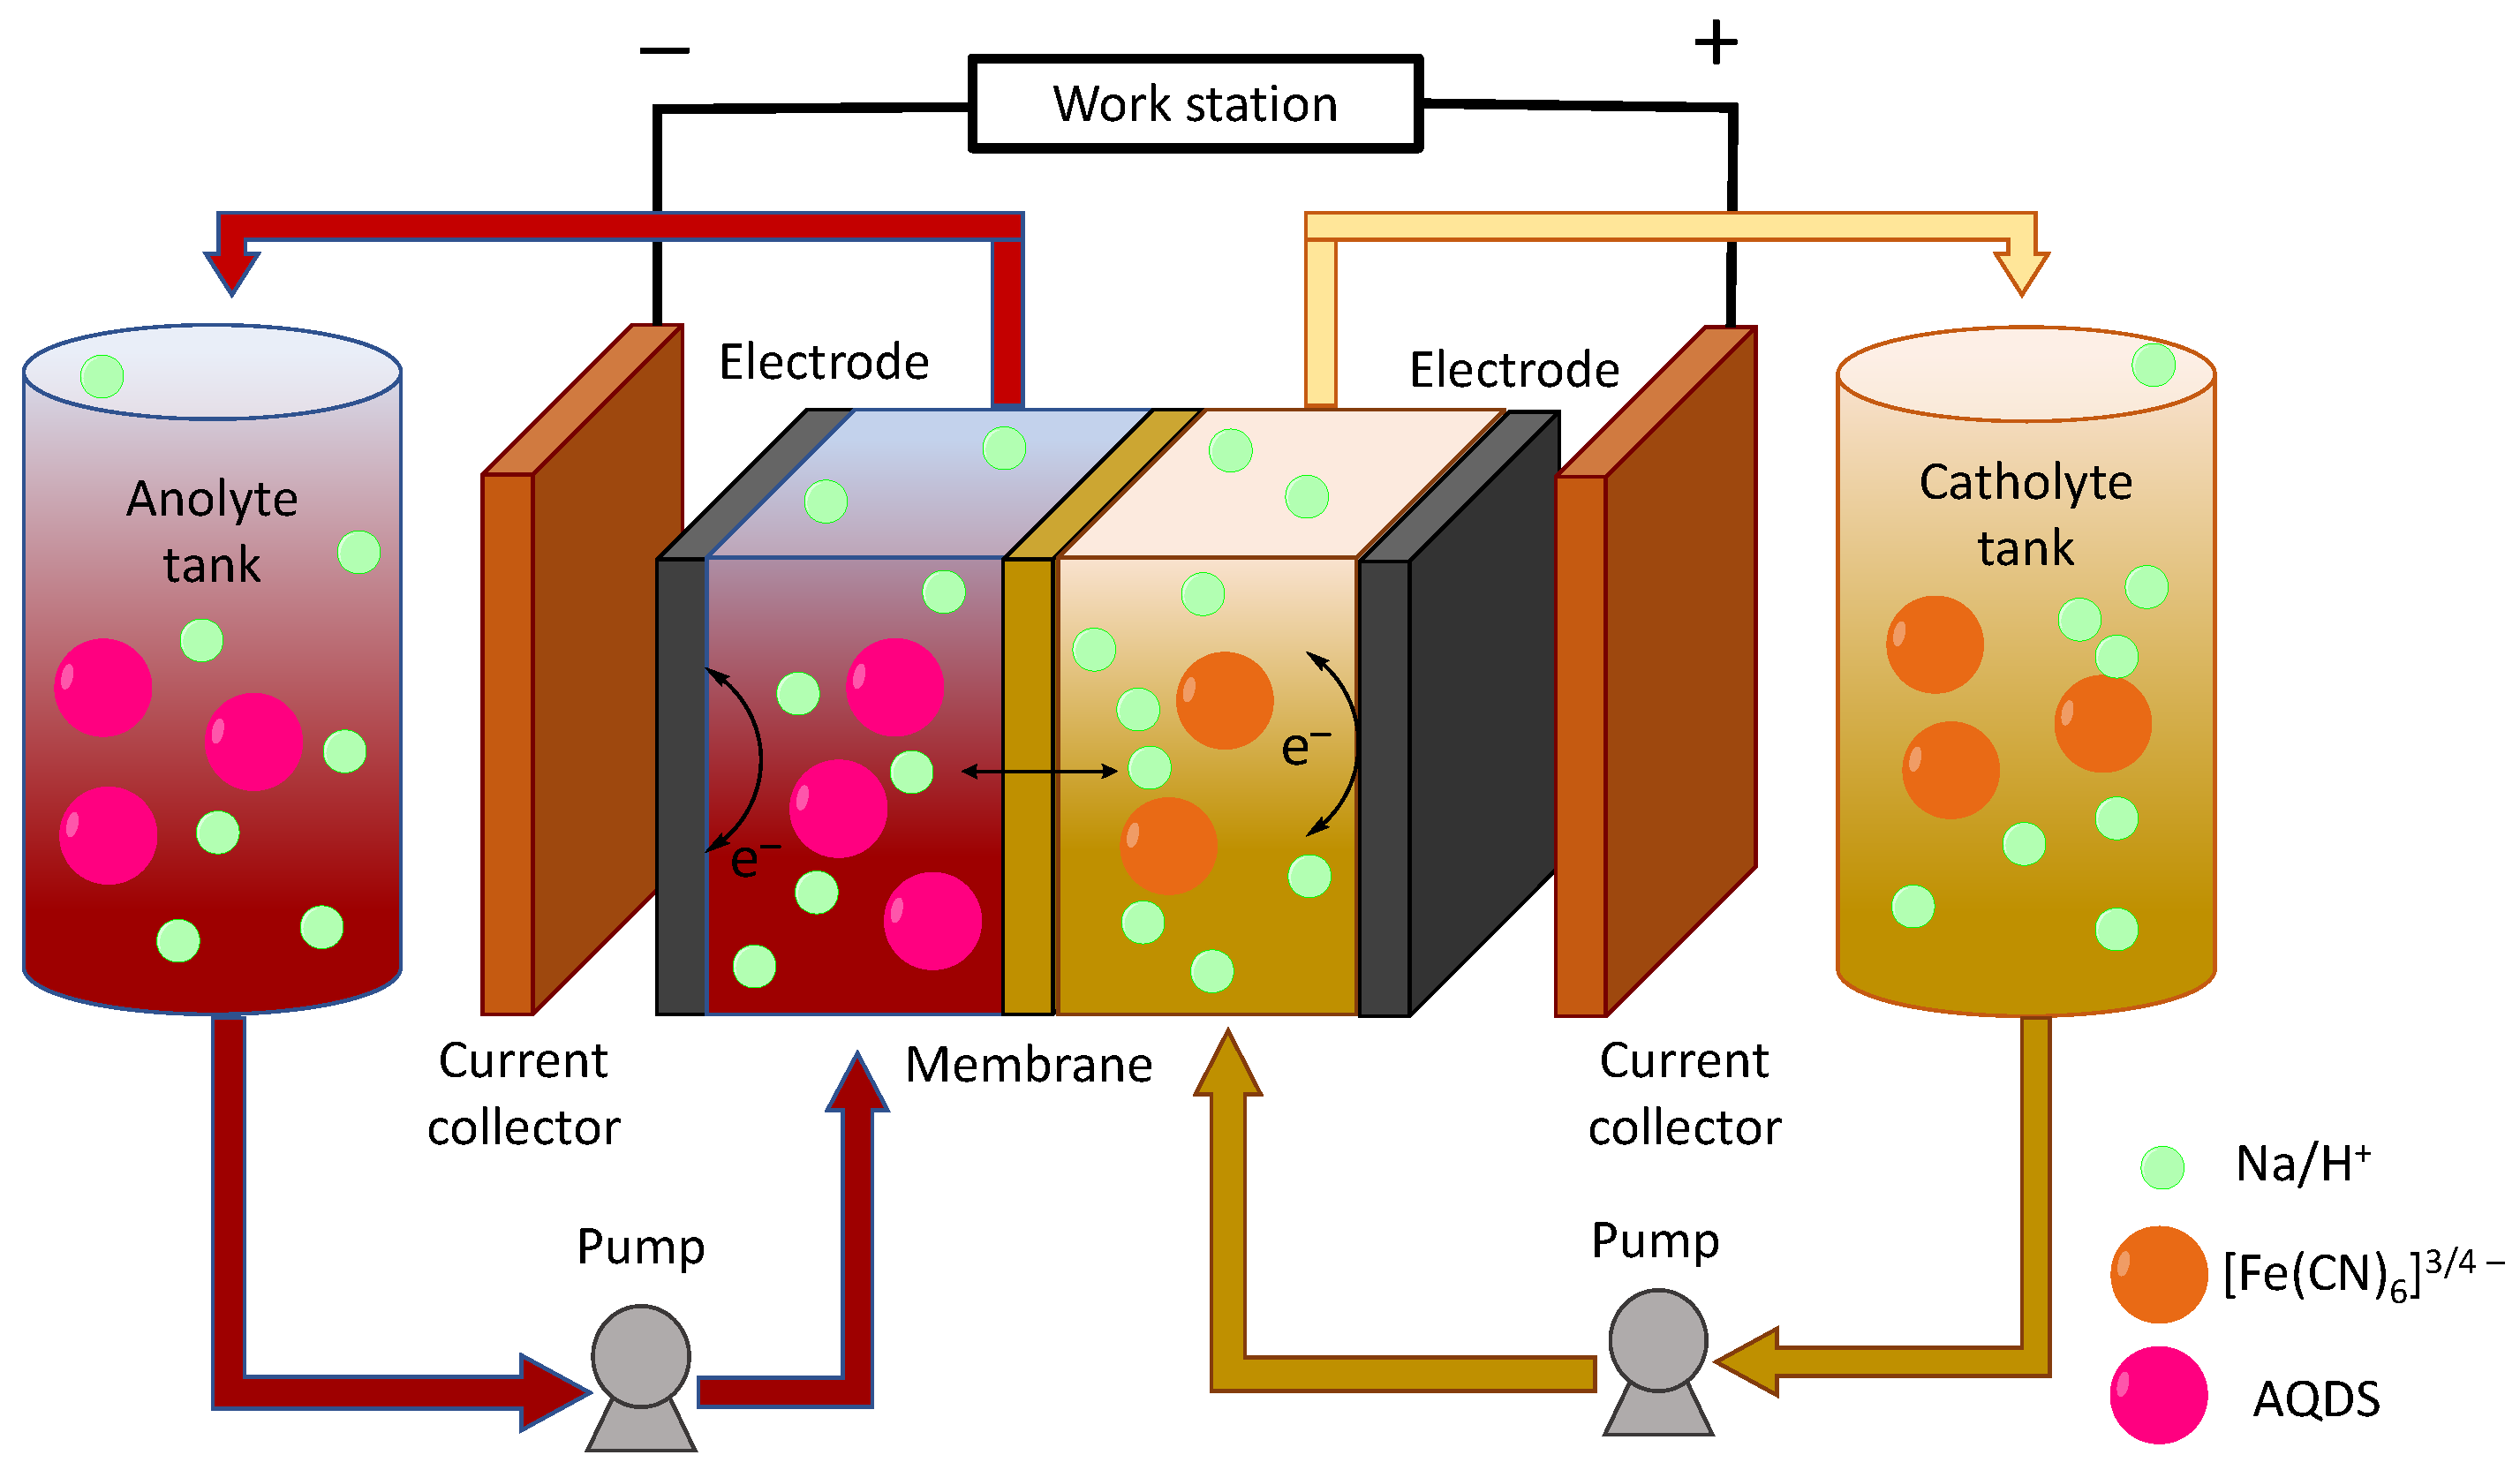
3.1. Experimental Characterization of the AQDS-Ferrocyanide RFB Single Cell

Before setting up any RFB, the electrochemical response of the redox-active materials used must be understood by measuring the cyclic voltammetry of the anolyte and catholyte. As has been discussed above, the AQDS used in this work undergoes a proton-coupled redox reaction. For this reason, the variation in the redox potential at each pH value must be studied. As illustrated in Figure S1, for the AQDS, the potential shifts toward more negative values as pH increases. The Pourbaix diagram as a case study is shown in Figure 2.
According to the Nernst (Equation (3)), E depends on the pH for the redox processes, which are proton-coupled (see mechanisms included in Figure 2). We observed that the slope of the linear relationship E–pH was around 59 mV in the case that the redox reaction included the same number of protons and electrons. For the AQDS, at a pH below 7 (red line), after the reduction, the anthrahydroquinone was fully protonated, so the reduction took two electrons and two protons. If the slope was around 30 mV, this suggests that the redox reaction took double of the electrons than protons. In the pH range 7–11 (green line), the AQDS reduction included two electrons and one proton, thus achieving the partially protonated anthrahydroquinone. The constant value of the redox potential indicated that no protons/hydroxyl ions were involved in the process. At a pH over 11 (black line), the reduced anthraquinone was in a fully deprotonated form and thus the redox potential did not change with the pH, making the slope equal to 0 [45]. The same slope as in the last example was achieved for ferrocyanide in the whole range of pH values because the redox reaction was not proton-coupled. This example showed how, by plotting the Pourbaix diagram, it was possible to calculate the relationship between the protons and electrons consumed in the redox reaction under consideration. The values of redox potentials are usually obtained from CV measurements of very diluted buffered electrolytes. It is important to incorporate buffer solutions, otherwise the pH could be different in the vicinity of the electrode interface. In the case of ferrocyanide, the redox reaction was not proton-coupled, so the redox potential was independent for the whole pH range.
To gain a better understanding of the electrochemical kinetics and mass transport processes of both the redox-active materials, studies using a rotating disk electrode (RDE) were carried out. The diffusion coefficient was determined by the Levich equation (see Equation (S1)) and the values determined were 3.99 × 10⁻⁶ and 4.38 × 10⁻⁶ cm2/s for the AQDS and Na4[Fe(CN)6], respectively. Using the Koutecky–Levich plot and the Tafel plot, the kinetic constant for both the redox-active materials were obtained by extrapolating to infinite rates; so, 9.96 × 10⁻³ and 7.99 × 10⁻³ cm/s were found for the AQDS and Na4[Fe(CN)6], respectively (see Figures S2 and S3 and Equations (S2)–(S4)) [29]. Both results were in a good agreement with the reported results [45]. Lower values than those could compromise the battery performance.
This first characterization of the redox materials must give enough information to elucidate the conditions where the battery should work as initial step. After that, using commercial and well described components (i.e., ion-exchange membranes and carbon felts) the RFB can be set up (see the Supporting Information). Now, by showing different RFB testing cases, we will depict the different pitfalls that a beginner researcher could face. More precisely: the dependence of RFB polarization on the pH of the electrolytes, anolyte chemical degradation due to O2 appearance, membrane pretreatment effects on the battery’s performance and capacity-limiting side effects.

3.2. Effect of pH

The pH of the electrolyte solutions can be a determinant parameter, especially when protons are involved in the redox reaction of active materials. In these cases, the pH changes caused by the reaction can modify the mechanism of the redox reactions, the cell potential (see Figure 2) and ultimately the whole performance of the battery [46]. To study this, the same battery was tested under different initial pH values, namely pH 4, 7 and 10, where the other components were identical (see coulombic, voltage and energy efficiencies and capacity decay at different current densities in the Supporting Information, Figures S6–S8 and Table S1). The comparison of the capacity over 100 cycles will be discussed below. Here, we demonstrated how only the difference in the supporting electrolyte can influence the fundamental battery parameters such as cell voltage, the stability of the redox-active materials and the resistance of the cell.
First, let us see how the ASR of the cell changes due to the different ionic conductivities of the supporting electrolytes. The different resistances were determined from EIS and load curve measurements at different SOCs, and the results are summarized in Table 1 and Figure 3. The LC can be measured by different methods. The most commonly used is the stepwise polarization of the RFB using a fixed current at fixed times. Using this method, after each step of polarization with opposite current values, the battery’s SOC is recovered and levelized values of the battery’s voltage can be extracted [41]. Another less accurate method is the low-speed linear current sweep; the potential of the battery is evaluated under a range of current densities by applying a current scan. Thus, the resistance of the system can be calculated from the slope of the charge and discharge curves. This second method can lead to deviations due to differences in the charge and discharge resistance, the gradual shift of the SOC and the composition in the vicinity of the electrodes potentially changing during the measurement. Despite this, some works have used this method and provided polarization curves very close to point-by-point galvanostatic holds as a consequence of imposing a minimal change in the SOC of small-electrolyte-volume cells [47,48]. In our case, we selected a linear sweep of the current due to the measurement being shorter, and the influence of O2 being potentially minimized (the measurements were performed outside of the glovebox, so longer experiments would lead to a bigger effect of the oxygen in that case). So, from the linear part of the load curves, the resistance Rcharge and Rdischarge under current loading including the ohmic, charge transfer and mass transport polarization of both electrodes were determined (Figure 3).
Looking at the measured LC, we could see a small deviation from linearity and differences between Rcharge and Rdischarge, probably due to the changes in the SOC of the electrolyte. Taking a look to the achieved resistances, we concluded that at 50% SOC (Table 1), the system underwent an activation upon the charging decreasing the ohmic ASR when compared to 0% SOC. In addition, we observed in all cases that Rcharge was always higher than Rdischarge. In addition, the resistance of the cell was intrinsically linked to the ionic conductivity of the electrolytes (Table 1). When carbonate buffer was used for the electrolytes at pH 10, the ionic conductivity was the highest and the cell resistance is the lowest (Green colour). However, in the case of acetate buffer at pH 4, the ionic conductivities of both electrolytes were very low, and thus the cell resistance was increased. Comparing the contribution of the ohmic resistance at 50% SOC with the resistance of the discharging process on each pH studied, we concluded that a higher ionic conductivity of the electrolytes led to a higher contribution of the membrane to the total cell resistance. Note that the charge transfer resistance and the mass transport resistance could also change with a different composition of the electrolytes.
Regarding Ucell, it corresponded to the values measured at the OCV at 50% SOC. The redox potential of the AQDS decreased at higher pH values (Figure 2) and, consequently, the OCV increased. Higher pH values of the electrolytes established a higher OCV, which was observed in the LC at 0 mA/cm2 (see Figure 3). Regarding the voltage and energy efficiencies, the battery showing the highest cell ASR was the one using an electrolyte at pH 4 (lowest ionic conductivity) and therefore it provided the lowest efficiencies. On the other hand, the battery at pH 10 presented the highest ionic conductivity and consequently the highest voltage and energy efficiencies. The stability of the redox-active materials was truly affected by the environment of the electrolyte. An analysis of the capacity fade during the long cycling showed clear differences between the three studied pH values. The battery at pH 10 showed the highest capacity decay per hour and could be because of the low stability of the ferrocyanide in the basic media [49]. The battery at pH 7 was the most stable and it is logical to think that the redox-active materials were more stable in less aggressive solutions showing a notably low-capacity decay.
This study allows us to understand the role of the supporting electrolyte, to introduce the load curves and to compare the different resistances that contribute to the resistance of the whole system. Furthermore, the stability of the RAM and the effect on the battery’s performance were shown, with the neutral pH value being the most stable media, but the basic media, which presented the highest conductivity, also presented the lowest resistance. In this sense, when a battery is being set up, each parameter must be considered in terms of how it will affect its performance. Our next step in this guided tour is the effect of oxygen on the RFB.

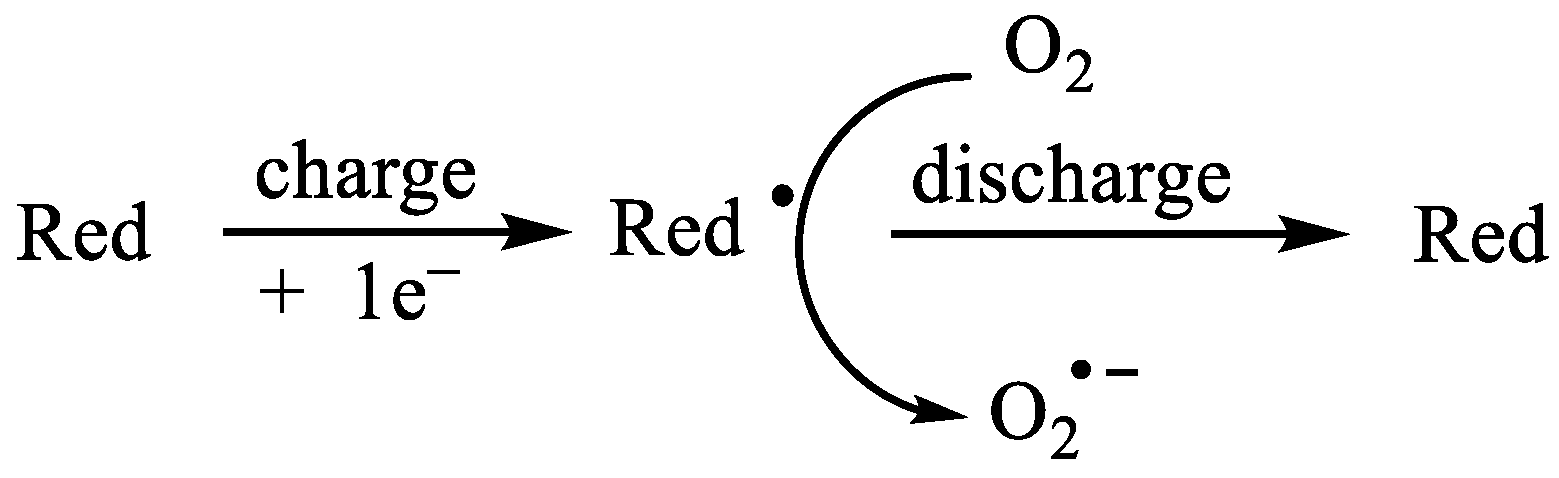
3.3. Effect of Presence of Oxygen

Almost all published works on aqueous organic redox flow batteries have been evaluated inside a glovebox due to the detrimental influence of oxygen on a battery’s efficiency and stability, as it imbalances the SOC of battery´s electrolytes and lowers the CE. The solubility of O2 at room temperature in water is approximately 0.25 mM. Thus, the charge imbalance of the system exposed to O2 depends on how much O2 dissolves in the system, the liquid–gas contact area, the concentration of electroactive species and their reactivity with oxygen and the duration of the experiment [50].
Generally, a large proportion of the examples reported in the literature have used galvanostatic cycling to analyse battery performance. During the charging process, a constant current is applied, raising the voltage up to the selected cut-off (voltage, time, capacity, etc.), and during the discharging process a negative constant current conducts the battery voltage to the selected discharge cut-off, this being considered as a galvanostatic cycle. Setting the same current and cut-offs lets us compare similar systems because, theoretically, the same SOC and CU should be obtained. Let us look at the role of oxygen during the process studied.
Herein, we present three identical redox flow batteries (0.1 M AQDS in 1 M NaCl vs. 0.1 M Na4[Fe(CN)6] in 1 M NaCl, with a pretreated Nafion 212® membrane, 40 mL/min electrolyte flow rate and operated at room temperature) exposed to different amounts of oxygen in the atmosphere to evaluate its influence on the RFB. The first RFB cell and its electrolytes were not purged by nitrogen, the second one was purged and introduced into a home-made nitrogen-filled box ([O2] < 2% molar fraction) and the third one was operated in a commercial nitrogen-filled glovebox ([O2] < 1 ppm).
Firstly, the three systems should present similar initial resistance, otherwise, the results would not be comparable. After checking the resistance of the systems (0.99–1.02 Ohm·cm2), they were charged–discharged at 20 mA/cm2 up to the same cut-offs (1.1–0 V) during five cycles, Figure 4 shows a summary of the data included in Figures S9–S11 and Table S2 for the evaluations performed. The single cell exposed to atmospheric O2 concentrations showed a clear imbalance between both electrolytes. This fact is supported by looking at Figure 4, in particular the black columns. Once the battery was fully charged (first filled black column, 63.0 mAh, 94% SOC), it reacted with the oxygen present in the electrolyte solution, thus discharging the anolyte (first dashed black column, 39.0 mAh, 58.2% SOC), while the catholyte was fully charged. When the next discharging process started, the capacity of the anolyte was lower than the catholyte, and the capacity of the battery was limited by the amount of the reduced anolyte. So, as the single cell was exposed to constant O2 concentrations, O2 permeated into the solution and continuously discharged the battery. When the battery was exposed to smaller amounts of O2, such as in the home-made glovebox system (blue columns), the O2 had a big influence on the first cycle, but when the O2 present in the solution was consumed the effect was almost negligible because permeation was practically suppressed. Finally, if we look at the results achieved when the battery was placed in an atmosphere without O2 (commercial glovebox), the imbalance was negligible and no significant differences between the charge and discharge processes, even in the first cycle, were observed (green columns).
The detrimental effects of O2 content on the RFB performance was demonstrated. The active species in the anolyte was reduced during the charging, and this reduced form, being sensitive to oxygen, reacted with oxygen producing the oxygen radical anion and regenerating the oxidized form of the anolyte (see Figure 5) and consequently discharging the system. Aziz et al. reported the reaction of reduced viologen, generating uncharged viologen and hydroxide anions [51].
An electrochemical oxygen reduction reaction (ORR) could be included with the consequent load consumption, contributing to capacity losses due to faradaic imbalance, but considering the electrode material, the pH value of 7 and the operating conditions this could be ruled out. The irreversible consumption of charge in the anolyte during the charging process caused the anolyte to not reach full charge and, consequently, the discharge capacity was limited, inhibiting the complete discharge of the catholyte, which caused an SOC imbalance between both electrolytes. After highlighting the important effects of O2 in the battery’s performance, the next role of the membrane pretreatment will be discussed

3.4. Effect of Membrane Pretreatment

One of the most important components of redox flow batteries is the ion-exchange membrane, which is responsible for closing the internal circuit by allowing ions to pass between the electrode to preserve electroneutrality and prevent the cross-mixing of the electrolytes. There are different types of ion-exchange membranes, but the most known are cationic (preferentially allowing the passage of cations), anionic (preferentially allowing the passage of anions) and bipolar membranes (provides ions by dissociating the water into protons and hydroxyls) [52].
Nafion membranes® have been widely used due to their good mechanical and chemical properties and good performance in different modes of operation in hydrated acidic environments. Nafion membranes are generally pretreated before use to enhance their ionic conductivity, but this treatment also enhances the cross-mixing of RAMs, as demonstrated in the permeability study. Henceforth, we would like to show the advantages and disadvantages of this conditioning process, pointing out the importance of the careful selection of both the right material and the pre-treatment for a given system. By using the same configuration as in the previous section, the influence on the RFB’s parameters was studied by comparing the membrane resistance determined by EIS at 0% SOC and the permeability results in both systems (Figure 6a,b, respectively).
The comparison between the cell resistance obtained by EIS before cycling allowed us to compare the conductivity of the non-pretreated and pretreated membranes (see Figure 6a). The pretreated membrane (blue crosses) showed a lower intercept with the Z′ axis in the high-frequency part of the EIS. During the boiling process, the membranes extended their polymeric structure, resulting in a different internal conformation, which made the pores larger, and this may have led to more accessible ion-exchange groups, improving the conductivity values (up to 53% higher in the case of the pretreated one compared to the non-pretreated one). However, this also led to increased cross-mixing of the active species due to the enhanced permeability. The RAM’s permeability is a key parameter since it limits the capacity of the battery and may also alter other parameters such as viscosity, stability and others. So, an examination of the permeabilities of redox-active materials were carried out in a H-cell for each membrane, the results being 1.7 × 10⁻³ and 1.3 × 10⁻⁶ cm2/s for the [Fe(CN)6]4− and 8.5 × 10⁻⁴ and 9.9 × 10⁻⁷ for the AQDS in the pretreated and non-pretreated membranes, respectively, (Figure 6b, filled markers and non-filled markers, respectively). Both results were corroborated in the RFB set-up (Figure 7 as a summary of the reported data in Figure S12 and Table S2) despite both membranes showing similar coulombic efficiencies, where the higher resistance of the non-pretreated membrane led to lower voltage and energy efficiencies. The voltage and energy efficiencies using the pretreated membrane (Figure 7, green squares and red triangles, respectively) were around 10% higher than the VE and EE achieved with the non-pretreated membrane (Figure 7, orange squares and grey triangles, respectively). Furthermore, comparing the capacity evolution over the cycles (purple and blue crosses for the non-/pretreated membranes, respectively), a lower capacity decay per hour (−0.33 vs. −0.47 %Qtheo/h) due to the lower permeability was observed for the non-pretreated membrane, as compared to the battery set with the pretreated membrane. As we can see, each component played a different role in the battery’s performance. The use of different amounts of redox-active materials can change the results achieved.

3.5. Effect of Capacity-Limiting Side

Even using the same redox couple, the performance of the battery will change if the catholyte or the anolyte is on the limiting-capacity side. In this section, we studied the different behaviours if the catholyte (ferrocyanide, Figure 8a) or the anolyte (AQDS, Figure 8b) were on the capacity-limiting side.
Both batteries showed similar results in term of capacity fade and coulombic, voltage and energy efficiencies (Figure 8c shows a summary of the data depicted in Figure S13 and Table S4), but it is true that the capacity utilization was higher when AQDS was the CLS compared to when ferrocyanide was the CLS (67.5 vs. 44.9%, respectively). The slightly higher capacity fade when AQDS (blue crosses) was the limiting side was due to the higher capacity utilization of the RAM (−0.18 versus –0.14% Qtheo/cycle, respectively). In this case, the comparison of the loss of capacity per hour led to the opposite trend as a consequence of the different capacity in each experiment. In addition, higher amounts of ferrocyanide provided a higher ionic conductivity, so higher efficiencies were expected.
As a brief summary, in this paper, the experimental results of the same RFB setup but using different conditions were used to highlight the main pitfalls that a beginner can face. Furthermore, the effects of different parameters on the battery’s performance such as the electrolyte pH, the presence of O2, membrane pretreatment and capacity limiting were discussed. At the same time that hundreds of papers have focused on the development and validation of new systems, other works must explain and reinforce the basic concepts and techniques of RFBs. So, this work aimed to help new researchers to understand this complex field.

4. Conclusions

Redox flow batteries are one of the most studied electrochemical energy storage devices due to their promising characteristics and ability to solve the intermittent nature of renewable energies. Nevertheless, there has been a lack of studies in the literature where the basic concepts of RFB are explained by means of different experimental demonstrations. So, this work attempted to be a guide for beginners as well as a reinforcement for all researchers focussing on this field. A brief but concise description of the components and parameters opened the tour. The next step was an example of the minimum electrolyte characterization before showing the RFB results. Through the analysis of different variables such as the pH of the electrolyte, the presence of O2, the pretreatment of the ion-exchange membrane and the capacity-limiting side were studied. The study of the battery at different pH values let us correlate the ionic conductivity of the electrolyte with the system resistance. A higher ionic conductivity provided lower resistance in the system and, therefore, higher voltages and energy efficiencies (53.4%, 34,1% and 12.2% energy efficiencies for electrolytes at pH 10, 7 and 4, respectively). In addition, the RAMs appeared to be more stable at a neutral pH than in basic and acidic media, where side reactions could lead to higher capacity decays. Furthermore, the detrimental role of oxygen was corroborated and the imbalance of the battery in the galvanostatic charging/discharging cycles was demonstrated. In this work, it was shown that anolyte oxidation by dissolved O2 led to decrease in its SoC, while the catholyte remained the same; in extreme cases this effect will lead to complete capacity fade (a catholyte SoC = 100% of a fully discharged battery). This phenomenon was also studied by Ventosa et al. [50]. So, this imbalance can lead to a total failure of the battery’s performance if O2 concentrations are too high. This problem can be solved by cycling the battery inside a glovebox (in the absence of O2). In the case of membrane conditioning, large differences were observed after conditioning Nafion 212®. This study serves as a case study for introducing electrochemical impedance spectroscopy and permeability studies. The pretreated membrane showed a higher ionic conductivity (53% higher), which translated into higher voltage and energy efficiencies (10% higher). On the other hand, the boiling process made the membrane pores larger, easing the cross-mixing of redox-active species (a three orders of magnitude higher permeability), thus decreasing the capacity retention tenfold if the pretreated membrane is used. Regarding the capacity-limiting side of the battery, it was not observed to play a crucial role, showing similar results regarding capacity decay when the anolyte or the catholyte were used as the CLS but higher efficiencies when AQDS was the CLS due to the higher number of ions in the system. Finally, this work does not constitute any step forward in terms of novel or promising results but provides a significant example where the basic concepts and experimental parameters merge to allow an understanding of RFBs.

Supplementary Materials

The following Supporting Information can be downloaded at: https://www.mdpi.com/article/10.3390/batteries8100193/s1, see [7,27,40,41,42,53,54,55].

Author Contributions

Conceptualization, J.A.-P. and P.M. (Petr Mazur); methodology, J.A.-P., I.S.-S. and P.M. (Petr Mazur); writing—original draft preparation, J.A.-P.; writing—review and editing, I.S.-S., P.M. (Petr Mazur), P.M. (Pablo Mauleon), J.R.A.-M. and P.O.; supervision, P.M. (Petr Mazur), P.M. (Pablo Mauleon), J.R.A.-M. and P.O.; funding acquisition, P.M. (Petr Mazur), P.M. (Pablo Mauleon), J.R.A.-M. and P.O. All authors have read and agreed to the published version of the manuscript.

Funding

This research was funded by the European Union under the HIGREEW project, Affordable High-performance Green Redox Flow batteries. Grant agreement 875613. H2020: LC-BAT-4-2019 and the European Regional Development Fund-Project “Organic redox couple-based batteries for energetics of traditional and renewable resources (ORGBAT)”, no. CZ.02.1.01/0.0/0.0/16_025/0007445.

Conflicts of Interest

The authors declare no conflict of interest.

References

  1. Ibrahim, H.; Ilinca, A.; Perron, J. Energy storage systems—Characteristics and comparisons. Renew. Sustain. Energy Rev. 2008, 12, 1221–1250. [Google Scholar] [CrossRef]
  2. Mazúr, P.; Krakowiak, J. Family Tree for Aqueous Organic Redox Couples for Redox Flow Battery Electrolytes: A Conceptual Review. Molecules 2022, 27, 560–599. [Google Scholar]
  3. Arevalo-Cid, P.; Dias, P.; Mendes, A.; Azevedo, J. Redox flow batteries: A new frontier on energy storage. Sustain. Energy Fuels 2021, 5, 5366–5419. [Google Scholar] [CrossRef]
  4. Alotto, P.; Guarnieri, M.; Moro, F.; Stella, A. Redox Flow Batteries for large scale energy storage. In Proceedings of the 2012 IEEE International Energy Conference and Exhibition (ENERGYCON), Florence, Italy, 9–12 September 2012; Volume 1, pp. 293–298. [Google Scholar]
  5. Li, X.; Zhang, H.; Mai, Z.; Zhang, H.; Vankelecom, I. Ion exchange membranes for vanadium redox flow battery (VRB) applications. Energy Environ. Sci. 2011, 4, 1147–1160. [Google Scholar] [CrossRef]
  6. Zeng, L.; Zhao, T.S.; Wei, L.; Jiang, H.R.; Wu, M.C. Anion exchange membranes for aqueous acid-based redox flow batteries: Current status and challenges. Appl. Energy 2019, 1, 622–643. [Google Scholar] [CrossRef]
  7. Ke, X.; Prahl, J.M.; Alexander, J.I.D.; Wainright, J.S.; Zawodzinski, T.A.; Savinell, R.F. Rechargeable redox flow batteries: Flow fields, stacks and design considerations. Chem. Soc. Rev. 2018, 47, 8721–8743. [Google Scholar] [CrossRef] [PubMed]
  8. Khataee, A.; Wedege, K.; Drazevic, E.; Bentien, A. Differential pH as a method for increasing cell potential in organic aqueous flow batteries. J. Mater. Chem. A 2017, 5, 21875–21882. [Google Scholar] [CrossRef]
  9. Hu, B.; Luo, J.; Hu, M.; Yuan, B.; Leo Liu, T. A pH-Neutral, Metal-Free Aqueous Organic Redox Flow Battery Employing an Ammonium Anthraquinone Anolyte. Angew. Chem. Int. Ed. 2019, 58, 16629–16636. [Google Scholar] [CrossRef] [PubMed]
  10. Li, Z.; Jiang, T.; Ali, M.; Wu, C.; Chen, W. Recent Progress in Organic Species for Redox Flow Batteries. Energy Storage Mater. 2022, 50, 105–138. [Google Scholar] [CrossRef]
  11. Petrov, M.; Chikin, D.; Abunaeva, L.; Glazkov, A.; Pichugov, R.; Vinyukov, A.; Levina, I.; Motyakin, M.; Mezhuev, Y.; Konev, D.; et al. Mixture of Anthraquinone Sulfo-Derivatives as an Inexpensive Organic Flow Battery Negolyte: Optimization of Battery Cell. Membranes 2022, 12, 912. [Google Scholar] [CrossRef]
  12. Lloyd, D.; Magdalena, E.; Sanz, L.; Murtomaki, L.; Kontturi, K. Preparation of a cost-effective, scalable and energy efficient all-copper redox flow battery. J. Power Sources 2015, 292, 87–94. [Google Scholar] [CrossRef]
  13. Tucker, M.C.; Phillips, A.; Weber, A.Z. All-iron redox flow battery tailored for off-grid portable applications. ChemSusChem 2015, 8, 3996–4004. [Google Scholar] [CrossRef] [PubMed] [Green Version]
  14. Wu, M.; Jing, Y.; Wong, A.A.; Fell, E.M.; Jin, S.; Tang, Z.; Gordon, R.G.; Aziz, M.J. Extremely Stable Anthraquinone Negolytes Synthesized from Common Precursors. Chem 2020, 6, 1432–1442. [Google Scholar] [CrossRef]
  15. Suttil, J.A.; Kucharyson, J.F.; Escalante-Garcia, I.L.; Cabrera, P.J.; James, B.R.; Savinell, R.F.; Sanford, M.S.; Thompson, L.T. Metal acetylacetonate complexes for high energy density non-aqueous redox flow batteries. J. Mater. Chem. A 2015, 3, 7929–7938. [Google Scholar] [CrossRef]
  16. Luo, J.; Hu, B.; Hu, M.; Wu, W.; Leo Liu, T. An Energy Dense, Powerful, Robust Bipolar Zinc-Ferrocene Redox Flow Battery. Angew. Chem. Int. Ed. 2022, 61, e202204030. [Google Scholar] [CrossRef] [PubMed]
  17. Hatakeyama-Sato, K.; Nagano, T.; Noguchi, S.; Sugai, Y.; Du, J.; Nishide, H.; Oyaizu, K. Hydrophilic Organic Redox-Active Polymer Nanoparticles for Higher Energy Density Flow Batteries. ACS Appl. Polym. Mater. 2019, 1, 188–196. [Google Scholar] [CrossRef]
  18. Moklyak, V.; Hrubiak, A.; Gogitidze, Z.; Yavorski, Y. Biopolimer Peptide Batteries—A New Concept for Environmentally Friendly and Safer Energy Storage. Batteries 2021, 7, 50. [Google Scholar] [CrossRef]
  19. Singh, V.; Kim, S.; Kang, J.; Byon, H.R. Aqueous organic redox flow batteries. Nano Res. 2019, 12, 1988–2001. [Google Scholar] [CrossRef]
  20. Armstrong, C.G.; Toghill, K.E. Stability of molecular radicals in organic non-aqueous redox flow batteries: A mini review. Electrochem. Commun. 2018, 91, 19–24. [Google Scholar] [CrossRef] [Green Version]
  21. Mao, J.; Ruan, W.; Chen, Q. Understanding the Aqueous Solubility of Anthraquinone Sulfonate Salts: The Quest for High Capacity Electrolytes of Redox Flow Batteries. J. Electrochem. Soc. 2020, 167, 070522–070527. [Google Scholar] [CrossRef]
  22. Mazur, P.; Charvat, J.; Mrlik, J.; Procedic, J.; Akrman, J.; Kubac, L.; Rehakova, B.; Kosek, J. Evaluation of Electrochemical Stability of Sulfonated Anthraquinone-Based Acidic Electrolyte for Redox Flow Battery Application. Molecules 2021, 26, 2484. [Google Scholar] [CrossRef] [PubMed]
  23. Luo, J.; Hu, B.; Debruler, C.; Bi, Y.; Zhao, Y.; Yuan, B.; Hu, M.; Wu, W.; Liu, T.L. Unprecedented Capacity and Stability of Ammonium Ferrocyanide Catholyte in pH Neutral Aqueous Redox Flow Batteries. Joule 2019, 3, 149–163. [Google Scholar] [CrossRef] [Green Version]
  24. Schwan, S.; Schroder, D.; Wegner, H.A.; Janek, J.; Mollenhauer, D. Substituent Pattern Effects on the Redox Potentials of Quinone-Based Active Materials for Aqueous Redox Flow Batteries. CheSusChem 2020, 13, 5480–5488. [Google Scholar] [CrossRef] [PubMed]
  25. Wedege, K.; Drazevic, E.; Konya, D.; Bentien, A. Organic Redox Species in Aqueous Flow Batteries: Redox Potentials, Chemical Stability and Solubility. Sci. Rep. 2016, 6, 39101–39114. [Google Scholar] [CrossRef] [PubMed] [Green Version]
  26. Goulet, M.A.; Aziz, M.J. Flow Battery Molecular Reactant Stability Determined by Symmetric Cell Cycling Methods. J. Electrochem. Soc. 2018, 165, A1466–A1479. [Google Scholar] [CrossRef] [Green Version]
  27. Kwabi, D.G.; Ji, Y.; Aziz, M.J. Electrolyte Lifetime in Aqueous Organic Redox Flow Batteries: A Critical Review. Chem. Rev. 2020, 120, 6467–6489. [Google Scholar] [CrossRef]
  28. Nolte, O.; Volodin, I.A.; Stolze, C.; Hager, M.D.; Schubert, U.S. Trust is good, control is better: A review on monitoring and characterization techniques for flow battery electrolytes. Mater. Horiz. 2021, 8, 1866–1925. [Google Scholar] [CrossRef] [PubMed]
  29. Wang, H.; Sayed, S.Y.; Luber, E.J.; Olsen, B.C.; Shirurkar, S.M.; Venkatakrishnan, S.; Tehafse, U.M.; Farquhar, A.K.; Smotkin, E.S.; McCreery, R.L.; et al. Redox Flow Batteries: How to Determine Electrochemical Kinetic Parameters. ACS Nano 2020, 14, 2575–2584. [Google Scholar] [CrossRef] [PubMed]
  30. Prifti, H.; Parasuraman, A.; Winardi, S.; Lim, T.M.; Skyllas-Kazakos, M. Membranes for Redox Flow Batteries Applications. Membranes 2012, 2, 275–306. [Google Scholar] [CrossRef] [Green Version]
  31. Tung, S.O.; Fisher, S.L.; Kotov, N.A.; Thompson, L.T. Nanoporous aramid nanofibre separators for nonaqueous redox flow batteries. Nat. Commun. 2018, 9, 4193–4202. [Google Scholar] [CrossRef] [Green Version]
  32. Kreuer, K.D.; Jannasch, P. A practical method for measuring the ion exchange capacity decrease of hydroxide exchange membranes during intrinsic degradation. J. Power Sources 2018, 375, 361–367. [Google Scholar] [CrossRef]
  33. Vega, J.A.; Chartier, C.; Mustain, W.E. Effect of hydroxide and carbonate alkaline media on anion exchange membranes. J. Power Sources 2010, 195, 7176–7182. [Google Scholar] [CrossRef]
  34. Nagarale, R.K.; Gohil, G.S.; Shahi, V.K. Recent developments on ion-exchange membranes and electro-membrane processes. Adv. Colloid Interface Sci. 2006, 119, 97–130. [Google Scholar] [CrossRef]
  35. Jiang, B.; Yu, L.; Wu, L.; Mu, D.; Liu, L.; Xi, J.; Xi, J.; Qiu, X. Insights into the Impact of the Nafion Membrane Pretreatment Process on Vanadium Flow Battery Performance. ACS Appl. Mater. Interfaces 2016, 8, 12228–12238. [Google Scholar] [CrossRef] [PubMed]
  36. Pujiastuti, S.; Onggo, H. Effect of various concentration of sulfuric acid for Nafion membrane activation on the performance of fuel cell. AIP Conf. Proc. 2016, 1711, 060006. [Google Scholar] [CrossRef] [Green Version]
  37. Nayak, P.K.; Yang, L.; Brehm, W.; Adelhelm, P. From Lithium-Ion to Sodium-Ion Batteries: Advantages, Challenges, and Surprises. Angew. Chem. Int. Ed. 2018, 57, 102–120. [Google Scholar] [CrossRef]
  38. Wang, W.H.; Wang, X.D. Investigation of Ir-modified carbon felt as the positive electrode of an all-vanadium redox flow battery. Electrochim. Acta 2007, 52, 6755–6762. [Google Scholar] [CrossRef]
  39. García-Acalde, L.; Gonzalez, Z.; Barreda, D.; Rocha, V.G.; Blanco, C.; Santamaria, R. Unraveling the relevance of carbon felts surface modification during electrophoretic deposition of nanocarbons on their performance as electrodes for the VO2+/VO2+ redox couple. Appl. Surf. Sci. 2021, 569, 151095–151102. [Google Scholar] [CrossRef]
  40. Ghimire, P.C.; Bhattari, A.; Lim, T.M.; Wai, N.; Skyllas-Kazacos, M.; Yan, Q. In-Situ Tools Used in Vanadium Redox Flow Battery. Batteries 2021, 7, 53. [Google Scholar] [CrossRef]
  41. Yao, Y.; Lei, J.; Ai, F.; Lu, Y.-C. Assessment methods and performance metrics for redox flow batteries. Nat. Energy 2021, 6, 582–588. [Google Scholar] [CrossRef]
  42. Li, M.; Odom, S.A.; Pancoast, A.R.; Robertson, L.A.; Vaid, T.P.; Agarwal, G.; Doan, H.A.; Wang, Y.; Suduwella, T.M.; Bheemireddy, S.R.; et al. Experimental Protocols for Studying Organic Non-aqueous Redox Flow Batteries. ACS Energy Lett. 2021, 6, 3932–3943. [Google Scholar] [CrossRef]
  43. Liu, Y.; Chen, Q.; Zhang, X.; Ran, J.; Han, X.; Yang, Z.; Xu, T. Degradation of electrochemical active compounds in aqueous organic redox flow batteries. Curr. Opin. Electrochem. 2022, 32, 100895–100902. [Google Scholar] [CrossRef]
  44. Wei, L.; Zhao, T.S.; Xu, Q.; Zhou, Q.X.; Zhang, Z.H. In-Situ investigation of hydrogen evolution behavior in vanadium redox flow batteries. Appl. Energy 2017, 190, 1112–1118. [Google Scholar] [CrossRef]
  45. Huskinson, B.; Marshak, M.P.; Suh, C.; Er, V.; Gerhardt, M.R.; Galvin, C.J.; Chen, X.; Aspuru-Guzik, A.; Gordon, R.G.; Aziz, M.J. A metal-free organic inorganic aqueous flow battery. Nature 2014, 505, 195–198. [Google Scholar] [CrossRef]
  46. Wiberg, C.; Busch, M.; Evenäs, L.; Ahlberg, E. The electrochemical response of core-functionalized naphthalene Diimides (NDI)—A combined computational and experimental investigation. Electrochim. Acta 2021, 367, 137480–137491. [Google Scholar] [CrossRef]
  47. Kwabi, D.G.; Lin, K.; Ji, Y.; Kerr, E.F.; Goulet, M.A.; Porcellinis, D.D.; Tabor, D.P.; Pollack, D.A.; Aspuru-Guzik, A.; Gordon, R.G.; et al. Alkaline Quinone Flow Battery with Long Lifetime at pH 12. Joule 2018, 2, 1894–1906. [Google Scholar] [CrossRef]
  48. Mazur, P.; Mrlik, J.; Charvat, J.; Pocedic, J.; Vrana, J.; Dundalek, J.; Kosek, J. A complex four-point method for the evaluation of ohmic and faradaic losses within a redox flow battery single-cell. MehodsX 2019, 6, 534–539. [Google Scholar] [CrossRef]
  49. Fell, E.M.; De Porcellinis, D.; Jing, Y.; Gutierrez-Venegas, V.; Gordon, R.G.; Granados-Foncil, S.; Aziz, M.J. Long-Term Stability of Ferri-/Ferrocyanide as an Electroactive Component for Redox Flow 2 Battery Applications: On the Origin of Apparent Capacity Fade; Cambridge Open Engage: Cambridge, UK, 2022; submitted. [Google Scholar]
  50. Páez, T.; Martínez-Cueva, A.; Marcilla, R.; Palma, J.; Ventosa, E. Mitigating capacity fading in aqueous organic redox flow batteries through a simple electrochemical charge balancing protocol. J. Power Sources 2021, 512, 230516–230524. [Google Scholar] [CrossRef]
  51. Beh, E.S.; Porcellinis, D.D.; Garcia, R.L.; Xia, K.T.; Gordon, R.G.; Aziz, M.J. A Neutral pH Aqueous Organic—Organometallic Redox Flow Battery with Extremely High Capacity Retention. ACS Energy Lett. 2017, 2, 639–645. [Google Scholar] [CrossRef] [Green Version]
  52. Pärnamäe, R.; Mareev, S.; Nikonenko, V.; Melnikov, S.; Sheldeshov, N.; Zabolotskii, V.; Hamelers, H.V.M.; Tedesco, M. Bipolar membranes: A review on principles, latest developments, and applications. J. Membr. Sci. 2021, 617, 118538–118563. [Google Scholar] [CrossRef]
  53. Baricci, A.; Zago, M.; Casalegno, A. Modelling analysis of heterogenity og ageing in high temperature polymer electrolyte fuel cells. Insights into of electrochemical impedance spectra. Electrochim. Acta 2016, 222, 596–607. [Google Scholar]
  54. Zheng, Q.; Xing, F.; Li, X.; Ning, G.; Zhang, H. Flow feld design and optimization based on the mass transport polarization regulation in a fow-through type vanadium fow battery. J. Power Sources 2016, 324, 402–411. [Google Scholar]
  55. Wagner, N.; Gülzow, E. Change of electrochemical impedance spectra (EIS) with time during CO-poisoning of the Pt-anode in membrane fuel cell. J. Power Sources 2004, 127, 341–347. [Google Scholar]
Figure 1. Scheme of an RFB using AQDS and Na4[Fe(CN)6] as redox–active materials.
Batteries 08 00193 g001
Scheme 1. Electrochemical reactions of redox–active materials used in our RFB.
Batteries 08 00193 sch001
Figure 2. Pourbaix diagram of AQDS evaluated from CV measurements at different pH values on WE: glassy carbon, CE: platinum wire and RE: Ag|AgCl. A total of 10 mM AQDS in 1 M KCl at 5 mV/s was used.
Batteries 08 00193 g002
Figure 3. Load curves measured at 50% SOC at different pH values. A total of 0.08 M AQDS in 1 M buffer solution vs. 0.2 M Na4[Fe(CN)6] in 1 M buffer solution was used, using pretreated Nafion 212® membrane. Scan rate: 1 mA/cm2·s.
Batteries 08 00193 g003
Figure 4. Comparison of the fived first cycles at 20 mA/cm2 for battery exposed to different concentrations of O2. Black colour: single cell exposed to atmospheric concentrations of oxygen; blue colour: single cell inside a home-made glovebox with concentration of O2 < 2% and green colour: single cell cycle inside a glovebox (<1% O2). Filled columns and dashed column represent charge and discharge capacity, respectively. A total of 0.1 M AQDS in 1 M NaCl vs. 0.1 M Na4[Fe(CN)6] in 1 M NaCl was used, using pretreated Nafion 212® membrane.
Batteries 08 00193 g004
Figure 5. Schematic representation of the reaction between the anolyte and the oxygen.
Batteries 08 00193 g005
Figure 6. (a) Electrochemical impedance spectroscopy for both batteries in the high-frequency region of the Nyquist plot and schematic representation of the different resistances of the whole system. (b) Permeability evaluated from measurement in a H-cell using 100 mM of RAM in 1 M NaCl vs. 1 M NaCl for one week.
Batteries 08 00193 g006
Figure 7. Comparison of the voltage and energy efficiencies for both batteries in 100 cycles at 100 mA/cm2. Coulombic efficiency (almost equal for both batteries): blue diamond. Voltage efficiency: green and orange squares (Na4[Fe(CN)6 and AQDS as CLS, respectively). Energy efficiency: red and grey triangles (Na4[Fe(CN)6 and AQDS as CLS, respectively). Discharge capacity: blue and purple crosses. (Na4[Fe(CN)6 and AQDS as CLS, respectively). A total of 0.1 M AQDS in 1 M NaCl vs. 0.1 M Na4[Fe(CN)6] in 1 M NaCl was used, using pretreated and non-pretreatead Nafion 212® membranes.
Batteries 08 00193 g007
Figure 8. Comparison of charge/discharge profiles at different current densities (20, 40, 60, 80 and 100 mA/cm2) for batteries using different capacity-limiting sides (CLS): (a) 0.1 M AQDS in 1 M NaCl vs. 0.1 M Na4[Fe(CN)6] in 1 M NaCl, (b) 0.08 M AQDS in 1 M NaCl vs. 0.2 M Na4[Fe(CN)6] in 1 M NaCl, using pretreated Nafion 212® membrane. (c) Comparison of the voltage and energy efficiencies for both batteries in 100 cycles at 100 mA/cm2. Coulombic efficiency (almost equal for both batteries): blue diamond. Voltage efficiency: green and orange squares (Na4[Fe(CN)6 and AQDS as CLS, respectively). Energy efficiency: red and grey triangles (Na4[Fe(CN)6 and AQDS as CLS, respectively). Discharge capacity: blue and purple crosses. (Na4[Fe(CN)6 and AQDS as CLS, respectively).
Batteries 08 00193 g008
Table 1. Open cell voltage, resistance at different SOCs, ion conductivity of the different electrolytes, energy efficiencies and capacity decay at different pH values.
ParameterUnitpH 4pH 7pH 10
UcellV0.4550.6240.728
Rohm (0% SOC)Ohm·cm21.911.871.58
Rohm (50% SOC) Ohm·cm21.931.851.54
Rdisch (50% SOC) Ohm·cm23.833.212.30
Rcharge (50% SOC) Ohm·cm23.512.872.19
Rohm (50% Soc)/Rdisch-50.457.667.0
Ionic conductivitymS/cm21.2(A)41.9(C)21.2(A) 54.7(C)41.9(A)54.7(C)
Energy efficiencies %12.234.153.4
Capacity decay%Qtheo/h−0.21−0.10−0.38
Note: (A) is for the ionic conductivity of the anolyte and (C) for the catholyte. The coulombic, voltage and energy efficiencies and the capacity evolution in 100 cycles at 100 mA/cm2 for each battery can be found in Supporting Information (Figures S10–S12). Blue pH 4, Red pH 7 and Green pH 10.
Publisher’s Note: MDPI stays neutral with regard to jurisdictional claims in published maps and institutional affiliations.

