
Li-ion Electrode Microstructure Evolution during Drying and Calendering
by
 , , and
Mojdeh Nikpour
1 ,
,
Baichuan Liu
1,
Paul Minson
2,
Zachary Hillman
1,
Brian A. Mazzeo
3 and
Dean R. Wheeler
1,* 1
Department of Chemical Engineering, Brigham Young University, Provo, UT 84602, USA
2
Department of Physics and Astronomy, Brigham Young University, Provo, UT 84602, USA
3
Department of Electrical and Computer Engineering, Brigham Young University, Provo, UT 84602, USA
*
Author to whom correspondence should be addressed.
Batteries 2022, 8(9), 107; https://doi.org/10.3390/batteries8090107
Submission received: 22 July 2022
/
Revised: 17 August 2022
/
Accepted: 21 August 2022
/
Published: 1 September 2022
(This article belongs to the Section Battery Modelling, Simulation, Management and Application)
Abstract
:The drying process of electrodes might seem to be a simple operation, but it has profound effects on the microstructure. Some unexpected changes can happen depending on the drying conditions. In prior work, we developed the multiphase-smoothed-particle (MPSP) model, which predicted a relative increase in the carbon additive and binder adjacent to the current collector during drying. This motivated us to undertake the present experimental investigation of the relationship between the drying rate and microstructure and transport properties for a typical anode and cathode. Specifically, the drying rate was controlled by means of temperature for both an NMC532 cathode and graphite anode. The material distribution was analyzed using a combination of cross-section SEM images and the energy-dispersive X-ray spectroscopy elemental maps. The binder concentration gradients were developed in both the in- and through-plane directions. The through-plane gradient is evident at a temperature higher than 150 °C, whereas the in-plane variations resulted at all drying temperatures. The measurements identified an optimum temperature (80 °C) that results in high electronic conductivity and low ionic resistivity due to a more uniform binder distribution. Trends in transport properties are not significantly altered by calendering, which highlights the importance of the drying rate itself on the assembled cell properties.
1. Introduction
Li-ion electrode fabrication involves multiple steps: mixing, coating, drying, and calendering [1,2,3,4]. There have been studies on these steps, but not all the conclusions are consistent [3,5,6,7]. Relevant to the present study, different and sometimes contradictory arguments have been made on the effects of the drying conditions on the electrode performance, including of the sometimes-observed migration of binder during the drying process [3,5,8,9,10,11] Binder migration typically refers to the accumulation of binder on the top surface of the electrode and is associated with a reduced cell performance in one case [9], but seems to have not been problematic in another study [12]. One study proposed that there is a receding consolidation layer (i.e., a crust) starting from the top surface [9]. Later on, this hypothesis was rejected by the same group when they showed that film shrinkage happens homogenously during drying [10].
Note that the redistribution problem of binder is a separate issue from the overall electrode formulation, which means that, even when there are adequate overall amounts of active material, carbon, or binder in an electrode, they may not be optimally distributed. For example, the scarcity of conductive carbon black and binder near the current collector can contribute to the detachment and isolation of the electrode film from the substrate and otherwise increase the contact resistance. Note that there is a strong association of binder with high-surface-area carbon black and, therefore, the carbon and binder form a mesoscopically homogeneous phase. Thus, any lack of carbon black and binder decreases both the adhesion to the current collector, as well as the electronic transport at this interface. This will, in turn, affect the electrochemical reaction on all active-material surfaces and raise the cell overpotential.
Another issue is with standard commercial quality-control methods that are conducted after calendering. They might not detect problems that arise at earlier stages. For instance, optical defect detection is not sufficient to address all the heterogeneities that can develop during manufacturing. Furthermore, there is no standard method for binder-migration detection. More broadly, the experimental investigation of the microstructure while the electrode is drying is challenging due to three main reasons: (1) the battery slurry is opaque, consisting of a high solid content; (2) the drying process involves a multiphase system with both liquid, solid, and pores at the micrometer-length scale; (3) the slurry is coated as a thin layer that is usually dried at high rates, which makes tracking the phase transition even harder.
Even though binder migration has received some attention in the battery academic community, the drying conditions under which binder migration becomes an issue for the electrode transport properties are still unclear. Plus, most studies have been conducted for anodes. Therefore, this work addresses the binder-migration issue for two representative cases, an NMC532 cathode and a graphite anode, and focuses on determining the drying conditions under which the binder migration becomes significant. Furthermore, the extent to which calendering worsens or mitigates the effects of drying-induced defects is examined. This is performed by tracking the elemental distribution and charge-transport nonuniformities that are initiated during drying, and that remain even after calendering [13].
Multiple drying rates are studied by changing the drying temperature. In this way, the effects of convection, diffusion, or possible sedimentation can be distinguished, as the first two are amplified at a high drying rate, while the last effect is more pronounced at a lower drying rate because the particles have more time to settle. Such effects are quantified by tracking the microstructure and charge-transport properties. The electrochemical-performance properties of the electrodes have not been tested yet but could be part of future work. We also compare results between dried and calendered structures to assess the persistence of effects due to the drying rate.
Electrode microstructure properties: Based on our previous modeling study [13], we expect the bottom and top surfaces of the electrode to respond to the drying process differently than the interior region does. Therefore, the in- and through-plane-direction elemental-composition heterogeneity was analyzed based on SEM cross-sectional images and energy-dispersive X-ray spectroscopy (EDS). This analysis can help determine the nonuniform particle distributions across and through the film thickness. To ensure the reliability of the conclusions, three different electrode cross sections (250 175 µm2 area) from two separate batches of an NMC cathode and graphite anode were studied for the microstructure properties.
Electrode transport properties: Another way of quantifying the effect of the drying rate on the electrode microstructure is to measure the ability to transport charge. The local and overall differences in electronic and ionic transport reflect the microstructure differences among the electrodes dried at different rates. Electronic and ionic maps provide local charge-transfer data over a 2.4 cm × 2.4 cm electrode area. A flexible microcontact probe was used to measure the electronic conductivity [14]. The ionic resistivity is expressed as a MacMullin number based on localized blocking-electrolyte measurements [15]. These maps are intended to provide an areal presentation of the transport-property variability. The average electronic conductivity and ionic resistivity can help identify the optimal drying rate (temperature) that results in a lower transport resistivity.
The first part of this paper constitutes a review of prior literature on the topic of electrode drying, and it is followed by the new results for the NMC532 cathode and graphite anode dried at different rates.
1.1. Electrode Drying Process
This section reviews what is known about microstructure evolution during the drying process. We are particularly interested in how solvent evaporation leads to a particular microstructure and the resulting electrode defects.
Battery slurries are suspensions that consist of a large amount of solid material (active material and conductive carbon) that is dispersed in a liquid containing a solubilized polymeric binder. The solid particles are subject to random Brownian motion in the liquid medium, as well as particle-based forces, which affect the microstructure properties and rheology during the mixing and coating processes. Such effects also contribute to the phase distribution in the subsequent dried and calendered porous structures [16]. The focus of this work is on the drying and calendering steps.
The carbon–binder domain (CBD) occurs when binder associates with high-surface-area carbon additive and forms nanoporous regions on the same size scale as the active material and that are often distinct from larger pores. In our prior modeling work, the CBD was successfully approximated as a quasi-homogeneous particle with distinct mechanical and transport properties. For instance, the CBD is much more elastic than active material.
Evaporation, convection, diffusion, and sedimentation happen simultaneously during electrode drying [17]. The final location of the electrode components and the subsequent electrode features are determined by these phenomena. For example, the convective and capillary forces may cause the binder to migrate toward the top surface, whereas some of the binder particles can still diffuse back toward the substrate (binder homogenization) through the still-connected solvent reservoirs [9,10]. Sedimentation due to gravitational-force and density differences mostly affects the active-material distribution, as the active material is a denser phase compared with the CBD and solvent. However, sedimentation is not significant given the high viscosity of the Li-ion electrode slurry and relevant manufacturing timescale [18].
Among the different solid components of the battery slurry, the carbon black and binder are more subject to capillary-pressure-driven migration (redistribution). This can be due to the small carbon particle size (50 nm) and binder-chain length (15 nm) [19], such that the hydrodynamic flow has a significant effect on them.
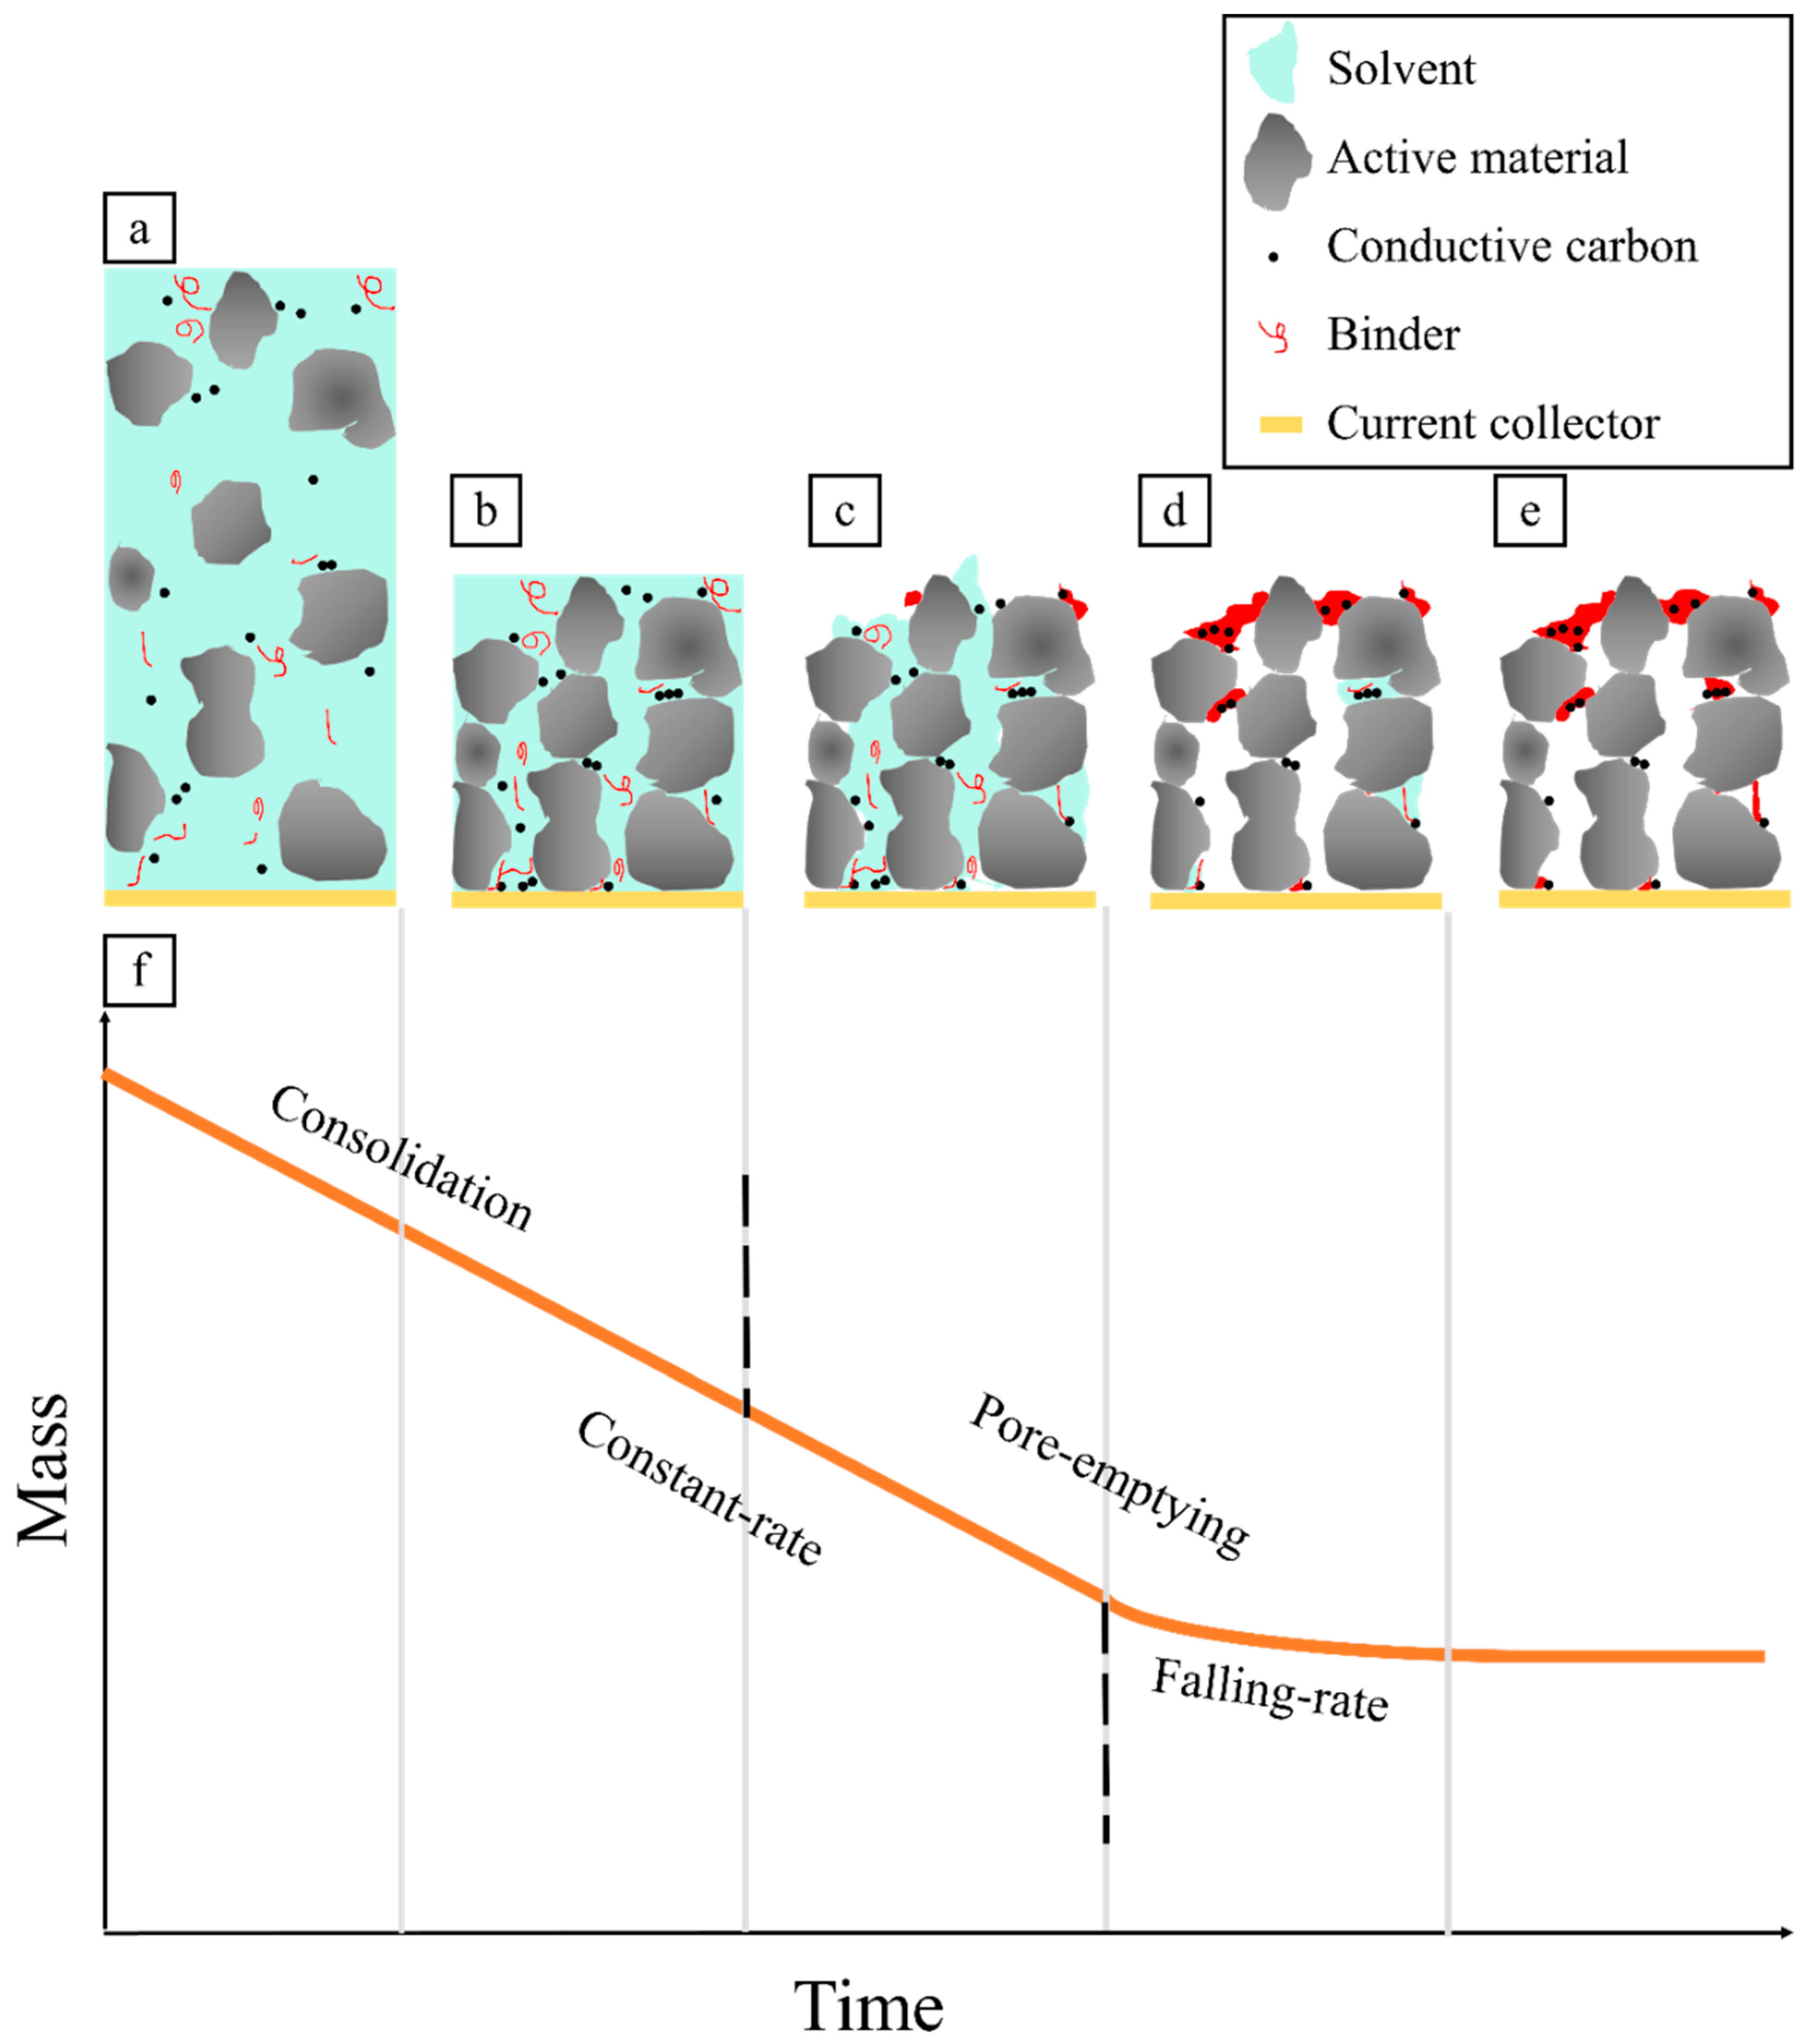
The drying mechanism of a slurry is illustrated in Figure 1. It is frequently divided into constant-rate and falling-rate regimes. In the battery community, some researchers instead divide the process into consolidation and pore-emptying regimes [3,5,6,10,18,20,21,22,23]. As indicated, these two ways of dividing the drying process are not exactly the same in an electrode film.
During the consolidation regime, the solvent evaporates from the top surface at a constant rate, and the electrode thickness starts to decrease as the solid particles move closer together.
At the end of film shrinkage (Figure 1b), when the hard active particles make contact and establish a semirigid skeleton, a capillary network is developed throughout the electrode film. Some pores start to empty as a result of evaporation, and the remaining pores will deliver more solvent to the emptying ones because of capillary action (Figure 1c). Assuming the solvent tends to wet the surface of the solid particles, capillary forces cause the solvent to flow from large (nearly empty) to smaller (fully or partially saturated) pores. Note that solvent evaporation still takes place at a constant rate overall from the microscopic distribution of saturated liquid reservoirs throughout the electrode (Figure 1d).
At this point, the solvent distribution is not uniform across the thickness of the film, which means that larger pores empty first, regardless of their location [3]. Therefore, electrode drying is not manifested simply as the liquid level dropping.
Near the end of drying, any remaining isolated solvent cluster must overcome an additional transport resistance through the gas phase of the empty pores. This results in a decreased mass transfer and a falling-rate regime [24,25]. As shown in Figure 1f, the majority of the drying process happens in the constant-rate regime, where small pores remain saturated during most of the electrode drying [3].
A simulation of this capillary-driven drying mechanism is described in our previous work and is called the network-favored model of the drying process [13].
1.2. Electrode Defects from the Drying Process
Studying the thin-electrode microstructure is challenging due to the phase transition of a multicomponent system that is subject to significant changes during a short amount of time. Three types of deleterious physical changes have been observed for Li-ion electrodes during drying: particle redistribution, electrode delamination, and cracking. These changes can lower the cell capacity and performance [3,6,9,10,26].
Material redistribution (migration): There are multiple sources of particle redistribution. As previously mentioned, the pressure gradient among pores drives the capillary movement of solvent. The same solvent movement can drag carbon black and binder to the top surface. Another instance is when the moving liquid–vapor interface causes the binder that is dissolved in the solvent during the mixing process to be left behind as part of the solid phase. The third redistribution example is when CBD particles, as the more mobile phase, fill the extra gaps between the inefficiently packed large and stiff active-material particles at the current-collector surface [13]. This redistribution results in a higher CBD content near the film–substrate interface after drying. Binder redistribution may be tracked using EDS to quantify the fluorine vs. position, as fluorine is the most distinguishable element in PVDF [23].
It is worth mentioning that we are not referring to other types of nonuniformities formed prior to the drying step. For example, a not-well-mixed slurry has a nonuniform distribution in different directions.
The binder type and solvent type affect the particle redistribution during drying. For instance, PVDF binder, which is widely used in battery electrodes, has less affinity to the active material than does carboxymethyl cellulose (CMC) or polyvinylpyrrolidone. Therefore, PVDF has a higher chance of redistribution during drying [27,28]. The solvent type can also affect the particle redistribution. It has been shown that organic-based NMP slurries are more subject to nonuniform binder distribution compared with water-based electrodes. This is due to the higher boiling point of organic-based solvents that can prolong the constant-drying regime, which allows the migration of binder for a longer time [29].
Therefore, a more detailed investigation into this particle redistribution is necessary to learn more about the drying mechanisms of Li-ion electrodes, and how they affect the microstructure properties or defects.
Electrode delamination: The separation of electrode film from the substrate is called delamination. Any shearing forces that overcome adhesion will cause delamination. The electrode film shrinks in all directions during drying, and a cohesive bond starts to form between the electrode components due to the binder. The electrode microstructure can shrink freely in the through-plane direction, but the current collector resists the in-plane shrinkage. This unrelieved shear stress can cause delamination when it is greater than the adhesion to the current collector. Thicker electrodes are more prone to delamination due to the higher probability of cohesion overcoming adhesion, given that there is more bulk electrode (raising cohesion) material within the same interfacial area (same adhesion).
Binder depletion at the film–substrate interface because of binder redistribution during drying can also be responsible for electrode delamination. Previous studies on graphite anodes show that the adhesive forces are lower at higher drying temperatures (56 °C versus 31 °C) [30].
Electrode cracking: Similar to electrode delamination, the forming of cracks on the electrode is the result of residual stresses inside the film after drying. Previous studies showed that electrode cracking is more probable for thicker electrodes and at higher drying rates [6]. Such particle disconnection can decrease the electronic transport across the crack, which is especially detrimental when they are in the in-plane direction. Note that through-plane cracking is not necessarily undesirable because it promotes ionic transport [31]. This can be compared to traditional pores inside the electrodes, which can be considered as microcracks that facilitate ion movement.
1.3. Defect Mitigation Methods
As mentioned previously, these defects directly affect the cell-level performance. Therefore, many of them need to be addressed for designing next-generation Li-ion electrodes with a superior lifetime. This can be achieved by: (1) decreasing the drying rate, which can reduce the particle migration; (2) reducing the solvent surface tension, which leads to less capillary forces that drive binder migration [32]; (3) increasing the elastic modulus of the solid component, which can lead to higher mechanical stability; (4) adding an inactive additive, such as a second polymeric binder (increasing the dry bonds), or a second solvent, such as isopropyl alcohol (reducing the stress inside the electrode) [20,33].
Changing the electrode components or adding nonactive material (e.g., extra carbon) is not necessarily desirable, and especially if it leads to a lower electrode energy density or requires increased manufacturing costs. However, particle redistribution is something that can be controlled by modifying the drying process so that a desirable particle arrangement is achieved. Controlling the drying rate is the most practical approach that can be applied to the drying process at any scale. Previous studies suggest a lower yet unidentified drying rate to minimize the particle redistribution, even though a higher drying rate is more economical from the production point of view [3,5]. Therefore, a multistep drying scheme can be devised to minimize binder migration. A three-stage drying protocol can minimize the capillary forces that lead to binder migration; an initial high drying rate followed by a low–moderate rate in the middle (when the first pore starts to empty), and then a high rate near the end of drying can ensure that the majority of binder migration happens during the low–moderate-rate step [10].
In conclusion, the drying process can alter the electrode microstructure and its physical and performance properties. However, this is not the final fabrication step. The next step, calendering, makes additional changes to the microstructure.
1.4. Calendering Process
The main purpose of calendaring is to compress the electrode (between two metal rollers) to achieve a target thickness and porosity. This process also smooths out the thickness variations in the film [34]. However, our previous work suggests that smoothing is not necessarily an improvement. The variability in the electronic conductivity and ionic resistivity can increase after calendering due to an additional CBD particle redistribution [13]. Another study showed that cracks formed during drying are not fully diminished after calendering [32].
Even though most batteries are composed of calendered electrodes, few studies have been conducted to investigate whether calendering can mitigate the binder-migration issue. Therefore, in this work, we investigate the effect of calendering as well. The in-house fabricated NMC532 cathodes and graphite anodes were dried at different temperatures. The effect of the drying rate was investigated by measuring the transport properties. Then, the electrode was calendered, and the transport-property measurements were repeated.
2. Experimental Design
2.1. Electrode Fabrication
The electrodes used in this work are fabricated as follows. Table 1 summarizes the dry-electrode formulations. The active materials are Philips 66 CPGA12 for anode and Toda NMC532 (LiNi0.5Mn0.3Co0.2O2) for cathode. The active material and TIMCAL carbon black were ground by a mortar and pestle for 20 min to break up aggregates and disperse the carbon black in the active material. Sigma-Aldrich NMP solvent and Solvey 5130 PVDF binder (Mw of 1300 kDa) were mixed separately for 30 min to activate the binder and to achieve a uniformly dispersed mixture (solvent/solid mass ratio of 1). All the components were then wet-mixed using a high-speed immersion blender for 20 min over an ice bath to prevent the heating of the slurry and the accompanying evaporation of NMP. The electrodes were coated (80 µm in thickness) on a metal foil using a doctor blade. The target loadings of the anodes and cathodes were 9 and 13 mg/cm2, respectively.
The graphite and NMC electrode drying took place in a small convective oven for 10 min at different film temperatures in the range of 80–232 °C, as discussed below. Additionally, one set of electrodes was dried at 24 °C for 12 h. Table 2 shows the corresponding average drying rates (including both consolidation and pore-emptying phases) at different temperatures. These values are recorded based on the electrode mass changes over a specific time interval (5 h for 24 °C, and 10 s for other temperatures). The electrode electronic- and ionic-transport properties were then measured. Then, the films were calendered at room temperature between two metal rollers. The thickness loss during calendering was 14% for all the dried electrodes (a final porosity of 30–35%).
2.2. Electrode Cross-Section Imaging and Analysis
SEM/BIB: The electrode films were milled using a broad ion beam (JEOL IB-19530CP cross-section polisher) for 2 h, at an ion beam voltage of 5 kV. A ThermoScientific Apreo C scanning electron microscope (SEM) was used to study the uncalendered electrode microstructure differences when dried at different temperatures.
EDS: Energy-dispersive X-ray spectroscopy was performed (ThermoScientific Verios G4 UC SEM) to obtain the elemental distributions of the milled cross sections of the uncalendered cathode and anode. Two types of analysis were performed to quantify the fluorine content of the PVDF binder as its most distinguishable element. First, cross sections were divided vertically into four similarly sized rectangles. Fluorine is difficult to detect given the low atomic mass and small amount of binder used in these electrodes. Therefore, we need a large enough area to obtain a good signal and, hence, we divided the cross sections into four rectangles. The fluorine distribution was determined based on the elemental amount normalized to the total fluorine weight fractions across the film cross section. The acceleration voltage was 15 kV, and the total X-ray counts were over two million in each spectrum to obtain a good signal-to-noise ratio. The second type of analysis was an elemental map, which shows an example of a semiquantitative binder distribution based on a superimposed fluorine distribution across the uncalendered film. Each of these analyses was repeated three times, but only one is shown.
2.3. Electrode Testing
Electronic conductivity. Electronic-conductivity measurements were conducted using a flexible surface probe over a 25 × 25 grid of points (1 mm spacing) on the electrodes. An input voltage of 2.5 V was used for cathodes, and 1.0 V for the anode. The lower voltage for the anode is due to the higher conductivity of the graphite active material. A model was used to invert the experimental measurements to the electronic conductivity and contact resistance of the films. The reader is referred to the previous work published by our group for more detail about this measurement [14].
Ionic conductivity. The ionic conductivity of the films was determined using a localized blocking-electrolyte measurement [15]. Each electrode was first soaked in an electrolyte (25.8 mM tetrabutylammonium hexafluorophosphate (TBAPF6) in propylene carbonate). After sitting for 24 h to allow wetting, we used a 400 µm diameter aperture probe to conduct localized ionic measurements on each electrode across a 25 × 25 grid of points (1 mm spacing). The typical contact pressure between the probe and sample is 73 kPa. While the sample was in contact with the probe, an electrochemical-impedance-spectroscopy (EIS) spectrum was collected, with frequencies varying from 4 kHz to 0.1 Hz, and a perturbation of 50 mV. After the measurement, impedance data were fitted to MacMullin numbers using a 2D cylindrical-transmission-line model. The reader is referred to the previous work published by our group for more detail about this measurement [15].
3. Results and Discussion
3.1. Anode Microstructure Changes with Drying Temperature
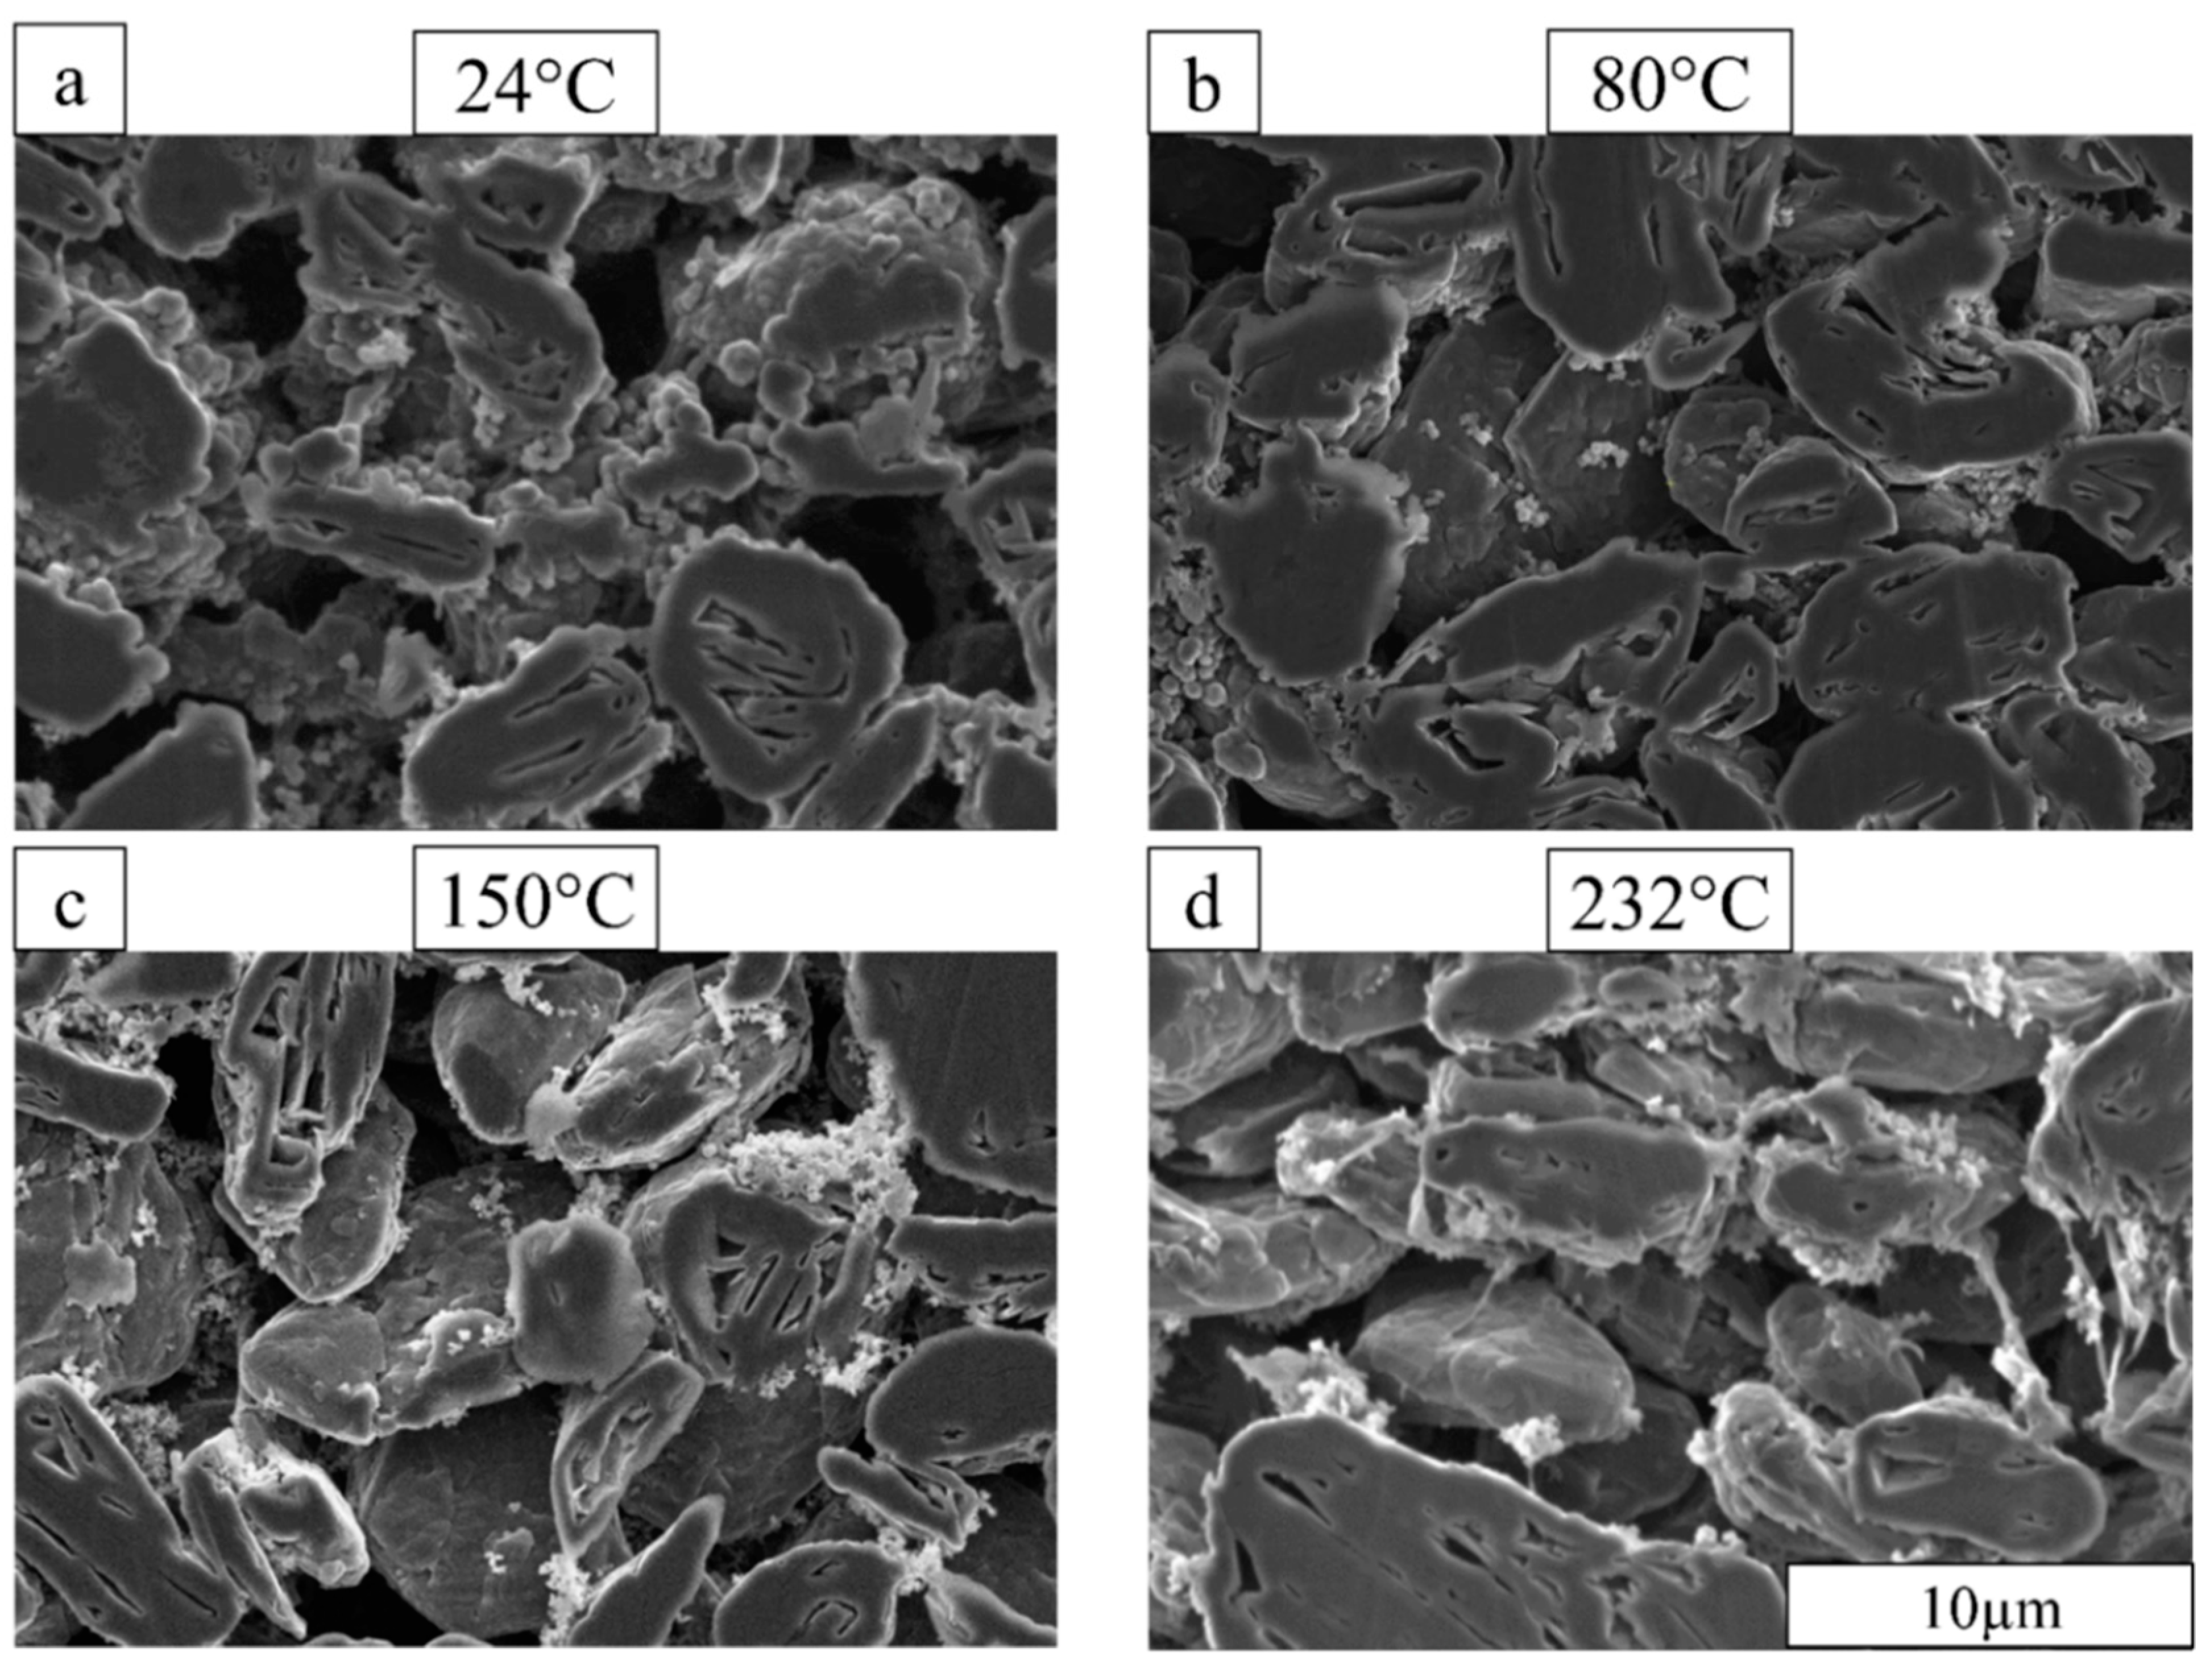
Figure 2 shows how the dried anode microstructure changes as the drying temperature increases. At 24 °C, the CBD phase is more similar to a nonporous cluster attached to the active-material surface. As the drying temperature increases, the CBD starts to become more porous, and the binder starts to form visible bonds or strings between the active materials (Figure 2d).
Porosity estimates of the dried uncalendered films are given in Table 3. The porosity was calculated from the measured electrode-film thickness using a micrometer at multiple points, and from the measured mass loading. The anode results show that the porosity was around 45 to 50%, regardless of the drying temperature; in other words, there was no clear trend. We also attempted to estimate porosities by segmenting the images in Figure 2 (i.e., by assigning each pixel to void vs. solid based on intensity threshold [35]). However, we found this result less reliable than the previous method due to the inadequate sampling of the number of particles and uncertainty over the carbon–binder domain. The cathodes in Table 3 are discussed below.
3.2. Cathode Microstructure Changes with Drying Temperature
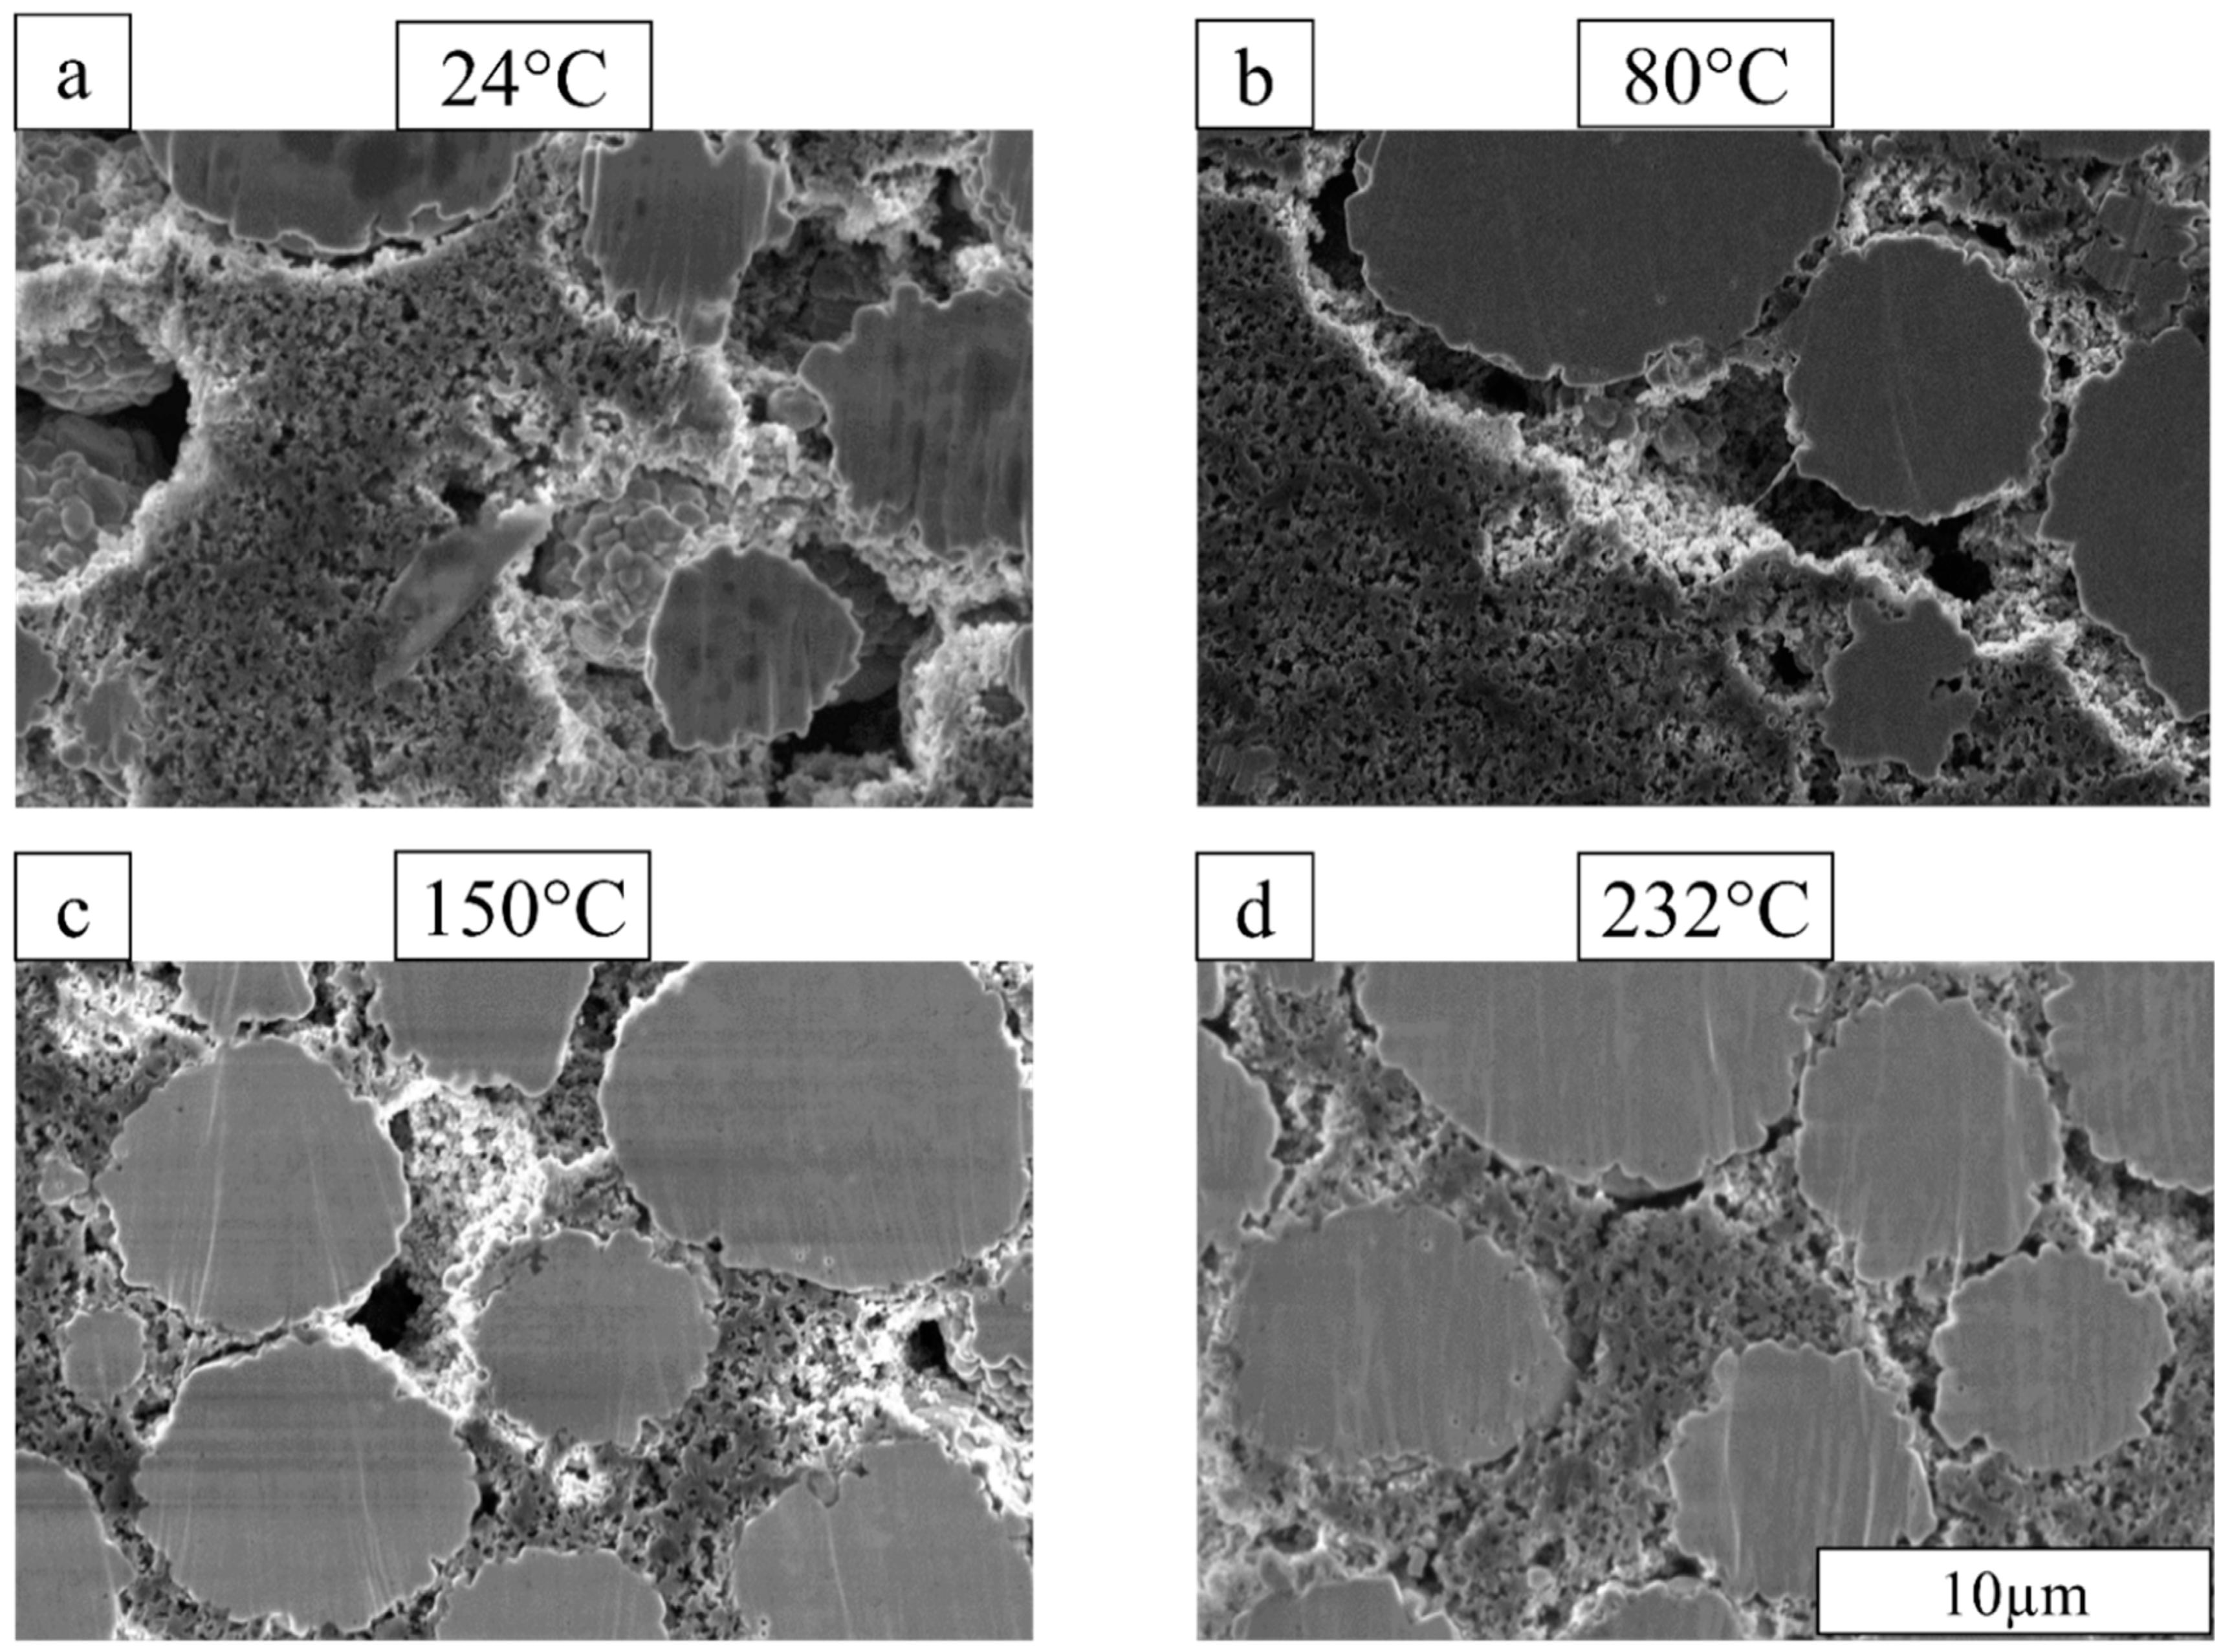
Figure 3 shows how the microstructure changes for the NMC cathode as the drying temperature increases. The CBD phase is more distinguishable for cathodes compared with anodes. At 24 °C, the CBD is less porous, and more macropores exist in the film.
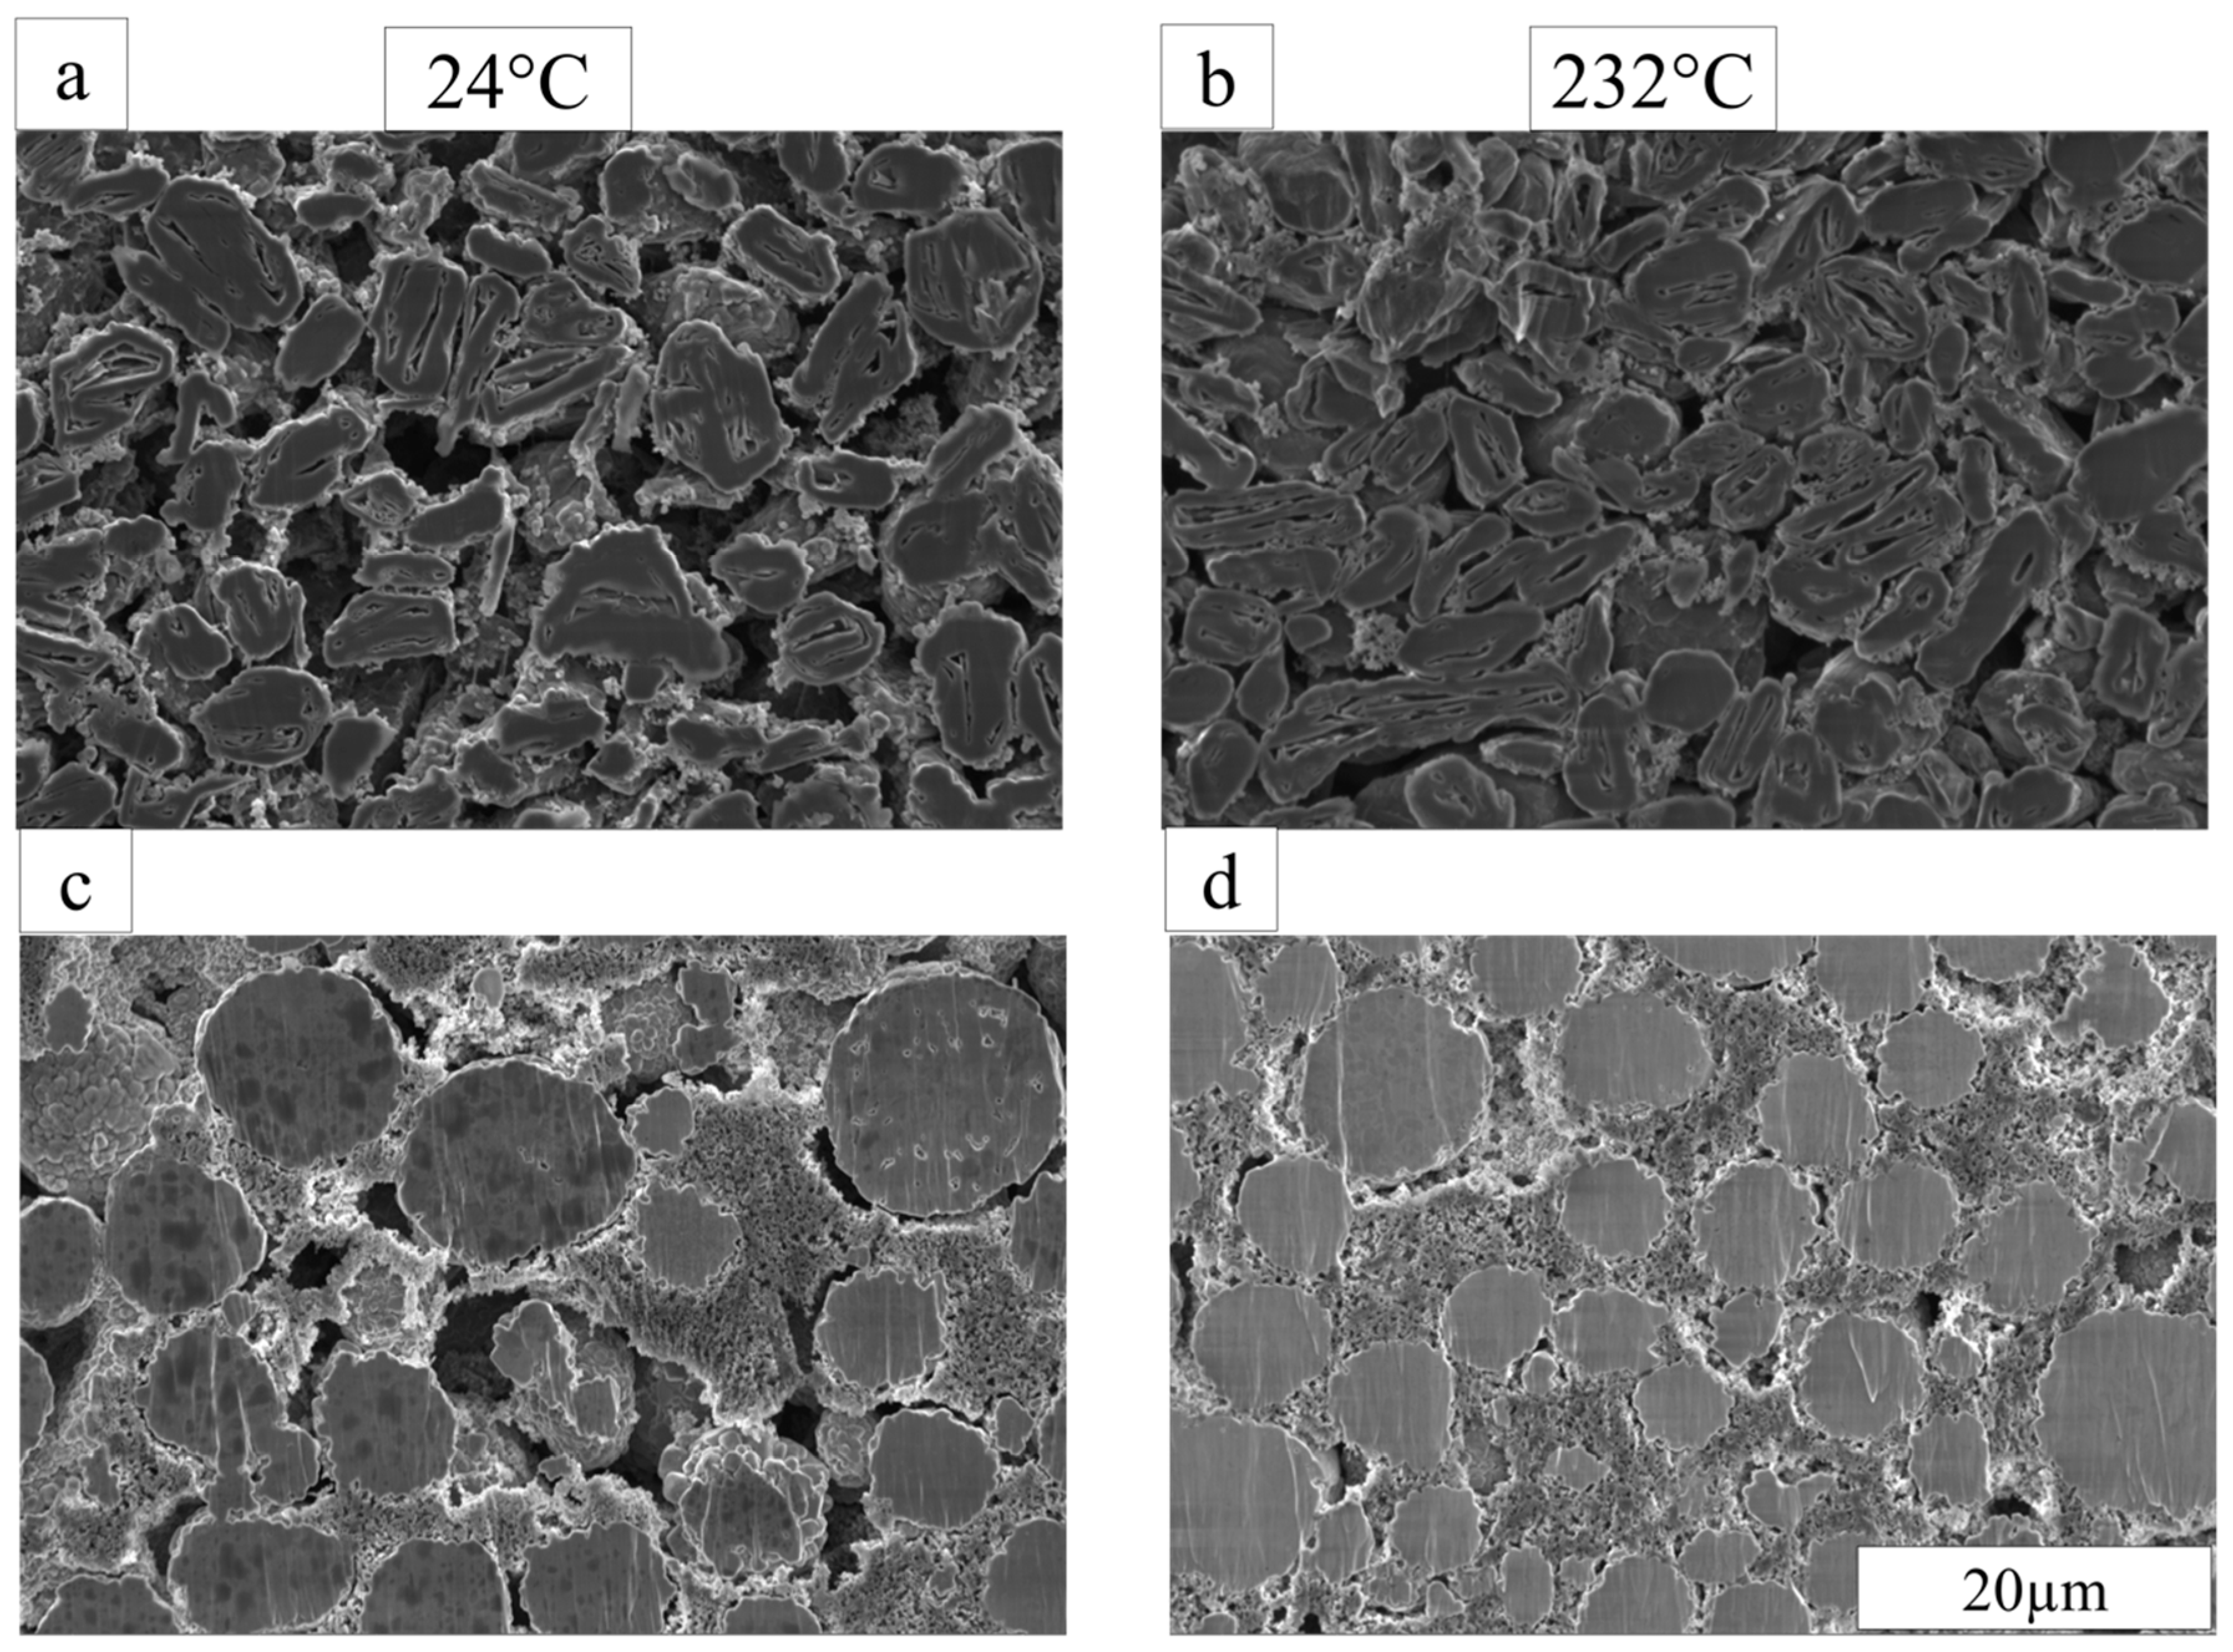
As the temperature increases, the active materials come closer together, and the CBD phase fills the space between the active material (Figure 4). This trend is also shown in the overall porosity of the cathode films given in Table 3. As the drying temperature increases from 24 °C to 80 °C, the porosities decrease significantly. For drying above 80 °C, the porosity is relatively constant.
3.3. Binder Distribution in through- and in-Plane Directions
In this subsection, a more detailed analysis of the binder distribution is presented to discover under what conditions the previously published MPSP-model predictions are observed in the experiments [13]. According to the model results, the CBD content is quite uniform across the film thickness, with a slight peak on the current-collector side, which is contradictory to previous studies by other groups [3,5,36]. We also considered binder heterogeneity for the in-plane direction.
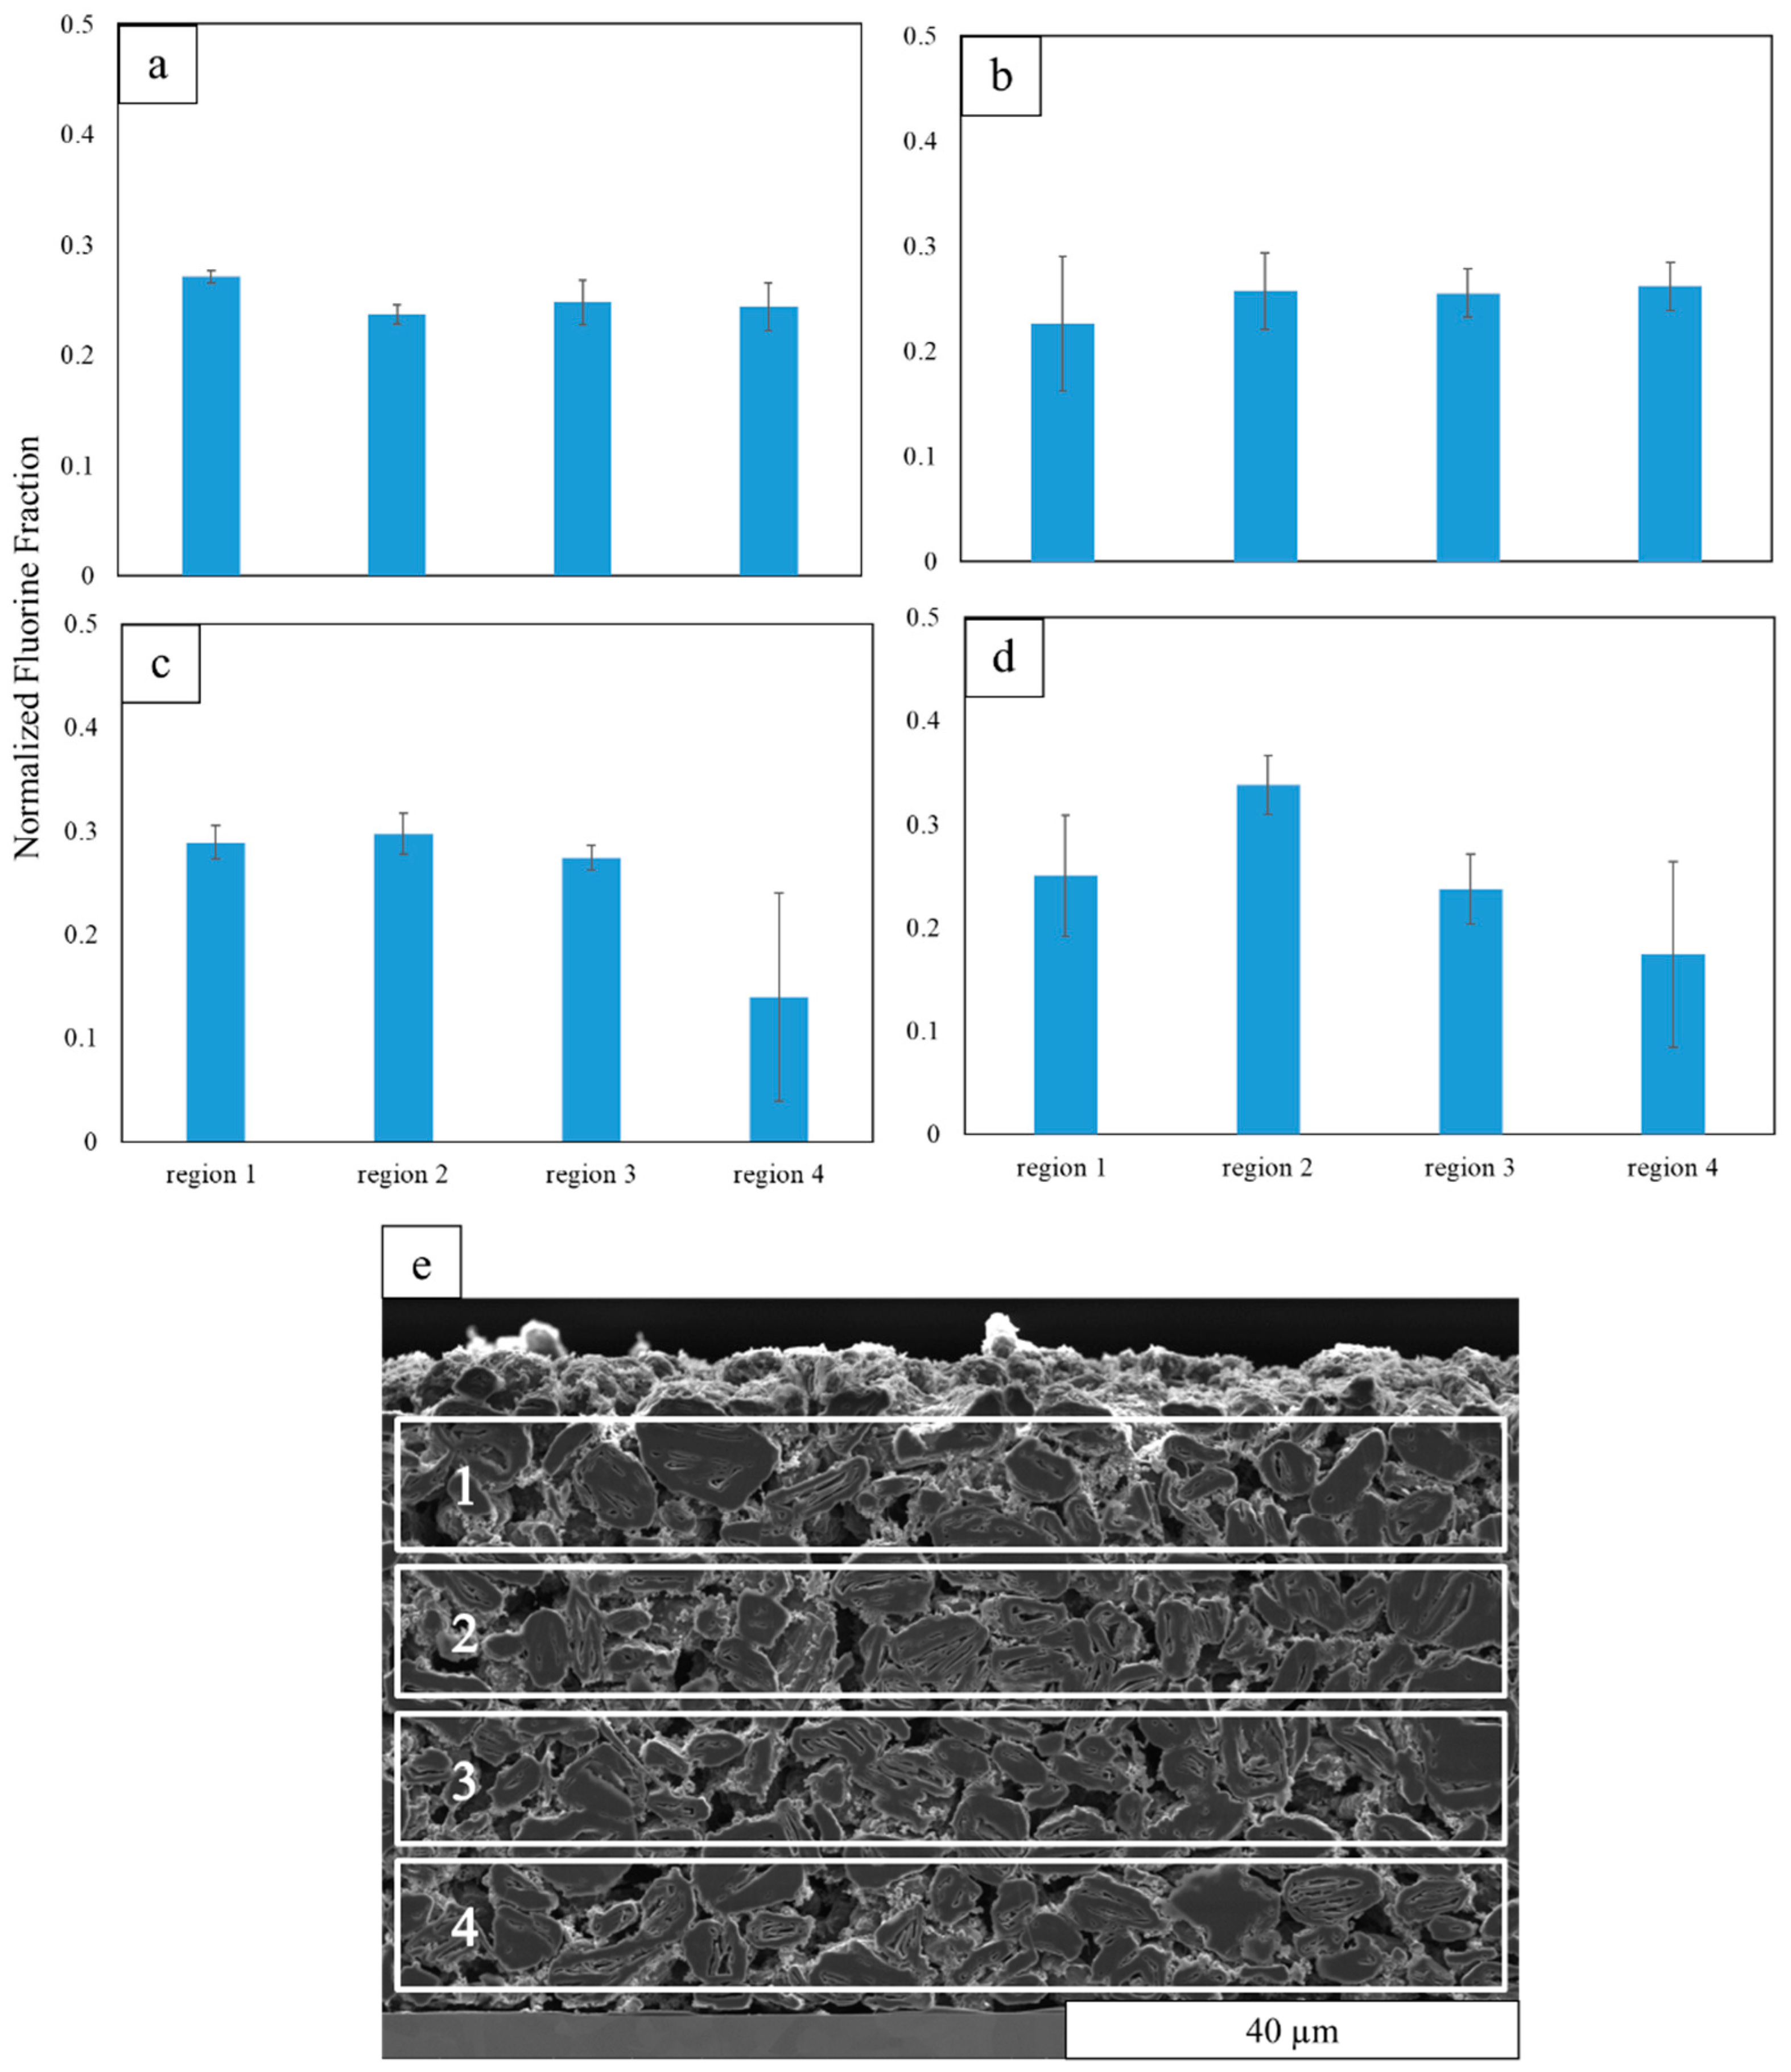
Binder distribution in graphite anode.Figure 5 shows the quantitative analysis of the fluorine-element content at four different regions (Region 1 is adjacent to the separator, and Region 4 is next to the current collector, as shown in Figure 5e). Region 4 does not include the thin layer between the electrode and current collector. The reason is to avoid introducing copper into the EDS signal because the quantification model cannot correctly account for its effects if it is not homogeneously distributed (which it clearly is not). Error bars are 95% confidence intervals determined by four independent spatial samples in each case and serve to indicate in-plane heterogeneity. The results show that the binder distribution is not uniform in both the through-plane (relative heights of bars) and in-plane (relative values of the confidence intervals) directions.
Figure 5a shows slightly higher fluorine content at the top surface of the electrode at 24 °C, which suggests that the binder that was dissolved in the solvent is left behind at the top surface. The expected binder migration appears at 150 °C, with lower fluorine content near the current collector (Figure 5c), although it is also not uniform at other cross sections (as indicated by the large error bar in Region 4). At the higher temperature of 232 °C, the highest fluorine fraction is observed in Region 2. This could be due to the presence of more pores in Region 1 that can skew the fluorine content, where the X-rays generated inside a pore need to go through more material to reach the detector and, as a result, higher X-ray absorption occurs, which is reflected in less fluorine content of Region 1 compared with Region 2.
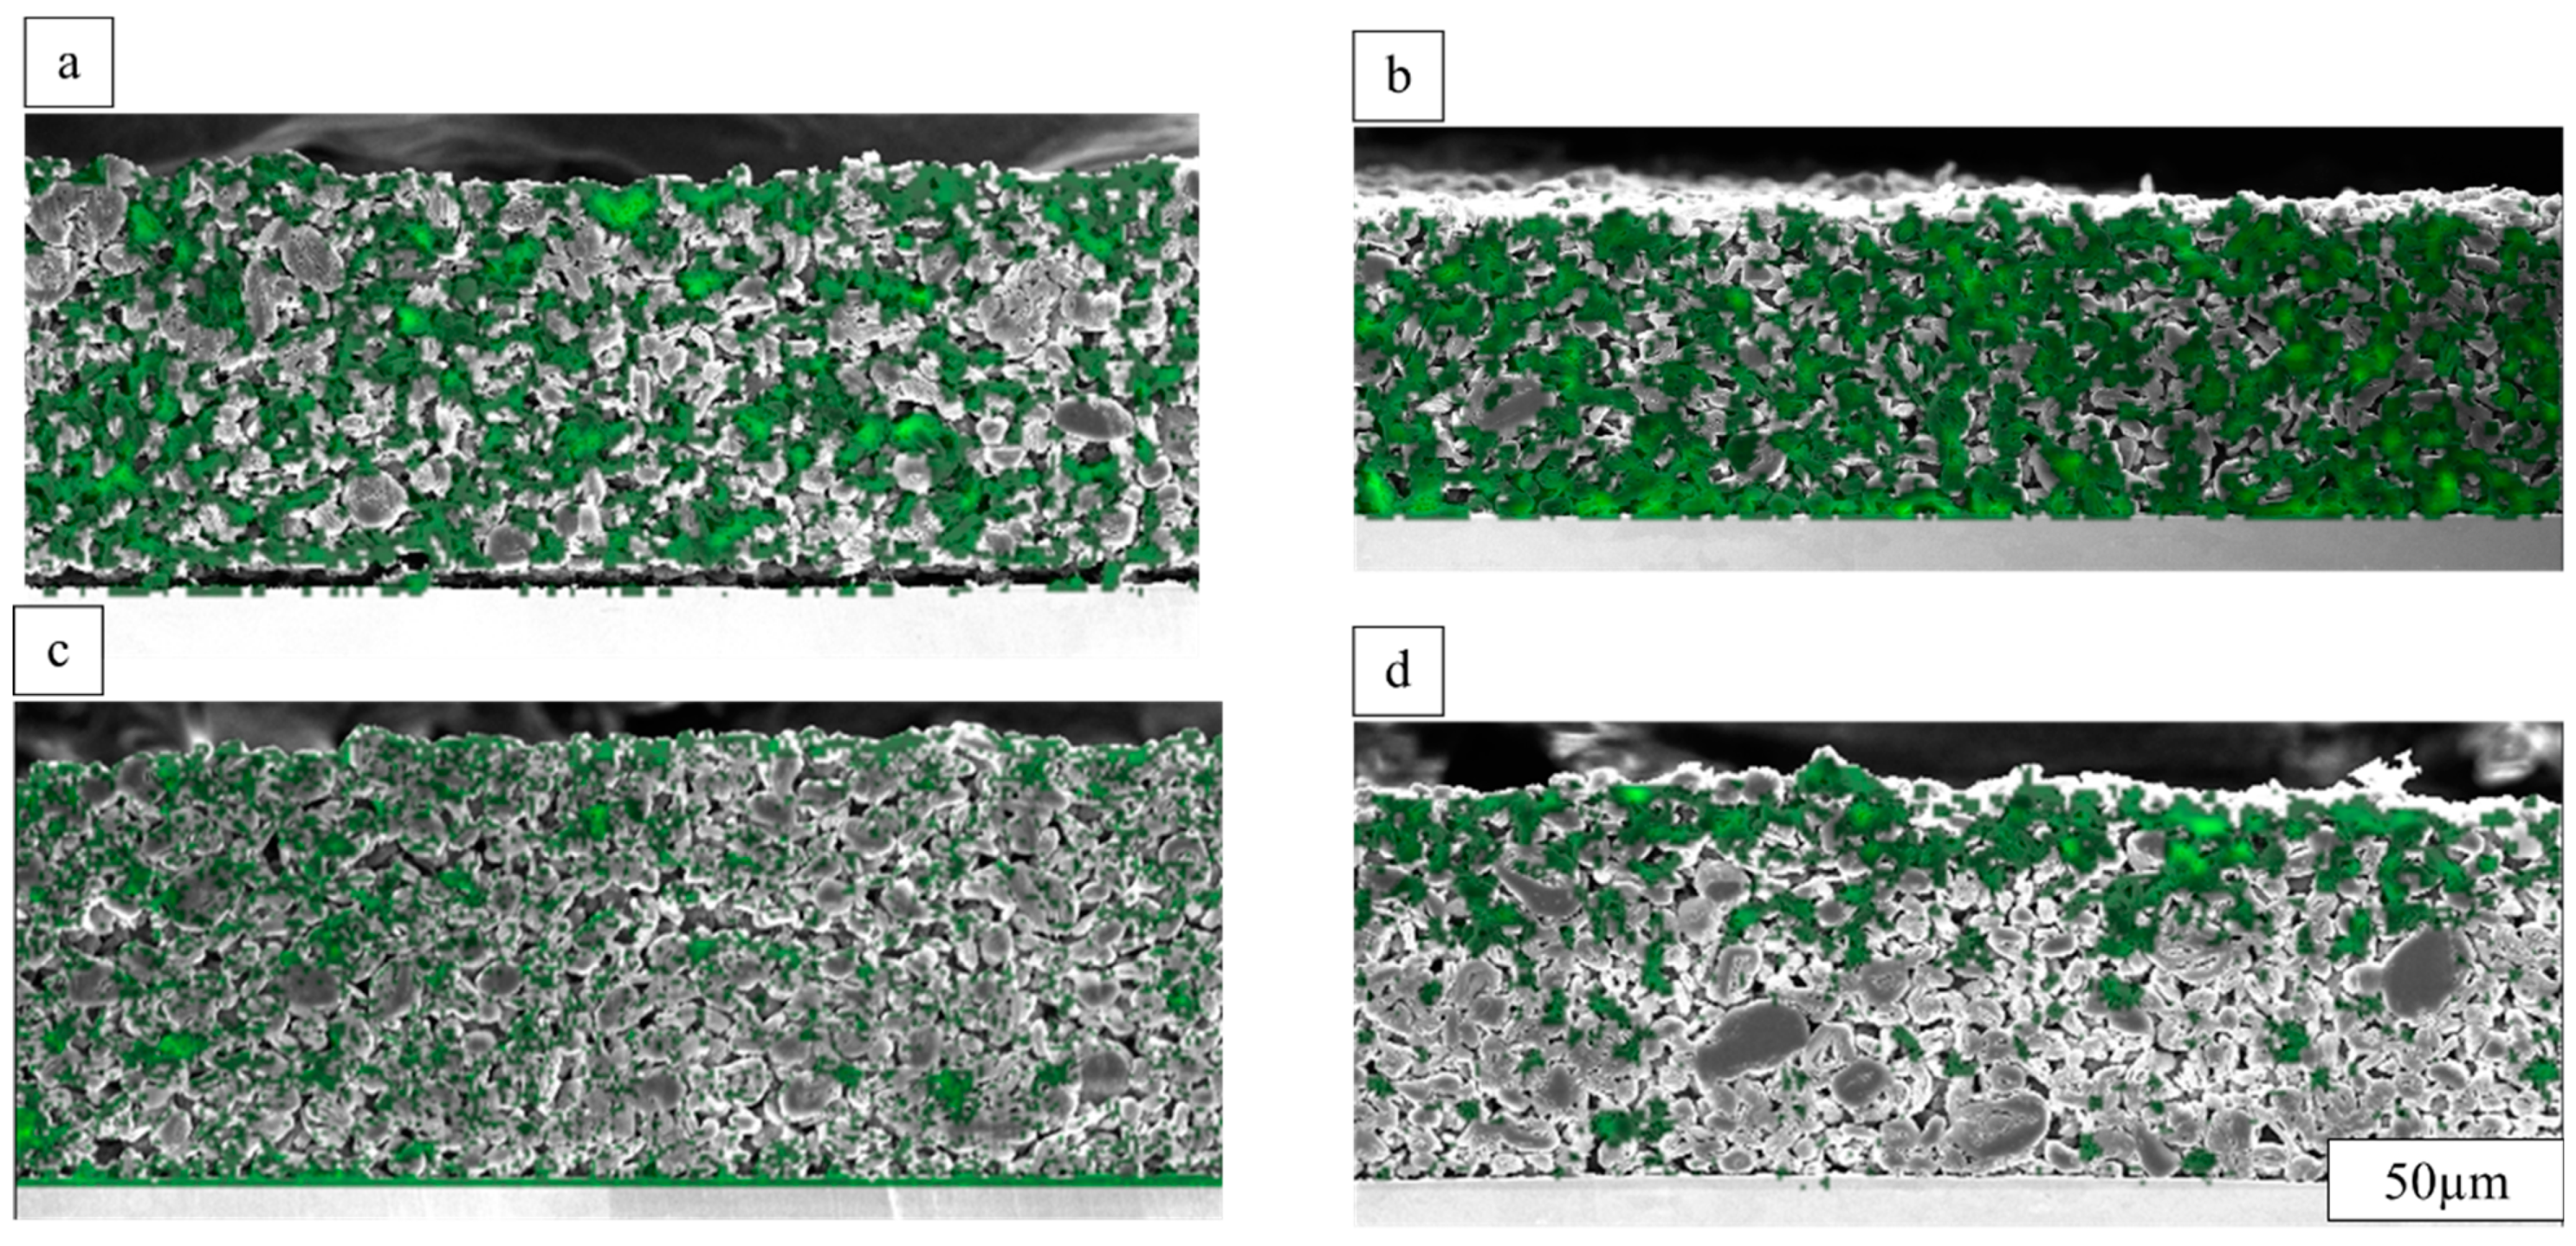
The fluorine elemental maps for the anodes are shown in Figure 6, revealing additional connections between these experiments and our previous simulations [13]. These results suggest that the MPSP-model predictions correspond to an experimental drying temperature range of 80–150 °C, where a thin layer of fluorine (the representative element of CBD) accumulates on the bottom surface of the electrode and fills the space created by the inefficient packing of active-material particles, which is a desirable situation that promotes adhesion and reduces contact resistance.
The high drying temperature required for binder migration suggests why there is less attention paid to binder migration in the battery industry compared with previous academic studies. This is due to the conventional lower drying-temperature range (60–80 °C) used on a large scale.
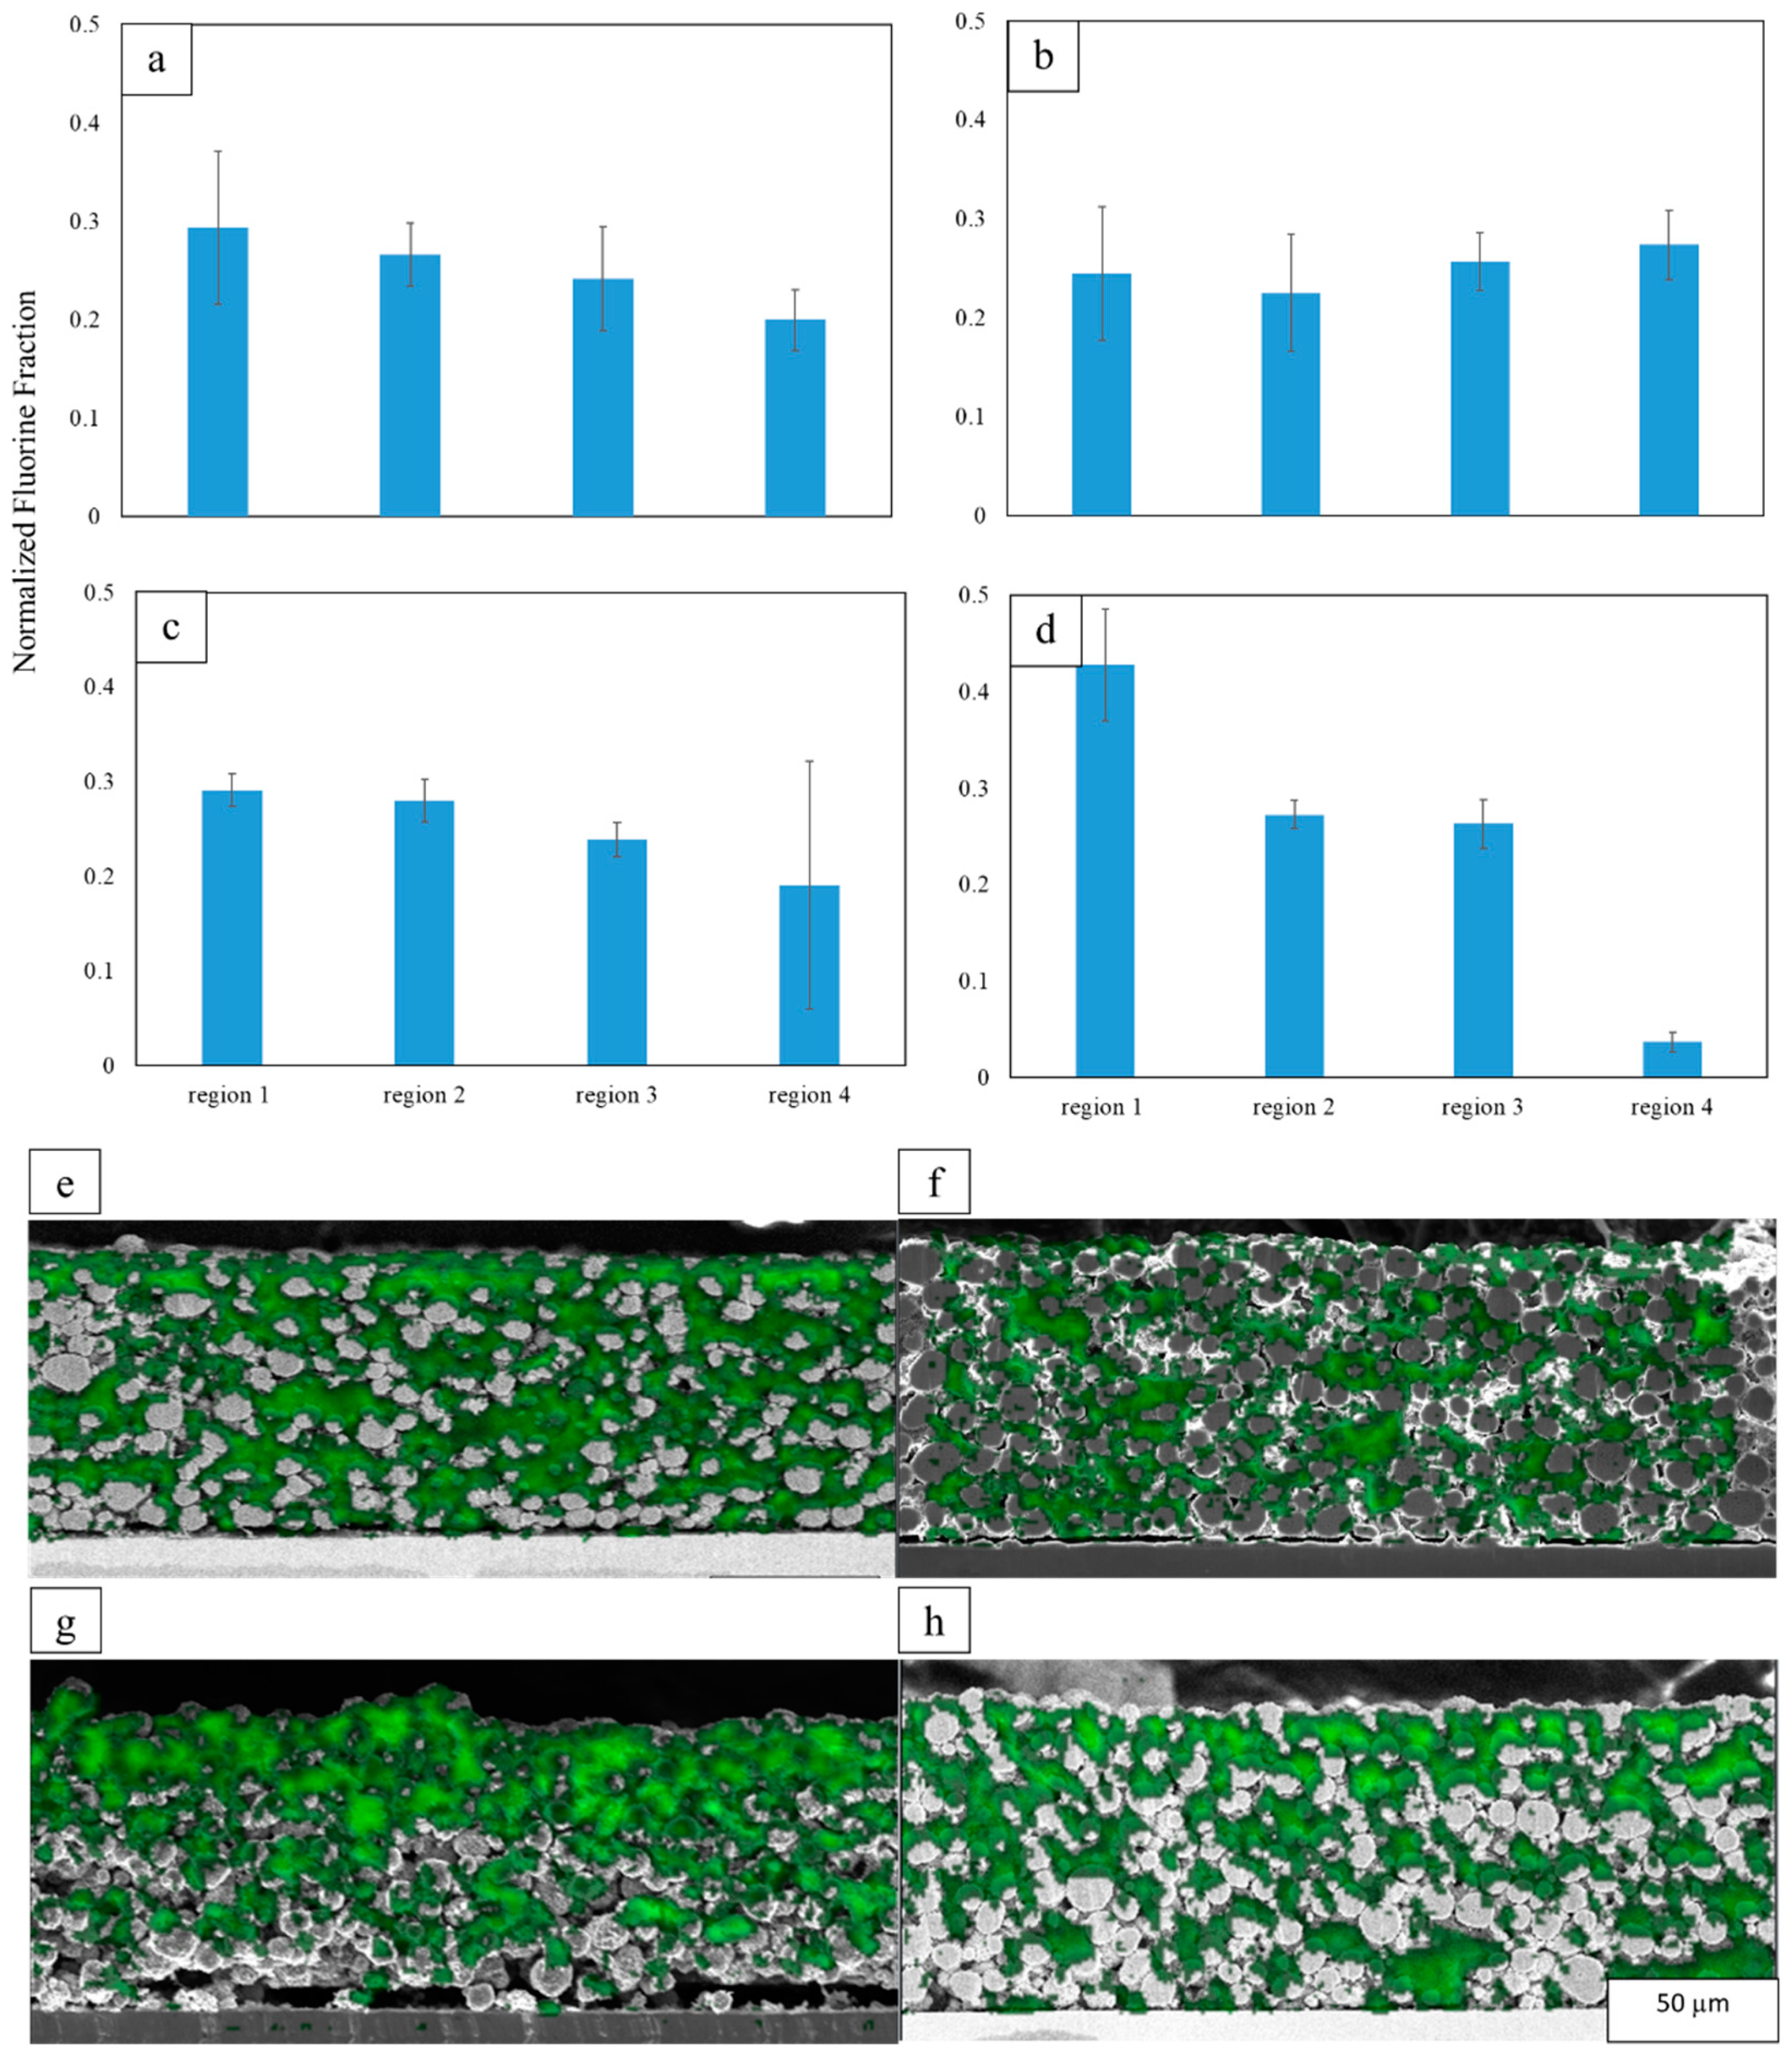
Binder distribution in NMC cathode.Figure 7 shows the quantitative EDS results for the NMC cathode. Similar to the anode results, the fluorine nonuniformity exists in both the through- and in-plane directions. The binder nonuniformity starts to emerge at temperatures higher than 150 °C, although this is not the case at all cross sections (c.f. the large error bar in Figure 7c). Therefore, the previous modeling results also correspond to the drying temperature of 80 °C, where there is slightly more binder content at the current collector, and no binder migration is detected.
The X-ray detection of the overall fluorine amounts can be skewed by the variation in the electrode porosity between samples dried at different temperatures, even though all samples were obtained from the same batch, with similar compositions and predried fabrication steps. EDS quantification theory [37] states that the sample needs to be flat and homogenous at the atomic level, neither of which are entirely true for battery electrodes. The milled active-material surface is flat, but the pores, and especially the nanopores in the CBD, can lead to anomalies. The X-rays generated by electrons that impact inside a pore need to go through more material to reach the detector versus when they are generated by electrons hitting the active-material milled surface. This can result in additional X-ray absorption and fluorescence, which are unanticipated by the standard quantification model used. Therefore, the X-ray detection is affected by moderate porosity differences between samples dried at different temperatures. For this reason, the fluorine fractions in Figure 7 are normalized from one sample to the next.
Another issue, due to inhomogeneity, arises when EDS is used for cathode binder-distribution analysis. Fluorine produces 677 eV and 687 eV X-rays. These X-rays can be strongly absorbed by manganese or oxygen absorption edges just below these energies in the active material if fluorine X-rays are generated inside the pores and pass through the active material enroute to the detector. The absorbed energy can excite the inner-shell electrons and fluoresce new X-rays from the cathode active material, which reduces the fluorine signal and enhances the cathode active-material signal, which would change the apparent composition. Therefore, it is better to use the EDS fluorine content as a relative measure for samples with similar porosities and compositions, rather than as an absolute indication of the binder content. In this work, the fluorine signals were used to compare spatially separated regions that otherwise should have similar porosities and active-material compositions, and so this effect should be minimized.
3.4. Anode Electronic Conductivity
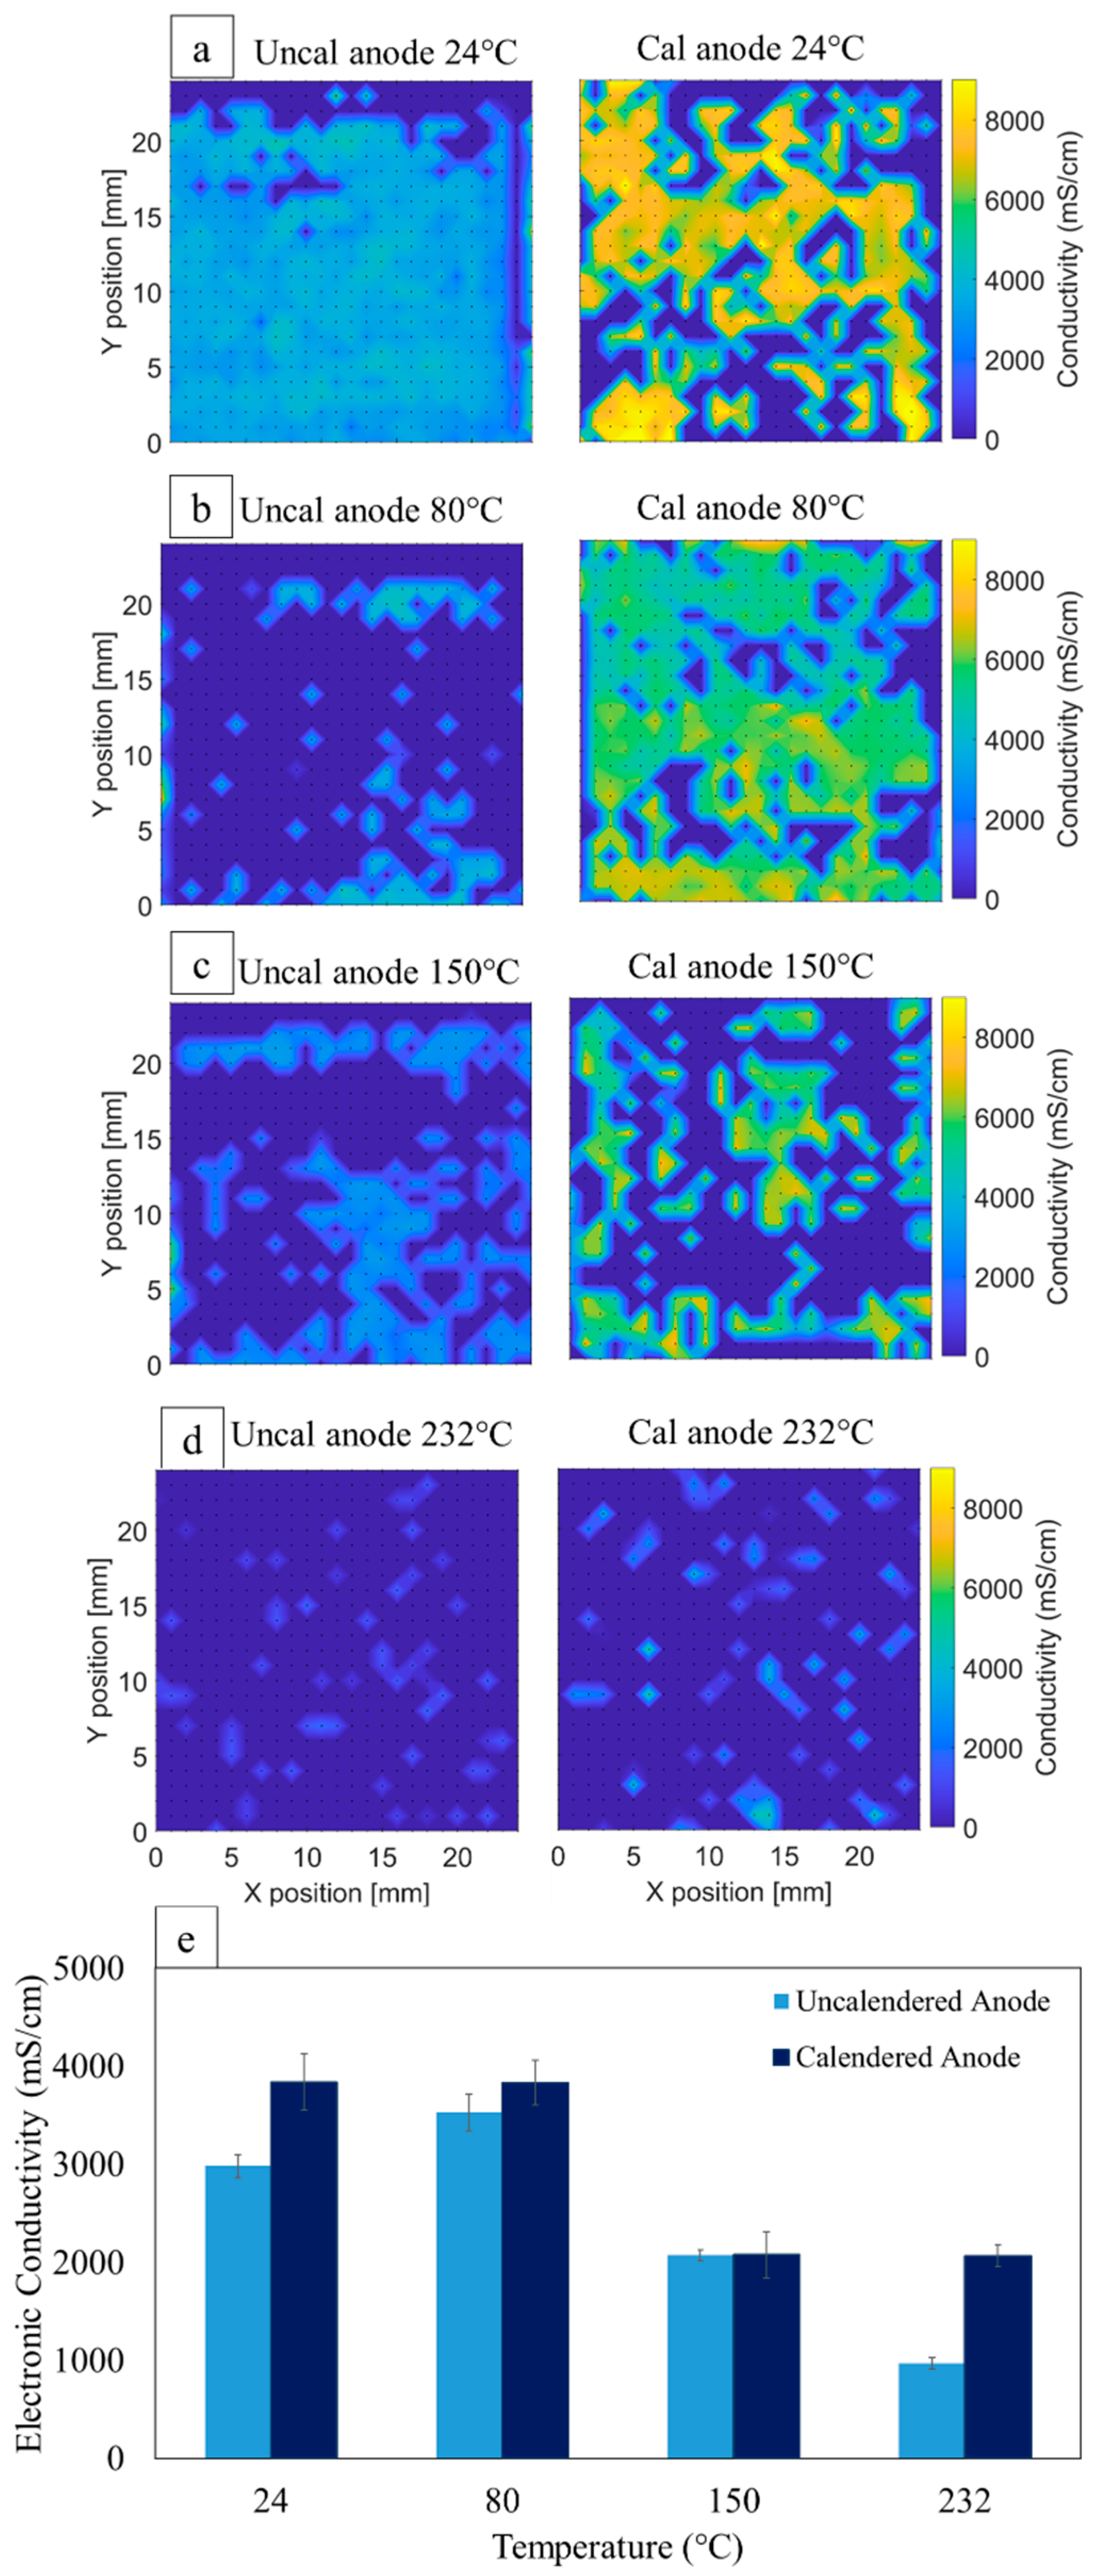
The electronic conductivity of an anode is an indication of its ability to transport electrons through a combination of conductive carbon and graphite active material. Figure 8 shows the electronic conductivity distributions of anodes dried at different temperatures. At 24 °C, most of the electrodes show an average electronic conductivity of around 3000 mS/cm. When we increase the temperature to 80 °C, the average electronic conductivity increases to more than 3500 mS/cm, but it is less uniform. At temperatures higher than 150 °C, the electronic conductivity starts to decrease. This is despite the relatively constant porosity (Table 3). The high-temperature conductivity change could be due to the visible in-plane cracks (Figure 6c), poor vertical uniformity in the binder amounts, or temperature-dependent conformational changes of the PVDF binder. Lower drying temperatures are reported to favor the PVDF conformation with the highest electronic conductivity [38].
Calendering increases the electronic conductivity of all electrodes by making a more compact microstructure (Figure 8). Such an increase is more noticeable for the lowest and highest drying temperatures of 24 °C and 232 °C. This results in a similar electronic conductivity of around 3800 mS/cm for anodes dried at 24 °C, and 80 °C versus 2000 mS/cm for the ones dried at 150 °C and 232 °C. These results suggest that calendering can diminish the effect of the drying rate to some extent, but lower drying temperatures still result in higher electronic conductivity, even after calendering.
Similar to the MPSP-model results, the amount of the variability (demonstrated by the size of the error bars in Figure 8e) increases for the anode after calendering due to particle redistribution.
3.5. Cathode Electronic Conductivity
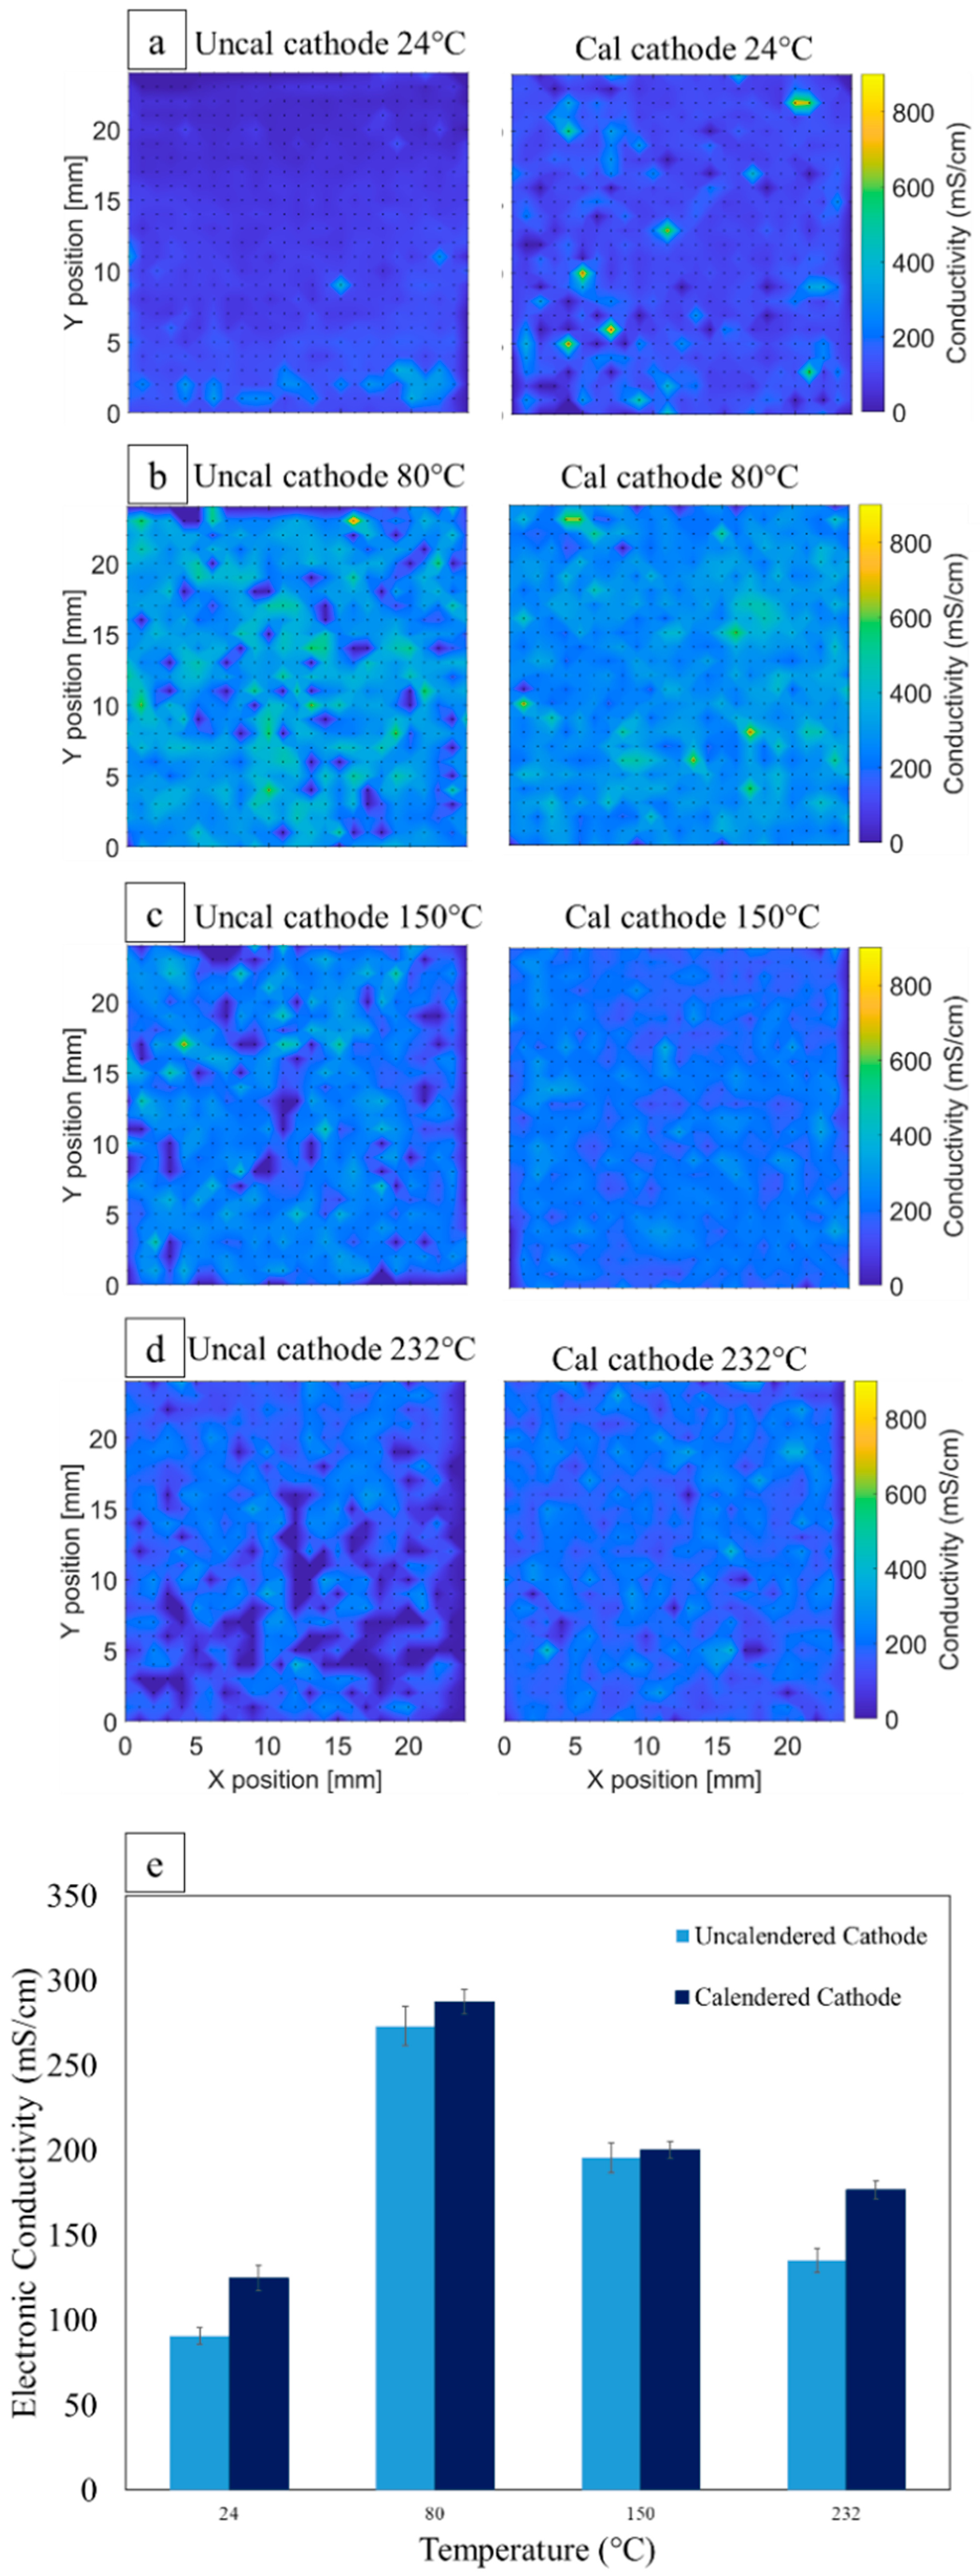
Similar to the anode results, the uncalendered cathode also shows a maximum electronic conductivity at an 80 °C drying temperature (Figure 9b). However, the microstructure is less uniform compared with other drying temperatures. This could be due to the intermediate microstructure with a mixture of high- and low-temperature characteristics. At low temperatures, there are some gaps between the active material and CBD phase (Figure 3b), and also the binder is not fully activated [39]. At higher temperatures, the microstructure is less porous, which promotes higher electronic conductivity.
It is worth noting that in an operating cell, maximizing the electronic conductivity is not the only consideration. It is rather a balance between the electronic- and ionic-transport properties of a given electrode, and the match between the cathode and anode properties, that determine the cell overpotential and cycle life.
The trend for calendered cathodes is similar to that for the uncalendered ones; namely, the 80 °C drying temperature results in the highest electronic conductivity (Figure 9). Here, the electronic conductivity of the cathode is more uniform after calendering. This result is different than what was presented in our previous work [13]. This could be due to the milder calendering process used for these electrodes. The previous cathodes were calendered to a higher degree to reach the desired 35% porosity. Their thickness change was about 20% of their initial uncalendered thickness, compared with 14% for the electrodes here. These results suggest that increased variability in the cathode after calendering can be a function of the calendering degree.
3.6. Anode Contact Resistance
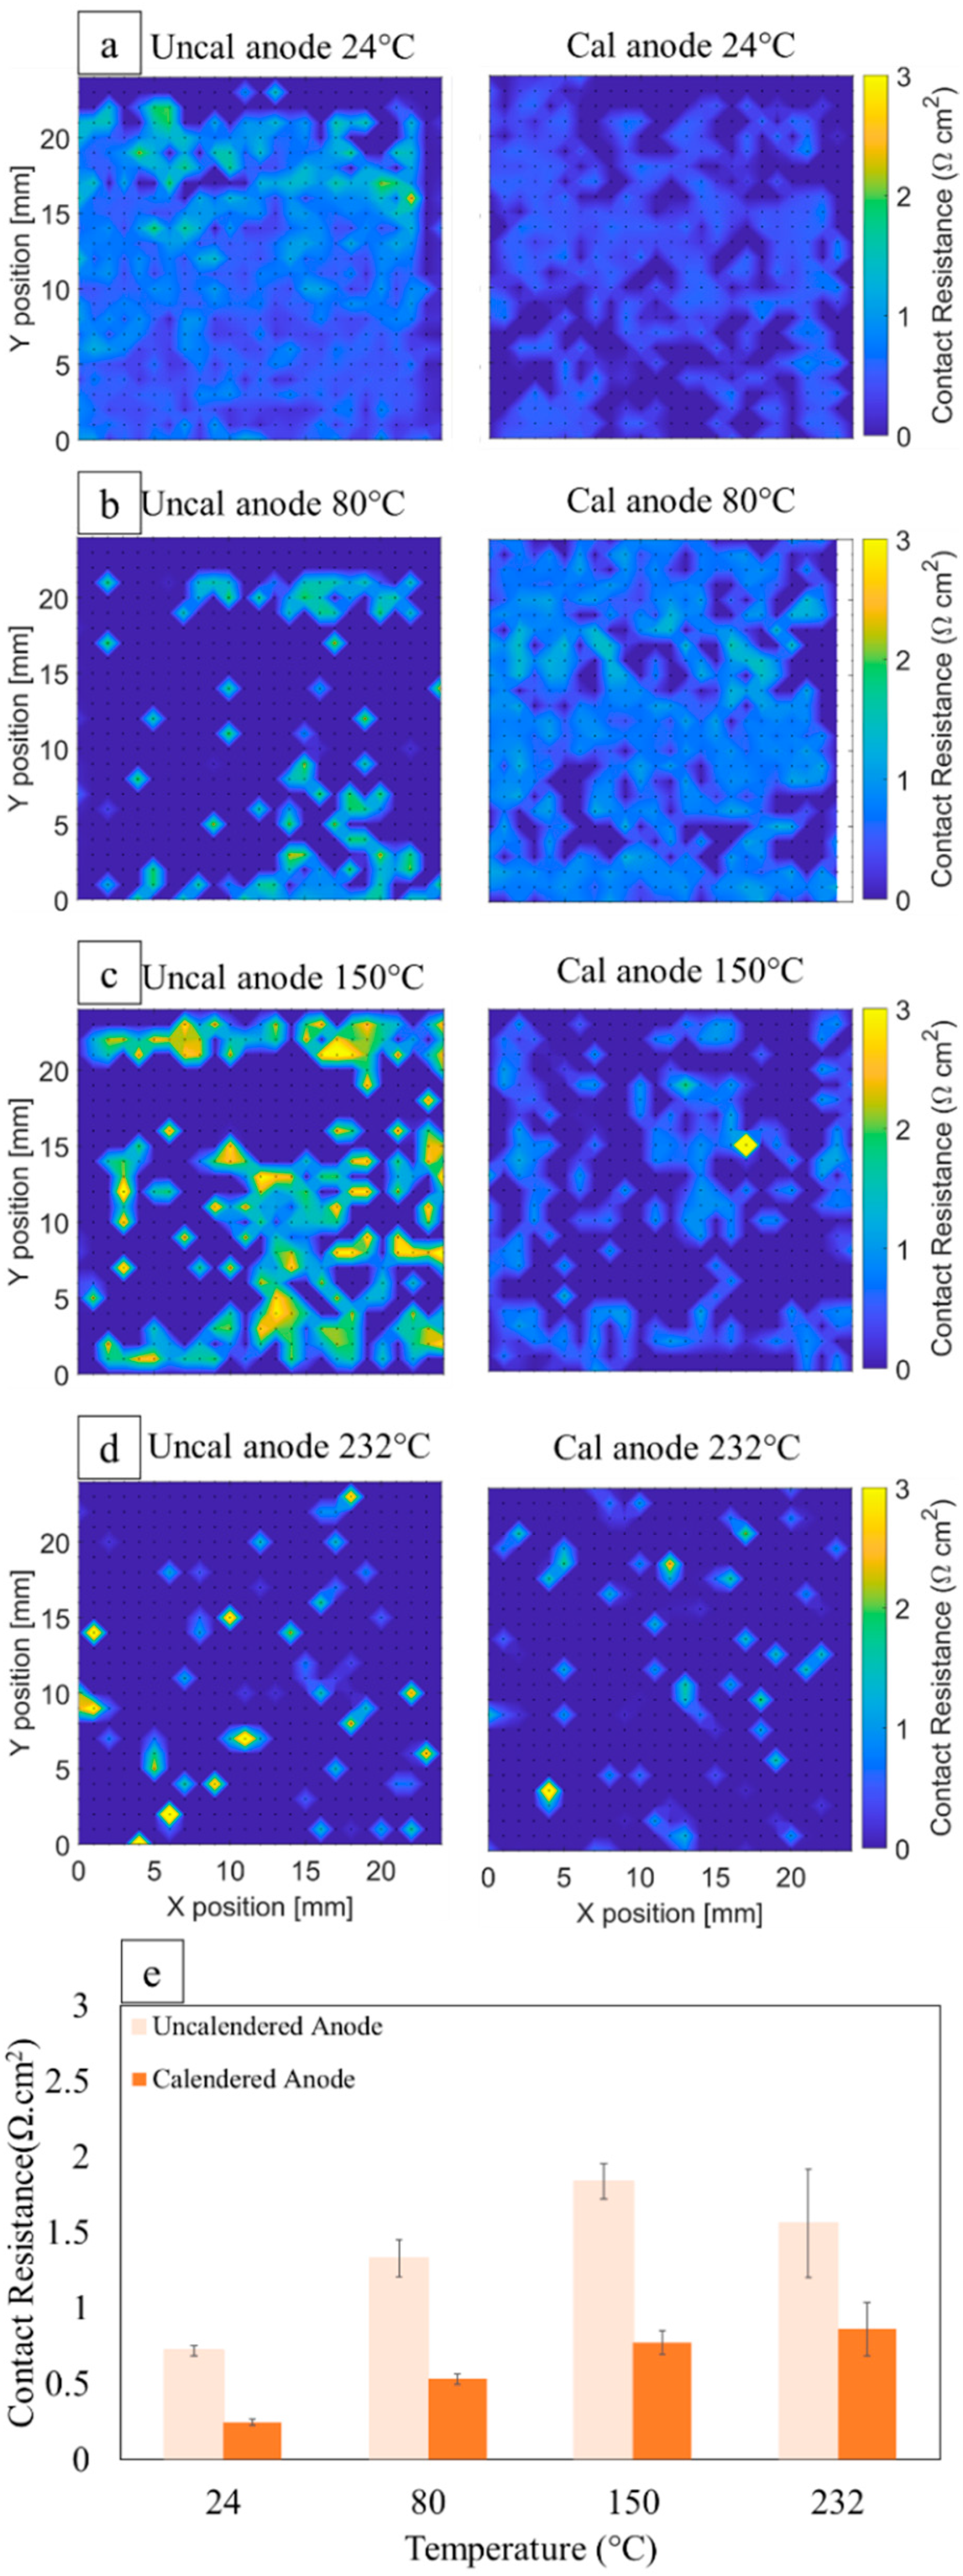
The contact resistance of an electrode provides more information about the film–substrate interface; higher contact resistance can mean that the electrons face a higher barrier at the interface, consuming energy during the cell charge and discharge. High contact resistance could be due to the large pores, cracks, or delaminated regions at the interface, instead of the electronically conductive active material or carbon black. Any depletion of the binder at the current-collector interface is likely to also cause the depletion of carbon black as well. Figure 10 shows the contact-resistance results of the uncalendered anodes dried at different temperatures. While there is a general trend of increasing contact resistance with temperature, which is associated with the depletion of binder, the uncalendered anode dried at 150 °C shows both higher contact resistance and higher spatial variability than other conditions. Figure 10 also shows that, after calendering, the contact resistance decreases for all anodes as a result of compaction near the current collector and the subsequent particle redistribution.
3.7. Cathode Contact Resistance
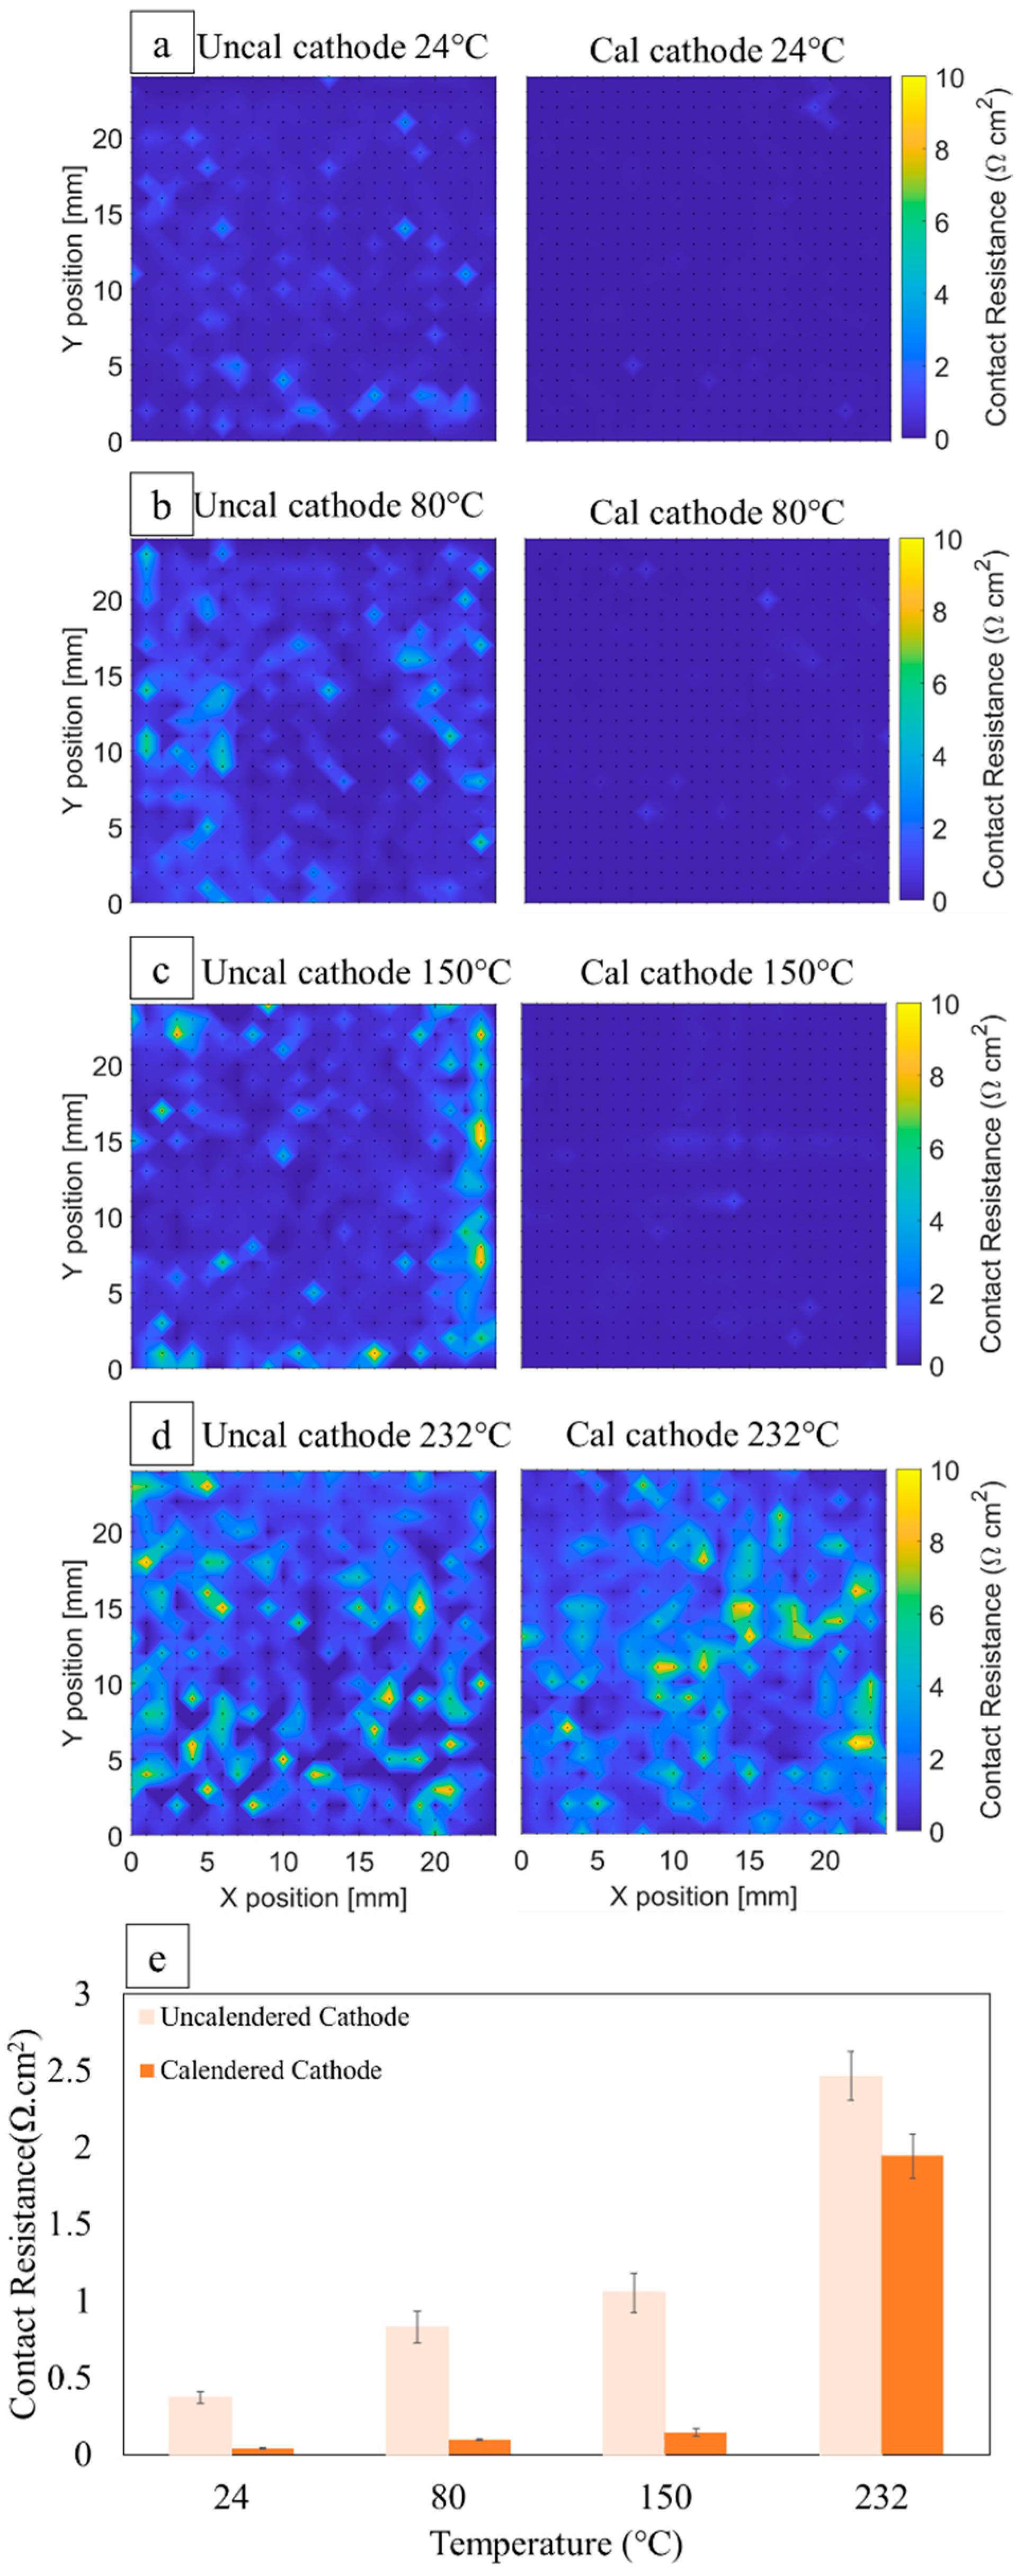
As for the anode, the cathode contact resistance and its variability increase with the drying temperature (Figure 11). This appears to be driven by the binder distribution near the current collector (Figure 7). At lower temperatures of 24 °C and 80 °C, enough binder exists at the film–substrate interface, creating sufficient connections. However, at high temperatures, the number of these bonds starts to decrease due to binder migration toward the top surface.
Calendering does not change the previously observed trend for the drying temperature for the NMC cathode (Figure 11), and it decreases the contact resistance and its variability for all electrodes. This can be due to calendering compression and the proposed binder-redistribution theory (namely, the multiphase packing theory) [13].
3.8. Anode Ionic Resistance
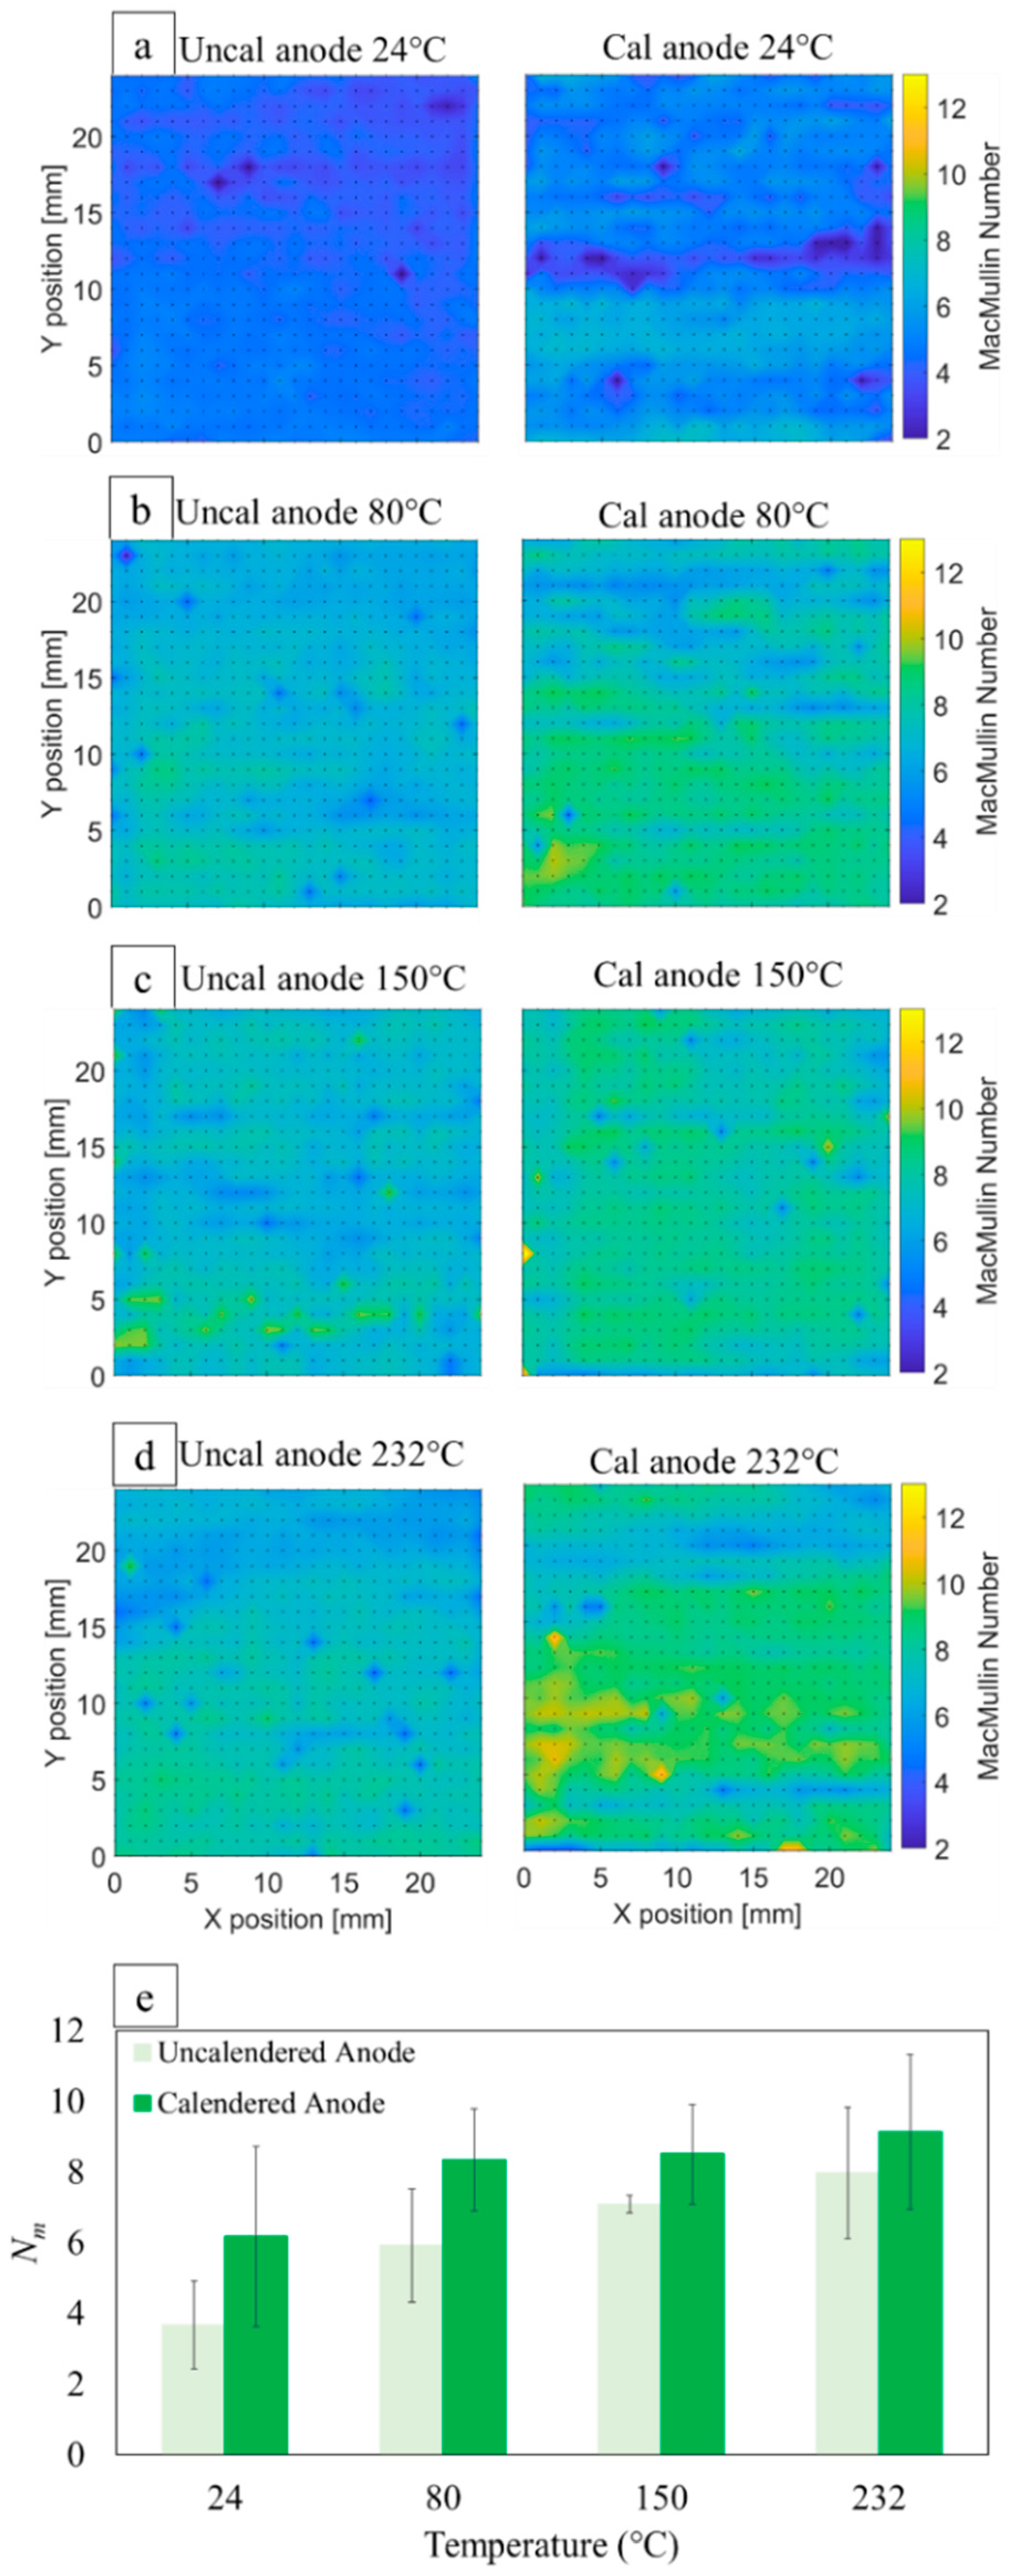
Ionic resistance in the electrode film is expressed here in terms of the dimensionless MacMullin number, which incorporates the effects of both the electrode tortuosity and porosity. Figure 12 shows that, with the increasing drying temperature, the MacMullin numbers increase as well. The binder migration during the drying process can explain this observation. This is due to the fact that ionic transport in the measurements, as in actual cell operations, is more sensitive to the pathways near the top surface [7]. The presence of more binder and conductive carbon on the top surface can restrict ionic transport to the entire electrode volume.
As expected, calendering will increase the MacMullin number as a result of the lower film porosity and, therefore, fewer connected pores (Figure 12). The error bars in Figure 12e confirm our previous modeling prediction that the anode is more prone to heterogeneity due to its shape and orientation variability.
3.9. Cathode Ionic Resistance
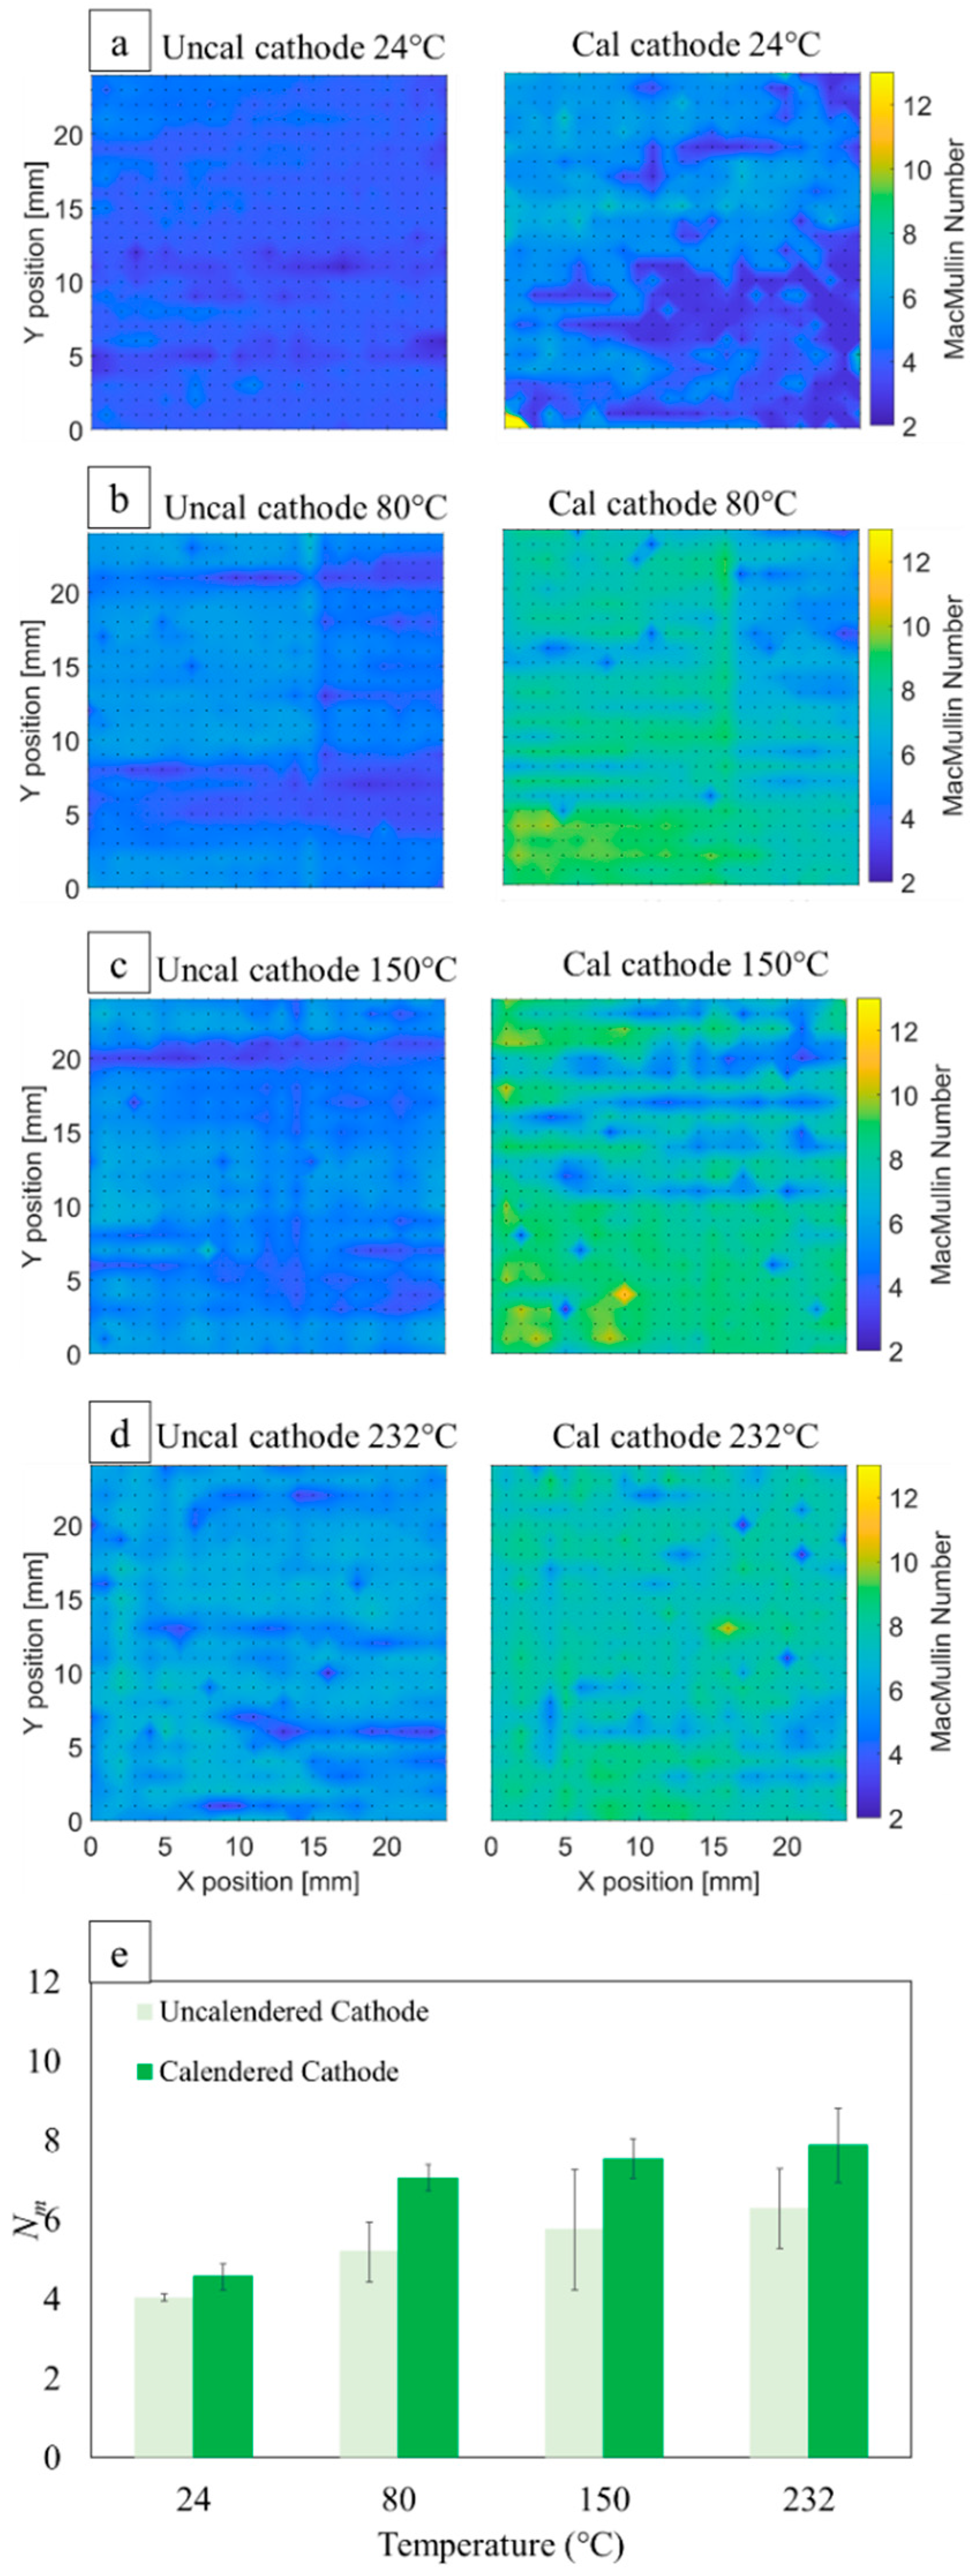
Figure 13 shows the contour maps of the MacMullin numbers for cathodes dried at different temperatures. Similar to what was observed for the anode, the MacMullin number increases with temperature due to binder and carbon migration toward the top surface, and the sensitivity of the ionic accessibility to that surface. Even though the CBD has nanoporosity, it still limits ion transport compared with macropores. Another reason for the higher ionic resistance of cathodes at higher temperatures is the lower film porosity (Table 3).
After calendering, both the average and local MacMullin numbers increase due to compression and decreased porosity (Figure 13). The ionic maps for cathode preserve some of the traits of MacMullin distribution after calendering due to the cathode higher mechanical resistance (stiffness) toward compression compared with the anode.
The cycling performance of full cells is beyond the scope of this work and is the subject of another paper. Our initial half-cell results show a higher working capacity for the anode dried at 80 °C. Another interesting topic could be cycling the cells at elevated temperatures. As a general rule, at higher temperatures, the transport properties improve, but so do the degradation reactions of electrode components.
4. Conclusions
Li-ion electrode film drying has a crucial effect on the microstructure, and yet relatively little is known about this process. This work provides an experimental study of the drying process for both a graphite anode and NMC cathode.
The experiments confirm the accuracy of the novel MPSP-model predictions in the binder redistribution near the current collector at conventional drying temperatures.
The EDS results show that these two electrodes respond differently toward drying conditions. Binder migration starts to appear at temperatures between 80 °C and 150 °C for the anode, whereas the NMC cathode has a higher tolerance toward binder redistribution; this starts to become noticeable at temperatures between 150 °C and 232 °C.
Both the cathode and anode showed the highest electronic conductivity for the drying temperature of 80 °C. This appears to be the result of a more uniform binder distribution and the higher electronic conductivity of a specific conformation of the PVDF binder.
Calendering has a diverging effect on anode electronic conductivity depending on the drying temperature. However, the trend of the electronic conductivity with the drying rate remains the same for cathodes after calendering. Regardless of the electrode type, the drying temperature of 80 °C still results in the highest electronic conductivity.
The contact resistances of both the graphite anode and NMC cathode increase at high temperatures as a result of fewer connections between the binder and current collector when the binder and conductive carbon accumulate more on the top surface.
The ionic-resistivity trend of the electrodes dried at different temperatures likewise suggests that carbon and binder redistribution at high temperatures causes higher ionic resistance at the upper surface, where nanopores inside the carbon–binder domain hinder ionic transport. This restricts the ion access to the entire film volume.
While it is attractive from a manufacturing perspective to decrease the drying time by increasing the drying temperature, this work suggests that, beyond a certain limit, such an approach can cause substantial degradation to the electrode transport pathways and should be avoided.
Author Contributions
Conceptualization, M.N.; methodology, M.N., D.R.W. and B.L.; software, Z.H. and M.N.; validation, M.N. and B.L.; formal analysis, M.N., B.L., P.M. and Z.H.; investigation, M.N.; resources, D.R.W.; data curation, M.N.; writing—original draft preparation, M.N.; writing—review and editing, M.N., D.R.W., B.A.M. and P.M.; visualization, M.N.; supervision, D.R.W.; project administration, D.R.W.; funding acquisition, D.R.W. and B.A.M. All authors have read and agreed to the published version of the manuscript.
Funding
This work was partially supported by the US Department of Energy Vehicles Technology Office through the eXtreme Fast Charge and Cell Evaluation for Li-ion Batteries (XCEL) Program.
Institutional Review Board Statement
Not applicable.
Informed Consent Statement
Not applicable.
Conflicts of Interest
The authors declare no conflict of interest.
References
- Tsai, F.-Y.; Jhang, J.H.; Hsieh, H.W.; Li, C.C. Dispersion, agglomeration, and gelation of LiFePO4 in water-based slurry. J. Power Sources 2016, 310, 47–53. [Google Scholar] [CrossRef]
- Mohanty, D.; Hockaday, E.; Li, J.; Hensley, D.K.; Daniel, C.; Wood III, D.L. Effect of electrode manufacturing defects on electrochemical performance of lithium-ion batteries: Cognizance of the battery failure sources. J. Power Sources 2016, 312, 70–79. [Google Scholar] [CrossRef]
- Jaiser, S.; Kumberg, J.; Klaver, J.; Urai, J.L.; Schabel, W.; Schmatz, J.; Scharfer, P. Microstructure formation of lithium-ion battery electrodes during drying—An ex-situ study using cryogenic broad ion beam slope-cutting and scanning electron microscopy (Cryo-BIB-SEM). J. Power Sources 2017, 345, 97–107. [Google Scholar] [CrossRef]
- Zheng, H.; Tan, L.; Liu, G.; Song, X.; Battaglia, V.S. Calendering effects on the physical and electrochemical properties of Li[Ni1/3Mn1/3Co1/3]O2 cathode. J. Power Sources 2012, 208, 52–57. [Google Scholar] [CrossRef]
- Font, F.; Protas, B.; Richardson, G.; Foster, J.M. Binder migration during drying of lithium-ion battery electrodes: Modelling and comparison to experiment. J. Power Sources 2018, 393, 177–185. [Google Scholar] [CrossRef]
- Kumberg, J.; Müller, M.; Diehm, R.; Spiegel, S.; Wachsmann, C.; Bauer, W.; Scharfer, P.; Schabel, W. Drying of Lithium-Ion Battery Anodes for Use in High-Energy Cells: Influence of Electrode Thickness on Drying Time, Adhesion, and Crack Formation. Energy Technol. 2019, 7, 1900722. [Google Scholar] [CrossRef]
- Morasch, R.; Landesfeind, J.; Suthar, B.; Gasteiger, H.A. Detection of binder gradients using impedance spectroscopy and their influence on the tortuosity of Li-ion battery graphite electrodes. J. Electrochem. Soc. 2018, 165, A3459. [Google Scholar] [CrossRef]
- Saraka, R.; Morelly, S.L.; Tang, M.H.; Alvarez, N.J. Effect of Shear Rate and Drying Speed in Lithium-Ion Battery Slurry Processing. In Proceedings of the 2018 AIChE Annual Meeting, Pittsburgh, PA, USA, 28 October–2 November 2018. [Google Scholar]
- Jaiser, S.; Müller, M.; Baunach, M.; Bauer, W.; Scharfer, P.; Schabel, W. Investigation of film solidification and binder migration during drying of Li-Ion battery anodes. J. Power Sources 2016, 318, 210–219. [Google Scholar] [CrossRef]
- Jaiser, S.; Funk, L.; Baunach, M.; Scharfer, P.; Schabel, W. Experimental investigation into battery electrode surfaces: The distribution of liquid at the surface and the emptying of pores during drying. J. Colloid Interface Sci. 2017, 494, 22–31. [Google Scholar] [CrossRef]
- Wang, C.; Guo, Z.; Zhang, S.; Chen, G.; Dong, S.; Cui, G. Constructing in-situ polymerized electrolyte on lithiophilic anode for high-performance lithium–air batteries operating in ambient conditions. Energy Storage Mater. 2021, 43, 221–228. [Google Scholar] [CrossRef]
- Saraka, R.M. Correlating Processing Conditions to Microstructural Order and Performance of Lithium-Ion Battery Electrodes; Drexel University: Philadelphia, PA, USA, 2021. [Google Scholar]
- Nikpour, M.; Barrett, N.; Hillman, Z.; Thompson, A.; Mazzeo, B.A.; Wheeler, D. A Model for Investigating Sources of Li-Ion Battery Electrode Heterogeneity: Part I. Electrode Drying and Calendering Processes. J. Electrochem. Soc. 2021, 168, 060547. [Google Scholar] [CrossRef]
- Vogel, J.E.; Hunter, E.E.; Wheeler, D.R.; Mazzeo, B.A. Micro-Flexible-Surface Probe for Determining Spatially Heterogeneous Electronic Conductivity of Lithium-Ion Battery Electrode Films. J. Electrochem. Soc. 2021, 168, 100504. [Google Scholar] [CrossRef]
- Liu, B.; Prugue, K.; Nikpour, M.; Ward, K.; Mazzeo, B.A.; Wheeler, D.R. Heterogeneity in MacMullin Number of Li-ion Battery Electrodes Studied by Means of an Aperture Probe. J. Electrochem. Soc. 2021, 1, 010517. [Google Scholar] [CrossRef]
- Hawley, W.B.; Li, J. Beneficial rheological properties of lithium-ion battery cathode slurries from elevated mixing and coating temperatures. J. Energy Storage 2019, 26, 100994. [Google Scholar] [CrossRef]
- Baesch, S.; Price, K.; Scharfer, P.; Francis, L.; Schabel, W. Influence of the drying conditions on the particle distribution in particle filled polymer films: Experimental validation of predictive drying regime maps. Chem. Eng. Process.-Process. Intensif. 2018, 123, 138–147. [Google Scholar] [CrossRef]
- Westphal, B.G.; Kwade, A. Critical electrode properties and drying conditions causing component segregation in graphitic anodes for lithium-ion batteries. J. Energy Storage 2018, 18, 509–517. [Google Scholar] [CrossRef]
- Park, I.-H.; Xu, Z.Y.; Ling, Y.; Kim, B.-S.; Lee, J.-O. Existence of critical aggregation concentration at the very dilute regime of poly (vinylidene fluoride)/propylene carbonate system. Bull. Korean Chem. Soc. 2007, 28, 1425–1428. [Google Scholar]
- Jaiser, S.; Sanchez Salach, N.; Baunach, M.; Scharfer, P.; Schabel, W. Impact of drying conditions and wet film properties on adhesion and film solidification of lithium-ion battery anodes. Dry. Technol. 2017, 35, 1807–1817. [Google Scholar] [CrossRef]
- Xu, P.; Mujumdar, A.; Yu, B. Drying-induced cracks in thin film fabricated from colloidal dispersions. Dry. Technol. 2009, 27, 636–652. [Google Scholar] [CrossRef]
- Susarla, N.; Ahmed, S.; Dees, D.W. Modeling and analysis of solvent removal during Li-ion battery electrode drying. J. Power Sources 2018, 378, 660–670. [Google Scholar] [CrossRef]
- Pfaffmann, L.; Jaiser, S.; Müller, M.; Scharfer, P.; Schabel, W.; Bauer, W.; Scheiba, F.; Ehrenberg, H. New method for binder and carbon black detection at nanometer scale in carbon electrodes for lithium ion batteries. J. Power Sources 2017, 363, 460–469. [Google Scholar] [CrossRef]
- Schlünder, E.-U. Drying of porous material during the constant and the falling rate period: A critical review of existing hypotheses. Dry. Technol. 2004, 22, 1517–1532. [Google Scholar] [CrossRef]
- Delgado, J.; de Lima, A.G.B. Drying and Energy Technologies; Springer: Berlin/Heidelberg, Germany, 2016. [Google Scholar]
- Routh, A.F. Drying of thin colloidal films. Rep. Prog. Phys. 2013, 76, 046603. [Google Scholar] [CrossRef]
- Sung, S.H.; Kim, S.; Park, J.H.; Park, J.D.; Ahn, K.H. Role of PVDF in Rheology and Microstructure of NCM Cathode Slurries for Lithium-Ion Battery. Materials 2020, 13, 4544. [Google Scholar] [CrossRef] [PubMed]
- Chou, S.-L.; Pan, Y.; Wang, J.-Z.; Liu, H.-K.; Dou, S.-X. Small things make a big difference: Binder effects on the performance of Li and Na batteries. Phys. Chem. Chem. Phys. 2014, 16, 20347–20359. [Google Scholar] [CrossRef] [PubMed]
- Li, C.-C.; Wang, Y.-W. Binder distributions in water-based and organic-based LiCoO2 electrode sheets and their effects on cell performance. J. Electrochem. Soc. 2011, 158, A1361. [Google Scholar] [CrossRef]
- Baunach, M.; Jaiser, S.; Schmelzle, S.; Nirschl, H.; Scharfer, P.; Schabel, W. Delamination behavior of lithium-ion battery anodes: Influence of drying temperature during electrode processing. Dry. Technol. 2016, 34, 462–473. [Google Scholar] [CrossRef]
- Pouraghajan, F.; Thompson, A.I.; Hunter, E.E.; Mazzeo, B.; Christensen, J.; Subbaraman, R.; Wray, M.; Wheeler, D. The effects of cycling on ionic and electronic conductivities of Li–ion battery electrodes. J. Power Sources 2021, 492, 229636. [Google Scholar] [CrossRef]
- Du, Z.; Rollag, K.; Li, J.; An, S.J.; Wood, M.; Sheng, Y.; Mukherjee, P.; Daniel, C.; Wood Iii, D. Enabling aqueous processing for crack-free thick electrodes. J. Power Sources 2017, 354, 200–206. [Google Scholar] [CrossRef]
- Mampallil, D. Some physics inside drying droplets. Resonance 2014, 19, 123–134. [Google Scholar] [CrossRef]
- Gallagher, K.G.; Trask, S.E.; Bauer, C.; Woehrle, T.; Lux, S.F.; Tschech, M.; Lamp, P.; Polzin, B.J.; Ha, S.; Long, B. Optimizing areal capacities through understanding the limitations of lithium-ion electrodes. J. Electrochem. Soc. 2015, 163, A138. [Google Scholar] [CrossRef]
- Kermad, C.; Chehdi, K. Multi-bands image segmentation: A scalar approach. In Proceedings of the 2000 International Conference on Image Processing (Cat. No. 00CH37101), Vancouver, BC, Canada, 10–13 September 2000; IEEE: Manhattan, NY, USA, 2000; pp. 468–471. [Google Scholar]
- Lombardo, T.; Ngandjong, A.C.; Belhcen, A.; Franco, A.A. Carbon-Binder Migration: A Three-Dimensional Drying Model for Lithium-ion Battery Electrodes. Energy Storage Mater. 2021, 43, 337–347. [Google Scholar] [CrossRef]
- Goldstein, J.I.; Newbury, D.E.; Michael, J.R.; Ritchie, N.W.; Scott, J.H.J.; Joy, D.C. Scanning Electron Microscopy and X-ray Microanalysis; Springer: Berlin/Heidelberg, Germany, 2017. [Google Scholar]
- Horibe, H.; Sasaki, Y.; Oshiro, H.; Hosokawa, Y.; Kono, A.; Takahashi, S.; Nishiyama, T. Quantification of the solvent evaporation rate during the production of three PVDF crystalline structure types by solvent casting. Polym. J. 2014, 46, 104–110. [Google Scholar] [CrossRef]
- Wang, M.; Hu, J.; Wang, Y.; Cheng, Y.-T. The Influence of Polyvinylidene Fluoride (PVDF) Binder Properties on LiNi0.33Co0.33Mn0.33O2 (NMC) Electrodes Made by a Dry-Powder-Coating Process. J. Electrochem. Soc. 2019, 166, A2151. [Google Scholar] [CrossRef]
Figure 1.
Illustration of the electrode-film drying mechanism: by means of consolidation (a,b) and pore emptying (c,d), to achieve a fully dried electrode (e). The drying curve (f) can also be divided into constant-rate and falling-rate regimes.
Figure 1.
Illustration of the electrode-film drying mechanism: by means of consolidation (a,b) and pore emptying (c,d), to achieve a fully dried electrode (e). The drying curve (f) can also be divided into constant-rate and falling-rate regimes.

Figure 2.
SEM cross-sectional images of the dried graphite anode at: (a) 24 °C; (b) 80 °C; (c) 150 °C; (d) 232 °C.
Figure 2.
SEM cross-sectional images of the dried graphite anode at: (a) 24 °C; (b) 80 °C; (c) 150 °C; (d) 232 °C.

Figure 3.
SEM images of the dried NMC cathodes at: (a) 24 °C; (b) 80 °C; (c) 150 °C; (d) 232 °C.

Figure 4.
SEM images of the dried uncalendered graphite anode (a,b) and NMC cathode (c,d) at 24 °C and 232 °C.
Figure 4.
SEM images of the dried uncalendered graphite anode (a,b) and NMC cathode (c,d) at 24 °C and 232 °C.

Figure 5.
Normalized fluorine fraction at four regions (1 is at the top, and 4 at the bottom) of anodes at different drying temperatures of (a) 24 °C, (b) 80 °C, (c) 150 °C, and (d) 232 °C, and (e) electrode cross-section regions for EDS quantification.
Figure 5.
Normalized fluorine fraction at four regions (1 is at the top, and 4 at the bottom) of anodes at different drying temperatures of (a) 24 °C, (b) 80 °C, (c) 150 °C, and (d) 232 °C, and (e) electrode cross-section regions for EDS quantification.

Figure 6.
Fluorine elemental map for uncalendered anodes dried at: (a) 24 °C; (b) 80 °C; (c) 150 °C; (d) 232 °C.
Figure 6.
Fluorine elemental map for uncalendered anodes dried at: (a) 24 °C; (b) 80 °C; (c) 150 °C; (d) 232 °C.

Figure 7.
Normalized fluorine fraction at four regions (1 is at the top and 4 at the bottom), and fluorine maps of uncalendered cathodes at different drying temperatures of: (a,e) 24 °C; (b,f) 80 °C; (c,g) 150 °C; (d,h) 232 °C.
Figure 7.
Normalized fluorine fraction at four regions (1 is at the top and 4 at the bottom), and fluorine maps of uncalendered cathodes at different drying temperatures of: (a,e) 24 °C; (b,f) 80 °C; (c,g) 150 °C; (d,h) 232 °C.

Figure 8.
Electronic-conductivity maps of uncalendered and calendered anodes dried at (a) 24 °C, (b) 80 °C, (c) 150 °C, and (d) 232 °C, and (e) comparison between the average electronic conductivity of anodes before and after calendering.
Figure 8.
Electronic-conductivity maps of uncalendered and calendered anodes dried at (a) 24 °C, (b) 80 °C, (c) 150 °C, and (d) 232 °C, and (e) comparison between the average electronic conductivity of anodes before and after calendering.

Figure 9.
Electronic-conductivity maps of uncalendered and calendered cathodes dried at (a) 24 °C, (b) 80 °C, (c) 150 °C, and (d) 232 °C, and (e) comparison between the average electronic conductivity of cathodes before and after calendering.
Figure 9.
Electronic-conductivity maps of uncalendered and calendered cathodes dried at (a) 24 °C, (b) 80 °C, (c) 150 °C, and (d) 232 °C, and (e) comparison between the average electronic conductivity of cathodes before and after calendering.

Figure 10.
Contact-resistance maps of uncalendered and calendered anodes dried at (a) 24 °C, (b) 80 °C, (c) 150 °C, and (d) 232 °C, and (e) comparison between the average contact resistances of anodes before and after calendering.
Figure 10.
Contact-resistance maps of uncalendered and calendered anodes dried at (a) 24 °C, (b) 80 °C, (c) 150 °C, and (d) 232 °C, and (e) comparison between the average contact resistances of anodes before and after calendering.

Figure 11.
Contact-resistance maps of uncalendered and calendered cathodes dried at (a) 24 °C, (b) 80 °C, (c) 150 °C, and (d) 232 °C, and (e) comparison between the average contact resistances of cathodes before and after calendering.
Figure 11.
Contact-resistance maps of uncalendered and calendered cathodes dried at (a) 24 °C, (b) 80 °C, (c) 150 °C, and (d) 232 °C, and (e) comparison between the average contact resistances of cathodes before and after calendering.

Figure 12.
Ionic-resistance maps of uncalendered/calendered anodes dried at (a) 24 °C, (b) 80 °C, (c) 150 °C, and (d) 232 °C, and (e) comparison between the average ionic resistances of anodes before and after calendering.
Figure 12.
Ionic-resistance maps of uncalendered/calendered anodes dried at (a) 24 °C, (b) 80 °C, (c) 150 °C, and (d) 232 °C, and (e) comparison between the average ionic resistances of anodes before and after calendering.

Figure 13.
Ionic-resistance maps of uncalendered and calendered cathodes dried at (a) 24 °C, (b) 80 °C, (c) 150 °C, and (d) 232 °C, and (e) comparison between the average ionic resistances of cathodes before and after calendering.
Figure 13.
Ionic-resistance maps of uncalendered and calendered cathodes dried at (a) 24 °C, (b) 80 °C, (c) 150 °C, and (d) 232 °C, and (e) comparison between the average ionic resistances of cathodes before and after calendering.


Table 1.
Electrode formulation.
| Active Name | Active (wt%) | Carbon Black (wt%) | Binder (wt%) |
|---|---|---|---|
| NMC | 90 | 5 | 5 |
| Graphite | 92 | 2 | 6 |
Table 2.
Average drying rates (mg/s) at different temperatures.
| Temperature | 24 °C | 80 °C | 150 °C | 232 °C |
|---|---|---|---|---|
| Drying rate | 0.005 | 2.1 | 16 | 35 |
Table 3.
The overall porosity (volume %) of the uncalendered graphite anodes and NMC cathodes dried at different temperatures.
Table 3.
The overall porosity (volume %) of the uncalendered graphite anodes and NMC cathodes dried at different temperatures.
| T (°C) | Anode | Cathode |
|---|---|---|
| 24 | 48.4 | 53.9 |
| 80 | 49.1 | 41.5 |
| 150 | 44.8 | 39.5 |
| 232 | 48.4 | 39.8 |
Publisher’s Note: MDPI stays neutral with regard to jurisdictional claims in published maps and institutional affiliations. |
© 2022 by the authors. Licensee MDPI, Basel, Switzerland. This article is an open access article distributed under the terms and conditions of the Creative Commons Attribution (CC BY) license (https://creativecommons.org/licenses/by/4.0/).
Share and Cite
MDPI and ACS Style
Nikpour, M.; Liu, B.; Minson, P.; Hillman, Z.; Mazzeo, B.A.; Wheeler, D.R. Li-ion Electrode Microstructure Evolution during Drying and Calendering. Batteries 2022, 8, 107. https://doi.org/10.3390/batteries8090107
AMA Style
Nikpour M, Liu B, Minson P, Hillman Z, Mazzeo BA, Wheeler DR. Li-ion Electrode Microstructure Evolution during Drying and Calendering. Batteries. 2022; 8(9):107. https://doi.org/10.3390/batteries8090107
Chicago/Turabian StyleNikpour, Mojdeh, Baichuan Liu, Paul Minson, Zachary Hillman, Brian A. Mazzeo, and Dean R. Wheeler. 2022. "Li-ion Electrode Microstructure Evolution during Drying and Calendering" Batteries 8, no. 9: 107. https://doi.org/10.3390/batteries8090107
Note that from the first issue of 2016, this journal uses article numbers instead of page numbers. See further details here.