Fast Electrical Characterizations of High-Energy Second Life Lithium-Ion Batteries for Embedded and Stationary Applications


Abstract
:1. Introduction
1.1. Deployment of Electric Vehicles and Arrival of Second Life Batteries
1.2. Heterogeneity of State of Health in Second Life Batteries
1.3. Need of Specific Methods for Determination of SOH
2. Experimental Setup and Methods
2.1. Data Acquisition System
2.2. Cell Specifications
2.3. Experimental Methods for SOH Estimation
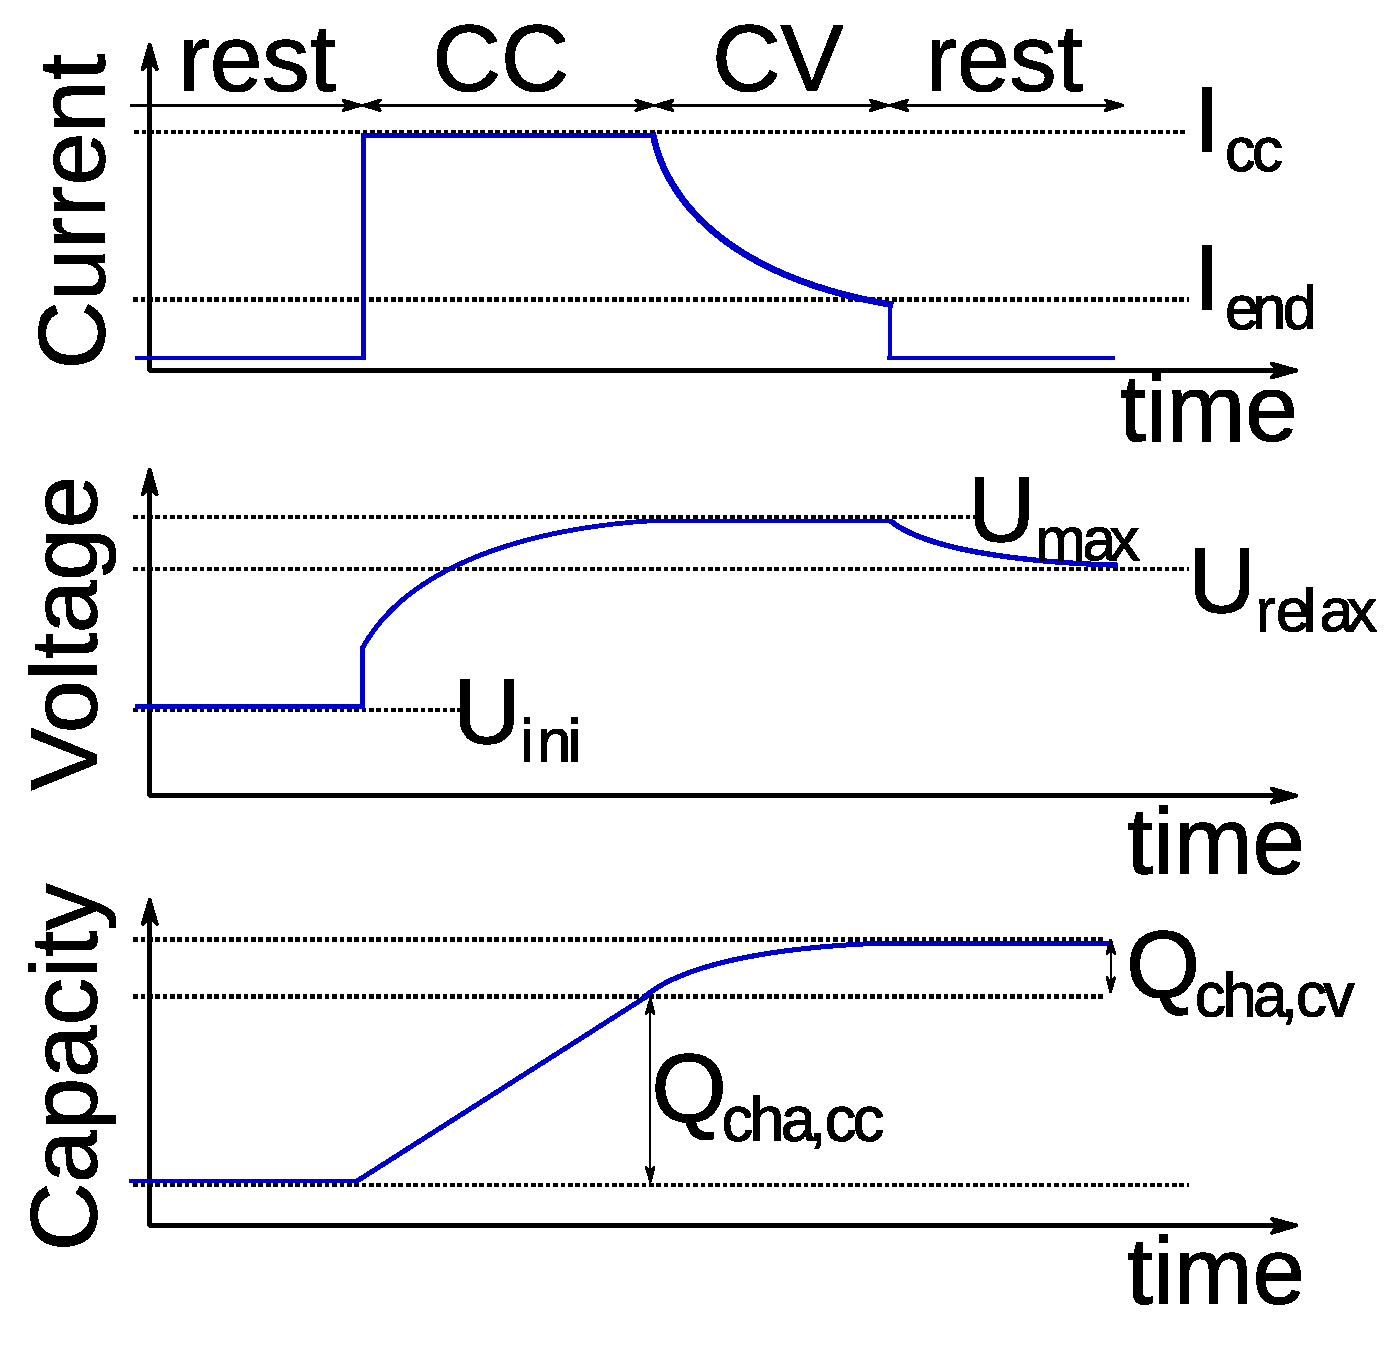
2.3.1. Constant Voltage Analysis during CC-CV Charge
2.3.2. Incremental Capacity Analysis
2.3.3. Partial Coulometric Counter
3. Comparison between Methods for Fast Characterization of SOH
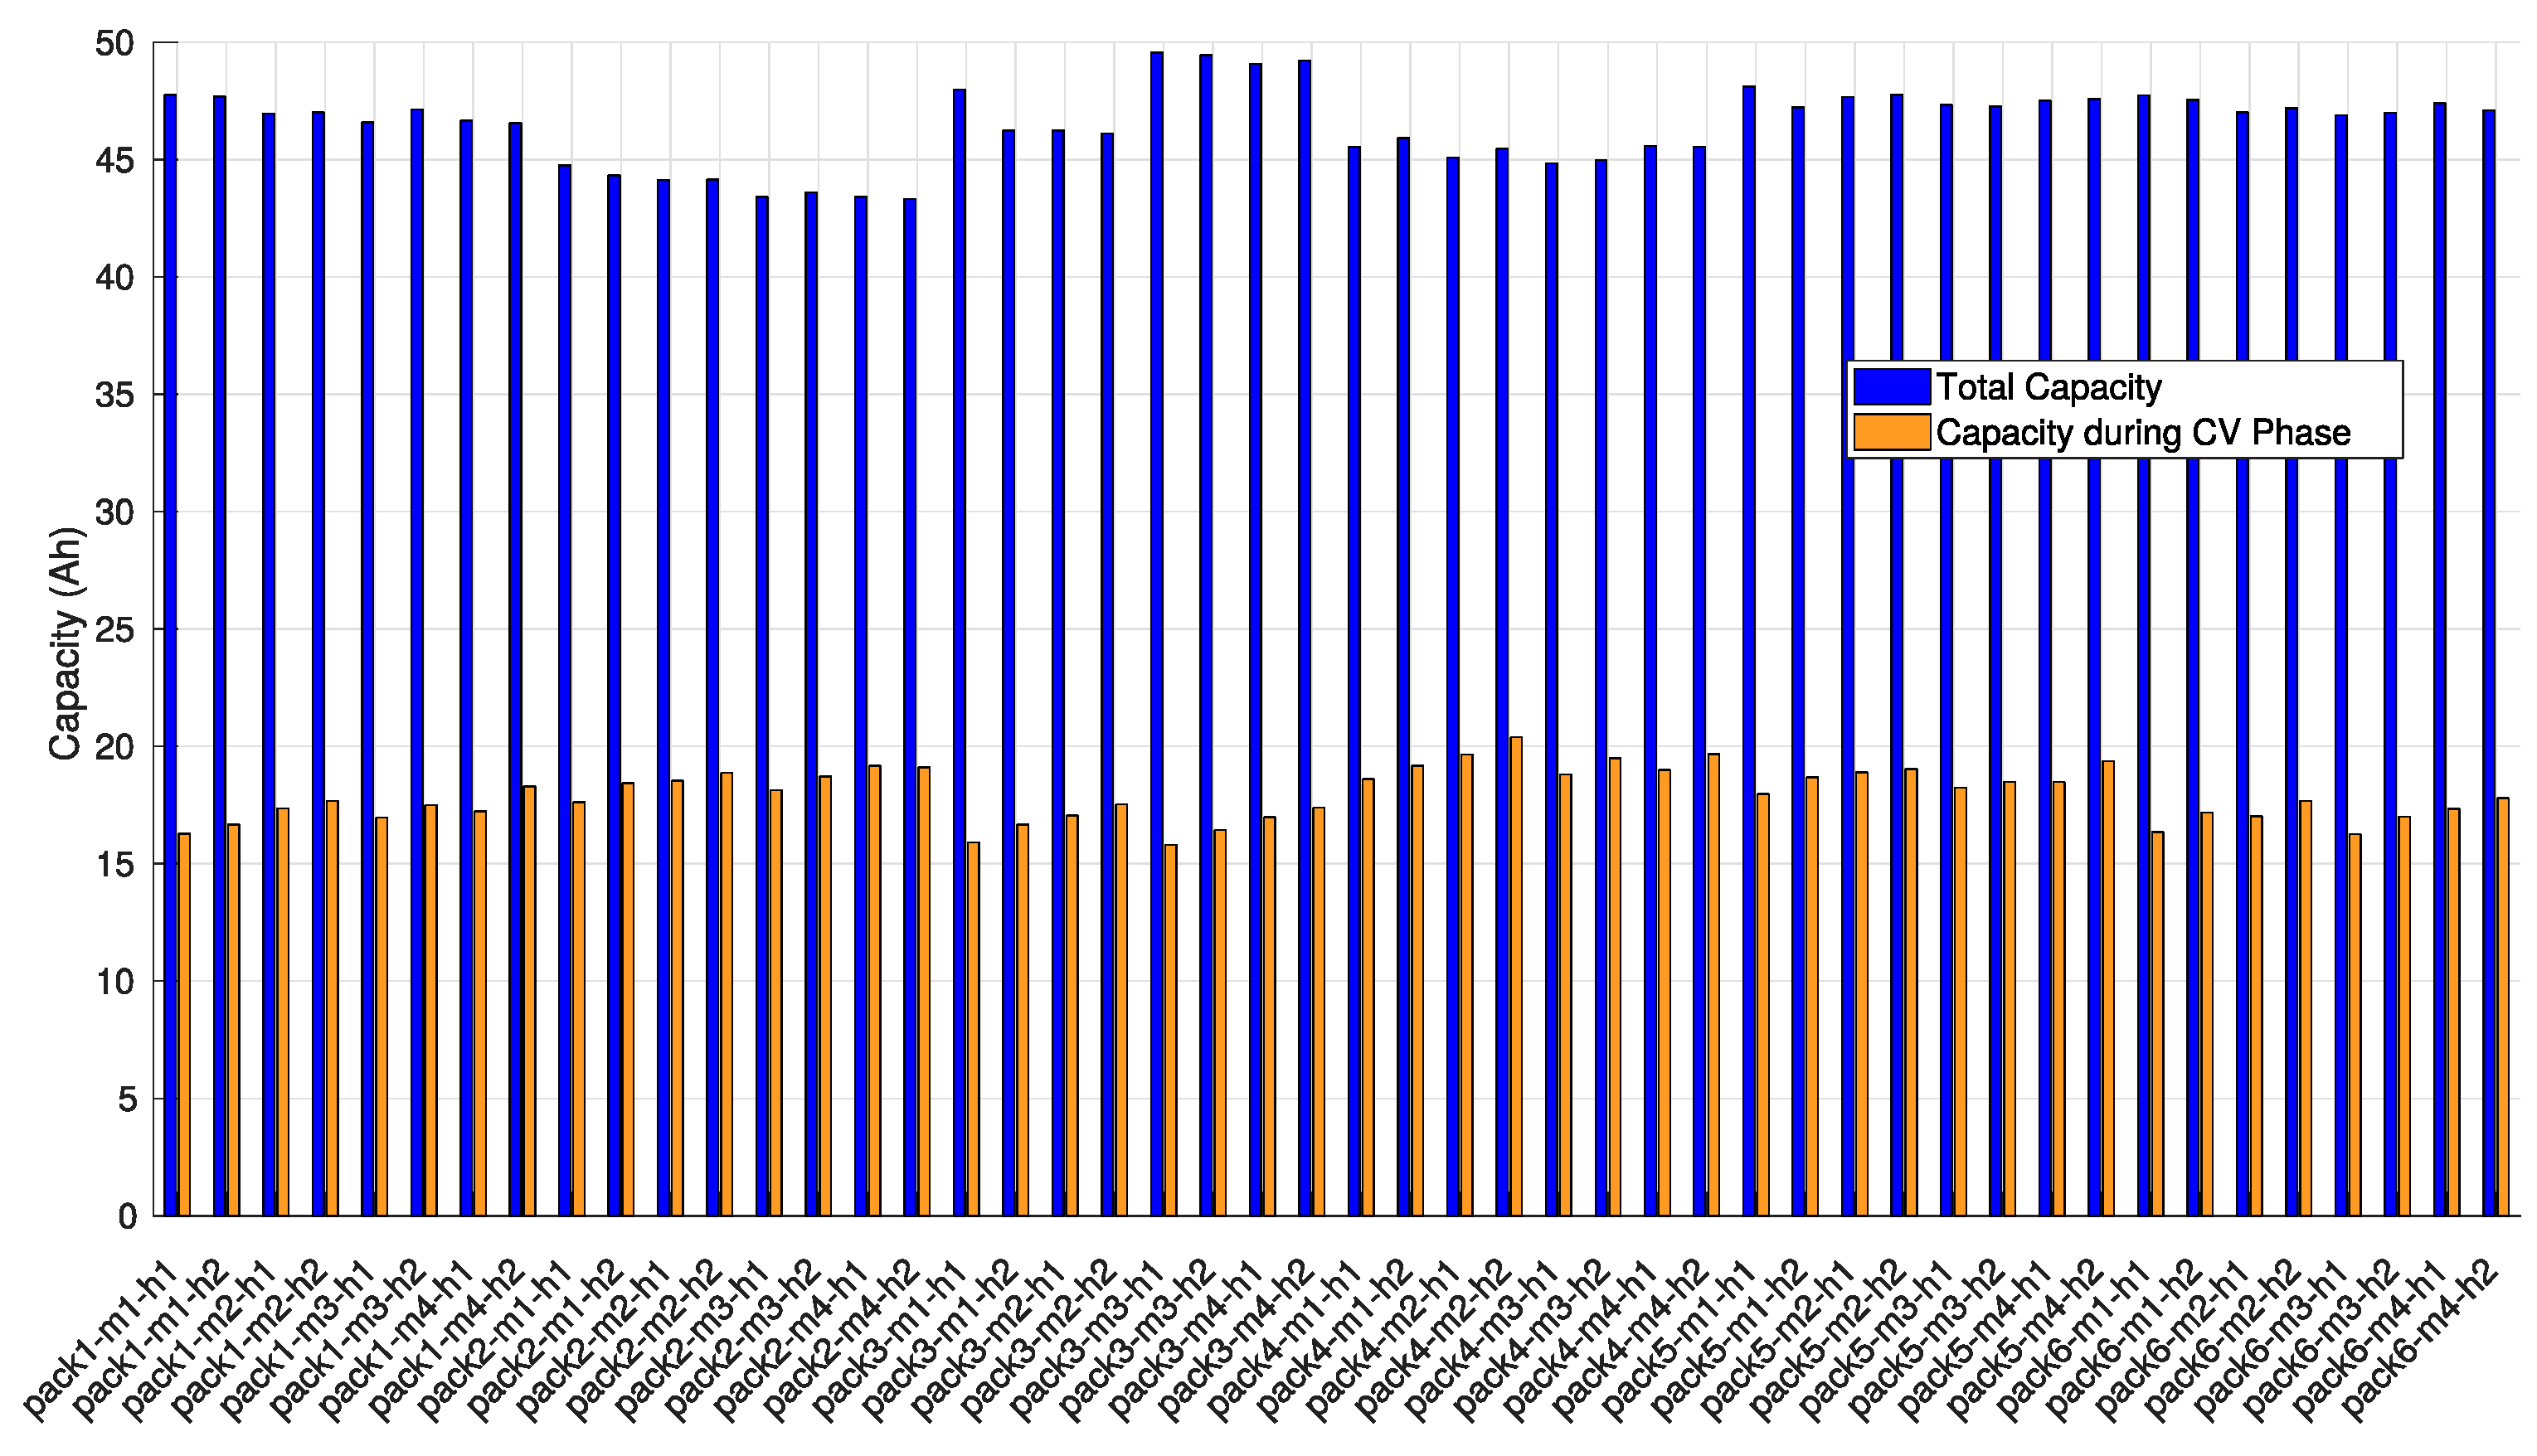
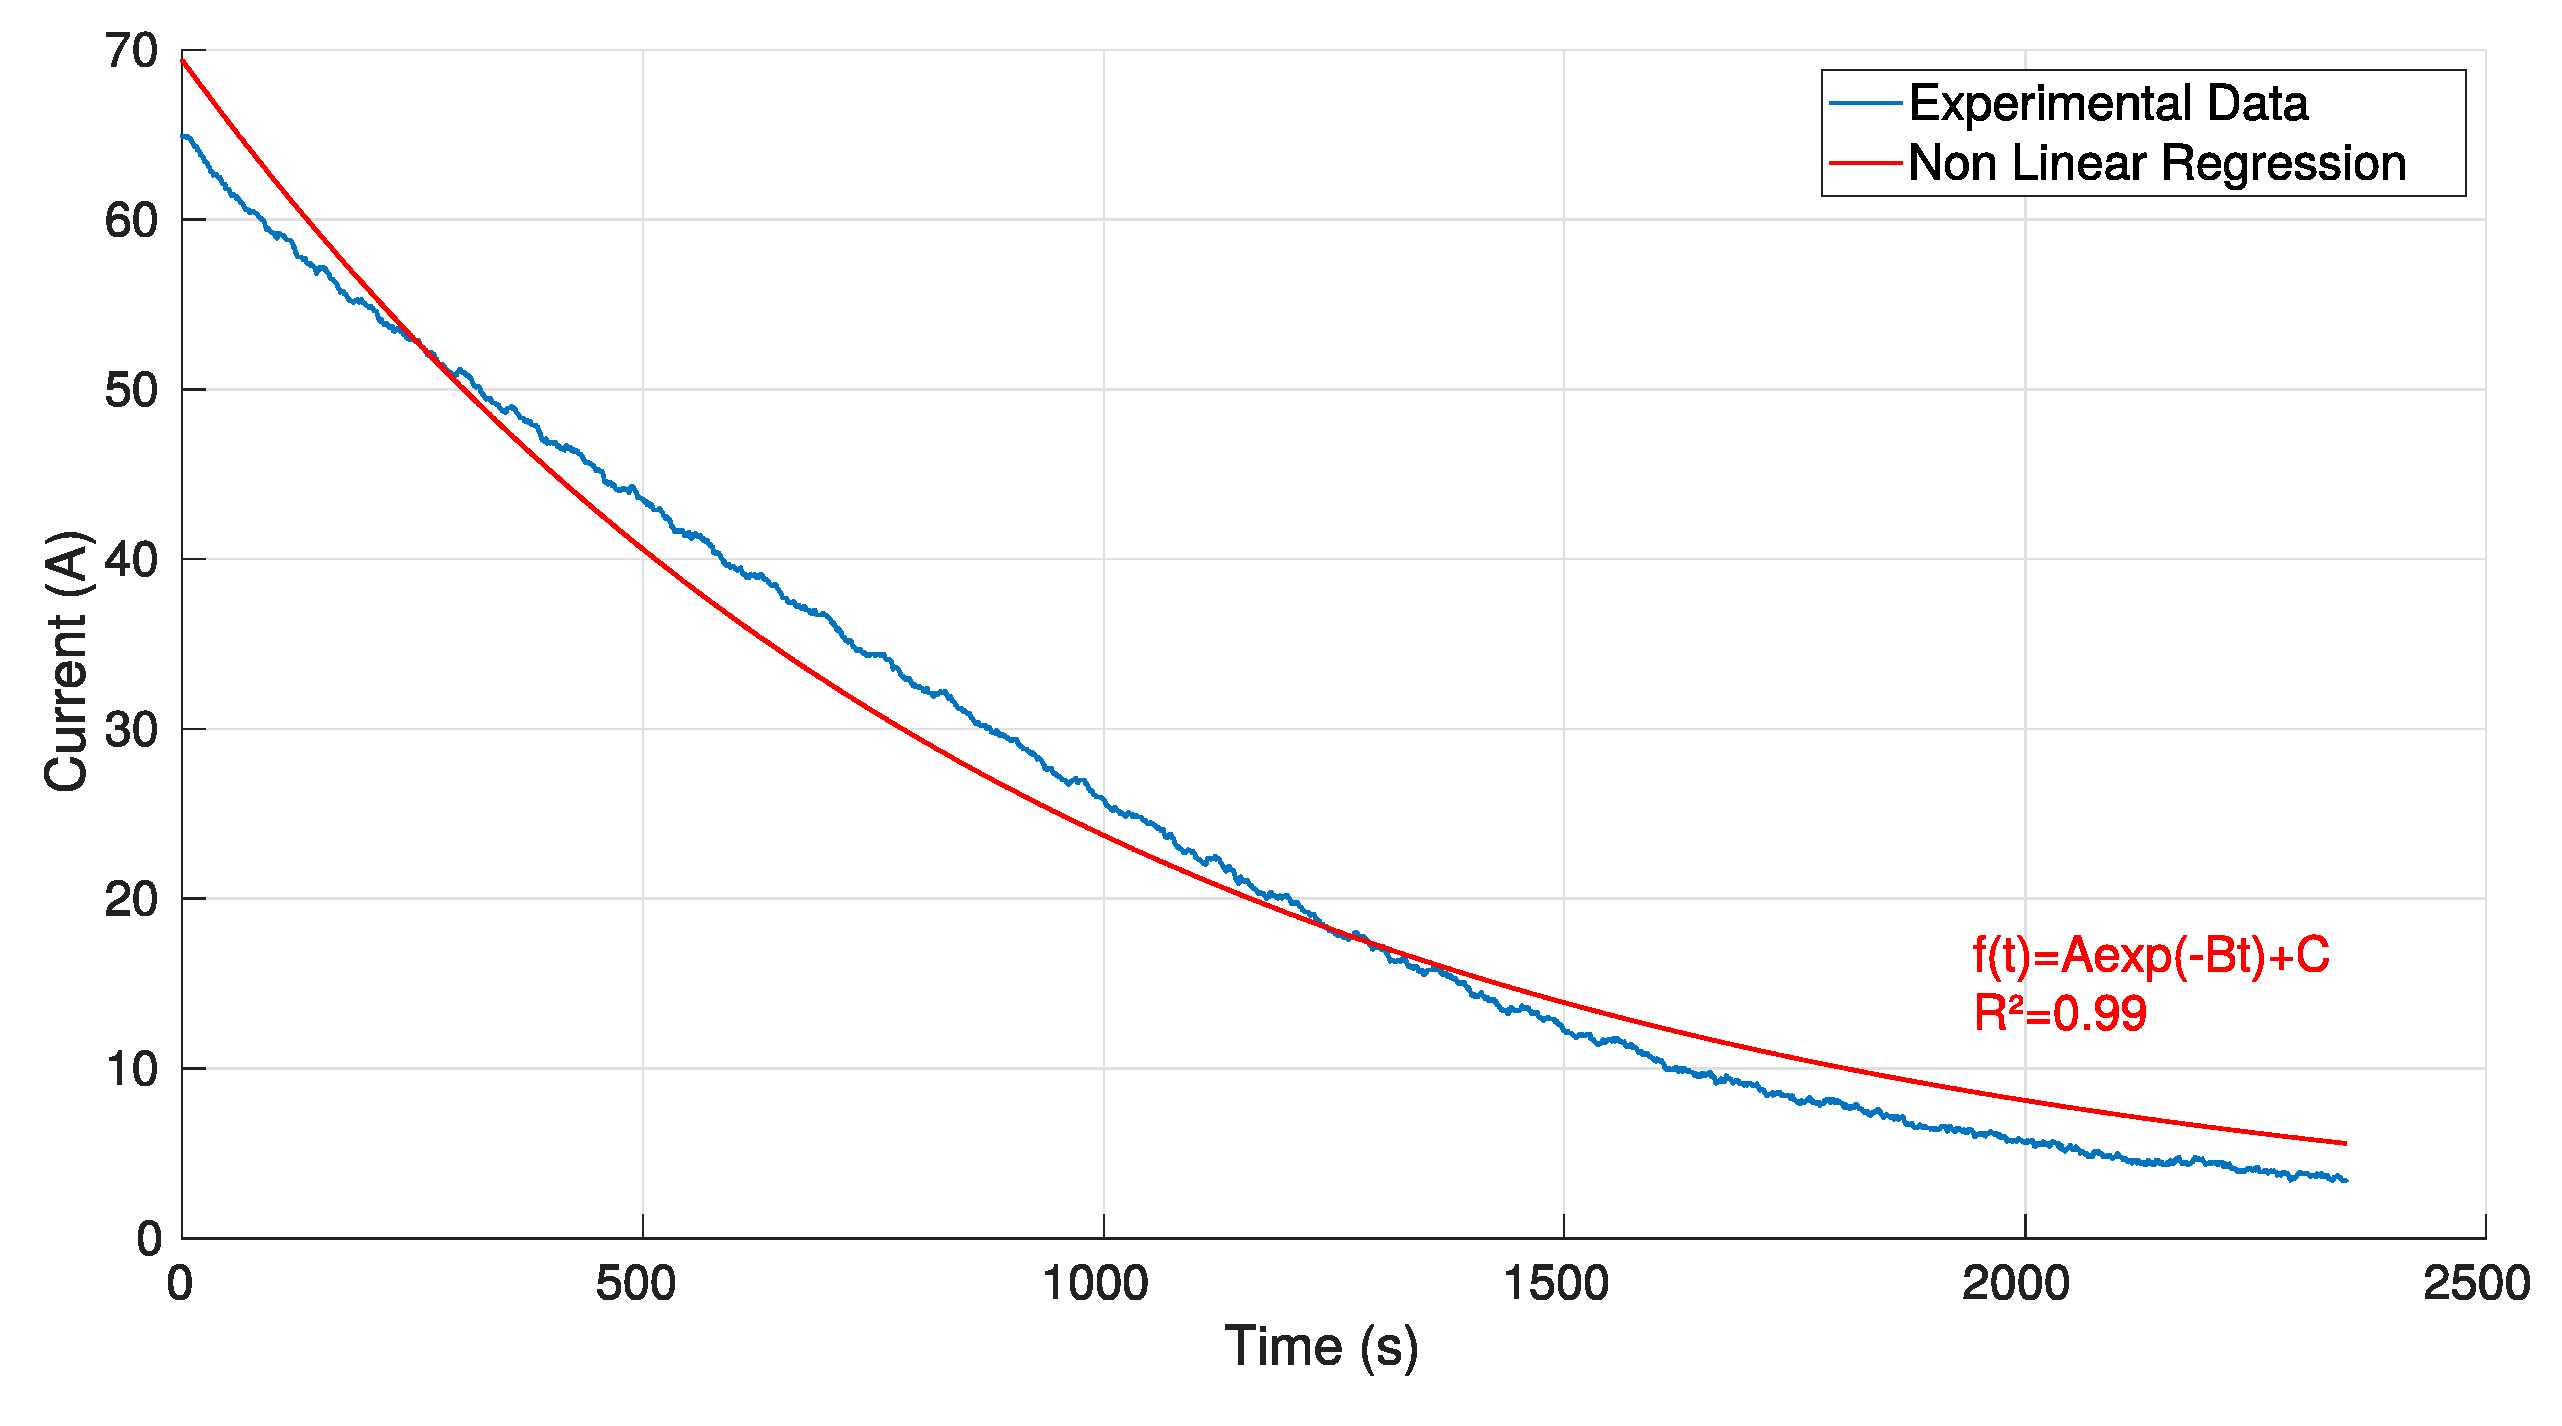
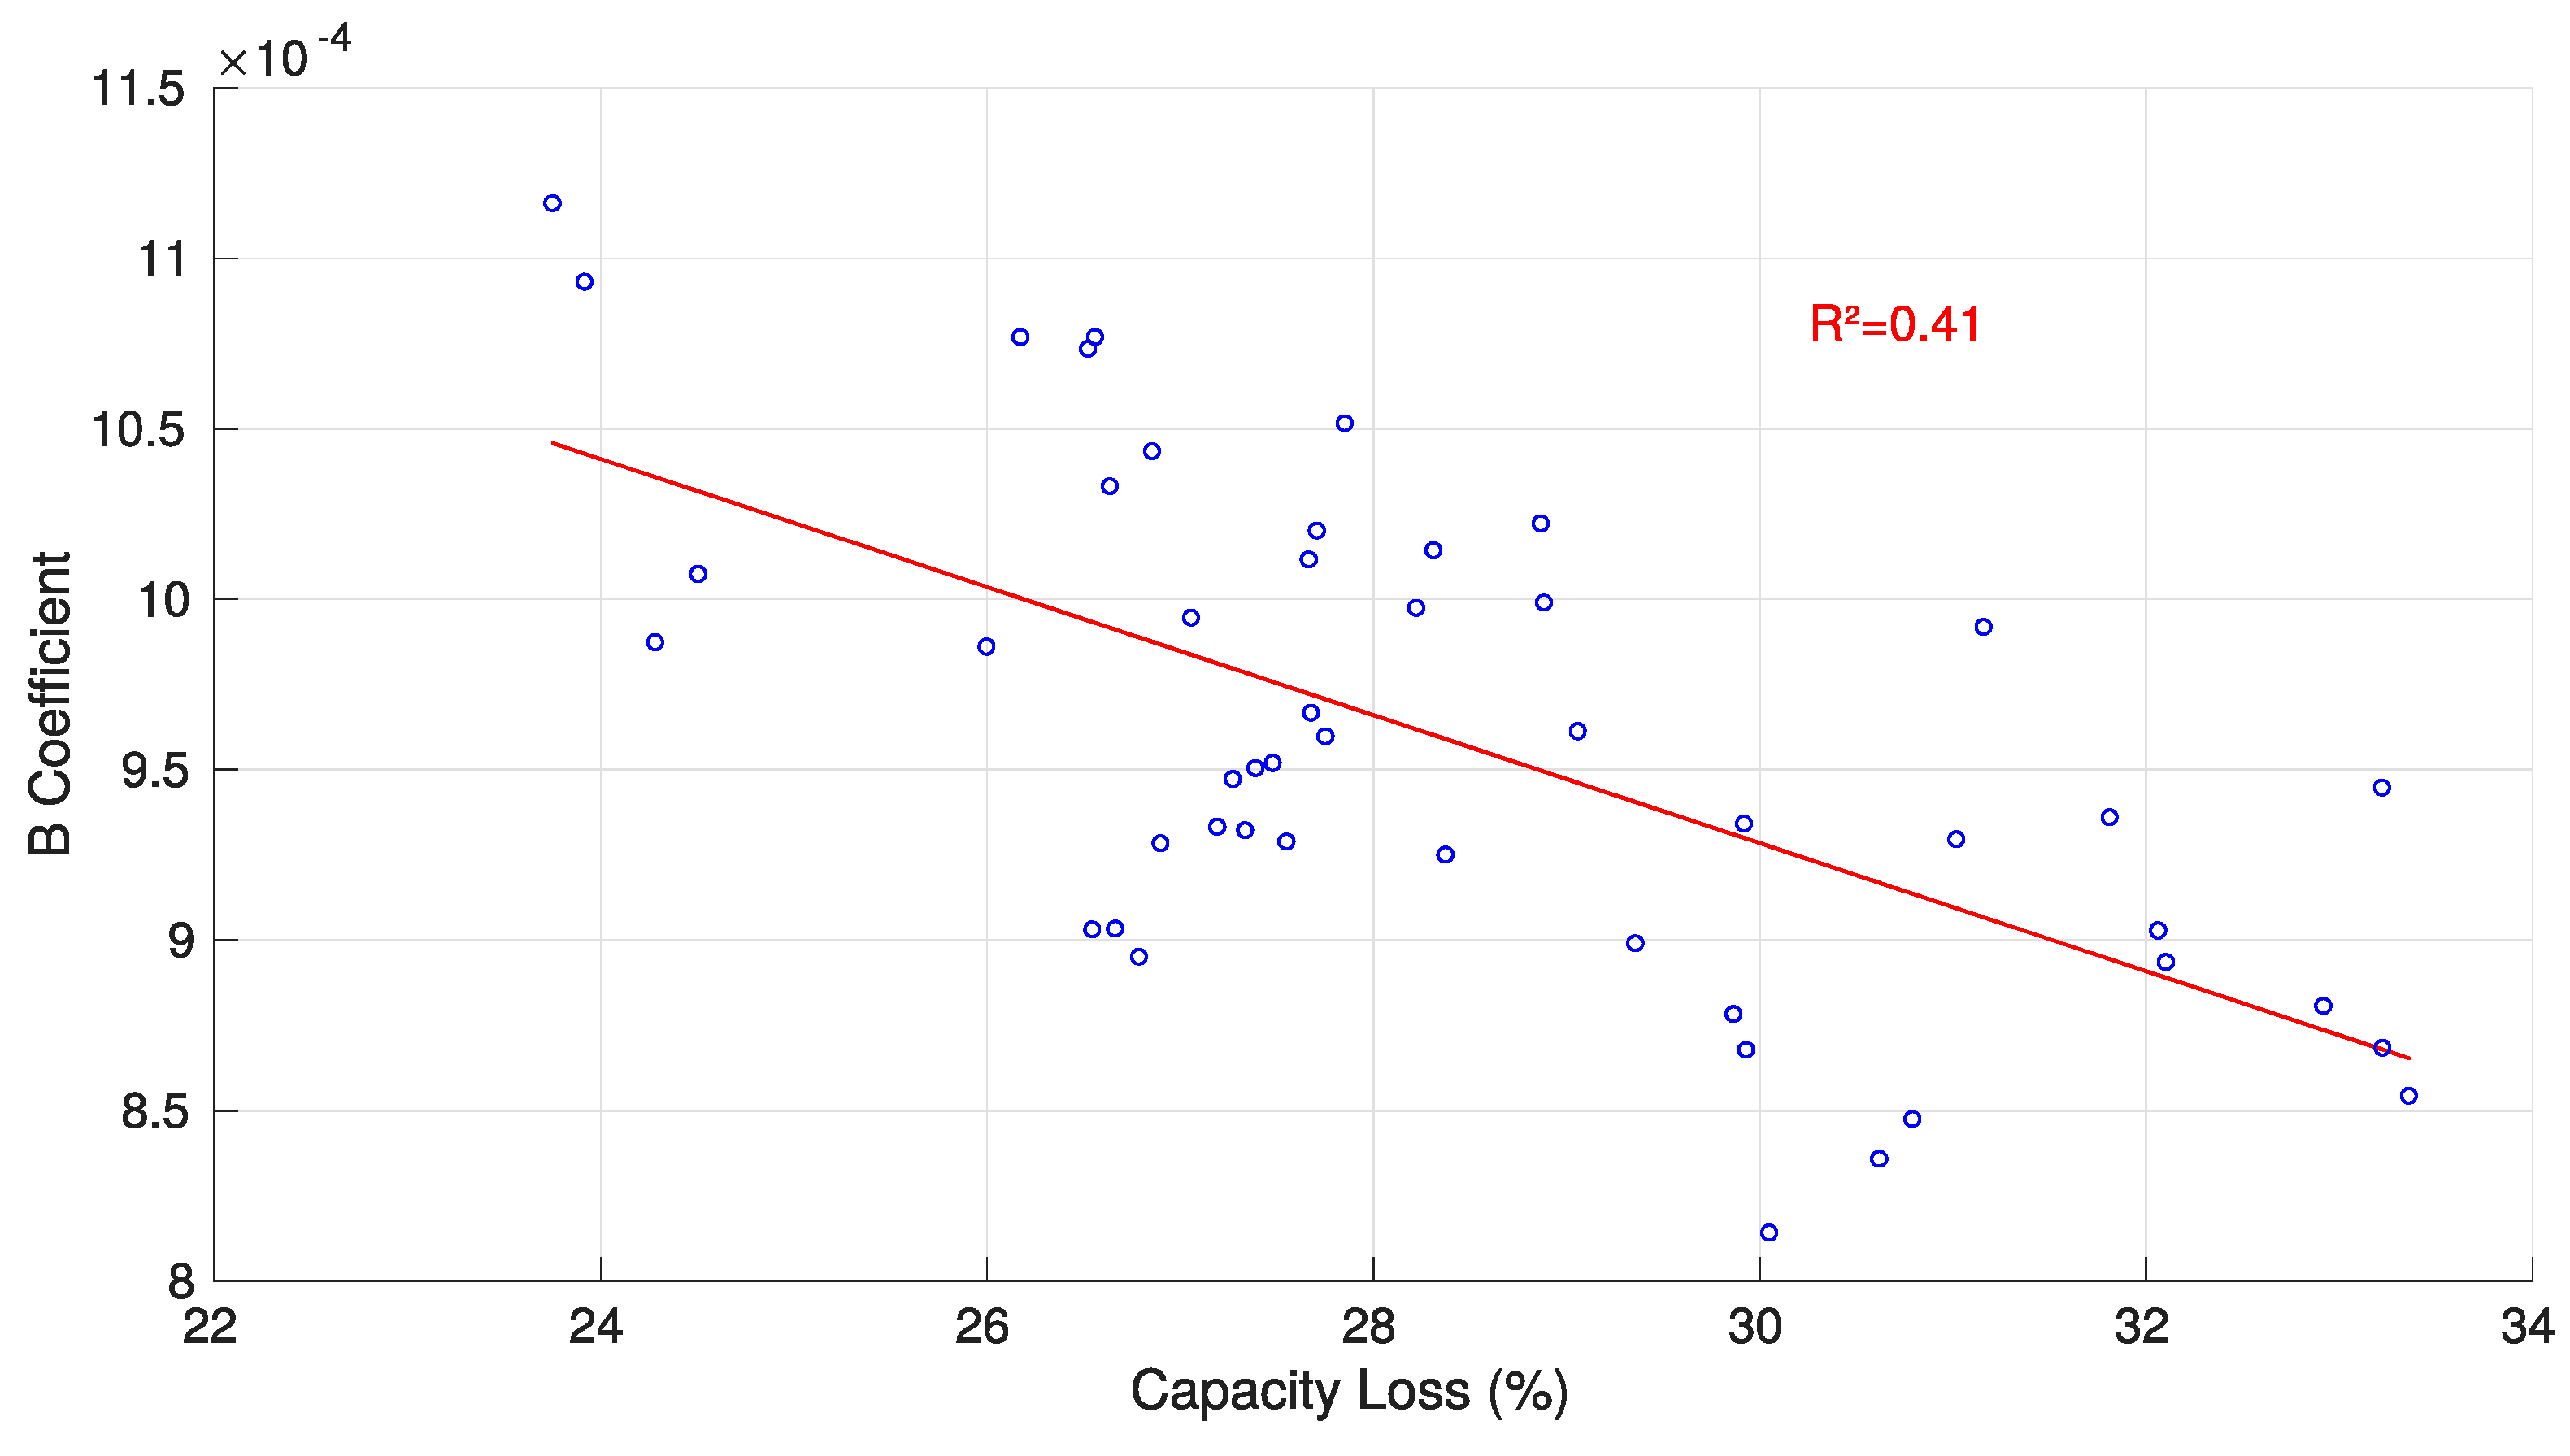
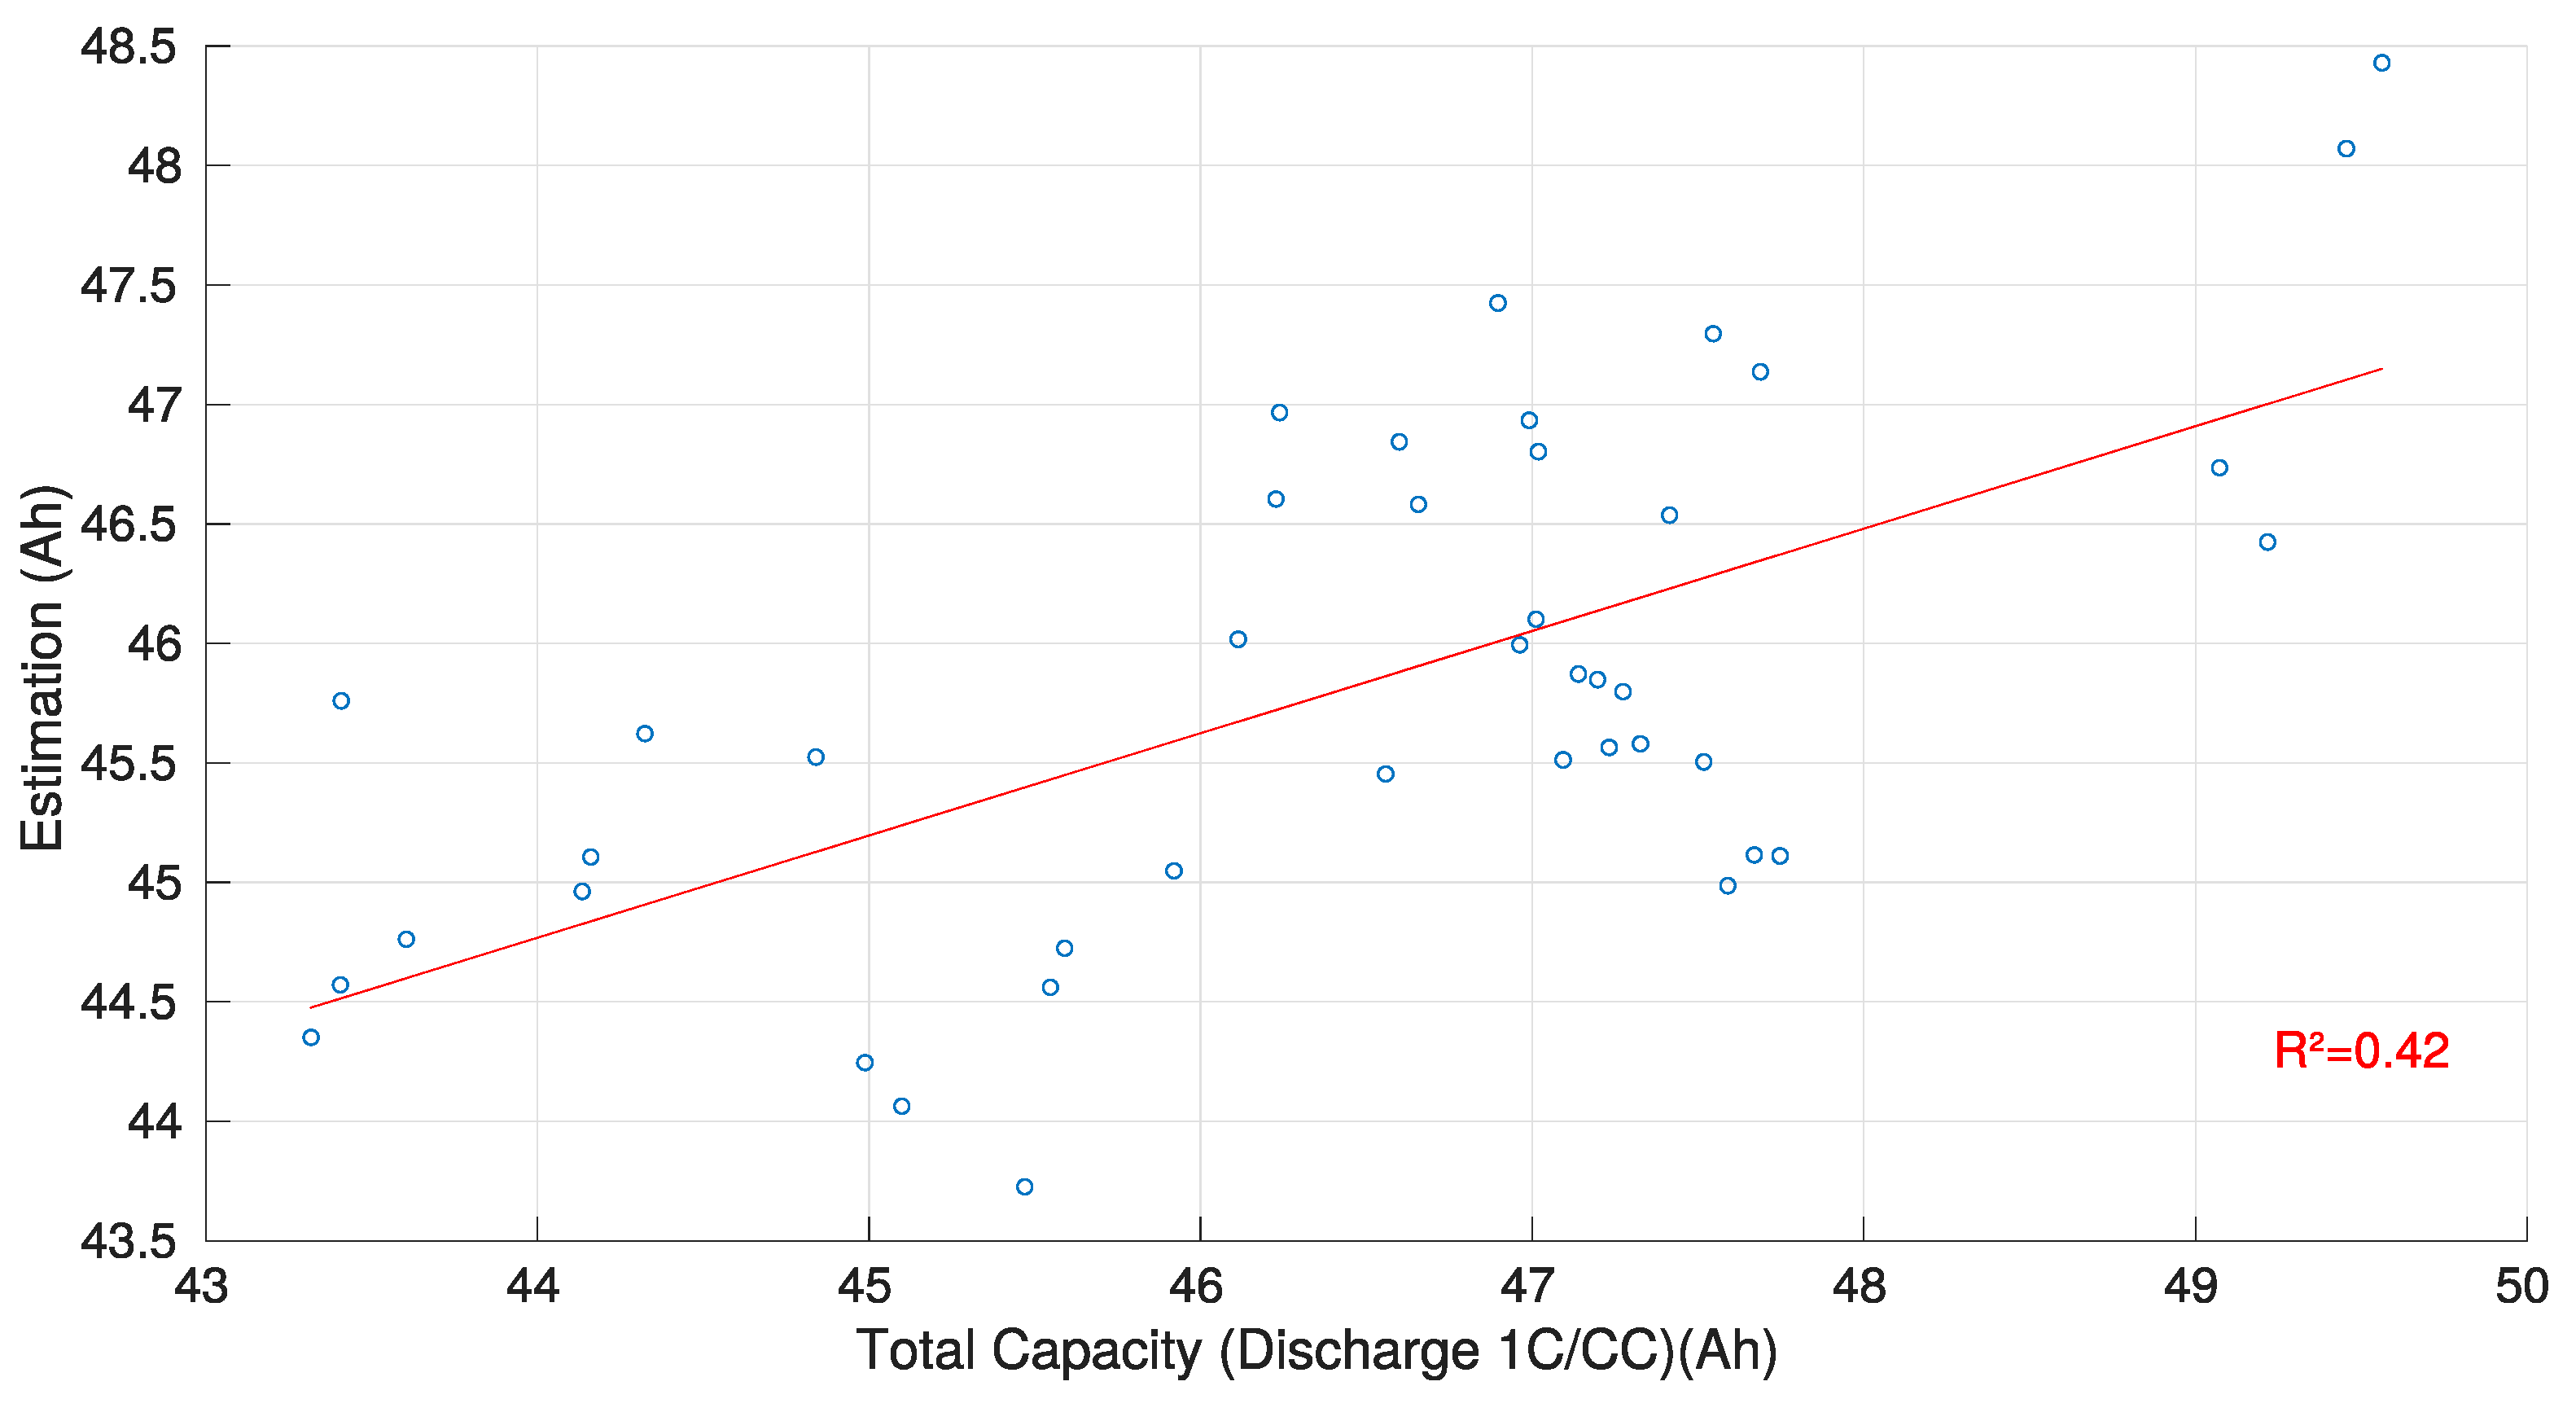
3.1. CV Charge Phase Capacity Estimation Method
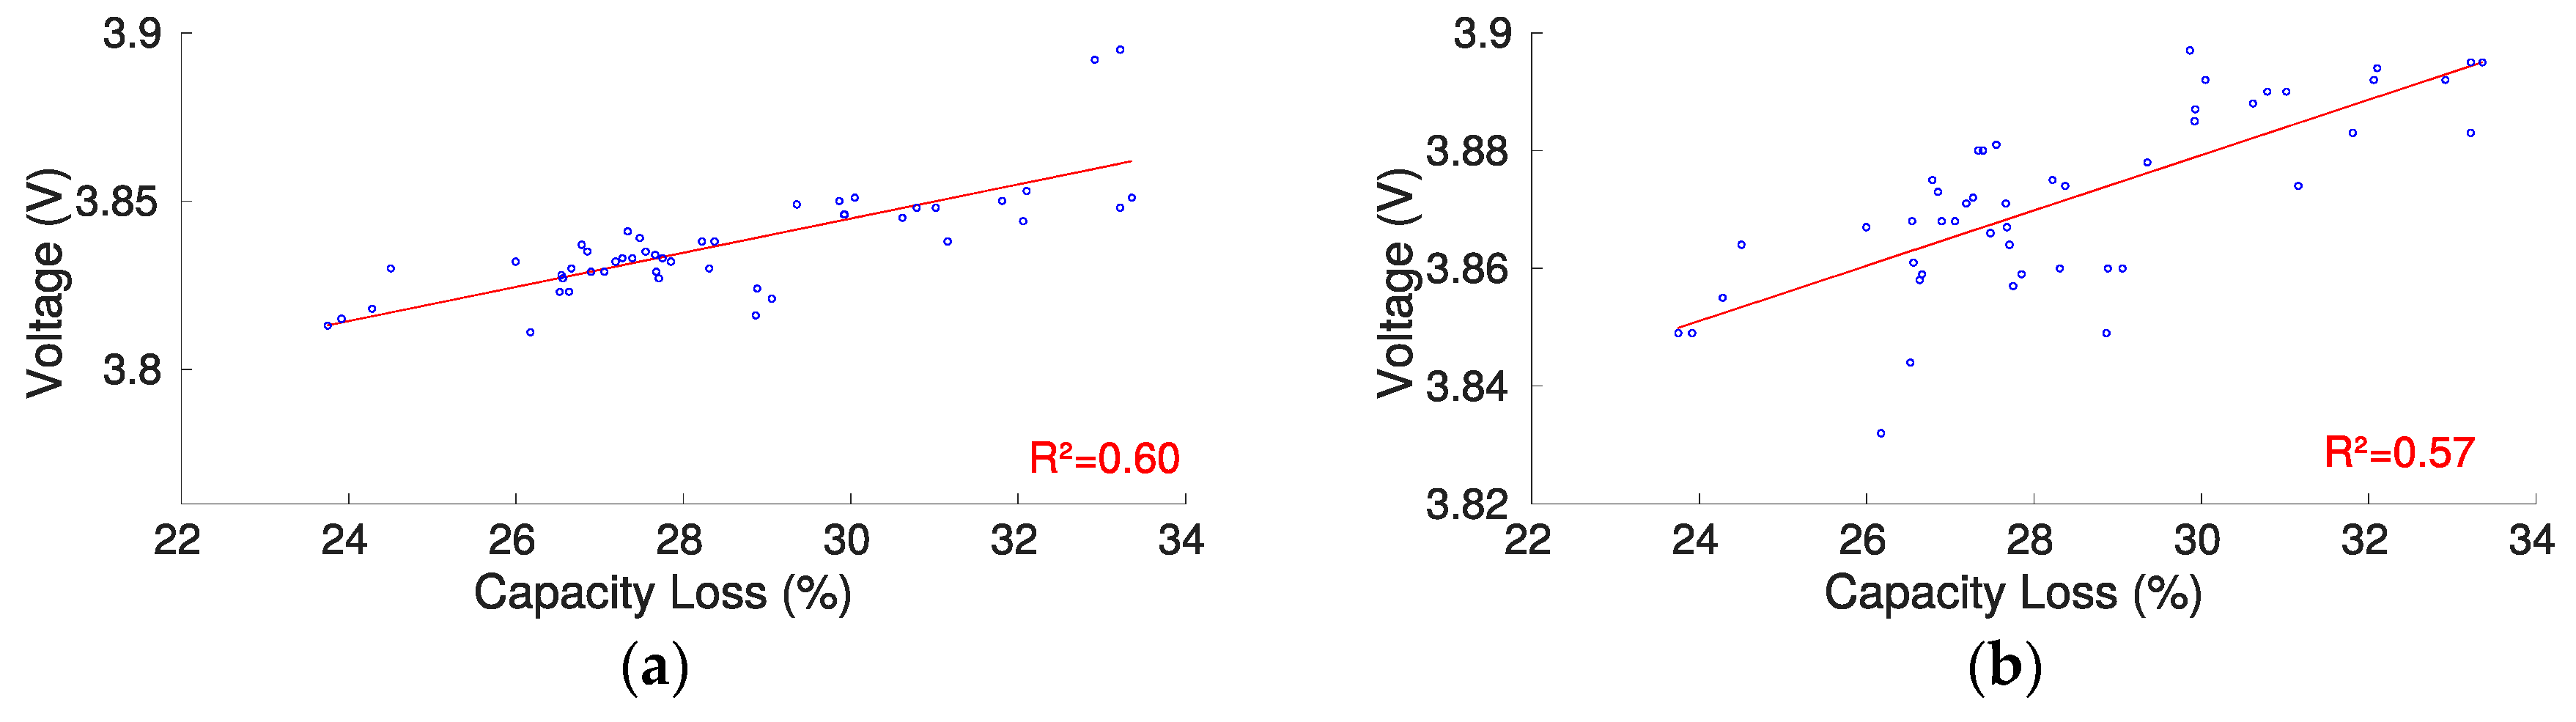
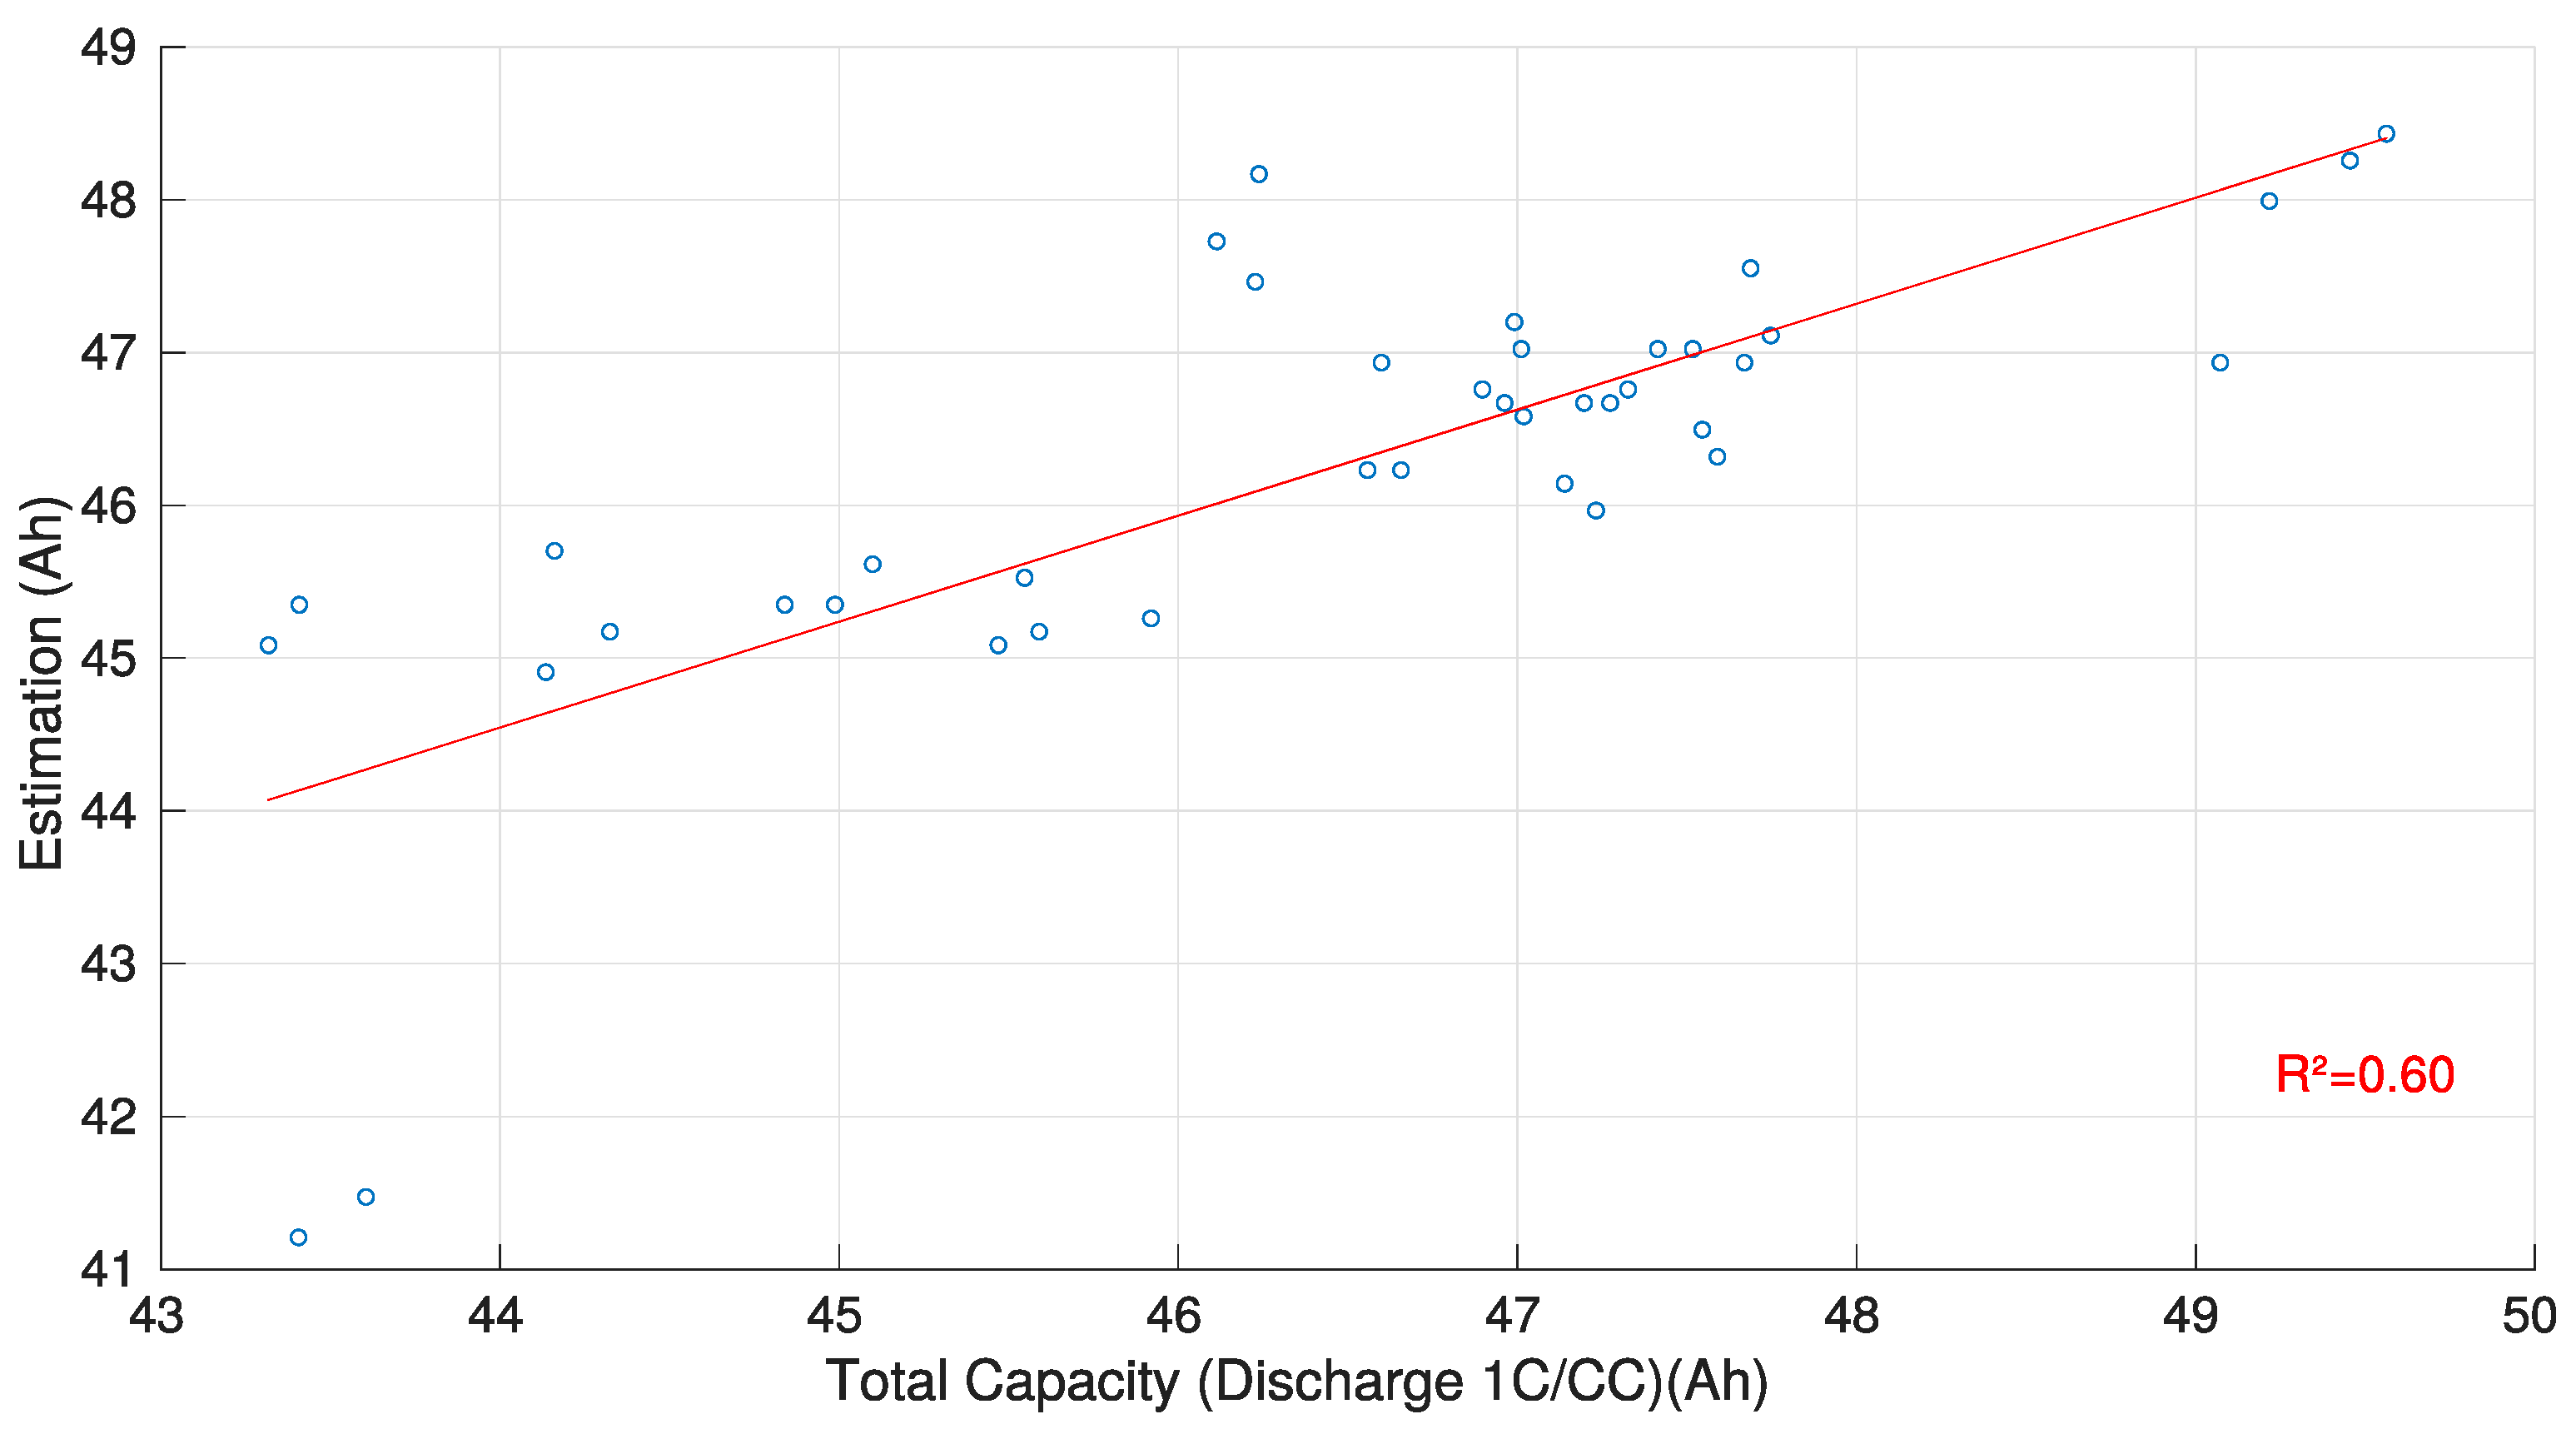
3.2. ICA Capacity Estimation Methodology
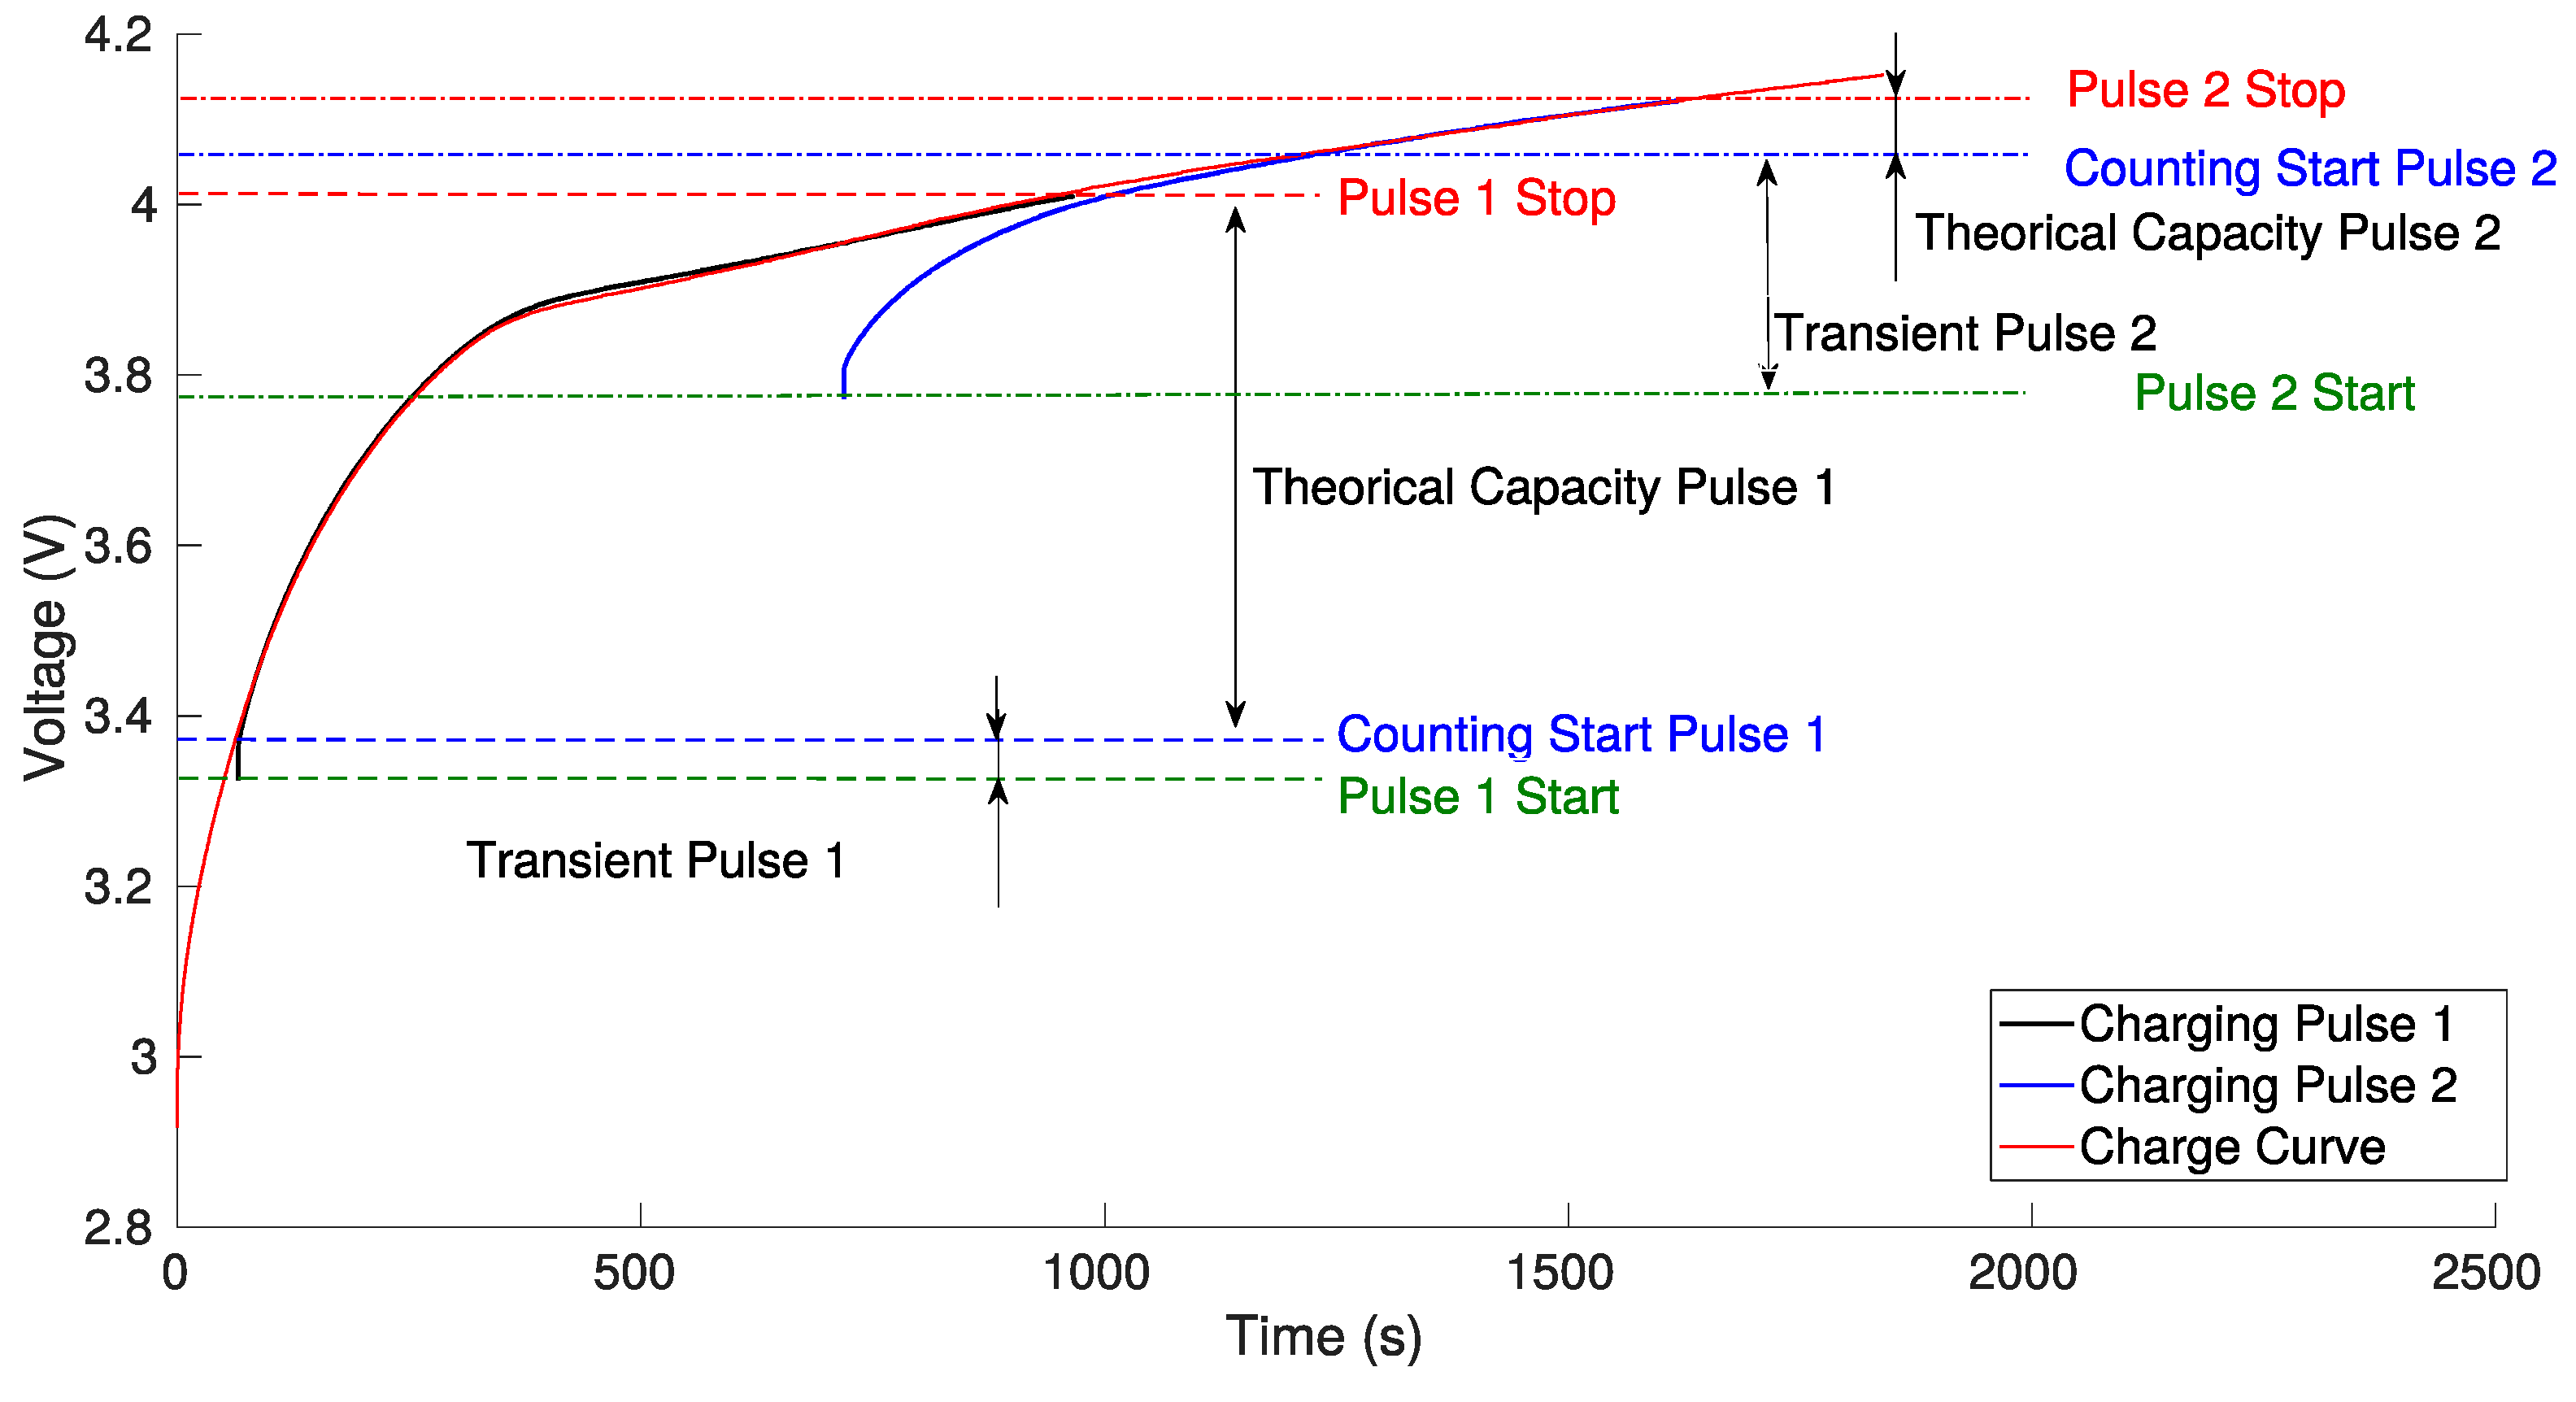
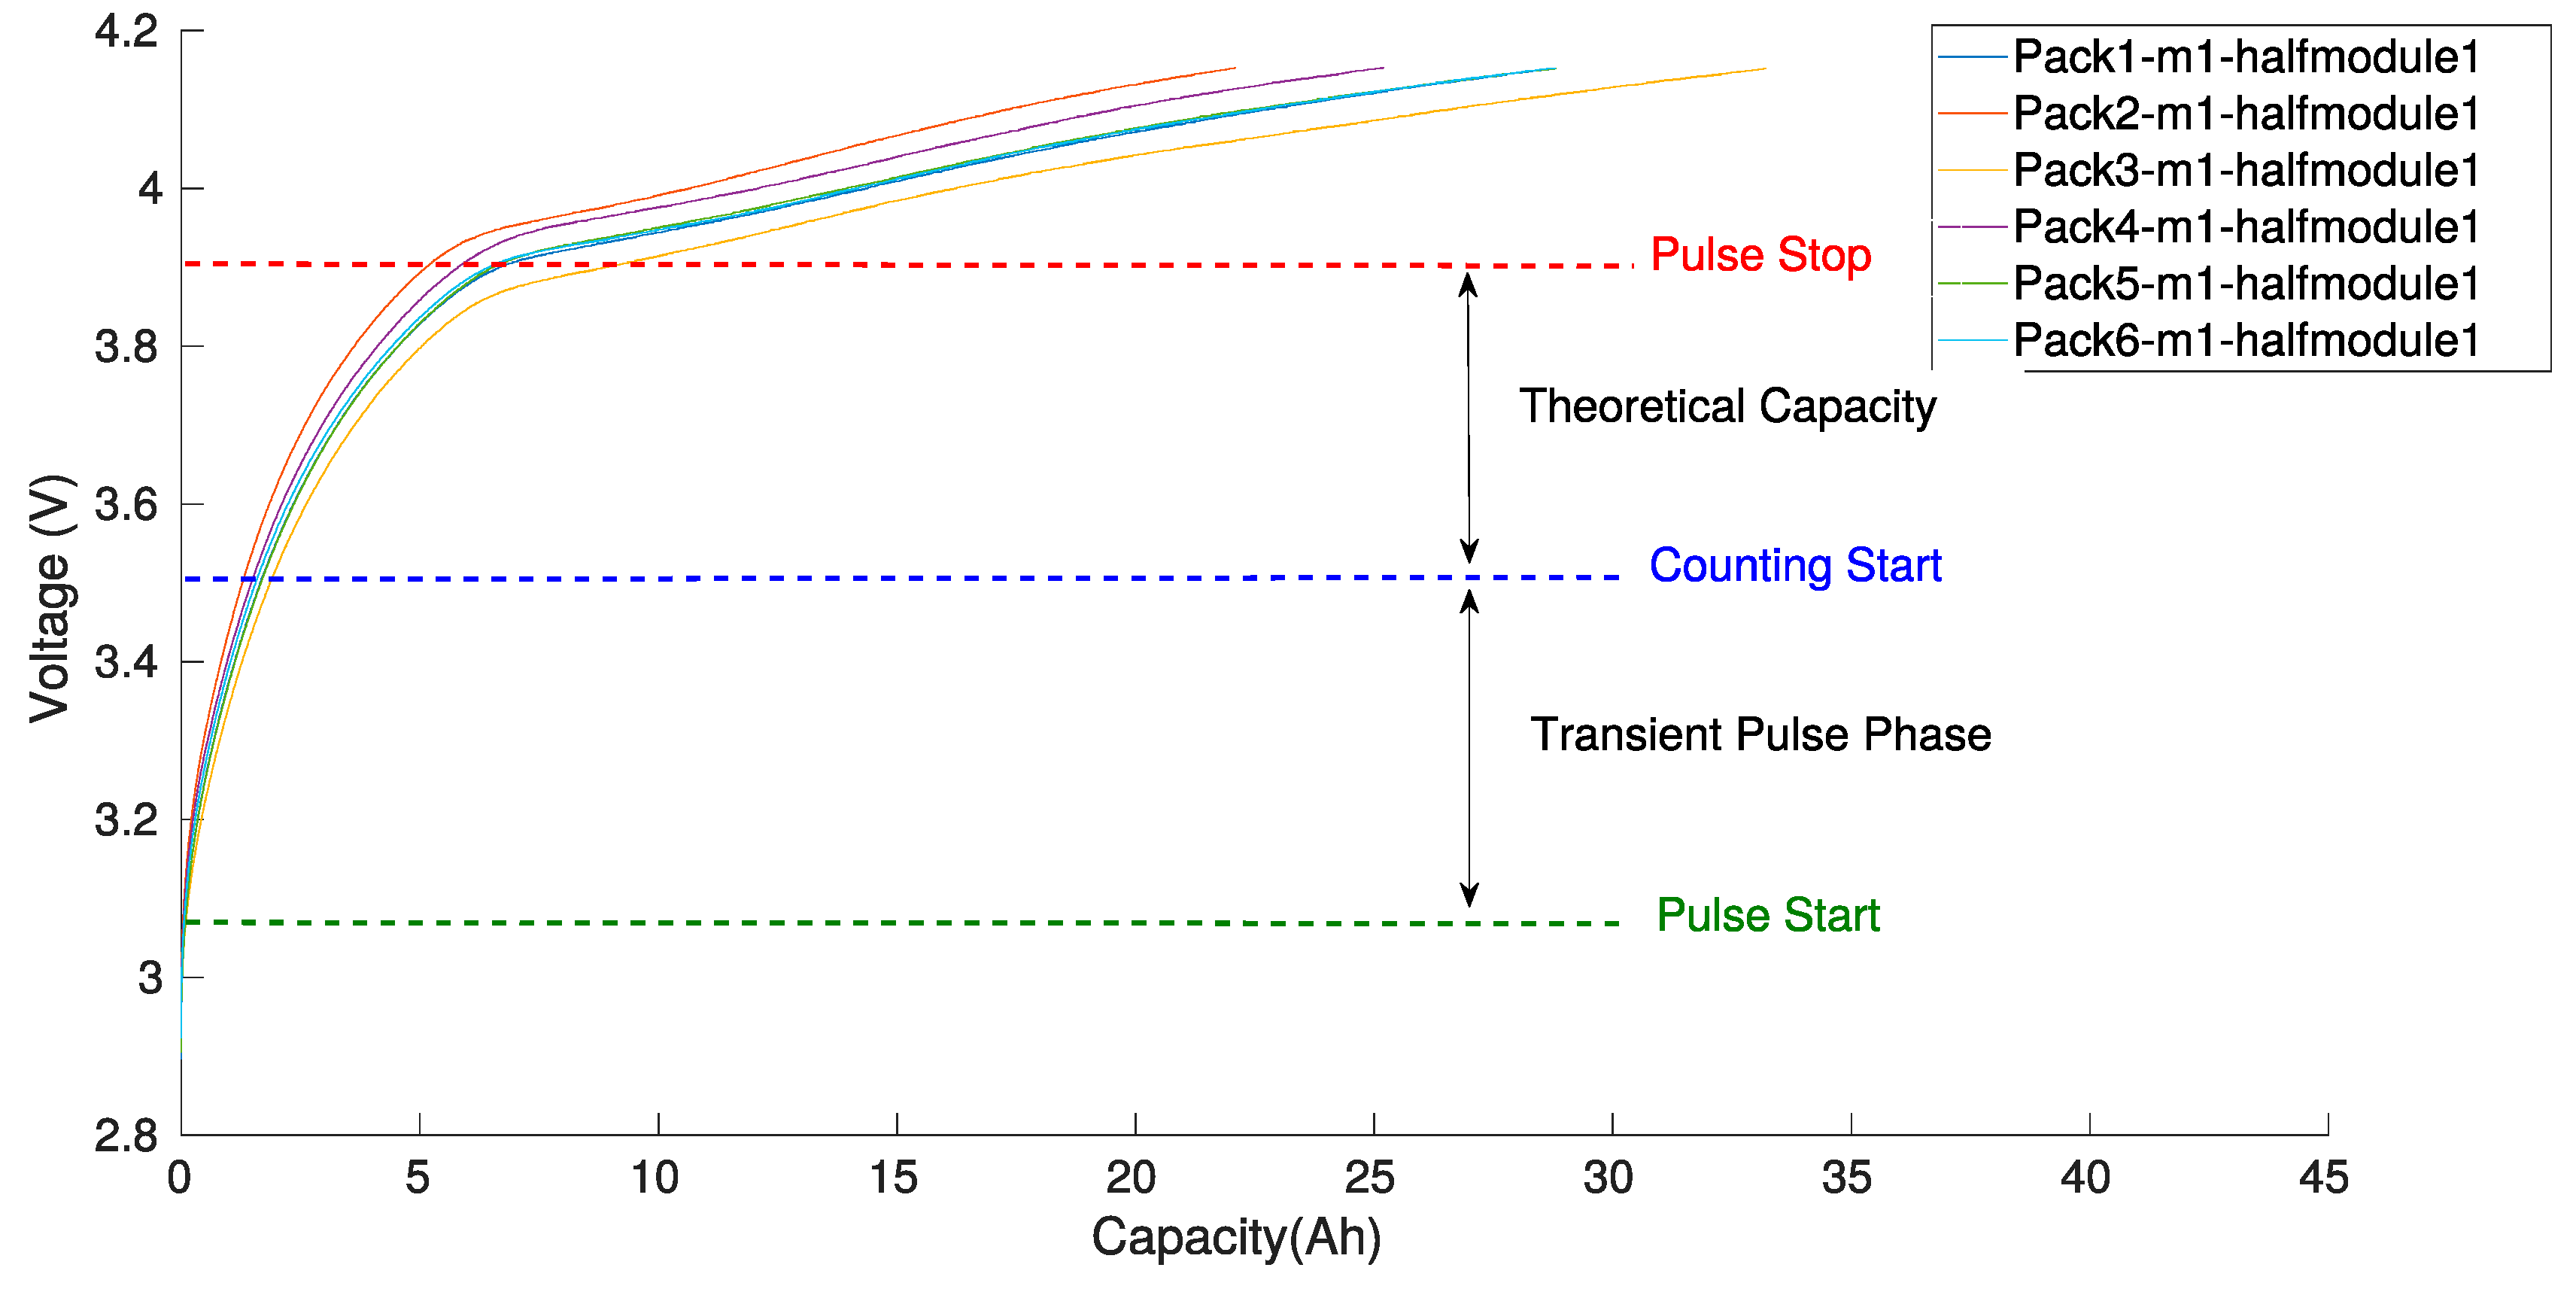
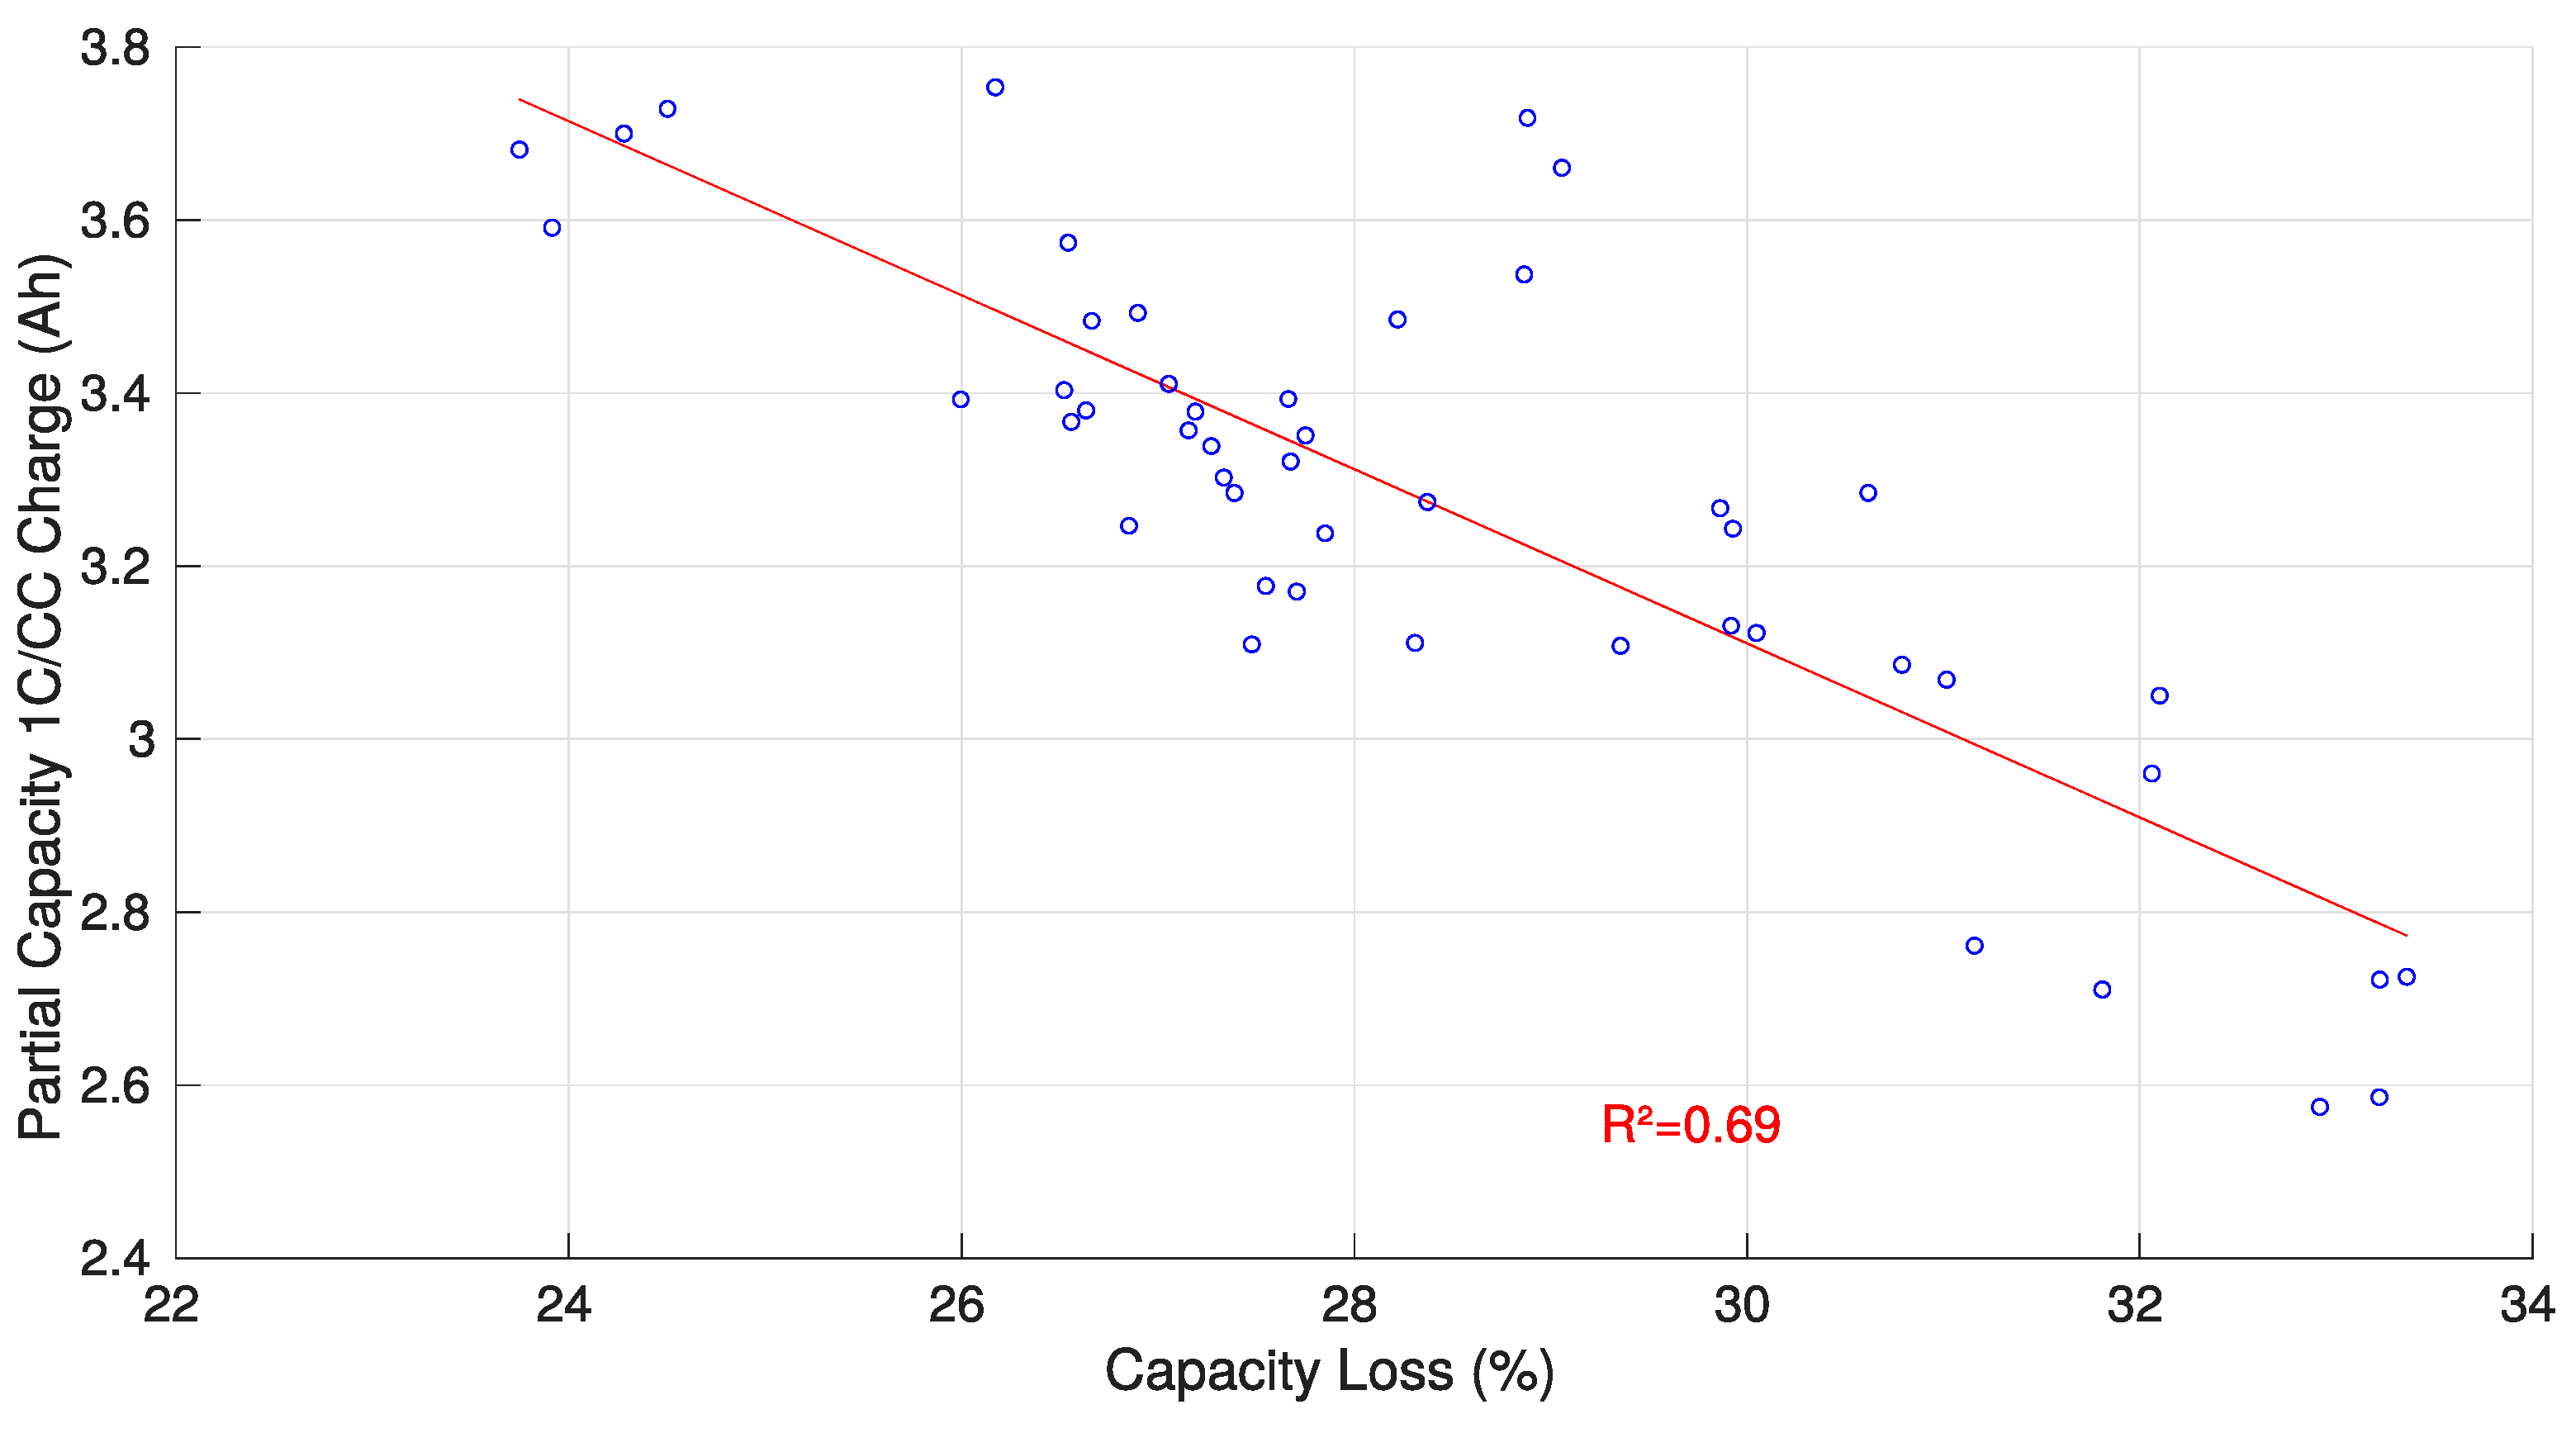
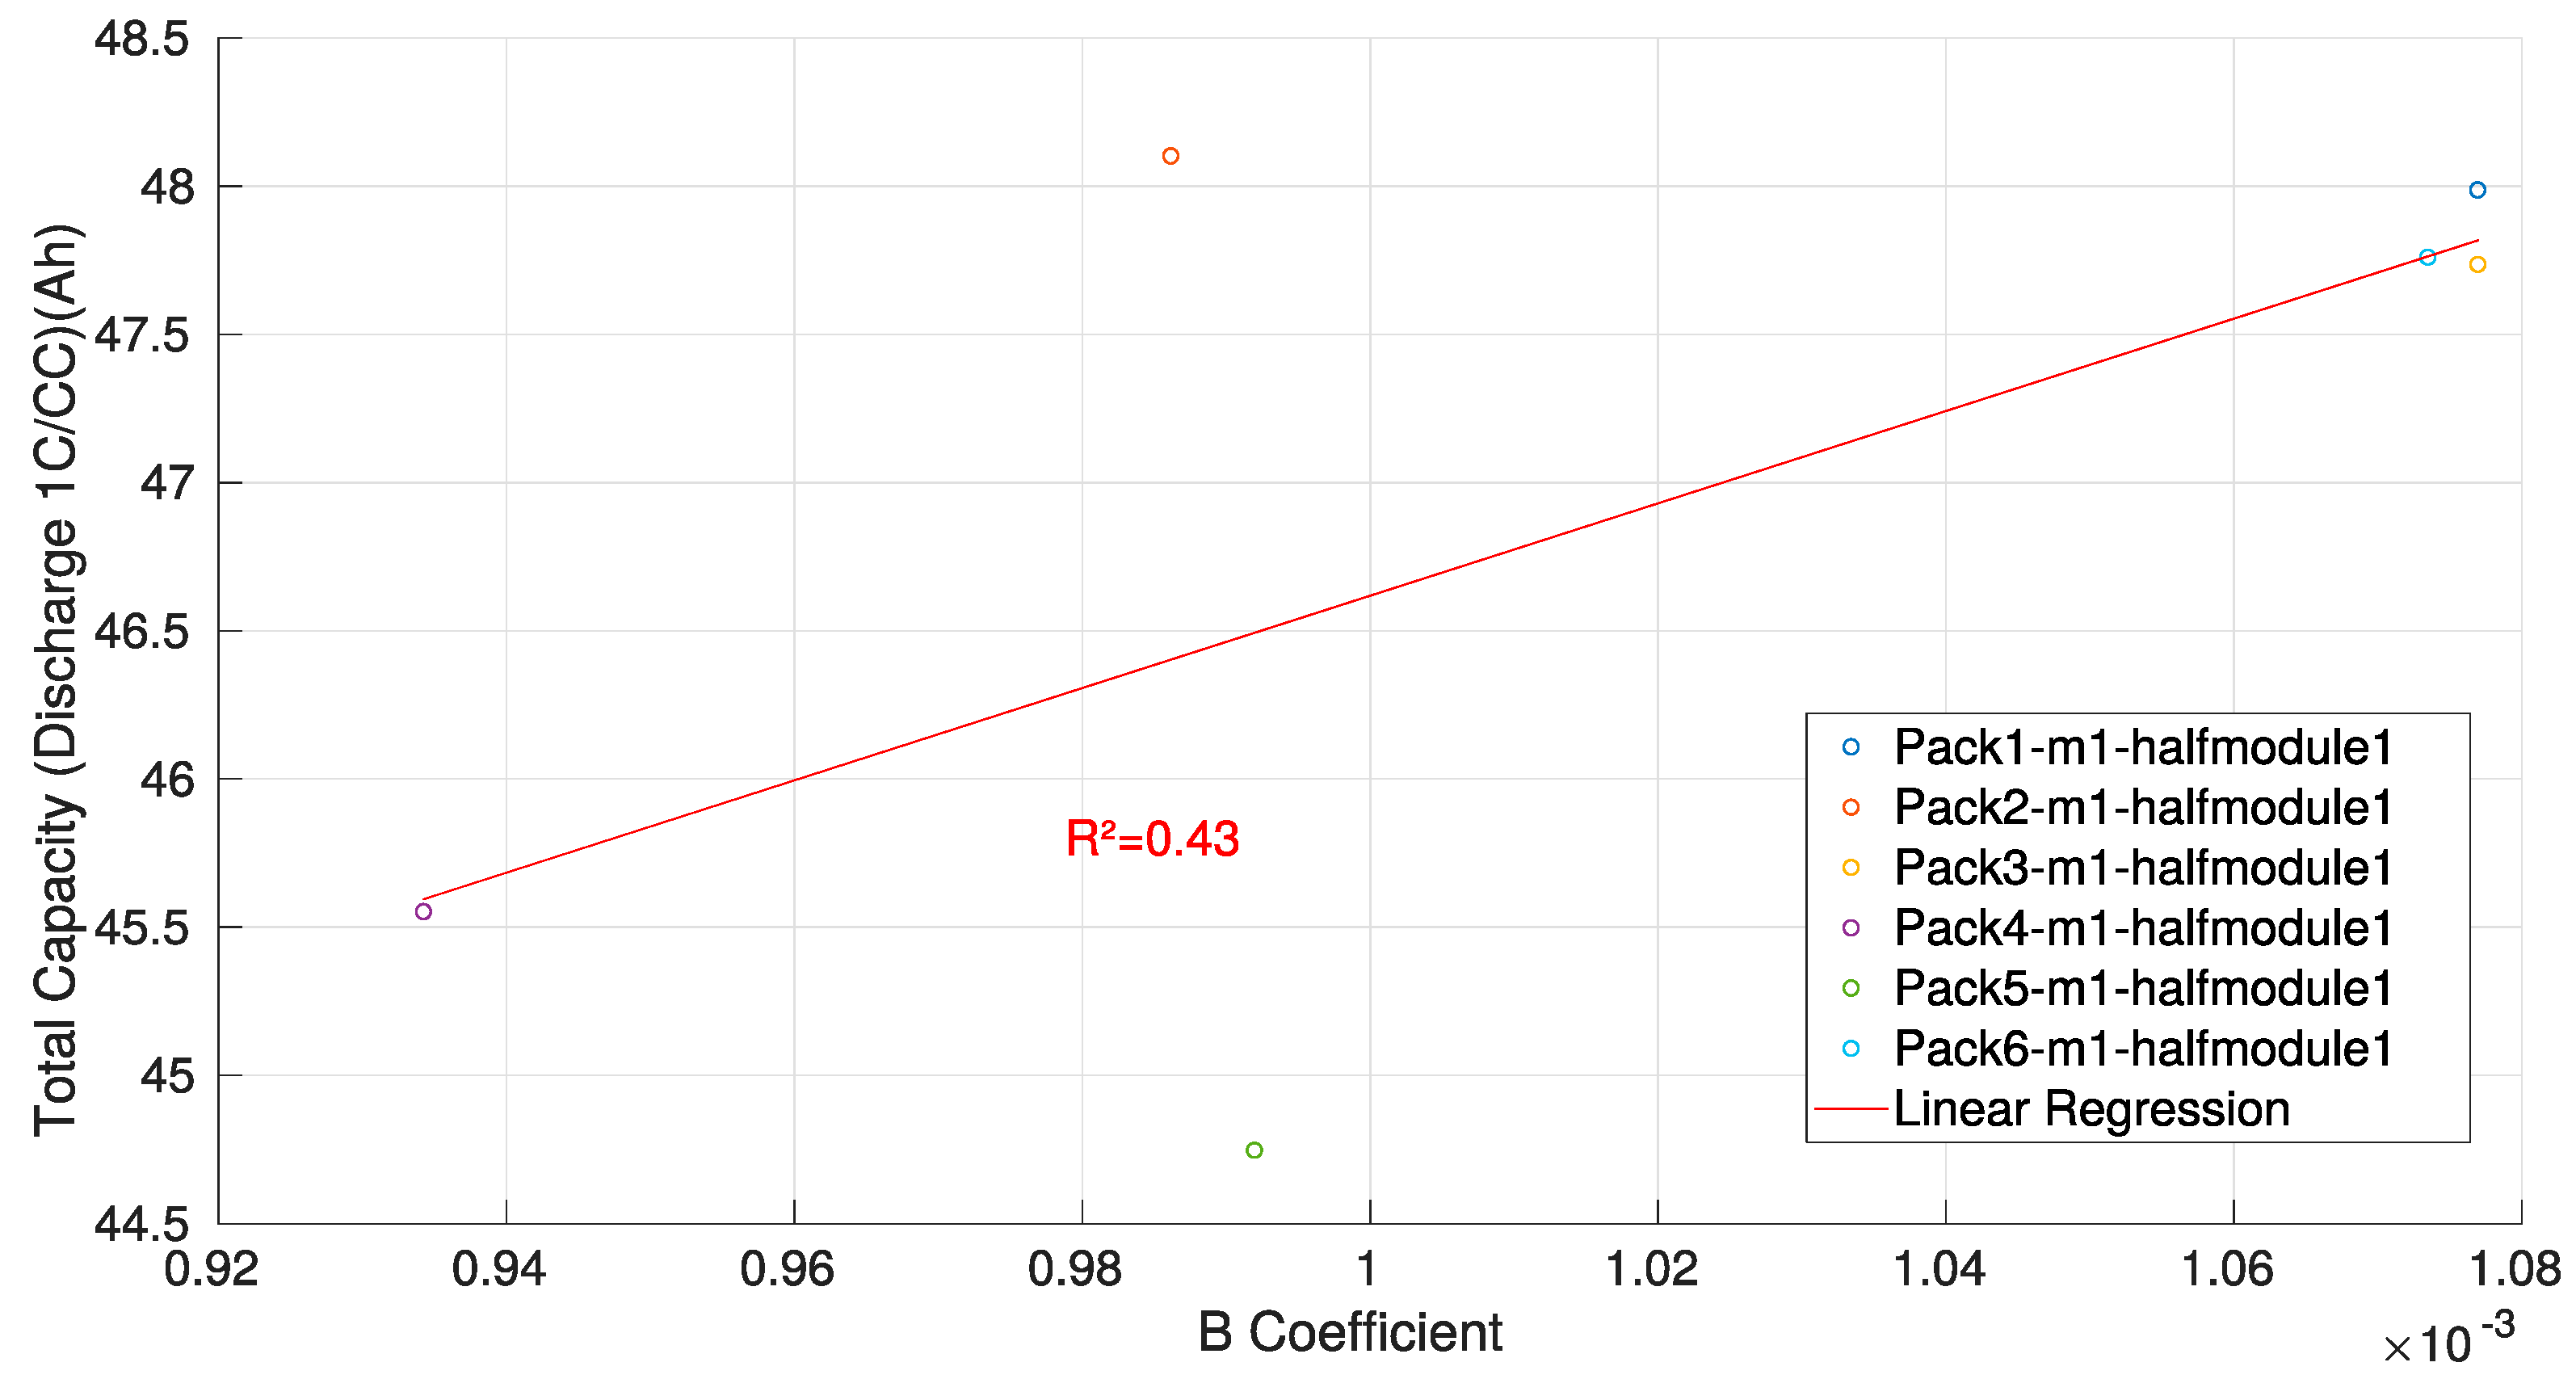
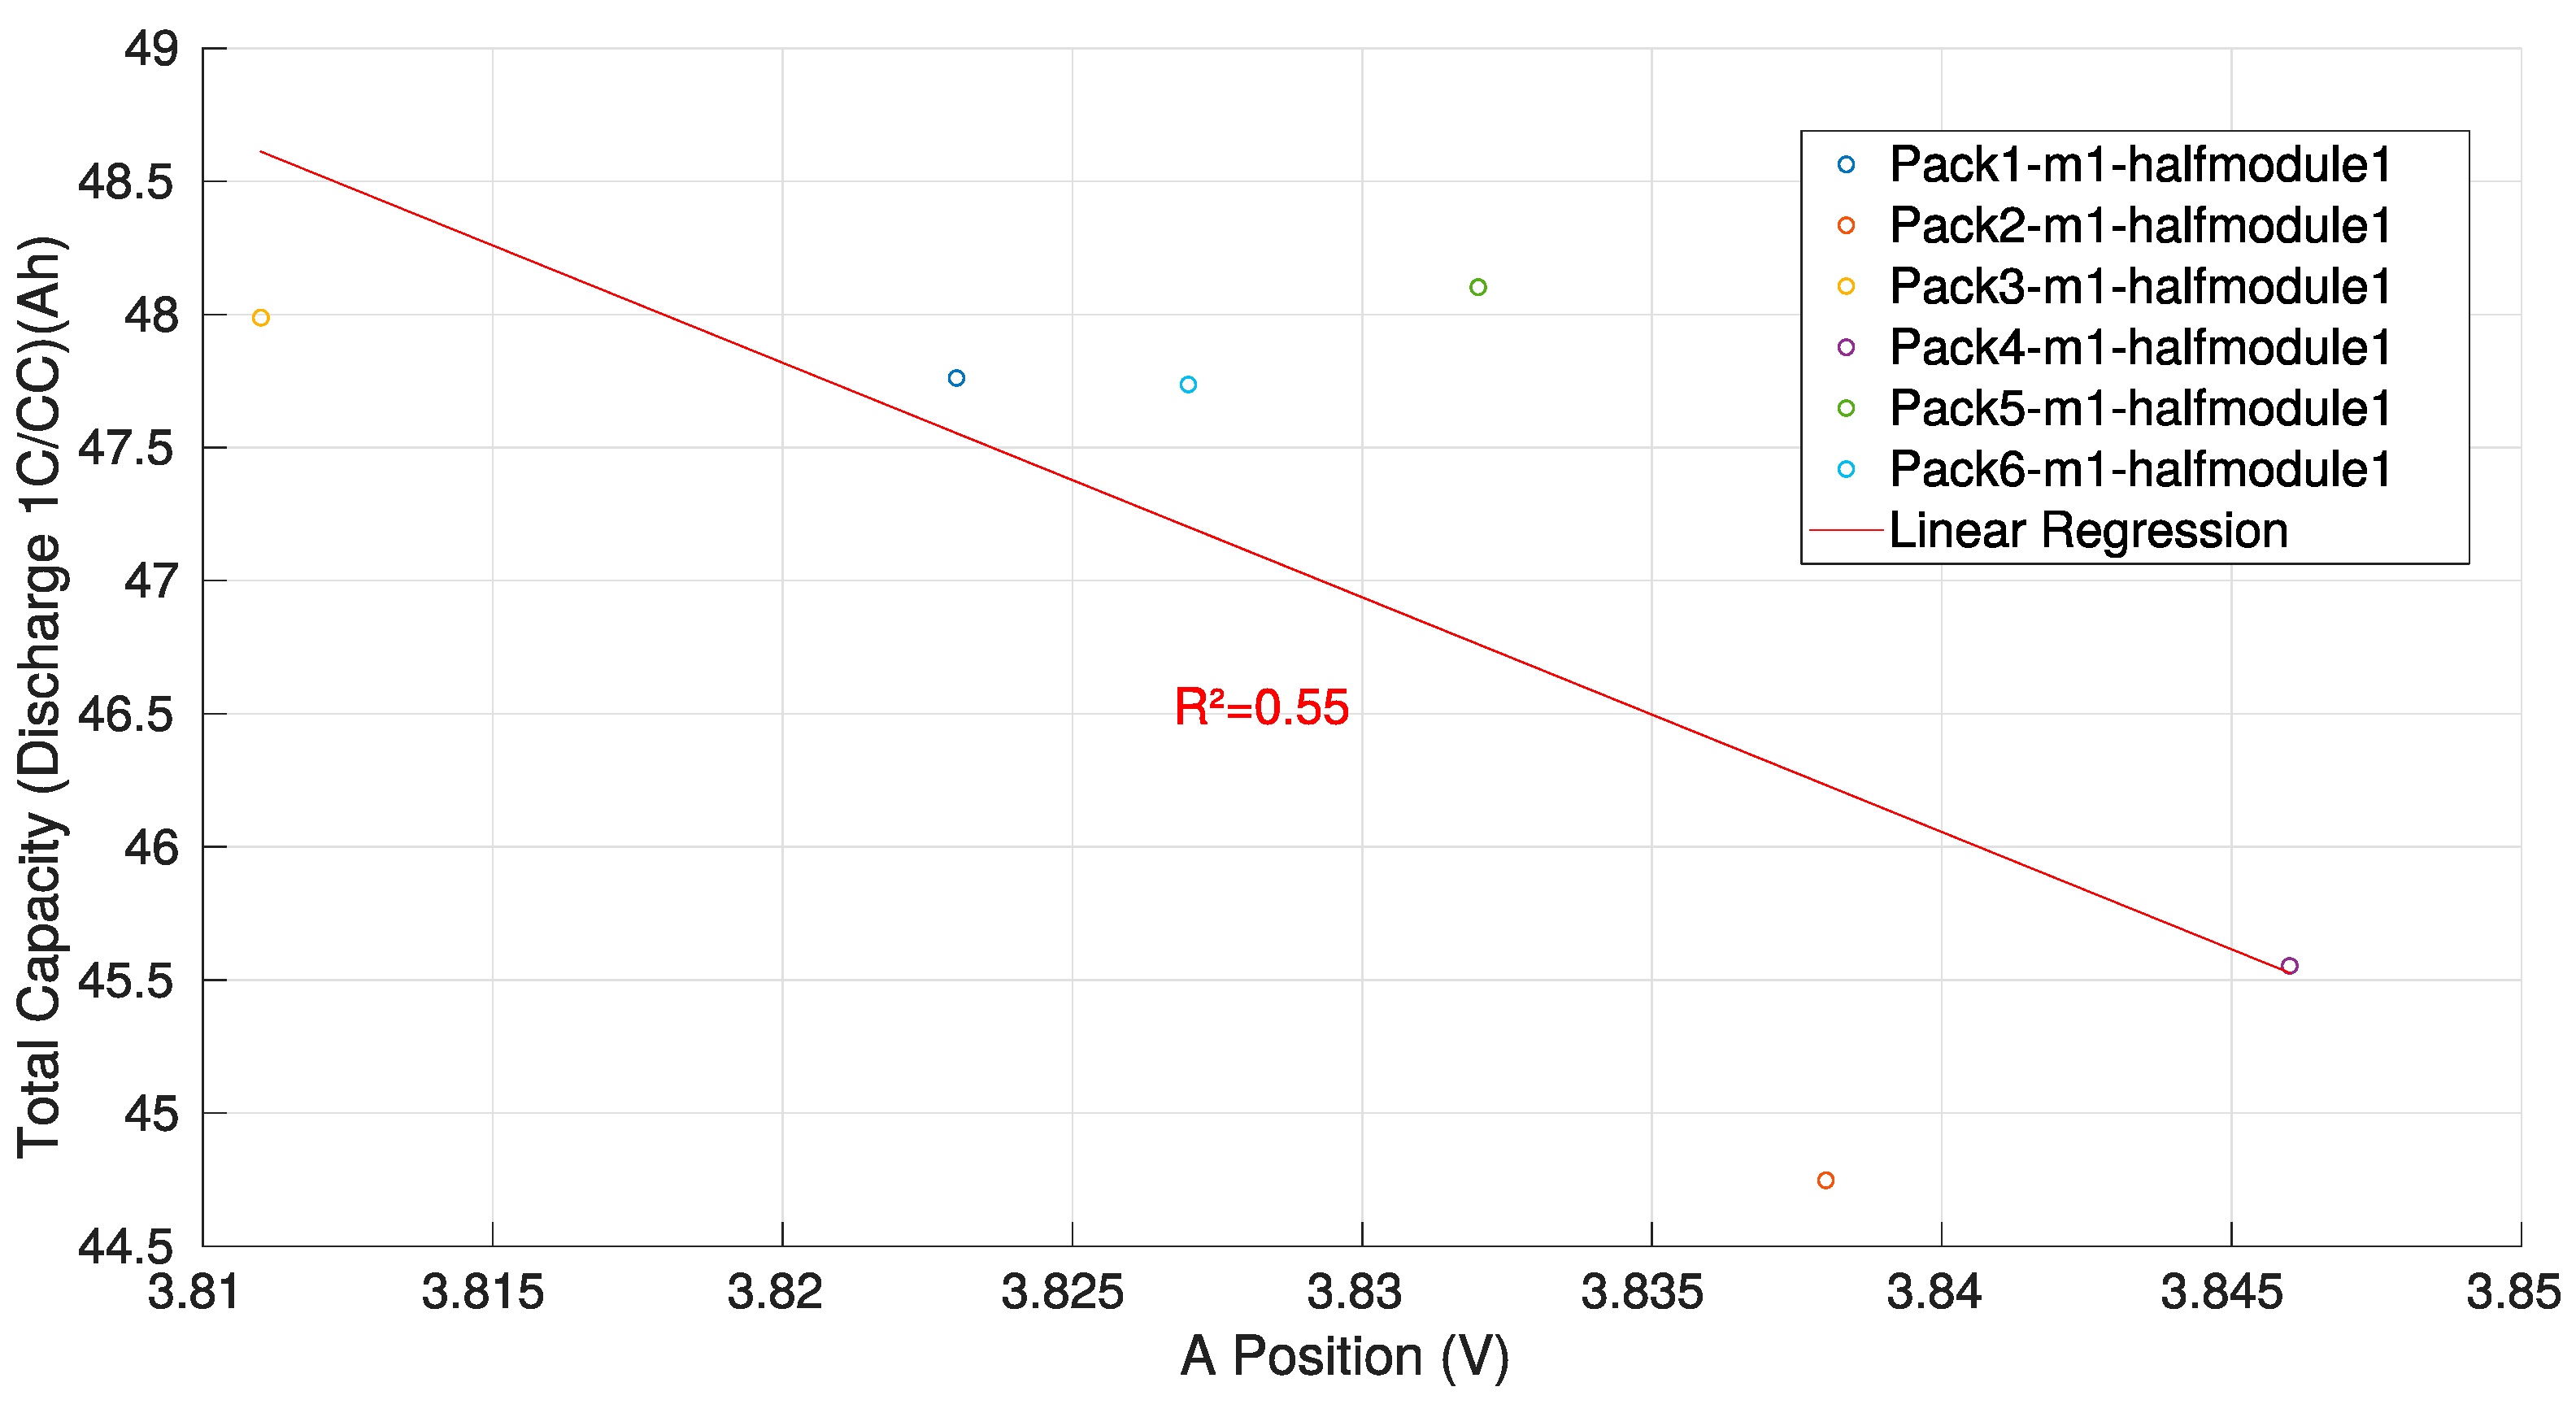
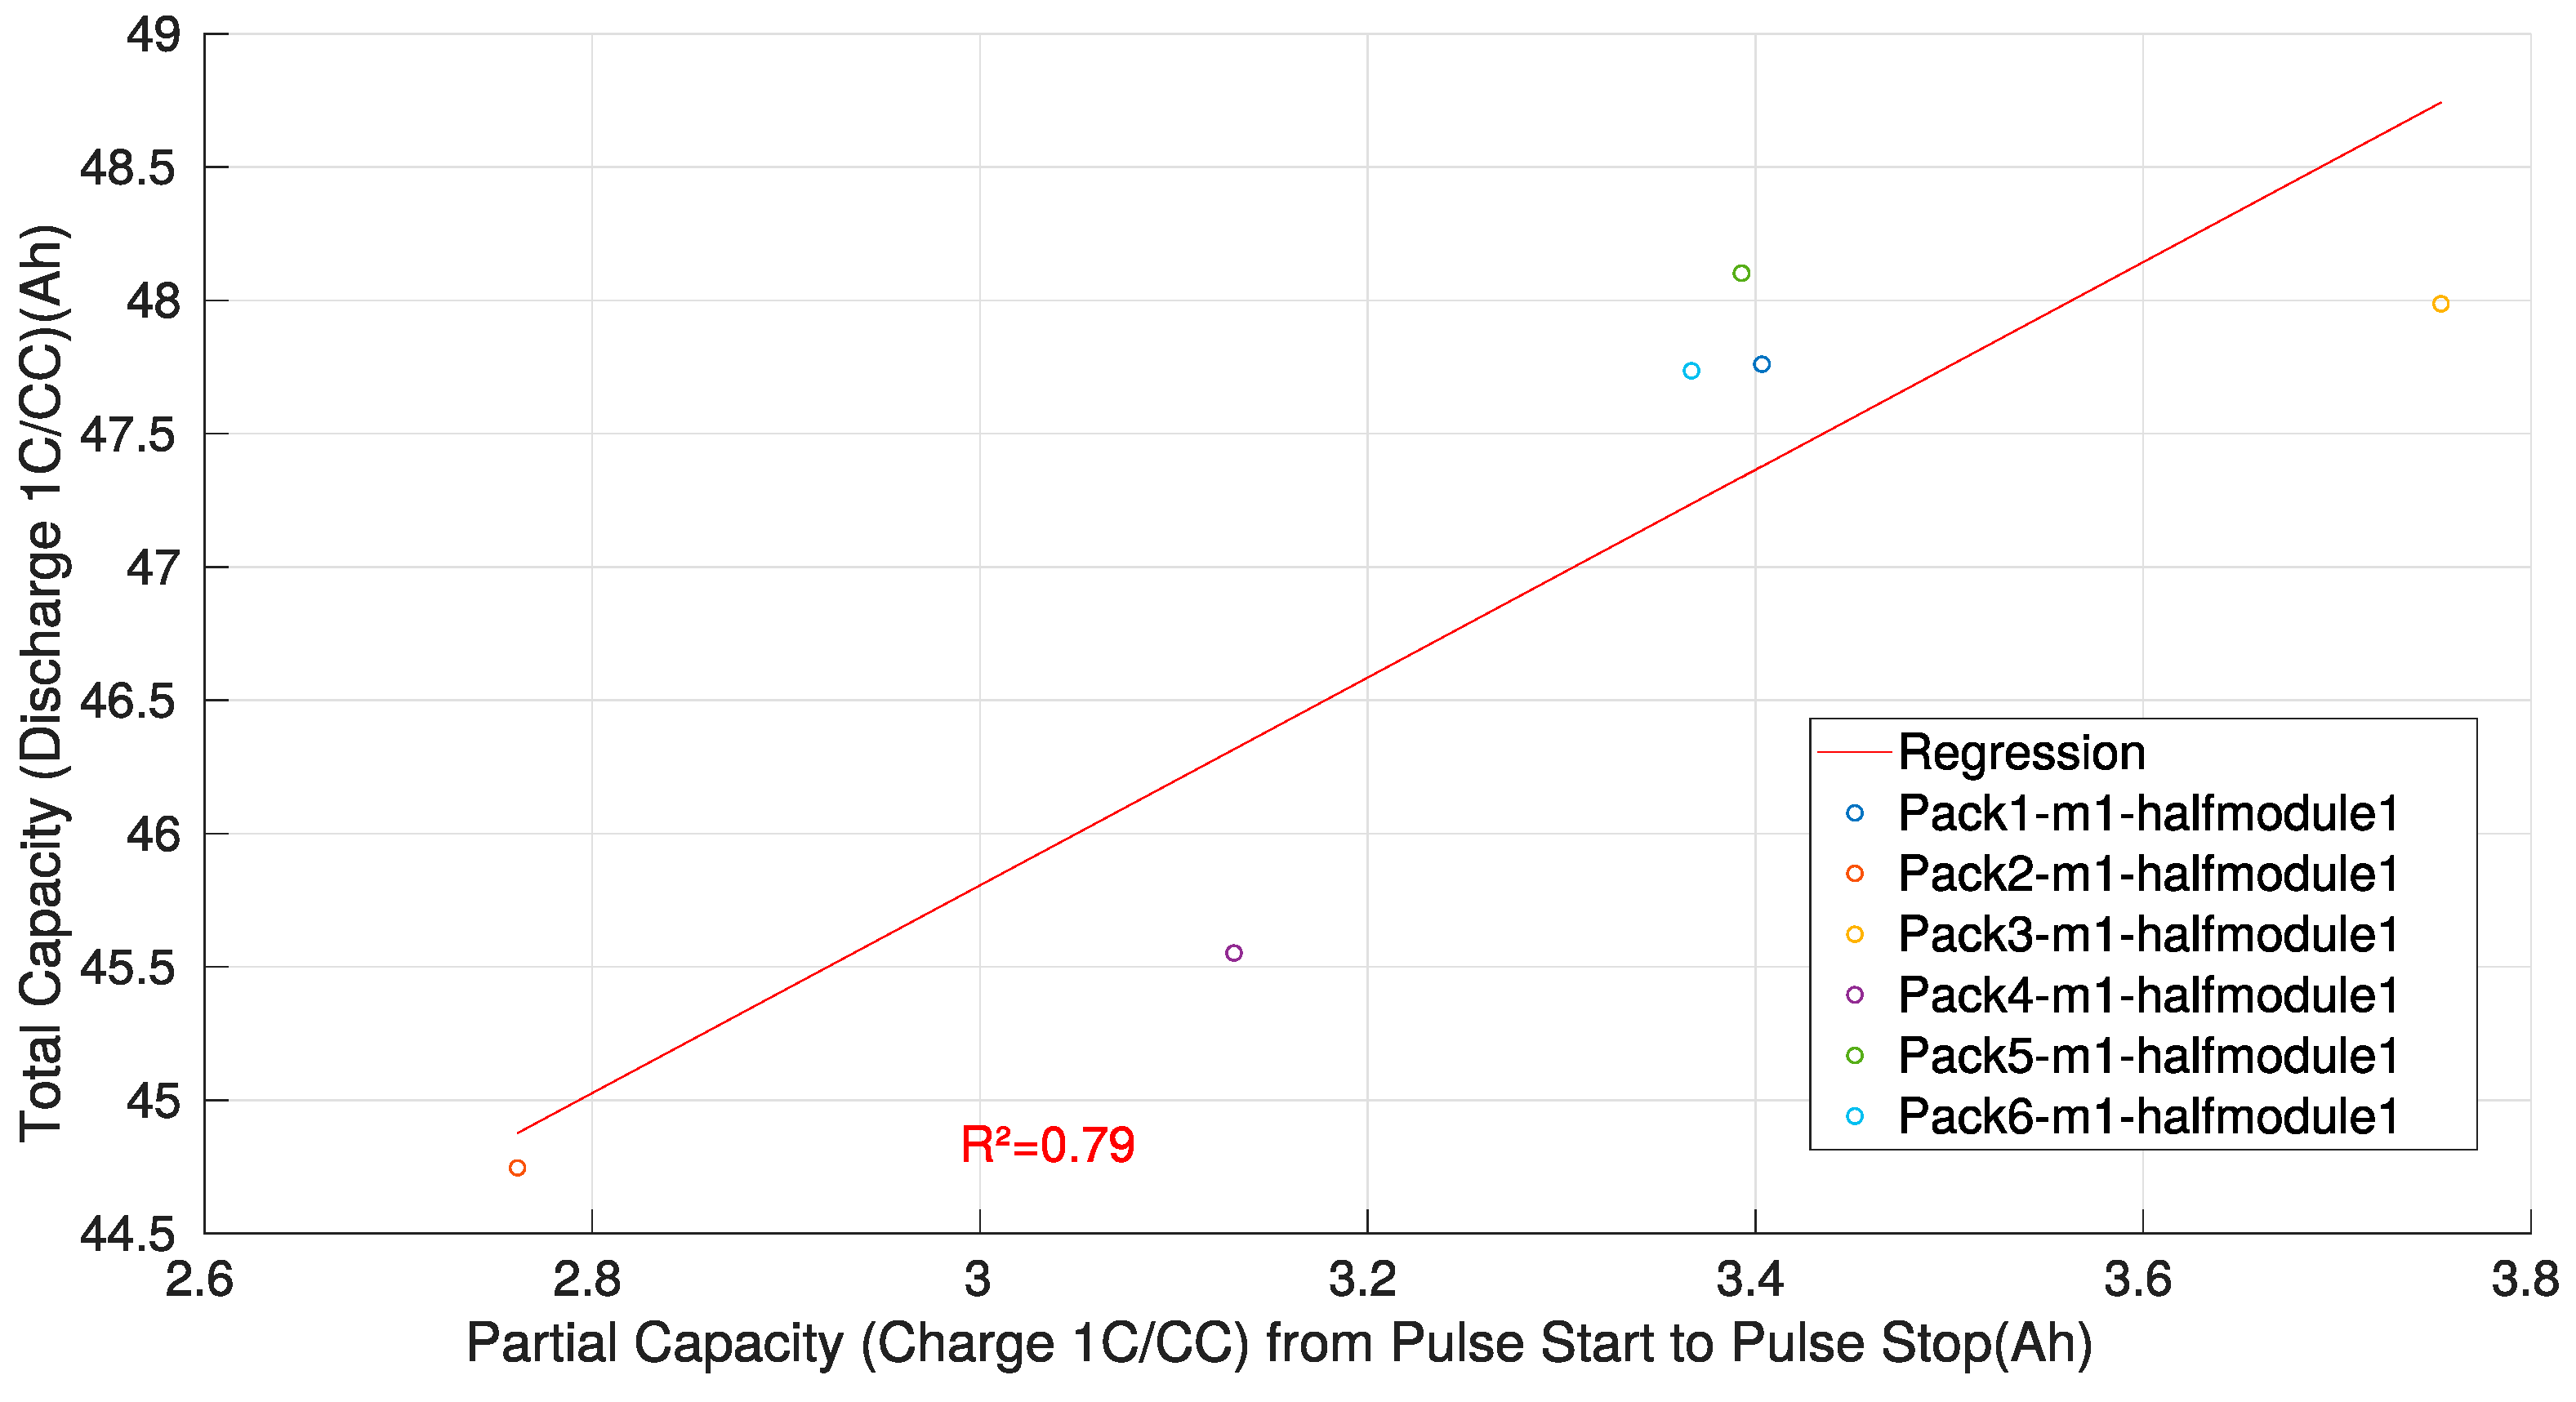
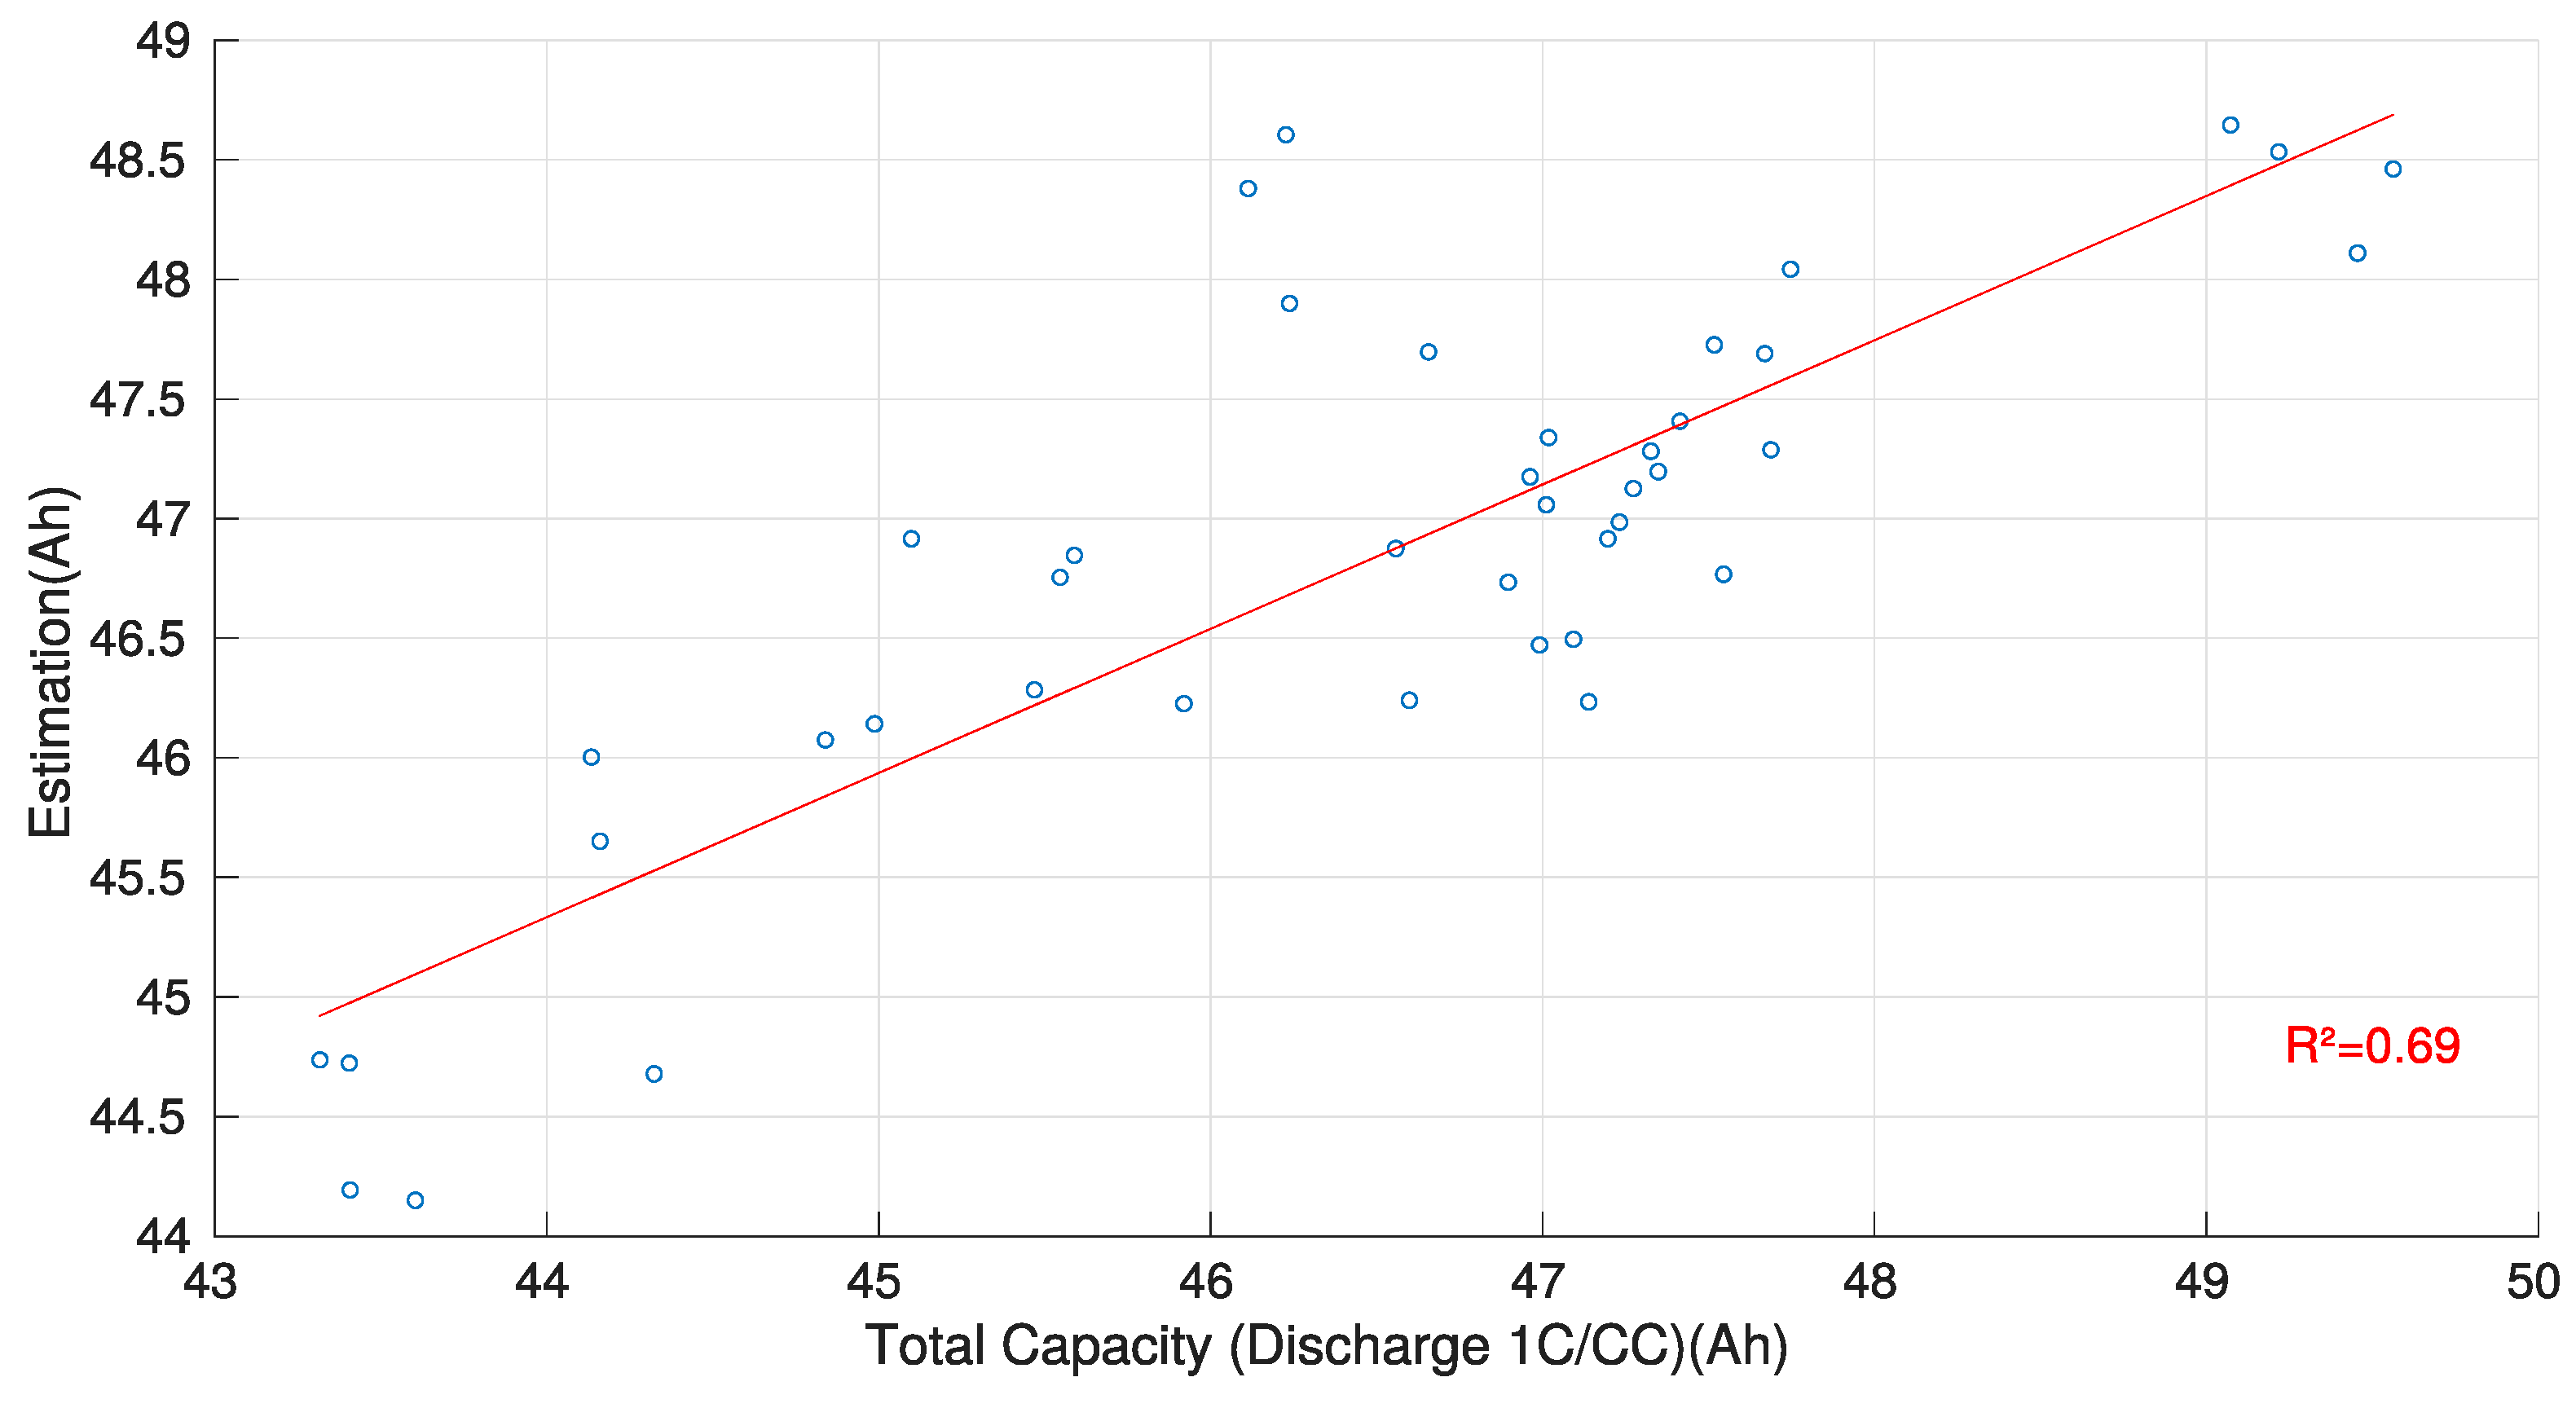
3.3. Partial Coulometric Counter
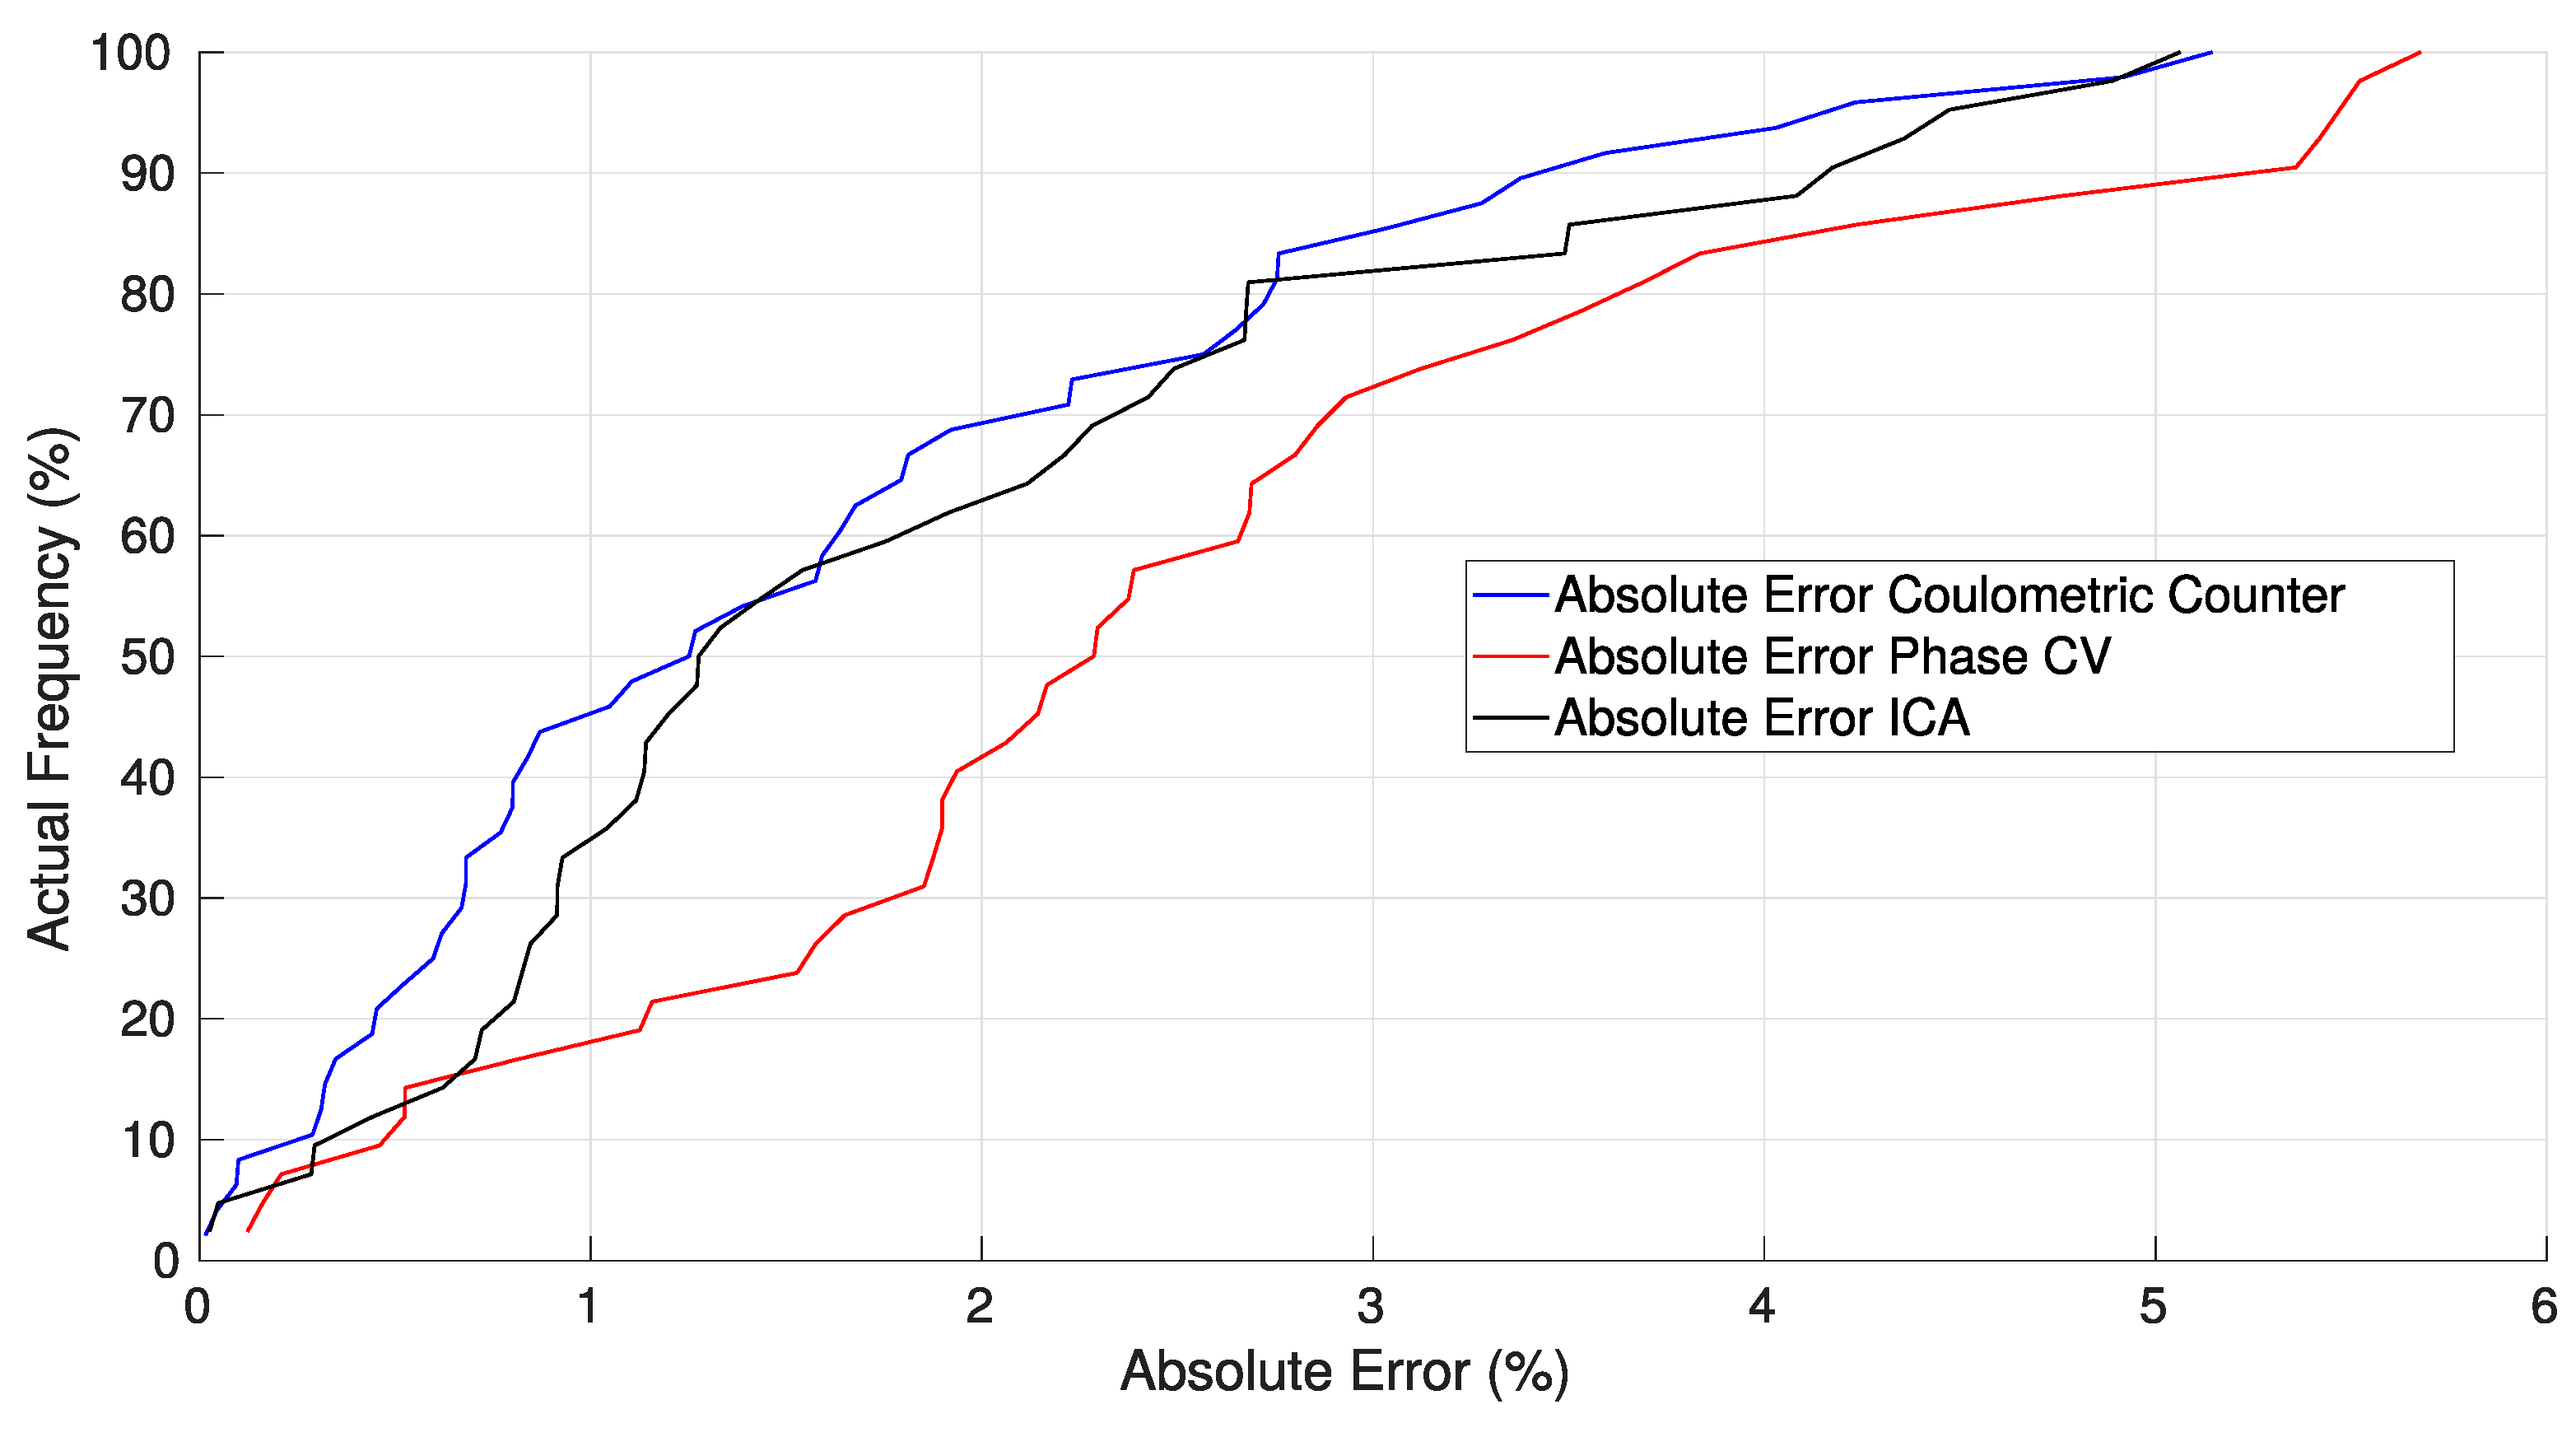
3.4. Synthesis
4. Conclusions
Author Contributions
Funding
Conflicts of Interest
References
- International Energy Agency. Global EV Outlook 2018; International Energy Agency: Paris, France, 2018. [Google Scholar] [CrossRef]
- The Paris Declaration on Electro-Mobility and Climate Change and Call to Action. Available online: https://unfccc.int/news/the-paris-declaration-on-electro-mobility-and-climate-change-and-call-to-action (accessed on 29 November 2019).
- New Life for Electric Vehicle Batteries—California Energy Storage Showcase. Available online: https://www.energy.ca.gov/research/energystorage/tour/ev_batteries/ (accessed on 29 November 2019).
- Electric Vehicle Technology to Power New Nissan Office in Europe. Available online: https://europe.nissannews.com/en-GB/releases/release-143213-electric-vehicle-technology-to-power-new-nissan-office-in-europe/ (accessed on 29 November 2019).
- Joint Japan-France Demonstration of Energy Storage System Project Utilization of used Lithium-Ion Batteries from Electric-Powered Vehicles. Available online: https://www.mitsubishi-motors.com/publish/pressrelease_en/corporate/2015/news/detailf710.html (accessed on 29 November 2019).
- Powerwall—The Tesla Home Battery. Available online: https://www.tesla.com/powerwall (accessed on 29 November 2019).
- Eaton—Energy Storage. [En ligne]. Available online: https://www.eaton.com/gb/en-gb/products/energy-storage.html (accessed on 29 November 2019).
- Carwatt. Available online: http://www.carwatt.net/ (accessed on 29 November 2019).
- Berecibar, M.; Gandiaga, I.; Villarreal, I.; Omar, N.; Van Mierlo, J.; Van den Bossche, P. Critical review of state of health estimation methods of Li-ion batteries for real applications. Renew. Sustain. Energy Rev. 2016, 56, 572–587. [Google Scholar] [CrossRef]
- Plett, G.L. Extended Kalman filtering for battery management systems of LiPB- based HEV battery packs. J. Power Sources 2004, 134, 252–261. [Google Scholar] [CrossRef]
- Remmlinger, J.; Buchholz, M.; Soczka-Guth, T.; Dietmayer, K. On-board state-of- health monitoring of lithium-ion batteries using linear parameter-varying models. J. Power Sources 2013, 239, 689–695. [Google Scholar] [CrossRef]
- Ragsdale, M.; Brunet, J.; Fahimi, B. A novel battery identification method based on pattern recognition. In Proceedings of the 2008 IEEE Vehicle Power and Propulsion Conference (VPPC), Harbin, China, 3–5 September 2008. [Google Scholar]
- Zenati, A.; Desprez, P.; Razik, H.; Rael, S. Impedance measurements combined with the fuzzy logic methodology to assess the SOC and SOH of lithium-ion cells. In Proceedings of the 2010 IEEE Vehicle Power and Propulsion Conference (VPPC), Lille, France, 1–3 September 2010. [Google Scholar]
- Cho, S.; Jeong, H.; Han, C.; Jin, S.; Lim, J.H.; Oh, J. On-line monitoring of capacity fade in lithium-ion batteries. J. Chem. Eng. Jpn. 2012, 45, 983–994. [Google Scholar] [CrossRef]
- Dai, H.; Wei, X.; Sun, Z. A new SOH prediction concept for the power lithium-ion battery used on HEVs. In Proceedings of the 2009 IEEE Vehicle Power and Propulsion Conference (VPPC), Dearborn, MI, USA, 7–10 September 2009. [Google Scholar]
- Lu, L.; Han, X.; Li, J.; Hua, J.; Ouyang, M. A review on the key issues for lithium-ion battery management in electric vehicles. J. Power Sources 2013, 226, 272–288. [Google Scholar] [CrossRef]
- Bloom, I.; Jansen, A.N.; Abraham, D.P.; Knuth, J.; Jones, S.A.; Battaglia, V.S.; Henriksen, G.L. Differential voltage analyses of high-power lithium-ion cells. J. Power Sources 2005, 139, 295–303. [Google Scholar] [CrossRef]
- Piłatowicz, G.; Marongiu, A.; Drillkens, J.; Sinhuber, P.; Sauer, D.U. A critical overview of definitions and determination techniques of the internal resistance using lithium-ion, lead-acid, nickel metal-hydride batteries and electrochemical double-layer capacitors as examples. J. Power Sources 2015, 296, 365–376. [Google Scholar] [CrossRef]
- Riviere, E.; Venet, P.; Sari, A.; Meniere, F.; Bultel, Y. LiFePO4 Battery State of Health Online Estimation Using Electric Vehicle Embedded Incremental Capacity Analysis. In Proceedings of the 2015 IEEE Vehicle Power and Propulsion Conference (VPPC), Montreal, QC, Canada, 19–22 October 2015. [Google Scholar]
- Anseán, D.; González, M.; Blanco, C.; Viera, J.C.; Fernández, Y.; García, V.M. Lithium-ion battery degradation indicators via incremental capacity analysis. In Proceedings of the 2017 IEEE International Conference on Environment and Electrical Engineering and 2017 IEEE Industrial and Commercial Power Systems Europe (EEEIC/I&CPS Europe), Milan, Italy, 6–9 June 2017. [Google Scholar]
- Li, Y.; Abdel-Monem, M.; Gopalakrishnan, R.; Berecibar, M.; Nanini-Maury, E.; Omar, N.; van den Bossche, P.; Van Mierlo, J. A quick on-line state of health estimation method for Li-ion battery with incremental capacity curves processed by Gaussian filter. J. Power Sources 2018, 373, 40–53. [Google Scholar] [CrossRef]
- Eddahech, A.; Briat, O.; Vinassa, J.-M. Determination of lithium-ion battery state-of-health based on constant-voltage charge phase. J. Power Sources 2014, 258, 218–227. [Google Scholar] [CrossRef]
- Yang, J.; Xia, B.; Huang, W.; Fu, Y.; Mi, C. Online state-of-health estimation for lithium-ion batteries using constant-voltage charging current analysis. Appl. Energy 2018, 212, 1589–1600. [Google Scholar] [CrossRef]
- Redondo-Iglesias, E.; Venet, P.; Pelissier, S. Global Model for Self-Discharge and Capacity Fade in Lithium-Ion Batteries Based on the Generalized Eyring Relationship. IEEE Trans. Veh. Technol. 2017, 67, 104–113. [Google Scholar] [CrossRef]
- Dubarry, M.; Truchot, C.; Liaw, B.Y. Synthesize battery degradation modes via a diagnostic and prognostic model. J. Power Sources 2012, 219, 204–216. [Google Scholar] [CrossRef]
- Ng, K.S.; Moo, C.-S.; Chen, Y.-P.; Hsieh, Y.-C. Enhanced coulomb counting method for estimating state-of-charge and state-of-health of lithium-ion batteries. Appl. Energy 2009, 86, 1506–1511. [Google Scholar] [CrossRef]
- Redondo-Iglesias, E.; Venet, P.; Pelissier, S. Eyring acceleration model for predicting calendar ageing of lithium-ion batteries. J. Energy Storage 2017, 13, 176–183. [Google Scholar] [CrossRef] [Green Version]
- Barré, A.; Suard, F.; Gérard, M.; Montaru, M.; Riu, D. Statistical analysis for understanding and predicting battery degradations in real-life electric vehicle use. J. Power Sources 2014, 245, 846–856. [Google Scholar] [CrossRef]


| AESC E5-M | |
|---|---|
| Cell type | Laminate Type |
| Positive electrode material | LMO with LNO |
| Negative electrode material | Graphite |
| Nominal capacity (at 0,3C) | 32.5 Ah |
| Nominal voltage | 3.75 V |
| Energy density | 157 Wh/kg |
| Voltage limit range | 2 to 4.2 V |
| Voltage operating range | 2.5 to 4.15 V |
| Method | R2 | Average Absolute Error | Maximum Absolute Error | Estimated Test Time (s) | Pack Estimation Suitability |
|---|---|---|---|---|---|
| Phase CV | 0.42 | 2.5 | 5.7 | 1050 | - |
| ICA | 0.60 | 1.8 | 5.1 | 3240 | ++ |
| Partial counter | 0.69 | 1.6 | 5.1 | 300 | + |
© 2019 by the authors. Licensee MDPI, Basel, Switzerland. This article is an open access article distributed under the terms and conditions of the Creative Commons Attribution (CC BY) license (http://creativecommons.org/licenses/by/4.0/).
Share and Cite
Quinard, H.; Redondo-Iglesias, E.; Pelissier, S.; Venet, P. Fast Electrical Characterizations of High-Energy Second Life Lithium-Ion Batteries for Embedded and Stationary Applications. Batteries 2019, 5, 33. https://doi.org/10.3390/batteries5010033
Quinard H, Redondo-Iglesias E, Pelissier S, Venet P. Fast Electrical Characterizations of High-Energy Second Life Lithium-Ion Batteries for Embedded and Stationary Applications. Batteries. 2019; 5(1):33. https://doi.org/10.3390/batteries5010033
Chicago/Turabian StyleQuinard, Honorat, Eduardo Redondo-Iglesias, Serge Pelissier, and Pascal Venet. 2019. "Fast Electrical Characterizations of High-Energy Second Life Lithium-Ion Batteries for Embedded and Stationary Applications" Batteries 5, no. 1: 33. https://doi.org/10.3390/batteries5010033