Article

Can the SOM Analysis Predict Business Failure Using Capital Structure Theory? Evidence from the Subprime Crisis in Spain

by
Juan Pedro Lucanera
1,
Laura Fabregat-Aibar
2,
Valeria Scherger
3,* and
Hernán Vigier
4
1
CEDETS-UPSO, Ciudad de Cali 320, Bahía Blanca 8000, Argentina
2
Department of Business Management, Faculty of Business and Economic, Universitat Rovira i Virgili; Av. Bellissens, 43204 Reus, Spain
3
Department of Economics, Universidad Nacional del Sur (UNS)-IIESS (UNS-CONICET); Campus Altos de Palihue, Bahía Blanca 8000, Argentina
4
Department of Economics, Universidad Nacional del Sur-CEDETS-UPSO; Ciudad de Cali 320, Bahía Blanca 8000, Argentina
*
Author to whom correspondence should be addressed.
Axioms 2020, 9(2), 46; https://doi.org/10.3390/axioms9020046
Submission received: 11 March 2020 / Revised: 13 April 2020 / Accepted: 21 April 2020 / Published: 27 April 2020
(This article belongs to the Special Issue Soft Computing in Economics, Finance and Management)

Abstract

:
The paper aims to identify which variables related to capital structure theory predict business failure in the Spanish construction sector during the subprime crisis. An artificial neural network (ANN) approach based on Self-Organizing Maps (SOM) is proposed, which allows one to cluster between default and active firms’ groups. The similarities and differences between the main features in each group determine the variables that explain the capacities of failure of the analyzed firms. The network tests whether the factors that explain leverage, such as profitability, growth opportunities, size of the company, risk, asset structure, and age of the firm, can be suitable to predict business failure. The sample is formed by 152 construction firms (76 default and 76 active) in the Spanish market. The results show that the SOM correctly predicts 97.4% of firms in the construction sector and classifies the firms in five groups with clear similarities inside the clusters. The study proves the suitability of the SOM for predicting business bankruptcy situations using variables related to capital structure theory and financial crises.

1. Introduction

The prediction of business failure receives special attention and growing interest in periods of instability and crisis to prevent bankruptcies. Business failure has been an important research area since the 60 s with Beaver’s univariate model [1] and Altman’s multivariate model [2]. These failure models compare and classify firms according to quantitative indicators to predict or distinguish between healthy and unhealthy businesses. A wide variety of models and techniques have been applied to predict distress situations and to improve the estimation results, such as logit, probit, artificial neural networks, expert systems, rough sets, hybrid systems, case based reasoning, decision trees, genetic algorithms, clusters, survival models, data envelopment analysis, support vector machines, and fuzzy logic [3,4,5,6,7,8,9,10,11,12,13]). Additionally, some studies detect the factors or causes that generate a firm’s problems [14,15]. Moreover, due to the nature of the problem, affected by expert analysts’ opinions and a large number of variables, it is suitable for tools taken from the artificial intelligence and big data analysis. Several authors [8,16] detected that using an artificial neural network is the most common technique for bankruptcy prediction because the architecture easily produces good results. Many studies employed the back propagation algorithm for bankruptcy prediction, despite the fact that it has a number of undesirable features, such as computational intensity, absence of formal theory, and sometimes illogical behavior. In a review [8], it was concluded that artificial neural networks and support vector machines appeared to be the most accurate tools among the most used techniques (multiple discriminant analysis, logistic regression, artificial neural networks, support vector machines, rough sets, case base reasoning, and genetic algorithms) and satisfy a good number of the 13 criteria analyzed for predicting business failure. Artificial neural networks were created to imitate the human brain, and they were first applied to predict bankruptcy by [17]. A typical neural network is a network of nodes interconnected by layers to forecast results. There are many architectures, algorithms, and training methods that can be used to predict failure.
Companies can use their own resources (capital) or borrowed (debt) to finance their operations. The combination between both types of resources is known as the capital structure. The study of a company’s capital structure becomes notable with the Modigliani and Miller’ paradox. This paradox argues that the market value of the company, under the assumption of a perfect financial market, is not affected by its combination of financing; that is, by its capital structure [18]. Since then, capital structure has become a subject of study.
In this paper, the literature of capital structure during financial crises is linked with the prediction of business failure, in order to detect causes of bankruptcy associated with firms’ capital structure variables, using Self-Organizing Maps (SOM). The main purpose of this paper is to examine the Spanish construction firms using a methodology based on artificial neural networks (ANN) and Self-Organizing Maps (SOM) to test whether the firms can be clustered into solvent and insolvent businesses (default and active companies) through the analysis of each firm’s age, profitability, growth opportunities, size, volatility, and asset tangibility—factors frequently used to explain a firm’s capital structure. To the best knowledge of the authors, using an ANN to predict business failure using capital structure-determining variables, has not been done. This association between both theories is most suitable to explain firm’s decisions in the context of the subprime financial crisis.
The learning process of SOM is unsupervised, so the network uses the internal properties of the input data to organize the information, depending on its similarities. This is a type of artificial neural network algorithm which belongs to the unsupervised learning category, and which is used to visualize and interpret large, high-dimensional data sets. Therefore, the ANN approach based on SOM can provide a clustering between default and active firms according to their financing; that is, investigating how the capital structure affects the firm’s survival.
This analysis provides a spatial distribution of the firms in a bidimensional map from which the accuracy percentage of grouping is calculated. It also enables the realization of the relationship between the variables introduced and the predictors of insolvency situations. This analysis is useful for identifying changes or levels in the variables that can induce or predict insolvency situations, and for expert analyses to diagnose firms through small samples.
The paper is organized in six sections. First, the introduction; then, Section 2 presents the theoretical background and the variables selected. Section 3 and Section 4 describe the methodology and data used in the study. In Section 5, the application to the case of study is shown, and finally, in Section 6 the discussion of the results and main conclusions are presented.

2. Theoretical Framework

In this study, the selection of the ratios was done taken with reference to a capital structure literature review [19,20]. The vast majority of the studies are empirical applications, and use similar econometric techniques, including ordinary last squares, the difference in differences model, the generalized moments model, logit, probit, tobit, etc. These works compare results and test the main traditional theories of capital structure focusing on characteristics of the firms in each sector. There are only a few applications of non-traditional techniques to study capital structure [19,20,21].
Modigliani and Miller [18] propose that the company’s market value is independent of its capital structure under certain assumptions. Then, the same authors in 1963 [22] analyzed the possibility to dismiss the original hypotheses of perfect financial markets and admitted the tax advantage of debt.
Other studies, such as [23,24], analyzed how the extensive use of debt can lead companies to default. As a result, the trade-off theory arose, which considers the effects of the several variables (taxes, bankruptcy costs, and agency problems) and predicts an optimal structure as a result of balancing the costs and the benefits of issuing debt and capital. According to this theory, a company will increase its debt size according to the level at which the tax benefits of debt are offset by the increase in bankruptcy costs.
Then, papers [25,26] proposed the pecking order hypotheses, which recognizes a hierarchical order in financing choices to minimize adverse selection costs. According to this theory, companies prefer, in first place, their internal resources; in second place, external debt; and in third place, they expand their capital through new financial alternatives. This order reflects the preference of entrepreneurs to retain control of the company and avoid the costs of external financing that takes place in context of asymmetric information.
Moreover, the business cycle theory of [27] explained the firms’ capital structure. This theory considers that firms can substitute and complement different forms of financing, which vary over its life cycle, and depend on the age, size, and information availability of the companies. Other authors [28] considered that a manager’s individual objectives, such as attitude towards debt and experience with external financing (according to risk aversion), level of education, and the socioeconomic and emotional costs of bankruptcy, affect the demand for funds. According to the business life cycle and to this approach, the demand for external funds and its success could be affected by some of the characteristics of the firms and owners. Following these theories, many studies have attempted, without consensus, to determine which describes better the companies financing decisions. For example, the effects of the financial crises over the financing decisions in Spain and Europe are analyzed in papers such as [21,29,30,31,32], among others.
In financial crisis periods, the alternatives of financing are reduced and the cost of access increased; therefore, the firms probably change their ways of financing and their capital structure. According to [33], companies in financial crises are affected the supply and demand of funds. After the subprime crisis, restrictions come from the supply side.
In summary, the literature review proposed indicators to analyze profitability, growth opportunities, company size, risk, asset structure, and age to evaluate whether these factors that explain leverage can be useful for predicting business failure in the context of a crisis. The selected variables are the following:
  • Profitability: According to [25,26] the firms prefer to use internal resources to finance operations; in other words, more profitability is linked with cash flows, so the firms no need external debt to finance their investments. Therefore, there is a negative relation between profitability and leverage. However, [22] found the opposite statement, confirming that exists a positive relation because of the most profitable firms can take more debt, given the advantages of taxes. In this study profitability is measured though EBIT (earnings before interest and taxes) over assets taken as references [34,35,36,37], among others. Another measure of profitability is EBITDA (earnings before interest taxes depreciation and amortization) over assets. Thus, the following hypothesis was formulated:
    H1. 
    Higher Profits (EBIT over Assets) Reduce Default Probability.
  • Growth opportunities: On the one hand, the operating earnings’ variability and the variation of total assets can be used as measures of growth potential. In the case of earnings, some authors suggest that firms with more variations in sales have more possibilities of growth [21,30,38] and firms with more investments have more potential for growth [21,37,39]. According to the pecking order theory, a positive relationship is expected between leverage and growth opportunities. One study [40] suggested a positive relationship between the growth and the firm’s age because companies need more external financing when they are young. On the other hand, there are other indicators used in the literature to measure growth opportunities, such as market to book ratio and Tobin’s Q. Thus, the following statement was formulated:
    H2. 
    A higher Variation in the Total Assets Decreases the Possibility of Bankruptcy.
  • Size: According to the trade-off theory, firm size is positively related with external financing, but some empirical evidence shows a negative relationship with leverage. The positive relation is associated with reputation and information asymmetries that are smaller in large firms [40,41]. The size can be measured through the logarithm of total assets [30,34,37,39,41,42,43] or the logarithm of earnings ([29,30,35,38], among others). Thus, the following statement was formulated:
    H3. 
    The Firm’s Size Decreases the Probability of Defaulting.
  • Risk/Volatility: The pecking order theory and the trade-off theory argue that more risk is associated with less leverage. The risk can be measured through the standard deviation of ROA, that of EBIT, and/or the standard deviation of earnings ([36,39,42], among others). Thus, the following statement was formulated:
    H4. 
    More Volatility Increases the Probability of Defaulting.
  • Tangibility: This variable shows the proportion of fixed assets in the firm [25,30,35,36,38,42,43]. The literature review showed that companies with high proportions of fixed assets over total assets present more leverage because fixed assets can be used as guaranties. On the other hand, guaranties reduce agency problems and cost of default [35]. Thus, the following statement was formulated:
    H5. 
    Higher Tangibility (Fixed Assets over Total Assets) Decreases Default Probability.
  • Age: A Firm’s age can be measured as the logarithm of the number of years of business operation, following [35,44]. It also can be measured by the number of years since the firm’s founding [29,38]. On the other hand, authors such as [40] use a size–age index, a linear combination of firm size and age. The pecking order theory predicts a negative relationship between age and debt, arguing that the years of operation of business help the firm to accumulate retained earnings and generate internal resources over time, thereby minimizing the need for external finance. Thus, the following statement was formulated:
    H6. 
    The Probability of Defaulting is Reduced with the Age of the Firms.

3. Methodology: Self-Organizing Maps

SOM is a type of ANN which allows one to cluster patrons (in this paper, firms) based on different variables [45]. It is important to mention that a key advantage of this kind of ANN is its unsupervised learning process because it is not necessary to define groups beforehand; rather, they will be defined according to the similarities and differences between the values of all variables included in the study. In this paper, the main purpose is to study how certain variables influence the business failures of Spanish firms without any assumptions; in this sense, the use of other networks, such as back-propagation, is rejected because this technique requires the definition of one or more outputs in conjunction with one or more inputs to find patterns. Thus, it was considered that SOM is the most suitable network for this study.
Regarding the SOM architecture, the neurons of the input layer are connected with all the neurons of the output layer through synaptic weights. Thus, it is possible to establish a bidimensional map, such as failed and non-failed regions (with default and active firms) and create insolvency trajectories [46,47,48]. The SOM learning algorithm can be summarized in the following steps:
Each neuron of the input layer is connected to each neuron of the output layer through synaptic weights ( w i j ), where w i j corresponds to the weight that connects the neuron i in the input layer with the neuron j. The output layer is a two-dimensional map. The input data are located on the map according to the similarities between all the variables used to define input information. The maximum number or possible iterations in the training phase of the network is defined.
Given an input vector k to the network (where k represents each company), the Euclidean distance (ED), as the measure of distance or similarity, is calculated to find the closest matching unit to each input vector. Initially, t = 0, the weights take small random values.
E D = i = 1 N x i k ( t ) w i j k ( t ) 2
To reduce the distance between the input vector and the weighting vector associated to the winning neuron, the synaptic weights are updated according to the following rule:
w i j k ( t + 1 ) = w i j k ( t ) + α ( t ) h j k ( t ) [ h i k ( t ) w i j k ( t ) ]
where α is the learning ratio; the neighborhood function h ( t ) allows it to update the winning neuron’s weights and its neighborhood (neurons close to the winning neuron at a radio that decreases with the number of iterations). The neighborhood function allows actualizing the weights of the winning neuron and the neighbor neurons to localize similar patterns.
The interactive process goes on until t reaches the maximum number of iterations T previously defined.
The preceding step is repeated a sufficient number of times to get the stability of the association between the different patterns with the same unit of the output layer. Once the learning process ends, all the patterns are distributed in the bi-dimensional map. Finally, it is also possible to group the input patterns situated in the map in a particular number of groups. A pattern will belong to the closest group, according to the minimum distance between its characteristics and the mean of the characteristics in the region.
Once the network is implemented, it generates an output map where the firms are located. The ratio of default firms for an output neuron j, Q j , is calculated using the Equation (3):
Q j = A j E j
where E j is the total number of firms located in neuron j and A j is the total number of default firms in neuron j. If Q j ≥ 0.5, the cell is considered as a cell of default firms, and Q j < 0.5 if it is considered as a representative of active firms.
When the network makes the clusters of firms, two errors can be committed. Error type I: when the model classifies a default firm as active one. Error type II: when the model identifies an active firm as insolvent or the default company.

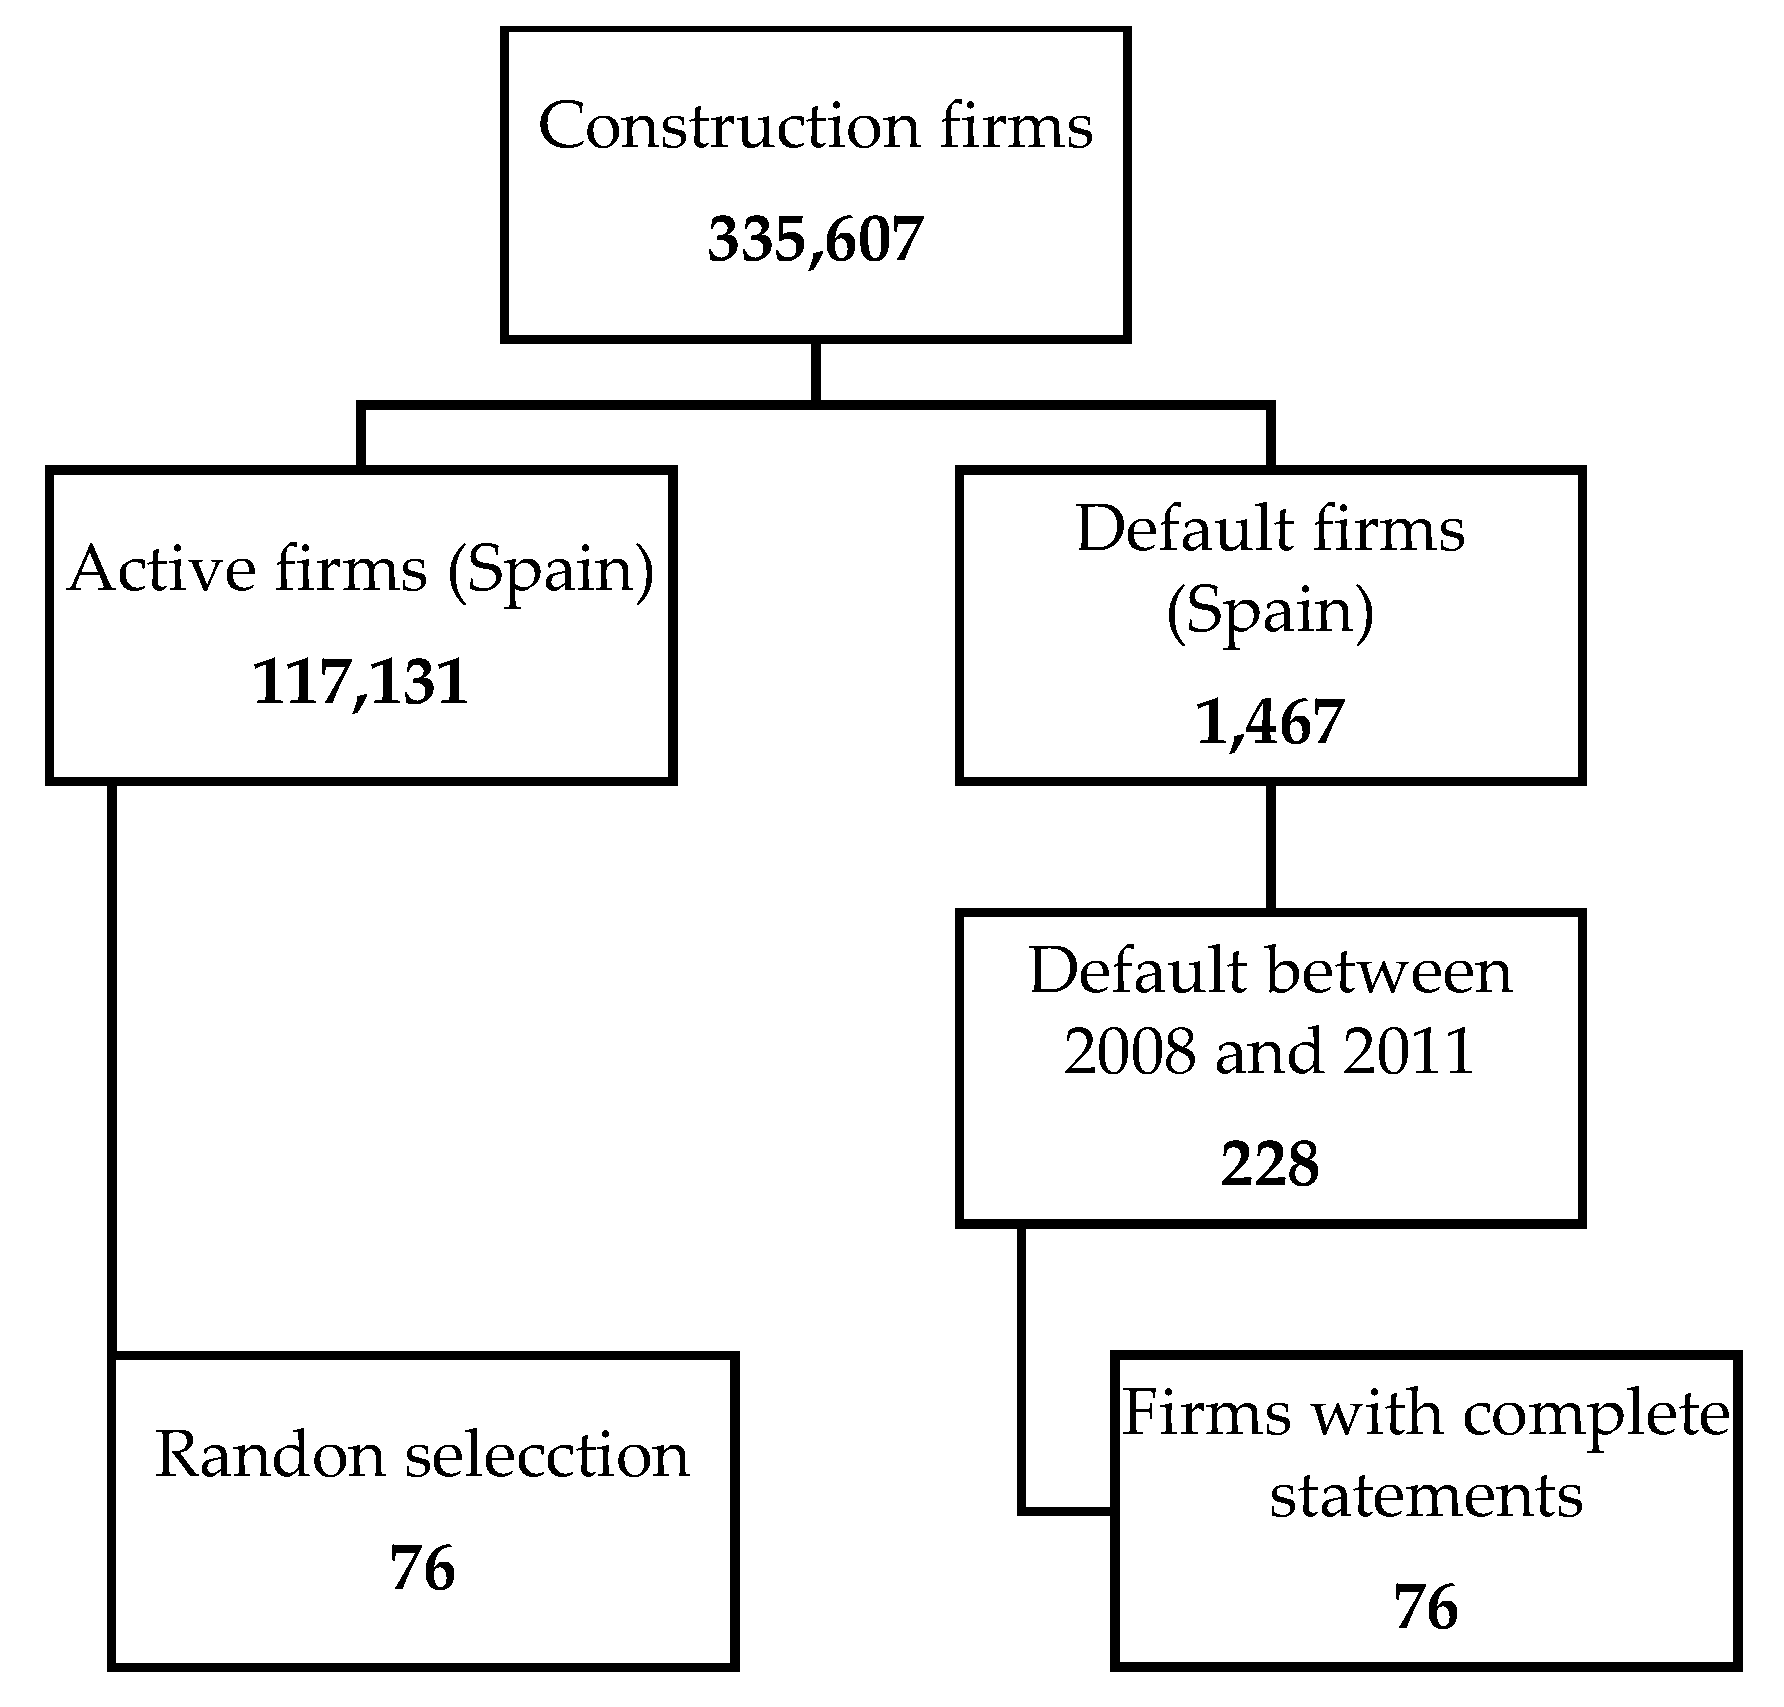
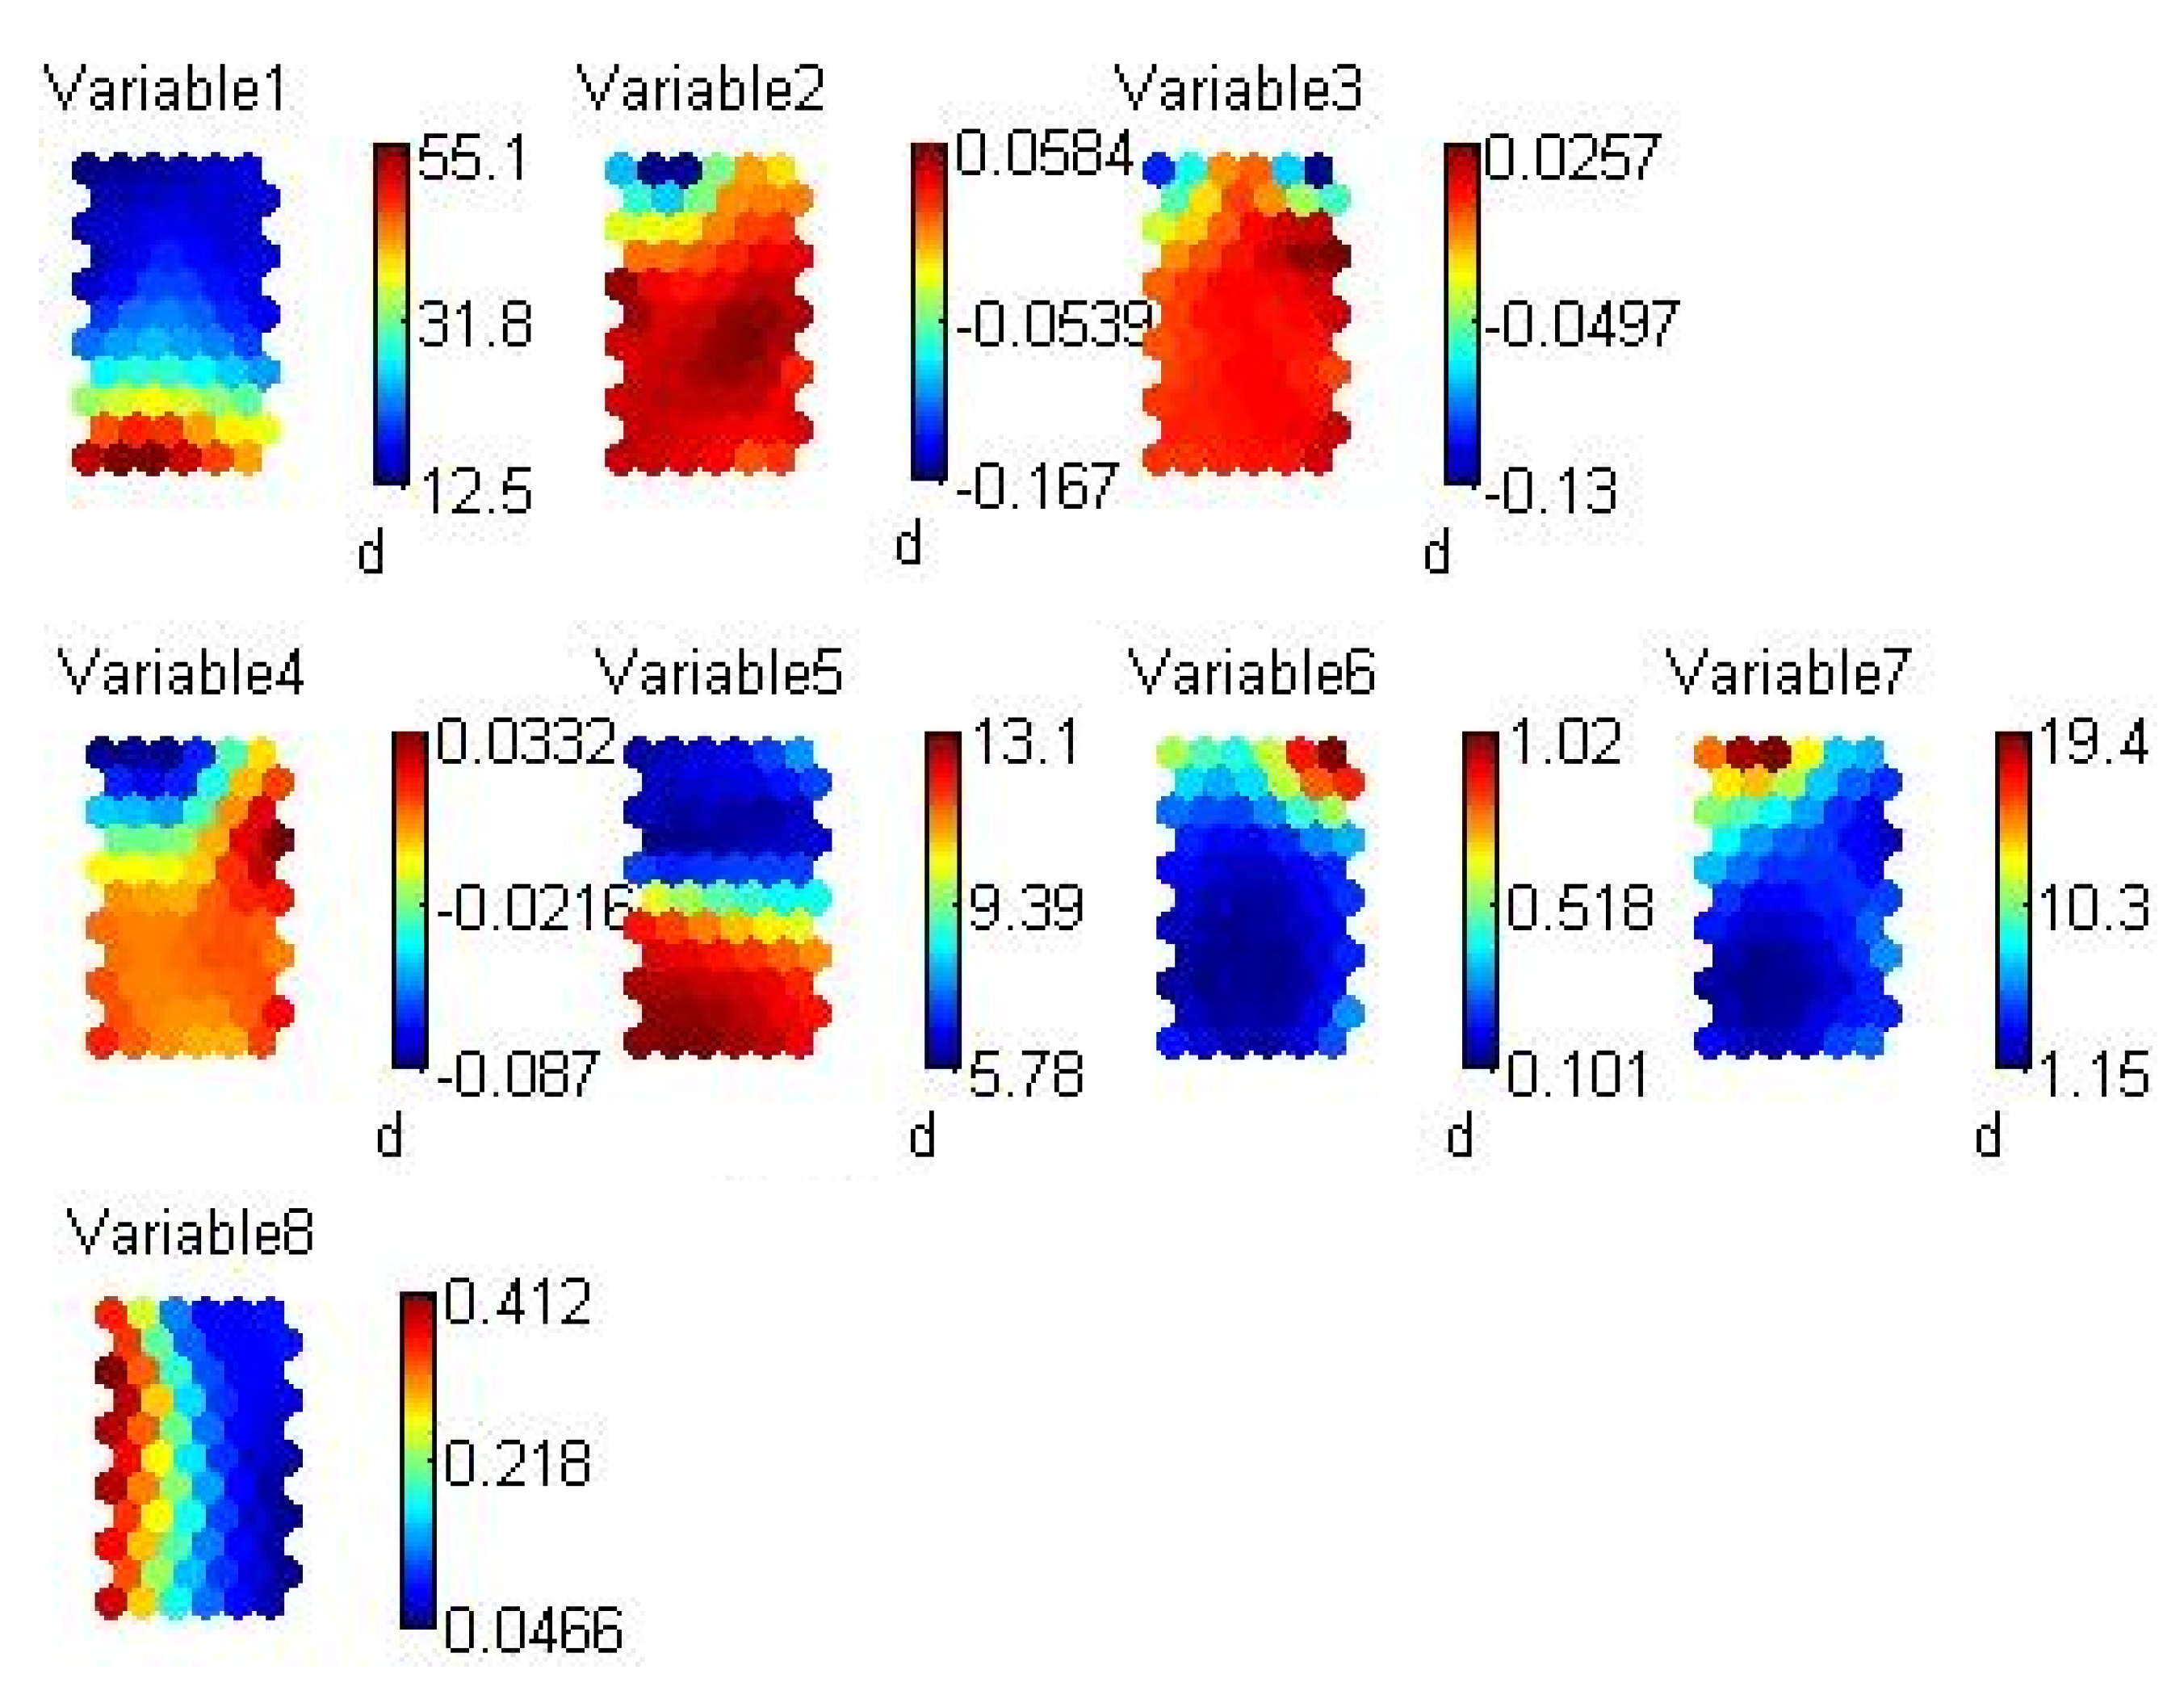
4. Data and Variables Selection
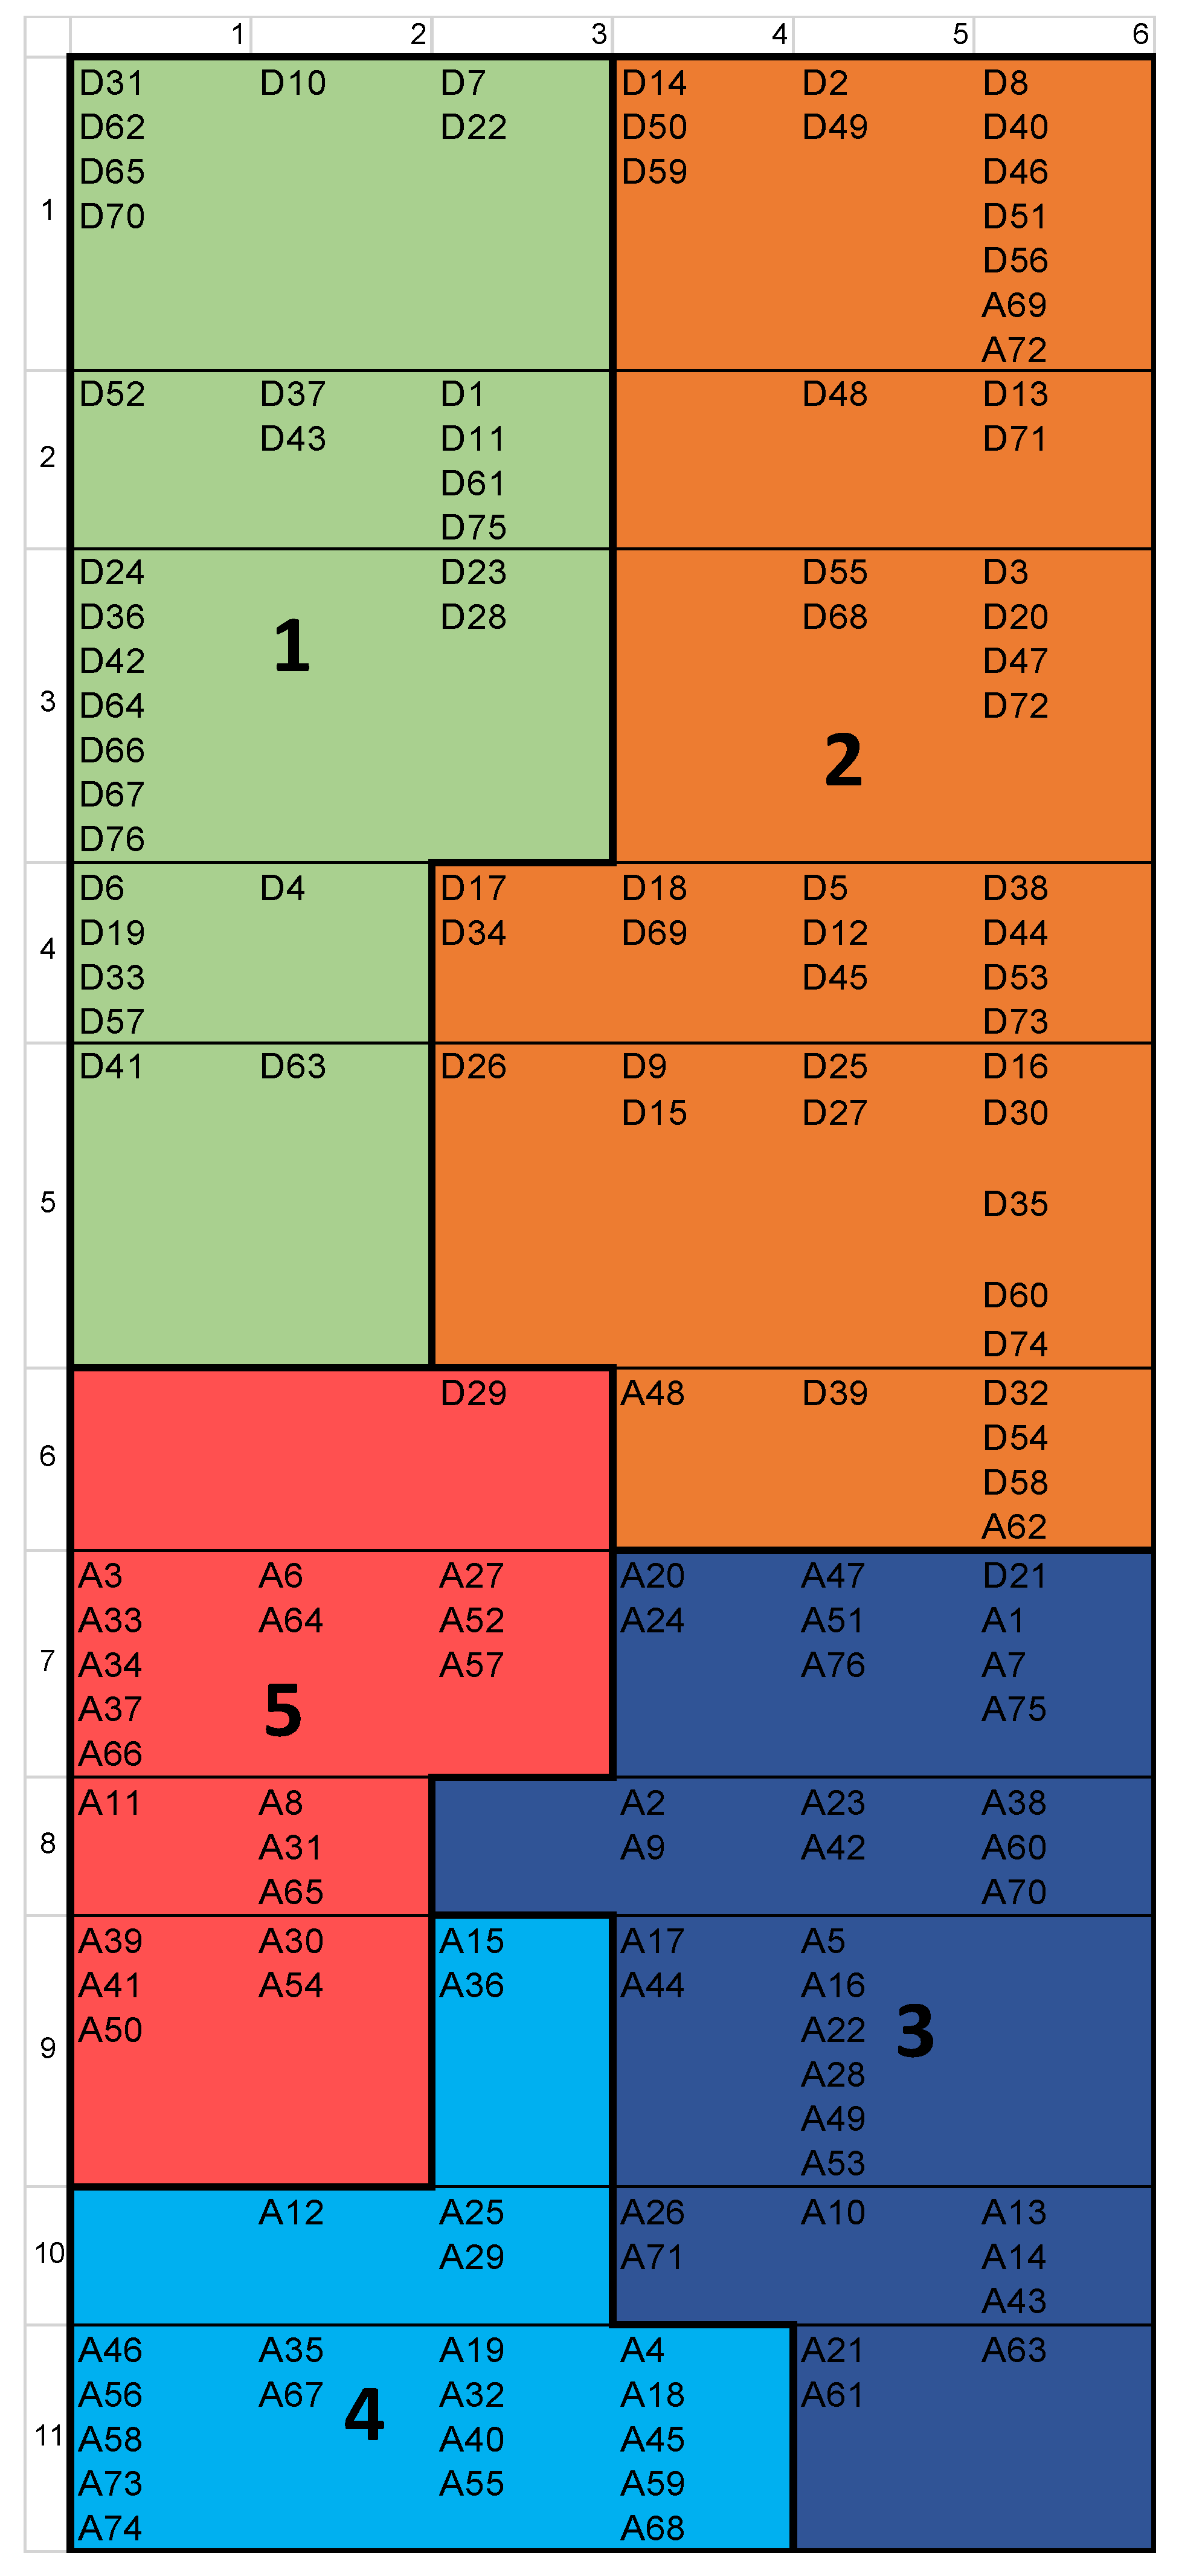
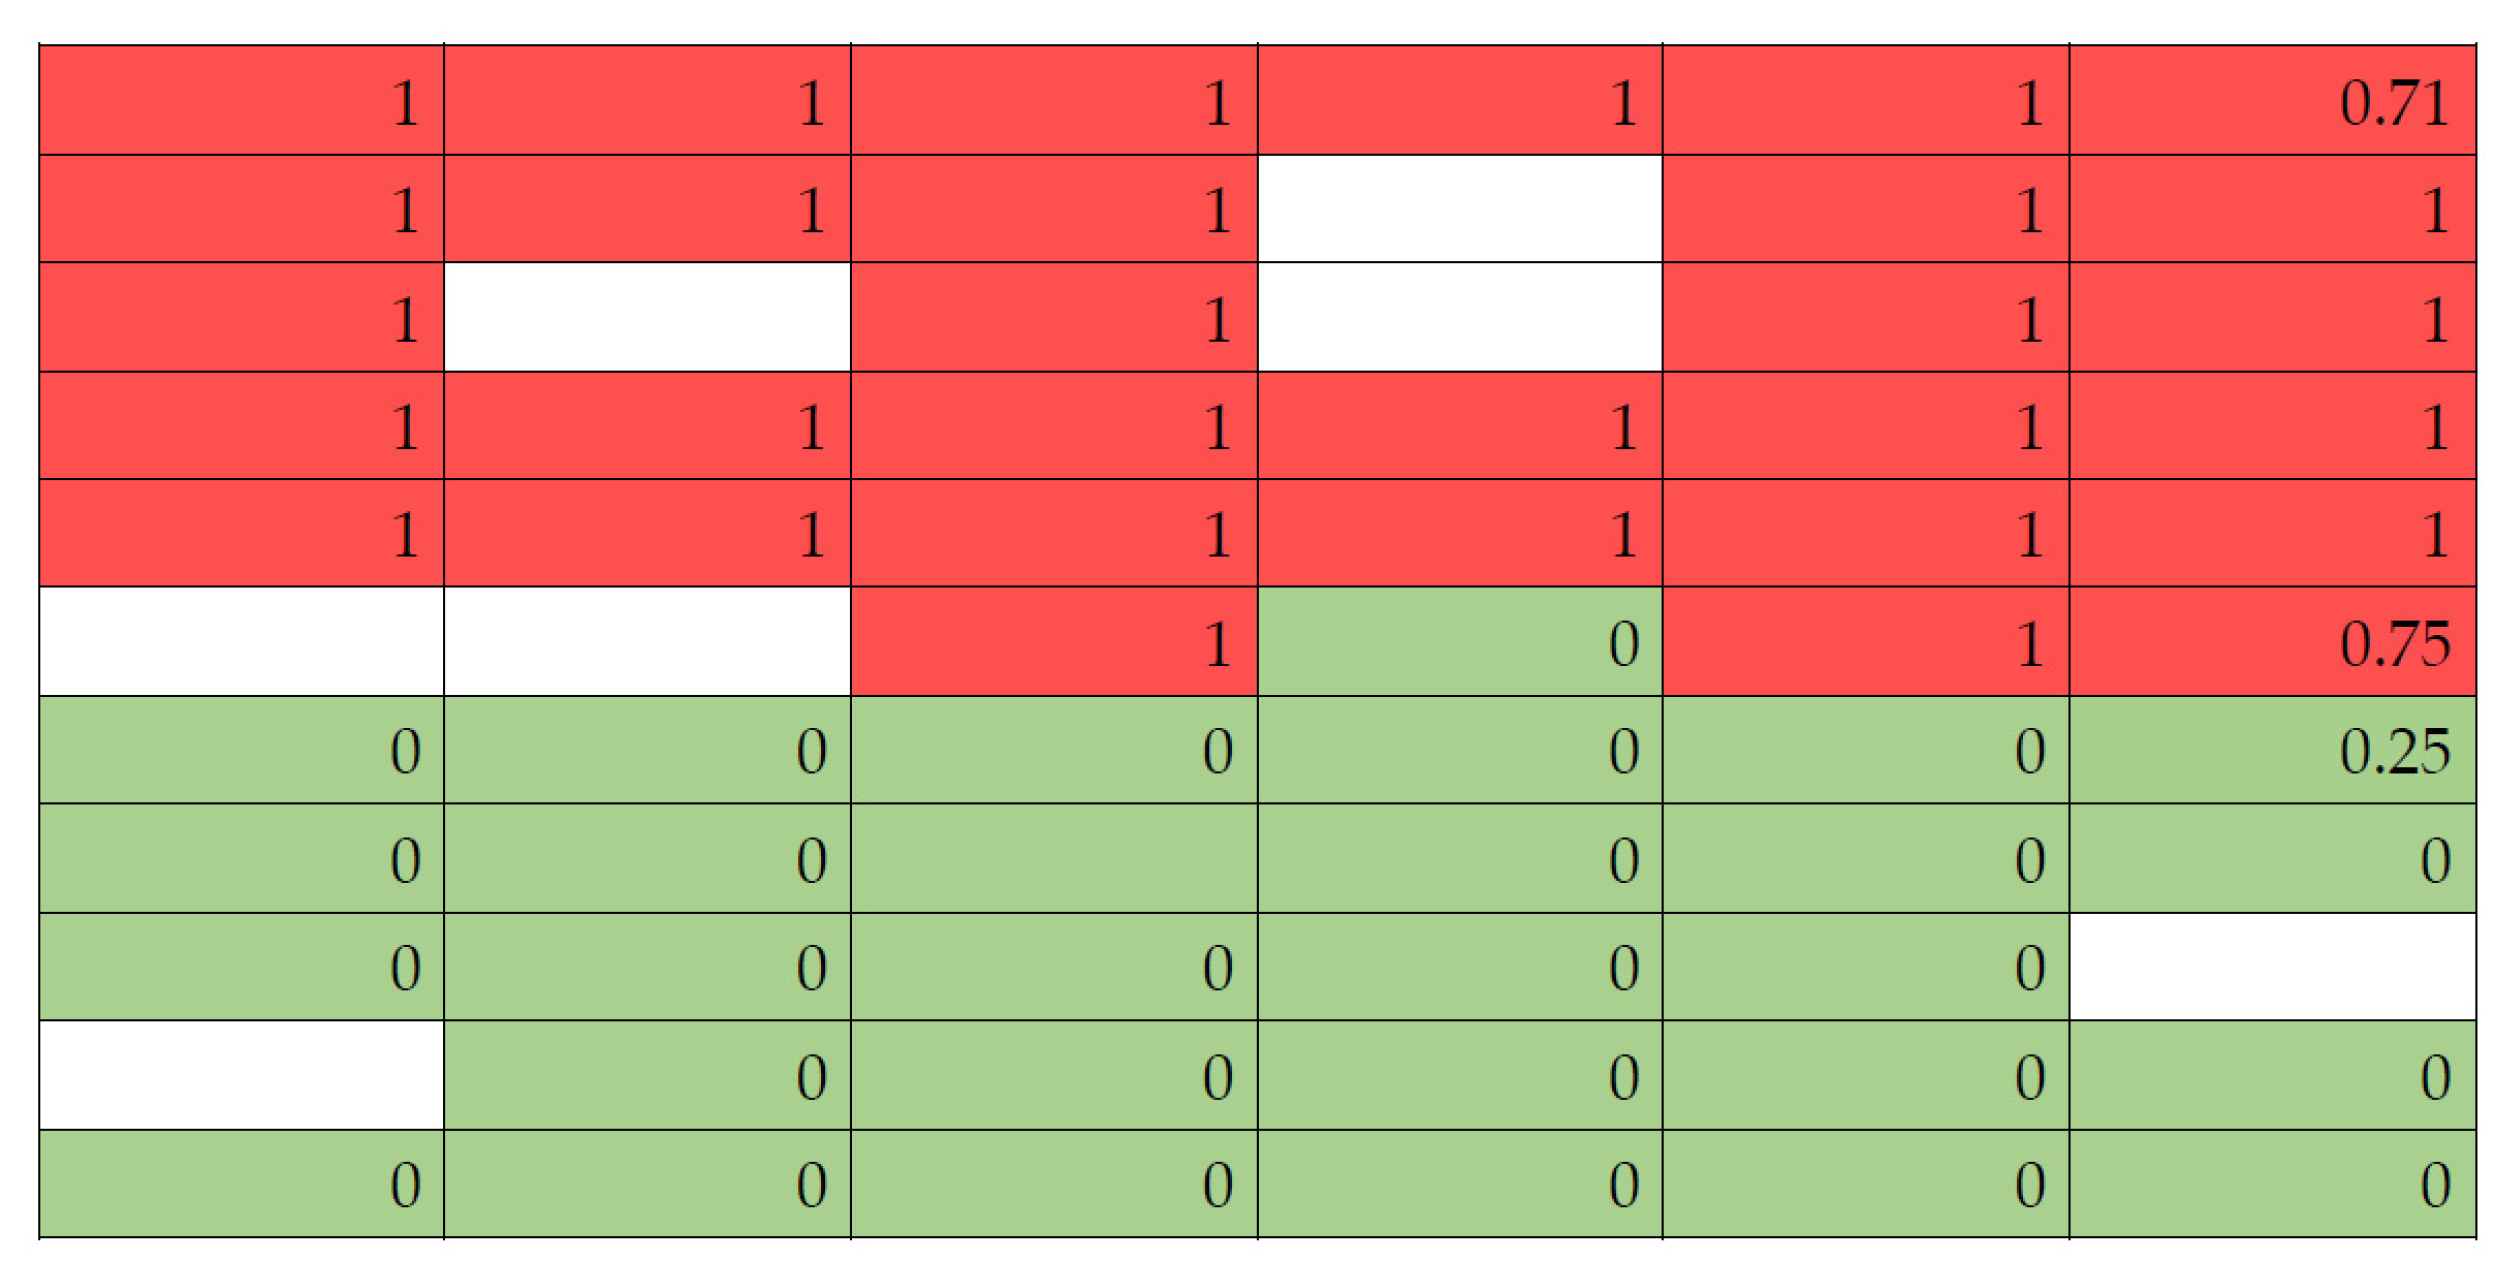
The data of construction firms were extracted from SABI database. The examined sector was the construction industry in Spain during 2008. The search has been carried out, dividing between active and insolvent company categories (bankruptcy, preventive arrangement, and suspension of payments). The selection criteria for active firms were met by 117,131 companies and by 1467 over insolvency firms. Then we explored the database to detect firms that changed their state between 2008 and 2011 to detect the incidence of the financial crisis. SABI database includes companies that did not publish complete financial statements, so the selection of observations was further limited, and the study was focused on companies whose financial statements contained at least the data necessary for the calculation of selected ratios. This condition was met by only 76 default companies; therefore, we randomly extracted 76 active firms (see Figure 1).
The variables were selected considering the hypothesis described in Section 2 based on the theoretical framework of a financial crisis and capital structure. Table 1 shows the variables selected for the analysis and its description, Table 2 presents the descriptive statistics of the sample, and Table 3 shows the correlation matrix between the analyzed variables.
According to the results of the correlation matrix, the variables 5 and 6 show a high correlation, so the variable 6 (earnings) was eliminated as a measure of the sizes of the firms. The other eight variables were selected for the empirical analysis.

5. Application

When the network is implemented, it generates an output map of dimensions 11 × 6 (11 rows and six columns), where the corresponding patterns (firms) have been numbered, and “D” corresponds to a default company and “A” identifies an active company, both at the end of 2011.
The firms that were most similar were placed in the same area of the map. As can be seen in Figure 2, the groups situated at the top of the map contain the default firms, whereas the groups located at the bottom mainly represent clusters of active firms.
On the other hand, Figure 3 shows the values of Q j of each output layer neuron, defined in Equation (3). The color red is used to identify the neurons with Q j ≥ 0.5; in other words, those contain default firms. The color green is a cell considered representative of an active firm neuron ( Q j < 0.5). The white cells represent those units of the map in which no company has been located.
Table 4 shows the accuracy percentage of the model, the error percentages of each type, and the resulting percentage error. As can be seen, the SOM correctly predicts 97.4% of firms in the construction sector in Spain. Moreover, the percentage of type I error (1.4%) is less than that of type II error (3.8%). Therefore, the results show the suitability of SOM for classifying business bankruptcy, and it is generally accepted that the cost of incurring type I error is greater than the cost of incurring type II, due to the losses that may be entailed when investing in a company with a high risk of bankruptcy when it has been considered to be active.
Then, the second step is to analyze which variables define the bankruptcy in the Spanish construction sector. To do this, it is necessary to evaluate the value of each variable in the map. These values with the color scale are presented in Figure 4. The dark blue color represents the minimum values while the red one shows the highest values. In this case, for variables associated with risk, low values (blue) are expected, whereas for others such as profitability or size—high values (red).
Through SOM (Figure 2) and the characteristics map (Figure 4), similarities were detected between the firms included in the five clusters.
Group 1 is only formed by default firms (30 companies), which shows a high ROA volatility and a middle earnings volatility as measure of risk. These firms also have low profitability and low growth opportunities due to low variability in earnings and assets. Moreover, they are small, young, and have high proportions of fixed assets that are long term.
Group 2 is formed by 48 firms, identifying 44 default firms and only four active. This group shows low/middle profitability and low/middle growth opportunities. The earnings volatility is high, and in the case of ROA, as a measure of risk, the value is medium to low. Additionally, these firms are young and small, but, in this case, most of the assets are not fixed.
Group 3 is comprised by 32 active firms and only one default firm. This group presents low volatility in ROA and earnings, medium to high profitability, and high opportunities for growth. Additionally, it can be observed that this cluster is characterized by middle aged and big firms, with small fixed assets ratios.
Group 4 contains only active firms (21 companies). These firms are the oldest of the sample, with high profitability. Additionally, they show high growth opportunities and low risk measured by both variables (earnings and ROA), and they have middle/high tangibility.
Group 5 contains 20 firms: specifically, 19 active and one default firm. This group is the most different cluster because it is characterized by big and middle aged firms which have high profitability, high growth opportunities, and low risk, measured as the volatility of earnings and ROA. Additionally, most of the assets are fixed.

6. Discussion and Conclusions

This paper proposes an enrichment of the theory of capital structure and the prediction of business failure showing the capacity of SOM neural network to classify firms as healthy or unhealthy. In this case, we proved the impact of the financial crisis on firms’ financial decisions that could have induced failure. In the net, we considered variables that measure the age, profitability, growth opportunities, size, volatility, and asset tangibility. Those factors taken from the capital structure and financial theory were employed to predict business failure and the financial crisis’s impact. The SOM correctly predicts 97.4% of firms (98.6% of the active firms and 96.2% of the default firms) in the analyzed sector with a type I error (1.4%) smaller than type II error (3.8%). Additionally, the net classifies the firms in five groups with clear similarities inside the clusters that confirms the hypotheses. That means that firms with high profits, with more assets, and of older age have lesser probabilities of defaulting. Additionally, the net shows that more risk or volatility increases the probability of defaulting. These characteristics were verified in the five clusters created through the SOM, linking the groups 1 and 2 with the default firms, which show high risk, low to medium profitability, and low growth opportunities. Moreover, they are small and young, but show high (group 1) or low (group 2) fixed assets. Groups 3, 4, and 5 are associated with active or solvent businesses with the opposite characteristics of those expected.
Due to the results exposed above, we can confirm hypotheses 1, 2, 3, 4, and 6. Hypothesis 5 is not clear, because bankruptcy clusters (groups 1 and 2) show opposite values.
According to hypothesis 1: higher profits reduce default probability. These results are in accordance with the capital structure literature, and specifically with the pecking order theory [25,26], showing that companies prefer to use internal sources to finance their operations, so a negative relationship between leverage and profitability is expected ([32,33,34,39,43,44] among others). Hence, higher profitability implies a greater cash flow generated internally to finance the planned investment, and consequently, a lower need for debt. Additionally, we can add that these funds could be used to go through situations of external financial distress, reducing the probability of defaulting. Hypothesis 2 supposes that a higher variation in total assets decreases the possibility of bankruptcy, when using this ratio as a measure of growth potential. Therefore, we confirm that companies with higher growth opportunities could go through financial problems better than companies with lower opportunities during the subprime crisis. But in the literature, there are arguments for and against the positive relationship [31,32,39,43], whereas there is a negative relationship between leverage and growth [35,49]. The tests of hypothesis 3 shows that firm’s size decreases the probability of defaulting because larger companies tend to be more diversified. This situation decreases the company’s risk to internal and external shocks and bankruptcy possibilities. In addition, large companies generally have better access to external sources of financing because they have lower problems of asymmetric information, while they tend to be more mature, with greater availability of tangible assets and profitability, so they face lower adjustment costs of leverage [40]. Furthermore, hypothesis 4 is confirmed linking more volatility or risk with the possibility of default. The companies with volatility in their income face greater credit restrictions due to the risk that they will not generate sufficient profits to meet their debt commitments. Finally, hypothesis 6 is verified: the probability of defaulting is reduced with the age of a firm. Older companies tend to be more diversified, with better financial records, better relationships with suppliers, among other factors. The net does not identify clearly the impact of tangibility (hypothesis 5) in the prediction of business failure. The analysis identifies that most of the factors that explain financial decisions in companies are also useful for predicting bankruptcy during crisis situations. This relationship between both theories could be useful in order to set public and banking policies to improve the access to financial resources and for monitoring the firms with higher chances of defaulting.
As a future study, it would be interesting to add another clustering method, such as K-means, as a comparison with SOM and to compare the obtained results. On the other hand, regarding the application, the study could be extended by including other countries, besides Spain; for example, European countries. Moreover, it is possible to test the analysis, including other years or other crises, such as the case of the Euro crises. Finally, other sectors could be studied, both for the subprime crisis in Spain, and for other crises and other countries, to test whether the SOM confirms the same results.

Author Contributions

This article is a joint work of the four authors. J.P.L., L.F.-A., V.S., and H.V. contributed to the research ideas, literature review and analysis and to writing the paper. All authors read and approved the final manuscript.

Funding

Part of this research was funded by the project “Análisis exploratorio y detección de las causas de fracaso empresarial en emprendedores, micro y pequeñas empresas del sudoeste de la Provincia de Buenos Aires [PGI UNS 24/E162].

Conflicts of Interest

The authors declare no conflict of interest

References

  1. Beaver, W.H. Financial ratios as predictors of failure. J. Account. Res. 1966, 4, 71–111. [Google Scholar] [CrossRef]
  2. Altman, E.I. Financial ratios, discriminant analysis and the prediction of corporate bankruptcy. J. Financ. 1968, 23, 589–609. [Google Scholar] [CrossRef]
  3. Balcaen, S.; Ooghe, H. 35 years of studies on business failure: An overview of the classic statistical methodologies and their related problems. Br. Account. Rev. 2006, 38, 63–93. [Google Scholar] [CrossRef]
  4. Kumar, P.R.; Ravi, V. Bankruptcy prediction in banks and firms via statistical and intelligent techniques: A review. Eur. J. Oper. Res. 2007, 180, 1–28. [Google Scholar] [CrossRef]
  5. Bahrammirzaee, A. A comparative survey of artificial intelligence applications in finance: Artificial neural networks, expert systems and hybrid intelligent systems. Neural Comput. Appl. 2010, 19, 1165–1195. [Google Scholar] [CrossRef]
  6. Sun, J.; Li, H.; Huang, Q.H.; He, K.Y. Predicting financial distress and corporate failure: A review from the state of the art definitions, modeling, sampling, and featuring approaches. Knowl. Based Syst. 2014, 57, 41–56. [Google Scholar] [CrossRef]
  7. Appiah, K.O.; Chizema, A.; Arthur, J. Predicting corporate failure: A systematic literature review of methodological issues. Int. J. Law Manag. 2015, 57, 461–485. [Google Scholar] [CrossRef]
  8. Alaka, H.A.; Oyedele, L.O.; Owolabi, H.A.; Kumar, V.; Ajayi, S.O.; Akinade, O.O.; Bilal, M. Systematic review of bankruptcy prediction models: Towards a framework for tool selection. Expert Syst. Appl. 2018, 94, 164–184. [Google Scholar] [CrossRef]
  9. Scherger, V.; Terceño, A.; Vigier, H. A systematic overview of the prediction of business failure. Int. J. Technol. Policy Manag. 2019, 19, 196–211. [Google Scholar] [CrossRef]
  10. Vigier, H.; Scherger, V.; Terceño, A. An application of OWA operators in fuzzy business diagnosis. Appl. Soft. Comput. 2017, 54, 440–448. [Google Scholar] [CrossRef]
  11. Scherger, V.; Terceño, A.; Vigier, H. The OWA distance operator and its application in business failure. Kybernetes 2017, 46, 114–130. [Google Scholar] [CrossRef]
  12. Terceño, A.; Vigier, H.; Scherger, V. Prediction of business failure with fuzzy models. Int. J. Uncertain. Fuzziness Knowl. Based Syst. 2018, 26, 21–38. [Google Scholar] [CrossRef]
  13. Hu, C.K.; Liu, F.B.; Hu, C.F. A set covering-based diagnostic expert system to economic and financial applications. Int. J. Uncertain. Fuzziness Knowl. Based Syst. 2016, 24, 91–107. [Google Scholar] [CrossRef]
  14. Scarlat, E.; Delcea, C. Complete analysis of bankruptcy syndrome using grey systems theory. Grey Syst. Theory Appl. 2011, 1, 19–32. [Google Scholar]
  15. Scherger, V.; Terceño, A.; Vigier, H.; Barberá-Mariné, M.G. Detection and assessment of causes in business diagnosis. Econ. Comp. Econ. Cybern. Stud. Res. 2015, 49, 211–229. [Google Scholar]
  16. Tseng, F.M.; Hu, Y.C. Comparing four bankruptcy prediction models: Logit, quadratic interval logit, neural and fuzzy neural networks. Expert Syst. Appl. 2010, 37, 1846–1853. [Google Scholar] [CrossRef]
  17. Odom, M.D.; Sharda, R. A neural network model for bankruptcy prediction. In Proceedings of International Joint Conference on Neural Networks; IEEE: San Diego, CA, USA, 1990; pp. 163–168. [Google Scholar]
  18. Modigliani, F.; Miller, M.H. The cost of capital, corporation finance and the theory of investment. American 1958, 48, 261–297. [Google Scholar]
  19. Martinez, L.B.; Scherger, V.; Guercio, M.B. SMEs capital structure: Trade-off or pecking order theory: A systematic review. J. Small Bus. Enterp. Dev. 2018, 26, 105–132. [Google Scholar] [CrossRef]
  20. Ardalan, K. Capital structure theory: Reconsidered. Res. Int. Bus. Financ. 2017, 39, 696–710. [Google Scholar] [CrossRef]
  21. Camara-Turull, X.; Fernández-Izquierdo, M.A.; Sorrosal-Forradellas, M.T. Analysing capital structure of spanish chemical companies using self-organizing maps. Kybernetes 2017, 46, 947–965. [Google Scholar] [CrossRef]
  22. Modigliani, F.; Miller, M.H. Corporate Income Taxes and the Cost of Capital: A Correction. Am. Econ. Rev. 1963, 53, 433–443. [Google Scholar]
  23. Stiglitz, J.E. A re-examination of the Modigliani-Miller theorem. Am. Econ. Rev. 1969, 59, 784–793. [Google Scholar]
  24. Fama, E.F. The effects of a firm’s investment and financing decisions on the welfare of its security holders. Am. Econ. Rev. 1978, 68, 272–284. [Google Scholar]
  25. Myers, S.C. The capital structure puzzle. J. Financ. 1984, 39, 574–592. [Google Scholar] [CrossRef]
  26. Myers, S.C.; Majluf, N.S. Corporate financing and investment decisions when firms have information that investors do not have. J. Financ. Econ. 1984, 13, 187–221. [Google Scholar] [CrossRef] [Green Version]
  27. Berger, A.N.; Udell, G.F. The economics of small business finance: The roles of private equity and debt markets in the financial growth cycle. J. Bank. Financ. 1998, 22, 613–673. [Google Scholar] [CrossRef] [Green Version]
  28. Briozzo, A.; Vigier, H. A demand-side approach to SMES’ capital structure: Evidence from Argentina. J. Bus. Entrep. 2009, 21, 30–56. [Google Scholar]
  29. Alves, P.; Francisco, P. The impact of institutional environment on the capital structure of firms during recent financial crises. Q. Rev. Econ. Financ. 2015, 57, 129–146. [Google Scholar] [CrossRef]
  30. Daskalakis, N.; Balios, D.; Dalla, V. The behaviour of SMEs’ capital structure determinants in different macroeconomic states. J. Corp. Financ. 2017, 46, 248–260. [Google Scholar] [CrossRef]
  31. Balios, D.; Eriotis, N.; Fragoudaki, A.; Giokas, D. Economic efficiency of Greek retail SMEs in a period of high fluctuations in economic activity: A DEA approach. Appl. Econ. 2015, 47, 3577–3593. [Google Scholar] [CrossRef]
  32. Van Hoang, T.H.; Gurău, C.; Lahiani, A.; Seran, T.L. Do crises impact capital structure? A study of French micro-enterprises. Small Bus. Econ. 2018, 50, 181–199. [Google Scholar]
  33. Zeitun, R.; Temimi, A.; Mimouni, K. Do financial crises alter the dynamics of corporate capital structure? Evidence from GCC countries. Q. Rev. Econ. Financ. 2017, 63, 21–33. [Google Scholar] [CrossRef]
  34. Crespí, R.; Martín-Oliver, A. Do family firms have better access to external finance during crises? Corp. Gov. Int. Rev. 2015, 23, 249–265. [Google Scholar] [CrossRef]
  35. Dasilas, A.; Papasyriopoulos, N. Corporate governance, credit ratings and the capital structure of Greek SME and large listed firms. Small Bus. Econ. 2015, 45, 215–244. [Google Scholar] [CrossRef]
  36. Ebrahim, M.S.; Girma, S.; Shah, M.E.; Williams, J. Dynamic capital structure and political patronage: The case of Malaysia. Int. Rev. Financ. Anal. 2014, 31, 117–128. [Google Scholar] [CrossRef] [Green Version]
  37. Kim, H.; Heshmati, A.; Aoun, D. Dynamics of capital structure: The case of Korean listed manufacturing companies. Asian Econ. J. 2006, 20, 275–302. [Google Scholar] [CrossRef]
  38. Ramalho, J.J.; Rita, R.M.; Vidigal da Silva, J. The impact of family ownership on capital structure of firms: Exploring the role of zero-leverage, size, location and the global financial crisis. Int. Small Bus. J. Res. Entrep. 2018, 36, 574–604. [Google Scholar] [CrossRef] [Green Version]
  39. Mirza, S.S.; Jebran, K.; Yan, Y.; Iqbal, A. Financing behavior of firms in tranquil and crisis period: Evidence from China. Cogent Econ. Financ. 2017, 5. [Google Scholar] [CrossRef]
  40. Dang, V.A.; Kim, M.; Shin, Y. Asymmetric adjustment toward optimal capital structure: Evidence from a crisis. Int. Rev. Financ. Anal. 2014, 33, 226–242. [Google Scholar] [CrossRef]
  41. Hernández, C.G.; Ríos Bolivar, H.; Garrido Noguera, C. Determinantes microeconómicos del acceso al financiamiento externo de la estructura de capital de empresas del sector industrial. Contad. Y Adm. 2015, 60, 326–345. [Google Scholar] [CrossRef] [Green Version]
  42. Danso, A.; Adomako, S. The financing behaviour of firms and financial crisis. Manag. Financ. 2014, 40, 1159–1174. [Google Scholar] [CrossRef]
  43. Fernández, A.I.; González, F.; Suárez, N. Bank supply shocks and the substitution between bank and nonbank debt. J. Corp. Financ. 2017, 48, 122–147. [Google Scholar] [CrossRef]
  44. Kyriazopoulos, G. Corporate governance and capital structure in the periods of financial distress. Evidence from Greece. Invest. Manag. Financ. Innov. 2017, 14, 254–262. [Google Scholar] [CrossRef] [Green Version]
  45. Kohonen, T.K. Self-organized formation of topologically correct feature maps. Biol. Cybern. 1982, 4, 59–69. [Google Scholar] [CrossRef]
  46. Chen, N.; Ribeiro, B.; Vieira, A.; Chen, A. Clustering and visualization of bankruptcy trajectory using self-organizing map. Expert Syst. Appl. 2013, 40, 385–393. [Google Scholar] [CrossRef]
  47. Serrano-Cinca, C. Self organizing neural networks for financial diagnosis. Decis. Support Syst. 1996, 17, 227–238. [Google Scholar] [CrossRef]
  48. du Jardin, P. Bankruptcy prediction using terminal failure processes. Eur. J. Oper. Res. 2015, 242, 286–303. [Google Scholar] [CrossRef]
  49. Judge, A.; Korzhenitskaya, A. Credit market conditions and the impact of access to the public debt market on corporate leverage. Int. Rev. Financ. Anal. 2012, 25, 28–63. [Google Scholar] [CrossRef]
Figure 1. Summary of samples.
Axioms 09 00046 g001
Figure 2. SOM.
Figure 2. SOM.
Axioms 09 00046 g002
Figure 3. Value of Q j of each neuron in SOM.
Axioms 09 00046 g003
Figure 4. Map of features.
Axioms 09 00046 g004
Table 1. Selected variables and the expected impact on default.
ClassificationVariableDescriptionExpected Relationship
AgeAge (Var1)Number of years elapsed between the firm creation and its insolvency situation or the end of the study period if the firm is still active.(-)
ProfitabilityEBIT/A (Var2)EBIT over assets(-)
Growth opportunitiesVar. earnings (Var3)% change in ln of sales(-)
Var. assets (Var4)% change in ln of total assets(-)
SizeAssets (Var5)Ln of assets(-)
Earnings (Var6)Ln of earnings(-)
Risk/VolatilityStd of earnings (Var7)Standard deviation of ln of earnings(+)
Std of ROA (Var8)Standard deviation of EBIT over assets in 2008 (year)(+)
TangibilityFA/A (Var9)Fixed assets over assets(-)
Table 2. Descriptive statistics of selected variables.
MinimumMaximumMeanStandard Deviation
A) Default companies
Age7.6434.0115.296.12
EBIT/A−7.850.52−0.100.91
Var. earnings−1.180.65−0.030.20
Var. assets−0.280.11−0.020.06
Assets0.0010.356.182.20
Earnings−0.979.937.271.58
Std. earnings0.014.510.480.64
Std ROA0.00569.1513.5965.32
FA/A0.000.810.180.18
B) Active companies
Age12.12112.9936.6920.91
EBIT/A−0.420.190.040.08
Var. earnings−0.150.11−0.000.04
Var. assets−0.040.080.010.02
Assets9.3015.5312.191.40
Earnings9.4115.3411.981.38
Std. earnings0.001.230.180.23
Std ROA0.0137.753.345.74
FA/A0.000.550.190.15
Table 3. Correlation matrix.
Var 1 Var 2 Var 3 Var 4 Var 5 Var 6 Var 7 Var 8 Var 9
Var 1 10.0980.0720.2600.7140.705−0.263−0.1160.030
Var 2 0.09810.0500.4900.0830.101−0.001−0.9910.046
Var 3 0.0720.05010.0930.2330.034−0.493−0.032−0.030
Var 4 0.2600.4900.09310.2910.247−0.120−0.504−0.113
Var 5 0.7140.0830.2330.29110.832−0.547−0.0880.019
Var 6 0.7050.1010.0340.2470.8321−0.246−0.1170.012
Var 7 −0.263−0.001−0.493−0.120−0.547−0.2461−0.007−0.086
Var 8 −0.116−0.991−0.032−0.504−0.088−0.117−0.0071−0.043
Var 9 0.0300.046−0.030−0.1130.0190.012−0.086−0.0431
Table 4. Default and errors of SOM network.
Error (%)Accuracy (%)
Type I1.498.6
Type II3.896.2
Total error2.697.4

