
Lichen Biodiversity Index (LBI) for the Assessment of Air Quality in an Industrial City in Pahang, Malaysia


Centre for Research in Development, Social and Environment (SEEDS), Faculty of Social Sciences and Humanities, Universiti Kebangsaan Malaysia, Bangi 43600, Malaysia
*
Author to whom correspondence should be addressed.
Atmosphere 2022, 13(11), 1905; https://doi.org/10.3390/atmos13111905
Submission received: 21 September 2022
/
Revised: 10 November 2022
/
Accepted: 11 November 2022
/
Published: 15 November 2022
(This article belongs to the Special Issue Biomonitoring - an Effective Tool for Air Pollution Assessment)
Abstract
:Lichen is a well-documented useful biological indicator for monitoring air pollution using various methods such as the biodiversity of lichens. However, the use of lichen biodiversity to estimate air pollution levels in industrial areas, particularly in Malaysia, is still weak, and the determinants of its diversity are unknown. As a result, the purpose of this research is to analyse air pollution in Malaysia’s industrial urban area using the lichen biodiversity index and its determining factor. This research was carried out at Gebeng, Pahang, Malaysia. A total of 14 sample locations were chosen, each with three replication stations. The Lichen Biodiversity Index (LBI) approach was employed in this study to estimate the degree of air pollution in Gebeng. This study also investigated three potential determinants of lichen biodiversity: carbon monoxide (CO) concentration, relative humidity (%), and vehicle motor frequency (per hour). The LBI was plotted and analysed using the Geographical Information System (GIS) programme ArcGIS 10.8.1, and the determining variables were identified using Pearson’s Correlation Coefficient software PAST 4.03. This study discovered a total of 11 lichen species known as metropolitan lichen. The average LBI across Gebeng is 19.5 (moderate alteration). In the industrial region, CO has an inversely significant relation with lichen biodiversity (r = −0.7433), relative humidity has a significant relation with lichen biodiversity (r = 0.8249), and vehicle motors are not significant as a determining factor for lichen biodiversity (r = 0.2068). This study demonstrates that lichen, with its diversity of species in one place, can be utilised to measure and quantify the degree of air pollution in industrial areas. In addition to that, in the context of an industrial city, vehicle motors do not have a significant impact on lichen biodiversity due to the existence of other pollutants sources from industrial activities. Relative humidity is a sign of clean air and humid surroundings, which is good for lichen growth; meanwhile, higher CO concentration will restrict the growth of sensitive-type lichen and will only allow the resistant type of lichen to grow.
1. Introduction
Air pollution is one of the most serious issues worldwide [1]. There are no regions of the earth where human-made substances cannot be discovered [2]. The quantity of these substances, as well as their application, is constantly expanding. Some are extremely persistent, with half-lives that can last decades. As a result, monitoring changes in environmental quality and status is critical to ensuring that humans are always aware of how much the environment is changing as a result of anthropogenic activity [3]. Biomonitoring is a field that bridges the gap between environmental monitoring and public health surveillance [4]. The use of organisms to assess environmental pollution, such as that of surrounding air or water, is known as biomonitoring. It can be accomplished qualitatively by seeing and noting changes in organisms, or quantitatively by detecting chemical build up in organism tissues [5].
Other than humans, numerous species of organisms are commonly utilised as biomonitors for air pollution, the most known of which being lichens [6]. Lichens are creatures that are the result of a symbiotic interaction between a fungus (mycobiont) and one or more photosynthetic partners, such as algae or cyanobacteria (photobiont) [7,8]. Furthermore, several lichen species have been linked to basidiomycete yeasts [9]. Lichens are good biomonitors for semi-volatile organic air pollutants, notably polyaromatic hydrocarbons (PAHs), because of their capacity to respond to air pollutants at varied levels, their slow growth rate, their longevity, and their ability to detect the presence and concentrations of these pollutants [10,11,12]. Lichens have been employed as biomonitors for air pollution in a variety of ways, including lichen biodiversity [13], lichen transplanting techniques [14], and lichen physiological changes [15].
Lichens are found all over the world under a range of environmental circumstances. According to Devkota et al. [16], lichens are the toughest and most resilient living creatures, able to thrive practically everywhere and in any situation, from sea level to high alpine heights, in a variety of weather circumstances, and on almost any surface. Lichens are plentiful in rain forests [17] and temperate woodlands, growing on bark, leaves, mosses, or other lichens and hanging from branches, “dwelling on thin air” [18]. They can be found on rocks, walls, gravestones, roofs, exposed soil surfaces, rubber, bones, and in soil as part of biological soil crusts [19]. Lichens have evolved to thrive in some of the most hostile settings on the planet, including arctic tundras [20], scorching dry deserts [21], rocky beaches [22], and poisonous slag heaps [23]. Lichens may even grow between the grains of solid rock. Lichen biodiversity is mostly determined by environmental elements such as water, air, nutrients, pH substrate, temperature, and light intensity [4]. Because of the differences in susceptibility to air contaminants, Brunialti et al. [24] propose that lichen biodiversity may be utilised as one of the approaches to evaluate air pollution. There are lichens that are susceptible to certain air pollutants such as sulphur and nitrogen, and lichens that are resistant and can thrive in polluted environments.
The fact that lichen biodiversity varies according to the quantity of air pollution in its surroundings makes lichen an ideal biomonitor for assessing air [25]. Furthermore, the widespread distribution and abundance of lichen in practically any environment makes it easier and more efficient to analyse the health of any ecosystem, including the urban ecology [26]. This study hypothesizes that the lichen diversity in industrial areas is affected by microclimatic factors such as humidity and temperature. According to Carillo et al. [27], lichens need multiple supports from their surrounding to survive. As a result, the aim of this research is to use lichen biodiversity to biomonitor air pollution in Malaysian industrial areas while also determining the determinant factor for its abundance. To achieve those aims, this study asks these following questions: (i) What are the lichen species that can be found in the industrial areas of Malaysia? (ii) What is the level of air pollution of industrial areas in Malaysia by using lichen biodiversity? and (iii) What is the determinant factor for lichen biodiversity in industrial areas of Malaysia?
2. Research Methodology
2.1. Area of Study
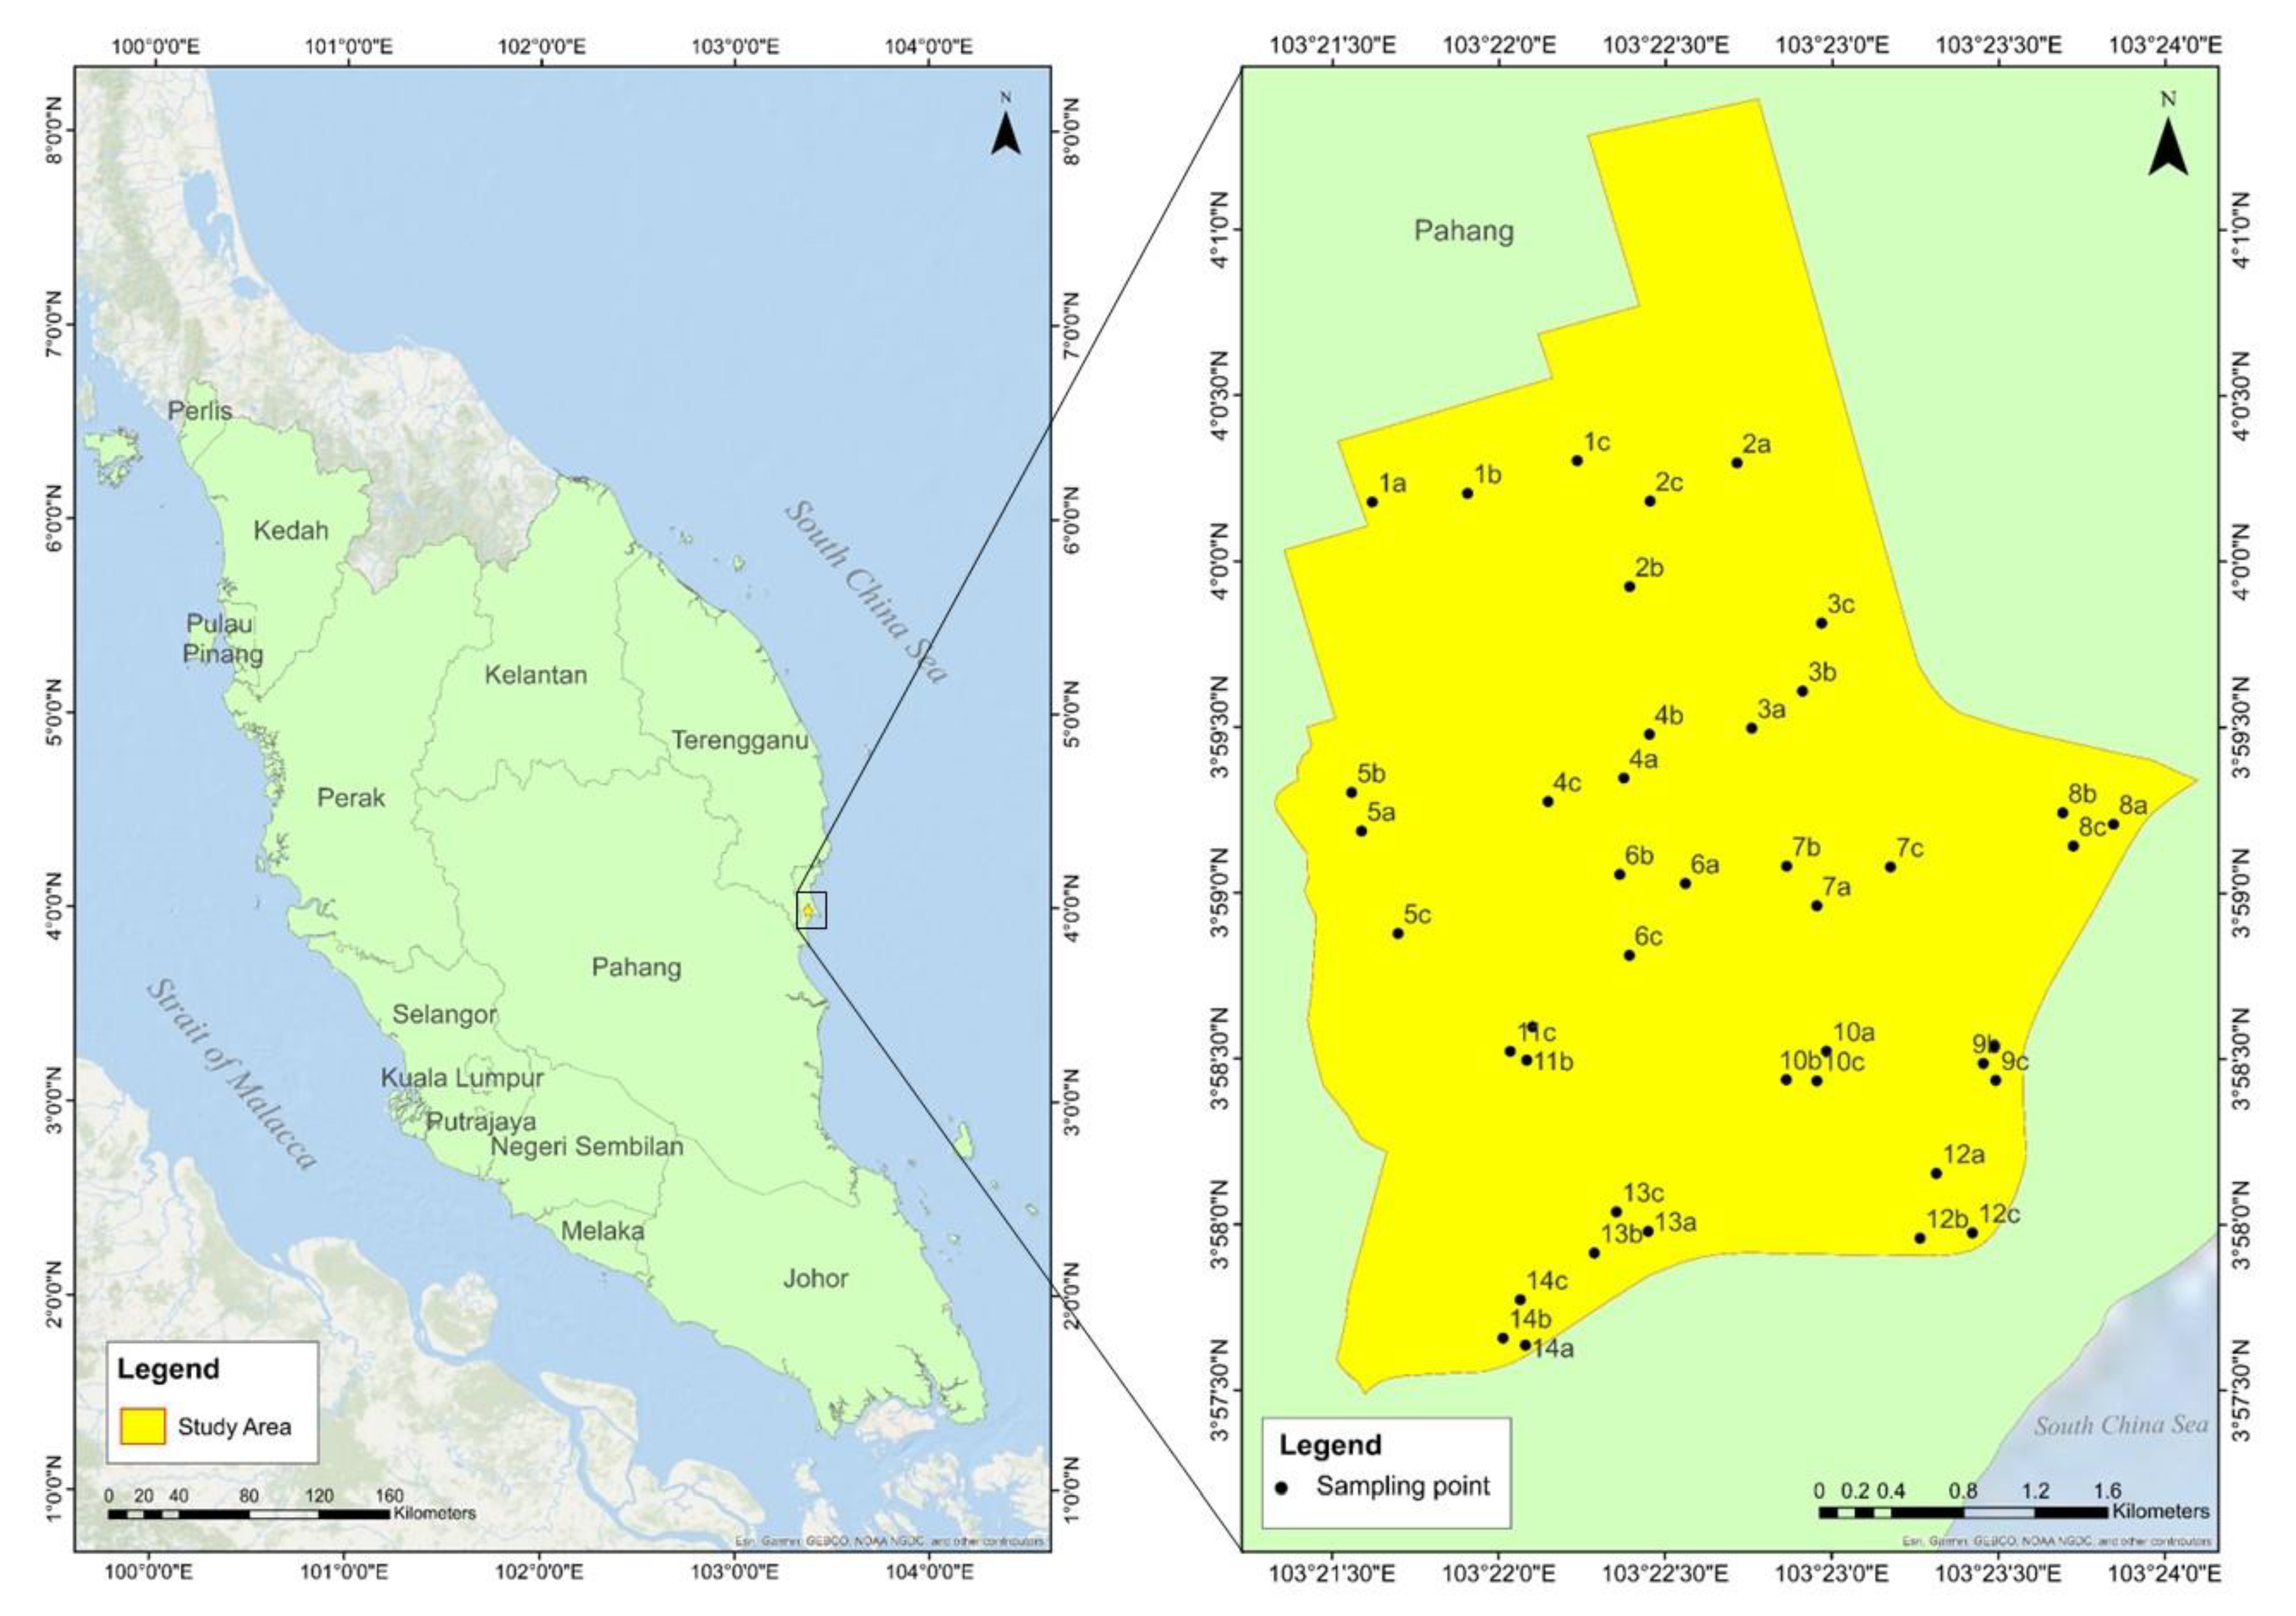
This research was carried out in the industrial city of Gebeng, Pahang, Malaysia. Gebeng is a small town and major industrial sector in the Malaysian state of Pahang. Gebeng is similarly close to the Kuantan port and seaside area, and its coordinates are 3°58′0″ N, 103°26′0″ E [28]. Gebeng has been developed into an industrial area since the 1970s, and numerous industries such as and consisting of small- and medium-scale industries, such as wood processing industries, metal works factories, concrete ducting company, petrochemical companies (Petronas, BP, Kaneka, and so on), and the most controversial industry—Lynas Advanced Materials Plant (Australian rare-earths mining company)—have been located here since then [29].
Gebeng’s yearly average temperature in 2021 is 32 °C at its highest and 23 °C at its lowest. The yearly precipitation totals are 274.01 mm, whereas the annual relative humidity average is 79%. According to Wahab et al. [28], the amount of air pollution in Gebeng in 2021 will be moderate, with PM2.5 concentrations 1.6 times the WHO annual air quality guideline value.
2.2. Lichen Sampling Procedure
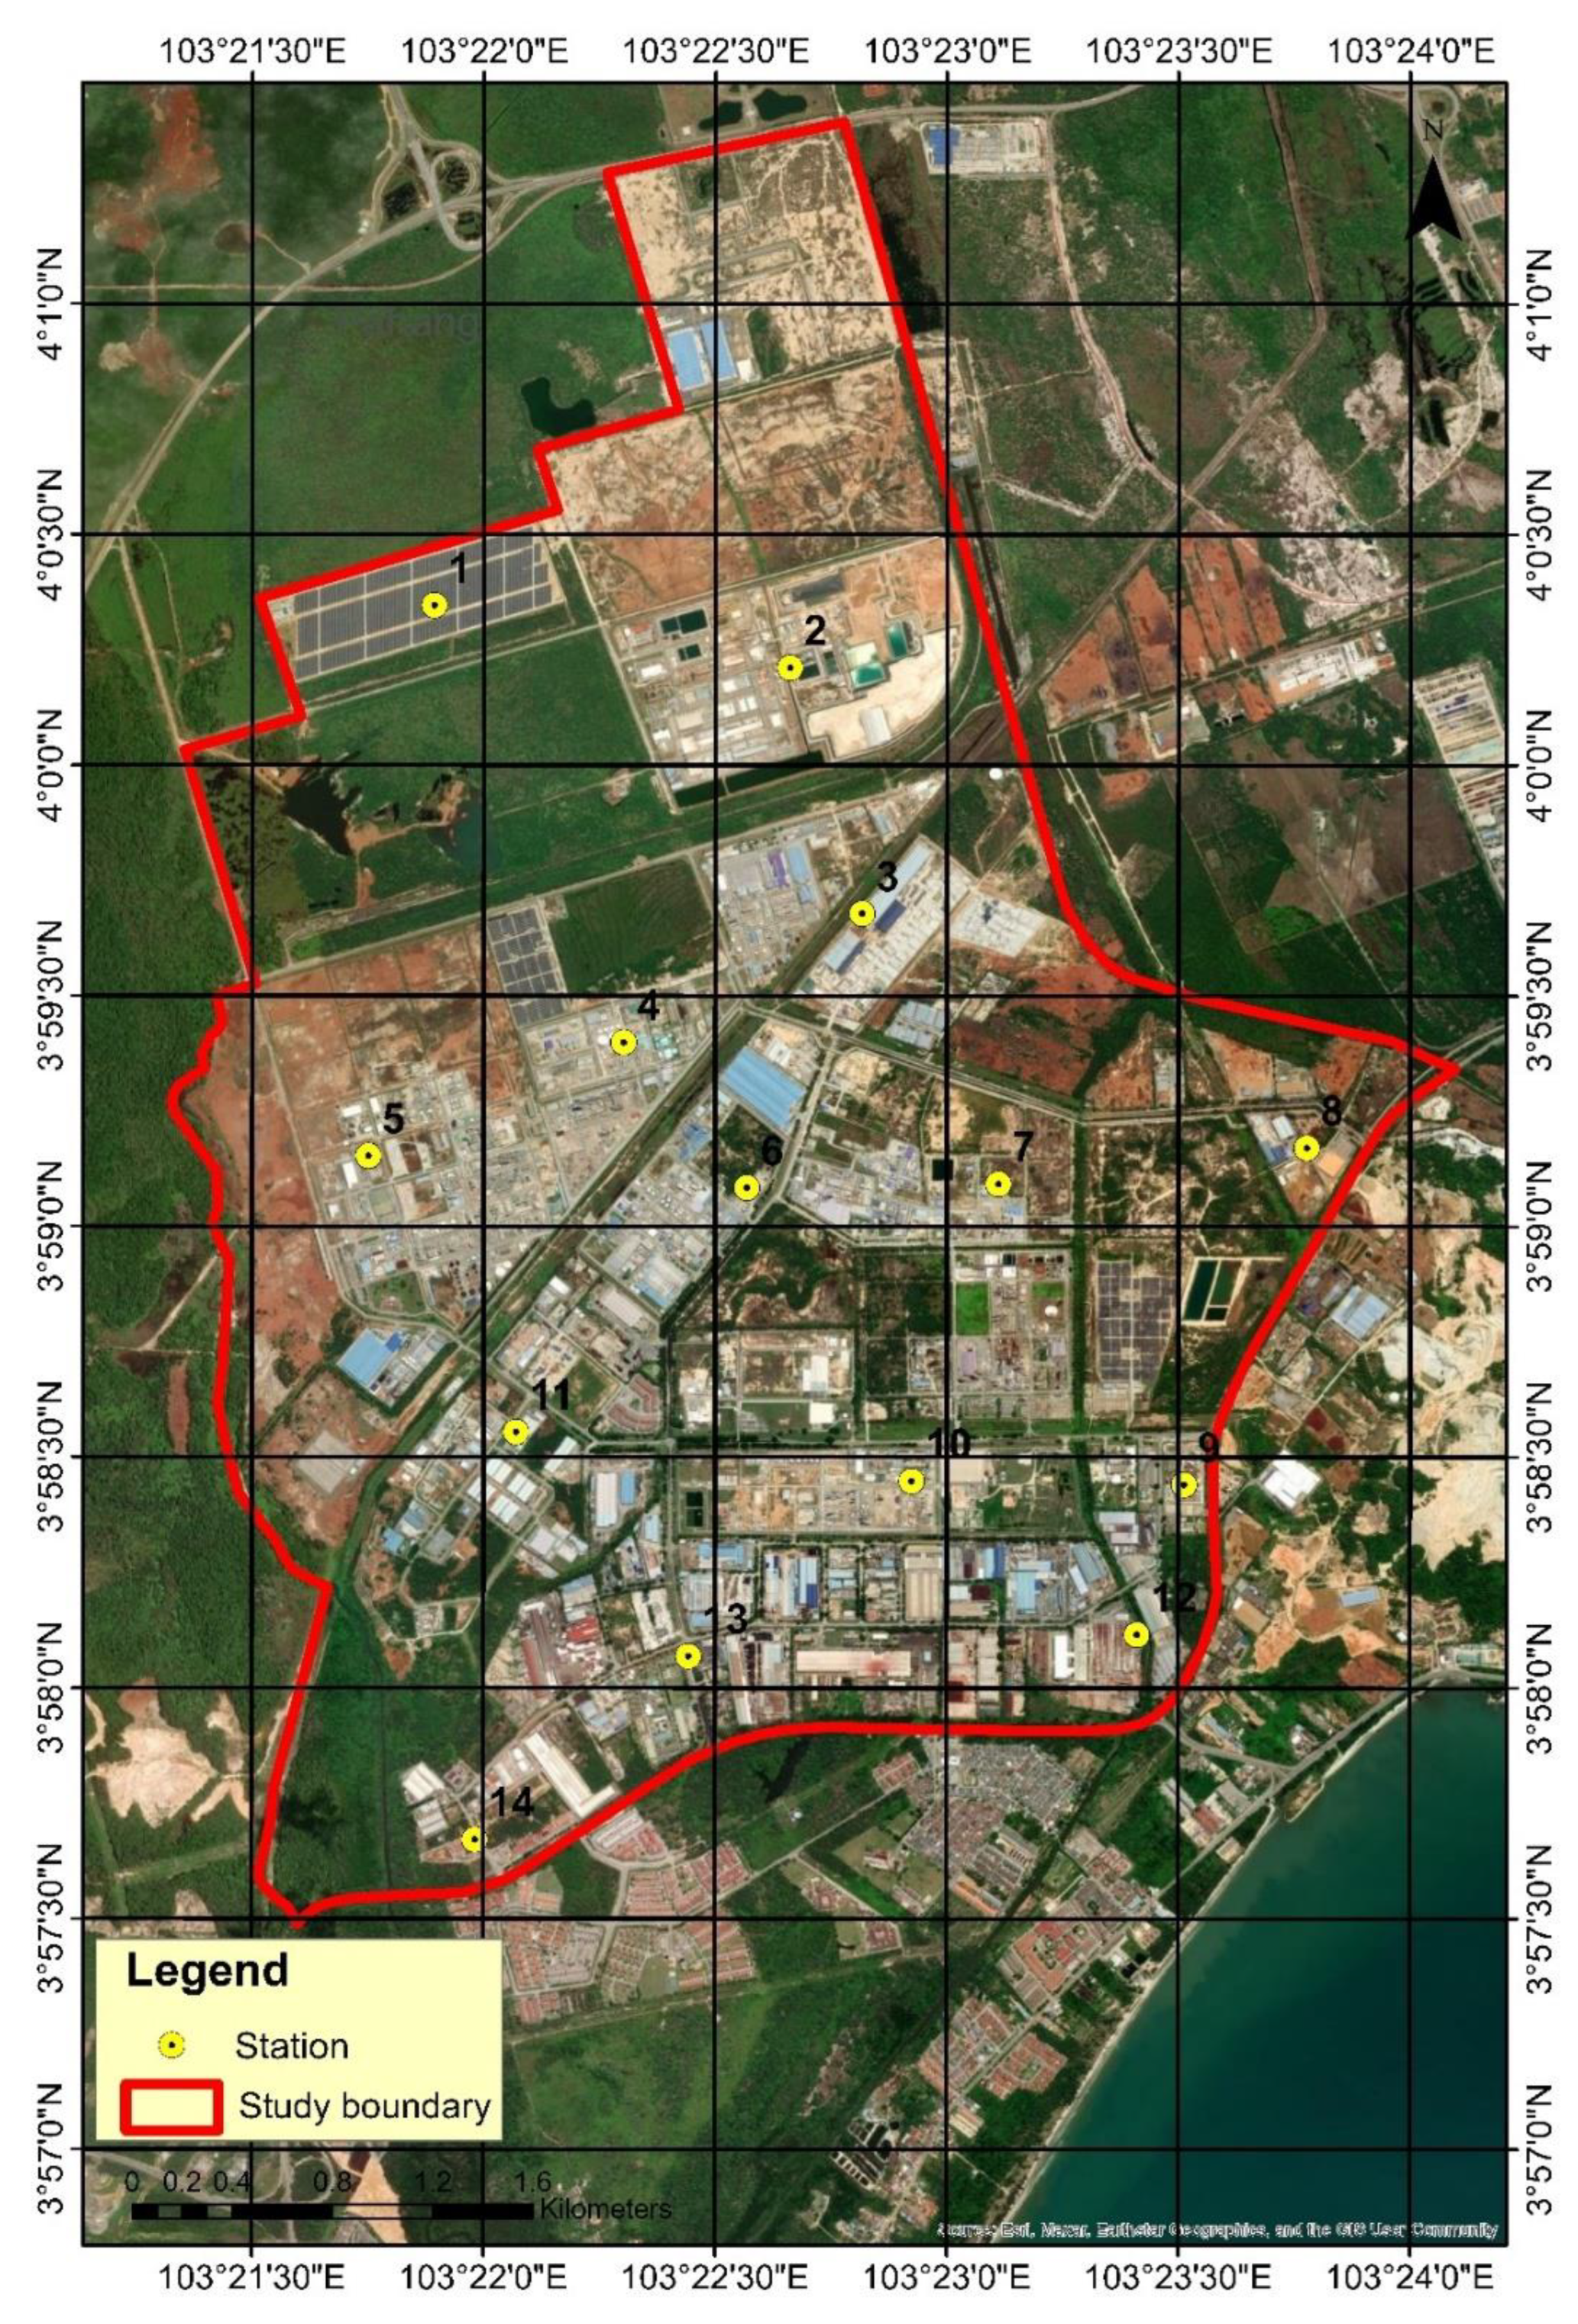
Lichens were collected from the Gebeng Industrial City Area (Table 1 and Figure 1). In total, 14 grids of 2 × 2 cm squares (Figure 2) were established to guarantee that the data obtained was distributed evenly over the Gebeng region. Purposive sampling was used to pick 14 sample locations from 14 square grids utilising a few criteria such as: (i) area with buildings or human activities, (ii) area with trees (diameter > 80 cm), and (iii) area with light penetration [10]. According to Pinho et al. [30], these characteristics are necessary and critical in order to biomonitor the amount of air pollution using lichen since lichens require light, substrate (for example, a tree), water, and nutrients in order to survive and develop. For each sampling site, 3 sampling locations were selected to replicate the sampling procedure and part of the quality assurance of the sampling procedure.
Lichen species and frequencies were sampled using a quadrat sampling size of 50 × 10 cm. The quadrat was put on the tree bark at a height of 100–200 cm above the ground in each of the four wind directions (north, south, east, and west). The chosen trees were planted within 100 metres of air pollution sources such as car motors, industrial buildings, and others [10].
2.3. Lichen Identification Procedure
Lichen samples were collected and taken to the National University of Malaysia (UKM) lab for identification [31]. Lichen identification was accomplished by examining lichen morphological features using stereoscopic and optical microscopes. The lobes, thallus, pycnidia, rhizines, ciliates, and apothecia of lichens were carefully examined. The acid (lichen’s secondary metabolites) was detected using a spot test in the medulla and brain [32]. All data obtained from both procedures (morphological observation and spot test) were documented and entered into the UKM Lichen Herbarium in Malaysia.
2.4. Lichen Biodiversity Index (LBI)
The Lichen Biodiversity Index (LBI) is a tool for measuring air pollution established by Cioffi [33] and improved by Abas and Awang [10] to adapt to tropical lichen diversity, especially tropical urban lichen. The LBI assesses the quantity and frequency of lichen species on a certain environment and converts the data into a condition. The LBI values recorded in each station were interpreted in terms of deviations from ‘natural’ conditions, using the scales of environmental naturality/alteration calibrated for trees in Kuala Lumpur, Malaysia, as follows: 0 = very high alteration 1–10 = high alteration, 11–20 = moderate alteration, 21–30 = low alteration/low naturality, 31–40 = moderate naturality, 41–50 = high naturality, and 51 and above = very high naturality (Table 2).
2.5. Relative Humidity Measurement
The quantity of moisture in the air is measured as relative humidity. It is stated as a percentage of the total quantity required to fully saturate the air at the same temperature. A digital hygrometer was used to record the relative humidity at each sample site [34]. A hygrometer is a device that measures the amount of water vapour in a room or space using various materials and measurements. The measurements were obtained three times at each sample point between 10 a.m. and 2 p.m.
2.6. Carbon Monoxide Concentration
The carbon monoxide concentration was recorded using the GC210 Portable Gas Detector. The sampling was conducted at each of the sampling sites between 10.00 a.m. to 2.00 p.m., as this the optimum period for carbon monoxide emission in an urban area in Malaysia [35].
2.7. Vehicle Motor Frequencies
A portable counter was used to count the frequencies of the vehicle motors. Sampling was done at each sampling site by standing along the roadside and recording all vehicle motors such as cars, motorbikes, trucks, and buses. The sampling lasted around 6 min, from 10 a.m. until 2 p.m. [36].
2.8. Data Analysis
The LBI data was captured and analysed using the Geographical Information System (GIS) interpolation analysis approach using the ArcGIS software version 10.8.1. The technique of constructing a surface based on values at isolated sample locations is known as interpolation analysis. Sample points are sites where data on a phenomenon is collected and geographical coordinates are recorded [31].
The Pearson’s Correlation Coefficient was used to examine the significant association between the LBI and other parameters such as relative humidity, CO content, and vehicle motor frequency. This test was performed using Past Software Version 4.03, where the significant value is p > 0.05 and the variable strength is considerably strong when 0.5 > r 1.0. [8].
3. Results
3.1. Lichen Species Distribution in Gebeng
Based on Table 3, this study has found 11 of lichen species where the most dominant species is Graphis scripta (found at 13 sites out of 14) and the lowest species distributed in Gebeng is Lecanora helva (found at 3 sites out of 14). The other species that has been found in Gebeng are Amandinea efflorescens, Chrysothrix xanthina, Dirinaria applanata, Dirinaria picta, Graphis librata, Lepraria usnica, Pheaographis brasiliensis, Pramotrema praesorediosum, Pyxine berteriana, and Pyxine cocoes.
3.2. Lichen Biodiversity Index (LBI) of Gebeng
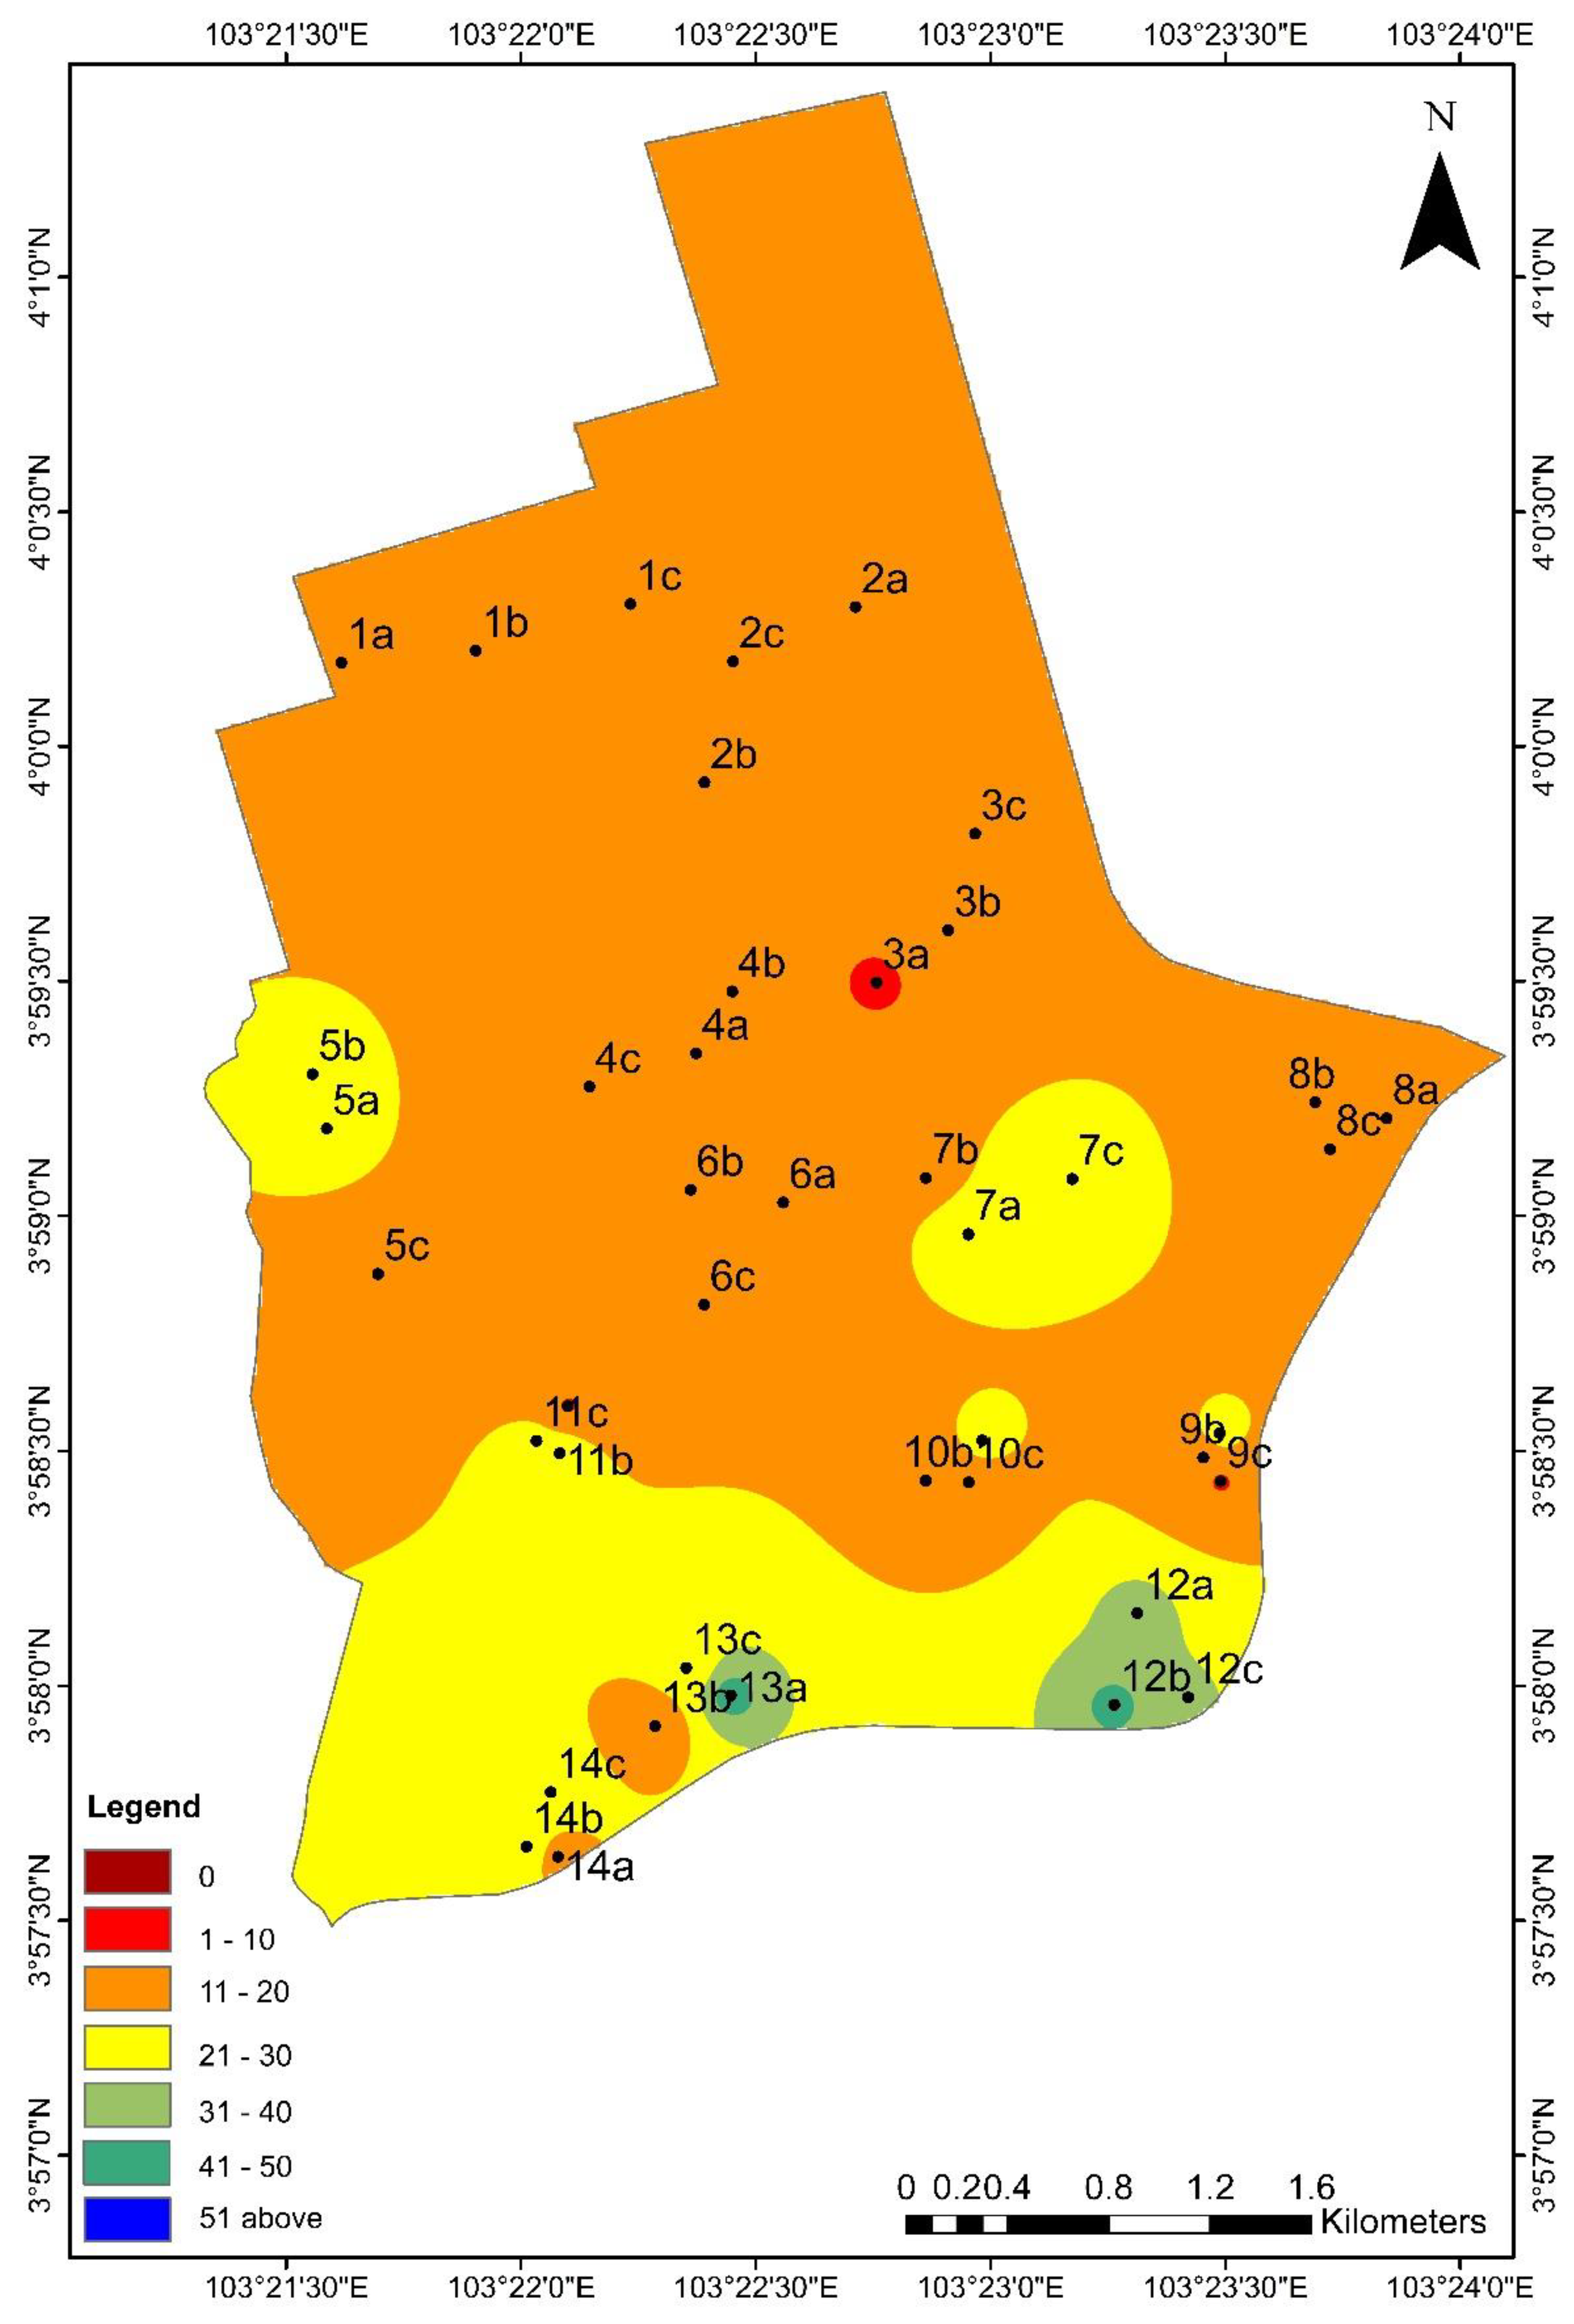
Table 4 shows that the lowest LBI value for Gebeng is 9.5 (sampling site no. 2) and the highest value is 45.5 (sampling site no. 13). The average LBI value for Gebeng is 20.51. Based on Figure 3, most areas in Gebeng are categorized as moderately low alteration (57.2%), followed by low alteration areas (28.6%), moderately high naturality area (7.1%), high naturality (4.8%), and the lowest being high alteration (2.3%).
3.3. Multiple Variable Measurement
Table 5 shows the data of multiple variables that has been measured alongside lichen diversity in Gebeng, Kuantan. Three variables have been measured and determined which are relative humidity (%), concentration on carbon monoxide (ug/m3), and vehicle motor frequency (per hour). In terms of relative humidity, the highest value was recorded at sampling sites no. 13 and no. 14 with 83%; meanwhile, the lowest value was recorded at sampling site no. 2 with 71%. On the other hand, for CO concentration, the highest concentration was recorded at sampling site no. 3 with 1633 ug/m3, and the lowest value was recorded at sampling site no. 14 with 317 ug/m3. The highest value for motor vehicles frequency was recorded at sampling sites no. 13 with 12, 164 motor vehicles per hour and the lowest value was recorded at sampling site no. 12 with 199 motor vehicles per hour.
3.4. Analysis of Relationship between Lichen Diversity and Multiple Factors
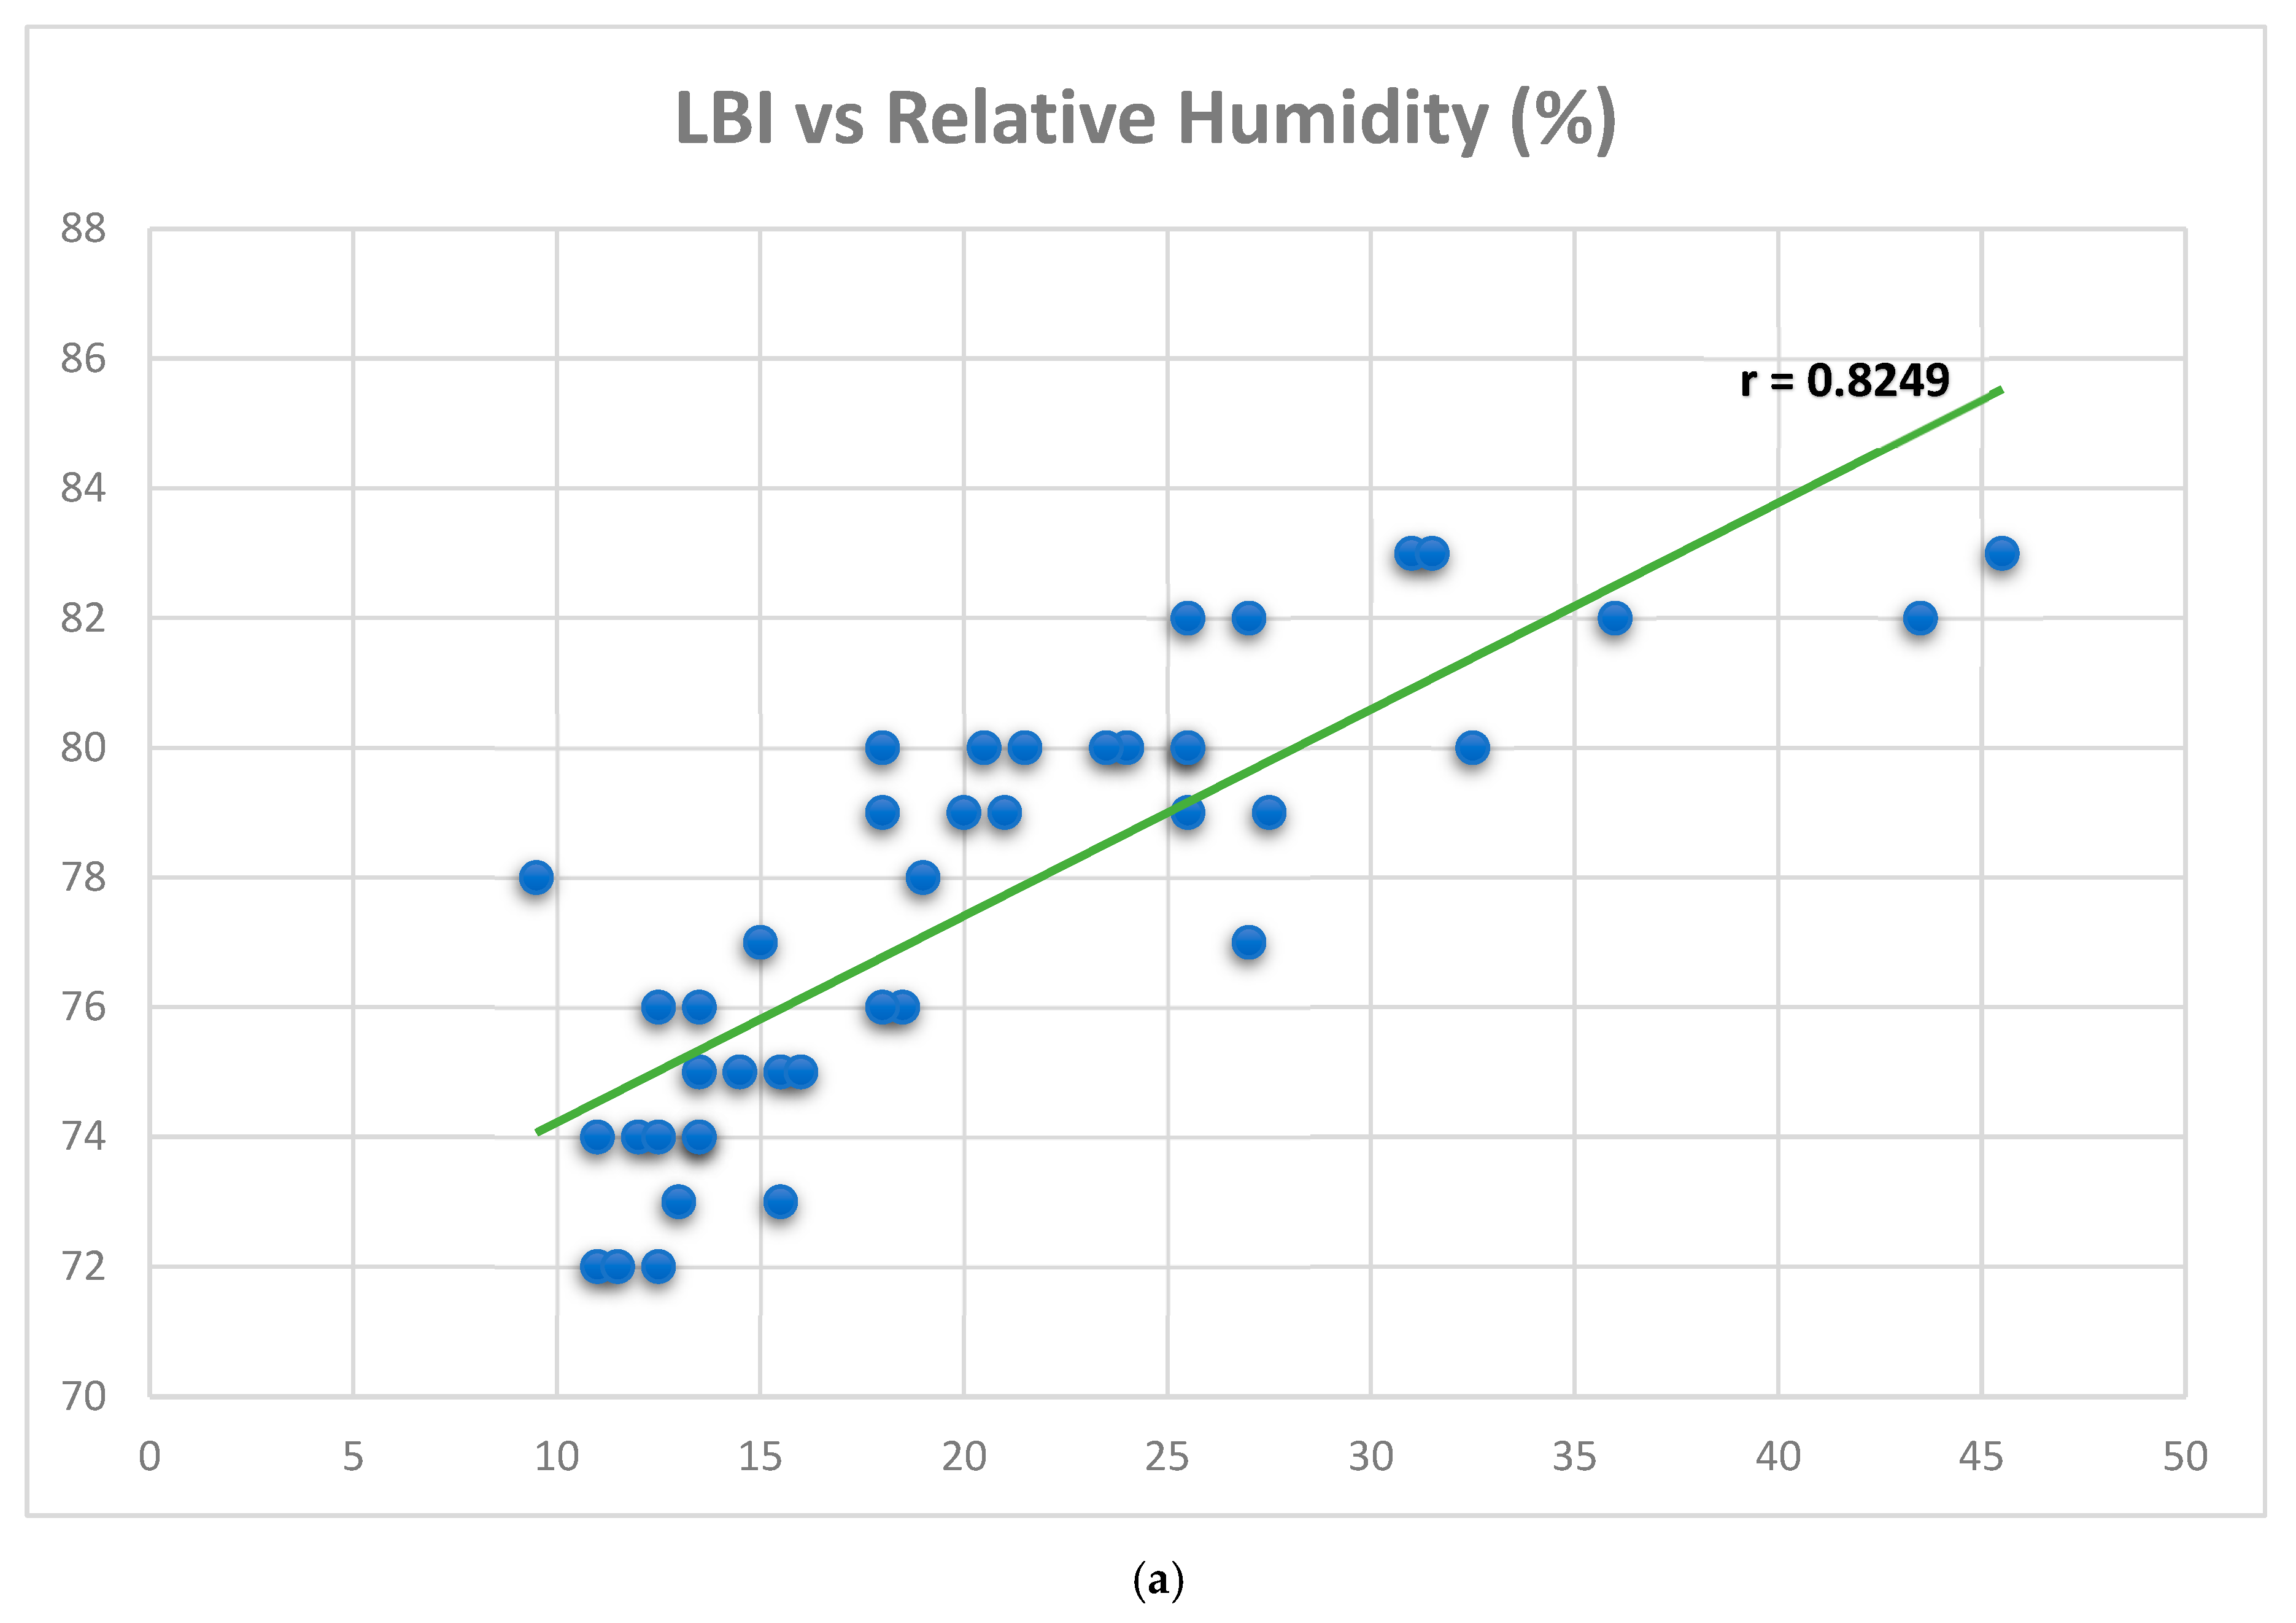
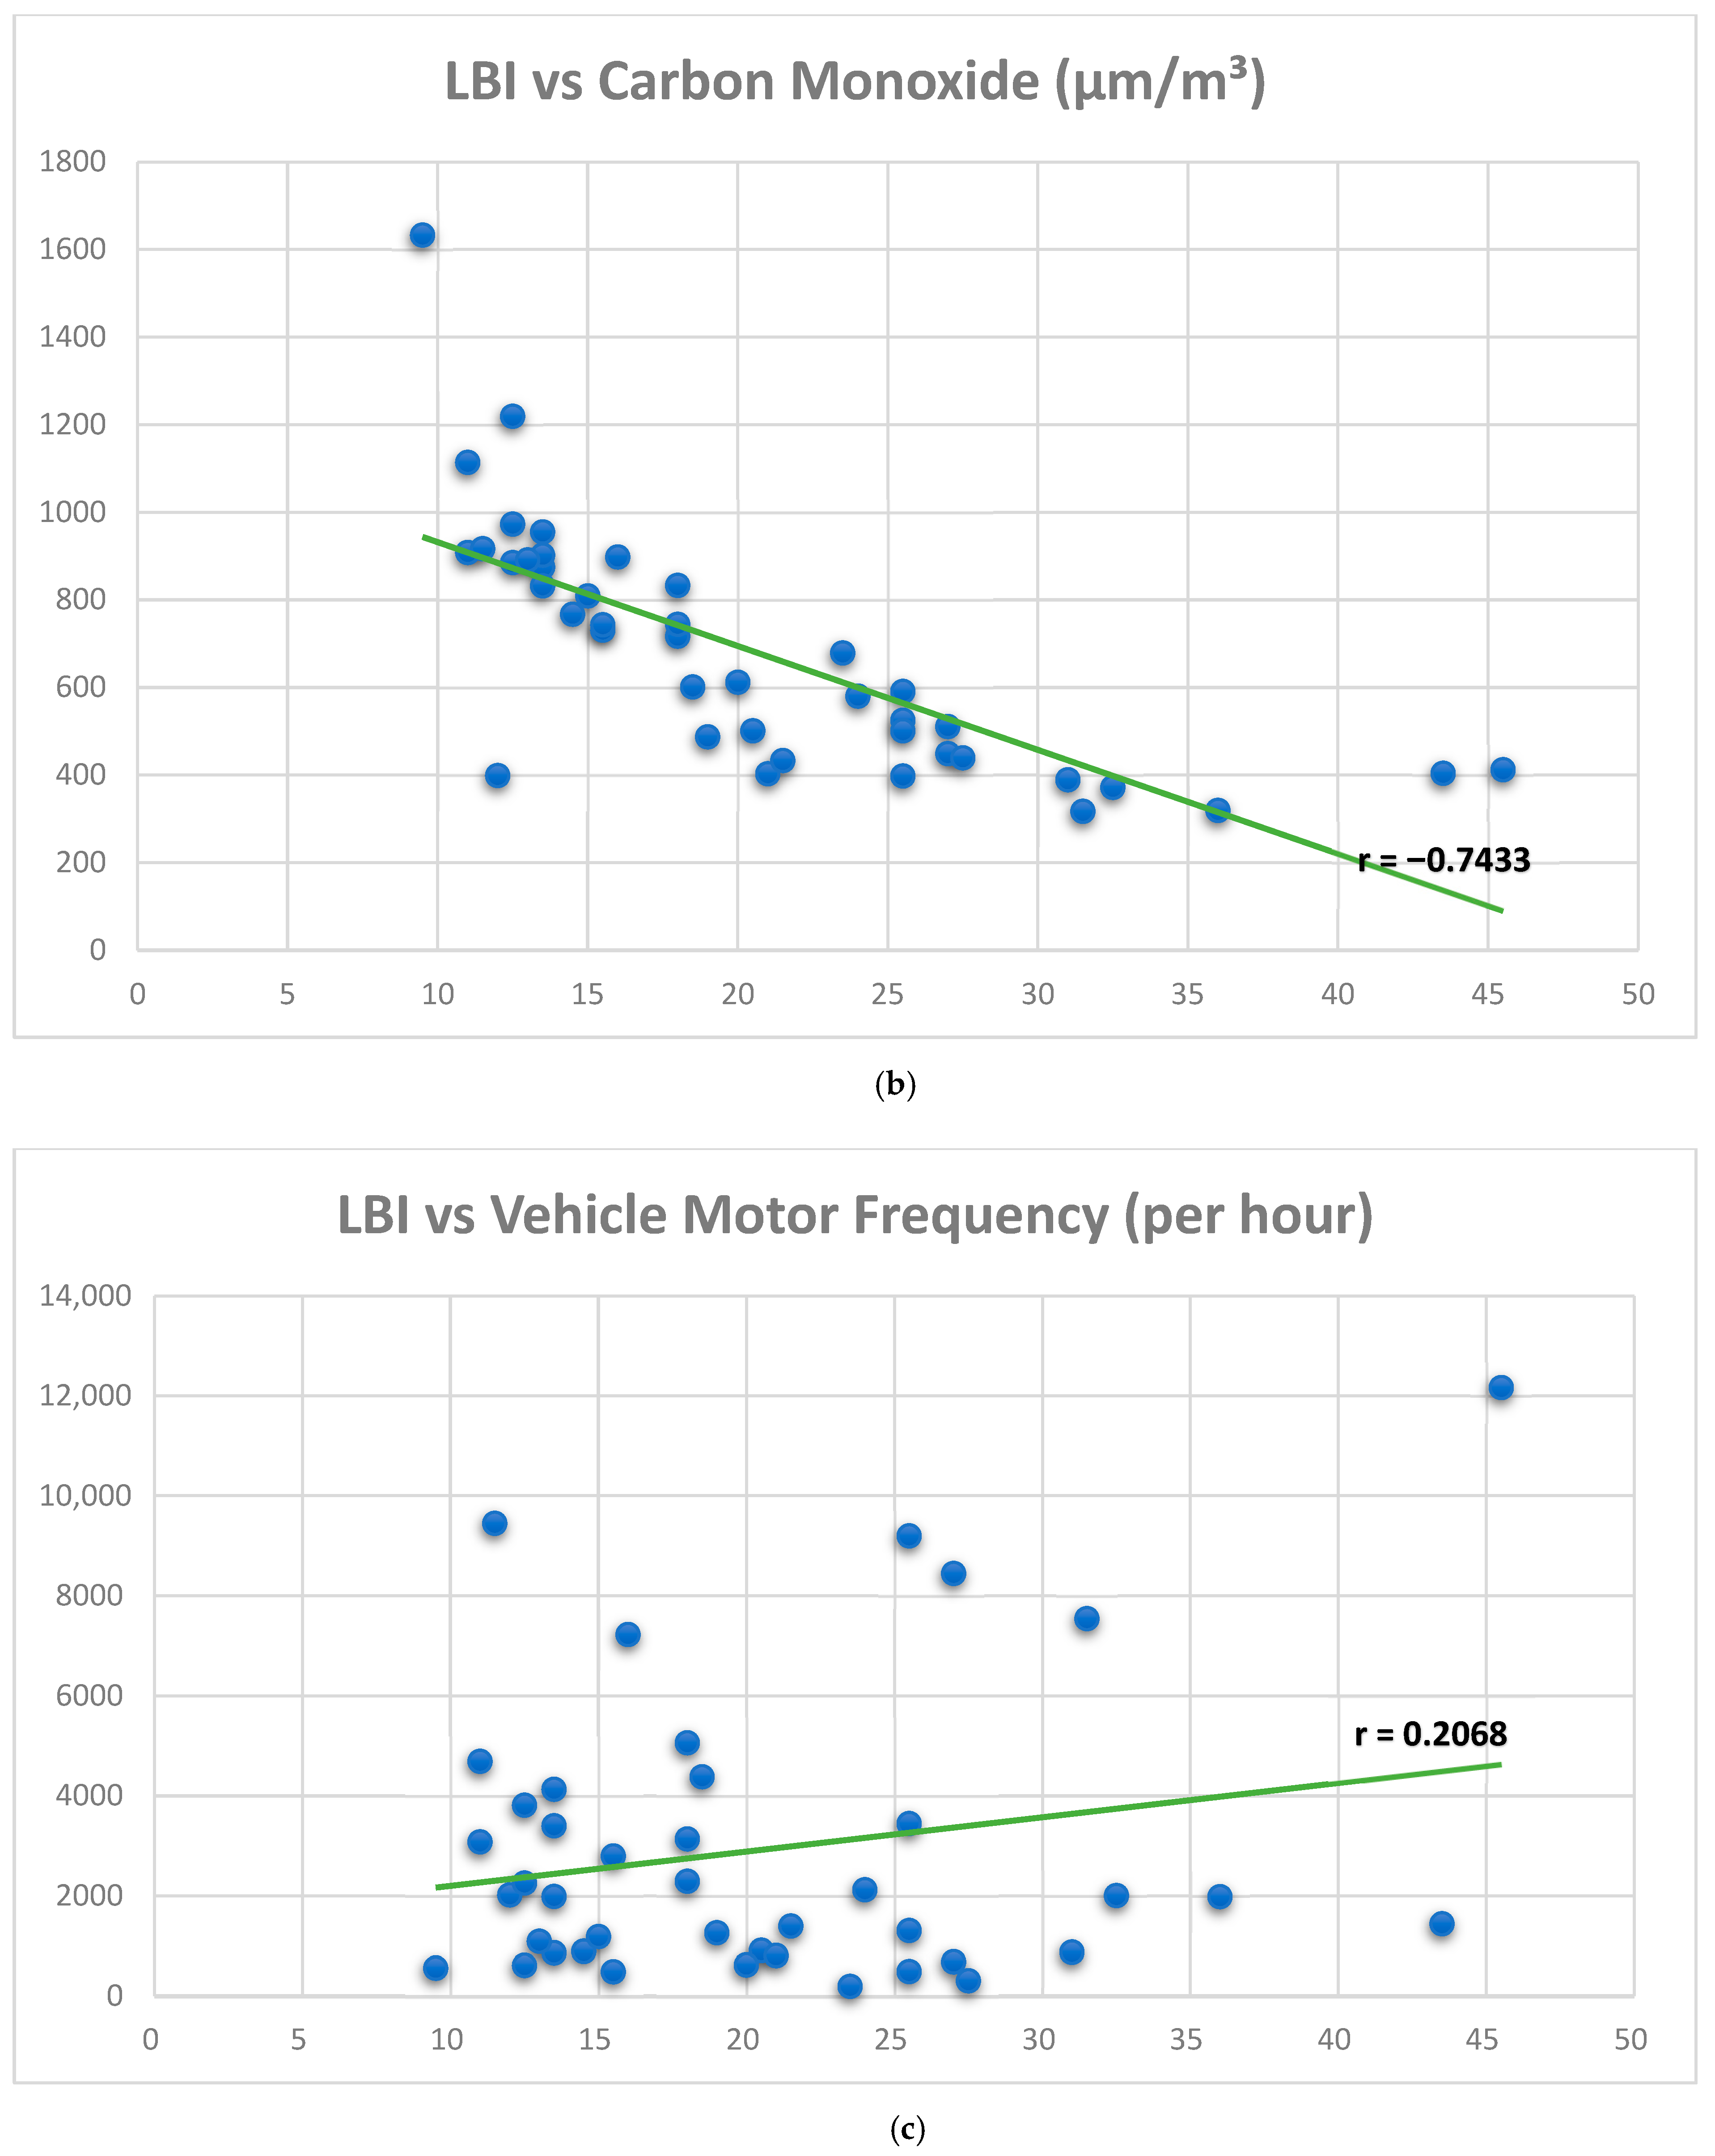
Figure 4a shows the relationship between the LBI value vs Relative Humidity where the r value recorded is 0.8249 (r > 0.5). This means that the relationship between LBI value vs Relative Humidity is significantly strong. Figure 4b shows the relationship between LBI value and CO concentration where the r value is −0.7433 (r > −0.5). This means that the relationship between the LBI value vs CO concentration is inversely strong. Lastly, Figure 4c shows the relationship between LBI value and motor vehicles frequency where the r value is 0.2068 (r < 0.5). This means that the relationship between LBI value and motor vehicles frequency is weak.
4. Discussion
Lichen species in urban areas are often less diverse than those in natural areas. Because of the tough conditions in metropolitan areas, the types of lichen species that may thrive there are quite limited. The urban region is noted for being a source of pollution and having a lack of green space. According to Monge-Nájera [19], the majority of lichen species that may develop and thrive in urban areas are classified as nitrophyte (nitrogen lover) and acidophyte (sulphur lover). More than 70% of the lichen species discovered in Gebeng are from the families Caliciaceae and Graphidaceae, including Dirinaria picta, Dirinaria applanata, Graphis scripta, Graphis librata, and others. This lichen species is recognised as a pollution resistance lichen because it can thrive in polluted conditions in metropolitan areas [10]. This study also discovered that no fruticose lichen grows in the Gebeng region, only crustose and foliose lichen. To thrive, fruticose lichen requires high humidity and clean air [37]. These are the total opposites of the circumstances in Gebeng.
The distribution of lichen diversity has historically been linked to the air quality of the surrounding region using several techniques, one of which is the lichen biodiversity index, or LBI [33]. According to this study, the average LBI score for the Gebeng region is 20.51, indicating fairly low change. Furthermore, more than half of the Gebeng region was classified similarly. As a result of their industrial and commercial operations, the majority of the Gebeng region may be classified as having low to moderate levels of pollution. However, based on the current growth pattern in the Gebeng area, this state may deteriorate from low to moderate levels of pollution [29]. According to Wahab et al. [28], the Kuantan City development plan, which includes Gebeng, shows that more over 30% of Kuantan City would be developed as an industrial district by 2025. As a result, Gebeng’s air quality was projected to improve.
This study assessed numerous factors that might impact the distribution of lichen variety, such as relative humidity, CO concentration, and vehicle motor frequency. The majority of high relative humidity sample sites are also surrounded by lush greenery, such as secondary forests, grass field areas, and so on. Furthermore, with less active traffic and wind movement, these conditions aid in boosting relative humidity in certain specific locations. According to Golkar et al. [38], relative humidity has a strong association with the vegetation in that location. This is due to the creation of oxygen from vegetative plants via photosynthesis, as well as plants such as trees and shrubs providing shade to the region, which aids in the prevention of water loss from the air via the evaporation process [39]. On the other hand, locations with a high concentration of CO are densely packed with industrial and commercial buildings, as well as asphalted roads. According to Mohd Shafie and Mahmud [40], the source of CO is cars, trucks, and other vehicles or apparatuses that use fossil fuels. Furthermore, CO may be created by domestic activities such as cooking, as well as industrial furnaces [41]. In terms of vehicle motor frequency, a large number has been reported in areas with asphalted roads and substantial human activity, such as commercialization and population settlements. According to Khan et al. [42], vehicle motors are more common in areas with strong road access and a centre for human activity.
This study also demonstrated that various variables have a major impact on lichen diversity. In this situation, the relative humidity and CO content of the environment have had a substantial impact on the lichen. High relative humidity percentages indicate that the surrounding air contains a lot of water. Furthermore, water has an important role in the growth of many lichen species, which require a lot of water to survive. In the instance of CO concentration, a high concentration of CO indicates that the air will become more acidic. As a result, lichen species that cannot thrive in acidic conditions, particularly fruticose and foliose lichen, will develop slower [43]. However, lichen diversity is not considerably influenced by the frequency of vehicle motors for a variety of reasons, including pollution from vehicle motors being blown away by wind movement and diluted by evaporated water in the surrounds. According to Leh et al. [44], even though vehicle motors emit a large amount of pollution into the atmosphere, variables such as wind movement and humidity can mitigate their impact.
5. Conclusions
This study indicates that lichen varieties may be utilised to biomonitor industrial air quality. This study also reveals that certain industrial factors, such as relative humidity and CO concentration, have a considerable impact on lichen diversity. This study discovered 11 lichen species in the Gebeng region, the majority of which are crustose-type lichens. Furthermore, the air quality in the Gebeng region is classified as fairly low change. This study also investigates the relationship between lichen diversity and other environmental variables such as relative humidity, CO concentration, and vehicle motor frequency, discovering that lichen diversity has a strong relationship with relative humidity and an inverse relationship with CO concentration. However, the relationship with vehicle motor frequency is weak.
This research faced several limitations such as, no control plot from non-industrial areas that can be compared with the current data from this study. Therefore, it is strongly recommended in the future to include the non-industrial area control plot in a related study. Second, this study only focuses on lichen species that were already identified and recorded in the herbarium. Therefore, in future studies, researchers may need to add a proper lichen identification technique to ensure all lichen species will be recorded.
This research advocates for improved planning in the Gebeng region to guarantee that air quality does not deteriorate. This study suggests a few actions that the local authority should take, such as (i) increasing the growth of vegetative plants, (ii) increasing the green space area, particularly in industrial areas, (iii) developing a systematic development plan, particularly in terms of expanding the industrial and commercialization areas, and (iv) implementing a green building initiative in the Gebeng area.
Author Contributions
Data curation, A.A. (Azlan Abas); Formal analysis, N.H.A.; Investigation, S.R.A.; Methodology, A.A. (Azlan Abas); Resources, A.A. (Azlan Abas); Software, N.H.A.; Writing—original draft, A.A. (Azlan Abas); Writing—review and editing, K.A. and A.A (Azahan Awang). All authors have read and agreed to the published version of the manuscript.
Funding
This research was funded by the Universiti Kebangsaan, Malaysia (No. SK-2022-015).
Institutional Review Board Statement
Not applicable.
Informed Consent Statement
Not applicable.
Data Availability Statement
Not applicable.
Acknowledgments
The authors would like to thank Rose Norman for her proofreading service and Universiti Kebangsaan Malaysia for providing facility for this study to be conducted.
Conflicts of Interest
The authors declare no conflict of interest.
References
- Landrigan, P.J.; Fuller, R. Global health and environmental pollution. Int. J. Public Health 2015, 60, 761–762. [Google Scholar] [CrossRef] [PubMed] [Green Version]
- Butnariu, M. Global Environmental Pollution Problems. Environ. Anal. Ecol. Stud. 2018, 1, 94–95. [Google Scholar] [CrossRef]
- Zaman, N.A.F.K.; Kanniah, K.D.; Kaskaoutis, D.G.; Latif, M.T. Evaluation of machine learning models for estimating PM2.5 concentrations across Malaysia. Appl. Sci. 2021, 11, 7326. [Google Scholar] [CrossRef]
- Abas, A. A systematic review on biomonitoring using lichen as the biological indicator: A decade of practices, progress and challenges. Ecol. Indic. 2021, 121, 107197. [Google Scholar] [CrossRef]
- Protano, C.; Owczarek, M.; Antonucci, A.; Guidotti, M.; Vitali, M. Assessing indoor air quality of school environments: Transplanted lichen Pseudovernia furfuracea as a new tool for biomonitoring and bioaccumulation. Environ. Monit. Assess. 2017, 189, 358. [Google Scholar] [CrossRef]
- Abas, A.; Khalid, R.M.; Rosandy, A.R.; Sulaiman, N. Lichens of Pulau Pangkor, Perak, Malaysia. Malays. For. 2019, 82, 59–66. [Google Scholar]
- Honegger, R. Developmental biology of lichens. New Phytol. 1993, 125, 659–677. [Google Scholar] [CrossRef]
- Abas, A.; Mazlan, S.M.; Latif, M.T.; Aiyub, K.; Muhammad, N.; Nadzir, M.S.M. Lichens reveal the quality of indoor air in Selangor, Malaysia. Ecol. Process. 2021, 10, 1–8. [Google Scholar] [CrossRef]
- Spribille, T.; Tuovinen, V.; Resl, P.; Vanderpool, D.; Wolinski, H.; Aime, M.C.; Schneider, K.; Stabentheiner, E.; Toome-Heller, M.; Thor, G.; et al. Basidiomycete yeasts in the cortex of ascomycete macrolichens. Science 2016, 353, 488–492. [Google Scholar] [CrossRef] [Green Version]
- Abas, A.; Awang, A. Air pollution assessment using lichen biodiversity index (LBI) in Kuala Lumpur, Malaysia. Poll. Res. 2017, 36, 242–249. [Google Scholar]
- Boonpeng, C.; Sriviboon, C.; Polyiam, W.; Sangiamdee, D.; Watthana, S.; Boonpragob, K. Assessing atmospheric pollution in a petrochemical industrial district using a lichen-air quality index (LiAQI). Ecol. Indic. 2018, 95, 589–594. [Google Scholar] [CrossRef]
- Abas, A.; Sulaiman, N.; Adnan, N.R.; Aziz, S.A.; Nawang, W.N.S.W. Using lichen (Dirinaria sp.) as bio-indicator for airborne heavy metal at selected industrial areas in Malaysia. Environment 2019, 12, 85–90. [Google Scholar]
- Boonpeng, C.; Polyiam, W.; Sriviboon, C.; Sangiamdee, D.; Watthana, S.; Nimis, P.; Boonpragob, K. Airborne trace elements near a petrochemical industrial complex in Thailand assessed by the lichen Parmotrema tinctorum (Despr. ex Nyl.) Hale. Environ. Sci. Pollut. Res. 2017, 24, 12393–12404. [Google Scholar] [CrossRef] [PubMed]
- Abas, A.; Aiyub, K.; Awang, A. Biomonitoring Potentially Toxic Elements (PTEs) Using Lichen Transplant Usnea misaminensis: A Case Study from Malaysia. Sustainability 2022, 14, 7254. [Google Scholar] [CrossRef]
- Matos, P.; Pinho, P.; Aragón, G.; Martínez, I.; Nunes, A.; Soares, A.M.V.M.; Branquinho, C. Lichen traits responding to aridity. J. Ecol. 2015, 103, 451–458. [Google Scholar] [CrossRef]
- Devkota, S.; Dymytrova, L.; Chaudhary, R.P.; Werth, S.; Scheidegger, C. Climate change-induced range shift of the endemic epiphytic lichen Lobaria pindarensis in the Hindu Kush Himalayan region. Lichenologist 2019, 51, 157–173. [Google Scholar] [CrossRef]
- Anthony, P.A.; Holtum, J.A.M.; Jackes, B.R. Shade acclimation of rainforest leaves to colonization by lichens. Funct. Ecol. 2022, 16, 808–816. [Google Scholar] [CrossRef]
- Ellis, C.J. Oceanic and temperate rainforest climates and their epiphyte indicators in Britain. Ecol. Indic. 2016, 70, 125–133. [Google Scholar] [CrossRef]
- Monge-Nájera, J. Relative humidity, temperature, substrate type, and height of terrestrial lichens in a tropical paramo. Rev. De Biol. Trop. 2019, 67, 206–212. [Google Scholar] [CrossRef]
- Lee, Y.M.; Kim, E.H.; Lee, H.K.; Hong, S.G. Biodiversity and physiological characteristics of Antarctic and Arctic lichens-associated bacteria. World J. Microbiol. Biotechnol. 2014, 30, 2711–2721. [Google Scholar] [CrossRef]
- Warren, R.J.; Casterline, S.; Goodman, M.; Kocher, M.; Zaluski, R.; Battaglia, J.H. Long-term lichen trends in a rust belt region. J. Urban Ecol. 2019, 5, juz011. [Google Scholar] [CrossRef]
- Fraser, R.H.; Pouliot, D.; van der Sluijs, J. UAV and High Resolution Satellite Mapping of Forage Lichen (Cladonia spp.) in a Rocky Canadian Shield Landscape. Can. J. Remote Sens. 2022, 48, 5–18. [Google Scholar] [CrossRef]
- Sueoka, Y.; Sakakibara, M.; Sera, K. Heavy metal behavior in lichen-mine waste interactions at an abandoned mine site in Southwest Japan. Metals 2015, 5, 1591–1608. [Google Scholar] [CrossRef]
- Brunialti, G.; Frati, L.; Calderisi, M.; Giorgolo, F.; Bagella, S.; Bertini, G.; Chianucci, F.; Fratini, R.; Gottardini, E.; Cutini, A. Epiphytic lichen diversity and sustainable forest management criteria and indicators: A multivariate and modelling approach in coppice forests of Italy. Ecol. Indic. 2020, 115, 106358. [Google Scholar] [CrossRef]
- Winkler, A.; Contardo, T.; Lapenta, V.; Sgamellotti, A.; Loppi, S. Assessing the impact of vehicular particulate matter on cultural heritage by magnetic biomonitoring at Villa Farnesina in Rome, Italy. Sci. Total Environ. 2022, 823, 153729. [Google Scholar] [CrossRef]
- Rosli, N.S.; Zulkifly, S. Application of Index of Atmospheric Purity (IAP) along elevation gradients in Gunung Jerai, Kedah, Malaysia. Environ. Monit. Assess. 2022, 194, 1–10. [Google Scholar] [CrossRef]
- Carrillo, W.; Calva, J.; Benítez, Á. The Use of Bryophytes, Lichens and Bromeliads for Evaluating Air and Water Pollution in an Andean City. Forests 2022, 13, 1607. [Google Scholar] [CrossRef]
- Wahab, S.U.K.A.; Samah, M.A.A.; Sabuti, A.A.; Yunus, K.; Chowdhury, A.J.K.; John, A.; Hamid, A.A.A. Environmental forensic study: Tracing of pollution sources using environmetric technique in balok and tunggak rivers near gebeng industrial area, Kuantan, Pahang, Malaysia. Desalin. Water Treat. 2020, 191, 118–125. [Google Scholar] [CrossRef]
- Zakaria, M.H.; Mustapha, I.; Amran, M.; Hassan, S.; Ikbar, A.W.M.; Bakar, F.A.A. Case study of environmental impact analysis (EIA) exercise on the development of gebeng wind farm Pahang, Malaysia. J. Adv. Res. Dyn. Control. Syst. 2020, 12, 1859–1865. [Google Scholar] [CrossRef]
- Pinho, P.; Augusto, S.; Branquinho, C.; Bio, A.; Pereira, M.J.; Soares, A.; Catarino, F. Mapping lichen diversity as a first step for air quality assessment. J. Atmos. Chem. 2004, 49, 377–389. [Google Scholar] [CrossRef]
- Abas, A.; Awang, A.; Aiyub, K. Analysis of heavy metal concentration using transplanted lichen Usnea misaminensis at Kota Kinabalu, Sabah (Malaysia). Appl. Ecol. Environ. Res. 2020, 18, 1175–1182. [Google Scholar] [CrossRef]
- Brodo, I.M. Microchemical Methods for the Identification of Lichens. Bryologist 2003, 106, 345. [Google Scholar] [CrossRef]
- Cioffi, M. Air quality monitoring with the lichen biodiversity index (LBI) in the district of Faenza (Italy). EQA Int. J. Environ. Qual. 2009, 1, 1–6. [Google Scholar]
- Lee, S.W.; Choi, B.I.; Woo, S.B.; Kim, J.C.; Kim, Y.G. Development of a low-temperature low-pressure humidity chamber for calibration of radiosonde humidity sensors. Metrologia 2019, 56, 025009. [Google Scholar] [CrossRef]
- Razli, S.A.; Abas, A.; Ismail, A.; Othman, M.; Mohtar, A.A.A.; Baharudin, N.H.; Latif, M.T. Epiphytic microalgae as biological indicators for carbon monoxide concentrations in different areas of Peninsular Malaysia. Environ. Forensics 2020, 23, 314–323. [Google Scholar] [CrossRef]
- Zulaini, A.A.M.; Muhammad, N.; Asman, S.; Hashim, N.H.; Jusoh, S.; Abas, A.; Din, L. Evaluation of transplanted lichens, Parmotrema Tinctorum and Usnea diffracta as bioindicator on heavy metals accumulation in southern Peninsular Malaysia. J. Sustain. Sci. Manag. 2019, 14, 1–13. [Google Scholar]
- Notov, A.A. Fruticose lichens: Structural diversity, taxonomic characteristics and evolution. Wulfenia 2014, 21, 21–31. [Google Scholar]
- Golkar, F.; Al-Wardy, M.; Saffari, S.F.; Al-Aufi, K.; Al-Rawas, G. Using OCO-2 satellite data for investigating the variability of atmospheric CO2 concentration in relationship with precipitation, relative humidity, and vegetation over Oman. Water 2020, 12, 101. [Google Scholar] [CrossRef] [Green Version]
- Battisti, L.; Pomatto, E.; Larcher, F. Assessment and mapping green areas ecosystem services and socio-demographic characteristics in Turin Neighborhoods (Italy). Forests 2020, 11, 25. [Google Scholar] [CrossRef] [Green Version]
- Mohd Shafie, S.H.; Mahmud, M. Urban air pollutant from motor vehicle emissions in kuala lumpur, malaysia. Aerosol. Air Qual. Res. 2020, 20, 2793–2804. [Google Scholar] [CrossRef]
- Zheng, B.; Chevallier, F.; Ciais, P.; Yin, Y.; Deeter, M.N.; Worden, H.M.; He, K. Rapid decline in carbon monoxide emissions and export from East Asia between years 2005 and 2016. Environ. Res. Lett. 2018, 13, 044007. [Google Scholar] [CrossRef] [Green Version]
- Khan, J.; Ketzel, M.; Kakosimos, K.; Sørensen, M.; Jensen, S.S. Road traffic air and noise pollution exposure assessment—A review of tools and techniques. Sci. Total Environ. 2018, 634, 661–676. [Google Scholar] [CrossRef] [PubMed]
- Root, H.T.; Jovan, S.; Fenn, M.; Amacher, M.; Hall, J.; Shaw, J.D. Lichen bioindicators of nitrogen and sulfur deposition in dry forests of Utah and New Mexico, USA. Ecol. Indic. 2021, 127, 107727. [Google Scholar] [CrossRef]
- Leh, O.L.H.; Marzukhi, M.A.; Kwong, Q.J.; Mabahwi, N.A. Impact of urban land uses and activities on the ambient air quality in Klang Valley, Malaysia from 2014 to 2020. Plan. Malays. 2020, 18, 239–258. [Google Scholar] [CrossRef]
Figure 1.
Map of Study Area. (a—sampling replicate no. 1; b—sampling replicate no. 2; c—sampling replicate no. 3).
Figure 1.
Map of Study Area. (a—sampling replicate no. 1; b—sampling replicate no. 2; c—sampling replicate no. 3).

Figure 2.
Map of Sampling Site in Gebeng, Kuantan. Source: ArcGIS Software Version 10.8.1.

Figure 3.
Lichen Biodiversity Index Mapping at Gebeng, Kuantan. a, b and c in Figure 3 are the sampling replicate for each sampling plot which have 3 replication each.
Figure 3.
Lichen Biodiversity Index Mapping at Gebeng, Kuantan. a, b and c in Figure 3 are the sampling replicate for each sampling plot which have 3 replication each.

Figure 4.
(a) Relationship between LBI Value vs. Relative Humidity. (b) Relationship between LBI Value vs. CO Concentration. (c) Relationship between LBI Value vs. Vehicle Motor Frequency.
Figure 4.
(a) Relationship between LBI Value vs. Relative Humidity. (b) Relationship between LBI Value vs. CO Concentration. (c) Relationship between LBI Value vs. Vehicle Motor Frequency.


Table 1.
Coordinates of Sampling Sites.
| Sampling Site | Name of Location | Coordinate |
|---|---|---|
| 1 | RE Gebeng Sdn. Bhd. | 4.0029637° N 103.3636357° E |
| 4.0036229° N 103.3658488° E | ||
| 4.0050440° N 103.3705615° E | ||
| 2 | Lynas Malaysia | 4.0049390° N 103.3785562° E |
| 3.9987167° N 103.3731907° E | ||
| 3.9992495° N 103.3729715° E | ||
| 3 | CSWIND Malaysia Sdn. Bhd. | 3.9912251° N 103.3787365° E |
| 3.9937249° N 103.3751424° E | ||
| 3.9962357° N 103.3743924° E | ||
| 4 | Petronas Gas Berhad Utilities Gebeng | 3.9921141° N 103.3757083° E |
| 3.9922202° N 103.3756801° E | ||
| 3.9923616° N 103.3756061° E | ||
| 5 | Basf Petronas Chemical Sdn. Bhd. | 3.9864222° N 103.3597773° E |
| 3.9882875° N 103.3591614° E | ||
| 3.9812758° N 103.3616049° E | ||
| 6 | Kaneka Malaysia | 3.9834756° N 103.3761391° E |
| 3.9842863° N 103.3774886° E | ||
| 3.9762636° N 103.3490307° E | ||
| 7 | Eastman Chemical (Malaysia) Sdn. Bhd. | 3.9826786° N 103.3825614° E |
| 3.9829572° N 103.3826941° E | ||
| 3.9826608° N 103.3825764° E | ||
| 8 | Tiong Nam Warehouse | 3.9878838° N 103.3952623° E |
| 3.9879514° N 103.3965504° E | ||
| 3.9878952° N 103.3957176° E | ||
| 9 | Wilmar Kuantan Edible Oils Sdn. Bhd. | 3.9746450° N 103.3930330° E |
| 3.9747594° N 103.3908987° E | ||
| 3.9757413° N 103.3905413° E | ||
| 10 | Petronas Chemicals MTBE Sdn. Bhd. | 3.9748818° N 103.3844654° E |
| 3.9717461° N 103.3785602° E | ||
| 3.9693463° N 103.3817782° E | ||
| 11 | Rwana Engineering Sdn. Bhd. | 3.9767816° N 103.3689227° E |
| 3.9748667° N 103.3676778° E | ||
| 3.9719629° N 103.3682534° E | ||
| 12 | Mieco Manufacturing Sdn. Bhd. | 3.9690814° N 103.3775131° E |
| 3.9691168° N 103.3777595° E | ||
| 3.9690459° N 103.3778725° E | ||
| 13 | Kuantan Industrial Training Institute | 3.9646958° N 103.3747102° E |
| 3.9659955° N 103.374883° E | ||
| 3.9700012° N 103.3734090° E | ||
| 14 | Medan Selera Gebeng | 3.9604182° N 103.3692908° E |
| 3.9606573° N 103.3676818° E | ||
| 3.9630870° N 103.3682286° E |
Table 2.
Lichen Biodiversity Index (LBI).
| Colour | LBI | Condition |
|---|---|---|
| 0 | Very High Alteration | |
| 1–10 | High Alteration | |
| 11–20 | Moderately High Alteration | |
| 21–30 | Low Alteration | |
| 31–40 | Moderately High Naturality | |
| 41–50 | High Naturality | |
| 51 and above | Very High Naturality |
Table 3.
List of Species Found at each Sampling Site.
| Lichen Species | Sampling Site | |||||||||||||
|---|---|---|---|---|---|---|---|---|---|---|---|---|---|---|
| 1 | 2 | 3 | 4 | 5 | 6 | 7 | 8 | 9 | 10 | 11 | 12 | 13 | 14 | |
| Amandinea efflorescens | / | / | / | / | / | / | / | |||||||
| Chrysothrix xanthina | / | / | / | / | / | / | / | / | ||||||
| Dirinaria applanata | / | / | / | / | / | / | / | |||||||
| Dirinaria picta | / | / | / | / | / | / | / | / | / | / | ||||
| Graphis librata | / | / | / | / | / | / | / | / | / | |||||
| Graphis scripta | / | / | / | / | / | / | / | / | / | / | / | / | / | |
| Lecanora helva | / | / | / | |||||||||||
| Lepraria usnica | / | / | / | / | / | / | / | |||||||
| Pheaographis brasiliensis | / | / | / | / | / | / | / | / | ||||||
| Pramotrema praesorediosum | / | / | / | / | / | / | / | / | ||||||
| Pyxine berteriana | / | / | / | / | / | / | ||||||||
| Pyxine cocoes | / | / | / | / | / | / | / | |||||||
Table 4.
LBI Value for each Sampling Site.
| Sampling Site | Name of Location | LBI |
|---|---|---|
| 1 | RE Gebeng Sdn. Bhd. | 19 |
| 13.5 | ||
| 13.5 | ||
| 2 | Lynas Malaysia | 12 |
| 20.5 | ||
| 12.5 | ||
| 3 | CSWIND Malaysia Sdn. Bhd. | 9.5 |
| 21 | ||
| 14.5 | ||
| 4 | Petronas Gas Berhad Utilities Gebeng | 13.5 |
| 18.5 | ||
| 12.5 | ||
| 5 | Basf Petronas Chemical Sdn. Bhd. | 24 |
| 25.5 | ||
| 18 | ||
| 6 | Kaneka Malaysia | 18 |
| 15 | ||
| 21.5 | ||
| 7 | Eastman Chemical (Malaysia) Sdn. Bhd. | 25.5 |
| 20 | ||
| 31 | ||
| 8 | Tiong Nam Warehouse | 18 |
| 13.5 | ||
| 15.5 | ||
| 9 | Wilmar Kuantan Edible Oils Sdn. Bhd. | 27 |
| 12.5 | ||
| 11 | ||
| 10 | Petronas Chemicals MTBE Sdn. Bhd. | 25.5 |
| 15.5 | ||
| 13 | ||
| 11 | Rwana Engineering Sdn. Bhd. | 11 |
| 27.5 | ||
| 23.5 | ||
| 12 | Mieco Manufacturing Sdn. Bhd. | 36 |
| 43.5 | ||
| 32.5 | ||
| 13 | Kuantan Industrial Training Institute | 45.5 |
| 11.5 | ||
| 25.5 | ||
| 14 | Medan Selera Gebeng | 16 |
| 31.5 | ||
| 27 |
Table 5.
Level of Relative Humidity, CO, and Vehicle Motor frequency in Gebeng, Kuantan.
| Sampling Site | Relative Humidity (%) | CO (ug/m3) | Vehicle Motor Frequency (per Hour) |
|---|---|---|---|
| 1 | 78 | 487 | 1263 |
| 76 | 875 | 1988 | |
| 74 | 902 | 864 | |
| 2 | 74 | 399 | 2017 |
| 80 | 501 | 914 | |
| 71 | 1219 | 616 | |
| 3 | 78 | 1633 | 559 |
| 79 | 403 | 810 | |
| 75 | 767 | 897 | |
| 4 | 75 | 832 | 4132 |
| 76 | 601 | 4382 | |
| 74 | 973 | 3814 | |
| 5 | 80 | 580 | 2122 |
| 82 | 591 | 3448 | |
| 80 | 717 | 3139 | |
| 6 | 79 | 833 | 5059 |
| 77 | 809 | 1188 | |
| 80 | 433 | 1398 | |
| 7 | 79 | 398 | 492 |
| 79 | 612 | 622 | |
| 83 | 389 | 877 | |
| 8 | 76 | 744 | 2291 |
| 74 | 955 | 3400 | |
| 75 | 731 | 2798 | |
| 9 | 77 | 449 | 8448 |
| 76 | 885 | 2255 | |
| 72 | 1114 | 4689 | |
| 10 | 80 | 525 | 1309 |
| 73 | 743 | 488 | |
| 73 | 891 | 1092 | |
| 11 | 74 | 908 | 3081 |
| 79 | 439 | 311 | |
| 80 | 679 | 199 | |
| 12 | 82 | 319 | 1983 |
| 82 | 404 | 1443 | |
| 80 | 372 | 2005 | |
| 13 | 83 | 412 | 12164 |
| 72 | 917 | 9451 | |
| 80 | 501 | 9198 | |
| 14 | 75 | 898 | 7227 |
| 83 | 317 | 7543 | |
| 82 | 511 | 687 |
Publisher’s Note: MDPI stays neutral with regard to jurisdictional claims in published maps and institutional affiliations. |
© 2022 by the authors. Licensee MDPI, Basel, Switzerland. This article is an open access article distributed under the terms and conditions of the Creative Commons Attribution (CC BY) license (https://creativecommons.org/licenses/by/4.0/).
Share and Cite
MDPI and ACS Style
Abas, A.; Asnawi, N.H.; Aiyub, K.; Awang, A.; Abdullah, S.R. Lichen Biodiversity Index (LBI) for the Assessment of Air Quality in an Industrial City in Pahang, Malaysia. Atmosphere 2022, 13, 1905. https://doi.org/10.3390/atmos13111905
AMA Style
Abas A, Asnawi NH, Aiyub K, Awang A, Abdullah SR. Lichen Biodiversity Index (LBI) for the Assessment of Air Quality in an Industrial City in Pahang, Malaysia. Atmosphere. 2022; 13(11):1905. https://doi.org/10.3390/atmos13111905
Chicago/Turabian StyleAbas, Azlan, Nur Hakimah Asnawi, Kadaruddin Aiyub, Azahan Awang, and Siti Rodziah Abdullah. 2022. "Lichen Biodiversity Index (LBI) for the Assessment of Air Quality in an Industrial City in Pahang, Malaysia" Atmosphere 13, no. 11: 1905. https://doi.org/10.3390/atmos13111905
Note that from the first issue of 2016, this journal uses article numbers instead of page numbers. See further details here.