
Comparison of Particle Sizers and Counters with Soot-like, Salt, and Silver Particles

Joint Research Centre (JRC), European Commission, 21027 Ispra, Italy
*
Author to whom correspondence should be addressed.
Atmosphere 2022, 13(10), 1675; https://doi.org/10.3390/atmos13101675
Submission received: 23 August 2022
/
Revised: 2 October 2022
/
Accepted: 11 October 2022
/
Published: 13 October 2022
(This article belongs to the Special Issue Feature Papers in Air Quality)
Abstract
:Vehicle emission regulations in Europe and many Asian countries include a particle number limit. The number concentration is measured, typically, with condensation particle counters (CPCs). For research purposes, the size distributions provide useful information. Scanning mobility particle sizers (SMPSs) accurately provide the size distribution but are not suitable for transient aerosol. Engine (fast) exhaust particle sizers (EEPSs) cover this gap, but with less accuracy. Fast size distribution instruments are commonly used in the research and development of engines. In the last few years, instrument algorithms have been improved, but studies assessing the improvements are limited, in particular in their lower size range, around 10–20 nm, and for soot-like aerosol. In this paper, we compared the three instruments using salt, silver, diffusion flame soot (CAST), and spark discharge graphite particles. Moreover, vehicle exhaust number concentration measurements with EEPSs over a seven-year period were presented. In terms of particle concentration, EEPS overestimated, on average, 25% compared to CPC, in agreement with previous studies. Its accuracy for mean particle size determination was better than 5 nm compared to SMPS. The agreement between the instruments was satisfactory but the uncertainty increased at low concentrations and larger particle sizes, showing that there is still room for further improvements. Experimental challenges, such as low concentration levels of modern vehicles, losses in the diluters, use of photometric mode by the CPCs, and the material impact, are also discussed.
1. Introduction
Air pollution, especially particulate matter (PM), is responsible for negative environmental and health impacts [1]. Vehicle regulations in Europe have had limits for PM mass since the 1990s for diesel vehicles [2]. Many research projects measured the mass distributions [3,4]. The implementation of diesel particulate filters (DPFs) at the tailpipe of vehicles rendered the mass method unsuitable for accurate determination of the emissions [5]. European regulations introduced the particle number (PN) method and many other Asian countries followed [6,7,8]. PN measurements are also conducted in the aviation field [9] and are under discussion for brakes from vehicles [6]. The PN concentration is determined with a condensation particle counter (CPC) [10,11]. The lower size is around 23 nm in order to include the smallest soot particles but avoid any volatile nucleation mode particles. In the aviation field, the lower size is 10 nm. Such decisions were based mainly on size distribution measurements. The most used and studied system is the scanning mobility particle sizer (SMPS), which is based on charging of particles, electrical classification, and subsequent measurement with a CPC [12,13,14]. SMPS determines, with high accuracy, the particle size distribution but, in some cases, high differences are reported between SMPS, which are attributed to the CPCs used, the charging efficiency of the neutralizers, and the diffusion losses, depending on the flowrates used [15,16]. Due to the slow time resolution (around 2 min) of the SMPS, measurements are only possible for constant conditions or speeds. Instruments that provide real-time size distributions are the electrical low-pressure impactor (ELPI) (Dekati Ltd., Kangasala, Finland) [17], the differential mobility sizer (DMS) (DMS500, Cambustion Ltd., Cambridge, UK) [18], and the engine exhaust particle sizer (EEPS) (model 3090, TSI Inc., Shoreview, MN, USA) [19]. Vehicle or aircraft exhaust, indoor or outdoor ambient air, or workplace environment measurements with such instruments are very common [20,21,22,23]. Many studies, however, raised concerns regarding the accuracy of such instruments measuring aerosol with not-well-defined properties, such as from vehicles or ambient air [24,25,26,27].
Even though the vehicle emission levels have decreased over the last few years, such instruments remain necessary for research and development, e.g., for the optimization of the combustion process, the assessment of cold start, regeneration, or different fuels [28,29,30,31,32,33,34,35]. For regulatory purposes, size distribution measurements are necessary for determining the lowest size that needs to be measured. For example, for diesel vehicles, 23 nm was considered the appropriate size, i.e., the smallest primary soot spherule [36]. Many studies, however, found particles below 23 nm for gasoline direct injection (GDI), port-fuel injection (PFI) vehicles, motorcycles, compressed natural gas (CNG) vehicles, and even diesel vehicle (e.g., urea particles) [37,38,39,40]. Furthermore, determination of the technical requirements of the instruments for on-road testing, i.e., portable emission measurement systems (PEMSs), needs an appropriate size range due to its impact to measurement uncertainty and, thus, on the definition of conformity factors [41]. Similar discussions take place also for the specifications of the recently introduced periodical technical inspection (PTI) sensors [42].
The assessment of such real-time size distribution instruments, in particular with soot particles, is limited [43]. There are many practical difficulties. For example, the emission levels of modern vehicles are very low, the size distributions do not necessarily remain constant, and there is not an appropriate reliable reference instrument or even material. Consequently, most input comes from studies in the field of ambient air measurements or personal exposure in workplaces [44,45]. Very often, the calibration material of these instruments is performed with salt, silver, or emery oil and the impact on measurements of soot particles is not well studied. There is a lack of studies with materials relevant to vehicle exhaust and, most importantly, in the relevant size range (10–50 nm) for vehicles or aircrafts.
The aim of this study is two-fold; to compare particle number concentrations measured by SMPS and EEPS to a CPC and to examine the preciseness of EEPS to determine the mean size of particles compared to SMPS. For this scope, different materials, concentrations, and sizes are used, with special emphasis on small sizes and soot-like materials. The laboratory measurements are compared with the literature and in-house data from vehicles collected over a time span of seven years. The results of this study can be used to put into perspective studies that use the abovementioned instruments.
2. Materials and Methods
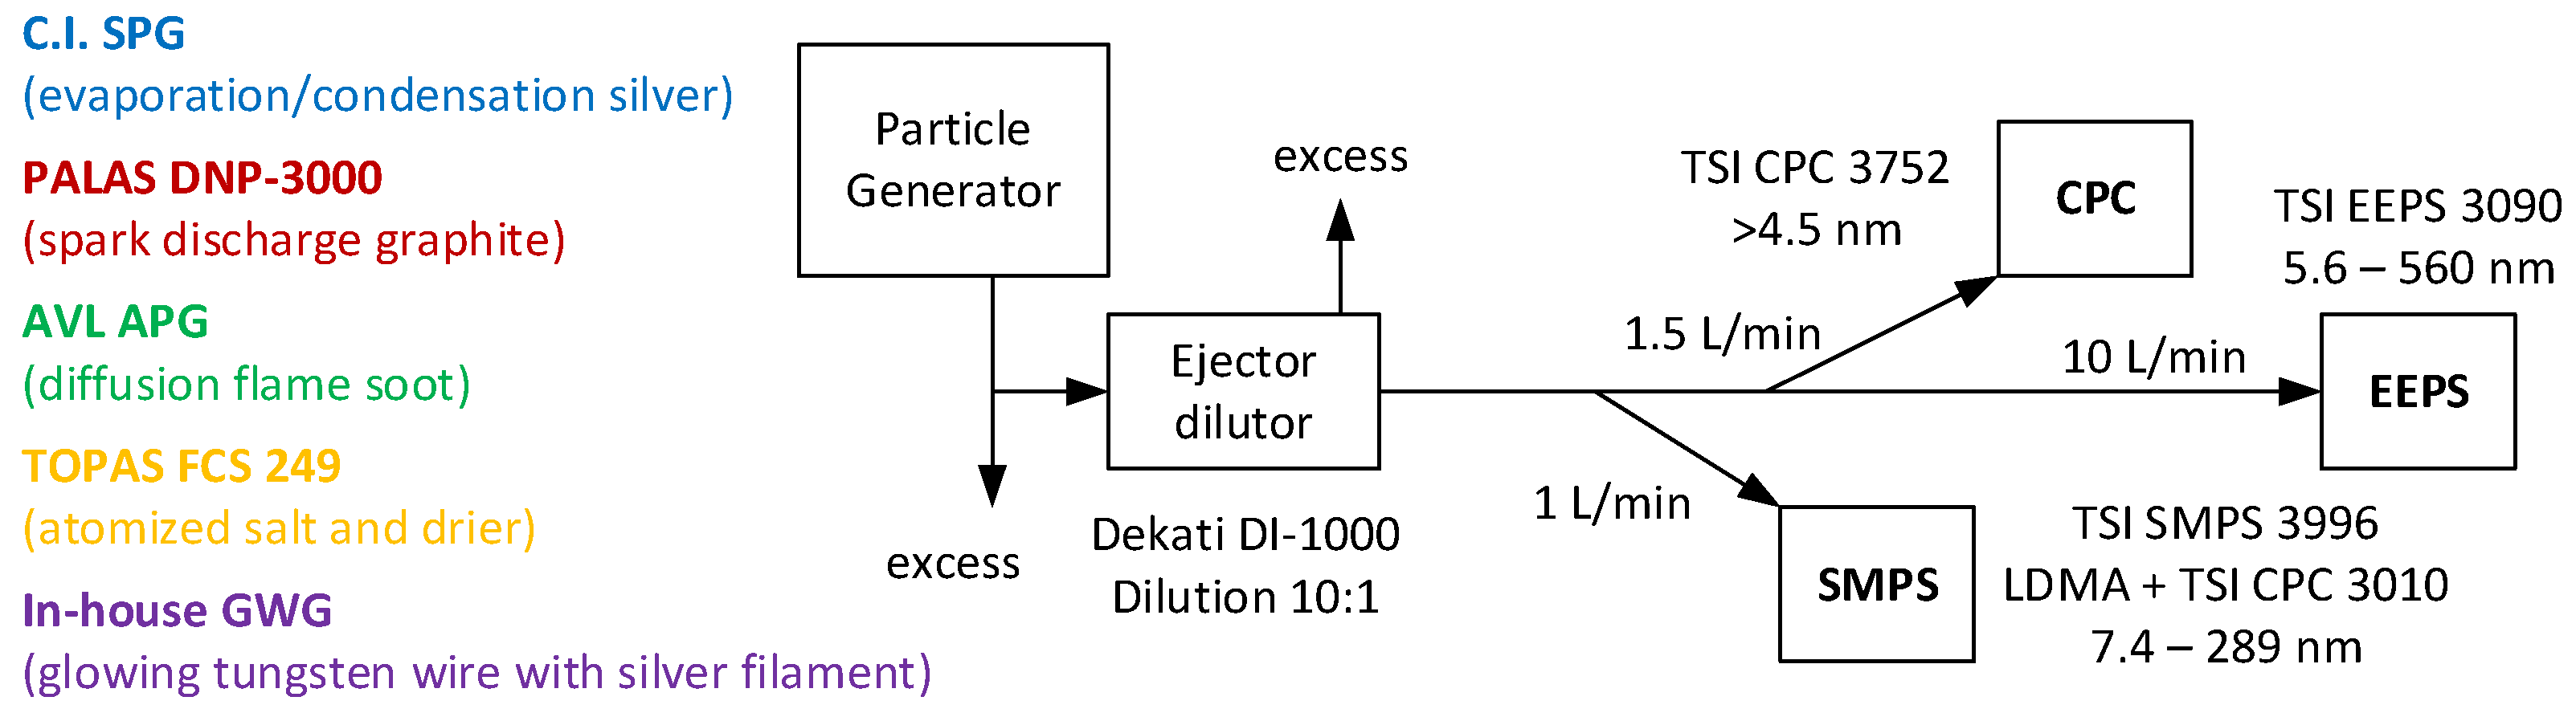
The schematic setup is plotted in Figure 1. Various particle generators for salt, silver, soot, and graphite were used with various settings to cover a wide range of particle types and sizes. An ejector diluter, DI-1000 from Dekati [46], was used to reduce the particle concentration and provide enough flow and identical conditions to the measurement instruments (CPC, SMPS, EEPS), independent from the generator and the settings. Thus, all results are comparable. The diluter was based on the Venturi principle: pressurized air through an orifice creates underpressure that sucks a sample from the generators, which subsequently is mixed with the air. The instruments sampled the flow needed, while the excess was vented from the ejector diluter. Furthermore, ejector diluters have negligible impact on the size and losses of particles in the examined range in our study, i.e., 10–200 nm [46]. The lengths of the electrically conductive tubes to the instruments were chosen to provide similar diffusion losses [47]. Details of the generators and instruments follow.
2.1. Particle Generators
The selection of the particle generators was based on the current requirements of vehicle exhaust regulations: (i) soot-like particles are prescribed in the calibration of the PN instruments for type approval, in-service conformity, market surveillance, and periodical technical inspection (PTI); (ii) salt particles are used for the on-field calibration of PTI instruments; (iii) other materials (e.g., silver) can be used if they prove equivalency.
2.1.1. Salt Generator
The field calibration system (FCS 249, Topas GmbH, Dresden, Germany) generates salt particles in an atomizer, dries them in a tube with silica gel, and optionally dilutes them. An isotonic saline solution with 0.9 wt%. NaCl, purchased from pharmacy, was used in the atomizer. The air overpressure can be adjusted to achieve different concentrations. In our study it was set to 1.4 bar, producing the maximum concentration. The geometric mean diameter (GMD) of the produced size distribution was around 60 nm.
2.1.2. Silver Generator
The silver particle generator (SPG, Catalytic Instruments GmbH & Co.KG, Rosenheim, Germany) produces silver particles via evaporation–condensation in a vertical tube furnace [48]. The silver containing tube is heated at 1000–1100 °C and a 2 L/min carrier gas flow (particle free air in our tests) transports and cools the silver nuclei to the main flow tube, where they are optionally diluted with a flow of 0–20 L/min. The two settings that were used were: 1000 °C with 15 L/min at the main flow that produced a size distribution with GMD of 9 nm and 1100 °C with 15 L/min at the main flow that produced GMD of 16 nm. The particles are called “silver oxidized” because air was used in the generator.
2.1.3. Diffusion Flame Soot Generator
The AVL particle generator (APG) is a modified mini CAST (model 6.203 C, Jing Ltd., Zollikofen, Switzerland) combined with a thermal pre-conditioning and dilution unit, called volatile particle remover (VPR) [49].
The mini CAST is based on the principle of a laminar propane co-flow diffusion flame with air as oxidizing gas [50]. The adjustment of propane fuel and oxidation air can adjust the particle size. Quenching with inert gas N2 at a special height cuts off the chemical reactions in the flame and “freezes” the particles in that condition. The mixing of nitrogen (mixing gas) to the fuel propane gas can decrease the size of the particles. After quenching with N2, the dilution air at the burner exit affects the agglomeration process, thus, both number concentration and size.
The VPR consists of two diluters based on the ejector diluter concept, with an evaporation tube heated at 350 °C in between. The first ejector diluter is also heated >150 °C. Downstream of the second diluter there is a dilution bridge that can further decrease the concentration. In this study the sample was taken from the outlet of the mini CAST (“Burner” position), the second ejector diluter (“VPR” position), or the dilution bridge (“DB” position).
The settings of the mini CAST were varied in order to achieve a wide range of sizes (10–90 nm) and both unimodal and bimodal size distributions (Table 1).
2.1.4. Spark Discharge Graphite Generator
In the DNP 3000 (Palas GmbH, Karlsruhe, Germany) high-voltage spark discharges between two electrodes result in evaporation of the electrode material [51,52,53]. A carrier gas transfers the vapors that subsequently nucleate and coagulate. Further dilution with filtered air reduces the particle number concentration and “freezes” the size distribution. In our case the electrodes were from graphite and the carrier gas was N2. The two settings used were: (i) for GMD around 25 nm: medium energy 3.0 kV, current 2 mA, N2 carrier 3 L/min, mixing air 8 L/min; (ii) for GMD around 40 nm, medium energy 3.0 kV, current 5 mA, N2 carrier 3 L/min, mixing air 3 L/min.
2.1.5. Glowing Wire Generator
An in-house tungsten glowing wire generator (GWG) with silver filament around it was used to generate silver particles [54,55]. Voltage applied (5.5–6.5 V, 2.3–2.4 A) to the tungsten wire resistively heats it, resulting in evaporation of silver particles. The carrier gas was 4 L/min of nitrogen to avoid oxidation of the tungsten wire and the silver particles. The carrier gas was mixed with 6 L/min nitrogen flowing around the tube. The particles are called “silver” because nitrogen was used in the generator and limited oxidation is expected.
2.2. Measurement Instruments
The three instruments used were a condensation particle counter (CPC), a scanning mobility particle sizer (SMPS), and an engine exhaust particle sizer (EEPS). These are the most commonly used instruments in the vehicle exhaust sector. Details follow.
2.2.1. CPC
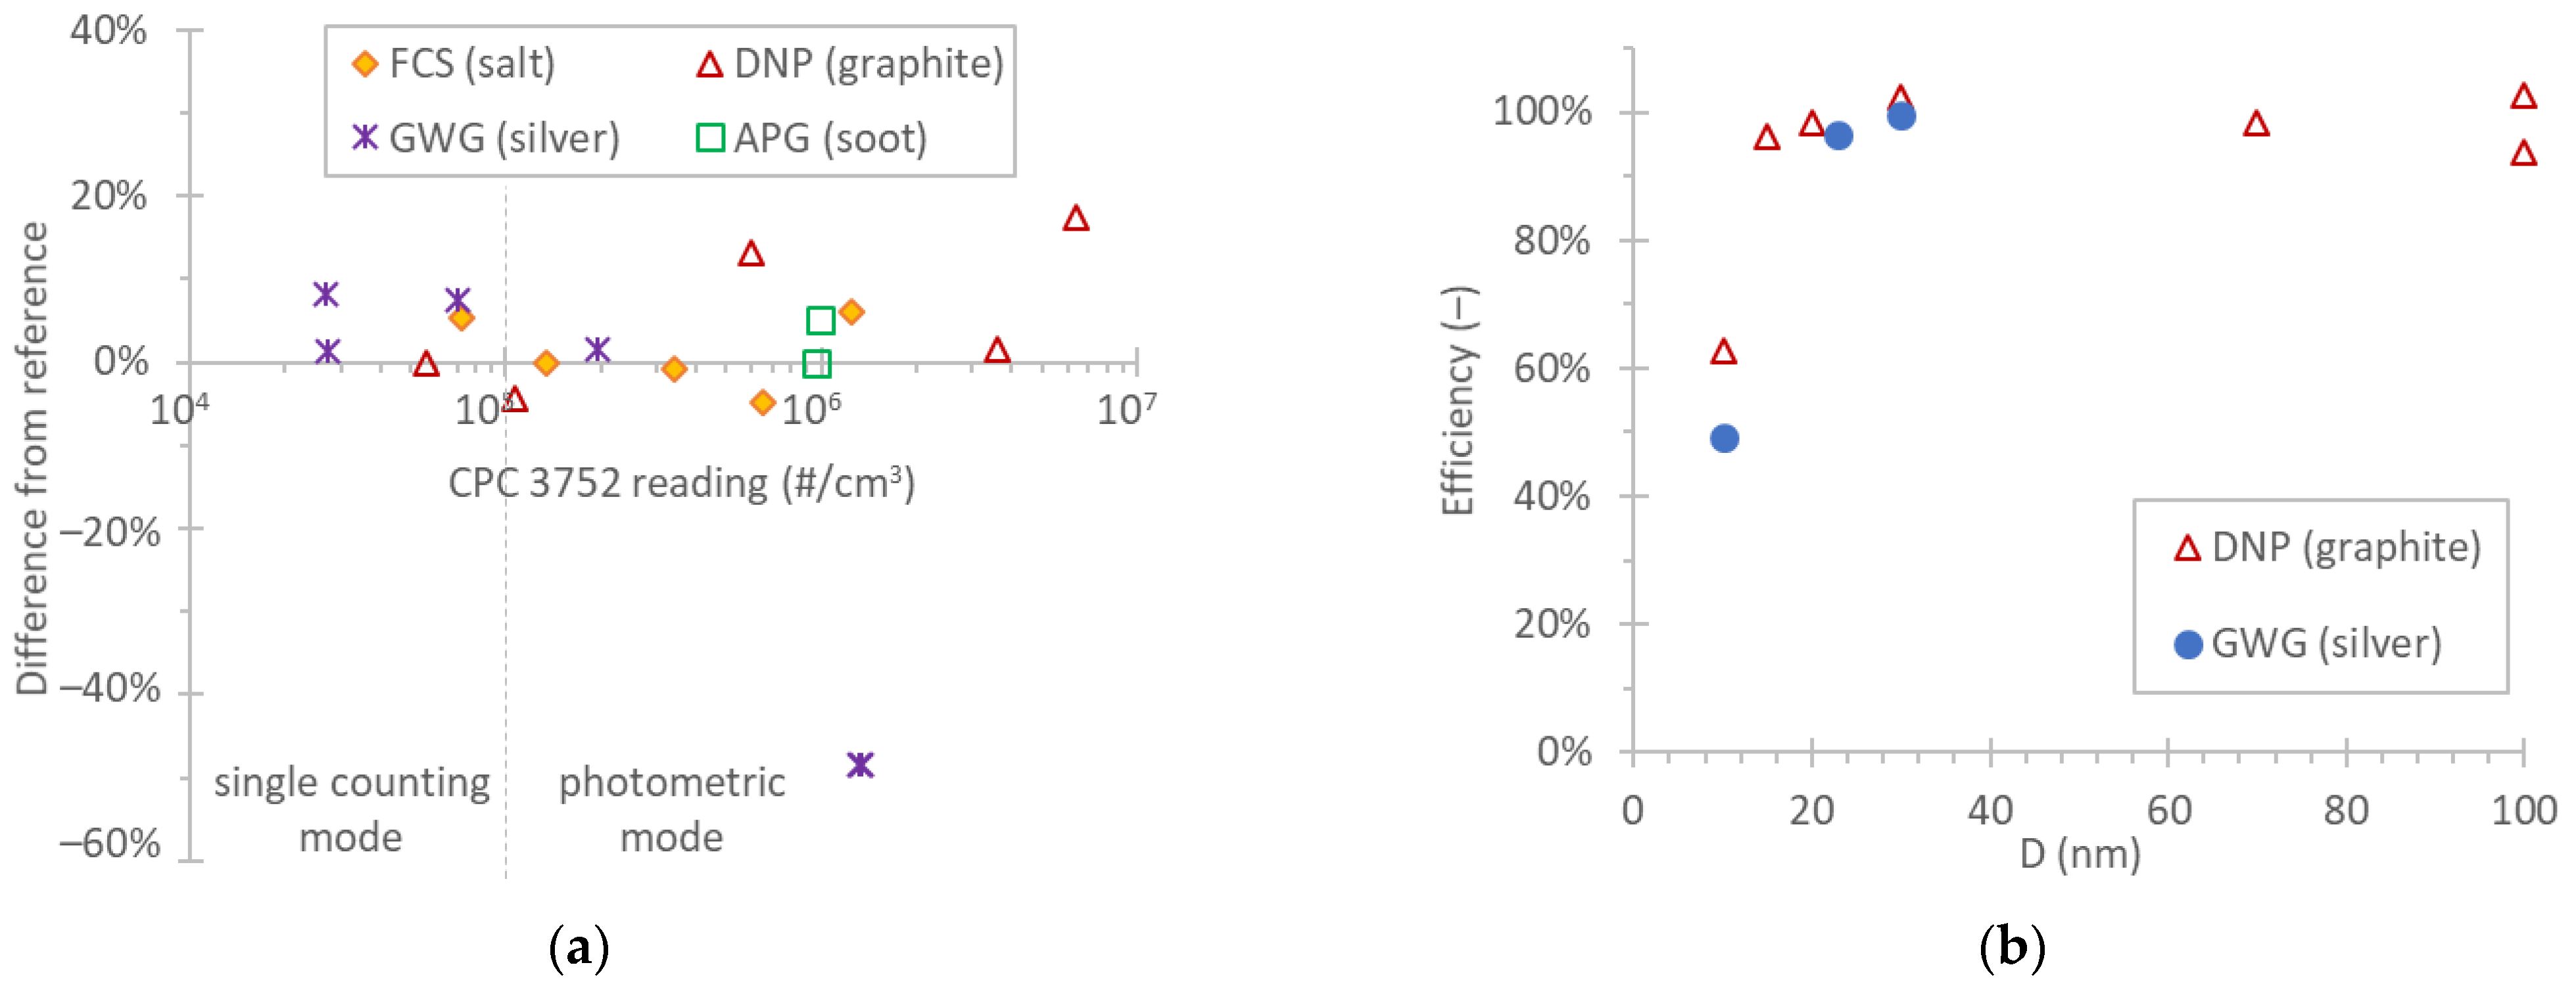
CPCs use light scattering to count particles after they have grown to micron size in a supersaturated environment. The methods that are used to achieve supersaturation and particle growth are adiabatic expansion of the aerosol–vapor mixture, conductive cooling, or mixing of cool and warm saturated air [56]. The CPC of this study was the butanol-based model 3752 from TSI with 50% efficiency at 4 nm [48,57]. A flow rate of 1.5 L/min was selected. It has single particle concentration range up to 105 #/cm3, while up to 107 #/cm3 uses photometric detection. In single-particle mode, one particle is detected each time in the optical chamber, while in the photometric mode the light scattered by many particles is converted to number concentration. According to the manufacturer, the particle concentration accuracy is ±5% in single-counting mode and ±20% in photometric mode. In order to confirm these values, we compared the CPC 3752 measuring either in photometric mode or in the single-counting mode with a DDS 560 Topas diluter upstream of the CPC with the SMPS. Since the concentration of the SMPS remained the same during the tests with and without the diluter upstream of the CPC, the ratio of the two concentrations to the SMPS readings is a good indication of the uncertainty in photometric mode. The particle losses in the diluter were taken into account: 15% for the silver particles (10–15 nm), no correction for salt (60 nm), graphite (30 nm), and soot (30 nm). The results are summarized in Figure 2a, where the differences in the dilution-corrected CPC concentration to the SMPS concentration are plotted. For salt, soot, and spark discharge graphite particles, the photometric mode uncertainty was in agreement with the manufacturer. The results were within ±20% with a small increasing trend for graphite particles. For silver particles there was a clear effect: the difference reached −50% at concentration level of 106 #/cm3 or stated differently; the SMPS measured almost double the CPC. As nanoparticles in the CPC grow to micrometer range with butanol condensation before detection, we believe that the effect relates to smaller initial size of the silver particles (10–15 nm), compared to salt, soot, and graphite, resulting in smaller droplet growth until detection at the optics of the CPC.
2.2.2. SMPS
In an SMPS, particles are initially neutralized, i.e., reach an equilibrium charge distribution. The polydisperse particles are then separated in a differential mobility analyzer (DMA) according to their electrical mobility. At each specific voltage, only particles with a specific electrical mobility are selected and counted by a downstream CPC. For our measurements we used a SMPS (model 3936, TSI, Inc., Shoreview, MN, USA). It included a 10-year-old 3077A 85Kr charger (neutralizer 370 MBq, beta, TSI), with estimated activity >50%, as its half-life is 10.7 years [12] and a butanol-based CPC model 3010 from TSI, which has electrical mobility d50% around 10 nm [58]. The SMPS was operated with an inlet impactor with a cut-off aerodynamic diameter of 710 nm. The SMPS was configured with aerosol and sheath flows equal to 10 L/min and 1 L/min, respectively, an approximately 2.5 min sampling resolution (up scan 120 s, down scan 15 s), and, therefore, the measured size distribution was from 7.4 to 289 nm, over 103 size bins. The data were analyzed with a TSI aerosol instrument manager (AIM), version 9.0.0, and both diffusion loss and multiple charge corrections were applied.
2.2.3. EEPS
The EEPS (model 3090, TSI Inc., Shoreview, MN, USA) with firmware version 3.11, and software version 3.2.5.0. measures size distribution in real time (1 Hz collection rate in this study) [19]. Note that this instrument is identical with the fast mobility particle sizer (FMPS) (model 3091, TSI Inc., Shoreview, MN, USA), commonly used in ambient air studies, except that the FMPS reports data up to 1 Hz while the EEPS reports data up to 10 Hz. The EEPS charges particles first in a negative unipolar corona charger to bring them to a similar charge state independent of their initial charge distribution. Then they are charged in a positive unipolar charger with high-ion concentration [19,59,60]. The charged particles are classified by their electrical mobility and then detected using 32 multiple electrometers, covering a size range of 5.6 to 560 nm. The currents are converted to number concentrations and size distributions using an inversion “matrix”, which accounts for particle transport losses, charge distribution of particles, current detection by the electrometers, image current interference, and delay times. The sample flow rate is 10 L/min and the inlet cyclone has a cut-off diameter of 1000 nm. The measured size distributions were exported using the three available matrices (“Default”, “Soot”, “Compact”) under the user-selectable menu option for comparison reasons. The original “Default” matrix, which describes the EEPS response to particles of different sizes, was developed based on theoretical considerations and experimental data with near-spherical particles: oil droplets, salt particles, polystyrene latex spheres (PSLs). The “Compact” matrix was developed to improve the “Default” matrix for compact particles, using lab-generated near-spherical particles of sucrose, poly-α-olefin oil (PAO), and sodium chloride (NaCl) [59]. In 2015 the “Soot” matrix became available to cover soot particles with fractal morphologies, which acquire more charge than spherical particles of the same electrical mobility diameter [61]. It was developed using diesel engine exhaust particles as the calibration aerosol [62].
2.3. Vehicle Testing
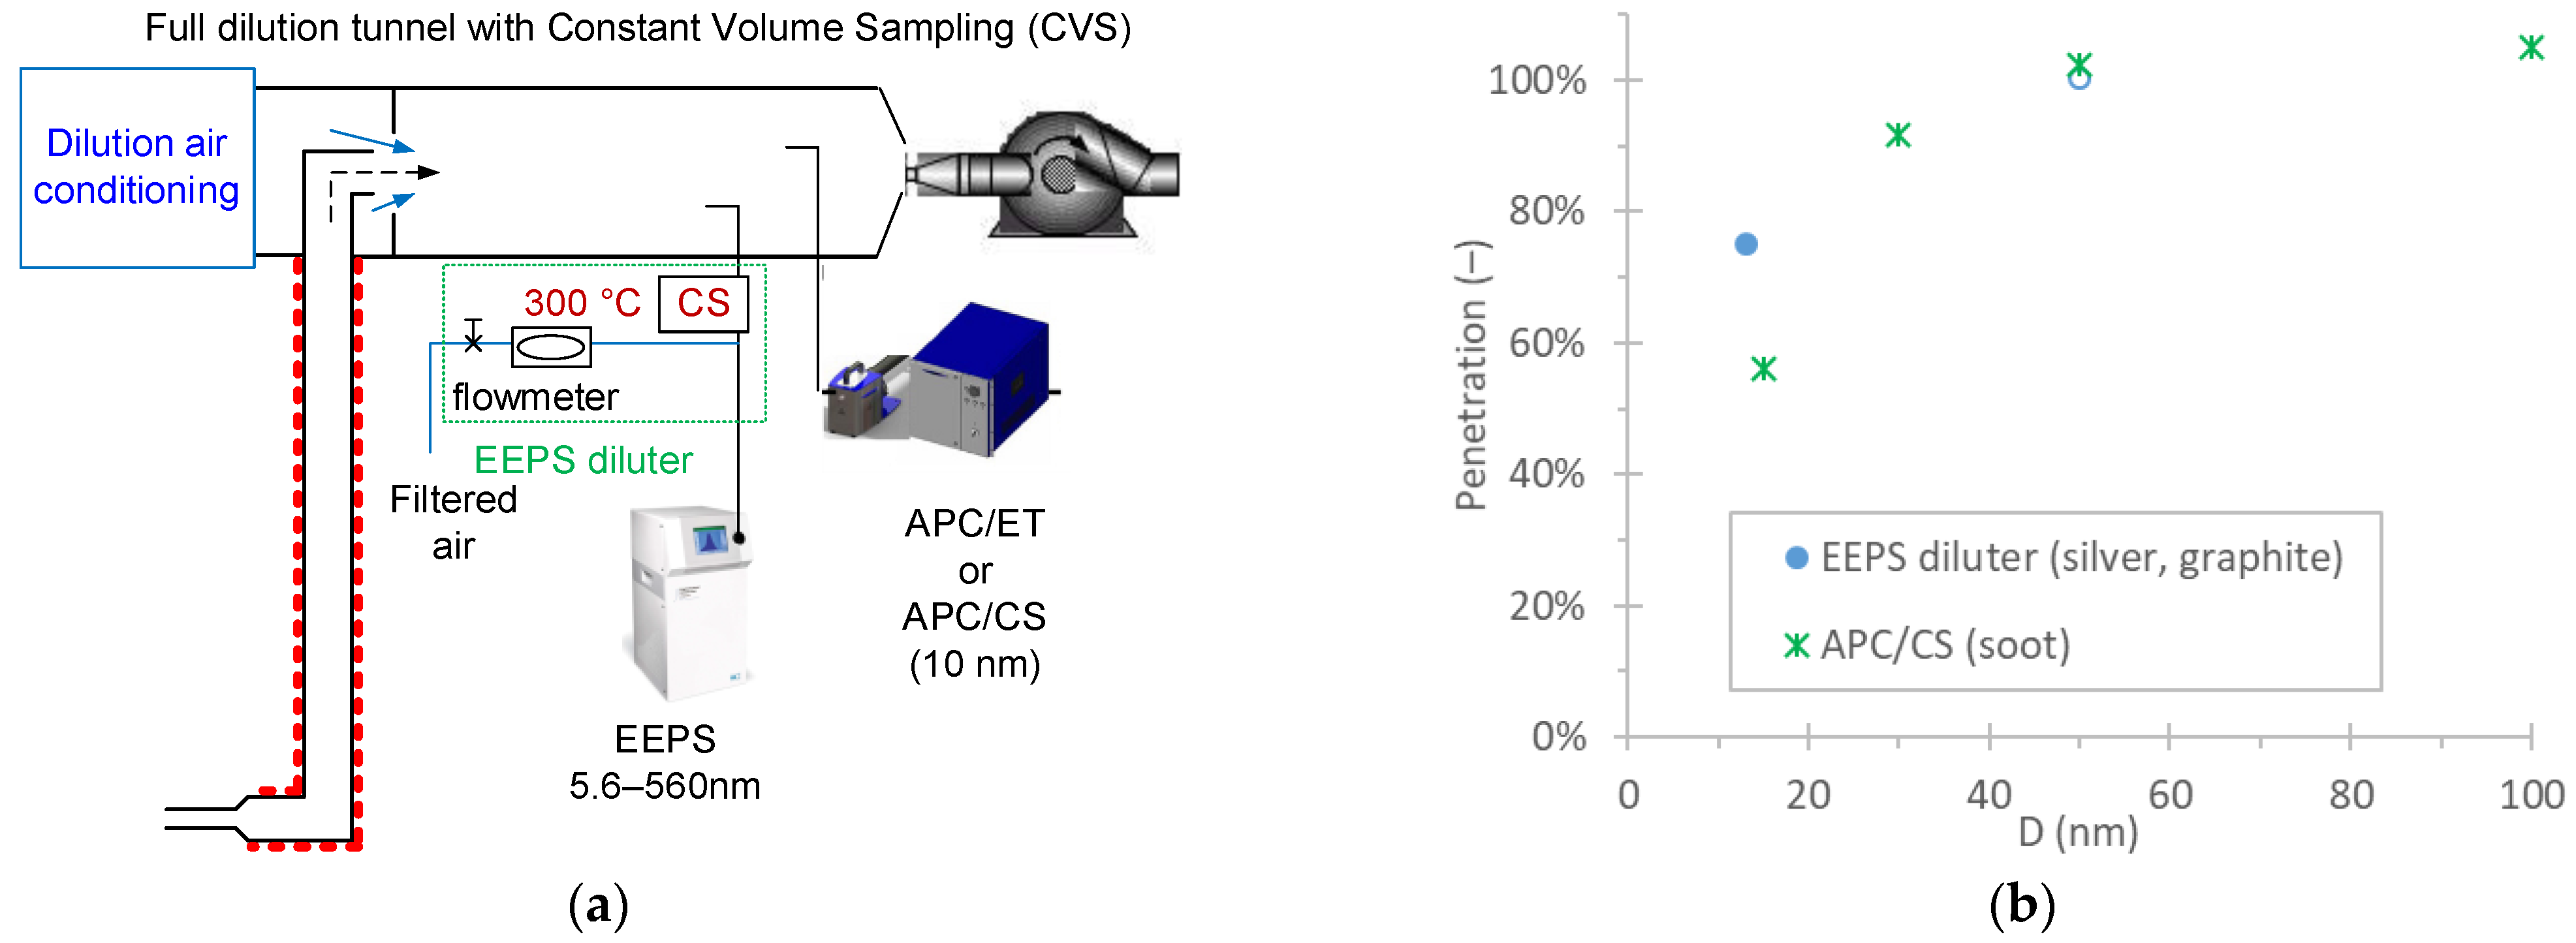
The EEPS was compared to reference systems fulfilling the requirements of the light-duty emissions regulations, both systems measuring in parallel (simultaneously) from the full dilution tunnel with constant volume sampling (CVS) (Figure 3a). The measurements were taken from 2014 until 2020. Most of the data are unpublished and only some of them are partly presented [31,32,35,63,64,65].
The reference systems were based on the particle measurement program (PMP) protocol using a 10 nm CPC and in most cases included a catalytic stripper at 350 °C [66], otherwise a simple evaporation tube at 350 °C (APC 489, AVL, Graz, Austria) [67]. The normalized penetration, i.e., with correction factor to reach 100% at the plateau region (large sizes), was around 60% at 15 nm and >90% at 30 nm (Figure 3b).
The EEPS was connected to the dilution tunnel via a catalytic stripper at 300 °C and a downstream porous mixer diluter to cool down the exhaust and provide the necessary flow to the EEPS (“EEPS diluter”). The dilution was controlled with a throttling valve and was adjusted to be around 10:1. The combination of catalytic stripper and diluter was a prototype system from AVL, almost identical with the one in the APC from AVL. The penetration was around 75% at 15 nm and close to 100% at 30 nm. Thus, for size distributions peaking below 30 nm the EEPS could be measuring around 25% higher (=75%/60%), while for size distributions >30 nm, the differences should be negligible. The particle losses were not corrected for two reasons: (i) both systems fulfil the penetration requirements of the regulation and no loss correction is applied for legislative measurements; (ii) the objective of these tests was to monitor sub-23 nm particles and not the absolute levels, which were monitored by the regulation-compliant system.
The EEPS “Default” matrix was used until 2016 and “Soot” afterwards (as soon as it was officially available). It was not possible to re-process the old data with the “Soot” matrix, due to non-availability of the original EEPS files. The old data were mainly mopeds and motorcycles, diesel without DPF, and high-emitting GDIs. The uncertainty introduced by the diluter and the differences in the penetration curves of the two systems have a high contribution to the differences and could be as important as the impact of the EEPS inversion matrix.
2.4. Calibration and Controls
The CPC 3752 was calibrated less than 12 months before the testing and the calibration factor was taken into account (6%). The EEPS was calibrated three years before the testing, but due to the COVID-19 pandemic it has not been used since the latest calibration. Experience and tests with CPCs have shown that the calibration remains valid when they are not in use [68]. The SMPS was not calibrated. Last check of the DMA with polystyrene latex (PSL) particles was ten years before the tests and only the flows and the counter were checked, which were within 2%. The counter model 3010 of the SMPS was 10% lower than the reference CPC 3752 (see Figure 2b) and the 10% difference in the counter was taken into account. The calibration procedure followed the methodology described in Regulation (EU) 2017/1151. The APCs were calibrated yearly according to the requirements in the regulation. Operational checks, such as inlet flow and zero check, were performed before each measurement. Typical maintenance procedures, such as cleaning and flow measurements, were performed regularly.
3. Results
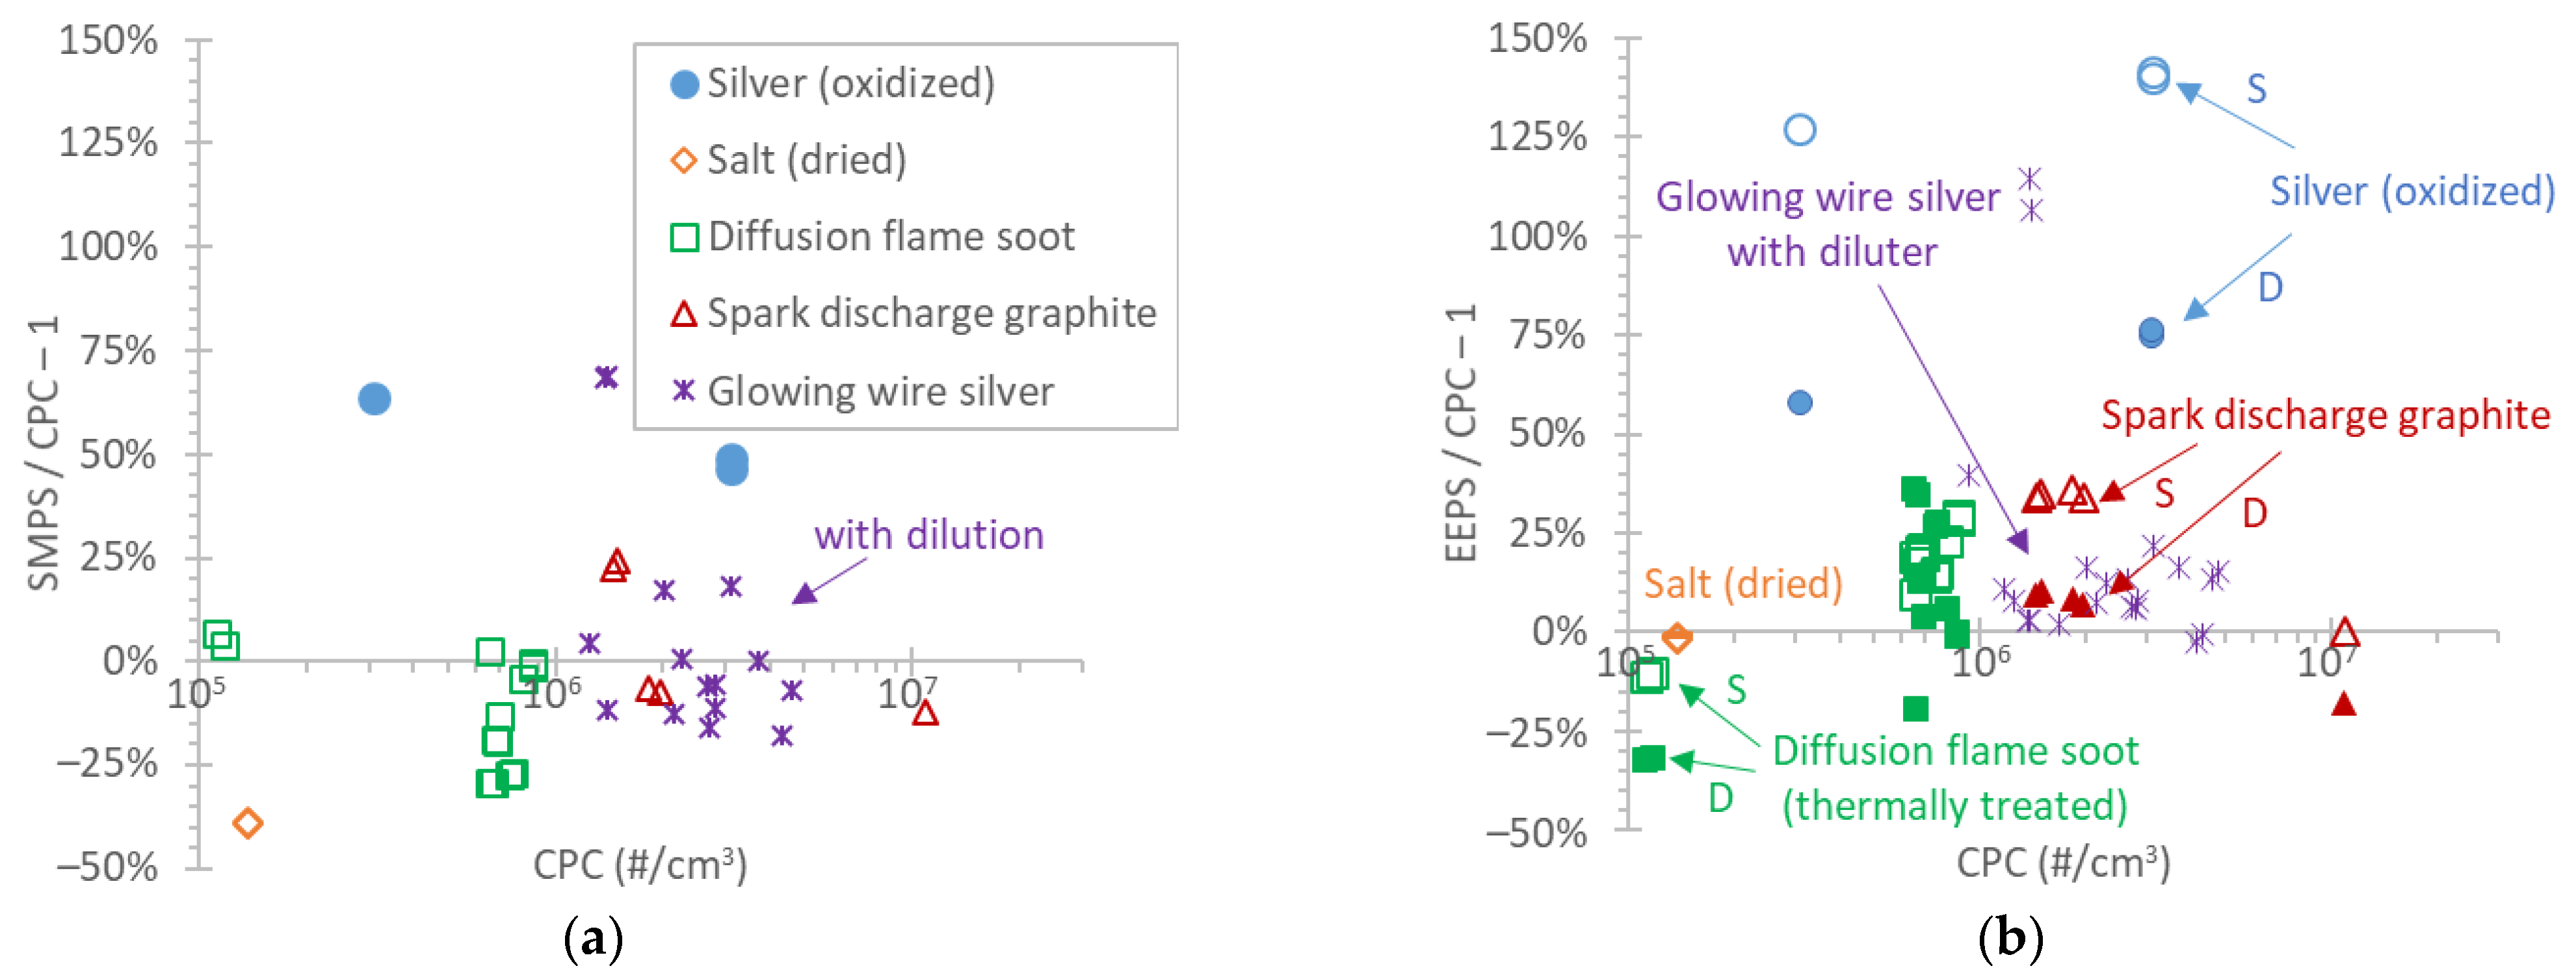
Figure 4 plots the ratios of the SMPS and EEPS to the CPC in function of the concentration levels. The values include all particles as measured by the instruments, i.e., the SMPS measured from 7.4 to 289 nm, the EEPS from 5.6 to 560 nm, and the CPC from 4 to a few micrometers. This should not be an issue for most of the size distributions examined, but it could result in differences when measuring size distributions close to the lower cut-off sizes of the instruments, as will be discussed below. Examples of size distributions are given in Figure A1 in Appendix A. For the instruments measuring with 1 Hz frequency, the average value during the SMPS scan was used. The stability of all generators was very good: 2% on concentration and 1% on size, expressed as one standard deviation. There was no particular difference between the generators regarding stability.
The SMPS was, in general, within ±25% for the diffusion flame soot and spark discharge graphite particles (Figure 4a). For salt particles, the difference was −40%, while for silver and oxidized silver particles, around 50–60%. When some tests with silver particles were repeated with dilution, the difference dropped to ±25%, indicating that the uncertainty of the CPC photometric mode was the main reason for this high difference, as explained in Section 2. Inefficient neutralization is unlikely because the two instruments did not have high differences for the soot particles with similar size and concentration and the oxidized silver particles from the evaporation–condensation technique are expected to be mostly neutral. There was no trend of the differences in function of the concentration levels.
For EEPS, the differences were within ±30%, except for silver particles, which had differences >50%, for the reason described previously (Figure 4b). With solid symbols, we plot ratios using “Default” EEPS matrix and with open symbols using the “Soot” EEPS matrix. The “Soot” matrix did not change the differences much, except for silver particles, which further increased the differences, reaching 125%. However, silver particles should be near spherical at such low diameters and the use of the “Soot” matrix is doubtful. There was no trend of the differences in function of the concentration levels.
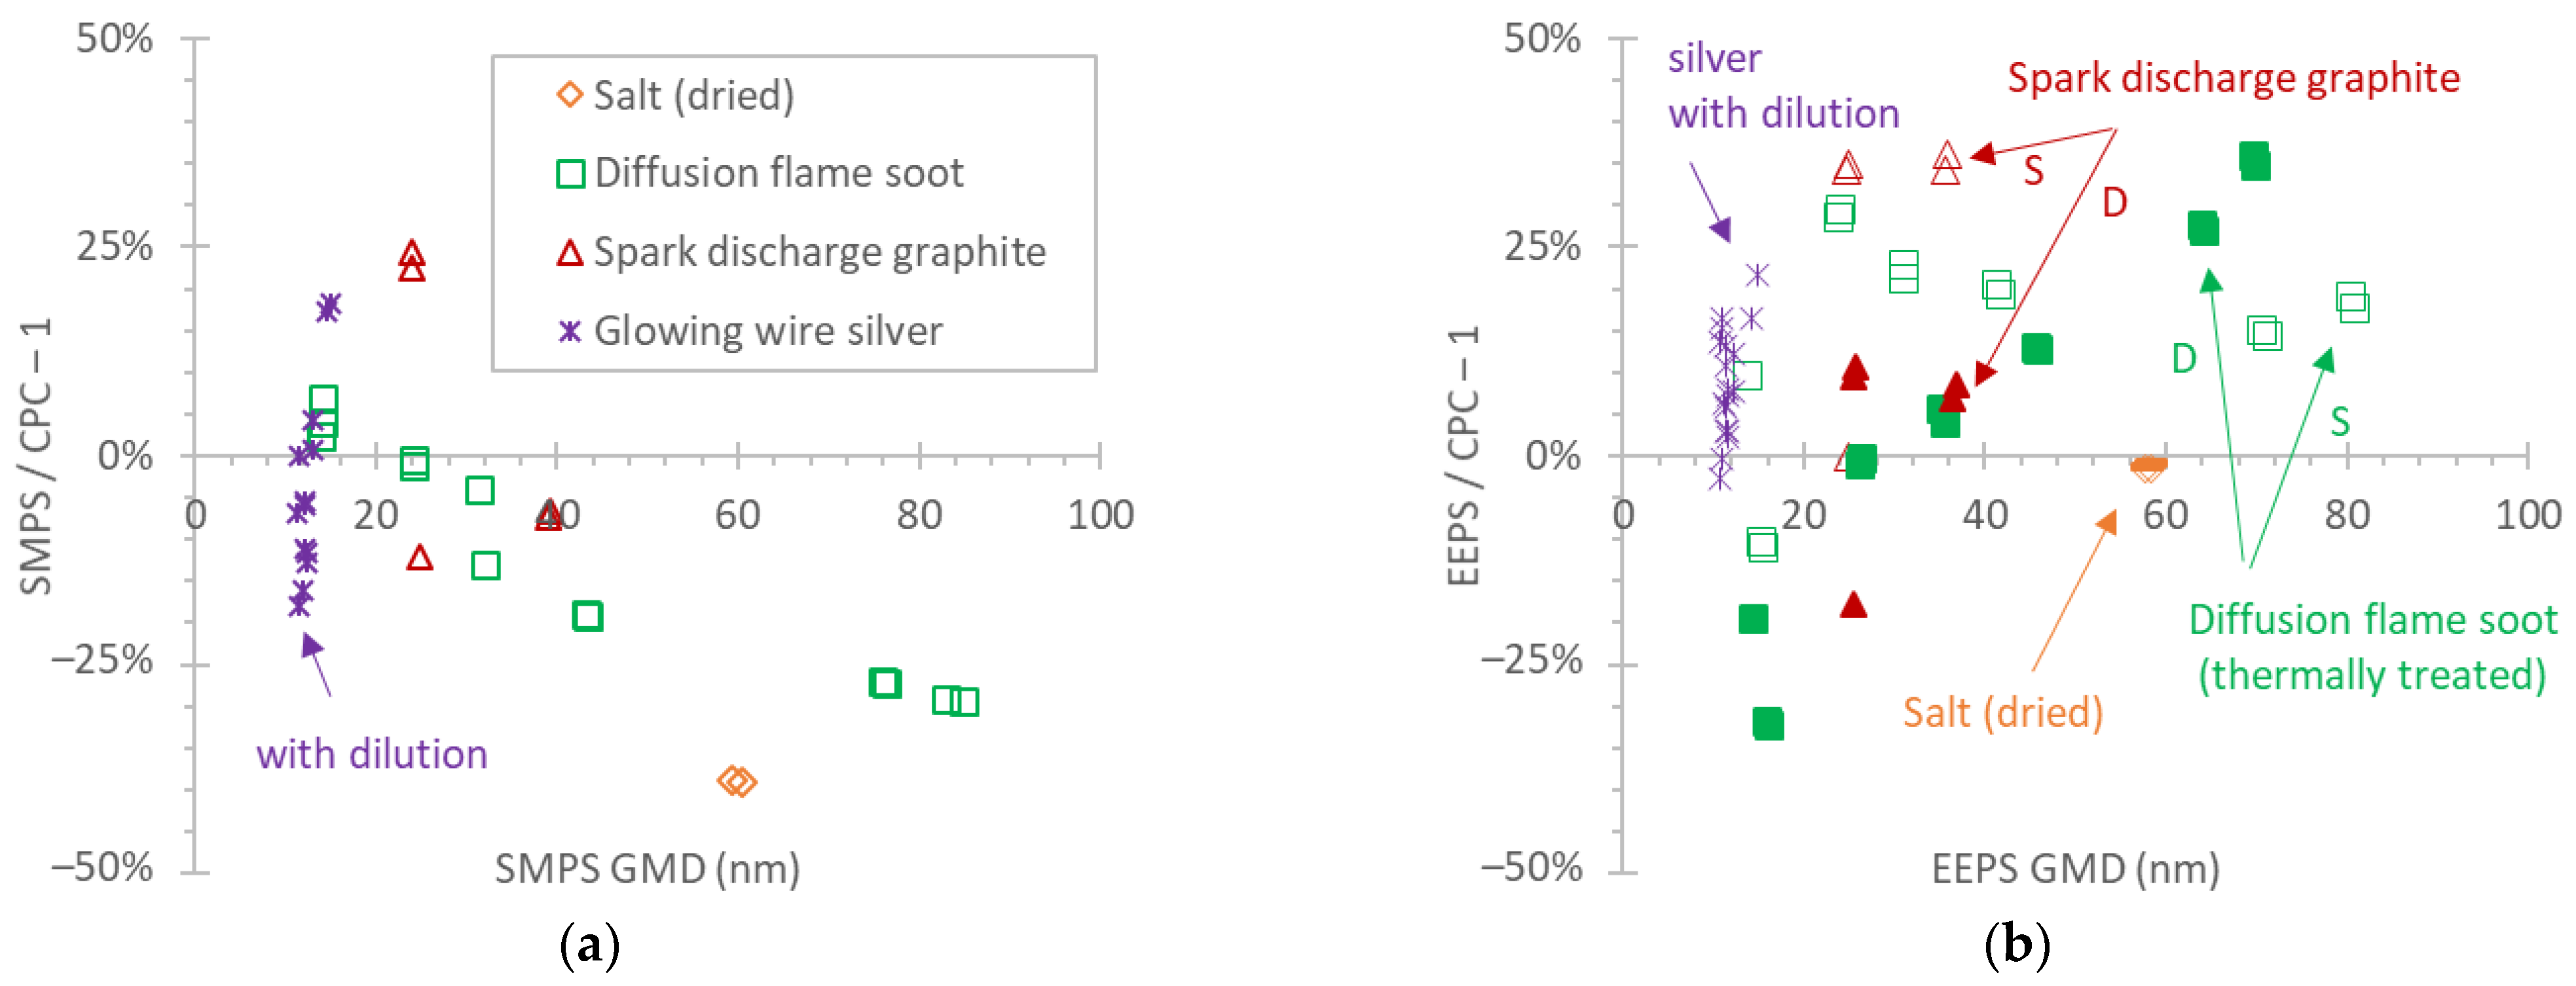
Figure 5 plots the ratios of the SMPS and EEPS to the CPC in function of the geometric mean diameter (GMD). The generated particles have big differences in their density: the bulk density is 2.16 g/cm3 for salt, 7.14 g/cm3 for silver oxide, around 2 g/cm3 for soot, and 2.15 g/cm3 for graphite. For aggregates, the effective density is lower [69,70]. Since the results are based on mobility diameter, they should be independent from the material density. In Figure 5a, the same tests and differences as in Figure 4a are plotted. For this reason, the SMPS differences were as discussed previously: within ±25% for the soot and graphite particles and −40% for salt. Only silver tests performed in CPC single-particle mode are plotted due to the increased uncertainty in the CPC in the photometric mode. There was a small negative trend of the differences in function of the GMD, but the results remained within experimental uncertainty. Figure 5b plots the same EEPS tests as Figure 4b, but in function of the GMD, as determined by EEPS. There was a size dependency of the differences with the “Default” matrix, but this disappeared with the “Soot” matrix.
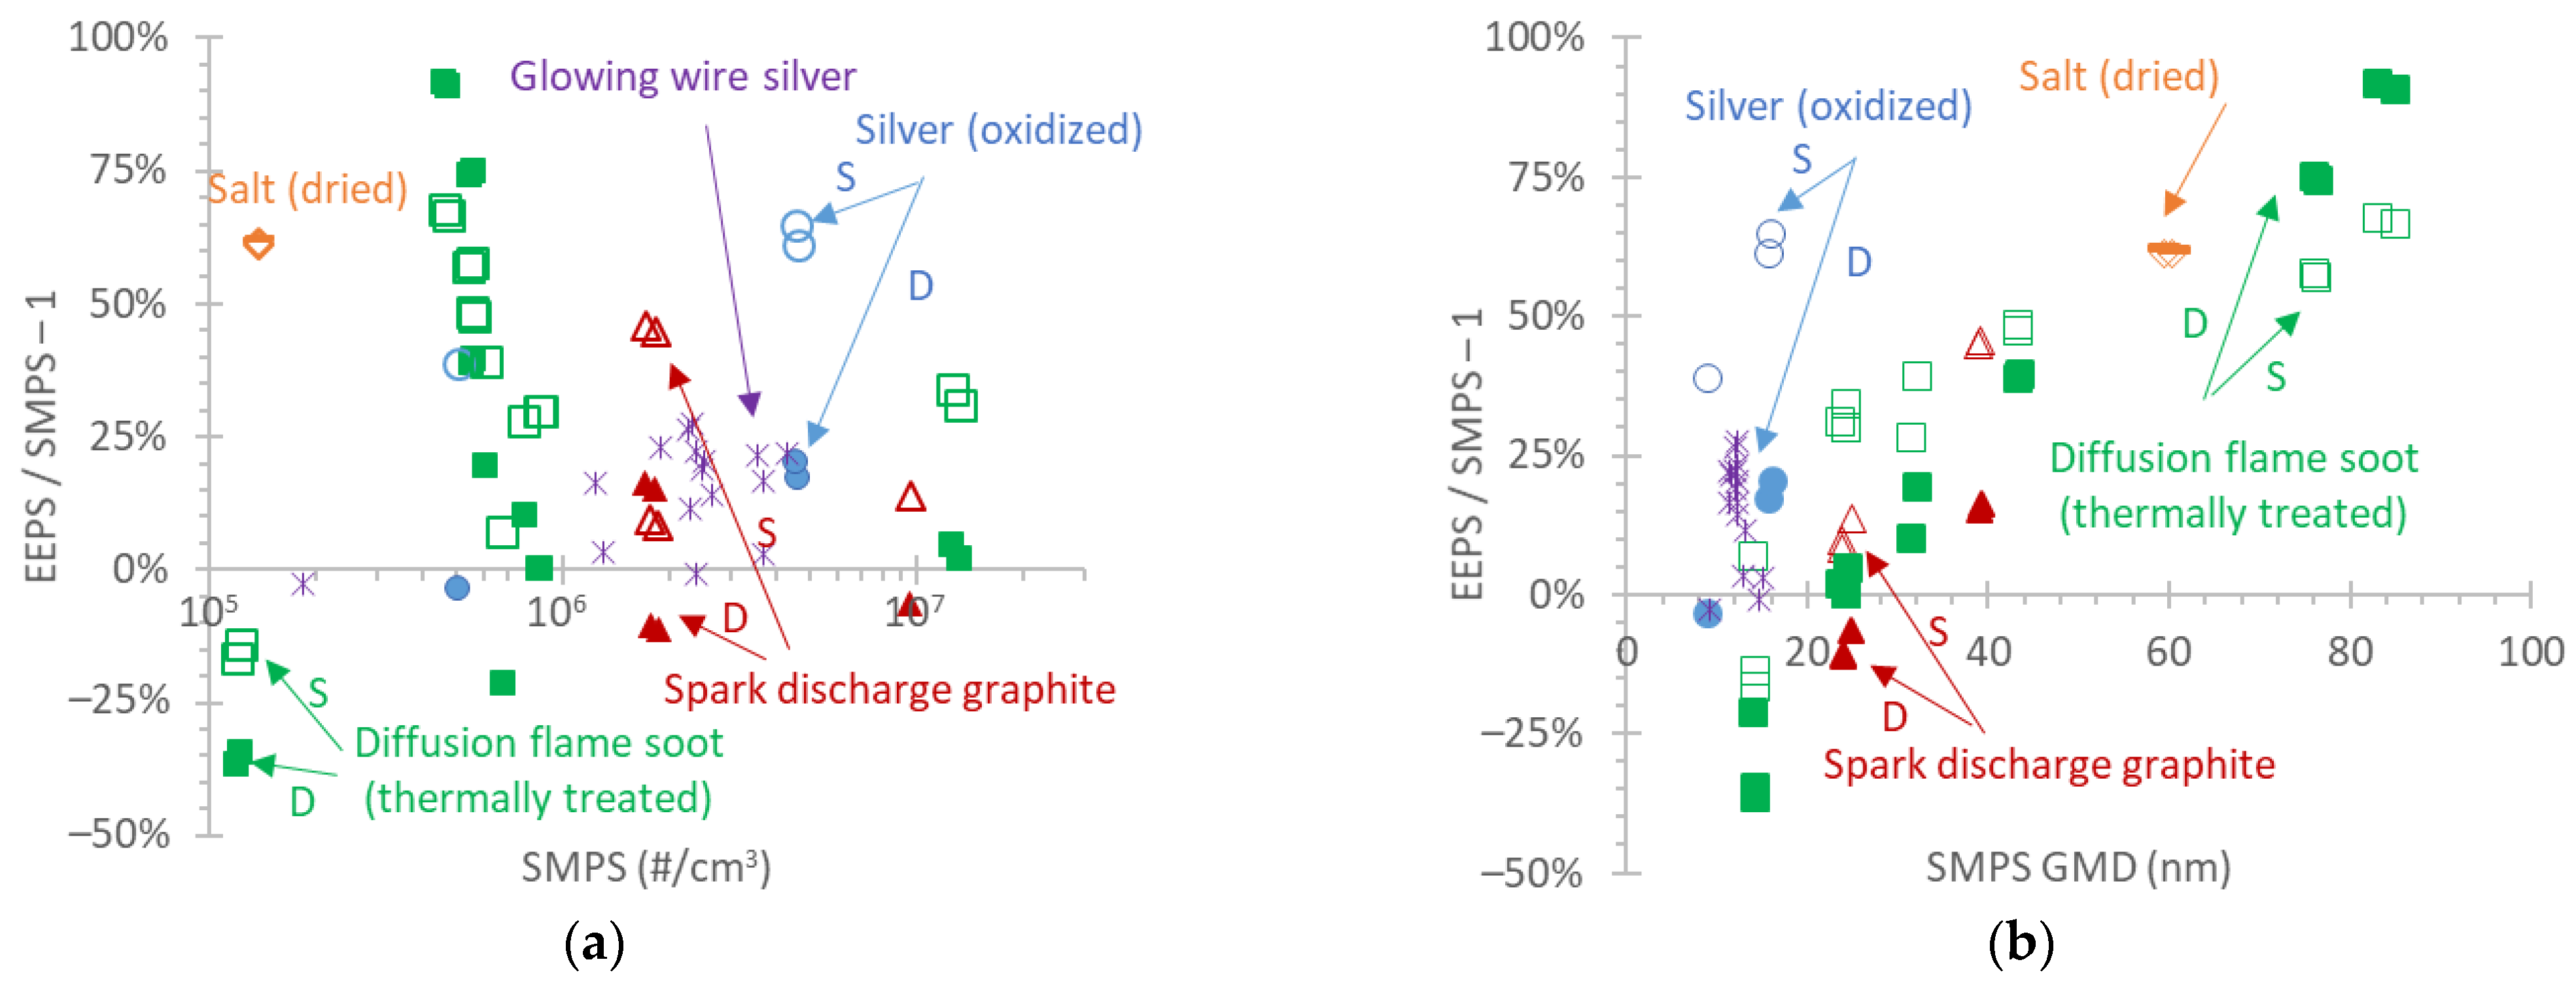
To exclude the uncertainty in the CPC due to the photometric mode, Figure 6a compares EEPS with SMPS in function of the concentration and Figure 6b in function of the GMD. The differences in the two instruments for silver and graphite particles were within 25%, 60% for salt particles with EEPS measuring higher, while for the soot particles, the differences ranged from −35% to +90%. The “Soot” matrix reduced this range to −15% to +60%. Figure 6b indicates that in the concentration range 105 #/cm3 to 107 #/cm3, the particle size is the main uncertainty contributor to the measurement of concentration; the higher the GMD, the higher the overestimation of the number concentration by EEPS.
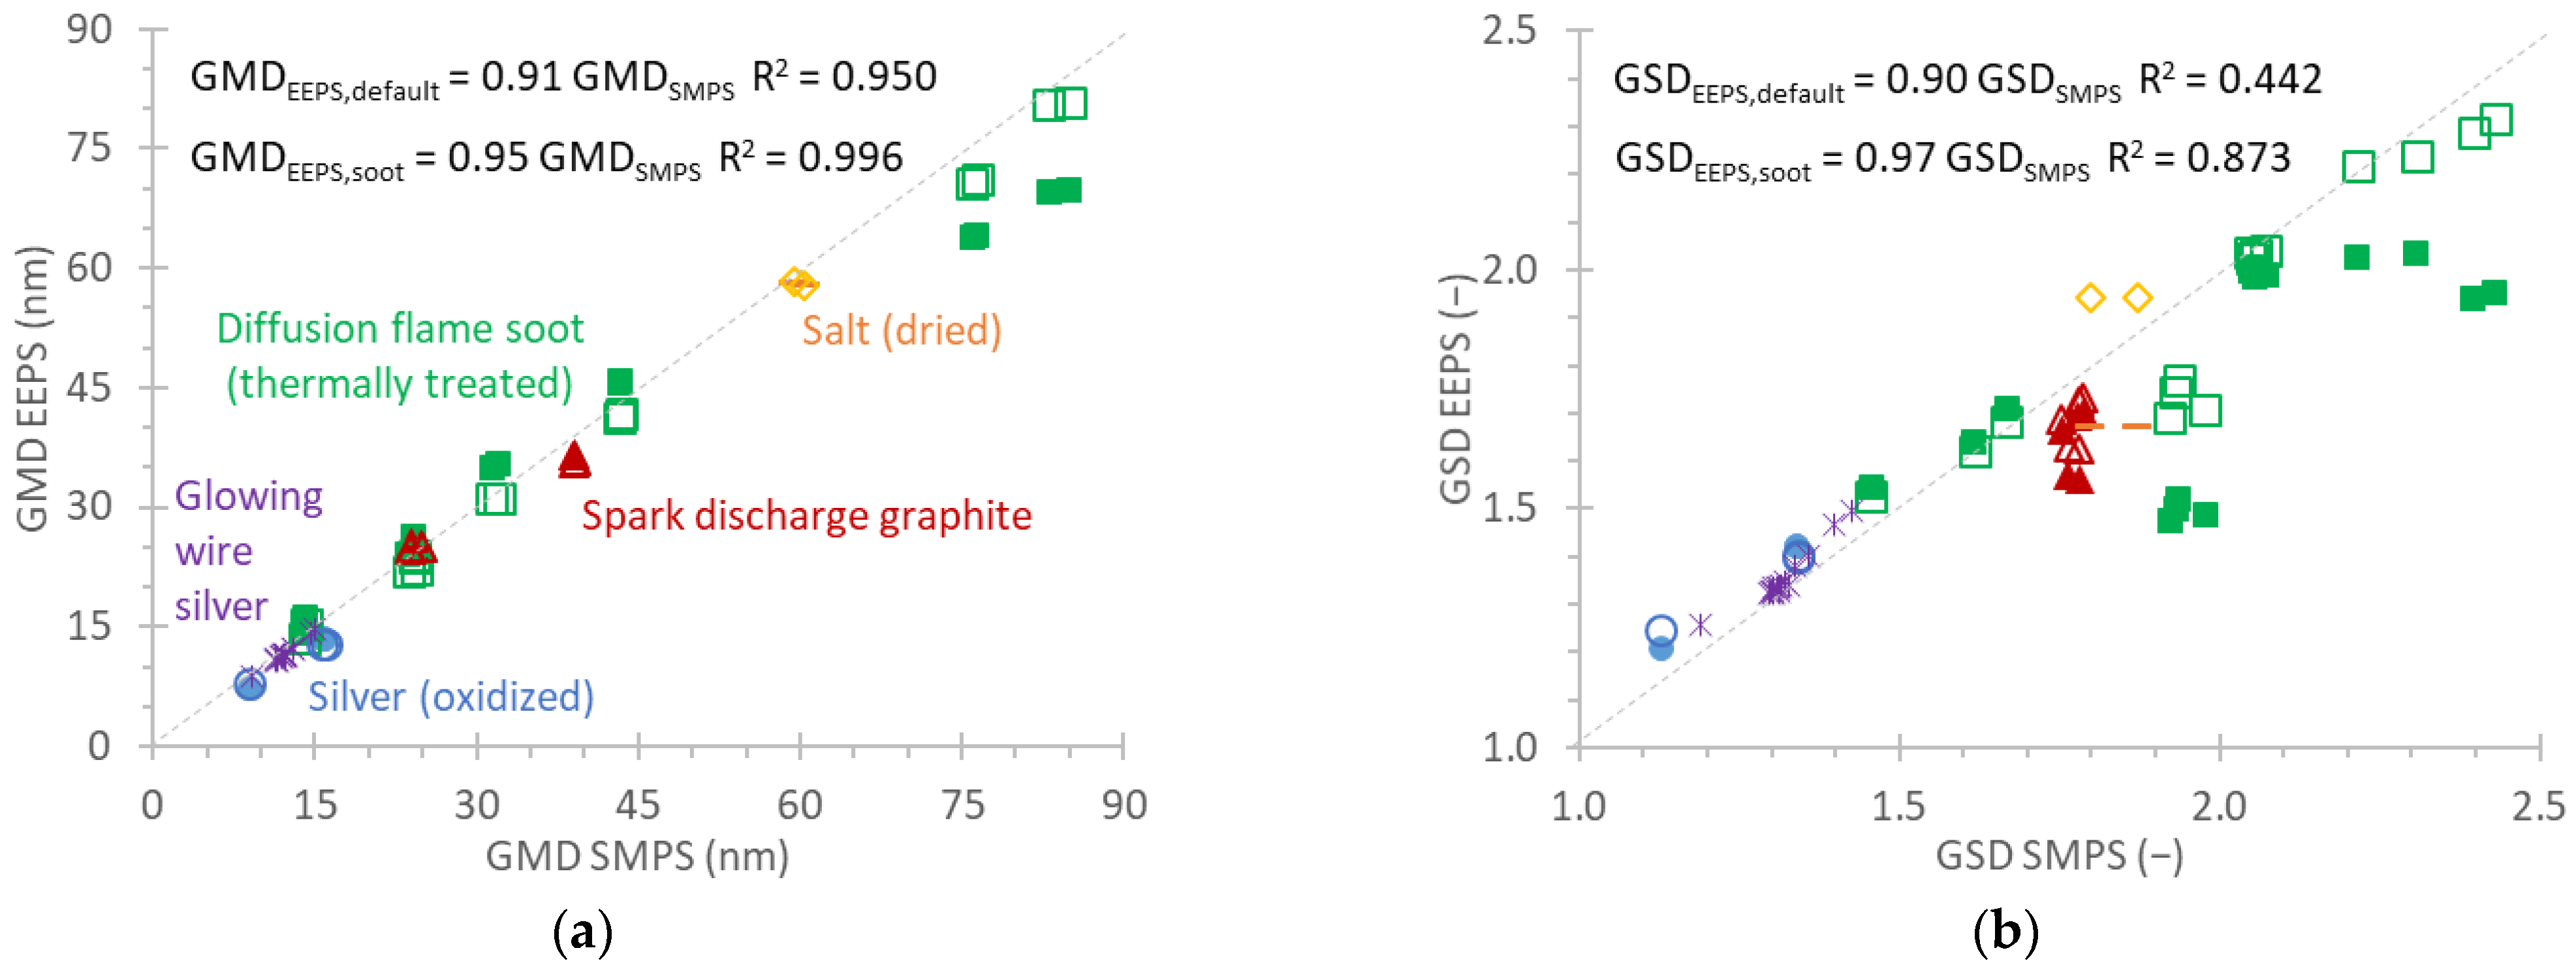
Figure 7a correlates the GMDs of the SMPS and the EEPS with the “Default” (solid symbols) and the “Soot” (open symbols) matrices. The slope improved from 0.91 with the “Default” matrix to 0.95 with the “Soot” matrix and the R2 from 0.950 to 0.996, respectively, mainly due to the improvement in the diffusion flame soot points. Figure 7b correlates the GSDs of the SMPS and the EEPS with the “Default” (solid symbols) and the “Soot” (open symbols) matrices. The slope improved from 0.90 with the “Default” matrix to 0.97 with the “Soot” matrix and the R2 from 0.442 to 0.873, respectively. The improvement originated from the improvement in the diffusion flame soot points and slightly from the salt points.
4. Discussion
In this study, we assessed two commonly used size distribution instruments: the SMPS and the EEPS. In addition to other studies that compared the two instruments to each other, here, we additionally used a CPC for the particle number concentration. The CPC had a lower detectable size, much lower than of the two size distribution instruments (4 nm vs. 5.6 nm or 7.4 nm); thus, all particles could be measured with detection efficiency of unity.
The CPC was used in the photometric range. The concentrations for CPC using the single-counting mode (<105 #/cm3) are not adequate for the size distribution instruments that measure accurately at high concentrations (>105 #/cm3). Combining the CPC with diluters (at least 50:1 dilution would be necessary) could be another solution, but the uncertainty of the diluters, plus any size-dependent losses should be considered. This approach was followed for a few tests. For example, our diluter had 15% losses at 15 nm and negligible for sizes >30 nm. For this reason, this solution was not applied in our study. According to the manufacturer, the uncertainty in photometric mode is around ±20%. Our dedicated tests found uncertainty of ±20% for salt, soot, and graphite particles, but much higher for silver particles. At 106 #/cm3, the CPC was underestimating silver particles, approximately 50%. The difference was attributed to the small size of silver particles and the smaller growth with butanol in the instrument, thus, affecting the light scattered. It is known that the scattered light is different for different particle sizes (for the same concentration) [2,71] and the final micrometer size in the CPC can depend on the initial size [72]. Based on these findings, we suggest that CPCs should be used in single-counting mode only with a well-characterized-for-losses diluter. Such an approach is used in the automotive field Regulation (EU) 2017/1151 and the recommendation for ambient air measurements (CEN/TS 16976:2016).
The SMPS concentrations compared to the CPC were within ±25% for the soot, silver, and graphite particles, −40% for the salt particles (Figure 5a). As discussed before, the photometric mode of the CPC is one reason for the differences. Another source of uncertainty could be that the charge distribution of the particles in this study did not have the equilibrium charge distribution of spherical particles assumed for SMPS. This has been discussed in the literature for, e.g., fractal-shaped particles [73,74,75]. Another study found that the inversion method of SMPS underestimates the total number concentration by about 15% to 27% when applied to diesel aggregates [76]. For small particles, around 10–15 nm, such as the silver particles, the counting efficiency of the SMPS internal counter might not have been taken into account accurately: a default curve is used in the software, which could be different from the actual counter that was used at the SMPS. Furthermore, high concentrations of small charged particles might not be neutralized efficiently [16,77]. For the salt particles, the higher difference cannot only be explained by the photometric mode, as the control with salt particle in single-counting mode did not show much improvement (Figure 2a). A likely explanation is that the SMPS (with the 10-year-old neutralizer used) did not properly neutralize the high concentration of highly charged salt particles from the atomizer [78,79]. Another likely explanation is that butanol-based counters (as the one used in this SMPS) underestimate the salt particle concentrations. This has been shown in many studies, where the plateau region is reached at very large sizes, with the effect even more pronounced for low-temperature differences between saturator and condenser [80]. Furthermore, the humidity also has an impact [58]. Other studies have used water counters in SMPS, which detect salt particles with high detection efficiency [15]. Water counters, however, underestimate the concentration of hydrophobic materials, such as the soot and graphite particles used herein, and consequently, it was not an option for our study [11,81,82].
The EEPS was, in general, within ±35% from the reference CPC with the “Default” matrix (Figure 5b). The “Soot” matrix narrowed the difference range to −10% to 30%. The “Compact” matrix is not presented because it is not relevant for the particles in this study, but the results can be found in Appendix A.
For EEPS, the size dependency was obvious with the “Default” matrix: the differences increased with increasing size, almost linearly. With the “Soot” matrix though, this dependency significantly decreased compared to CPC (Figure 5b) or SMPS (Figure 6b). This indicates that there is still room for improvement for the inversion matrix. It should be noted that the SMPS also increased uncertainty with non-spherical particles because the charge distributions are different than those assumed in the software. The EEPS “Soot” matrix did not only improve the concentration levels, but also the shape of the size distributions. The EEPS GMD was brought within 5% from the SMPS GMD and the GSD to 3% (Figure 5). Interestingly, it also improved the correlation for <20 nm particles, but to a smaller degree, expected to be near spherical. Thus, the “Soot” matrix should be preferred with fractal-shape particles. For silver and salt particles, there was no obvious improvement with the “Soot” matrix. This was expected, as these particles are near spherical or compact [48].
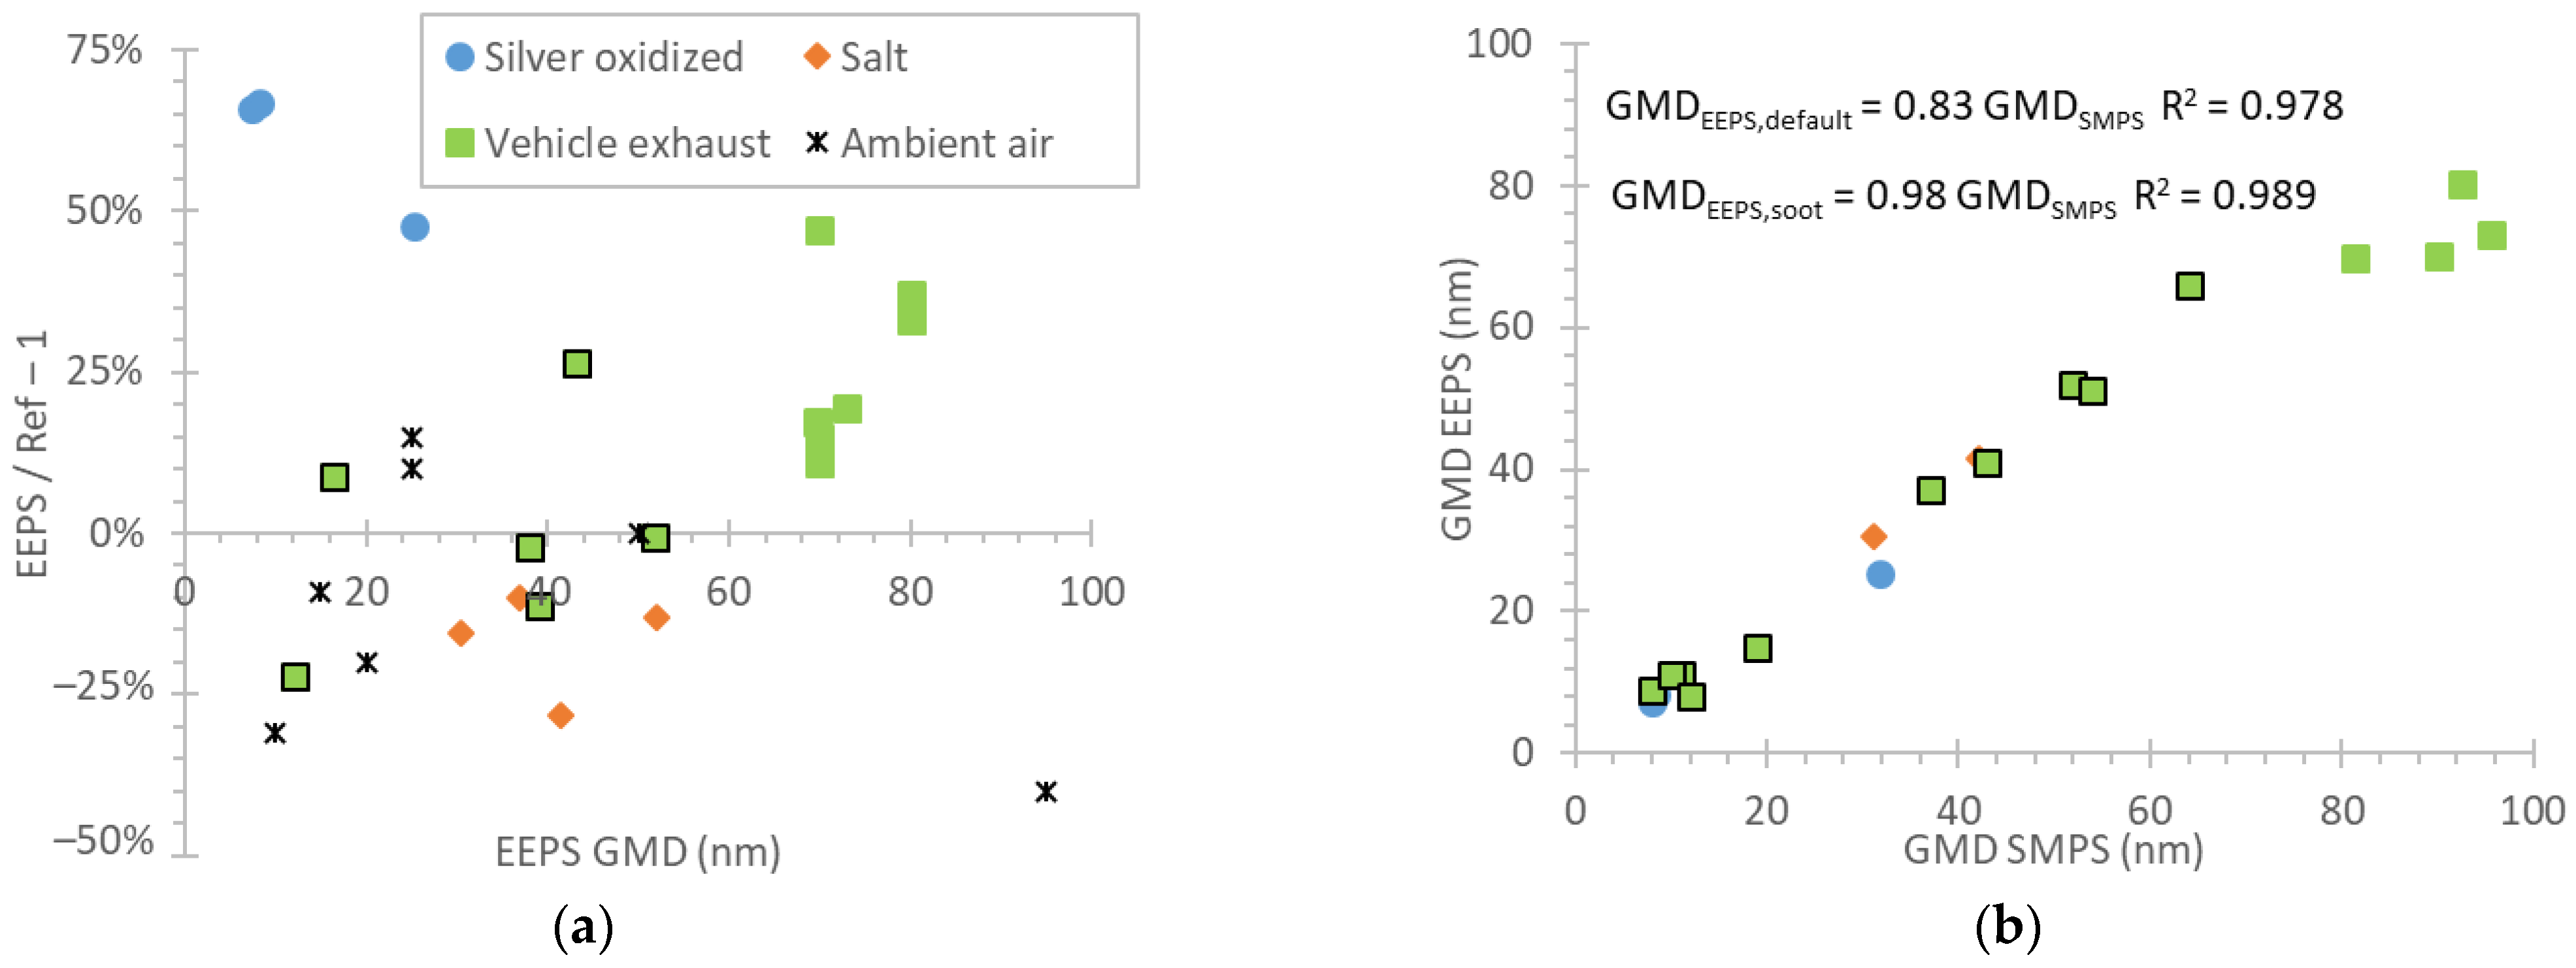
To put the results of this study into perspective, Figure 8 summarizes the results of other studies from the literature with similar materials and sizes: silver [83], salt [15,44,45,84,85], vehicle exhaust [25,26,44,45,86,87], and ambient [25,26,88,89]. Table A1 in Appendix A presents the reference instruments, the particle materials, the GMD, and the concentration of aerosols used in these studies. Figure 8a plots the concentrations ratio of EEPS to reference instruments (CPC or SMPS) in function of the EEPS GMD. With the exception of one study with vehicle exhaust [86] (symbols in black frame), the “Default” matrix was applied. The silver particles (GMDs < 25 nm) were overestimated 50–75% by the EEPS, the salt particles were underestimated 5–25%, while the vehicle exhaust particles were within ±25% (those with the “Soot” matrix) or 25–50% higher (those with the “Default” matrix). The results are very similar with the results of our study (presented in Figure 5b and Figure 6b). The ambient particles were, in general, within ±25%.
Similarly, the GMD of EEPS was 17% lower with the “Default” matrix but only 2% with the “Soot” matrix. The results are in very good agreement with our results (presented in Figure 7a). There are a few more studies assessing the EEPS using other materials (e.g., particles from welding, cooking, nanomaterial production, ammonium nitrate) and the “Default” matrix, which are more relevant to atmospheric or occupational health studies and they were not included in Figure 6 [90,91,92,93].
For completeness, our internal data with vehicle exhaust are summarized in Figure 9. The figure compares solid PN emissions from EEPS and reference systems, both systems measuring from the full dilution tunnel with constant volume sampling (CVS). The experimental details were given in Section 2 [31,32,35,63,64,65]. Each point is one vehicle and the error bars give one standard deviation of many (different) tests with the specific vehicle.
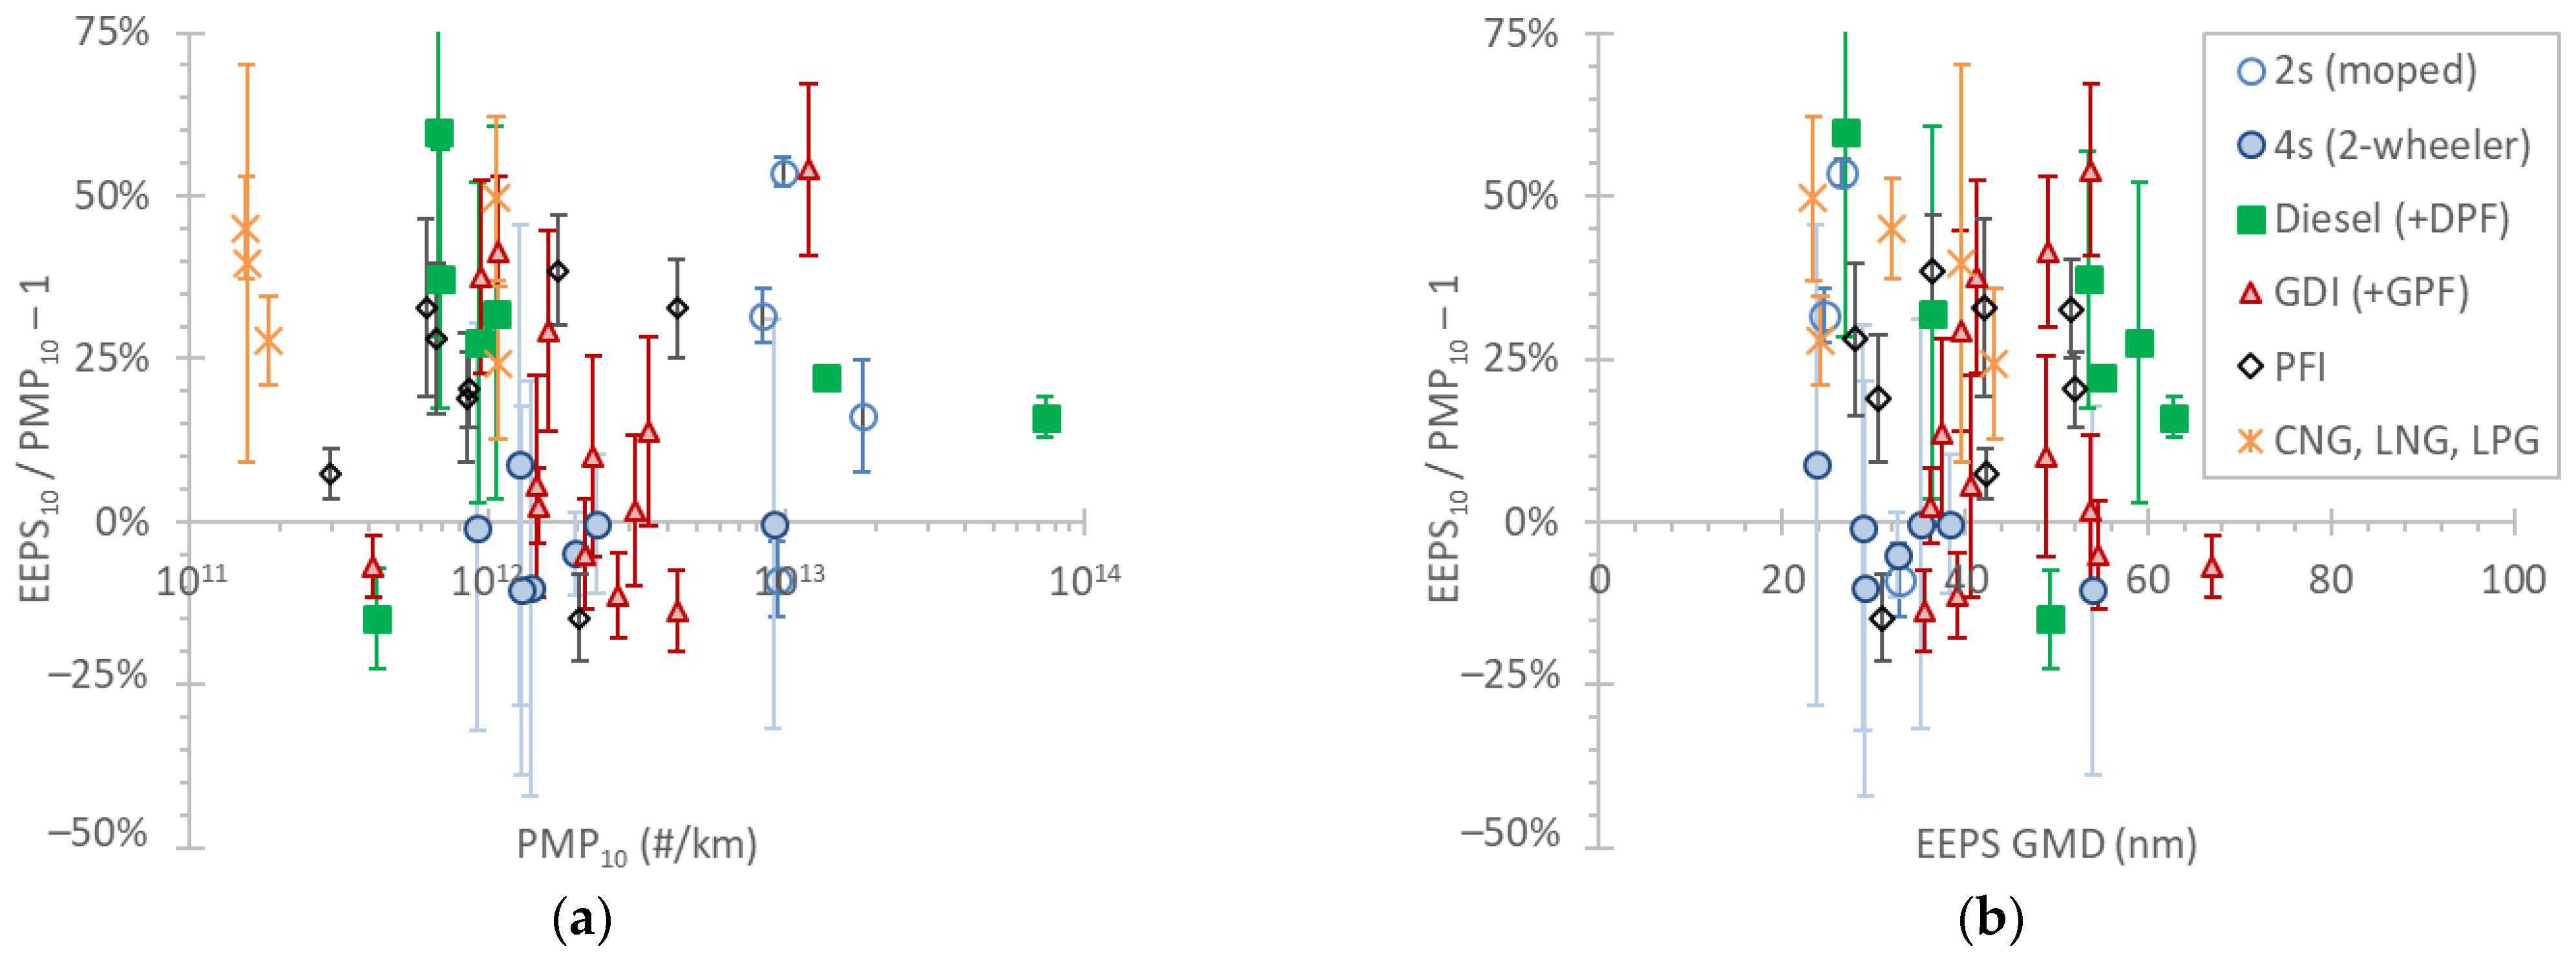
Figure 9a plots the differences in function of the emission levels. For emissions >1011 #/km, there was no obvious trend in function of the emission levels. It should be mentioned though that the results were filtered for emissions below 1011 #/km, because the differences were very high (>100%) as the EEPS was measuring at its background level. The highest emissions were from diesel vehicles without DPF or with DPF when regenerating and 2-stroke mopeds. GDIs had high emissions because they were models before the introduction of a particle number limit. There was no particular difference between different vehicle technologies. The mean differences spanned from −15% up to +60%.
Figure 9b plots the differences in function of the GMD. The GMDs ranged mostly between 20 nm and 65 nm. The diesel and GDI vehicles, on average, had higher GMDs. There was no obvious trend in the differences in function of the GMD. Mopeds, motorcycles, and gas engines had GMDs below 40 nm.
The EEPS trends are in agreement with the laboratory results: the EEPS seems to overestimate the emissions by 25% on average. In the size range examined (20–70 nm), there is no particular size dependency on the EEPS results. Many tests were not plotted because the concentration levels were very low. With an average tunnel flow of 10 m3/min, a dilution of 10:1 at the EEPS diluter, and a background of 2000 #/cm3, the EEPS background is 2.5 × 10¹¹ #/km, which is almost half of the current PN limit in the regulation. Thus, for solid particle number measurements of future vehicles, another solution should be applied, for example, using a high-flow catalytic stripper without dilution. A recent review for total particle number measurements (i.e., solids and volatiles) suggested that for regulatory purposes, the CPC should remain the basis, but the use of a real-time size distribution instrument was recognized as an important addition to the setup for better understanding of the results [22]. For total particles, both solid and volatiles, a wide range of emissions has to be covered: from below the solid PN limit up to 3–4 orders of magnitude higher during regeneration events. This is challenging, but feasible for the size distribution instruments. It would, however, require controls with liquid particles mimicking nucleation-mode particles. Furthermore, more studies are necessary comparing real-time size distribution instruments from different manufacturers, because often, high differences are reported [86,94].
5. Conclusions
Three commonly used instruments for particle concentration and size distribution were compared with particles of different material. Particle sizing instruments, EEPS and SMPS, were in good agreement with a CPC, ±25%, when measuring particle concentration. For high particle concentrations of silver particles, the difference between the different instruments was higher due to the higher uncertainty in the CPC, which was measuring in the photometric mode. It was shown that the uncertainty was around 20% for particles in a size range of 25–55 nm. For smaller particles of 10–15 nm, the CPC was underestimating the concentration 50%. These findings highlight the need for further research on the photometric mode, when used.
Particle size distribution measured by SMPS and EEPS were in very good agreement when the “Soot” matrix was used for EEPS. Comparison of the number concentration measured with SMPS and EEPS with the “Soot” matrix gave differences of −10% to 60%. The differences were in function of the particle size for soot particles, with negligible differences for small particles around 10–20 nm and reaching 60% at 80 nm. Different materials gave similar differences, as long as the appropriate matrix was used (“Soot” for agglomerates, “Default”, or “Compact” for spherical particles).
The results were in agreement with the studies in the literature, which also demonstrated improvements with the appropriate matrices. Our results expanded these conclusions for different materials, in particular, for soot and graphite particles, and most importantly, for small particles around 10 nm. This is important for the upcoming vehicle regulations that will require measurements from 10 nm.
Data collected over a 7-year period with various engine technologies gave similar differences or slightly higher. This was attributed to calibration uncertainties in the dilution system that was used and the different penetrations of the sub-23 nm compared to the reference system fulfilling the regulation requirements.
Concluding, this study showed that particle number concentration can be measured accurately enough (mostly within ±40%) and the size distributions are comparable with the SMPS’s, within 5 nm. This uncertainty should be taken into account when using the EEPS. Future evaluation with liquid particles and comparison of instruments from different manufacturers is important.
Author Contributions
Conceptualization, B.G.; formal analysis, B.G.; writing—original draft preparation, B.G.; writing—review and editing, A.M. All authors have read and agreed to the published version of the manuscript.
Funding
This research received no external funding.
Institutional Review Board Statement
Not applicable.
Informed Consent Statement
Not applicable.
Data Availability Statement
Data available upon request.
Acknowledgments
The authors would like to acknowledge AVL (Christos Dardiotis, Roman Davok) for providing the APG, Catalytic Instruments (Martin Irwin, Hans-Joachim Schulz) for providing the silver generator, and Topas (Stefano Somaschi, Stephan Grosse) for providing the salt generator.
Conflicts of Interest
The authors declare no conflict of interest. The opinions expressed in this manuscript are those of the authors and should in no way be considered to represent an official opinion of the European Commission. Mention of trade names or commercial products does not constitute endorsement or recommendation by the authors or the European Commission.
Appendix A
Table A1 summarizes the literature review with studies that evaluated the EEPS with various materials, comparing it with CPC or SMPS.

Table A1.
Overview of studies that compared EEPS with SMPS or CPC. SMPS with butanol CPC unless stated otherwise: water CPC (wCPC).
Table A1.
Overview of studies that compared EEPS with SMPS or CPC. SMPS with butanol CPC unless stated otherwise: water CPC (wCPC).
| Year | Citation | Ref. Instrument | Material | EEPS GMD (nm) | EEPS Conc. × 105 (#/cm3) | Comment |
|---|---|---|---|---|---|---|
| 2013 | [83] | SMPS (wCPC) | silver oxidized | 7–25 | 1.3–48.7 | |
| 2017 | [84] | CPC and SMPS | salt and others | 37 | - | details not given |
| 2009 | [44] | SMPS | salt | 30 | 1.4 | |
| 2009 | [85] | SMPS (wCPC) | salt | 52 | 0.2 | |
| 2013 | [45] | SMPS | salt and others | 41 | 0.1 | |
| 2014 | [15] | SMPS | salt and others | 29–32 | 10 | |
| 2013 | [88] | SMPS (wCPC) | air | 95 | 0.1 | |
| 2014 | [25] | CPC and SMPS | air | 25 | <0.8 | |
| 2015 | [26] | CPC | air | 25 | 0.03–2.5 | |
| 2021 | [89] | SMPS | air | 15–50 | 0.2 | |
| 2007 | [87] | CPC | Diesel | 70 | up to 1000 | |
| 2009 | [44] | SMPS | Diesel | 70–80 | 6–20 | |
| 2013 | [45] | SMPS | soot | 73 | 0.3 | |
| 2014 | [25] | SMPS | Diesel | 70 | 1.0 | |
| 2015 | [26] | CPC | Diesel, GDI | 70–80 | 0.3–1.7 | |
| 2015 | [86] | SMPS | Diesel, GDI, PFI | 12–52 | - | From the CVS |
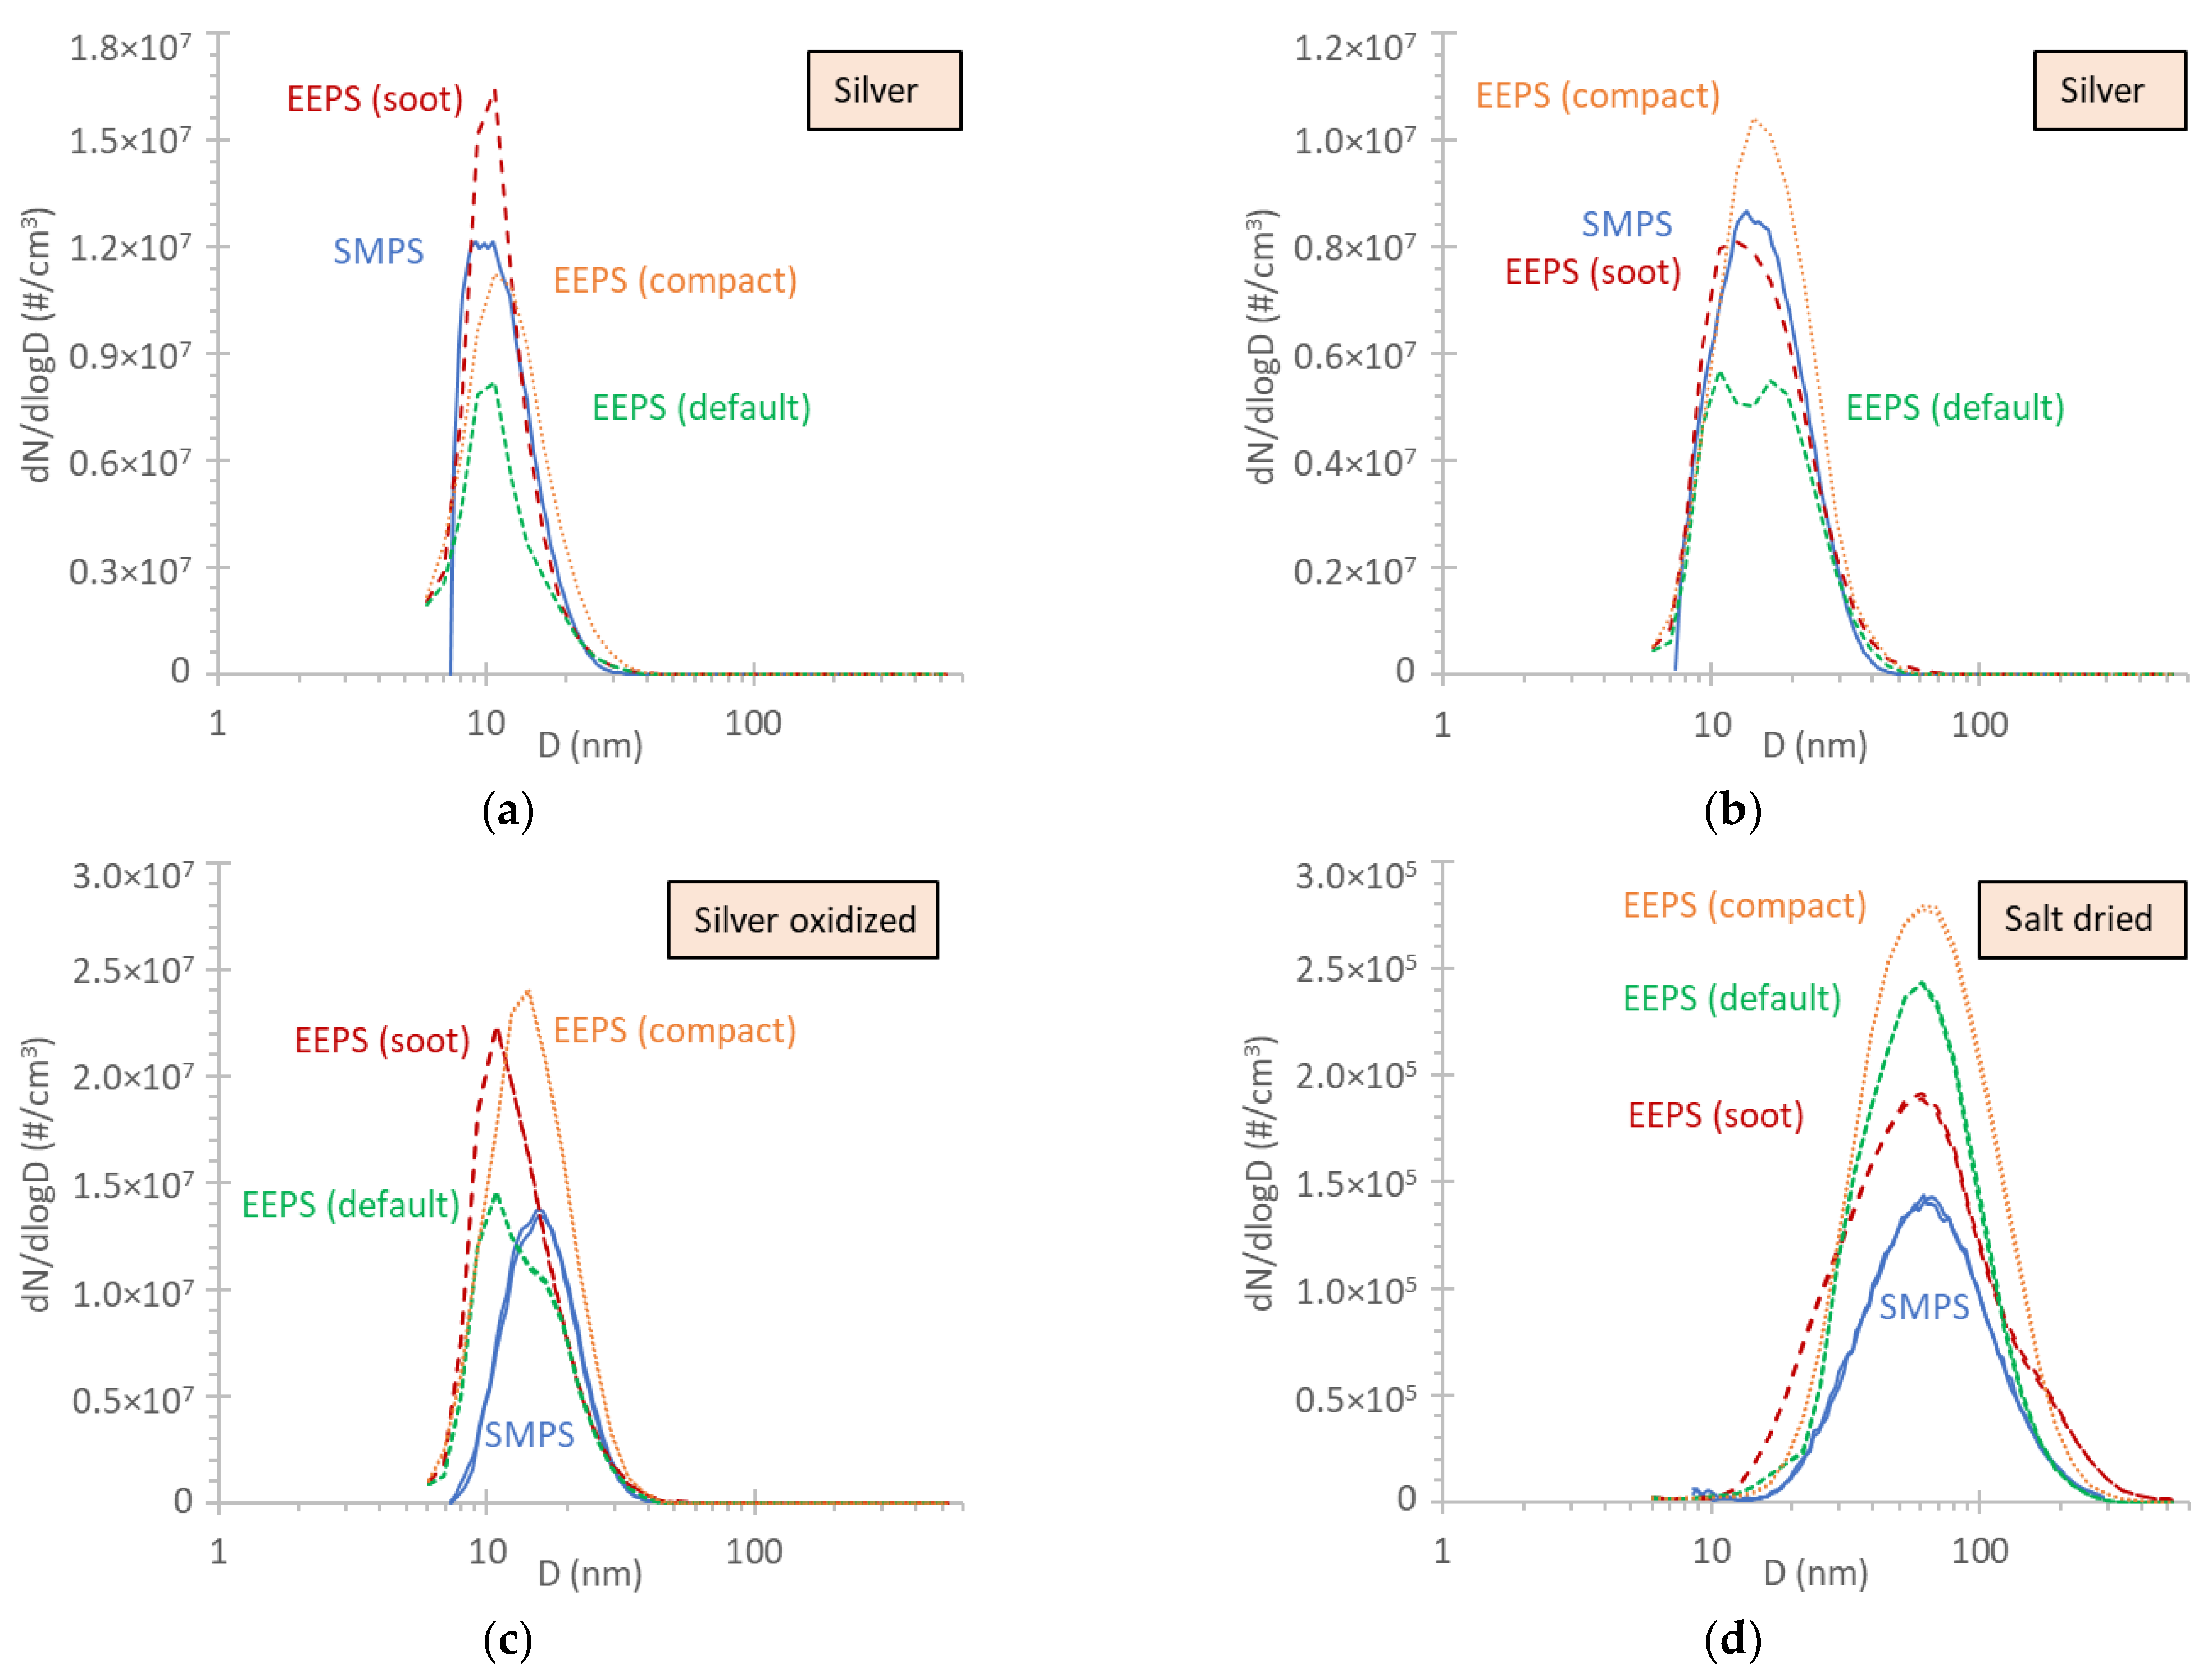
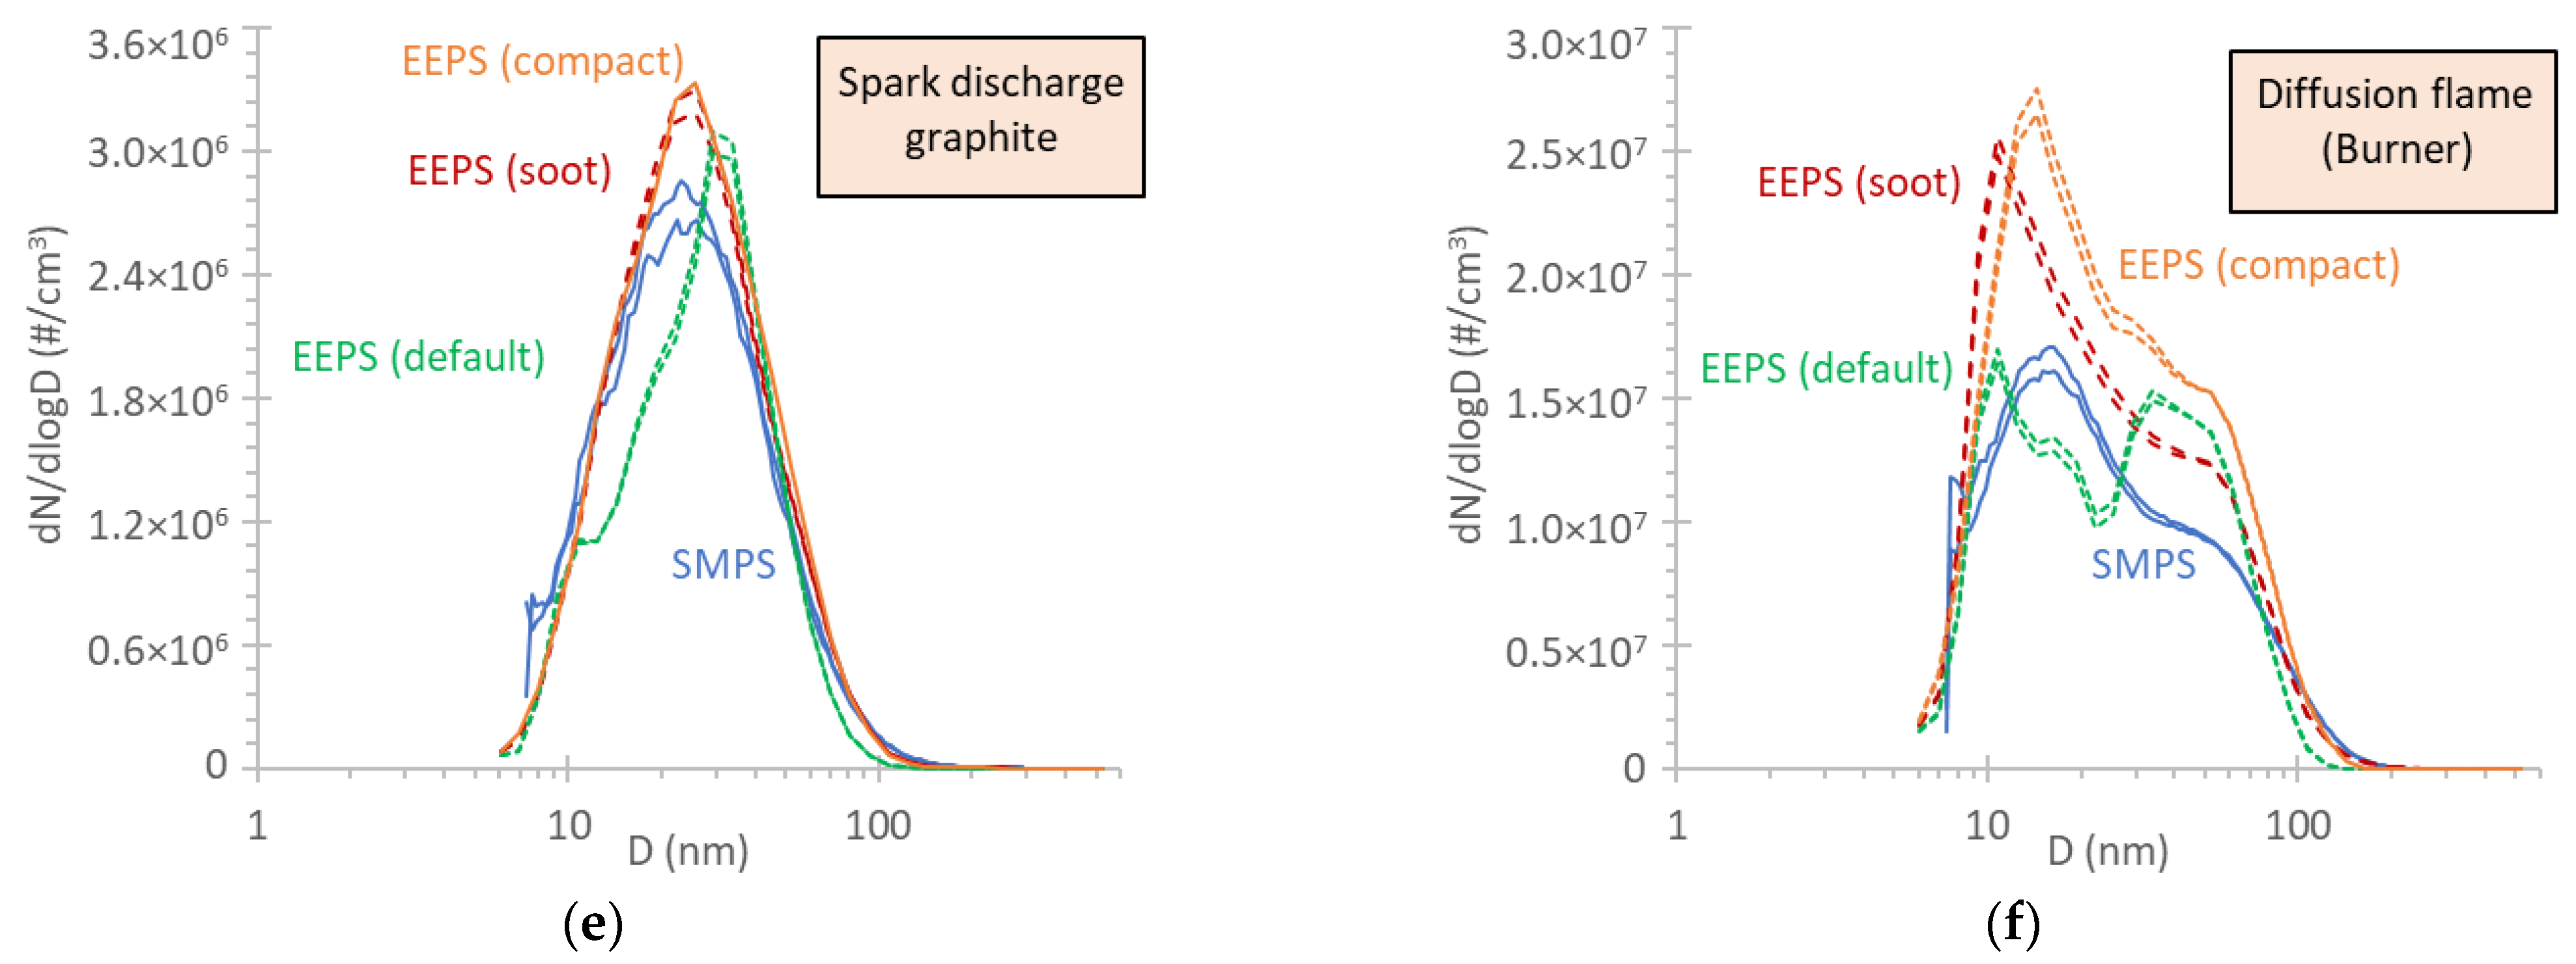
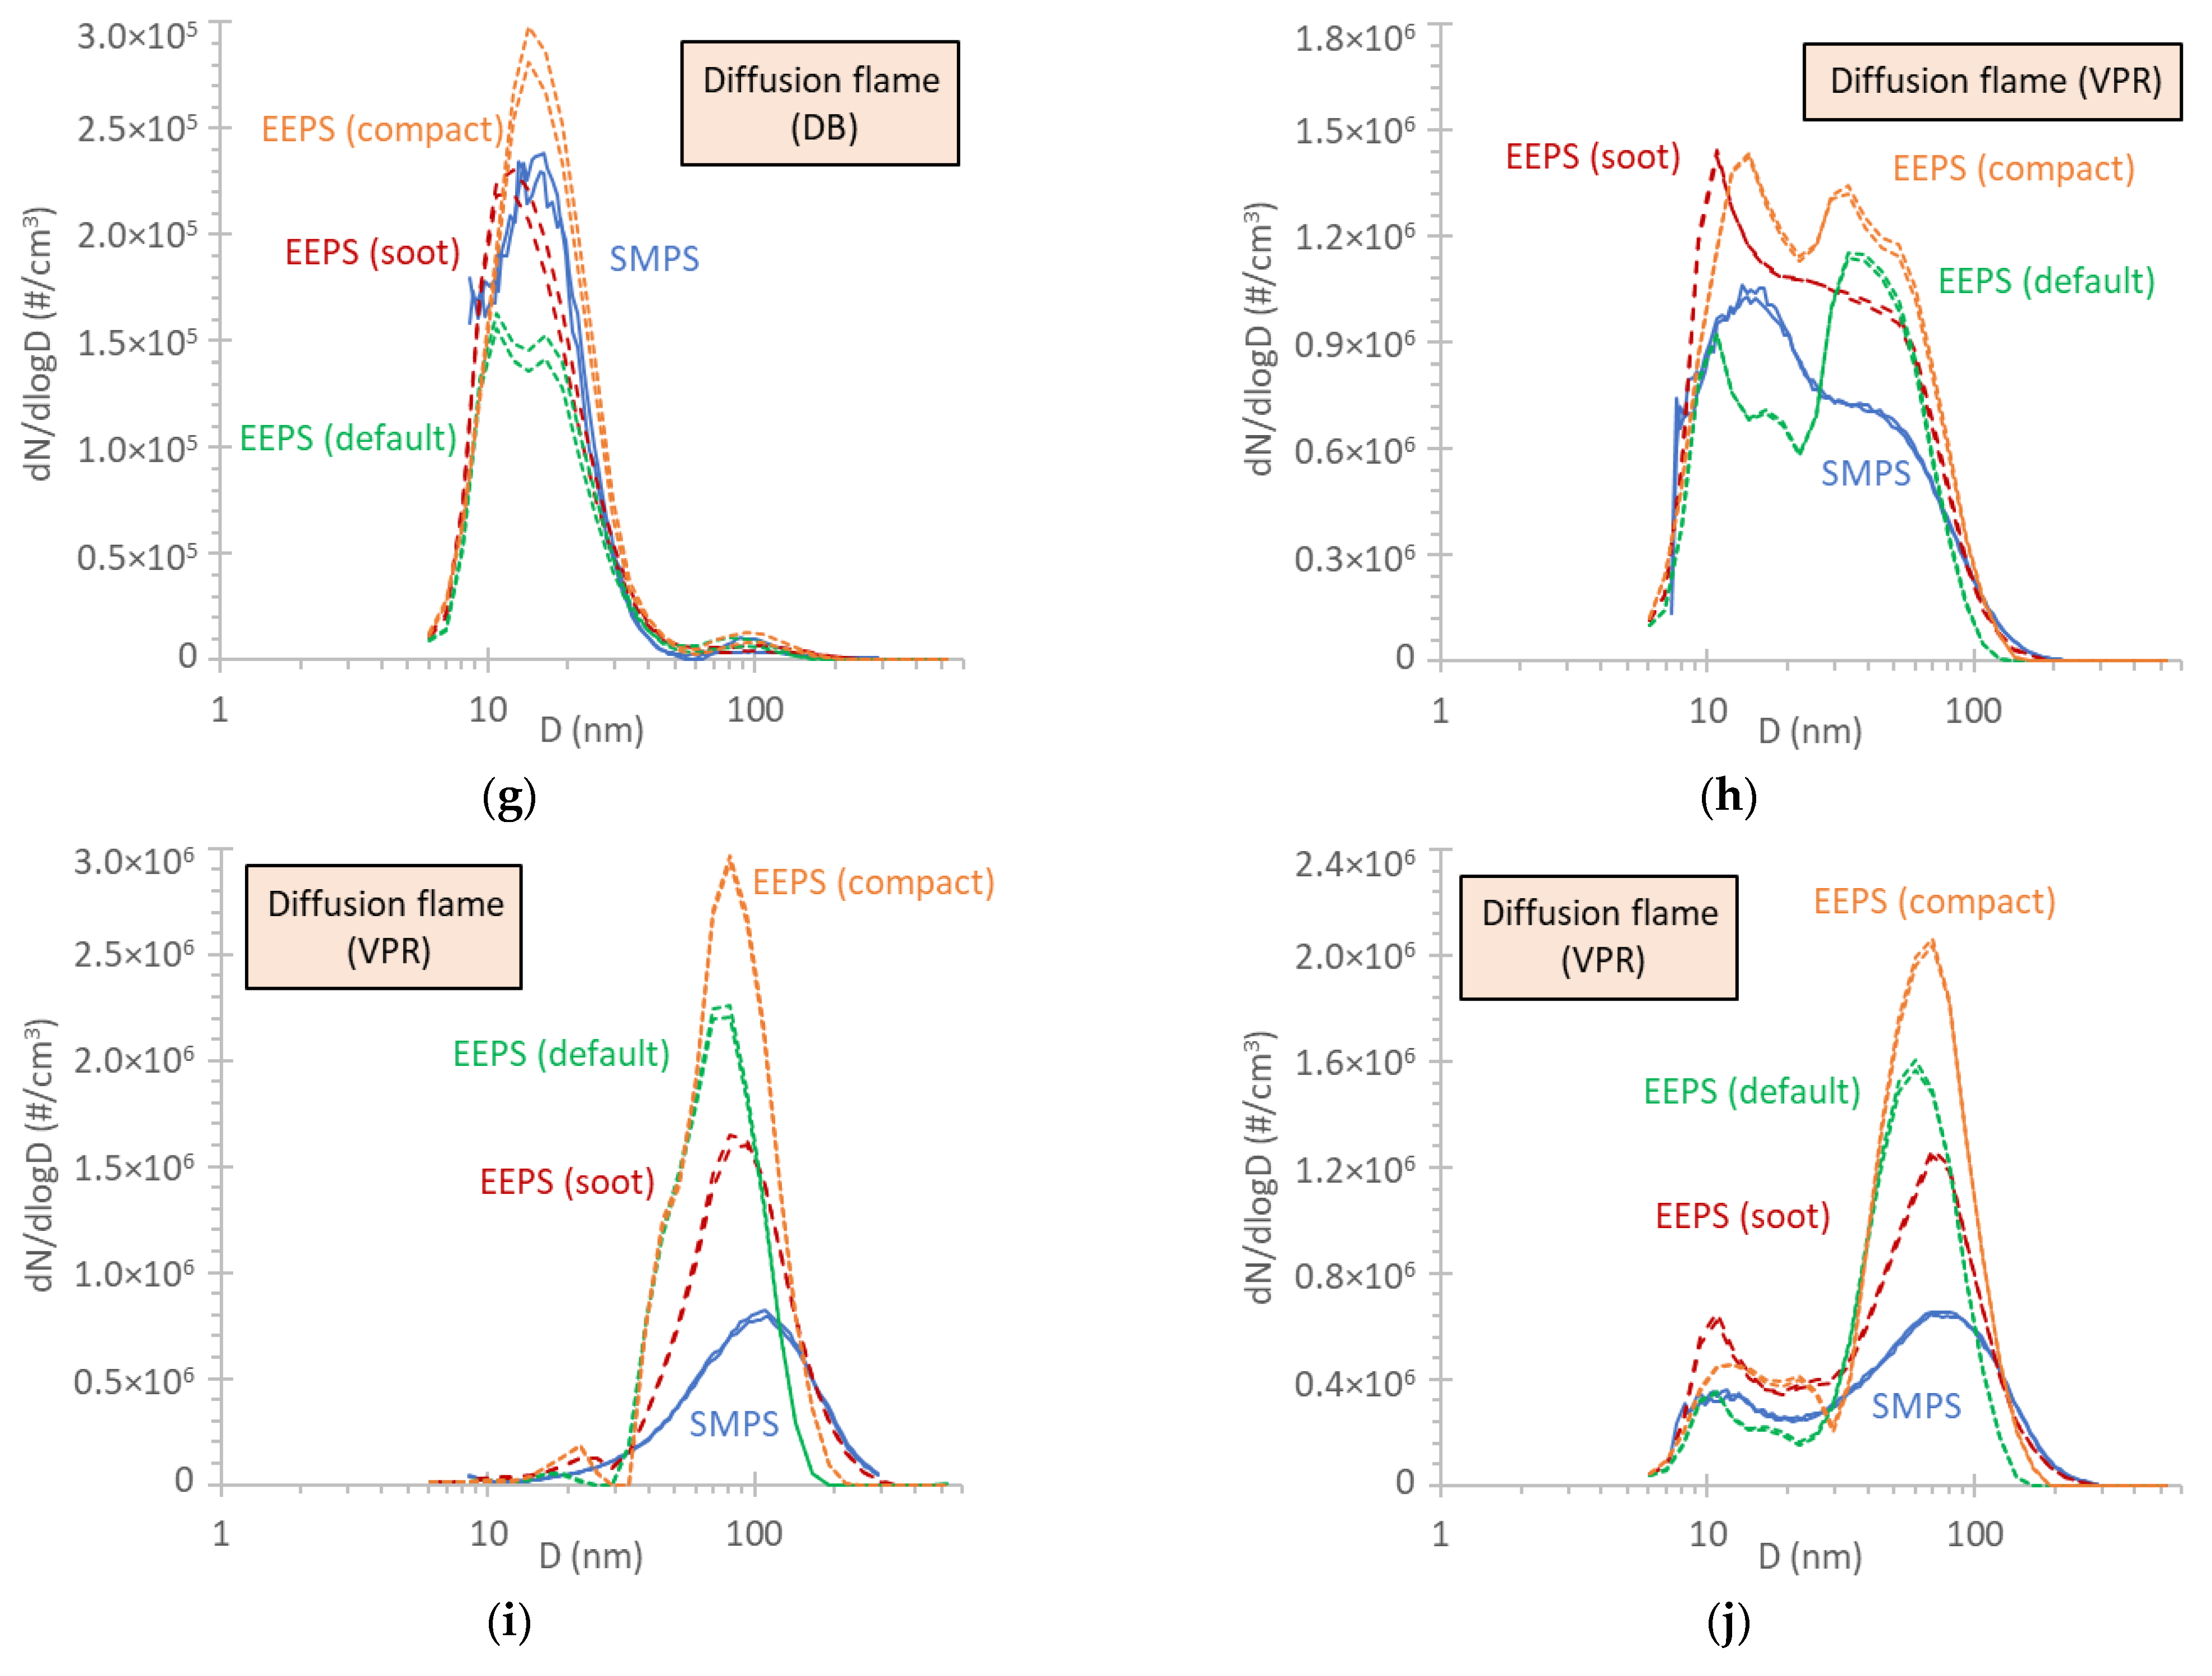
Figure A1 presents the size distributions measured with the SMPS and the EEPS applying the three matrices (“Default”, “Soot”, “Compact”). The settings of the generators can be found in Section 2. The total concentration and geometric mean diameter (GMD) differences were discussed in the main text. The details can be seen in Figure A1 with the measured size distributions. The EEPS, in general, overestimated the concentrations. The peak modes were in good agreement in most cases. For example, focusing at the <20 nm range, for silver (Figure A1a,b) and soot (Figure A1g), the difference in the peaks was <4 nm, while for oxidized silver (Figure A1c) and soot with bimodal distribution, slightly more than 5.5. nm (Figure A1f,h). The “Compact” matrix had better agreement. In the 20–70 nm range, the modes have differences of 5 nm for salt, graphite, and soot (Figure A1d–f). At the >70 nm range, the difference is around 10 nm (Figure A1i,j).
Figure A1.
Size distributions measured with SMPS and EEPS applying the three matrices (“Default”, “Soot”, “Compact”): (a) GWG silver; (b) GWG silver; (c) SPG silver (oxidized); (d) salt (dried); (e) spark discharge graphite; (f) diffusion flame soot directly from the burner (setting 1); (g) diffusion flame soot directly from the VPR (setting 6); (h) diffusion flame soot directly from the VPR (setting 1); (i) diffusion flame soot directly from the VPR (setting 5); (j) diffusion flame soot directly from the VPR (setting 3). Settings can be found in Table 1.


References
- European Environment Agency. Air Quality in Europe: 2020 Report; Publications Office: Luxembourg, 2020. [Google Scholar]
- Giechaskiel, B.; Maricq, M.; Ntziachristos, L.; Dardiotis, C.; Wang, X.; Axmann, H.; Bergmann, A.; Schindler, W. Review of Motor Vehicle Particulate Emissions Sampling and Measurement: From Smoke and Filter Mass to Particle Number. J. Aerosol Sci. 2014, 67, 48–86. [Google Scholar] [CrossRef]
- Ntziachristos, L.; Mamakos, A.; Samaras, Z.; Mathis, U.; Mohr, M.; Thompson, N.; Stradling, R.; Forti, L.; de Serves, C. Overview of the European “Particulates” Project on the Characterization of Exhaust Particulate Emissions from Road Vehicles: Results for Light-Duty Vehicles; Technical Paper 2004-01–1985; SAE International: Warrendale, PA, USA, 2004. [Google Scholar]
- Mohr, M.; Lehmann, U.; Margaria, G. ACEA Programme on the Emissions of Fine Particulates from Passenger Cars (2) Part 2: Effect of Sampling Conditions and Fuel Sulphur Content on the Particle Emission; Technical Paper 2003-01-1890; SAE International: Warrendale, PA, USA, 2003. [Google Scholar]
- Giechaskiel, B.; Dilara, P.; Andersson, J. Particle Measurement Programme (PMP) Light-Duty Inter-Laboratory Exercise: Repeatability and Reproducibility of the Particle Number Method. Aerosol Sci. Technol. 2008, 42, 528–543. [Google Scholar] [CrossRef]
- Giechaskiel, B.; Melas, A.; Martini, G.; Dilara, P. Overview of Vehicle Exhaust Particle Number Regulations. Processes 2021, 9, 2216. [Google Scholar] [CrossRef]
- Bischof, O.F. Recent Developments in the Measurement of Low Particulate Emissions from Mobile Sources: A Review of Particle Number Legislations. Emiss. Control. Sci. Technol. 2015, 1, 203–212. [Google Scholar] [CrossRef] [Green Version]
- DieselNet, Emission Standards 2022. Available online: https://dieselnet.com/standards/ (accessed on 10 October 2022).
- Owen, B.; Anet, J.G.; Bertier, N.; Christie, S.; Cremaschi, M.; Dellaert, S.; Edebeli, J.; Janicke, U.; Kuenen, J.; Lim, L.; et al. Review: Particulate Matter Emissions from Aircraft. Atmosphere 2022, 13, 1230. [Google Scholar] [CrossRef]
- Giechaskiel, B.; Wang, X.; Horn, H.-G.; Spielvogel, J.; Gerhart, C.; Southgate, J.; Jing, L.; Kasper, M.; Drossinos, Y.; Krasenbrink, A. Calibration of Condensation Particle Counters for Legislated Vehicle Number Emission Measurements. Aerosol Sci. Technol. 2009, 43, 1164–1173. [Google Scholar] [CrossRef]
- Wang, X.; Caldow, R.; Sem, G.J.; Hama, N.; Sakurai, H. Evaluation of a Condensation Particle Counter for Vehicle Emission Measurement: Experimental Procedure and Effects of Calibration Aerosol Material. J. Aerosol Sci. 2010, 41, 306–318. [Google Scholar] [CrossRef]
- Wang, S.C.; Flagan, R.C. Scanning Electrical Mobility Spectrometer. Aerosol Sci. Technol. 1990, 13, 230–240. [Google Scholar] [CrossRef]
- Wiedensohler, A.; Birmili, W.; Nowak, A.; Sonntag, A.; Weinhold, K.; Merkel, M.; Wehner, B.; Tuch, T.; Pfeifer, S.; Fiebig, M.; et al. Mobility Particle Size Spectrometers: Harmonization of Technical Standards and Data Structure to Facilitate High Quality Long-Term Observations of Atmospheric Particle Number Size Distributions. Atmos. Meas. Tech. 2012, 5, 657–685. [Google Scholar] [CrossRef] [Green Version]
- Wiedensohler, A.; Wiesner, A.; Weinhold, K.; Birmili, W.; Hermann, M.; Merkel, M.; Müller, T.; Pfeifer, S.; Schmidt, A.; Tuch, T.; et al. Mobility Particle Size Spectrometers: Calibration Procedures and Measurement Uncertainties. Aerosol Sci. Technol. 2018, 52, 146–164. [Google Scholar] [CrossRef]
- Hornsby, K.E.; Pryor, S.C. A Laboratory Comparison of Real-Time Measurement Methods for 10–100-Nm Particle Size Distributions. Aerosol Sci. Technol. 2014, 48, 571–582. [Google Scholar] [CrossRef]
- Liu, P.S.K.; Deshler, T. Causes of Concentration Differences Between a Scanning Mobility Particle Sizer and a Condensation Particle Counter. Aerosol Sci. Technol. 2003, 37, 916–923. [Google Scholar] [CrossRef]
- Keskinen, J.; Pietarinen, K.; Lehtimäki, M. Electrical Low Pressure Impactor. J. Aerosol Sci. 1992, 23, 353–360. [Google Scholar] [CrossRef]
- Biskos, G.; Reavell, K.; Collings, N. Description and Theoretical Analysis of a Differential Mobility Spectrometer. Aerosol Sci. Technol. 2005, 39, 527–541. [Google Scholar] [CrossRef] [Green Version]
- Johnson, T.; Caldow, R.; Pöcher, A.; Mirme, A.; Kittelson, D. A New Electrical Mobility Particle Sizer Spectrometer for Engine Exhaust Particle Measurements; Technical Paper 2004-01-1341; SAE International: Warrendale, PA, USA, 2004. [Google Scholar]
- Takegawa, N.; Murashima, Y.; Fushimi, A.; Misawa, K.; Fujitani, Y.; Saitoh, K.; Sakurai, H. Characteristics of Sub-10 Nm Particle Emissions from In-Use Commercial Aircraft Observed at Narita International Airport. Atmos. Chem. Phys. 2021, 21, 1085–1104. [Google Scholar] [CrossRef]
- Premnath, V.; Khalek, I.A.; Morgan, P. Relationship among Various Particle Characterization Metrics Using GDI Engine Based Light-Duty Vehicles; Technical Paper 2018-01-0353; SAE International: Warrendale, PA, USA, 2018. [Google Scholar]
- Giechaskiel, B.; Melas, A.; Martini, G.; Dilara, P.; Ntziachristos, L. Revisiting Total Particle Number Measurements for Vehicle Exhaust Regulations. Atmosphere 2022, 13, 155. [Google Scholar] [CrossRef]
- Distaso, E.; Amirante, R.; Calò, G.; De Palma, P.; Tamburrano, P. Evolution of Soot Particle Number, Mass and Size Distribution along the Exhaust Line of a Heavy-Duty Engine Fueled with Compressed Natural Gas. Energies 2020, 13, 3993. [Google Scholar] [CrossRef]
- Rubino, L.; Phillips, P.R.; Twigg, M.V. Measurements of Ultrafine Particle Number Emissions from a Light-Duty Diesel Engine Using SMPS, DMS, ELPI and EEPS; Technical Paper 2005-24-015; SAE International: Warrendale, PA, USA, 2005. [Google Scholar]
- Zimmerman, N.; Pollitt, K.J.G.; Jeong, C.-H.; Wang, J.M.; Jung, T.; Cooper, J.M.; Wallace, J.S.; Evans, G.J. Comparison of Three Nanoparticle Sizing Instruments: The Influence of Particle Morphology. Atmos. Environ. 2014, 86, 140–147. [Google Scholar] [CrossRef]
- Zimmerman, N.; Jeong, C.-H.; Wang, J.M.; Ramos, M.; Wallace, J.S.; Evans, G.J. A Source-Independent Empirical Correction Procedure for the Fast Mobility and Engine Exhaust Particle Sizers. Atmos. Environ. 2015, 100, 178–184. [Google Scholar] [CrossRef]
- Quiros, D.C.; Hu, S.; Hu, S.; Lee, E.S.; Sardar, S.; Wang, X.; Olfert, J.S.; Jung, H.S.; Zhu, Y.; Huai, T. Particle Effective Density and Mass during Steady-State Operation of GDI, PFI, and Diesel Passenger Cars. J. Aerosol Sci. 2015, 83, 39–54. [Google Scholar] [CrossRef]
- Zare, A.; Bodisco, T.A.; Verma, P.; Jafari, M.; Babaie, M.; Yang, L.; Rahman, M.M.; Banks, A.P.W.; Ristovski, Z.D.; Brown, R.J.; et al. Particulate Number Emissions during Cold-Start with Diesel and Biofuels: A Special Focus on Particle Size Distribution. Sustain. Energy Technol. Assess. 2022, 51, 101953. [Google Scholar] [CrossRef]
- Feinauer, M.; Ehrenberger, S.; Epple, F.; Schripp, T.; Grein, T. Investigating Particulate and Nitrogen Oxides Emissions of a Plug-In Hybrid Electric Vehicle for a Real-World Driving Scenario. Appl. Sci. 2022, 12, 1404. [Google Scholar] [CrossRef]
- Kim, K.; Chung, W.; Kim, M.; Kim, C.; Myung, C.-L.; Park, S. Inspection of PN, CO2, and Regulated Gaseous Emissions Characteristics from a GDI Vehicle under Various Real-World Vehicle Test Modes. Energies 2020, 13, 2581. [Google Scholar] [CrossRef]
- Giechaskiel, B.; Mamakos, A.; Woodburn, J.; Szczotka, A.; Bielaczyc, P. Evaluation of a 10 Nm Particle Number Portable Emissions Measurement System (PEMS). Sensors 2019, 19, 5531. [Google Scholar] [CrossRef] [PubMed] [Green Version]
- Giechaskiel, B.; Lähde, T.; Gandi, S.; Keller, S.; Kreutziger, P.; Mamakos, A. Assessment of 10-Nm Particle Number (PN) Portable Emissions Measurement Systems (PEMS) for Future Regulations. Int. J. Environ. Res. Public Health 2020, 17, 3878. [Google Scholar] [CrossRef]
- Giechaskiel, B.; Melas, A.; Lähde, T. Detailed Characterization of Solid and Volatile Particle Emissions of Two Euro 6 Diesel Vehicles. Appl. Sci. 2022, 12, 3321. [Google Scholar] [CrossRef]
- Su, S.; Lv, T.; Lai, Y.; Mu, J.; Ge, Y.; Giechaskiel, B. Particulate Emissions of Heavy Duty Diesel Engines Measured from the Tailpipe and the Dilution Tunnel. J. Aerosol Sci. 2021, 156, 105799. [Google Scholar] [CrossRef]
- Kontses, A.; Ntziachristos, L.; Zardini, A.A.; Papadopoulos, G.; Giechaskiel, B. Particulate Emissions from L-Category Vehicles towards Euro 5. Environ. Res. 2020, 182, 109071. [Google Scholar] [CrossRef]
- Mathis, U.; Mohr, M.; Kaegi, R.; Bertola, A.; Boulouchos, K. Influence of Diesel Engine Combustion Parameters on Primary Soot Particle Diameter. Environ. Sci. Technol. 2005, 39, 1887–1892. [Google Scholar] [CrossRef]
- Giechaskiel, B.; Manfredi, U.; Martini, G. Engine Exhaust Solid Sub-23 Nm Particles: I. Literature Survey. SAE Int. J. Fuels Lubr. 2014, 7, 950–964. [Google Scholar] [CrossRef]
- Catapano, F.; Di Iorio, S.; Magno, A.; Sementa, P.; Vaglieco, B.M. Measurement of Sub-23 Nm Particles Emitted from PFI/DI SI Engine Fueled with Oxygenated Fuels: A Comparison between Conventional and Novel Methodologies. Energies 2022, 15, 2021. [Google Scholar] [CrossRef]
- Samaras, Z.; Rieker, M.; Papaioannou, E.; van Dorp, W.F.; Kousoulidou, M.; Ntziachristos, L.; Andersson, J.; Bergmann, A.; Hausberger, S.; Keskinen, J.; et al. Perspectives for Regulating 10 Nm Particle Number Emissions Based on Novel Measurement Methodologies. J. Aerosol Sci. 2022, 162, 105957. [Google Scholar] [CrossRef]
- Mamakos, A.; Schwelberger, M.; Fierz, M.; Giechaskiel, B. Effect of Selective Catalytic Reduction on Exhaust Nonvolatile Particle Emissions of Euro VI Heavy-Duty Compression Ignition Vehicles. Aerosol Sci. Technol. 2019, 53, 898–910. [Google Scholar] [CrossRef] [Green Version]
- Giechaskiel, B.; Bonnel, P.; Perujo, A.; Dilara, P. Solid Particle Number (SPN) Portable Emissions Measurement Systems (PEMS) in the European Legislation: A Review. Int. J. Environ. Res. Public Health 2019, 16, 4819. [Google Scholar] [CrossRef] [PubMed] [Green Version]
- Melas, A.; Selleri, T.; Suarez-Bertoa, R.; Giechaskiel, B. Evaluation of Solid Particle Number Sensors for Periodic Technical Inspection of Passenger Cars. Sensors 2021, 21, 8325. [Google Scholar] [CrossRef]
- Michler, T.; Dörnhöfer, J.; Erforth, D.; Heinz, A.; Scheiber, K.; Weber, P.; Nowak, N.; Kubach, H.; Meyer, J.; Koch, T.; et al. Comparison of Different Particle Measurement Techniques at a Heavy-Duty Diesel Engine Test Bed; Technical Paper 2019-24-0158; SAE International: Warrendale, PA, USA, 2019. [Google Scholar]
- Asbach, C.; Kaminski, H.; Fissan, H.; Monz, C.; Dahmann, D.; Mülhopt, S.; Paur, H.R.; Kiesling, H.J.; Herrmann, F.; Voetz, M.; et al. Comparison of Four Mobility Particle Sizers with Different Time Resolution for Stationary Exposure Measurements. J. Nanopart. Res. 2009, 11, 1593–1609. [Google Scholar] [CrossRef]
- Kaminski, H.; Kuhlbusch, T.A.J.; Rath, S.; Götz, U.; Sprenger, M.; Wels, D.; Polloczek, J.; Bachmann, V.; Dziurowitz, N.; Kiesling, H.-J.; et al. Comparability of Mobility Particle Sizers and Diffusion Chargers. J. Aerosol Sci. 2013, 57, 156–178. [Google Scholar] [CrossRef]
- Giechaskiel, B.; Ntziachristos, L.; Samaras, Z. Effect of Ejector Dilutors on Measurements of Automotive Exhaust Gas Aerosol Size Distributions. Meas. Sci. Technol. 2009, 20, 45703. [Google Scholar] [CrossRef]
- Giechaskiel, B.; Arndt, M.; Schindler, W.; Bergmann, A.; Silvis, W.; Drossinos, Y. Sampling of Non-Volatile Vehicle Exhaust Particles: A Simplified Guide. SAE Int. J. Engines 2012, 5, 379–399. [Google Scholar] [CrossRef]
- Hammer, T.; Irwin, M.; Swanson, J.; Berger, V.; Sonkamble, U.; Boies, A.; Schulz, H.; Vasilatou, K. Characterising the Silver Particle Generator; a Pathway towards Standardising Silver Aerosol Generation. J. Aerosol Sci. 2022, 163, 105978. [Google Scholar] [CrossRef]
- Giechaskiel, B.; Davok, R.; Giovanella, K.M.; Joergl, H.; Diewald, R.; Schindler, W. Particle Generator (APG): A Soot Generator for the On-Site Checks of Particle Number (PN) Measurement Systems. In Proceedings of the JSAE Annual Congress, SAE, Yokohama, Japan, 24 May 2013. [Google Scholar]
- Ess, M.N.; Vasilatou, K. Characterization of a New MiniCAST with Diffusion Flame and Premixed Flame Options: Generation of Particles with High EC Content in the Size Range 30 Nm to 200 Nm. Aerosol Sci. Technol. 2019, 53, 29–44. [Google Scholar] [CrossRef]
- Horvath, H.; Gangl, M. A Low-Voltage Spark Generator for Production of Carbon Particles. J. Aerosol Sci. 2003, 34, 1581–1588. [Google Scholar] [CrossRef]
- Meuller, B.O.; Messing, M.E.; Engberg, D.L.J.; Jansson, A.M.; Johansson, L.I.M.; Norlén, S.M.; Tureson, N.; Deppert, K. Review of Spark Discharge Generators for Production of Nanoparticle Aerosols. Aerosol Sci. Technol. 2012, 46, 1256–1270. [Google Scholar] [CrossRef]
- Tabrizi, N.S.; Ullmann, M.; Vons, V.A.; Lafont, U.; Schmidt-Ott, A. Generation of Nanoparticles by Spark Discharge. J. Nanopart. Res. 2009, 11, 315–332. [Google Scholar] [CrossRef] [Green Version]
- Burtscher, H.; Schmidt-Ott, A.; Siegmann, H.C. Photoelectron Yield of Small Silver and Gold Particles Suspended in Gas up to a Photon Energy of 10 EV. Z. Phys. B Condens. Matter 1984, 56, 197–199. [Google Scholar] [CrossRef]
- Peineke, C.; Attoui, M.B.; Schmidt-Ott, A. Using a Glowing Wire Generator for Production of Charged, Uniformly Sized Nanoparticles at High Concentrations. J. Aerosol Sci. 2006, 37, 1651–1661. [Google Scholar] [CrossRef]
- McMurry, P.H. The History of Condensation Nucleus Counters. Aerosol Sci. Technol. 2000, 33, 297–322. [Google Scholar] [CrossRef] [Green Version]
- TSI Inc. Model 3752 Condensation Particle Counter Operation Manual; P/N 6011194, Revision D; TSI: Shoreview, MN, USA, 2022. [Google Scholar]
- Sem, G.J. Design and Performance Characteristics of Three Continuous-Flow Condensation Particle Counters: A Summary. Atmos. Res. 2002, 62, 267–294. [Google Scholar] [CrossRef]
- Wang, X.; Grose, M.A.; Avenido, A.; Stolzenburg, M.R.; Caldow, R.; Osmondson, B.L.; Chow, J.C.; Watson, J.G. Improvement of Engine Exhaust Particle Sizer (EEPS) Size Distribution Measurement—I. Algorithm and Applications to Compact-Shape Particles. J. Aerosol Sci. 2016, 92, 95–108. [Google Scholar] [CrossRef]
- TSI Inc. Model 3090 Engine Exhaust Particle Sizer Spectrometer Operation and Service Manual; P/N 1980494, Revision M; TSI: Shoreview, MN, USA, 2021. [Google Scholar]
- Shin, W.G.; Wang, J.; Mertler, M.; Sachweh, B.; Fissan, H.; Pui, D.Y.H. The Effect of Particle Morphology on Unipolar Diffusion Charging of Nanoparticle Agglomerates in the Transition Regime. J. Aerosol Sci. 2010, 41, 975–986. [Google Scholar] [CrossRef]
- Wang, X.; Grose, M.A.; Caldow, R.; Osmondson, B.L.; Swanson, J.J.; Chow, J.C.; Watson, J.G.; Kittelson, D.B.; Li, Y.; Xue, J.; et al. Improvement of Engine Exhaust Particle Sizer (EEPS) Size Distribution Measurement—II. Engine Exhaust Particles. J. Aerosol Sci. 2016, 92, 83–94. [Google Scholar] [CrossRef]
- Giechaskiel, B.; Zardini, A.; Martini, G. Particle Emission Measurements from L-Category Vehicles. SAE Int. J. Engines 2015, 8, 2322–2337. [Google Scholar] [CrossRef]
- Giechaskiel, B.; Riccobono, F.; Bonnel, P. Feasibility Study on the Extension of the Real-Driving Emissions (RDE) Procedure to Particle Number (PN): Chassis Dynamometer Evaluation of Portable Emission Measurement Systems (PEMS) to Measure Particle Number (PN) Concentration: Phase II; Publications Office: Luxembourg, 2015; ISBN 978-92-79-51003-8. [Google Scholar]
- Giechaskiel, B.; Lähde, T.; Drossinos, Y. Regulating Particle Number Measurements from the Tailpipe of Light-Duty Vehicles: The next Step? Environ. Res. 2019, 172, 1–9. [Google Scholar] [CrossRef] [PubMed]
- Amanatidis, S.; Ntziachristos, L.; Giechaskiel, B.; Katsaounis, D.; Samaras, Z.; Bergmann, A. Evaluation of an Oxidation Catalyst (“Catalytic Stripper”) in Eliminating Volatile Material from Combustion Aerosol. J. Aerosol Sci. 2013, 57, 144–155. [Google Scholar] [CrossRef]
- Giechaskiel, B.; Cresnoverh, M.; Jörgl, H.; Bergmann, A. Calibration and Accuracy of a Particle Number Measurement System. Meas. Sci. Technol. 2010, 21, 45102. [Google Scholar] [CrossRef]
- Giechaskiel, B.; Bergmann, A. Validation of 14 Used, Re-Calibrated and New TSI 3790 Condensation Particle Counters According to the UN-ECE Regulation 83. J. Aerosol Sci. 2011, 42, 195–203. [Google Scholar] [CrossRef]
- Olfert, J.S.; Symonds, J.P.R.; Collings, N. The Effective Density and Fractal Dimension of Particles Emitted from a Light-Duty Diesel Vehicle with a Diesel Oxidation Catalyst. J. Aerosol Sci. 2007, 38, 69–82. [Google Scholar] [CrossRef]
- Abegglen, M.; Durdina, L.; Brem, B.T.; Wang, J.; Rindlisbacher, T.; Corbin, J.C.; Lohmann, U.; Sierau, B. Effective Density and Mass-Mobility Exponents of Particulate Matter in Aircraft Turbine Exhaust: Dependence on Engine Thrust and Particle Size. J. Aerosol Sci. 2015, 88, 135–147. [Google Scholar] [CrossRef]
- Austin, J.; Minelli, C.; Hamilton, D.; Wywijas, M.; Jones, H.J. Nanoparticle Number Concentration Measurements by Multi-Angle Dynamic Light Scattering. J. Nanopart. Res. 2020, 22, 108. [Google Scholar] [CrossRef]
- Mamakos, A.; Giechaskiel, B.; Drossinos, Y. Experimental and Theoretical Investigations of the Effect of the Calibration Aerosol Material on the Counting Efficiencies of TSI 3790 Condensation Particle Counters. Aerosol Sci. Technol. 2013, 47, 11–21. [Google Scholar] [CrossRef]
- Mamakos, A. Methodology to Quantify the Ratio of Multiple-to Single-Charged Fractions Acquired in Aerosol Neutralizers. Aerosol Sci. Technol. 2016, 50, 363–372. [Google Scholar] [CrossRef] [Green Version]
- Maricq, M.M. Bipolar Diffusion Charging of Soot Aggregates. Aerosol Sci. Technol. 2008, 42, 247–254. [Google Scholar] [CrossRef]
- Johnson, T.J.; Nishida, R.T.; Zhang, X.; Symonds, J.P.R.; Olfert, J.S.; Boies, A.M. Generating an Aerosol of Homogeneous, Non-Spherical Particles and Measuring Their Bipolar Charge Distribution. J. Aerosol Sci. 2021, 153, 105705. [Google Scholar] [CrossRef]
- Xiao, K.; Swanson, J.J.; Pui, D.Y.H.; Kittelson, D.B. Bipolar Diffusion Charging of Aggregates. Aerosol Sci. Technol. 2012, 46, 794–803. [Google Scholar] [CrossRef] [Green Version]
- de La Verpilliere, J.L.; Swanson, J.J.; Boies, A.M. Unsteady Bipolar Diffusion Charging in Aerosol Neutralisers: A Non-Dimensional Approach to Predict Charge Distribution Equilibrium Behaviour. J. Aerosol Sci. 2015, 86, 55–68. [Google Scholar] [CrossRef] [Green Version]
- Forsyth, B.; Liu, B.Y.H.; Romay, F.J. Particle Charge Distribution Measurement for Commonly Generated Laboratory Aerosols. Aerosol Sci. Technol. 1998, 28, 489–501. [Google Scholar] [CrossRef]
- Tsai, C.-J.; Lin, J.-S.; Deshpande, C.G.; Liu, L.-C. Electrostatic Charge Measurement and Charge Neutralization of Fine Aerosol Particles during the Generation Process. Part. Part. Syst. Charact. 2005, 22, 293–298. [Google Scholar] [CrossRef]
- Giechaskiel, B.; Martini, G. Engine Exhaust Solid Sub-23 Nm Particles: II. Feasibility Study for Particle Number Measurement Systems. SAE Int. J. Fuels Lubr. 2014, 7, 935–949. [Google Scholar] [CrossRef]
- Keller, A.; Tritscher, T.; Burtscher, H. Performance of Water-Based CPC 3788 for Particles from a Propane-Flame Soot-Generator Operated with Rich Fuel/Air Mixtures. J. Aerosol Sci. 2013, 60, 67–72. [Google Scholar] [CrossRef]
- Yli-Ojanperä, J.; Sakurai, H.; Iida, K.; Mäkelä, J.M.; Ehara, K.; Keskinen, J. Comparison of Three Particle Number Concentration Calibration Standards through Calibration of a Single CPC in a Wide Particle Size Range. Aerosol Sci. Technol. 2012, 46, 1163–1173. [Google Scholar] [CrossRef]
- Awasthi, A.; Wu, B.-S.; Liu, C.-N.; Chen, C.-W.; Uang, S.-N.; Tsai, C.-J. The Effect of Nanoparticle Morphology on the Measurement Accuracy of Mobility Particle Sizers. MAPAN 2013, 28, 205–215. [Google Scholar] [CrossRef]
- Bau, S.; Payet, R.; Witschger, O.; Jankowska, E. Performance Study of Portable Devices for the Real-Time Measurement of Airborne Particle Number Concentration and Size (Distribution). J. Phys. Conf. Ser. 2017, 838, 12001. [Google Scholar] [CrossRef]
- Jeong, C.-H.; Evans, G.J. Inter-Comparison of a Fast Mobility Particle Sizer and a Scanning Mobility Particle Sizer Incorporating an Ultrafine Water-Based Condensation Particle Counter. Aerosol Sci. Technol. 2009, 43, 364–373. [Google Scholar] [CrossRef] [Green Version]
- Xue, J.; Li, Y.; Wang, X.; Durbin, T.D.; Johnson, K.C.; Karavalakis, G.; Asa-Awuku, A.; Villela, M.; Quiros, D.; Hu, S.; et al. Comparison of Vehicle Exhaust Particle Size Distributions Measured by SMPS and EEPS during Steady-State Conditions. Aerosol Sci. Technol. 2015, 49, 984–996. [Google Scholar] [CrossRef] [Green Version]
- Konstandopoulos, A.G.; Zarvalis, D.; Dolios, I. Multi-Instrumental Assessment of Diesel Particulate Filters; Technical Paper 2007-01-0313; SAE International: Warrendale, PA, USA, 2007. [Google Scholar]
- Lee, B.P.; Li, Y.J.; Flagan, R.C.; Lo, C.; Chan, C.K. Sizing Characterization of the Fast-Mobility Particle Sizer (FMPS) Against SMPS and HR-ToF-AMS. Aerosol Sci. Technol. 2013, 47, 1030–1037. [Google Scholar] [CrossRef] [Green Version]
- Lin, Y.; Pham, L.; Wang, X.; Bahreini, R.; Jung, H.S. Evaluation of Fast Mobility Particle Sizer (FMPS) for Ambient Aerosol Measurement. Aerosol Air Qual. Res. 2021, 21, 200525. [Google Scholar] [CrossRef]
- Levin, M.; Witschger, O.; Bau, S.; Jankowska, E.; Koponen, I.K.; Koivisto, A.J.; Clausen, P.A.; Jensen, A.; Mølhave, K.; Asbach, C.; et al. Can We Trust Real Time Measurements of Lung Deposited Surface Area Concentrations in Dust from Powder Nanomaterials? Aerosol Air Qual. Res. 2016, 16, 1105–1117. [Google Scholar] [CrossRef] [Green Version]
- Leskinen, J.; Joutsensaari, J.; Lyyränen, J.; Koivisto, J.; Ruusunen, J.; Järvelä, M.; Tuomi, T.; Hämeri, K.; Auvinen, A.; Jokiniemi, J. Comparison of Nanoparticle Measurement Instruments for Occupational Health Applications. J. Nanopart. Res. 2012, 14, 718. [Google Scholar] [CrossRef]
- Jørgensen, R.B. Comparison of Four Nanoparticle Monitoring Instruments Relevant for Occupational Hygiene Applications. J. Occup. Med. Toxicol. 2019, 14, 28. [Google Scholar] [CrossRef]
- Gini, M.I.; Helmis, C.; Melas, A.D.; Papanastasiou, D.; Orfanopoulos, G.; Giannakopoulos, K.P.; Drossinos, Y.; Eleftheriadis, K. Characterization of Carbon Fractal-like Aggregates by Size Distribution Measurements and Theoretical Calculations. Aerosol Sci. Technol. 2016, 50, 133–147. [Google Scholar] [CrossRef]
- Zervas, E.; Dorlhène, P. Comparison of Exhaust Particle Number Measured by EEPS, CPC, and ELPI. Aerosol Sci. Technol. 2006, 40, 977–984. [Google Scholar] [CrossRef]
Figure 1.
Experimental setup. C.I. = Catalytic Instruments; CPC = condensation particle counter; EEPS = engine exhaust particle sizer; GWG = glowing wire generator; LDMA = long differential mobility analyzer; SMPS = scanning mobility particle sizer.
Figure 1.
Experimental setup. C.I. = Catalytic Instruments; CPC = condensation particle counter; EEPS = engine exhaust particle sizer; GWG = glowing wire generator; LDMA = long differential mobility analyzer; SMPS = scanning mobility particle sizer.

Figure 2.
Control of reference instruments: (a) CPC 3752 photometric mode and single-counting mode with various materials with sizes 10–15 nm for silver, 30 nm for soot and graphite, and 60 nm for salt; (b) efficiency of CPC 3010 vs. CPC 3752 with various materials having applied the calibration factors: 6% at CPC 3752 and 10% at CPC 3010.

Figure 3.
Vehicle testing: (a) experimental setup; (b) instrument penetrations. APC = AVL particle counter; CS = catalytic stripper; CVS = constant volume sampling; D = electrical mobility diameter; EEPS = engine exhaust particle sizer; ET = evaporation tube.
Figure 3.
Vehicle testing: (a) experimental setup; (b) instrument penetrations. APC = AVL particle counter; CS = catalytic stripper; CVS = constant volume sampling; D = electrical mobility diameter; EEPS = engine exhaust particle sizer; ET = evaporation tube.

Figure 4.
PN concentration ratio (SMPS or EEPS to CPC) in function of the CPC concentrations for various materials: (a) SMPS; (b) EEPS. “D” refers to the “Default” EEPS matrix (solid symbols), “S” refers to the “Soot” EEPS matrix (open symbols). CPC in photometric mode, except silver points indicated “with dilution”.

Figure 5.
PN concentration ratio (SMPS or EEPS to CPC) in function of the geometric mean diameter (GMD) for various materials: (a) SMPS; (b) EEPS. “D” refers to the “Default” EEPS matrix (solid symbols), “S” refers to the “Soot” EEPS matrix (open symbols). CPC in photometric mode, except silver points indicated “with dilution”.

Figure 6.
PN concentration ratio (EEPS to SMPS) in function of: (a) the SMPS concentration; (b) geometric mean diameter (GMD) of SMPS. “D” refers to the “Default” EEPS matrix (solid symbols), “S” refers to the “Soot” EEPS matrix (open symbols).
Figure 6.
PN concentration ratio (EEPS to SMPS) in function of: (a) the SMPS concentration; (b) geometric mean diameter (GMD) of SMPS. “D” refers to the “Default” EEPS matrix (solid symbols), “S” refers to the “Soot” EEPS matrix (open symbols).

Figure 7.
Correlation between EEPS and SMPS: (a) geometric mean diameter (GMD); (b) geometric standard deviation (GSD). Solid symbols refer to the “Default” EEPS matrix, open symbols refer to the “Soot” EEPS matrix.
Figure 7.
Correlation between EEPS and SMPS: (a) geometric mean diameter (GMD); (b) geometric standard deviation (GSD). Solid symbols refer to the “Default” EEPS matrix, open symbols refer to the “Soot” EEPS matrix.

Figure 8.
Overview of literature studies. (a) PN concentration ratio (EEPS to reference) in function of the reference instrument (CPC or SMPS) concentration; (b) Correlation between EEPS and SMPS: (a) geometric mean diameter (GMD). All studies used the “Default” EEPS matrix, except those with a black frame that used the “Soot” EEPS matrix. Data from: silver [83], salt [15,44,45,84,85], vehicle exhaust [25,26,44,45,86,87], and ambient [25,26,88,89].

Figure 9.
Overview of internal JRC data (details in the text). EEPS to reference PMP systems, both measuring solid particles from around 10 nm. The EEPS was used downstream of a catalytic stripper. In function of: (a) concentration levels measured with the PMP system; (b) geometric mean diameter (GMD). Both “Default” and “Soot” EEPS matrices are included. Each point is one vehicle. Error bars give one standard deviation of many measurements with the specific vehicle. 2s = two-stroke; 4s = four-stroke; CNG = compressed natural gas; DPF = Diesel particulate filter; EEPS = engine exhaust particle sizer; GDI = gasoline direct injection; GMD = geometric mean diameter; GPF = gasoline particulate filter; LNG = liquefied natural gas; LPG = liquefied petroleum gas; PFI = port fuel injection; PMP = particle measurement program.

Table 1.
Settings of the AVL particle generator (APG). PN and GMD refer to the inlet of the instruments (i.e., after the ejector diluter).
Table 1.
Settings of the AVL particle generator (APG). PN and GMD refer to the inlet of the instruments (i.e., after the ejector diluter).
| Setting | Fuel Propane (mL/min) | Mixing N2 (mL/min) | Oxidation Air (L/min) | Burner Air (L/min) | Sampling Position | PN (#/cm3) | GMD (nm) | Example |
|---|---|---|---|---|---|---|---|---|
| 1 | 21 | 15 | 0.70 | 3 | Burner | 1.3 × 10⁷ | 24 * | Figure A1f |
| 1 | 21 | 15 | 0.70 | 3 | VPR | 8.5 × 10⁵ | 24 * | Figure A1h |
| 2 | 21 | 5 | 0.70 | 3 | VPR | 7.0 × 10⁵ | 32 * | - |
| 3 | 21 | 0 | 0.70 | 3 | VPR | 5.5 × 10⁵ | 43 * | Figure A1j |
| 4 | 21 | 0 | 0.80 | 3 | VPR | 5.5 × 10⁵ | 76 | - |
| 5 | 21 | 0 | 1.00 | 3 | VPR | 4.7 × 10⁵ | 85 | Figure A1i |
| 6 | 21 | 0 | 0.37 | 3 | VPR | 6.7 × 10⁵ | 15 | - |
| 6 | 21 | 0 | 0.37 | 3 | DB | 1.2 × 10⁵ | 16 | Figure A1g |
* Asterisk indicates bimodal size distribution. “#” is for number of particles. DB = dilution bridge; GMD = geometric mean diameter; PN = particle number; VPR = volatile particle remover.
Publisher’s Note: MDPI stays neutral with regard to jurisdictional claims in published maps and institutional affiliations. |
© 2022 by the authors. Licensee MDPI, Basel, Switzerland. This article is an open access article distributed under the terms and conditions of the Creative Commons Attribution (CC BY) license (https://creativecommons.org/licenses/by/4.0/).
Share and Cite
MDPI and ACS Style
Giechaskiel, B.; Melas, A. Comparison of Particle Sizers and Counters with Soot-like, Salt, and Silver Particles. Atmosphere 2022, 13, 1675. https://doi.org/10.3390/atmos13101675
AMA Style
Giechaskiel B, Melas A. Comparison of Particle Sizers and Counters with Soot-like, Salt, and Silver Particles. Atmosphere. 2022; 13(10):1675. https://doi.org/10.3390/atmos13101675
Chicago/Turabian StyleGiechaskiel, Barouch, and Anastasios Melas. 2022. "Comparison of Particle Sizers and Counters with Soot-like, Salt, and Silver Particles" Atmosphere 13, no. 10: 1675. https://doi.org/10.3390/atmos13101675
Note that from the first issue of 2016, this journal uses article numbers instead of page numbers. See further details here.