Article

Observed Changes in Climate Conditions and Weather-Related Risks in Fruit and Grape Production in Serbia

by
Mirjam Vujadinović Mandić
1,*,
Ana Vuković Vimić
1,
Zorica Ranković-Vasić
1,
Dejan Đurović
1,
Marija Ćosić
1,
Dunja Sotonica
1,
Dragan Nikolić
1 and
Vladimir Đurđević
2
1
Faculty of Agriculture, University of Belgrade, Nemanjina 6, 11080 Belgrade, Serbia
2
Faculty of Physics, University of Belgrade, Dobračina 16, 11000 Belgrade, Serbia
*
Author to whom correspondence should be addressed.
Atmosphere 2022, 13(6), 948; https://doi.org/10.3390/atmos13060948
Submission received: 11 May 2022 / Revised: 24 May 2022 / Accepted: 6 June 2022 / Published: 10 June 2022
(This article belongs to the Section Climatology)

Abstract

:
Climate change, through changes in temperature, precipitation, and frequency of extreme events, has influenced agricultural production and food security over the past several decades. In order to assess climate and weather-related risks to fruit and grape production in Serbia, changes in bioclimatic indices and frequency of the occurrence of unfavourable weather events are spatially analysed for the past two decades (1998–2017) and the standard climatological period 1961–1990. Between the two periods, the Winkler and Huglin indices changed into a warmer category in most of the viticultural regions of Serbia. The average change shift was about 200 m towards higher elevations. Regarding the frequency of spring frost, high summer temperatures and water deficit, the most vulnerable regions in terms of fruit and grape production are found alongside large rivers (Danube, Sava, Great and South Morava), as well as in the northern part of the country. Regions below 300 m are under increased risk of high summer temperatures, as the number and duration of occurrences increased significantly over the studied periods. The high-resolution spatial analysis presented here gives an assessment of the climate change influence on the fruit and grapes production. The presented approach may be used in regional impact assessments and national planning of adaptation measures, and it may help increase resilience of agricultural production to climate change.

1. Introduction

Climate change has impacted agricultural production all over the world. Observed warming, change in precipitation patterns, increased frequency and intensity of extreme weather events such as heat waves, droughts, and intensive precipitation directly influences plant physiological processes during growth and development and, consequently, production and quality of yields [1,2]. A prolonged vegetation season, the earlier date of the last spring frost and the later date of the first autumn frost, as well as increased temperature sums of active and effective temperatures during the vegetation have been observed across Europe [3,4]. The rapid pace of observed changes in climate puts agricultural plants, especially perennials such as fruit trees and grapevines, under abiotic stress [5,6,7].
Since the 1980s, Serbia has experienced a warming of the mean annual temperature of about 0.6 °C per decade, which overshoots the global average [8]. In the period 2008–2017, the number of heat waves increased 2 to 3 times in comparison to 1961–1990, the number of days with precipitation above 20 mm doubled, and the number of days with precipitation above 40 mm increased by 5 times, while drought occurrence increased by 4 times [9].
Observed changes affected agricultural production in Serbia, which accounts for about 6% of the country’s GDP. Fruit and grape-growing account for 11% of the total agricultural production in Serbia. According to the Statistical Office of the Republic of Serbia [10], from a total of 3,504,290 ha of agricultural land, orchards make up 5.3% and vineyards make up 0.6%. The largest land surfaces are under plums (73,010 ha), apples (26,630 ha), raspberries (24,028 ha), grapes (19,840 ha), and sour cherries (19,601 ha). The most intensive fruit production is located in the western and central regions of the country. More detailed data of orchard and vineyard surfaces in statistical regions of Serbia are given in Appendix A (Table A1 and Figure A1). An increase in fruit and grape production in Serbia was observed over the last two decades [11,12]. However, large variability in yields was also noted and mainly attributed to weather-related extremes and events, such as low winter temperatures, late spring frosts, hail, droughts, and waterlogging [11].
Unfortunately, there is no systematic estimate of the total losses and damage caused by the weather events in Serbia. Statistical data on yields over the last 16 years show a large variability of apricot and plum yields; significant yield reduction for apricots, peaches, and sour cherries once in 3 or 4 years; plums, pears, and raspberries once in 5 years; and apples once in 8 years [13]. In most cases, it is difficult to point out a single weather event that caused this yield loss since it is typically a combination of at least two unfavourable events, often occurring in different seasons. The largest losses are recorded in years with droughts, heat waves, or intensive spring frost.
A study [14] showed that farmers in Serbia are aware of climate change impacts on their practices. They are mostly concerned about droughts, high summer temperatures, late spring frost, and hail. As a consequence of climate change, they have already noted yield reduction, occurrence of new pest and diseases, as well as lower tolerance to existing ones. According to their assessment, these events caused 30 to 50% profit loss in orchards and 10 to 30% in vineyards.
Climate change projections predict further intensification of already observed signals over the next several decades. In comparison to the 1986–2005 period, and depending on the future emissions of greenhouse gases, by the end of the century, Serbia may expect additional warming of 2 to 4.3 °C, 2.3 to 4.7 °C warmer and 20–40% dryer summers, an additional 3 to 7 extreme hot waves per year, an additional 30 to 50 days with intensive precipitation above 30 mm, and drought in 8 out of 10 years [8,9]. Expected changes will most certainly put the agricultural production under high pressure, which implies a constant need for (1) careful monitoring and assessment of climate change and its impacts, and (2) strategical planning of adaptation measures, on both national and local levels.
The aim of this study is to spatially analyse changes in the most important climate characteristics and frequency of weather-related risks in fruit and grape production over the last two decades across Serbia, and to compare them to the standard climatological period 1961–1990 in order to investigate their tendencies and statistical significance.

2. Materials and Methods
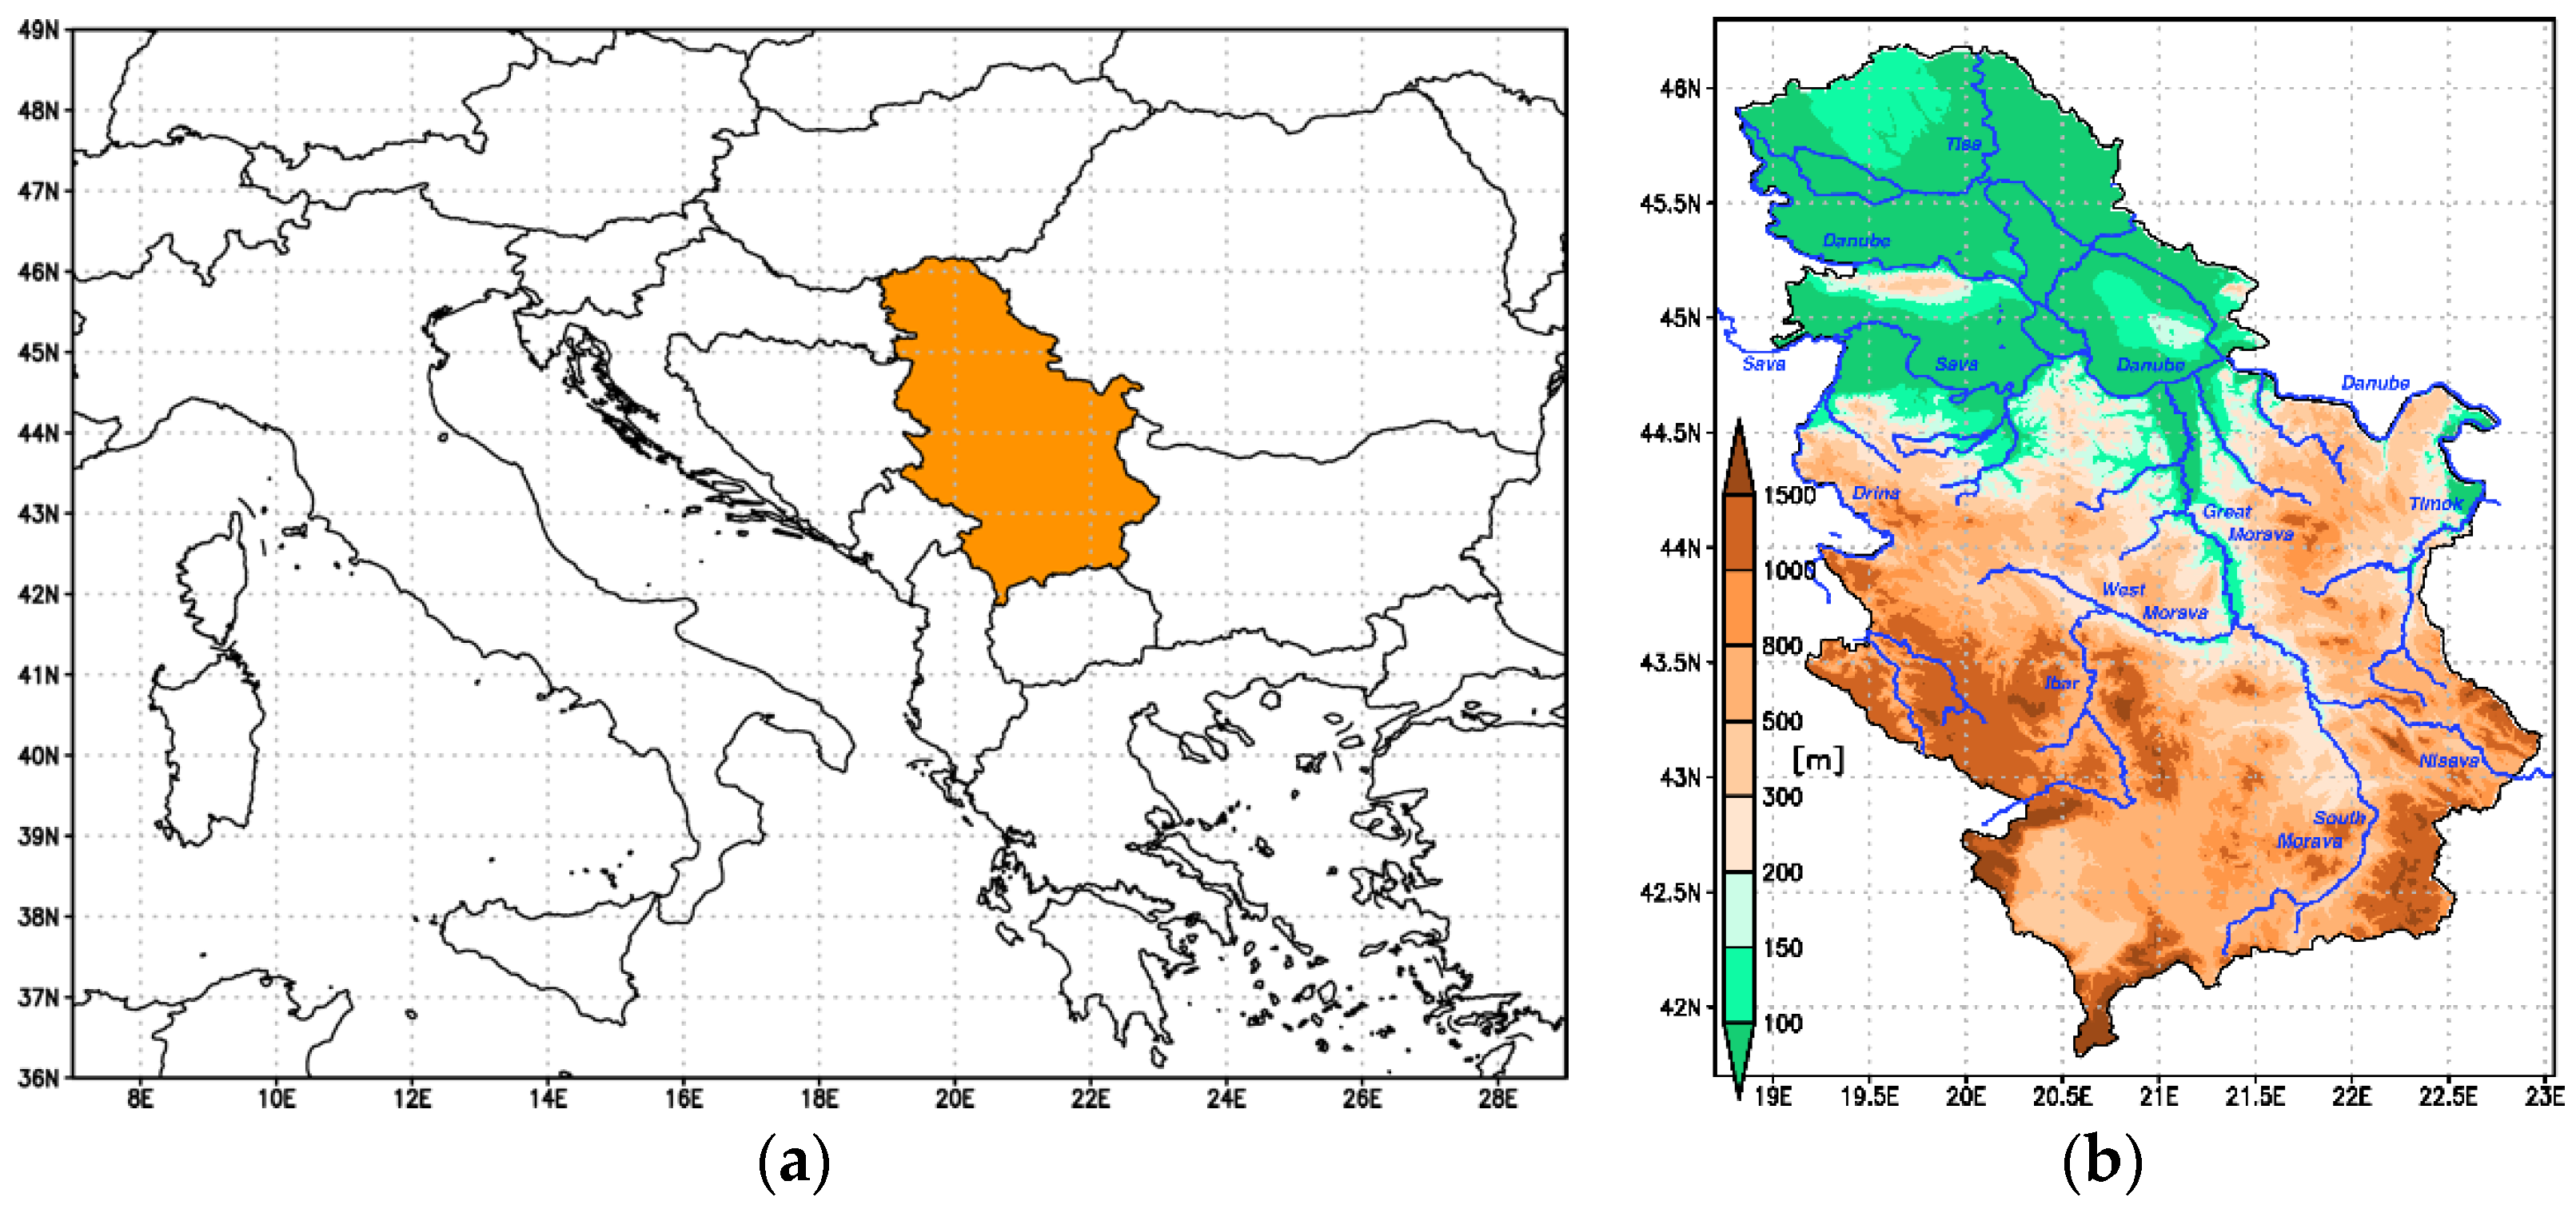
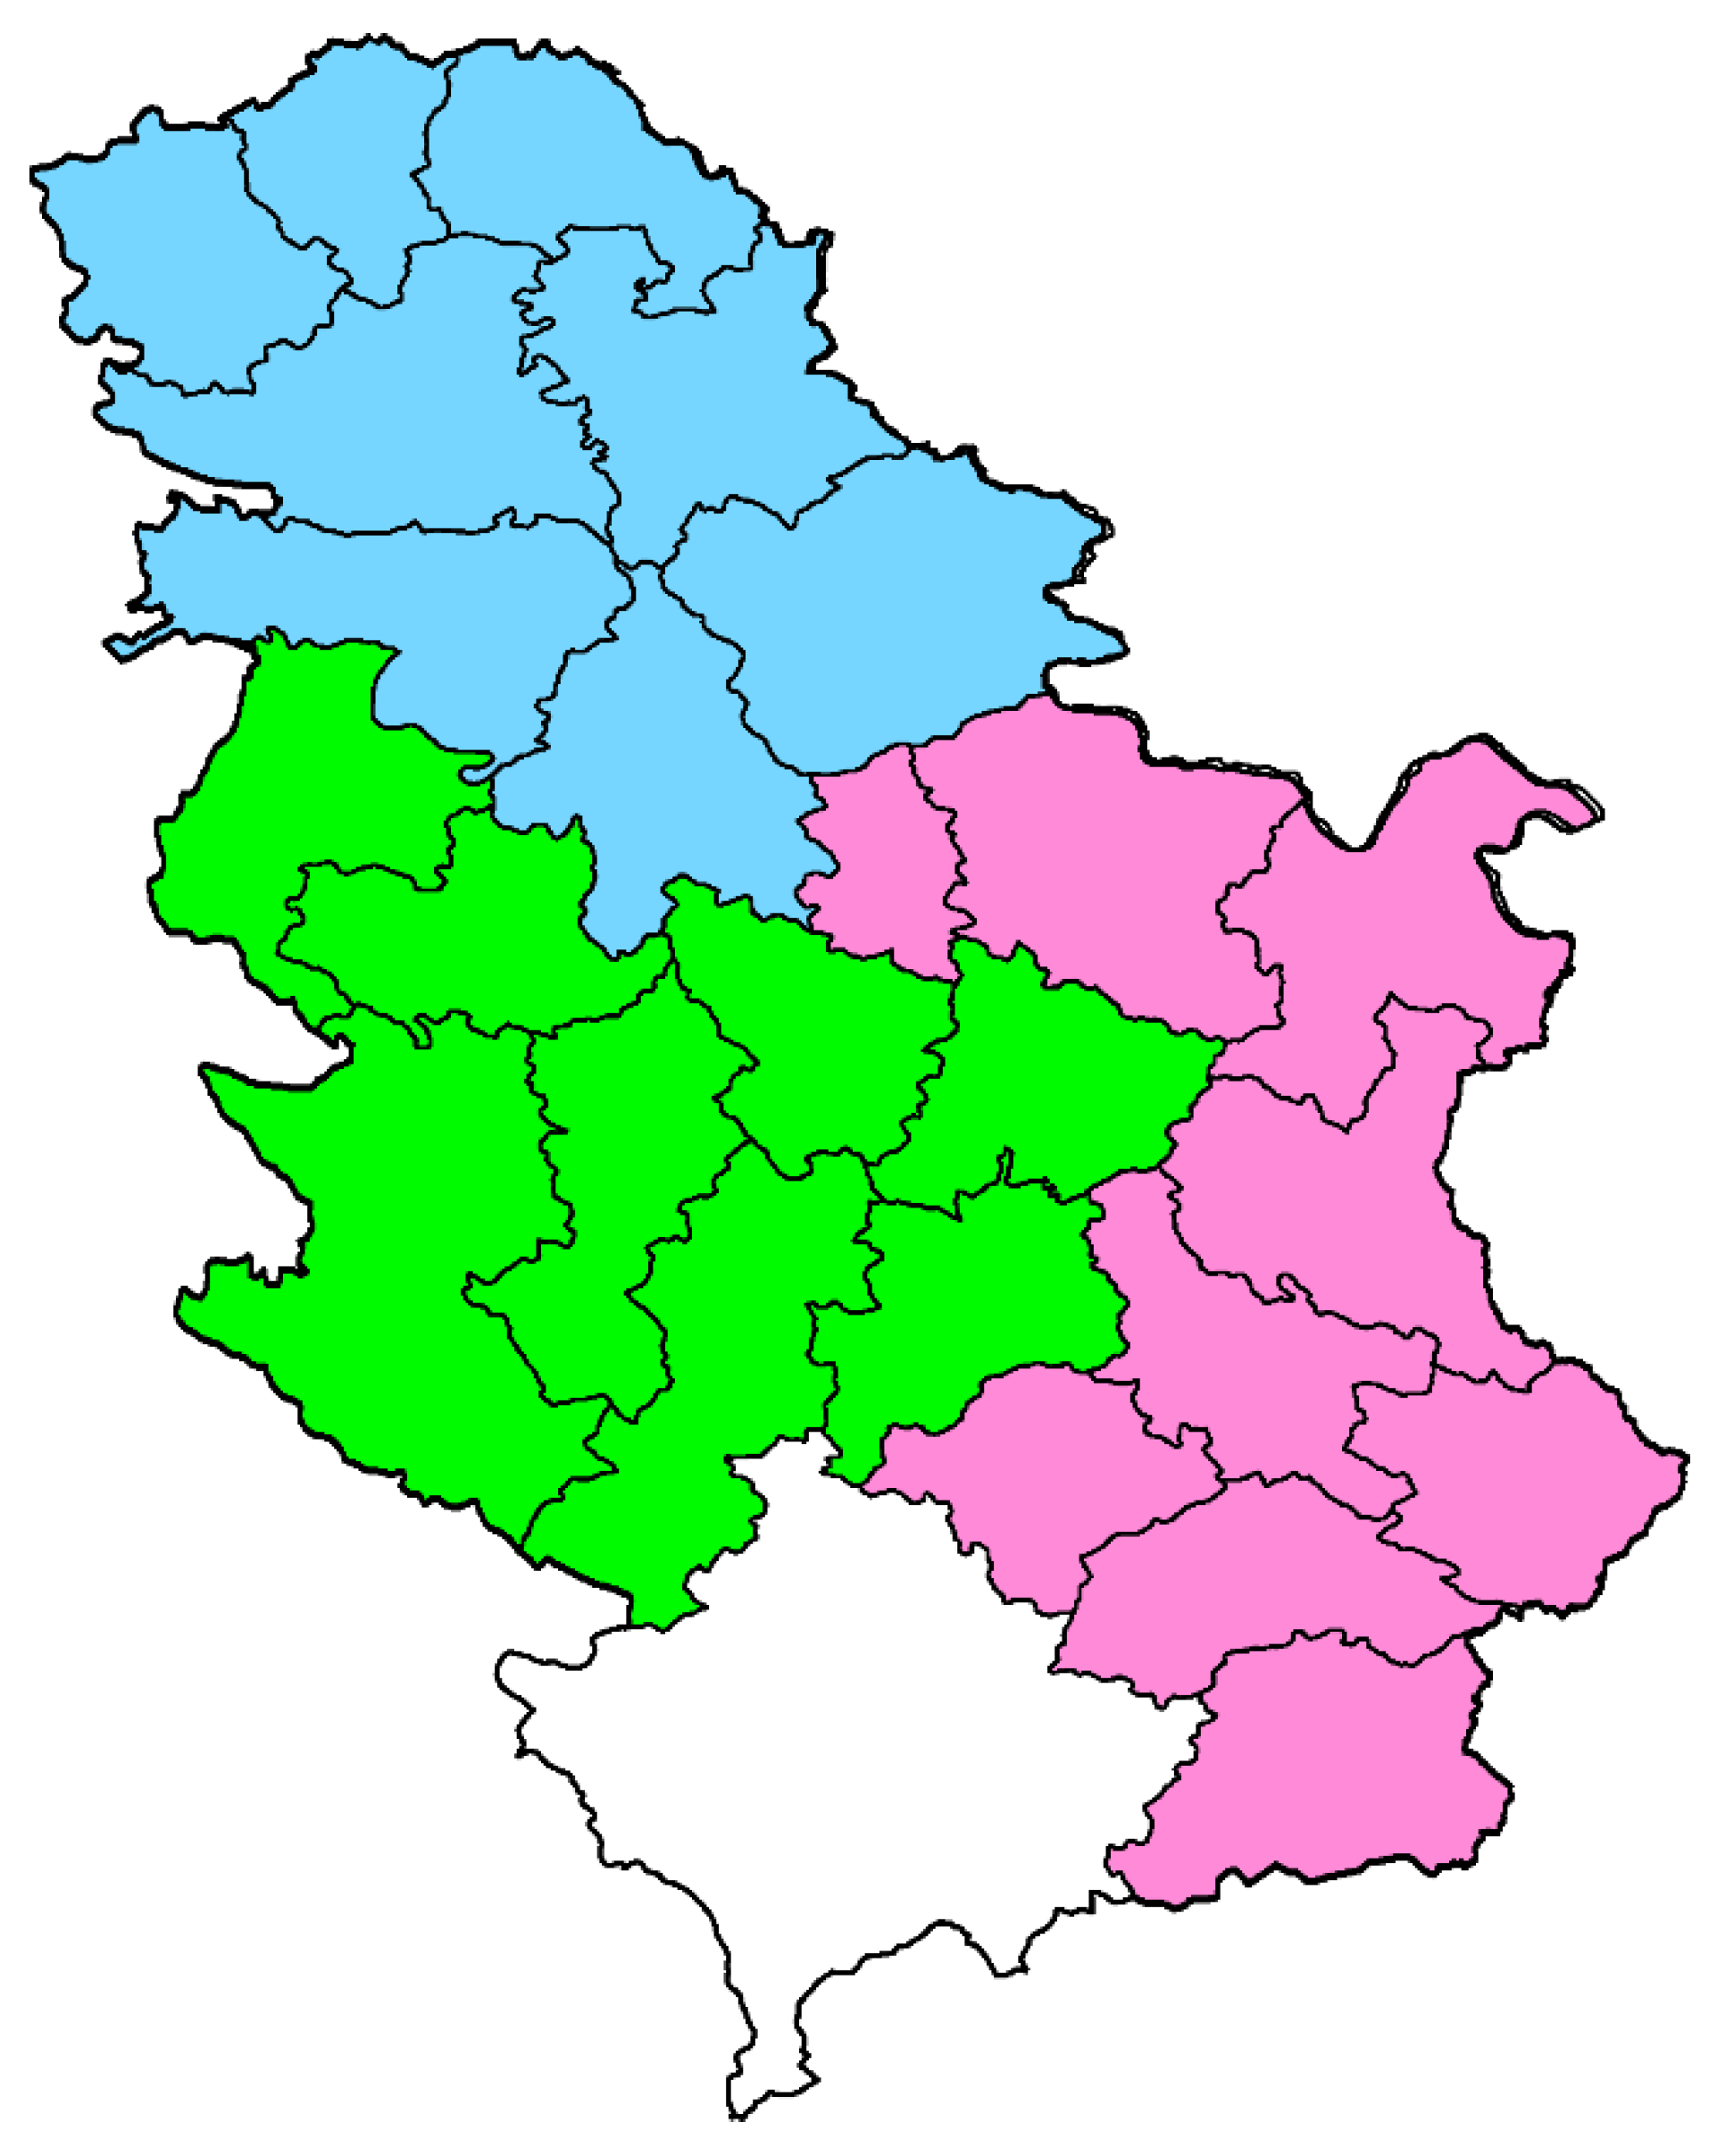
2.1. Study Region

This study covers the territory of the Republic of Serbia, a country in Southeast Europe located at the Balkan peninsula. North Serbia is mainly flat as it belongs to the Pannonian valley, while regions southern from the Sava and Danube rivers have hilly landscapes and mountains. From Serbia’s total surface of about 88,499 km2, 37% of the territory lays below 200 m, 24% is between 200 and 500 m, 27% are hills below 1000 m, and about 11% are mountains above 1000 m. Prevailing weather conditions in Serbia are mainly influenced by its topography and proximity to the Mediterranean Sea. Climate is temperate continental in the largest part of the country, while mountain climate is present at elevations above 1000 m. Lowlands have a mean annual temperature between 11 and 12 °C and receive between 500 and 700 mm of precipitation per year. In the mountains, annual mean temperature is below 8 °C, while mean annual precipitation is above 1000 mm. Location of the country and its topography are presented in Figure 1.

2.2. Climate Data

Daily data on minimum and maximum temperature and precipitation are collected from the archive of the network of meteorological and climatological observations of the Republic Hydrometeorological Service of Serbia, and meteorological services of neighboring countries (Montenegro, Bosnia and Herzegovina, Croatia, Hungary, Romania, Bulgaria, and North Macedonia) available through the World Meteorological Organisation’s Global Observing System exchange. Observational points are well distributed across the territory of Serbia, and their total number varied over the analysed period from about 70 to 100 [15].
Observations are spatially interpolated to the regular latitude/longitude grid with 0.01° resolution (about 1 km) over the territory of Serbia, using a method of successive corrections [16]. This method is one of the well-known interpolation procedures used in numerical weather prediction for the assimilation of the meteorological observations. The obtained gridded daily temperature and precipitation datasets were used for the national climate change assessment [17], viticultural zoning [18], and zoning of fruit-growing regions [19] in the Republic of Serbia.
In order to compare changes in climate conditions and frequency of weather-related risks important for fruit-and grape-growing, two periods were defined: 1961–1990 as the reference climate period for the past, and 1998–2017 as the period of recent climate and the latest period for which the current observations were available. For the defined periods, calculated are means and/or quartiles of the mean annual, vegetational (April–October), and summer (June, July, August) temperature and precipitation, bioclimatic indices, and frequency of the occurrence of weather events that could potentially have unfavourable impacts on grapes and fruit species commonly grown in Serbia. Statistical significance of the change in temperature and precipitation means were estimated by the independent t-test, at the confidence level of 95%.

2.3. Viticultural Indices

A number of bioclimatic indices is determined and used for different purposes in viticultural practice and research. In this study, calculated are the four mostly used viticultural indices: Winkler index, Huglin heliothermic index, Cool Nights index, and Dryness index. The latter three indices create a Multicriteria Classification System [20] that is often used to describe and compare climate characteristics of wine-producing regions, as well as to assess observed and projected climate changes [21,22,23]. Alongside topographic and soil data, these indices are recommended and are being used for micro- and macro-zoning of wine production across the world [24]. Mathematical definitions of the viticultural indices used in this study, as well as corresponding climate categories are given in the Table A2 of the Appendix B.

2.3.1. Winkler Index (WIN)

The Winkler index is a sum of effective growing degree days (GDD) (i.e., the sum of average daily temperatures above 10 °C in the period April–October for the northern hemisphere) [25]. Since it represents accumulated heat available for wine development during the vegetation, it is widely used to assess climate suitability for cultivating different grape varieties, but also for legal regulation of oenological practice [26].

2.3.2. Huglin Heliothermal Index (HI)

The Huglin heliothermal index represents heat conditions over the vegetation as well. Compared to the Winkler index, it puts more weight on daily maximum temperatures and, in addition, considers effects of daylight duration, through a corrective factor which is dependent on the latitude [27]. It is calculated for the period April–September for the northern hemisphere.

2.3.3. Cool Nights Index (CI)

The Cool Nights index is a mean monthly minimum temperature of the ripening month September for the northern hemisphere [20]. Low nighttime temperatures are crucial for accumulation of polyphenols and other chemical compounds responsible for aroma; thus, this index could indicate the potential for high quality vine production in a region.

2.3.4. Dryness Index (DI)

The Dryness index represents water available in the soil at the end of September [20]. It is calculated through a water balance equation that considers available soil water at the beginning of the vegetation, monthly precipitation, and evapotranspiration. In this study, potential evapotranspiration was estimated following the Thornthwaite formula [28].

2.4. Frequency of Unfavourable Weather Events

Weather events that may cause significant economic losses to fruit, grape, and vine production are low winter temperatures, spring frosts, hail, strong winds, droughts, high summer temperatures, and intensive rainfall. However, this study is limited to those events that could be described by temperature and precipitation measurements. Therefore, hail and strong winds were not further considered.

2.4.1. Spring Frost

Flowering is recognised as one of the most vulnerable phenological stages in fruit trees. In addition to other phenological stages, it is mainly driven by temperature, or, more precisely, the amount of chill that is accumulated over the dormancy and the amount of heat accumulated after the dormancy. There are several methods for estimating chilling, among which are Chilling Hours, and Utah and Dynamic models [29]. However, across the scientific literature, large spans in chilling and heating accumulations required for flowering of different fruit varieties at different locations are reported [30,31,32]. Since this study aims to provide an overall estimate of climate and weather-related risks across the country for a number of commonly grown fruit species in Serbia, the analysis required a more simplified and uniform approach.
It is common practice in climatology to define the growing season start date as a day after the determined number of consecutive days with mean daily temperature above a given threshold (i.e., the base temperature that is specific to a species or a group of plant species). Considering the fruit tree varieties that are most often cultivated in Serbia, based on sparse and non-systematically collected phenological data across the country, we have divided fruit species into four groups by mean daily temperature of the period in which frost may significantly influence yield and/or its quality. Through the zoning of fruit production in Serbia [19] it was shown that this simplified approach provides a good estimate in frost risk assessments in temperate climates. However, more attention should be given to this problem in climate change studies or in studies in warmer climates, in which it could be possible that winter chill requirements are not entirely met.
The date of the beginning of the frost-sensitive period is estimated as the day following the first occurrence (from the beginning of the year) of five consecutive days with a mean daily temperature above the temperature threshold shown in Table 1. Mean daily temperature is calculated as an average of daily minimum and maximum temperatures, while possible damaging frost is defined as the occurrence of minimum daily temperature (Tn) below −2 °C. Frequency of the occurrence is calculated as the percent of years in which at least one frost day occurred after the onset of the full flowering.

2.4.2. High Summer Temperatures

Air temperatures above 35 °C cause physiological responses in plants. They increase evapotranspiration, while slowing down photosynthesis and fruit development [33]. High summer temperatures are commonly followed by intensive solar radiation, which may cause sunburns. The date of the first occurrence of at least two consecutive days with maximum daily temperatures above 35 °C is marked as the start of the hot period. The date of the last occurrence of the two consecutive days with maximum daily temperature above 35 °C is marked as the end of the hot period. Frequency of the occurrence is calculated as percent of years in which at least one event of at least two consecutive days with maximum daily temperature (Tx) is above 35 °C.

2.4.3. Intensive Rainfall

Intensive precipitation may cause a range of problems, such as waterlogging in flat terrain or saturated soils, increased soil erosion, and floods and flashfloods. In this study, we focus on damages intensive precipitation may cause on fruits of sweet and sour cherries, which may significantly lower their quality and price [34]. Therefore, calculated is the number of days with precipitation above 30 mm in the period of ripening and harvest of sweet and sour cherries. Frequency of the occurrence is calculated as percent of years in which there was at least one event of daily precipitation above 30 mm.

2.5. Water Deficit

Net water deficit was estimated following the procedure described in [35], as a difference between evapotranspiration and effective precipitation. Effective precipitation was calculated as 90% of daily precipitation. Referent evapotranspiration was estimated using the Hargreaves method [36]. Evapotranspiration for fruits and grapes was obtained by multiplying reference evaporation with crop coefficient values adopted from [35].

3. Results

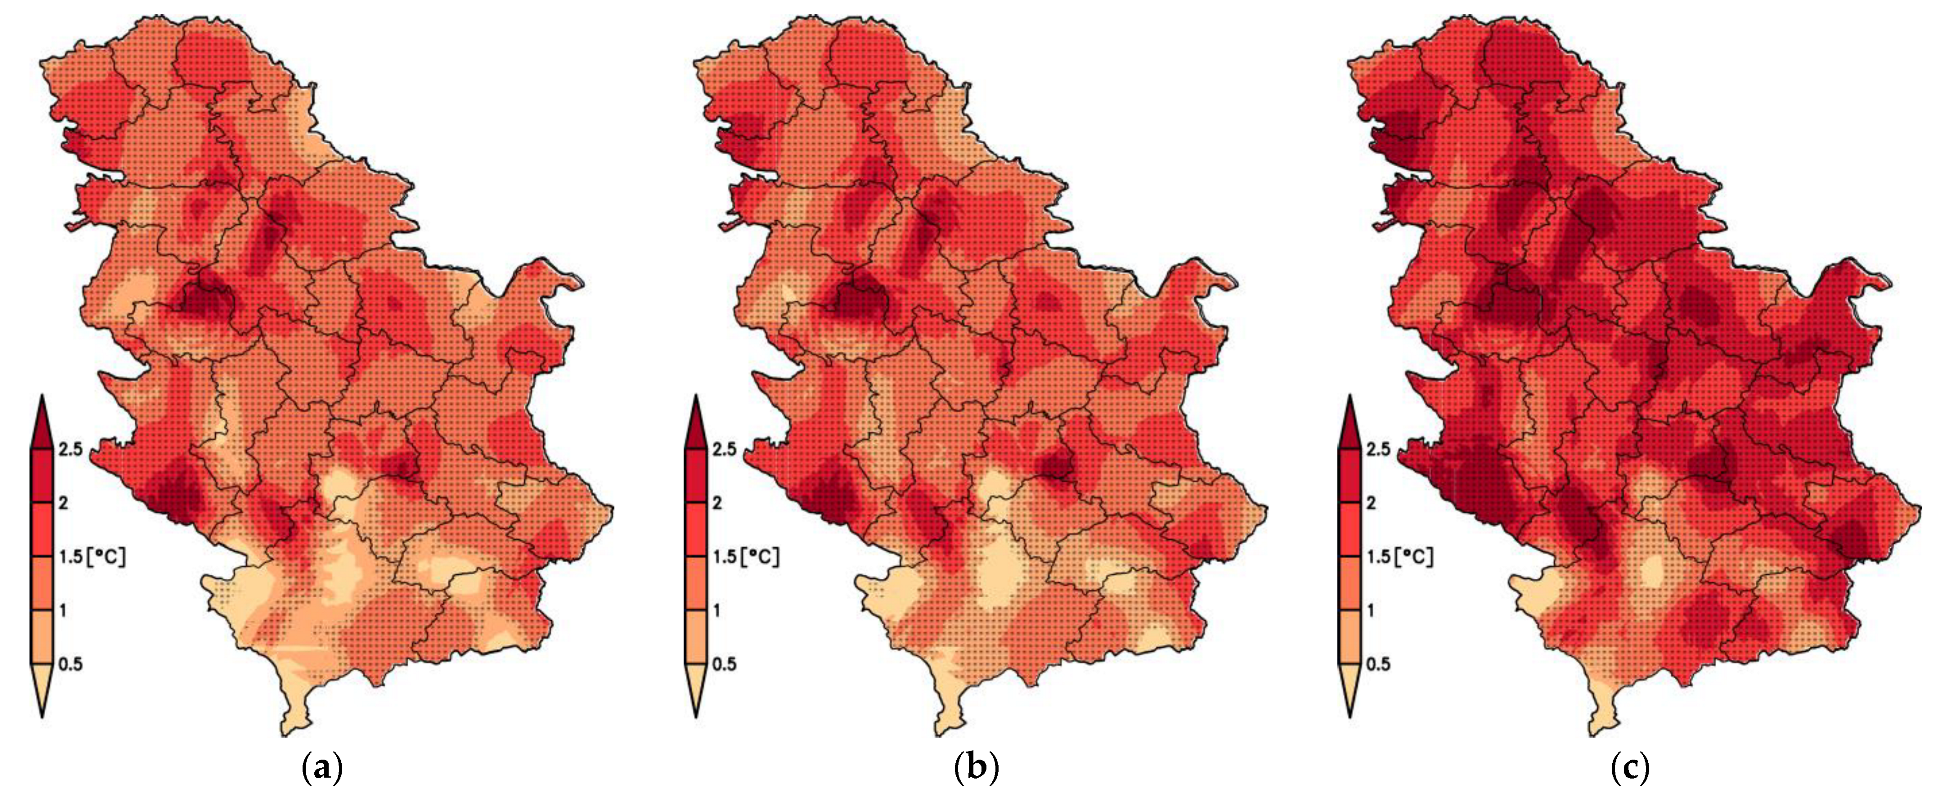
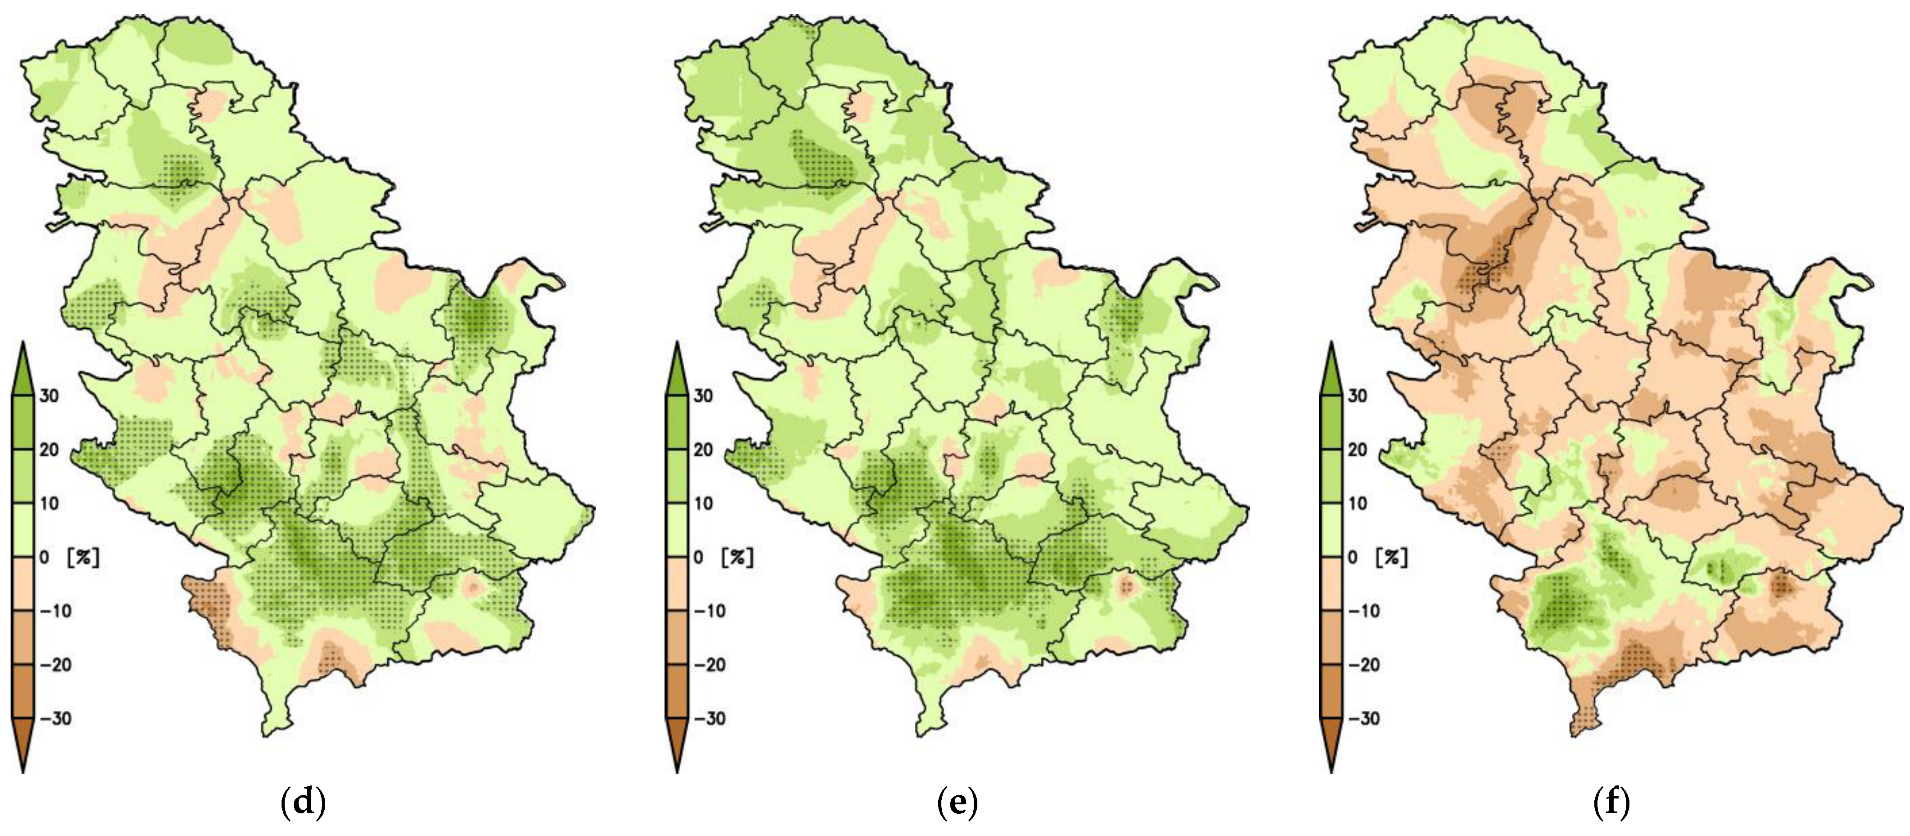
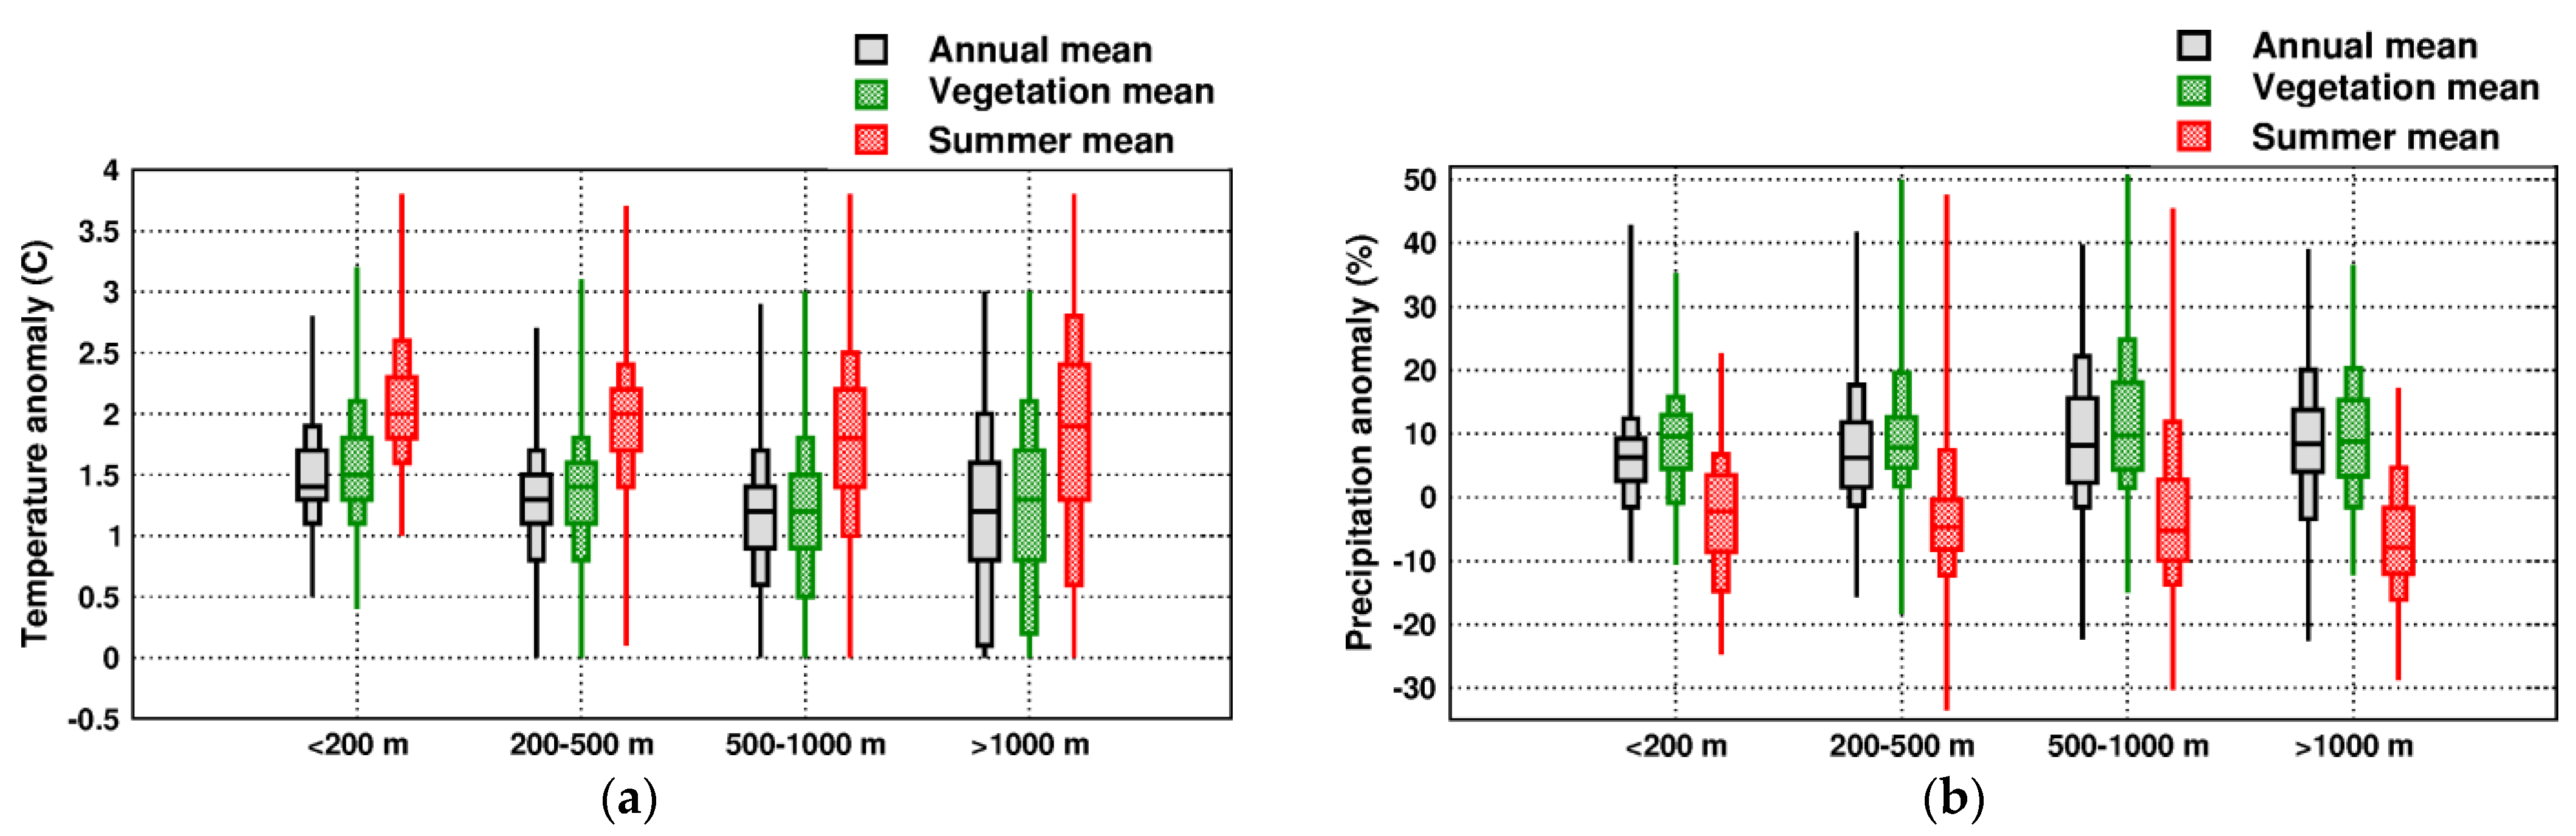
3.1. Temperature and Precipitation Change

The mean annual, vegetational, and summer temperature and precipitation anomalies between two periods, as well as the statistical significance of the change are presented in Figure 2. Average annual mean temperature increased from period 1961–1990 to 1998–2017 in all regions of Serbia. For the largest part of the country, annual and vegetational temperature anomalies exceed 1 °C. Summer warming is more pronounced, as it is found to be larger than 2 °C for most of the country. The observed changes are statistically significant in almost the entire country. Statistically insignificant changes of annual mean temperatures were observed in 55% of the country and in regions with anomalies less than 1 °C, mainly in the high mountains in the south, east, and west. As the anomaly increases for vegetation and summer months, the area of the statistically insignificant change decreases.
Presented in Figure 3 are percentiles of temperature and precipitation anomaly distributions for four elevation categories: lowlands below 200 m, areas with elevation between 200 and 500 m, hilly regions with elevation from 500 to 1000 m, and mountains above 1000 m. As seen in Figure 1, annual temperature anomalies are the smallest and summer change is the largest. While the annual temperature change, on average, decreases with elevation, the smallest average anomalies in vegetation and summer seasons are found in hilly regions (500–1000 m). The largest distribution spans for all three seasons are found for elevations above 1000 m.
While temperature increases across Serbia, observed precipitation change is not uniform. However, for most of the country, annual and vegetational anomalies are in the range ±10%, which is considered climate variability. Positive anomalies above 10% are mainly in mountain regions and the south of the country, where the changes are also found to be statistically significant. During the summer months, drying is noted for the largest part of Serbia. Negative anomalies larger than −10% are observed across the country, as well as positive anomalies above 10%, mainly in the south and northeast. Average annual and vegetational precipitation changes are nearly the same for all four elevation categories (Figure 3). On the other hand, summer drying is more pronounced at higher elevations. The largest span in distribution of the precipitation anomalies is found in hilly regions, from 500 to 1000 m.

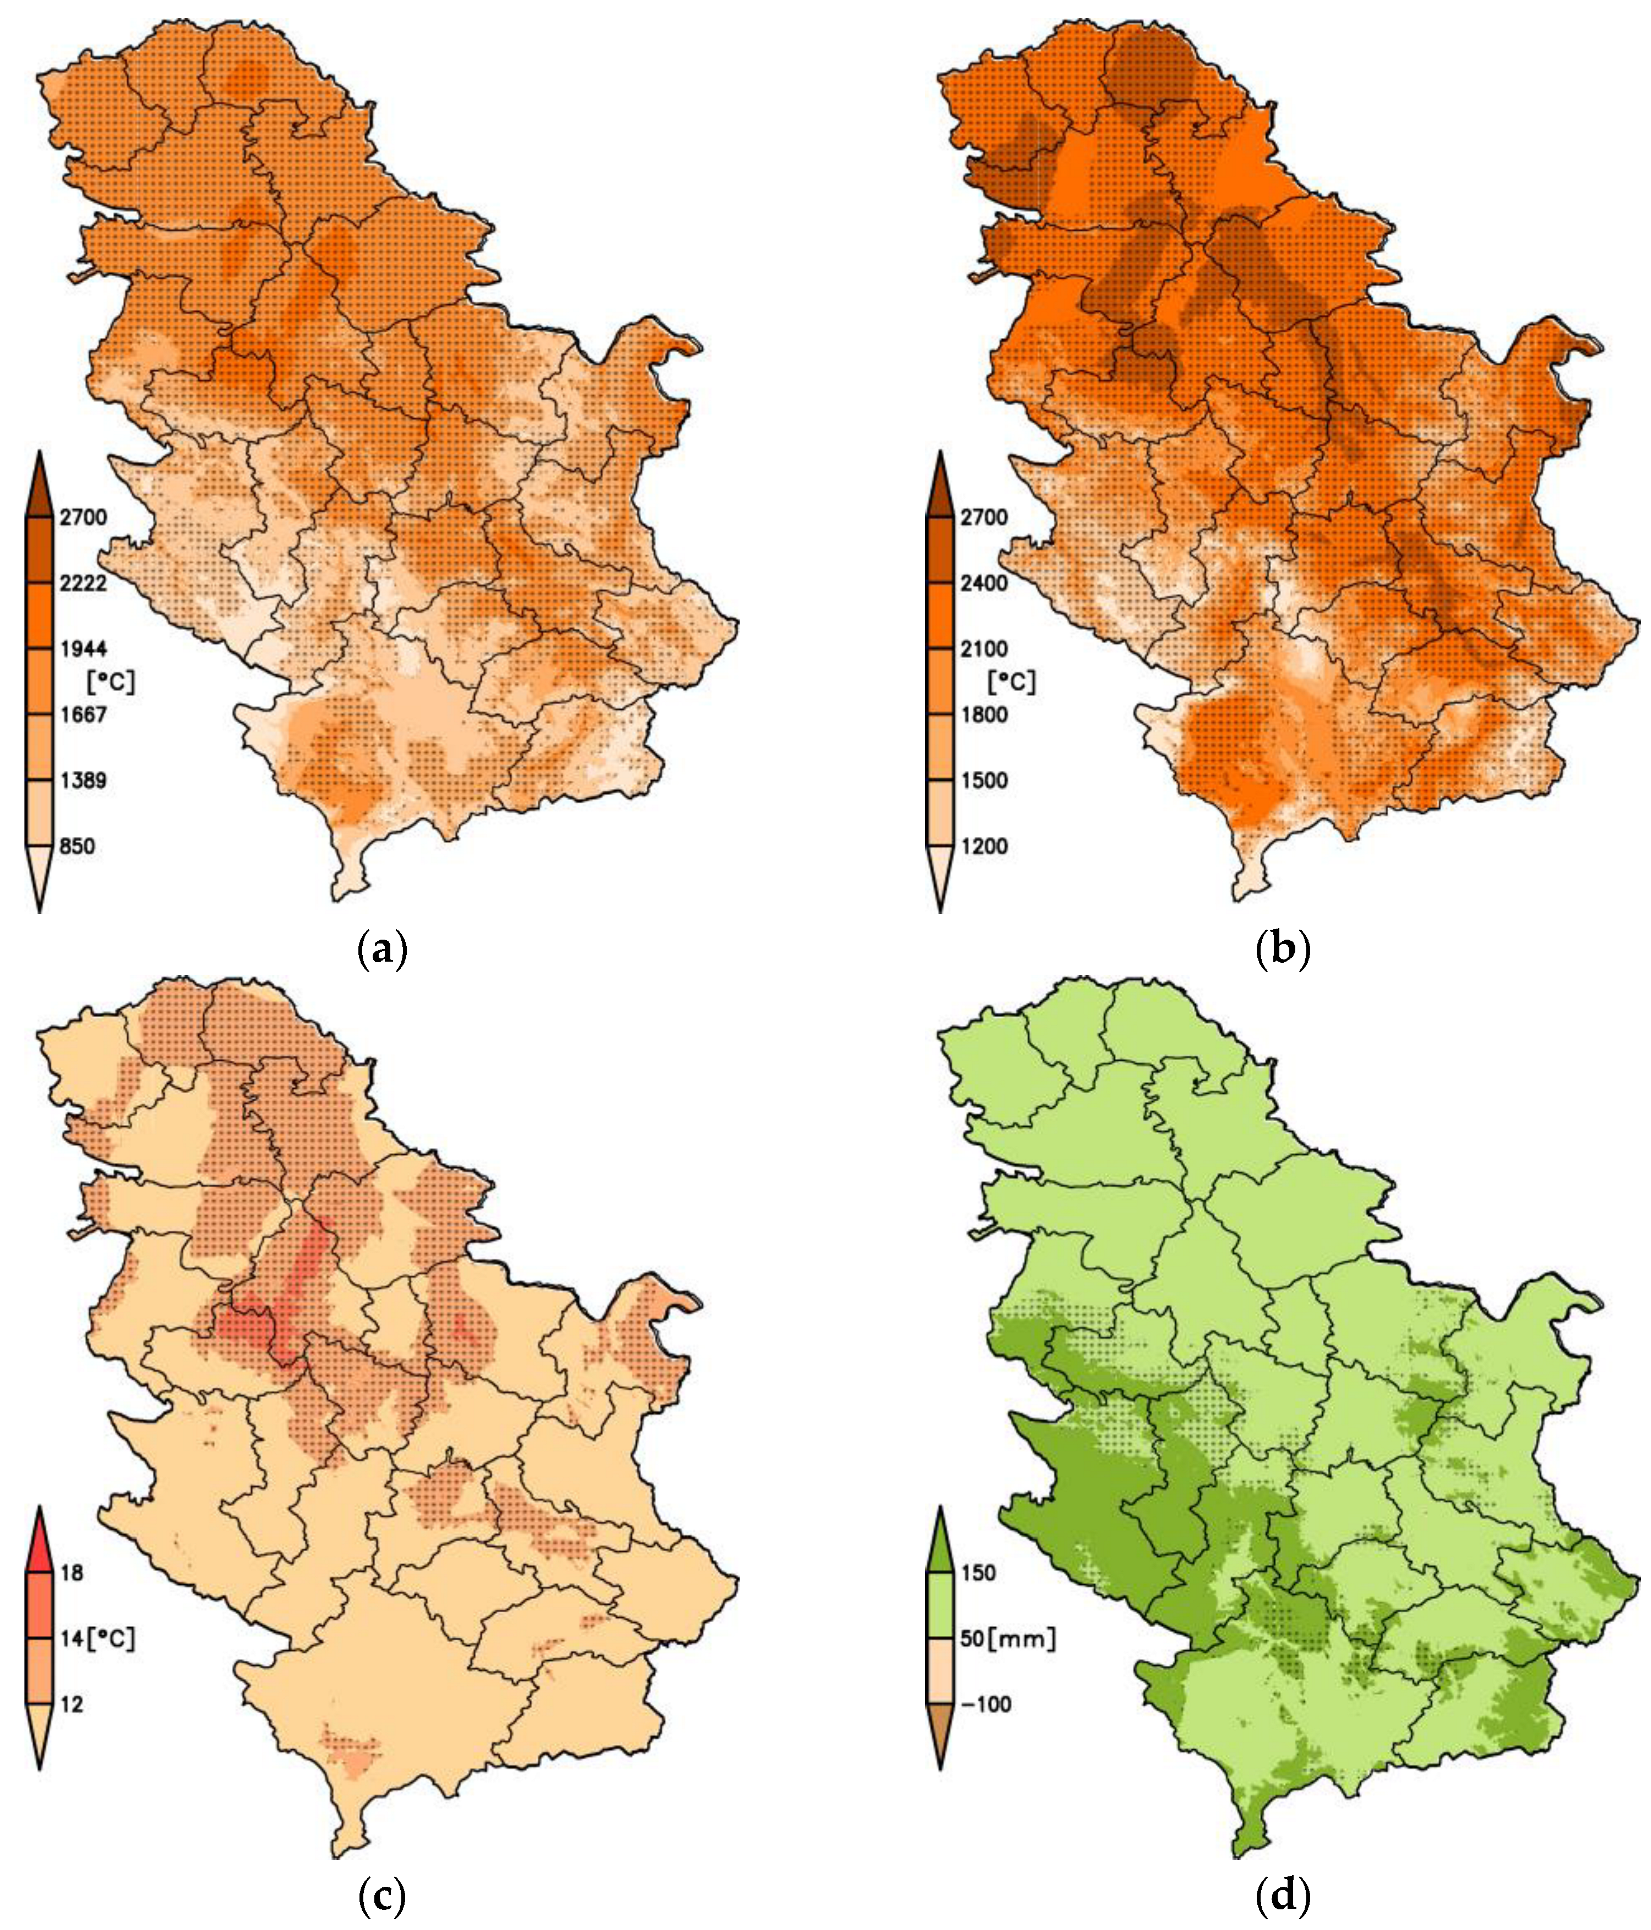
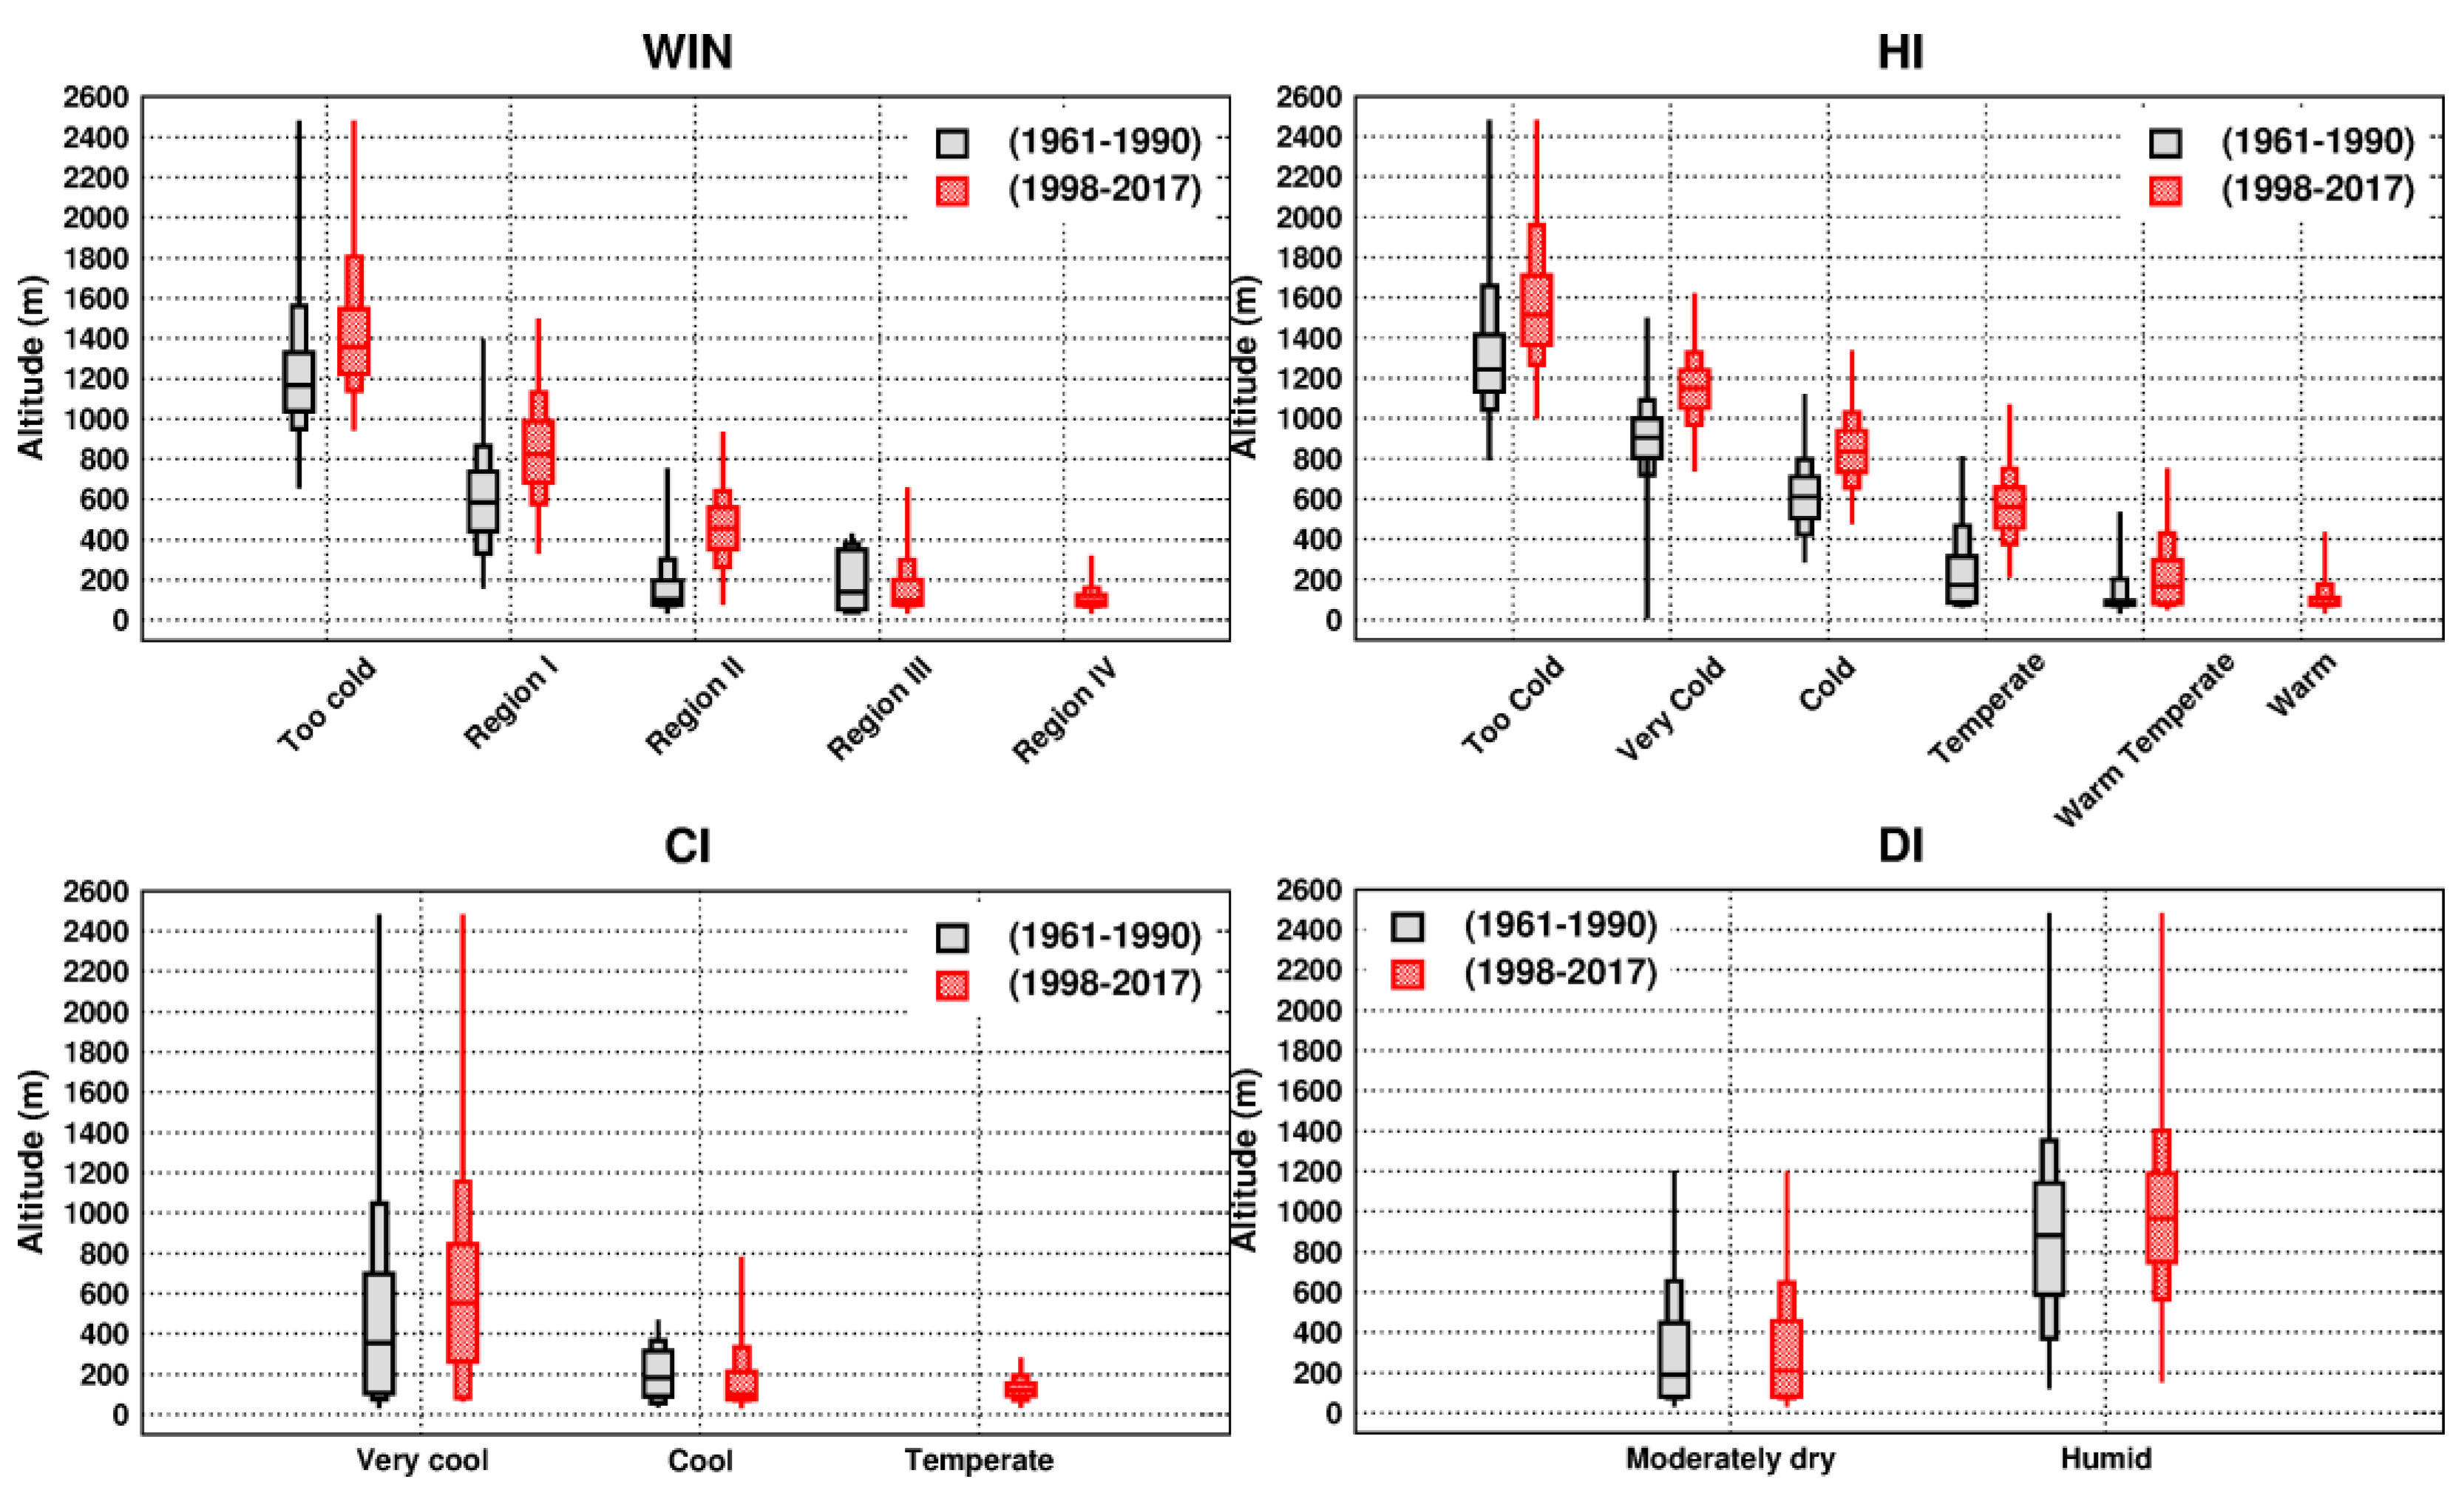
3.2. Viticultural Indices
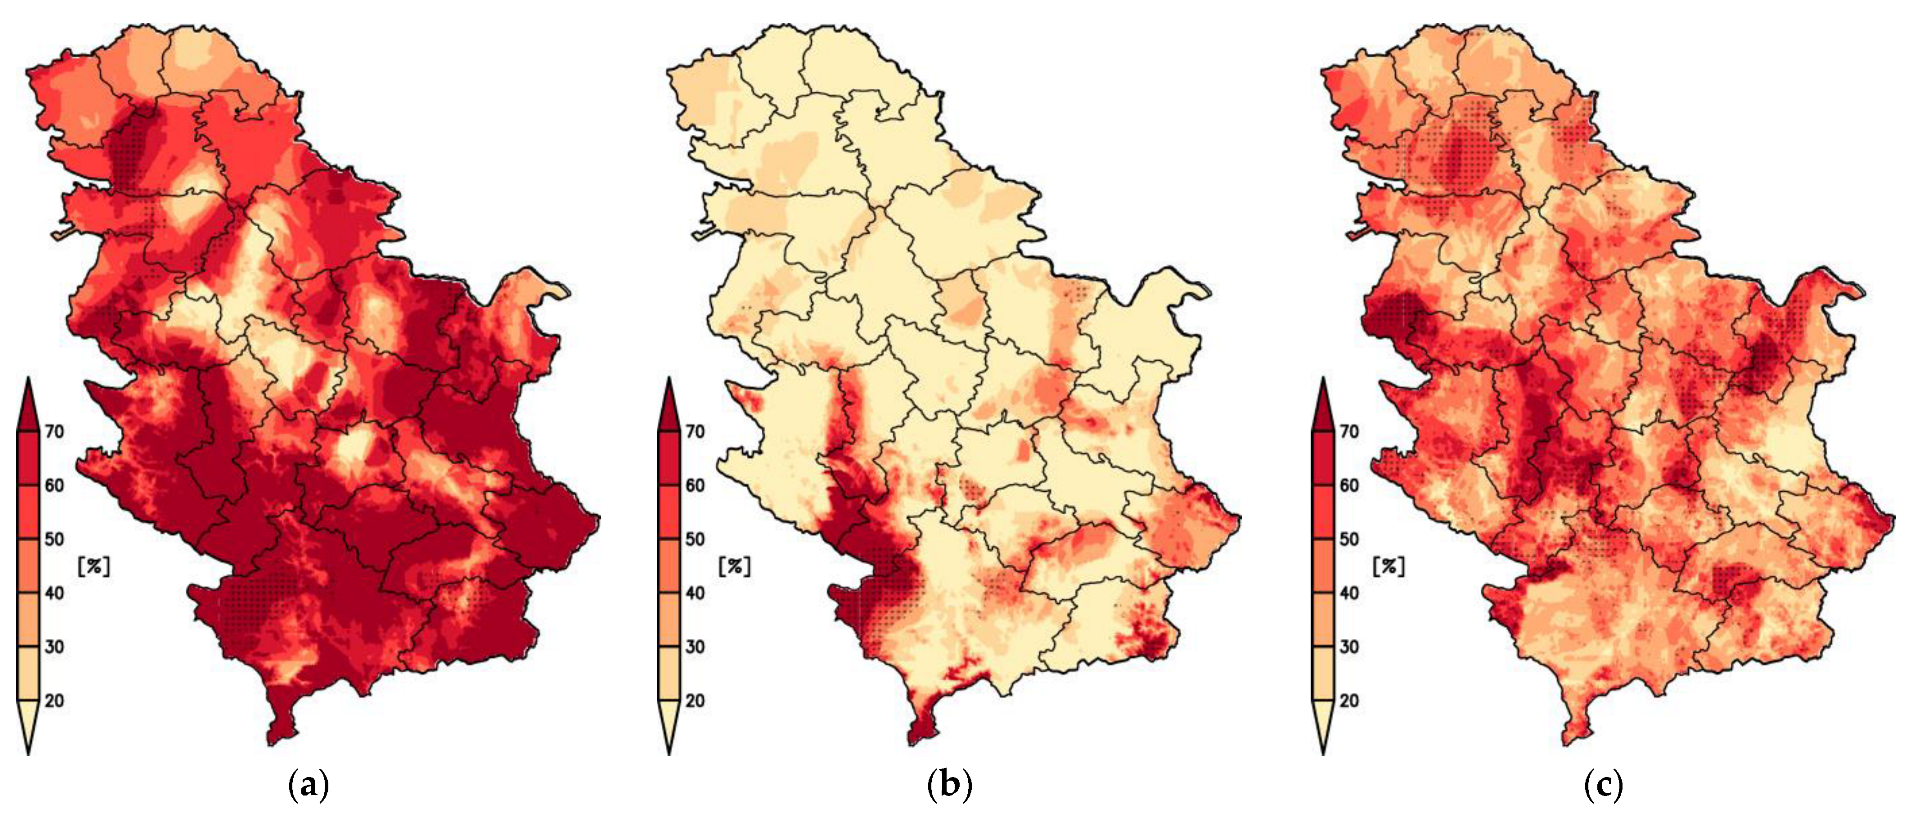
Categories of the four most important viticultural indices for the period 1987–2017 are shown in Figure 4. Regions where the index category changed in comparison to the period 1961–1990 are marked with black dots. Between the two researched periods, indices that represent heat accumulation during the vegetation, WIN and HI changed their categories toward the warmer end in almost the entire territory and in all wine-growing regions of the country. CI changed toward warmer nights in a smaller percentage of the territory, but the change affected some of the wine-growing regions in northern, central, and eastern parts of the country. The smallest modification is found in DI categories, which changed toward wetter climates in some hilly regions in the west, east, and south.
Categories of WIN and HI shifted 200 m on average to higher elevations (Figure 5). The largest elevation shift of about 500 m on average is noted for the “temperate climate” category of HI. For both WIN and HI, new, warmer categories that were not present in the 1961–1990 period emerged in the 1988–2017 period. For CI, the coldest, or “very cool,” category also shifted about 200 m upward, while the “cool” category moved toward lower elevations (100 m on average) at the expense of appearing in the “temperate” category, which was not present in 1961–1990. DI showed the smallest change, with only a 100 m average shift of the “humid” categories toward higher elevations.

3.3. Spring Frost

The average start of the frost-sensitive period estimated using mean daily temperatures advanced across the country toward the beginning of the year. This shift was up to 10 days early in most regions, the largest of which was for the threshold temperature of 10 °C. The frequency of years with frost occurrence during the sensitive period was the largest for the lower threshold temperature (i.e., for fruit trees that enter vegetation earliest, such as apricot and peach). The lowest risk frequency was for fruits with the latest vegetation start, such as apples and pears. The largest increase in the frequency of frost risk in comparison to the 1961–1990 period was found in regions that have experienced the largest warming, parts of eastern Serbia, central parts of northern Serbia, as well as valleys of large rivers (Sava, Danube, Great and South Morava) (Figure 6).

3.4. High Summer Temperatures

Hot periods, with maximum daily temperatures above 35 °C, are mainly observed below 300 m. The start of the period is most commonly in the second half of June or in the first half of July, and lasts about 20 days on average (Figure 7). However, in the most exposed regions, such as the Great Morava, Sava, and Danube River valleys, eastern parts of the country, and northeast and southwest parts, the period of high summer temperatures may last over 50 days. In comparison to the 1961–1990 period, changes in the start date and length of the hot period are statistically significant.
The frequency of years in which high summer temperatures occur has increased in the last two decades all over the country (except in high mountains). For most of the country, this risk is observed every other year, while there are regions where it could be observed almost every year.

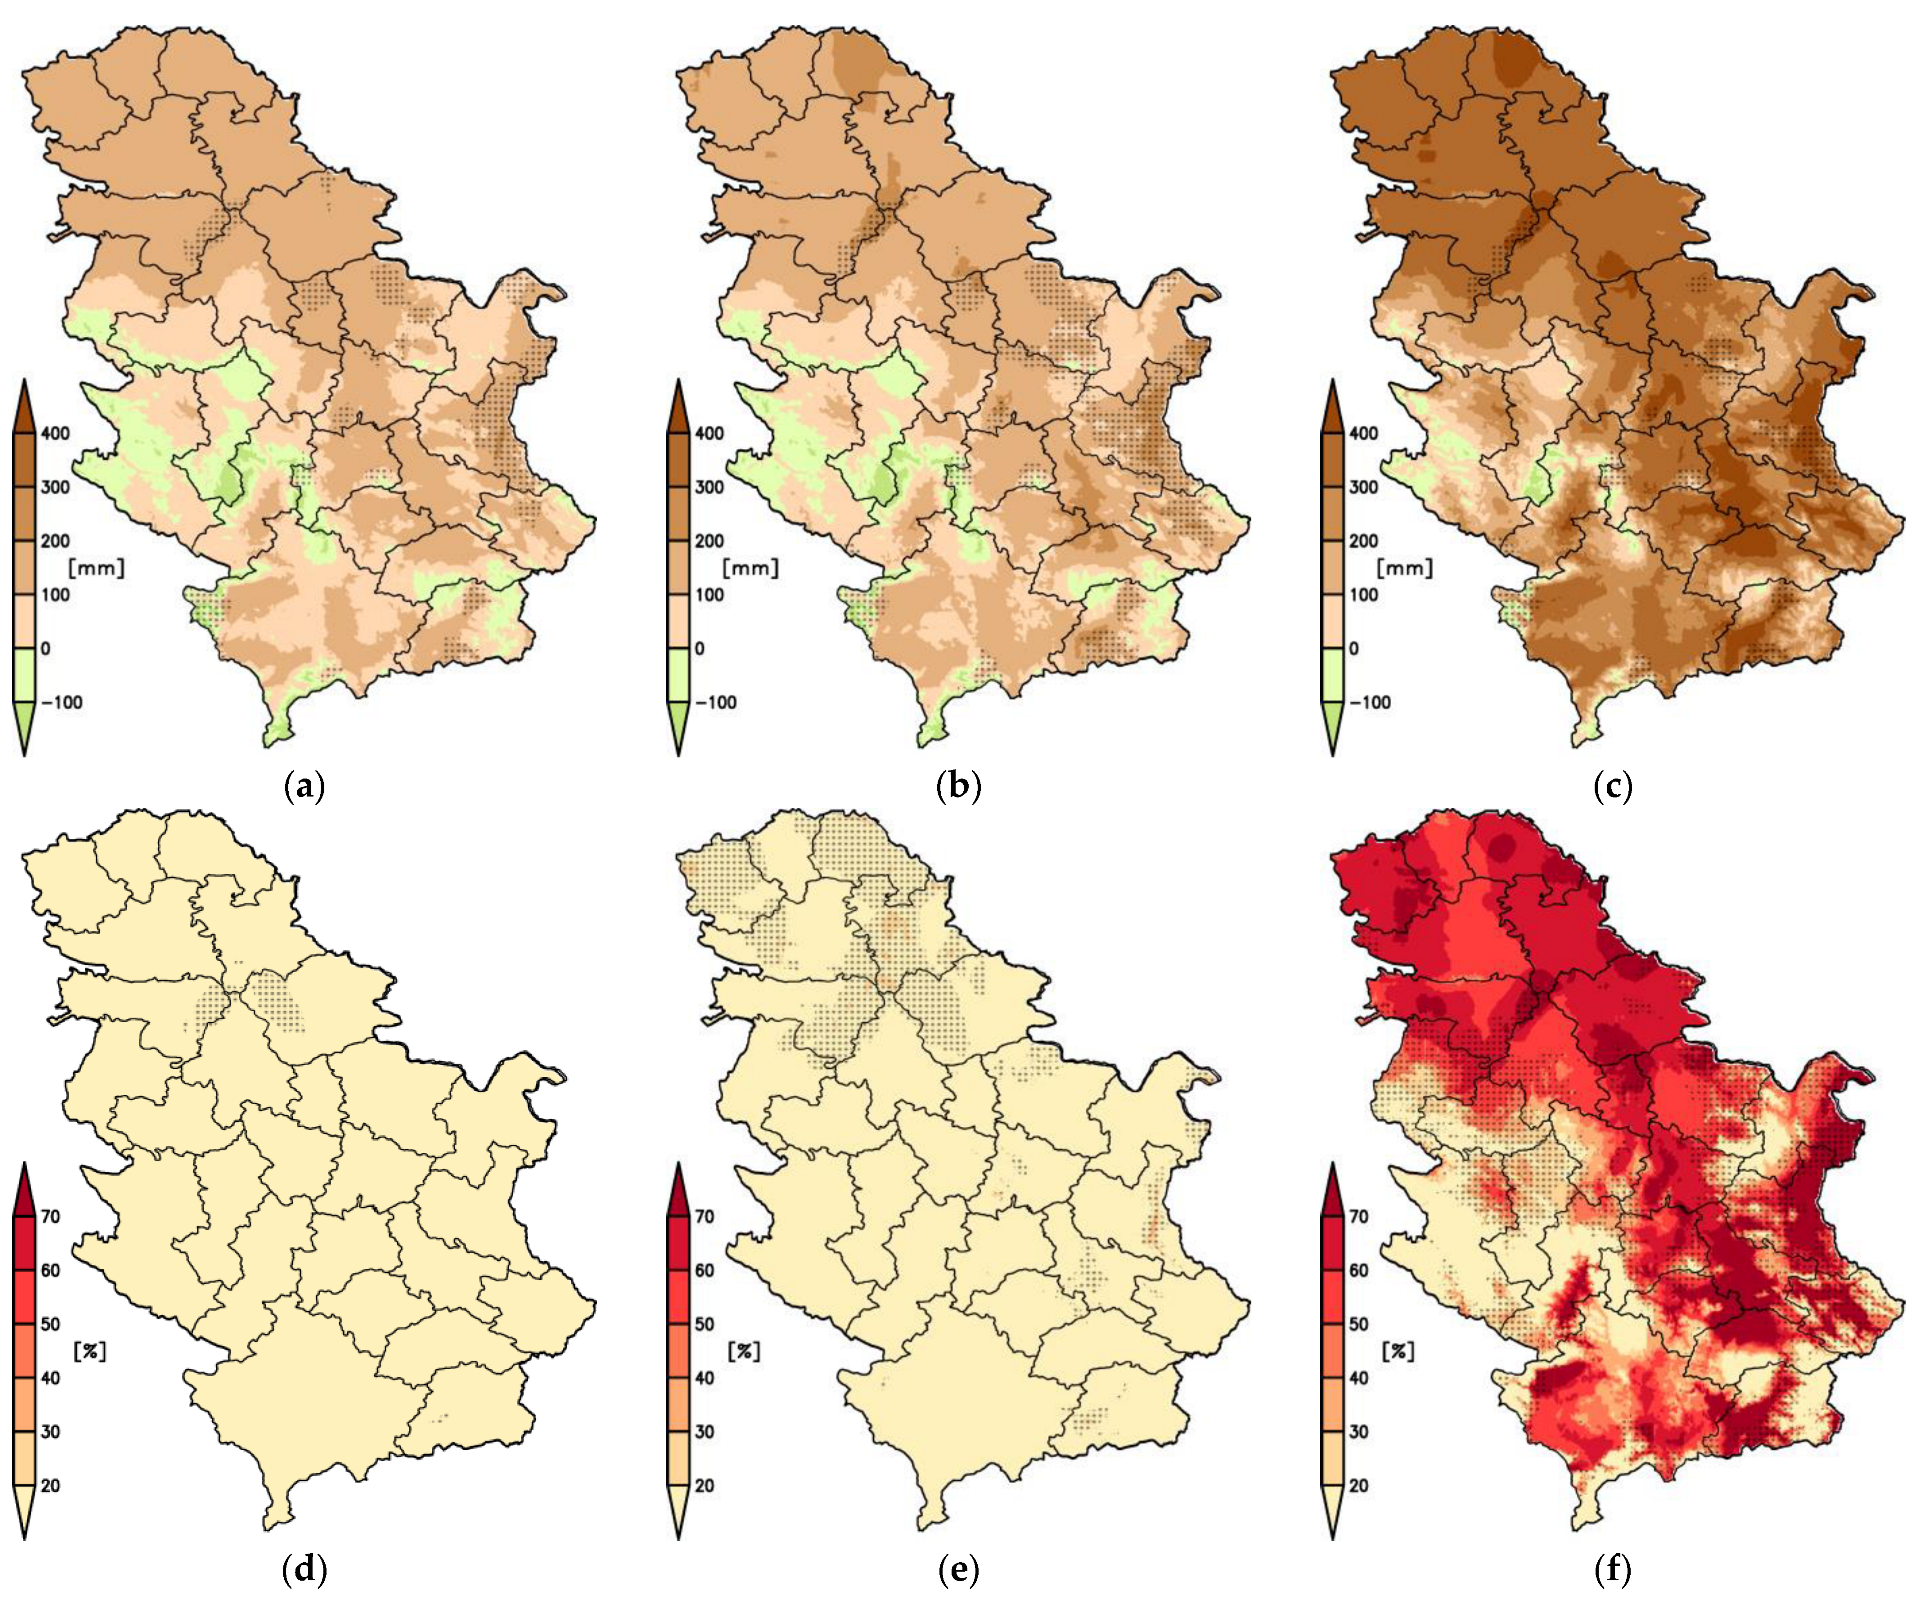
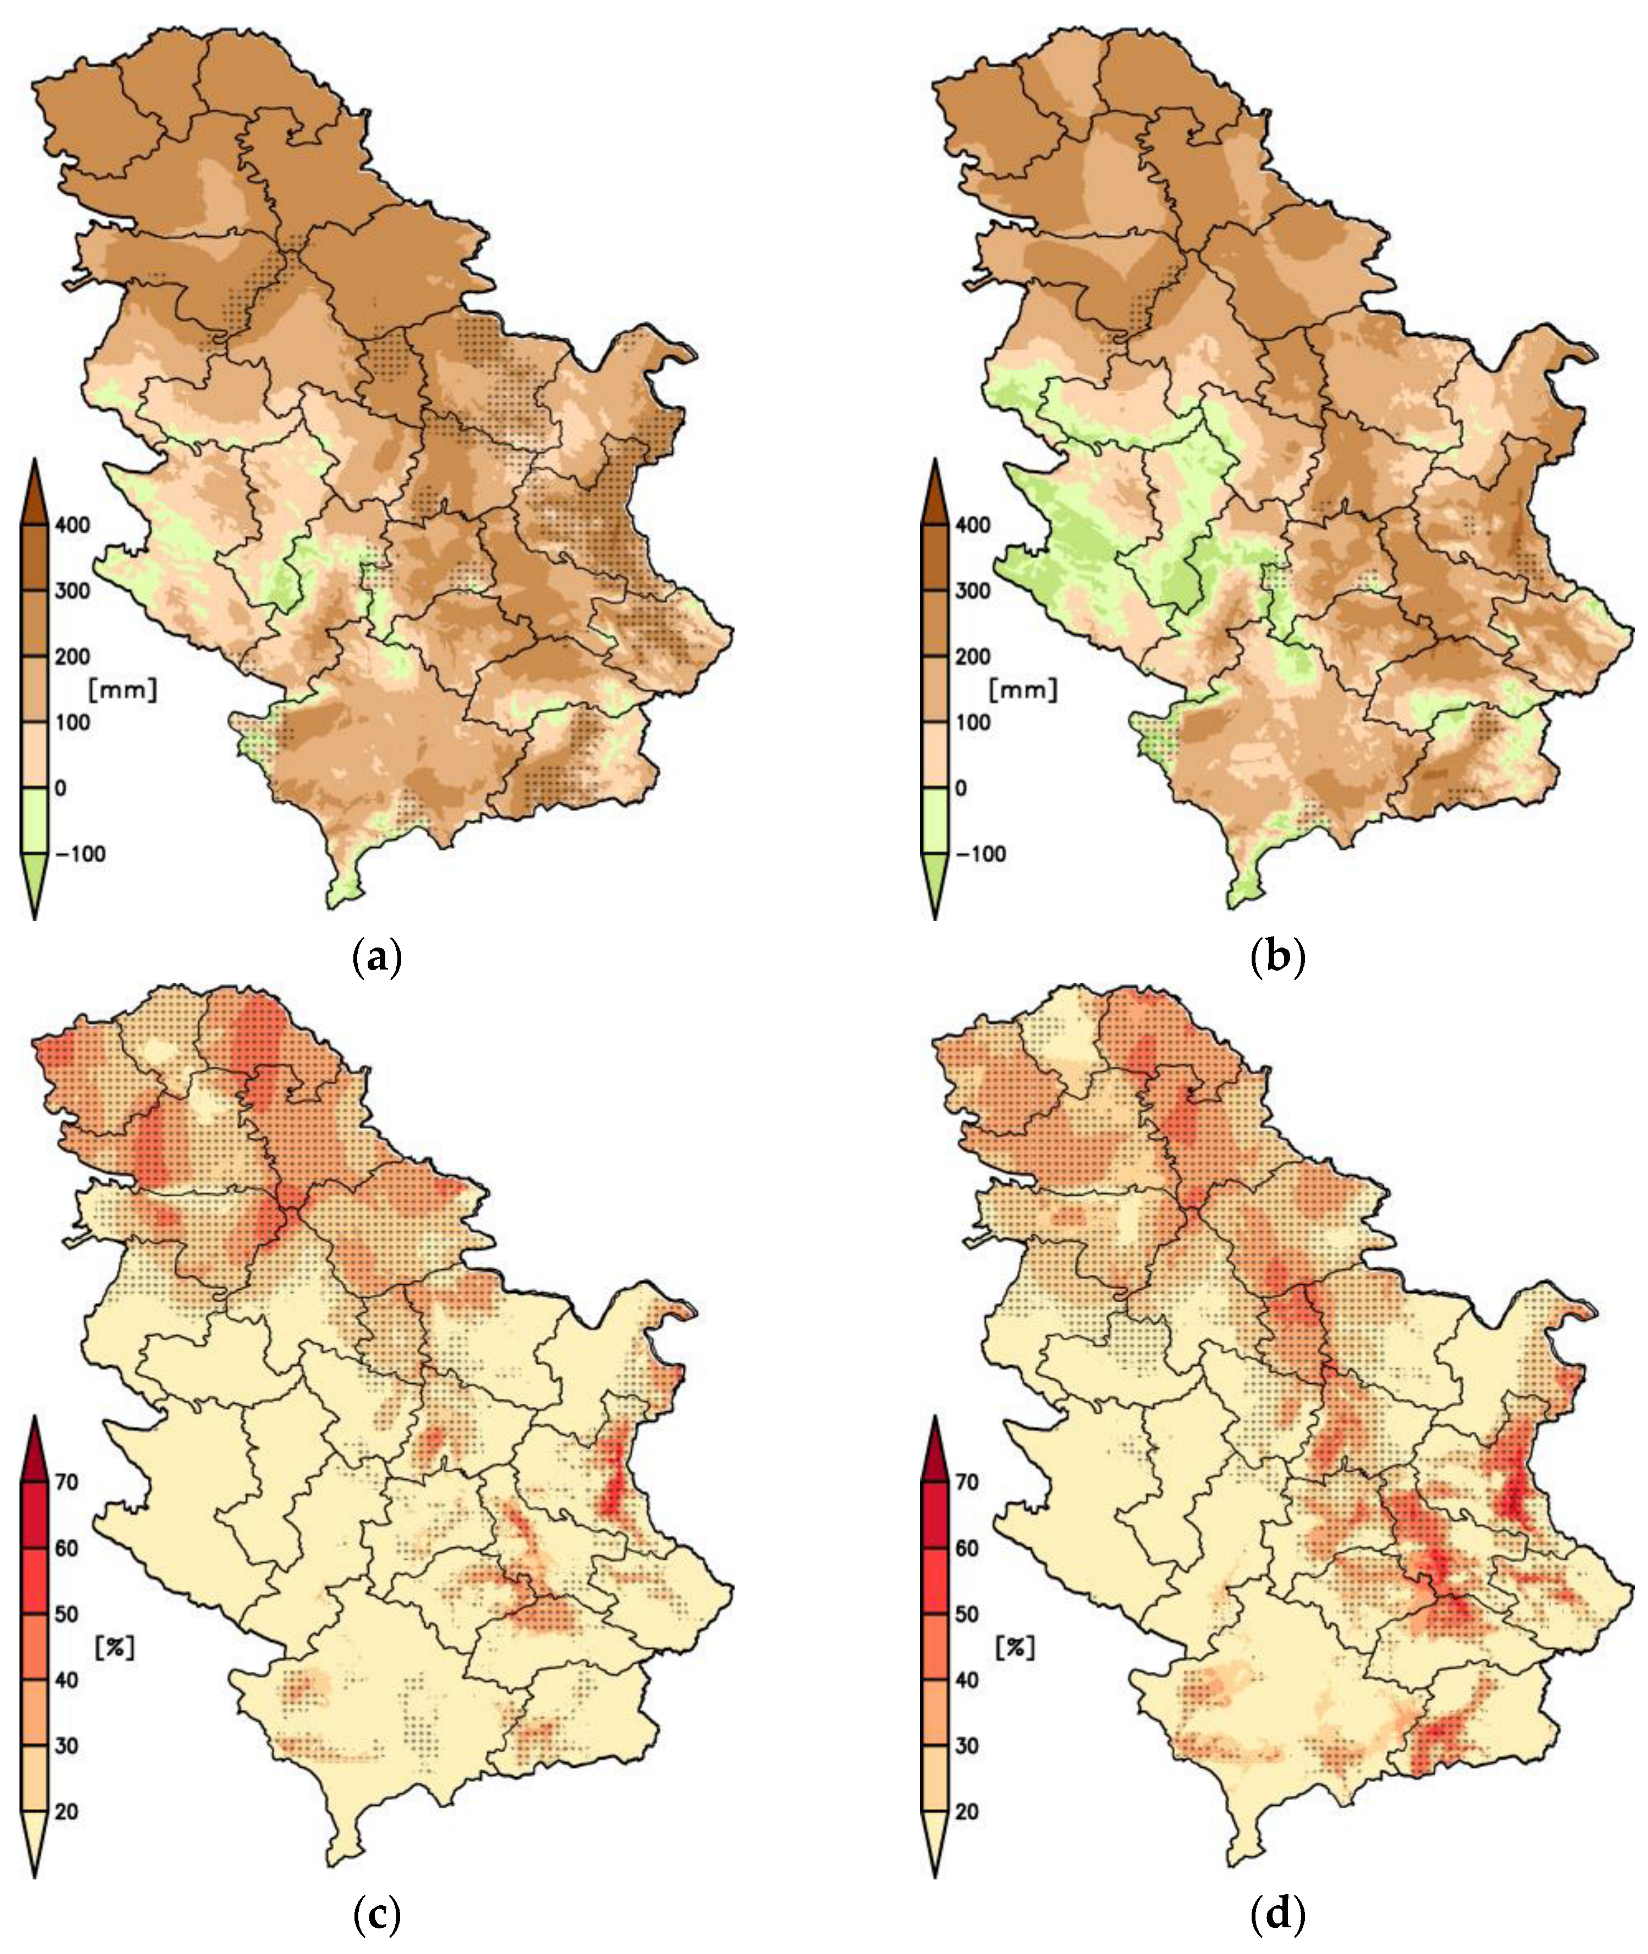
3.5. Intensive Rainfall during Ripening

Precipitation above 30 mm during cherry ripening is most commonly observed at higher elevations, more precisely in mountains of western, southern, and eastern parts of the country. However, comparing the frequency of this risk with the 1961–1990 period shows its increase is larger than 10% across almost all parts of the country (Figure 8).

3.6. Low Dormant Temperatures

In line with the decreasing number of cold events, possibly damaging low winter temperatures for most fruit species cultivated in Serbia, below −20 °C appeared rarely, with decreasing frequency in comparison to 1961–1990. The only region where it does still appear more often than every other year on average are in the high mountains in the southwest. Temperatures below −15 °C, which could be damaging to wine grapes, occur more frequently. However, this risk is reasonable in most of the wine-producing regions and does not show a tendency to increase.

3.7. Water Deficit

The average water deficit for different fruit groups, from the start of vegetation until the harvest for the period 1998–2017, is presented in Figure 9 and Figure 10. The largest water deficits were found in eastern and northern parts of the country, as well as in the valleys of big rivers (the Sava, Danube, Great and South Morava). Water excess could be found at higher elevations. The largest deficits, mainly between 300 and 400 mm, were found for fruit trees that ripened the latest (e.g., apples, pears, and plums). Water deficits above 300 mm were observed every other year or more often at lower elevations, while the increase in frequency (larger than 10%) in comparison to 1961–1990 was noted in hilly regions of the central, western, and eastern parts of the country.
Although they ripen late, wine grapes have smaller water needs, and therefore had smaller deficits, mainly between 200 and 300 mm in wine-producing regions. However, an increase in the frequency of water deficits above 300 mm was noted in most of these regions. Water deficits for raspberries and other berries in hilly regions where they are mainly cultivated ranged between 50 and 200 mm.
Fruits that ripen early (e.g., apricots, peaches, and cherries) had an average water deficit between 100 and 200 mm. The frequency of deficits above 300 mm increased more than 10% for apricots and peaches in northern Serbia and in the east and southeast regions of the country.

4. Discussion

Climate change influence on the development and yield of agricultural plants is twofold: (1) warming and shift in precipitation patterns change environmental conditions, while (2) extreme weather events often put plants under the pressure of heat and/or water stress. Both may have negative influences on the physiological processes in plants and decrease the quality and quantity of yields.
Although there is a number of predetermined climatic and bioclimatic indices that can be used to assess the level of exposure to climate change, it is often necessary to create and tailor new ones, which requires defining potentially unfavourable weather events depending on the specific characteristics of plant growth and development. Although the timing of sensitive phenological stages can be estimated in different ways, most of them are not applicable in studies like the present one, where the aim is an overall assessment of risks over the larger area with different climate characteristics for several different fruit tree species. Therefore, alongside the commonly used climate and viticultural indices, we have proposed a few simple indices for assessing the risks of late spring frost, high summer temperatures, and intensive precipitation.
The analysed viticultural indices show a shift of all temperature-related indices towards the warmer climate categories over the past 50 years. On average, the climate categories shifted about 200 m toward higher elevation. Similar changes have been observed in most European viticultural regions [22,37], and together with projected climate change, point out the need to adjust wine grape varieties in order to fully utilise a region’s climate potential [21,23,38]. Increased areas of WIN categories Region II and III in Serbia’s current wine-producing regions could potentially be used for the production of high-quality wines. At the same time, increased use of CI and the number of days with Tx > 35 °C show a need for adaptation measures to delay ripening and protect from high summer temperatures.
Increased risk of late spring frost above 10% between the two analysed periods was found in 28% of the territory for fruits that bloom earliest (apricot and peach), 17% for cherries, plums, and berries, and 12% for late-blooming fruits such as apples, pears, and quinces. In several attribution studies, it has been found that the increased frequency of potentially harmful spring frosts is a consequence of climate change [39,40,41,42]. The intensity of timing of such frosts may not necessarily change, however, its impact on fruit trees increased due to the earlier end of dormancy and endodormancy periods caused by the periods of higher winter (or early spring) temperatures [43,44].
Tree fruits that have the latest harvest (apples, pears, and plums) have the largest average water deficit across almost the entire country, except for high mountain areas in the southwest, south, and southeast. For most of the territory, it ranges from between 300 and 400 mm, while in the Great and South Morava River valleys, eastern Serbia, and some parts in the north, it overshoots 400 mm. Water deficits larger than 300 mm (prior to harvest) occur every other year and more often in lower elevations, while in hilly areas of western, central, and eastern Serbia, they appear less frequently. However, those hilly regions are, at the same time, areas where deficits above 300 mm occur at least 10% more frequently in comparison to the 1961–1990 period. The water deficit analysis is done up to harvest, thus, fruits that ripen earlier have smaller deficits, which could be increased in the future due to the earlier onset of the hot summer periods and warming in general, even if the precipitation amount does not change significantly. However, it could be beneficial for future studies to consider water deficits after the harvest as well, since they may influence the formation of buds for the next season.
In general, areas around large rivers (Danube, Sava, Great and South Morava), as well as northern parts of the country, are under increased risk of spring frost and high summer temperatures. Since, in these areas, the overall increase in temperature is the largest, they also present the largest water deficits during the vegetation season. These areas could be considered the most vulnerable in fruit and grape production, and they require implementation of a number of adaptation measures in order to secure the quantity and quality of yields.

5. Conclusions

This study spatially analysed changes in the most important climate characteristics and frequency of weather-related risks in fruit and grape production over the last two decades across Serbia. Besides well-established bioclimatological indices, a few simple indices for assessing the risks of late spring frost, high summer temperatures, and intensive precipitation are proposed. They enable the assessment over the larger area with different climate characteristics for different fruit tree species and can be used in regional studies.
The presented analysis provides an overview of changes in general climate characteristics and the frequency of potentially harmful weather events. It does not, however, include the consideration of soil conditions and terrain features, which can be considered “constant” features, and does not include the current position of fruit- and grape-producing regions, as the results are meant to provide information on climate change impacts alone, assessing current increasing vulnerabilities as a potential contribution for the future systematical planning of adaptation measures and agricultural development on a national level in order to increase resilience to climate change. High-resolution of the results enables their use down to the local level.

Author Contributions

Conceptualisation, M.V.M. and A.V.V.; methodology, D.Đ., Z.R.-V., M.Ć. and D.N.; software, M.V.M. and A.V.V.; analysis, M.V.M., A.V.V., D.Đ., Z.R.-V. and M.Ć.; resources, D.S.; data curation, A.V.V.; writing—original draft preparation, M.V.M.; writing—review and editing, A.V.V.; visualisation, M.V.M.; supervision, V.Đ. All authors have read and agreed to the published version of the manuscript.

Funding

This research was funded by the Science Fund of the Republic of Serbia through PROMIS project “Integrated Agrometeorological Prediction System” (IAPS), grant number 6062629.

Institutional Review Board Statement

Not applicable.

Informed Consent Statement

Not applicable.

Data Availability Statement

Not applicable.

Acknowledgments

This research was funded by the Science Fund of the Republic of Serbia through PROMIS project “Integrated Agrometeorological Prediction System” (IAPS), grant number 6062629. The meteorological data used in this study are observed in observational networks of national meteorological offices of Serbia, Croatia, Montenegro, Bosnia and Herzegovina, North Macedonia, Bulgaria, Romania, and Hungary, and available through the World Meteorological Observation’s Global Observing System exchange.

Conflicts of Interest

The authors declare no conflict of interest. The funders had no role in the design of the study; in the collection, analyses, or interpretation of data; in the writing of the manuscript, or in the decision to publish the results.

Appendix A

Table A1. Statistical data on the surfaces (ha) under the fruits and grapes in 2020 [10].
Fruit/GrapeTotal Serbia (ha)Northern Region (ha)Central and Western Region (ha)Southern and Eastern Region (ha)
Apples26,36010,01810,1136229
Pears5036123027071099
Plums73,010556350,40117,046
Sweet cherries434817931615940
Sour cherries19,6013283381512,503
Apricots598538031419763
Quinces1984500773711
Peaches510626646621780
Raspberries24,028224219,2682518
Grapes19,840380588107225
Figure A1. Map of statistical regions as used in Table A1: Northern region—blue; Central and Western region—green; Southern and Eastern region—pink.
Atmosphere 13 00948 g0a1

Appendix B

Table A2. Definition of viticultural indices and corresponding climate categories for the northern hemisphere.
Viticultural IndexEquationClimate Categories
Winkler Index (WIN)
[25]
W I N = 1.04 . 31.10 . T n + T x 2 10 ° C
Tn—Daily minimum temperature (°C)
Tx—Daily maximum temperature (°C)
2223–2700 °C Region V
1945–2222 °C Region IV
1668–1944 °C Region III
1389–1667 °C Region II
1111–1388 °C Region I
Huglin Index (HI)
[27]
H I = 1.04 . 30.09 . T 10 ° C + T x 10 ° C 2 d
T—Daily mean temperature (°C)
Tx—Daily maximum temperature (°C)
d—Coefficient for day length correction, as in [27]
>3000 °C Too hot
2700–3000 °C Very warm
2400–2700 °C Warm
2100–2400 °C Warm temperate
1800–2100 °C Temperate
1500–1800 °C Cold
1200–1500 °C Very cold
<1200 °C Too cold
Cool Nights Index (CI)
[20]
C I = 1 30 1.09 . 30.09 . T n
Tn—Daily minimum temperature (°C)
>18 °C Warm nights
14–18 °C Temperate nights
12–14 °C Cool nights
<12 °C Very cool nights
Dryness Index (DI)
[20]
D I = W 0 + A p r S e p t P E t E s
E t = a P E T
E s = 1 a N P E T N e f
W0—available soil water at the beginning of vegetation (200 mm)
P—monthly precipitation
Et—monthly transpiration
Es—monthly bare soil evaporation
PET—monthly potential evaporation [28]
a—plant radiation absorption coefficient [20]
Nef—monthly effective soil evaporation
N—Number of days in a month
>150 mm Humid
50–150 mm Moderately dry
−100–50 mm Sub-humid
<−100 mm Very dry

References

  1. Parmesan, C.; Hanley, M.E. Plants and climate change: Complexities and surprises. Ann. Bot. 2015, 116, 849–864. [Google Scholar] [CrossRef] [PubMed]
  2. DaMatta, F.M.; Grandis, A.; Arenque, B.C.; Buckeridge, M.S. Impacts of climate changes on crop physiology and food quality. Food Res. Int. 2010, 43, 1814–1823. [Google Scholar] [CrossRef]
  3. Wypych, A.; Ustrnul, Z.; Sulikowska, A.; Chmielewski, F.-M.; Bochenek, B. Spatial and temporal variability of the frost-free season in Central Europe and its circulation background. Int. J. Climatol. 2017, 37, 3340–3352. [Google Scholar] [CrossRef]
  4. Chervenkov, H.; Slavov, K. Assessment of agrometeorological indices over Southeast Europe in the context of climate change (1961–2018). Idojaras 2021, 125, 255–269. [Google Scholar] [CrossRef]
  5. Fischer, G.; Ramirez, F.; Casierra-Posada, F. Ecophysiological aspects of fruit crops in the era of climate change. A review. Agron. Colomb. 2016, 34, 190–199. [Google Scholar] [CrossRef]
  6. Leisner, C.P. Review: Climate change impacts on food security–focus on perennial cropping systems and nutritional value. Plant Sci. 2020, 293, 110412. [Google Scholar] [CrossRef]
  7. van Leeuwen, C.; Destrac-Irvine, A.; Dubernet, M.; Duchene, E.; Gowdy, M.; Marguerit, E.; Peiri, P.; Parker, A.; de Resseguier, L.; Ollat, N. An Update on the Impact of Climate Change in Viticulture and Potential Adaptations. Agronomy 2019, 9, 514. [Google Scholar] [CrossRef] [Green Version]
  8. Vuković, A.; Vujadinović, M.; Rendulić, S.; Djurdjević, V.; Ruml, M.; Babić, P.; Popović, D. Global Warming Impact on Climate Change in Serbia. Therm. Sci. 2018, 22, 2267–2280. [Google Scholar] [CrossRef]
  9. Djurdjević, V.; Vuković, A.; Vujadinović Mandić, M. Observed Climate Change in Serbia and Projections of Future Climate Based on Different Scenarios of Future Emissions; United Nation’s Development Program: Belgrade, Serbia, 2018; p. 24. (In Serbian) [Google Scholar]
  10. Statistical Office of the Republic of Serbia. Statistical Yearbook of the Republic of Serbia 2021; Statistical Office of the Republic of Serbia: Belgrade, Serbia, 2021; p. 453.
  11. Keserović, Z.; Magazin, N.; Kurjakov, A.; Dorić, M.; Gošić, J. Fruit Production; Statistical Office of the Republic of Serbia: Belgrade, Serbia, 2014; p. 94. (In Serbian) [Google Scholar]
  12. Jakšić, D. Grape and Wine Production in Serbia; Center for Grape and Wine Production Niš: Niš, Serbia, 2019; p. 294. [Google Scholar]
  13. Lukač Bulatović, M. The State and Forecast of Fruit Production and Processing in Serbia; Faculty of Agriculture in Novi Sad: Novi Sad, Serbia, 2020; p. 159. (In Serbian) [Google Scholar]
  14. Stričević, R.; Lipovac, A.; Prodanović, S.; Ristovski, M.; Petrović Obradović, O.; Djurović, N.; Djurović, D. Vulnerability of agriculture to climate change in Serbia–Farmer’s assessment of impacts and damages. J. Agric. Sci. 2020, 65, 263–281. [Google Scholar] [CrossRef]
  15. Hydrometeorlogical Service of Serbia. Available online: https://www.hidmet.gov.rs/ciril/meteorologija/klimatologija_godisnjaci.php (accessed on 24 May 2022).
  16. Cressman, G.P. An operational objective analysis system. Mon. Weather Rev. 1959, 87, 367–374. [Google Scholar] [CrossRef]
  17. Vukovic, A.; Vujadinovic, M.; Djurdjevic, V.; Cvetkovic, B.; Rankovic-Vasic, Z.; Przic, Z.; Ruml, M.; Krzic, A. Fine scale climate change analysis: From global models to local impact studies in Serbia. In Proceedings of the 7th International Conference on Information and Communication Technologies in Agriculture, Food and Environment (HAICTA), Kavala, Greece, 17–20 September 2015. [Google Scholar]
  18. Ivanisevic, D.; Jaksic, D.; Korac, N. Atlas of Viticulture; Statistical Office of the Republic of Serbia: Belgrade, Serbia, 2015; pp. 154–196. (In Serbian) [Google Scholar]
  19. Djurović, D.; Vulić, T.; Veličković, M.; Oparnica, Č.; Djordjević, A.; Milatović, D.; Nikolić, D.; Zec, G.; Fortirić-Akšić, M.; Djordjević, B.; et al. Zoning of Fruit Production in Belgrade, South and East Serbia; Project Report; University of Belgrade-Faculty of Agriculture: Belgrade, Serbia, 2020; p. 306. (In Serbian) [Google Scholar]
  20. Tonietto, J.; Carbonneau, A. A multicriteria climatic classification system for grape-growing regions worldwide. Agric. For. Meteorol. 2004, 124, 81–97. [Google Scholar] [CrossRef] [Green Version]
  21. Jones, G.V. Climate and Terroir: Impacts of Climate Variability and Change on Wine. In Fine Wine and Terroir—The Geoscience Perspective; Macqueen, R.W., Meinert, L.D., Eds.; Geological Association of Canada: St. John’s, NF, Canada, 2006; pp. 1–14. [Google Scholar]
  22. Fraga, H.; Malherio, A.C.; Moutinho-Pereira, J.; Jones, G.V.; Alves, F.; Pinto, J.G.; Santos, J.A. Very high resolution bioclimatic zoning of Portuguese wine regions: Present and future scenarios. Reg. Environ. Change 2014, 14, 295–306. [Google Scholar] [CrossRef]
  23. Fraga, H.; Malherio, A.C.; Santos, J.A. An overview of climate change impacts on European viticulture. Food Energy Secur. 2012, 1, 94–110. [Google Scholar] [CrossRef]
  24. International Organization of Vine and Wine. Guidelines for Vitiviniculture Zoning Methodologies on a Soil and Climate Level, Resolution OVI-VITI 423-2012; International Organization of Vine and Wine: Paris, France, 2012; p. 19. [Google Scholar]
  25. Winkler, A.J.; Cook, J.A.; Kliewer, W.M.; Lider, L.A. General Viticulture, 4th ed; University of California Press: Berkeley, CA, USA, 1974; p. 740. [Google Scholar]
  26. The European Parliament and the Council. Regulation EU No 1308/2013. Off. J. Eur. Union 2013, 347, 671–854. [Google Scholar]
  27. Huglin, M.P. Nouveau Mode D’evaluation des Possibilities Heliothermiques d’un Milieu Viticole; Comptes Rendus de l’Academie d’Agriculture de France; Academie d’Agriculture de France: Paris, France, 1978; Volume 64, pp. 1117–1126. [Google Scholar]
  28. Thornthwaite, C.W. An approach toward a rational classification of climate. Georg. Rev. 1948, 38, 55–94. [Google Scholar] [CrossRef]
  29. Luedeling, E.; Brown, P.H. A global analysis of the comparability of winter chill models for fruit and nut trees. Int. J. Biometeorol. 2011, 55, 411–421. [Google Scholar] [CrossRef] [Green Version]
  30. Fadon, E.; Herrera, S.; Guerrero, B.I.; Guerra, M.E.; Rodrigo, J. Chilling and Heat Requirements of Temperature Fruit Trees (Prunus sp.). Agronomy 2020, 10, 409. [Google Scholar] [CrossRef] [Green Version]
  31. Ruiz, D.; Campoy, J.A.; Egea, J. Chilling and heat requirements of apricot cultivars for flowering. Environ. Exp. Bot. 2007, 61, 254–263. [Google Scholar] [CrossRef]
  32. Djaman, K.; Koudahe, K.; Darapuneni, M.; Irmak, S. Chilling and Heat Accumulation of Fruit and Nut Trees and Flower Bud Vulnerability to Early Spring Low Temperatures in New Mexico: Meteorological Approach. Sustainability 2021, 13, 2524. [Google Scholar] [CrossRef]
  33. Hatfield, J.L.; Prueger, J.H. Temperature extremes: Effect on plant growth and development. Weather Clim. Extrem. 2015, 10, 4–10. [Google Scholar] [CrossRef] [Green Version]
  34. Correia, S.; Schouten, R.; Silva, A.P.; Goncalves, B. Sweet cherry fruit cracking mechanisms and prevention strategies: A review. Sci. Hortic. 2018, 240, 369–377. [Google Scholar] [CrossRef]
  35. Allen, R.G.; Pereira, L.S.; Raes, D.; Smith, M. Crop Evapotranspiration. Guidelines for Computing Crop Water Requirements; Irrigation and Drainage Paper, No. 56; FAO: Rome, Italy, 1998; p. 174. [Google Scholar]
  36. Hargreaves, G.H.; Samani, Z.A. Reference crop evapotranspiration from temperature. Appl. Eng. Agric. 1985, 1, 96–99. [Google Scholar] [CrossRef]
  37. Teslic, N.; Vujadinovic, M.; Ruml, M.; Antolini, G.; Vukovic, A.; Parpinello, G.P.; Versari, A.; Ricci, A. Climatic shifts in high quality wine production areas, Emilia Romagna, Italy, 1961–2015. Clim. Res. 2017, 73, 195–206. [Google Scholar] [CrossRef] [Green Version]
  38. Droulia, F.; Charalampopoulos, I. Future Climate Change Impacts on European Viticulture: A Review on Recent Scientific Advances. Atmosphere 2021, 12, 495. [Google Scholar] [CrossRef]
  39. Sgubin, G.; Swingedouw, D.; Dayon, G.; de Cortaz-Atauri, I.G.; Ollat, N.; Page, C.; van Leeuwen, C. The risk of tardive frost damage in French vineyards in a changing climate. Agric. For. Meteorol. 2018, 250, 226–242. [Google Scholar] [CrossRef]
  40. Vautard, R.; van Oldenborgh, G.J.; Bonnet, R.; Li, S.; Robin, Y.; Kew, S.; Philip, S.; Soubeyroux, J.M.; Dubuisson, B.; Viovy, N.; et al. Human influence on growing-period frosts like the early April 2021 in Central France. Nat. Hazards Earth Syst. Sci. Discuss 2022. in review. [Google Scholar] [CrossRef]
  41. Vitasse, Y.; Scneider, L.; Rixen, C.; Christen, D.; Rebetez, M. Increase in the risk of exposure of forest and fruit trees to spring frosts at higher elevations in Switzerland over the last four decades. Agric. For. Meteorol. 2018, 248, 60–69. [Google Scholar] [CrossRef]
  42. Augspurger, C.K. Reconstructing patterns of temperature, phenology, and frost damage over 124 years: Spring damage risk is increasing. Ecology 2013, 94, 41–50. [Google Scholar] [CrossRef]
  43. Liu, Q.; Piao, S.; Janssens, I.; Fu, Y.; Peng, S.; Lian, X.; Ciais, P.; Myneni, R.; Penuelas, J.; Wang, T. Extension of the growing season increases vegetation exposure to frost. Nat. Commun. 2018, 9, 426. [Google Scholar] [CrossRef] [Green Version]
  44. Lamichhane, J.R. Rising risks of late-spring frosts in a changing climate. Nat. Clim. Change 2021, 11, 554–555. [Google Scholar] [CrossRef]
Figure 1. Geographical position of the Republic of Serbia (a) and its topography (b).
Atmosphere 13 00948 g001
Figure 2. Mean temperature (°C) and precipitation (%) anomalies between periods 1961–1990 and 1998–2017. Black dots mark areas where the observed changes are statistically significant according to the t-test. (a) mean annual temperature anomaly; (b) mean vegetational (April–October) temperature anomaly; (c) mean summer (June, July, August) temperature anomaly; (d) annual precipitation anomaly; (e) vegetational precipitation anomaly; (f) summer precipitation anomaly.
Atmosphere 13 00948 g002aAtmosphere 13 00948 g002b
Figure 3. Quantiles of distribution of mean temperature (a) and precipitation (b) anomalies between periods 1961–1990 and 1998–2017 for four elevation categories. Whisker and box lines denote from bottom–up: minimum, 10th percentile, 25th percentile, median, 75th percentile, 90th percentile, and maximum anomaly. Black boxes are annual mean anomalies, green boxes are vegetational mean anomalies, and red boxes are summer anomalies.
Atmosphere 13 00948 g003
Figure 4. Winkler index (a), Huglin index (b), Cool Nights index (c), and Dryness index (d) categories for the period 1998–2017. Black dots mark areas where the index category has changed in comparison to 1961–1990.
Atmosphere 13 00948 g004
Figure 5. Quantiles of distribution of elevation in Winkler index (WIN), Huglin index (HI), Cool Nights index (CI), and Dryness index (DI) categories for periods 1961–1990 (black) and 1998–2017 (red). Whisker and box lines denote from bottom–up: minimum, 10th percentile, 25th percentile, median, 75th percentile, 90th percentile, and maximum anomaly.
Atmosphere 13 00948 g005
Figure 6. Frequency of years in which at least one day with Tn < −2 °C occurred after the start of the frost-sensitive period for threshold temperature 10 °C (a), 11 °C (b), and 12° (c) in the period 1998–2017. Black dots mark areas where the frequency has increased more than 10% between the periods 1998–2017 and 1961–1990.
Atmosphere 13 00948 g006
Figure 7. Mean date of the first occurrence of at least two consecutive days with Tx > 35 °C (a) and mean length of the period in which such events occurred, (b) for the period 1998–2017. Black dots mark areas where the change between the periods 1998–2017 and 1961–1990 is statistically significant. Data are given only for points in which such events occurred in more than half of the years of the period. Frequency of years in which at least two consecutive days with Tx > 35 °C occurred during summer (c) in the period 1998–2017. Black dots mark areas where the frequency has increased more than 10% between the periods 1998–2017 and 1961–1990.
Atmosphere 13 00948 g007
Figure 8. Frequency of years in which at least one occurrence of Tn < −15 °C (a), Tn < −20 °C (b), and daily precipitation above 30 mm during cherry ripening (c). Black dots mark areas where the frequency has increased more than 10% between the periods 1998–2017 and 1961–1990.
Atmosphere 13 00948 g008
Figure 9. Upper row: average water deficit (mm) for different fruits in 1998–2017. Black dots mark areas where the change between the periods 1998–2017 and 1961–1990 was statistically significant. Lower row: frequency of years in which observed water deficit was larger than 300 mm in the period 1998–2017. Black dots mark areas where the frequency has increased more than 10% between the periods 1998–2017 and 1961–1990. Results for cherries (a,d), apricots and peaches (b,e), apples, pears, and plums (c,f).
Atmosphere 13 00948 g009
Figure 10. Upper row: average water deficit (mm) for different fruits in 1998–2017. Black dots mark areas where the change between the periods 1998–2017 and 1961–1990 was statistically significant. Lower row: frequency of years in which observed water deficit was larger than 300 mm in period 1998–2017. Black dots mark areas where the frequency has increased more than 10% between the periods 1998–2017 and 1961–1990. Results for berries (a,c), and grapes (b,d).
Atmosphere 13 00948 g010
Table 1. Threshold temperature (°C) of the frost-sensitive period for fruit trees commonly grown in Serbia.
Threshold Temperature (°C)Fruits
10apricot, peach
11peach, sweet cherry, sour cherry, plum, raspberry
12apple, pear, quince, sour cherry
Publisher’s Note: MDPI stays neutral with regard to jurisdictional claims in published maps and institutional affiliations.

