Article

Monitoring and Analysis of Outdoor Carbon Dioxide Concentration by Autonomous Sensors

by
Paulo Henrique Soares
1,2,*,
Johny Paulo Monteiro
3,*,
Hanniel Ferreira Sarmento de Freitas
2,
Luciano Ogiboski
1,
Felipe Silva Vieira
2 and
Cid Marcos G. Andrade
2
1
Departamento de Informática, Universidade Tecnológica Federal do Paraná, Guarapuava 85053-525, Brazil
2
Departamento de Engenharia Mecânica, Universidade Estadual de Maringá, Maringá 87020-900, Brazil
3
Laboratório de Materiais, Macromoléculas e Compósitos (LaMMAC), Universidade Tecnológica Federal do Paraná, Apucarana 86812-460, Brazil
*
Authors to whom correspondence should be addressed.
Atmosphere 2022, 13(2), 358; https://doi.org/10.3390/atmos13020358
Submission received: 29 December 2021 / Revised: 7 February 2022 / Accepted: 9 February 2022 / Published: 20 February 2022

Abstract

:
Countless problems have been caused by the excessive emission of polluting gases, such as carbon dioxide (CO2), into the atmosphere. Therefore, more effective monitoring of CO2 is essential, especially in central or industrial regions. Thus, this work shows the development of a platform for monitoring the CO2 concentration, which is composed of autonomous and independent sensors that have their own energy source, storage capacity, and data replication for the central server. To validate the platform, CO2 measurements were taken at three strategic points in an outdoor environment in a Brazilian urban center. This platform proved to be an evolution over another system previously proposed by the group that was based on the use of a wireless network of sensors to monitor CO2. This new project managed to overcome limitations that compromised the efficiency of the first platform, which were mainly related to the interference in the communication signals between the network sensors due to the existence of physical barriers in the monitoring environment. With that, this new platform showed greater security in the maintenance of collected data and allowed for the expansion of the physical complexity of the environments that can be monitored.

1. Introduction

In recent years, the emission of polluting gases into the atmosphere has increased considerably due to the growth of the fleet of motor vehicles and industrial activities. This pollution is mainly concentrated in large urban centers, which contributes to people having greater exposure to substances considered toxic such as carbon dioxide (CO2). For these reasons, the monitoring of air quality is important, especially the concentration of gases that pose a greater health risk. Ideally, monitoring should take place at strategic points in cities, especially in regions with a heavy flow of vehicles and people [1]. CO2 atmospheric levels have been gradually increasing in recent years. According to data from the National Oceanic and Atmospheric Administration (NOAA, Washington, DC, USA), one of the most-respected laboratories in the USA, in 1960, the CO2 concentration was 320 ppm; in 2015, this value surpassed 400 ppm for the first time, reaching close to 410 ppm in 2021. These values were obtained from sensors installed at an altitude of 3500 m, in a region far from direct sources of pollution [2]. In places where the burning of fossil fuels is more intense, particularly in urban centers, the CO2 amount tends to have even higher values. This is due to the large flow of vehicles and industries.
According to previous studies, the ideal CO2 concentration in outdoor environments should be between 450 and 550 ppm [3], although this limit may vary according to different regional legislations. However, studies show that the human organism begins to subtly feel the first CO2 toxic effects from 600 ppm [4]. CO2 is a gas considered to be less toxic than others. However, it can pose a danger to the population’s health (when above safe limits) and to the environment. In humans, it can cause headaches, breathing problems, difficulty concentrating, compromise athletes’ performance, increase the risk of cancer, and even lead to death in extreme cases [1]. In addition, CO2 is considered one of the main gases responsible for the greenhouse effect, which is a worrying environmental problem. The amount of air pollutants is large and, therefore, it is an arduous and expensive task to quantify the concentration of all of them simultaneously. Each substance requires specific equipment and techniques for its correct monitoring. To alleviate this difficulty, it is possible to measure only CO2 levels as it is considered an excellent indicator of air quality. When the CO2 concentration is high in an environment, most of the other polluting gases tend to follow the same trend as well [5].
In recent years, several studies have proposed air-quality-monitoring mechanisms [6,7,8,9,10]. Most platforms are formed by a wireless-based sensors network, which measures different points and can display the information in real time or store it for future consultation. One of the great advantages of this type of architecture is the possibility of distributing sensors in an environment and monitoring it completely. Overall, the projects aim to optimize certain hardware components, wireless sensor network communication, and even battery life. The reported systems show high communication efficiency and are able to monitor different types of pollutants in different environments (such as subways, other indoor environments, and open areas in cities). However, all the proposed systems fail to perform a systematic analysis of the collected data. Therefore, they can only generate graphs with the concentration of a particular pollutant. This information may not necessarily be useful to a common user who has no knowledge of environmental pollution. Furthermore, there are some limitations that end up compromising the functioning of the system and compromising its use [11,12]. On the other hand, there are other works that do not address the measurement through sensors and focus on the development of algorithms and data analysis techniques to generate structured information [13,14,15,16,17]. The projects show the implementation of algorithms to predict the concentration of toxic gases and classifiers to categorize critical days and times, among other data analysis techniques. However, the systems are only able to apply the analysis tools in databases freely available on the internet or in data obtained from their own measurements using commercial equipment.
Our group has already reported an agile method of assessing air quality based on measurements of CO2 concentrations. For this, the construction of a monitoring platform composed of CO2 sensors connected in a wireless network was shown. The measurements performed by each sensor, spread across multiple points in the measurement environment, were sent to a central sensor, which was the only one capable of replicating all the data to a central database. Subsequently, the data were analyzed to generate knowledge through queries and data-mining techniques [18]. Despite enabling air quality analysis, the use of a wireless sensor network created some difficulties and limitations. The most common problems were interference and loss of communication between sensors due to the existence of physical obstacles. This caused data loss. Therefore, environments such as forests, woods, and urban centers (due to the buildings) can compromise the network’s functioning. Furthermore, the area covered by the network was limited as the number of sensors in the network increases proportionally to the monitoring area. A very large number of sensors increases management complexity and can generate network overload [18].
For these reasons, a new version of the monitoring platform was proposed in this work. The architecture consists of autonomous and independent CO2 sensors. Each sensor is able to store (in the absence of the internet) and replicate data to the central server. Then, the central server performed data analysis and mining to generate relevant air quality information on demand via some query methods. The objective was to develop a robust platform that can be used as a technical solution for the reliable monitoring of atmospheric CO2 in different environments (even in more remote places such as forests and agricultural areas). Furthermore, we aim to produce a system that can analyze data and present structured information about air quality to the user. The proposed monitoring system was used to assess the outdoor CO2 concentration at various points in a Brazilian urban center, which was only used as a test environment for the platform.

2. Materials and Methods

2.1. Monitoring Platform Architecture with Autonomous Sensors

The new architecture exclusively used free and low-cost technologies and components. CO2 sensors (MG811, Winsen Electronics, Zhengzhou, China) were used to determine the gas concentration. This is an electrochemical sensor that operates with a solid electrolyte cell. The redox reaction in question is: L i 2 C O 3 + 2 N a + N a 2 O + 2 L i + + C O 2 . CO2 is a colorless and relatively dense gas that is present in the atmosphere at average concentrations of 400 ppm. It interferes with the chemical reaction that occurs in the sensor and the electrical potential difference generated directly depends on the CO2 concentration to which the sensor is exposed. The sensor is highly selective as it adopts this chemical principle (only carbon monoxide can minimally interfere with the response if it reaches unlikely levels above 1000 ppm). Furthermore, the measurements suffer minimal variation if the device operates in a temperature range between 20 and 50 °C and relative humidity up to 95% (accuracy above 98.5%). The sensor can measure CO2 concentrations in the range between 350 and 10000 ppm. Thus, to relate the electrical signals and the CO2 concentration in ppm, an algorithm was developed and implemented on an Arduino UNO microcontroller that was connected to the sensor. The MG811 sensors were calibrated using environments with known CO2 concentrations, which were determined using the GL-T25GL001 CO2 sensor (Globus). This device is factory calibrated and guarantees extremely reliable measurements (up to 98%) accuracy. The Arduino microcontroller was connected to a Raspberry Pi minicomputer, where a database, MySQL, was installed. Then, The Raspberry Pi organized and replicated (or stored, if necessary) the data received from the sensor to the central server. The latter has more computational resources and allows for more advanced queries and data analysis processes. The presence of a Raspberry Pi in each sensor played a key role in this proposal to improve the monitoring platform. It can connect to the internet via a wireless network or 4G technology. When the Raspberry Pi was connected to the internet, data stored in its local database were instantly replicated to the central server’s MySQL. However, if the monitored environment does not have internet, the data can be stored in the device’s own memory and be synchronized in the future. This increased data security. Figure 1 shows the working flow of the monitoring platform.

2.2. Query and Data Mining Process

The monitoring platform collects the CO2 concentration, and these data are replicated/stored in the central server’s MySQL database. Some metadata (date, time, and location) are also sent. After the monitoring period (when all data have been replicated to the database), it is possible to consult the measurement history. Therefore, a query system was developed using the Java programming language and was installed in the database. This system allows the entry of parameters, such as specific dates and times, to filter and display the data measured by the sensors according to the user’s needs. However, queries to the database only return what is requested. As the database grows, a great deal of valuable information can be hidden because the human being is not able to analyze and find possible patterns in large databases. However, using computational data mining techniques, it is possible to establish patterns that can help in the generation of knowledge and the decision-making process [19]. Thus, the database was integrated with Weka, which is a free data-mining tool that already has a series of implemented and customizable algorithms [20]. The objective here was to determine the intervals of the day when air quality is compromised (CO2 concentration above 600 ppm). For this, the Weka classification algorithm, called C4.5, was used to generate a decision tree. This algorithm is classified as “greedy” because it uses the divide-and-conquer strategy. Basically, it solves problems by indicating the best choice locally, with the expectation that these choices lead to the best global choice at the end of the execution process [21].

2.3. CO2 Concentration Measurement Tests

The efficiency of measurements and analysis of the data obtained by the platform was evaluated through field analysis. The tests were carried out in Maringá, Brazil, which is a city with approximately 350,000 inhabitants. The city has large extensions of green areas that are mainly formed by parks and woods. However, it has one of the highest ratios of cars per inhabitant in the country, and for that reason, it is a good test environment. Sensory systems were spread in 3 locations in the city, which were selected as they present a large flow of vehicles and/or people. In addition, locations that left the sensors far apart were considered. Table 1 shows the distribution of the three sensors and the justification for choosing the location.
The sensors were positioned in places where direct contact with the smoke emitted by cars was avoided, as this could distort the accuracy of the measurements. All equipment was placed inside a case to protect the devices from adverse weather conditions. The sensors were powered by a 12 V and 1.3 A battery, which was able to keep the equipment working for 10 days. The devices were configured to measure the CO2 concentration daily every 10 s (start and end were 5:00 and 22:00, respectively) and send it immediately to the central database. In case the internet connection was unavailable, the data were stored in the local database so the synchronism can occur later when the local internet returns. Monitoring took place for a continuous period of 8 weeks (between 26 July and 20 September 2021), forming a database sufficient for the data mining process to generate relevant and representative results. Figure 2 shows a map with the distribution and distance between the sensors:

3. Results

The monitoring platform measured CO
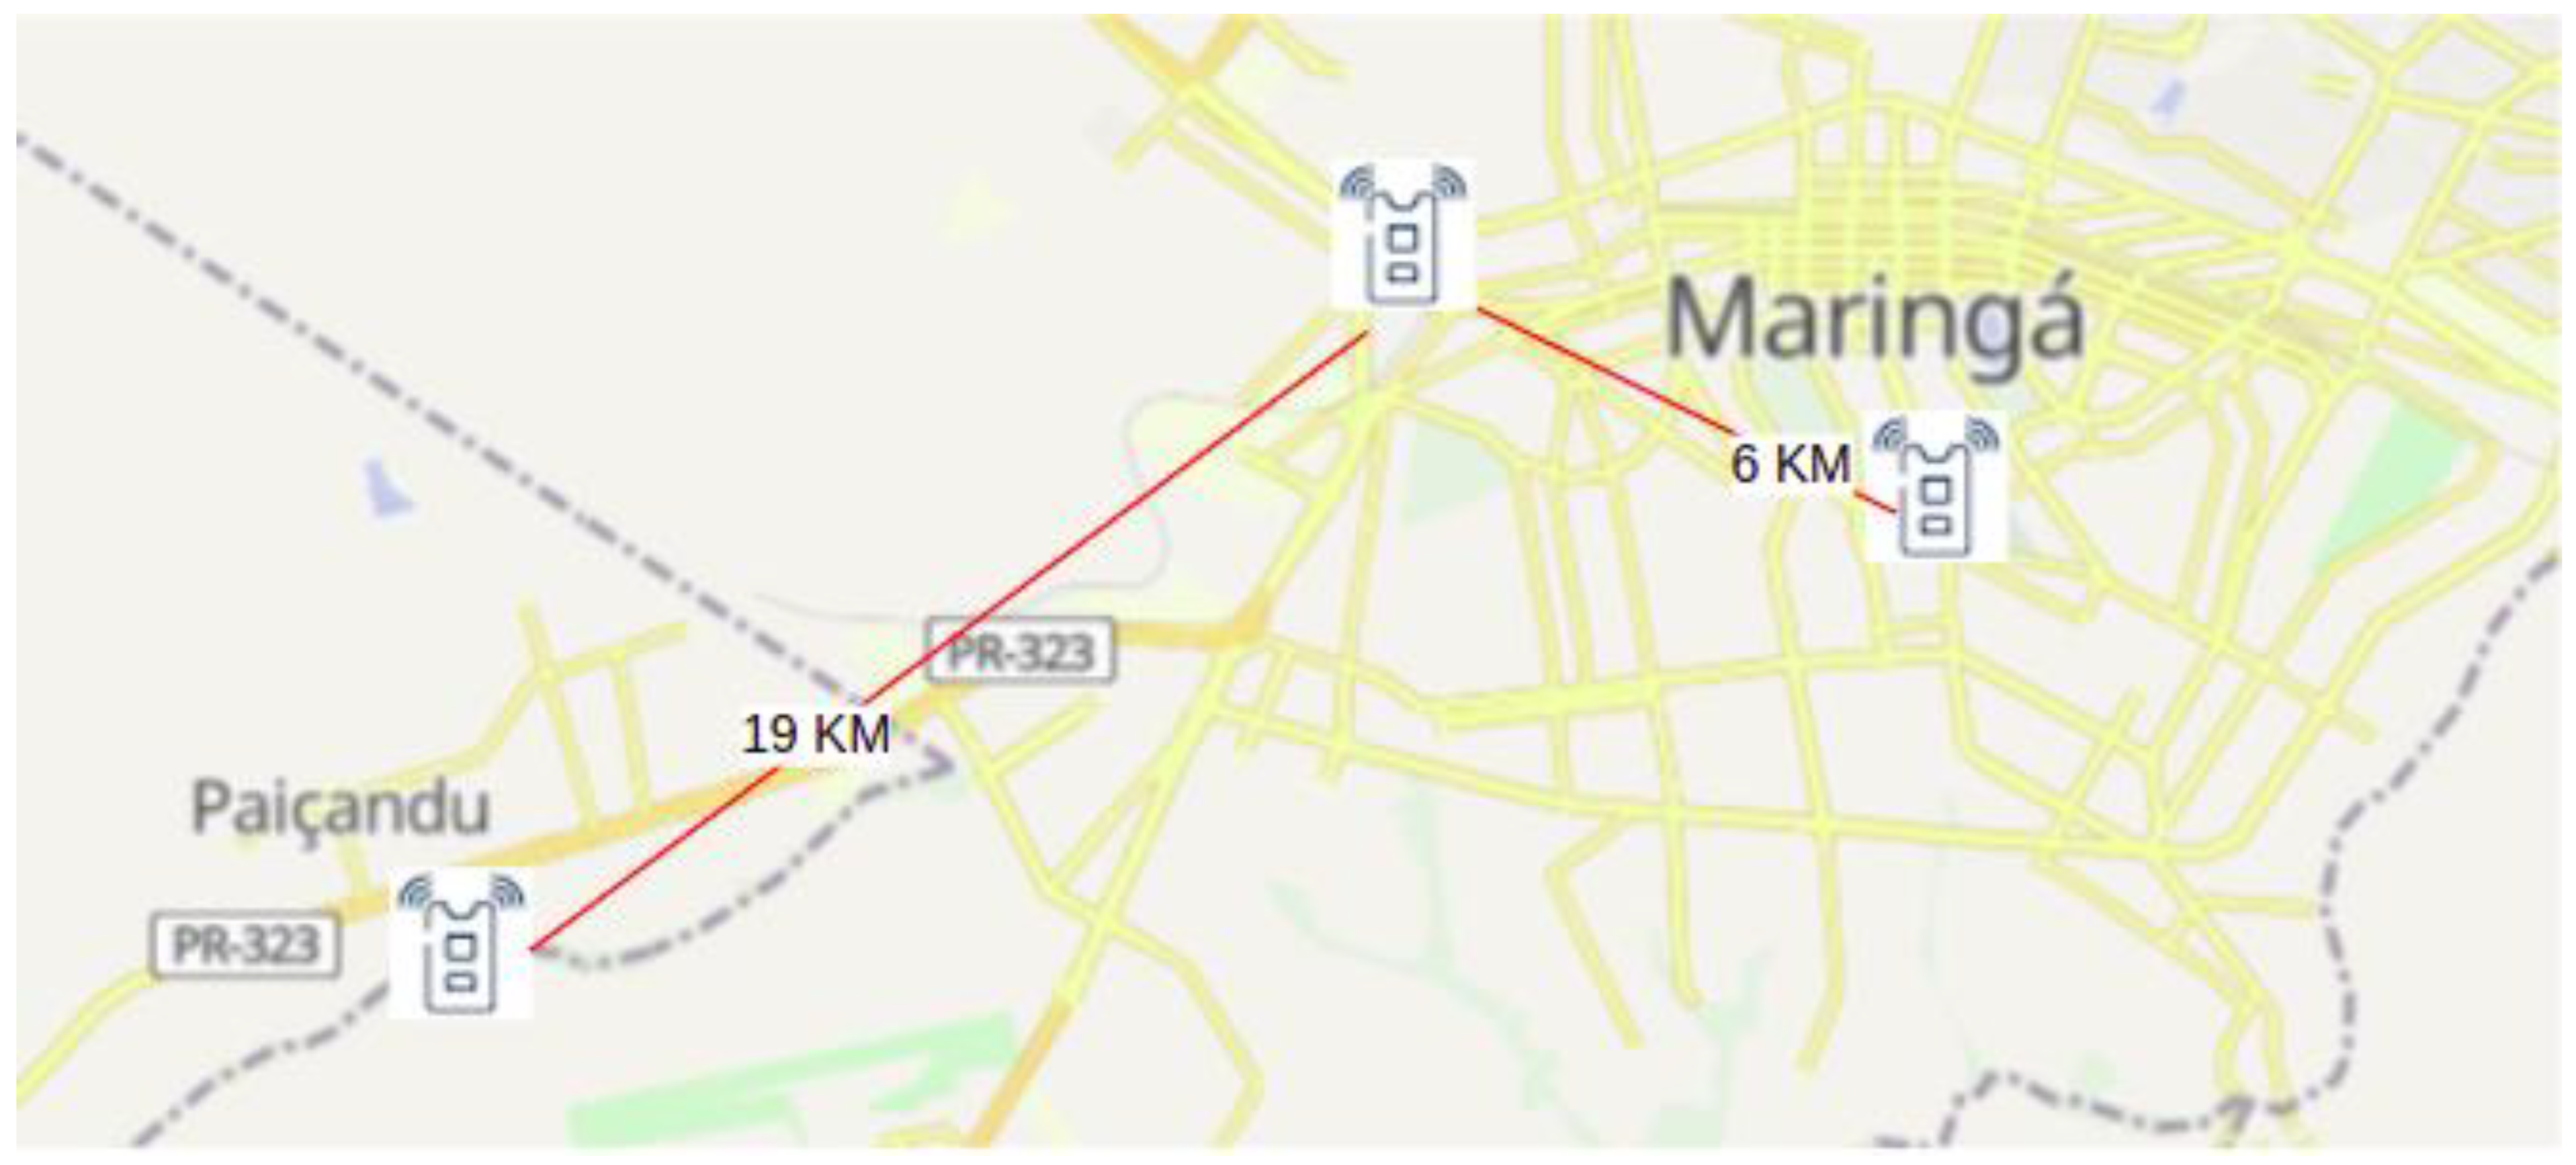
2 levels for 8 weeks in three different locations in a Brazilian city. The sensors generated 6120 daily records and a total of 342,720 at the end of the eighth week. The disk space occupied was approximately 1.1 GB. The database query process loses performance as it becomes lengthy. This causes the response time to increase. To alleviate this problem, an indexing structure was implemented in the measurement storage table. After these settings, analyses on air quality at the three test sites could be searched. Through the query interface, the highest and lowest CO2 concentrations were sought over the 8 weeks of monitoring for all sensors. These data were accompanied by the date and time the requested measures were taken. Table 2 displays these data.
The data in Table 2 show that the city entrance (monitored by sensor 2) had higher CO2 concentration peaks than the other locations and reached the highest CO2 concentration, which was 829 ppm. The lowest CO2 levels were found on the highway (monitored by sensor 3), mainly around 5:00 when the CO2 level remained below 500 ppm.
The query system also has tools for generating graphs that show the variation in CO2 levels. The user only needs to specify the time range (dates or times) that he wants to query, and the system dynamically generates a CO2 concentration curve over the selected period. As an example, Figure 3, Figure 4 and Figure 5 show curves with mean CO2 concentrations obtained throughout the day for sensors 1, 2, and 3, respectively. The average was obtained from the daily values obtained at each time over the 8 weeks of monitoring. Only weekdays were considered. It was evident that CO2 levels equal to or greater than 600 ppm (inappropriate for humans) were reached at certain times of the day for the different places evaluated.
Mapping was performed on the data collected by the sensors over the 8 weeks using data mining techniques. The C4.5 classification algorithm was configured to classify the CO2 measurements stored in the central database and generate a decision tree (Figure 6) to show the times of the weekdays when the air quality is poor (levels of CO2 are above 600 ppm).
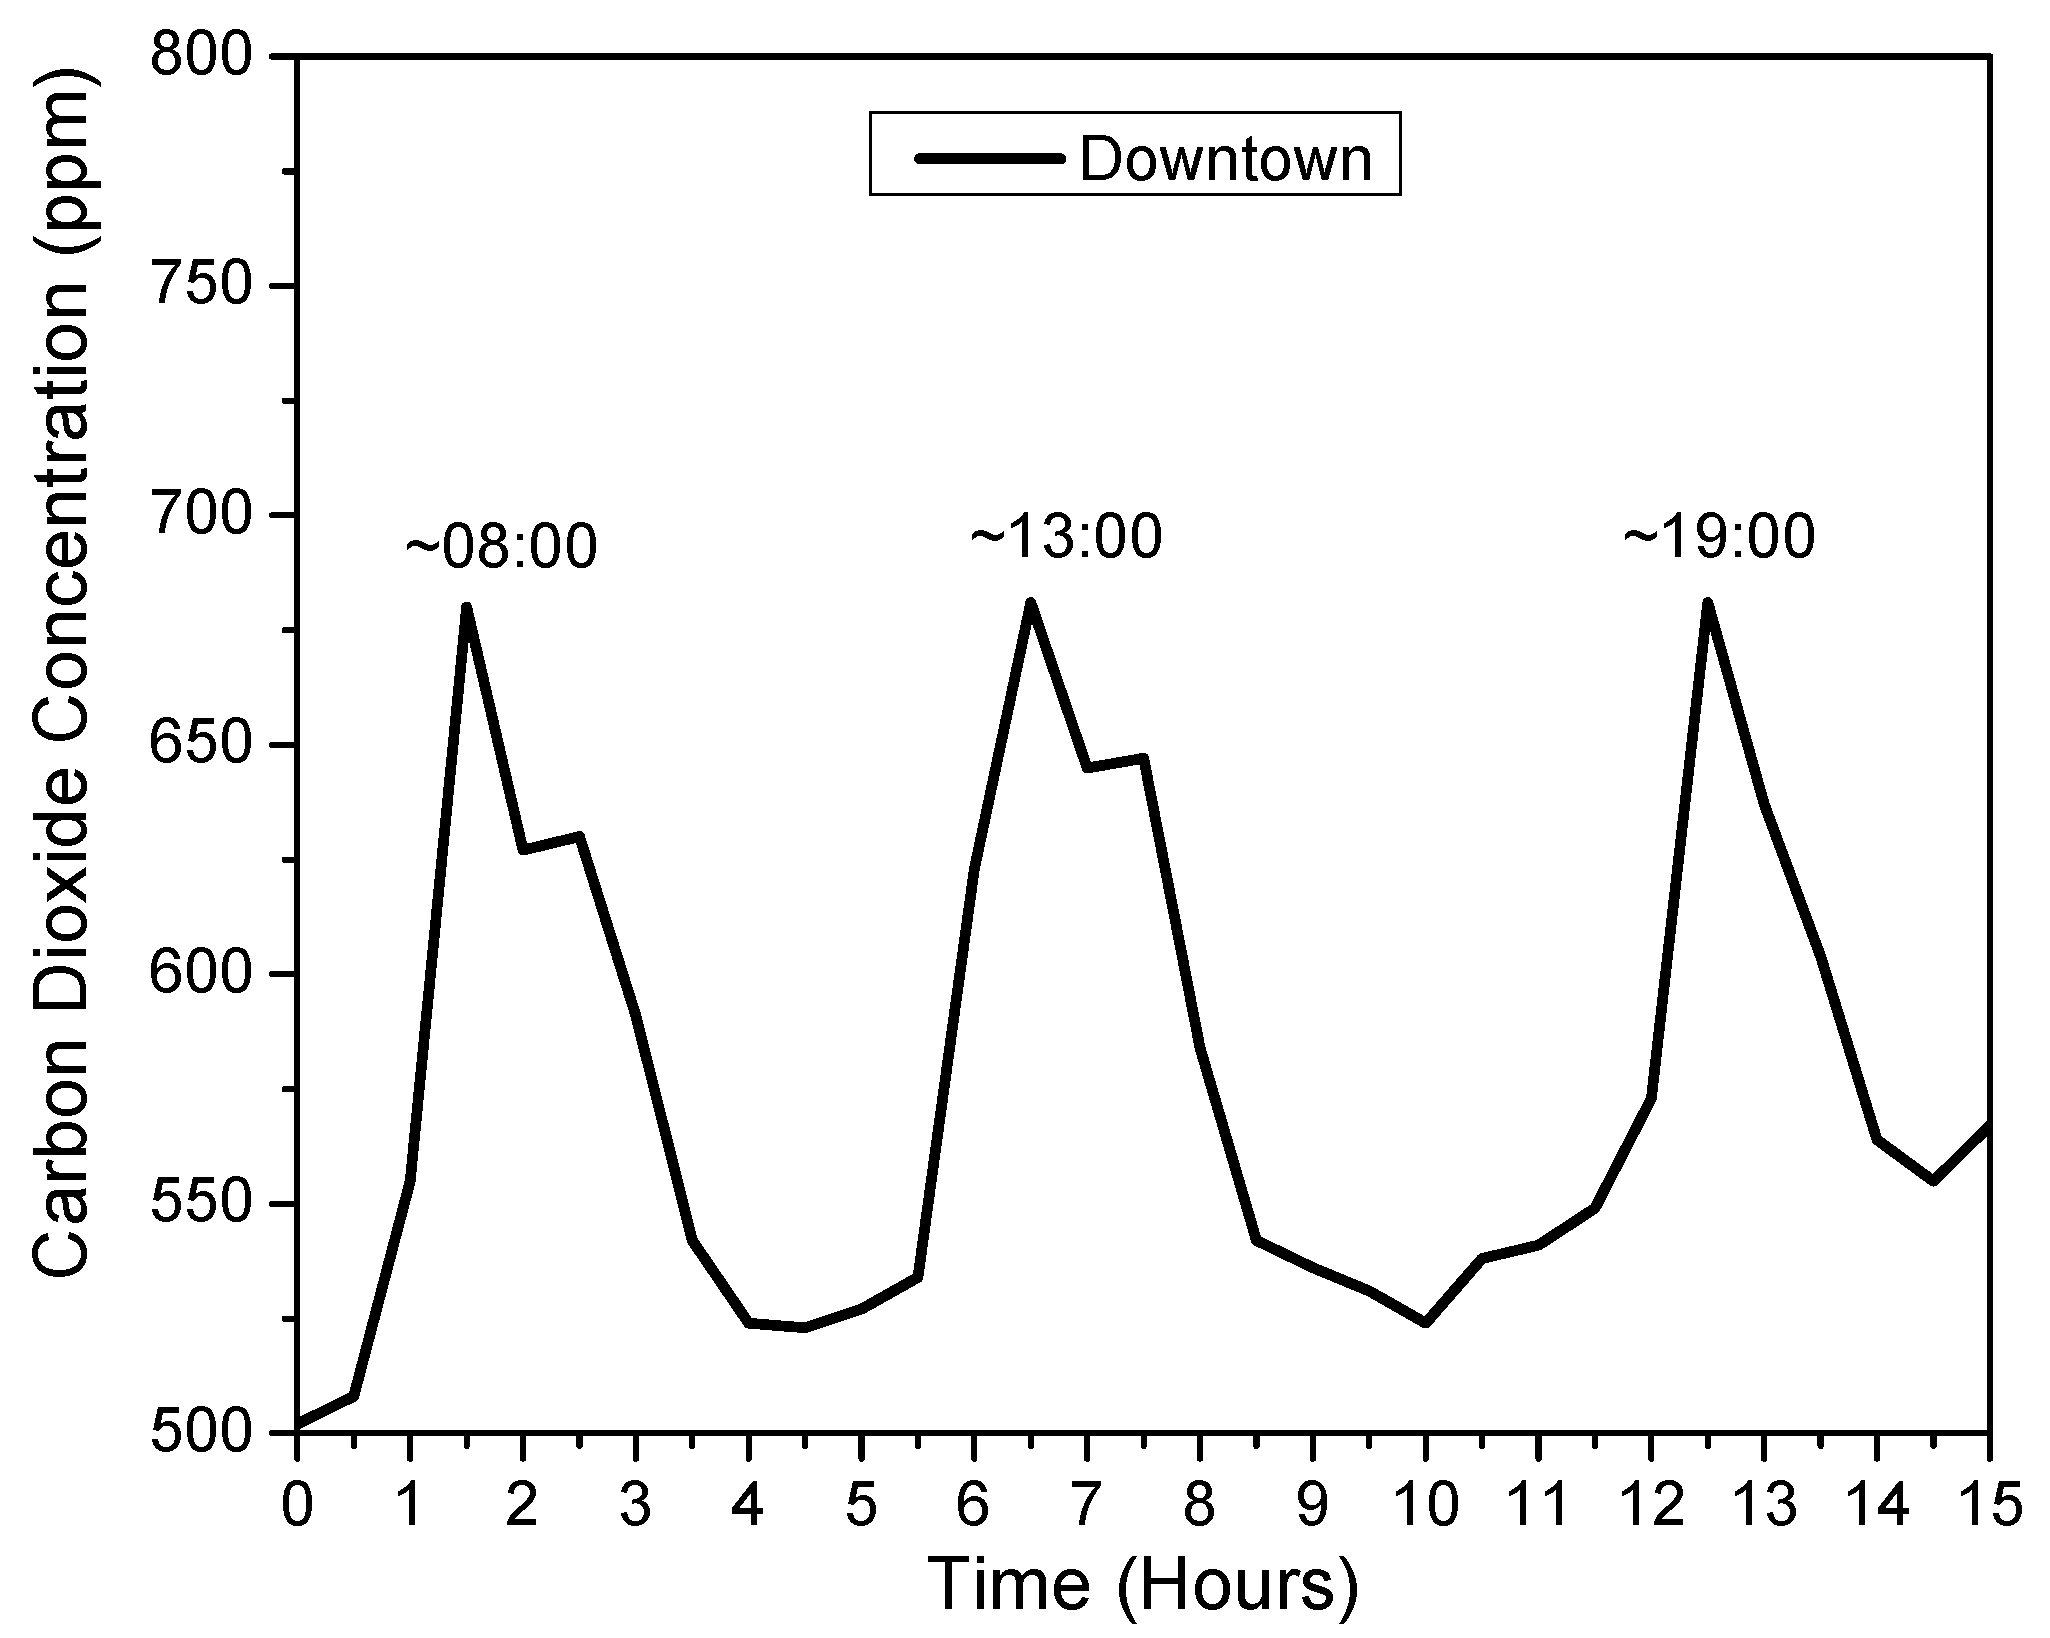
For downtown, there are three periods of the day in which the pollutant emissions were greater than recommended for outdoor environments: 07:13–08:41, 11:54–13:44, and 18:07–19:32. Both at the city entrance and at the highway, only two time-ranges displayed compromised air quality: 07:17–09:36 and 18:07–19:32, and 07:21–09:11 and 18:26–19:04, respectively.
To ensure good reliability of the results presented by the decision tree, the data stored in the central database were divided into two sets: The first set, corresponding to 70% of the records, was used to learn the C4.5 algorithm; the second one, corresponding to the remaining 30%, served to test the results generated from the data mining process. The success degree was satisfactory, reaching 86.7%. This means that only 13.3% of the data was outside of the pattern.

4. Discussion

The maximum and minimum values found by the query interface (Table 2) are the first point to be analyzed. The highest CO2 level found in the data contained in the central database was reached at the city entrance (829 ppm). This value is well above 600 ppm, which is considered safe for humans. Overall, this location had the highest CO2 levels compared to the other locations evaluated. This occurred because the city entrance shows large traffic jams throughout the day. A high CO2 peak (788 ppm) was also recorded downtown. In both cases, these high values were measured close to 18:00, which corresponds to the period of the day with the highest vehicular traffic. On the highway, the highest value measured by the sensor was 694 ppm, around 8:53. This possibly occurred because vehicles start leaving the city for the highway at 8:00, which is the time commercial activities begin on weekdays. The highway registered the lowest CO2 levels among the evaluated locations. Few traffic jams are observed, and the flow of vehicles is distributed throughout the day. The lowest CO2 concentration value obtained in the central database was recorded at this location (503 ppm). This value was acquired at 5:07, where vehicular traffic is very low.
The curves illustrated in Figure 3 and Figure 4 show more clearly how the average CO2 levels vary throughout the day during the 8 weeks of testing, considering only weekdays. Figure 2 represents the curve obtained for downtown and makes it clear that there are three CO2 concentration peaks where the limit concentration for human safety is exceeded. These high values occurred precisely at times with greater vehicle traffic and when traffic jams are normally observed. These are times when people from the city are in transit to go to work (beginning of the day), for lunch (midday), and to go home (end of the day).
Only two peaks were observed where the air quality was compromised for the entrance to the city, as shown in Figure 3. The average CO2 level at this location was remarkably high and had average values above 700 ppm at critical times. In this location, it usually presents extensive traffic jams daily. The city is the largest in the region and receives daily vehicular traffic from neighboring cities (people who are coming for work or for commercial reasons). The sensor was positioned at a roundabout that connects several highways, and traffic flows slowly during critical periods (start and end of the day).
The curve shown in Figure 5 clearly shows that the evaluated highway has superior air quality compared to the other monitored locations. The CO2 concentration usually exceeds 600 ppm for a few hours of the day, usually between 8:00 and 9:00. The present highway is in the interior of the state and major traffic jams are not common. There are only slight increases in vehicle flow when vehicles leave the city for external commercial activities.
The query system implemented in the monitoring platform allows a date range to be used as a parameter for generating graphics. This increased the data analysis flexibility. Thus, it is possible to generate daily, weekly, and monthly curves, among other possibilities. In the case of Figure 3 and Figure 4, the curves were generated based on the average CO2 concentration for each hour of the day, considering the 8 weeks of tests. The average value can bring some distortions. To obtain the average value, all data from the selected period are used. These data can bring extremely high (or low) CO2 concentration peaks, which are generated by a sporadic increase due to truck traffic, for example. This is an unusual situation within the dataset and can contribute to an erroneous impression of the local air quality.
The air quality profile can be more reliably obtained if the data mining technique is used. This was implemented in the monitoring system. The C4.5 algorithm was used to generate a decision tree that can determine time patterns when the CO2 concentration is above the safe limit (600 ppm), considering an acceptable error rate. Thus, the influence of extreme values on the measurements is disregarded since a broad analysis in the database is performed.
The decision tree generated in the data mining process (Figure 5) showed that, by default, the time ranges 07:13–08:41, 11:54–13:44, and 18:07–19:32 do not have good air quality downtown. Pollution rates were high in the 07:17–9:36 and 18:07–19:32 intervals at the city entrance. On the highway, the highest CO2 concentration values during monitoring were found in the 07:21–09:11 and 18:07–19:32 intervals. The 13.3% margin of error found in the decision tree means that out of 100 times when the air quality is considered poor, 13.3 are erroneous decisions by the algorithm (the air quality is adequate).
Finally, it is important to highlight that sensors 1 and 2, as they are in the city, were able to record data directly in the central database. The sensor 3, which was located on a highway, recorded CO2 concentrations locally as there was no internet signal. However, synchronization was performed later, and no problems were detected in this process.

5. Conclusions

This work demonstrated the development of an air-quality-monitoring platform that operated using autonomous sensors to measure CO2 concentrations. These devices had a technical condition that allowed the collected data to be recorded directly in a central database located in the cloud. In the absence of local internet, data could be stored for future synchronization. The project was tested for 8 weeks in three different external locations, and one of them had no internet signal. This proved the effectiveness of using autonomous sensors in architecture. In this way, the platform can act in the most diverse environments, even the most remote ones, such as agricultural regions and forests, among others. After the monitoring period, the platform was able to generate numerous graphs and updated information about air quality. Moreover, a decision tree was generated from the data mining process. Patterns were detected that allowed us to determine the periods when air pollution is above the levels considered ideal for humans.
Problems related to the security of the data collected and the limitation of the monitoring area were observed by an air-quality-monitoring platform (based on a wireless sensor network) previously reported by the group. All these problems were overcome with the development of this new monitoring architecture.
In addition to the great flexibility in monitoring air quality, the platform offered a wide range of query and data analysis tools, as well as an automated module in the data mining process. This generates knowledge that can help engineers and environmentalists in their decision making.

Author Contributions

Conceptualization, C.M.G.A.; Data curation, J.P.M., H.F.S.d.F. and L.O.; Formal analysis, P.H.S., J.P.M., H.F.S.d.F. and L.O.; Investigation, P.H.S. and H.F.S.d.F.; Methodology, P.H.S. and F.S.V.; Project administration, F.S.V. and C.M.G.A.; Resources, F.S.V.; Software, P.H.S., J.P.M. and F.S.V.; Supervision, C.M.G.A.; Validation, F.S.V.; Writing—original draft, P.H.S.; Writing—review & editing, F.S.V. and C.M.G.A. All authors have read and agreed to the published version of the manuscript.

Funding

Conselho Nacional de Desenvolvimento Científico (CNPq, process numbers: 420636-2018-8 and 305290/2020-7).

Institutional Review Board Statement

Not applicable.

Informed Consent Statement

Not applicable.

Data Availability Statement

Not applicable.

Acknowledgments

The authors thanks to Universidade Estadual de Maringá and Universidade Tecnológica Federal do Paraná.

Conflicts of Interest

The authors declare no conflict of interest.

References

  1. Marc, M.; Tobiszewskia, M.; Zabiegała, B.; Guardia, M.; Namieśnika, J. Current air quality analytics and monitoring: A review. Anal. Chim. Acta 2015, 853, 116–126. [Google Scholar] [CrossRef] [PubMed]
  2. National Oceanic and Atmospheric Administration (NOAA). Available online: https://www.noaa.gov/ (accessed on 21 December 2021).
  3. Zogla, G.; Blumberga, A. Energy Consumption and Indoor Air Quality of Different Ventilation Possibilities in a New Apartment Building. Sci. J. Riga Tech. Univ. Environ. Clim. Technol. 2010, 4. [Google Scholar] [CrossRef] [Green Version]
  4. Satish, U.; Mendell, M.J.; Shekhar, K.; Hotchi, T.; Sullivan, D.; Streufert, S.; Fisk, W.J. Is CO2 an indoor pollutant? Direct effects of low-to-moderate CO2 concentrations on human decision-making performance. Environ. Health Perspect. 2012, 120, 1671–1677. [Google Scholar] [CrossRef] [PubMed] [Green Version]
  5. Grant, R. Why is a carbon dioxide monitor a good investment? Crit. Environ. Technol. Can. Inc. (CETCI) 2010, 1. Available online: https://www.environmental-expert.com/articles/why-is-a-carbon-dioxide-monitor-a-good-investment-245067 (accessed on 28 December 2021).
  6. Kim, G.-S.; Son, Y.-S.; Lee, J.-H.; Kim, I.-W.; Kim, J.-C.; Oh, J.-T.; Kim, H. Air Pollution Monitoring and Control System for Subway Stations Using Environmental Sensors. J. Sensors 2016, 2016, 1–10. [Google Scholar] [CrossRef]
  7. Dzhevaga, N.V.; Borisova, D.D. Analysis of Air Monitoring System in Megacity on the Example of St. Petersburg. J. Ecol. Eng. 2021, 22, 175–185. [Google Scholar] [CrossRef]
  8. Wesseling, J.; De Ruiter, H.; Blokhuis, C.; Drukker, D.; Weijers, E.; Volten, H.; Vonk, J.; Gast, L.; Voogt, M.; Zandveld, P.; et al. Development and Implementation of a Platform for Public Information on Air Quality, Sensor Measurements, and Citizen Science. Atmosphere 2019, 10, 445. [Google Scholar] [CrossRef] [Green Version]
  9. Katulski, R.; Stefanski, J.; Sadowski, J.; Ambroziak, S.; Namiesnik, J.; Wardencki, W. Mobile Monitoring System for Control of Atmospheric Air Quality. Pol. J. Environ. Stud. 2011, 20, 677–681. [Google Scholar]
  10. Simo, A.; Dzitac, S.; Frigura-Iliasa, F.M.; Musuroi, S.; Andea, P.; Meianu, D. Technical Solution for a Real-Time Air Quality Monitoring System. Int. J. Comput. Commun. Control 2020, 15, 3891. [Google Scholar] [CrossRef]
  11. Al-Haija, Q. Design and on-field testing of wireless sensor network-based air quality monitoring system. JITCE J. Inf. Technol. Comput. Eng. 2019, 3, 54–59. [Google Scholar] [CrossRef] [Green Version]
  12. Caubel, J.J.; Cados, T.E.; Kirchstetter, T.W. A New Black Carbon Sensor for Dense Air Quality Monitoring Networks. Sensors 2018, 18, 738. [Google Scholar] [CrossRef] [PubMed] [Green Version]
  13. Sadhasivam, J.; Muthukumaran, V.; Raja, J.T.; Vinothkumar, V.; Deepa, R.; Nivedita, V. Applying data mining technique to predict trends in air pollution in Mumbai. J. Physics Conf. Ser. 2021, 1964. [Google Scholar] [CrossRef]
  14. Doreswamy, H.; Harishkumar, K.S. A Survey of Air Pollution Studies Using Data Mining Techniques. In Proceedings of the Smart City. National Conference on Science Engineering and Management 2018, Salem, Tamil Nadu, 25 January 2018; pp. 1–10. [Google Scholar]
  15. Aiswarya, J.; Namitha, S.J.; Namboothiri, L.V. Foresight of Health Risk Based on Air Pollutants’ Air Quality Index Values. Int. J. Innov. Technol. Explor. Eng. 2020, 9, 633–636. [Google Scholar] [CrossRef]
  16. Bellinger, C.; Jabbar, M.S.M.; Zaïane, O.; Osornio-Vargas, A. A systematic review of data mining and machine learning for air pollution epidemiology. BMC Public Heal. 2017, 17, 907. [Google Scholar] [CrossRef] [PubMed] [Green Version]
  17. Chowdhury, A.-S.; Uddin, M.S.; Tanjim, M.R.; Noor, F.; Rahman, R.M. Application of Data Mining Techniques on Air Pollution of Dhaka City. In Proceedings of the 2020 IEEE 10th International Conference on Intelligent Systems, Varna, Bulgaria, 28–30 August 2020; Sgurev, V., Jotsov, V., Kruse, R., Hadjiski, M., Eds.; IEEE: Piscataway, NJ, USA, 2020; pp. 562–567. [Google Scholar] [CrossRef]
  18. Soares, P.H.; Monteiro, J.P.; Freitas, H.F.; Sakiyama, R.Z.; Andrade, C.M. Platform for monitoring and analysis of air quality in environments with large circulation of people. Environ. Prog. Sustain. Energy 2018, 37, 2050–2057. [Google Scholar] [CrossRef]
  19. Vinodh, S.; Selvan, K.E.; Prakash, N.H. Evaluation of sustainability using fuzzy association rules mining. Clean Technol. Environ. Policy 2011, 13, 809–819. [Google Scholar] [CrossRef]
  20. Campbell, J.; Rustad, L.E.; Porter, J.; Taylor, J.R.; Dereszynski, E.W.; Shanley, J.B.; Gries, C.; Henshaw, D.; Martin, M.; Sheldon, W.M.; et al. Quantity is Nothing without Quality: Automated QA/QC for Streaming Environmental Sensor Data. BioScience 2013, 63, 574–585. [Google Scholar] [CrossRef] [Green Version]
  21. Setsirichok, D.; Piroonratana, T.; Wongseree, W.; Usavanarong, T.; Paulkhaolarn, N.; Kanjanakorn, C.; Sirikong, M.; Limwongse, C.; Chaiyaratanaa, N. Classification of complete blood count and haemoglobin typing data by a C4.5 decision tree, a naïve Bayes classifier and a multilayer perceptron for thalassaemia screening. Biomed. Signal Process. Control 2012, 7, 202–212. [Google Scholar] [CrossRef]
Figure 1. Monitoring platform architecture flow.
Atmosphere 13 00358 g001
Figure 2. Map with distribution and distance between sensors.
Atmosphere 13 00358 g002
Figure 3. Average CO2 concentration obtained downtown for each stipulated time. The mean was obtained from values acquired daily over the 8 weeks of monitoring. Only weekdays were considered. The data presented correspond to the period from 6:00 to 21:00 (total of 15 h of monitoring in the day).
Atmosphere 13 00358 g003
Figure 4. Average CO2 concentration obtained at the city entrance for each stipulated time. The mean was obtained from values acquired daily over the 8 weeks of monitoring. Only weekdays were considered. The data presented correspond to the period from 6:00 to 21:00 (total of 15 h of monitoring in the day).
Atmosphere 13 00358 g004
Figure 5. Average CO2 concentration obtained at the highway for each stipulated time. The mean was obtained from values acquired daily over the 8 weeks of monitoring. Only weekdays were considered. The data presented correspond to the period from 6:00 to 21:00 (total of 15 h of monitoring in the day).
Atmosphere 13 00358 g005
Figure 6. Decision tree generated in the data mining process containing the pattern of times when the air quality is not adequate.
Atmosphere 13 00358 g006
Table 1. Description of the places where the sensory systems were tested.
SensorLocalDescription
Sensor 1DowntownLocation with high flow of vehicles and people at certain times and has internet signal.
Sensor 1Roundabout at the city entranceLocation with heavy vehicle congestion at certain times and has internet signal.
Sensor 3Highway close to the cityLocation with more distributed vehicle flow and no internet signal.
Table 2. Lowest and highest CO2 concentration values obtained in the three monitored locations.
LocalSensorLowest ValuesHighest Values
Downtown1503 ppm
8 August 2021—05:07:40
788 ppm
27 August 2021—18:13:10
City entrance2516 ppm
5 September 2021—05:03:20
829 ppm
10 September 2021—18:21:50
Highway3484 ppm
12 September 2021—05:01:10
694 ppm
23 August 2021—08:53:30
Publisher’s Note: MDPI stays neutral with regard to jurisdictional claims in published maps and institutional affiliations.

