
Analysis of Regional Changes in Geodetic Mass Balance for All Caucasus Glaciers over the Past Two Decades


1
Antarctic Research Centre, Victoria University of Wellington, P.O. Box 600, Wellington 6140, New Zealand
2
School of Geography, Environment and Earth Sciences, Victoria University of Wellington, P.O. Box 600, Wellington 6140, New Zealand
3
School of Natural Sciences and Medicine, Ilia State University, Cholokashvili Ave 3/5, Tbilisi 0162, Georgia
4
Centre for Research and Teaching in Environmental Geoscience (CEREGE), Aix-Marseille University, CNRS, IRD, College De France, INRA, 13545 Aix-en-Provence, France
5
Department of Glaciology, Institute of Geography, Russian Academy of Sciences, 29 Staromonetniy Pereulok, 119017 Moscow, Russia
*
Author to whom correspondence should be addressed.
Atmosphere 2022, 13(2), 256; https://doi.org/10.3390/atmos13020256
Submission received: 4 January 2022
/
Revised: 28 January 2022
/
Accepted: 30 January 2022
/
Published: 2 February 2022
(This article belongs to the Special Issue Glaciers Mass Balance Sensitivity to Meteorological Variability)
Abstract
:Glaciers and snow in the Caucasus are major sources of runoff for populated places in many parts of this mountain region. These glaciers have shown a continuous area decrease; however, the magnitude of mass balance changes at the regional scale need to be further investigated. Here, we analyzed regional changes in surface elevation (or thickness) and geodetic mass balance for 1861 glaciers (1186.1 ± 53.3 km2) between 2000 and 2019 from recently published dataset and outlines of the Caucasus glacier inventory. We used a debris-covered glacier dataset to compare the changes between debris-free and debris-covered glaciers. We also used 30 m resolution ASTER GDEM (2011) to determine topographic details, such as aspect, slope, and elevation distribution of glaciers. Results indicate that the mean rate of glacier mass loss has accelerated from 0.42 ± 0.61 m of water equivalent per year (m w.e. a−1) over 2000–2010, to 0.64 ± 0.66 m w.e. a−1 over 2010–2019. This was 0.53 ± 0.38 m w.e. a−1 in 2000–2019. Mass loss rates differ between the western, central, and eastern Greater Caucasus, indicating the highest mean annual mass loss in the western section (0.65 ± 0.43 m w.e. a−1) in 2000–2019 and much lower in the central (0.48 ± 0.35 m w.e. a−1) and eastern (0.38 ± 0.37 m w.e. a−1) sections. No difference was found between the northern and southern slopes over the last twenty years corresponding 0.53 ± 0.38 m w.e. a−1. The observed decrease in mean annual geodetic mass balance is higher on debris-covered glaciers (0.66 ± 0.17 m w.e. a−1) than those on debris-free glaciers (0.49 ± 0.15 m w.e. a−1) between 2000 and 2019. Thickness change values in 2010–2019 were 1.5 times more negative (0.75 ± 0.70 m a−1) than those in 2000–2010 (0.50 ± 0.67 m a−1) in the entire region, suggesting an acceleration of ice thinning starting in 2010. A significant positive trend of May-September air temperatures at two selected meteorological stations (Terskol and Mestia) along with a negative trend of October-April precipitation might be responsible for the negative mass balances and thinning for all Caucasus glaciers over the study period. These results provide insight into the change processes of regional glaciers, which is key information to improve glaciological and hydrological projections in the Caucasus region.
1. Introduction
Glacier mass balance is an important variable for understanding the response of glaciers to climate change [1] and their contribution to regional water resources [2] as well as from the perspective of changes in global sea level [3,4,5]. Glacier mass balance can be derived by two different methods, such as the traditional glaciological method, and the geodetic method. Glaciological mass balance is based on in-situ measurements of accumulation and ablation using snow pits and stakes [1], while the geodetic mass balance can be obtained from observations of elevation change derived from digital elevation models (DEMs) computed from stereo satellite images. Ground-based measurement gives glaciological mass balance relatively high accuracy at the point of measurement, which is then interpolated to the glacier area, while the main advantage of geodetic mass balance is the wide regional coverage, although, the uncertainties of geodetic mass balance measurements depend on the satellite source and is often relatively high [6]. However, close range sensing such as airborne or terrestrial laser scanning significantly reduces the uncertainty to an order of decimeters to meter [7,8]. Significant improvements have been made in the last decades to improve the accuracy of the geodetic approach [9,10]. Furthermore, this method has become widely used in recent years due to the possibility to monitor large glacierised areas [3,4].
Meltwater of glaciers and snow provides a water source for electricity generation, ecosystems, and communities in the Greater Caucasus. These glaciers also have a positive impact on the economy by being a major tourist attraction in this region. Several national parks on both sides of the Greater Caucasus (Georgia/Russia) welcome thousands of visitors each year. On the other hand, glacier hazards are relatively common in this region, leading to major casualties [11,12,13]. Thus, estimation of glacier mass change is of great significance in this region. Investigation of glacier mass balance will also provide important information for future research on various socio-economic impacts such as water resource management, risk assessments, and tourism in this mountain region.
Attempts to organize in-situ regular observations of glacier mass balance have been made since the early 1960s on both southern (Georgia) and northern (Russia) slopes of the Greater Caucasus [14,15]. The duration of those measurements was short for various reasons. Long-term glaciological observation campaigns (stake method) on the Russian side of the Greater Caucasus began in 1967 on Djankuat Glacier (43°11′57″ N; 42°45′24″ E) [16], which started in 1982 on Garabashi Glacier (43°18′19″ N; 42°28′13″ E) [17]. A similar monitoring program was started in 1968 on Buba (Tbilisa) Glacier (42°44′57″ N; 43°44′45″ E) on the Georgian side of the Greater Caucasus [18]. After the dissolution of the Soviet Union in 1990s, the monitoring program was interrupted in Georgia and no glaciological field measurements were carried out until 2007, when the mass balance monitoring programs were temporarily (2007–2010) initiated on Zopkhito Glacier (42°52′54″ N; 43°25′29″ E). One-year glaciological mass balance measurement was also initiated on Chalaati Glacier (43°7′49″ N; 42°42′30″ E) in 2011 [19]. The initiation of other continuous monitoring programs was difficult mainly due to hard political and social conditions resulting in more than 30 years of gaps in glaciological mass balance data. Nowadays, continuous series of long-term observations by traditional glaciological method continue only on Djankuat and Garabashi glaciers from the Russian side of the Greater Caucasus [20].
In the last few decades, research in the Greater Caucasus focused mainly on documenting changes in glacier area [21,22,23,24], indicating a significant shrinkage in regional ice coverage. Long-term ground-based measurements from Djankuat and Garabashi glaciers also suggest predominantly negative mass balances over the last few decades from this region [17,25]. Recently, geodetic mass balances have also been monitored within the local [26,27], and global [3,4] studies. The main limitations of local studies are incomplete area coverage, while the global studies always describe the Caucasus, with the Middle East making the regional analysis difficult. The vast majority of glaciers in the Middle East are very small, with mean area of <0.1 km2 [28,29] and the climate is hot and arid (dry) [30], causing a much higher rate of glacier decline [28,29]. Thus, combining these two regions causes a bias with more negative values over the Caucasus region.
In this study, we use thickness and surface mass balance data from recently published global study by Hugonnet et al. (2021) [3]. This study offers a unique opportunity to analyze the behavior of individual glaciers in the Greater Caucasus as the data of mass balance and thickness changes are available for each specific glacier. Thus, the main goal of this study is to:
- (i)
- analyze the behavior of glaciers in the Greater Caucasus separately from the Middle East;
- (ii)
- estimate changes in surface elevation and geodetic mass balance for all Caucasus glaciers over the past two decades according to river basins and analyze these changes on sub-regional (e.g., western vs. eastern; northern vs. southern) and individual glaciers (e.g., debris-covered vs. debris-free);
- (iii)
- compare this data with those from local existing ground-based and geodetic mass balance measurements along with local climate observations from high-mountain meteorological stations.
2. Study Area
Caucasus is a complex mountain system located between the Black and Caspian seas on the border of Europe and Asia consisting of two separate mountain systems such as the Greater Caucasus and the Lesser Caucasus (Transcaucasian Highlands). The Greater Caucasus is the higher and more extensive part of this region, extending for about 1100 km from northwest to southeast. The Lesser Caucasus is located approximately 100 km to the south and characterized by relatively lower elevations and warm climate, providing unfavourable conditions for the existence of modern glaciers. Thus, all contemporary glaciers of the Caucasian region belong to the Greater Caucasus.
According to geomorphological characteristics, altitudinal difference, and climatic conditions, the Greater Caucasus divided into three parts—the Western, Central, and Eastern. The central Greater Caucasus is situated between the mountain peaks of Elbrus (5642 m) and Kazbegi (5047 m) (Figure 1). Several summits in the central Greater Caucasus exceed 5000 m above sea level (a.s.l.): Dykh-Tau (5205 m), Shkhara (5203 m), Koshtan-Tau (5151 m), Jangha (Dzhangi-Tau) (5058 m), and Pushkin Peak (5034 m). The western section is the lowest part of the Greater Caucasus, with highest summit being Dombai-Ulgen (4046 m). The Eastern section of the Greater Caucasus is the most expanded part of this mountain region, with the highest summit being Mt. Bazardüzü (4466 m a.s.l.). The division of the Greater Caucasus into northern and southern macroslopes by location relative to the main crest of the range is also often used.
The mountain range of the Greater Caucasus represents an orographic barrier to the flow of moisture brought from the west and southwest by Mediterranean and Atlantic cyclones. The greatest amount of precipitation falls on the southern slope of the western section. Here, the amount of annual precipitation at an altitude of 3000 m a.s.l. reaches 4000 mm. Precipitation gradually decreases from west to east, reaching about 1000 mm on the southern slopes of eastern Greater Caucasus. The northern slope is relatively more arid (dry) and cold than the southern one, resulting in ~500–1000 mm less annual precipitation and 1–2 °C lower summer temperatures [31,32]. The average regional lapse rate is minimum in winter (−2.3 °C per 1000 m) and maximum in summer (−5.2 °C per 1000 m) [33]. Overall, snow depth may reach 5–7 m in winter in several regions of the western part of the Greater Caucasus, such as the Upper Svaneti and northern Abkhazeti regions in Georgia [34].
Glacier decrease started from the last advances of the Little Ice Age (LIA) in the northern Greater Caucasus, dated approximatively to the late 1840s [35], though it may have been slightly earlier, in the 1810s, in the southern slopes [36]. The decrease rate was relatively small in centennial scale (~0.4% yr−1 in 1911–2014) [22,23,24], while this has increased since the 1960s (0.5% yr−1) [21] and reached its maximum rates over the past two decades (1.16% yr−1) [37].
About 13.4% of the surface area of Caucasus glaciers was covered by debris in 2014 [38]. Nowadays, there are more than 2200 glaciers in the Greater Caucasus, covering an area of about 1060 km2. The northern slopes of the mountain range contain more glaciers than the southern slopes. About 70% of the modern glaciated area is concentrated in the central section. Fourteen glaciers have an area > 10 km2 resulting in ~220 km2 or ~21% of the total glacier area in 2020. The Bezingi Glacier, with an area of ~39 km2, was the largest glacier mapped in the 2020 database [37].
3. Data and Methods
In this study, we used geodetic mass balance and ice thickness data from Hugonnet et al. (2021), [3] obtained from 30 m resolution Terra Advanced Spaceborne Thermal Emission and Reflection Radiometer (ASTER) Global Digital Elevation Model (GDEM) and ASTER L1A stereo images (each covering 60 km × 60 km) between 1 January 2000 and 31 December 2019 (downloaded from https://lpdaac.usgs.gov/products/ast_l1av003/) (Last access 13 December 2021). The specifically developed statistical methods are consistently described in Hugonnet et al. (2021) [3]. Outlines from the Caucasus glacier inventory from 2014 [21] were regarded as glacier boundaries in Hugonnet et al. (2021) [3]. These outlines for most glaciers in this area are identified according to the Landsat 8 Operational Land Imager (OLI) images and downloaded from the EarthExplorer website (http://earthexplorer.usgs.gov/) (Last access 13 December 2021).
The 5-year uncertainties by Hugonet et al., 2021 [3], at the 95% confidence level, were lower than 0.5 m yr−1 for glaciers larger than 1 km2 and conservative for smaller glaciers. They, thus, validated the reliability of improved uncertainty approaches for volume change estimation down to the scale of individual glaciers. A detailed description of uncertainty calculation is given in Huggonet et al., 2021 [3]. To check the accuracy of geodetic mass balance data by Hugonnet et al. (2021) [3] relative to the existing ground-based observation from the same period, we selected the Djankuat Glacier (Figure 2a) and extracted its glaciological mass balance data from the WGMS server [20]. For more comparison with other geodetic mass balance studies, we also selected the Kyukyurtyu, Ulluchiran, Karachaul, and Bolshoy Azau glaciers from the Elbrus Massif (Figure 2b), previously studied by Kutuzov et al. (2019) [27], based on two different DEMs from 1997 (aerial photography survey) and 2017 (Pléiades). We selected only these glaciers because they have almost similar internal boundaries in Hugonnet et al. (2021) [3] and Kutuzov et al. (2019) [27] and are comparable in terms of data analysis. The rest of the glaciers from Elbrus Massif were excluded for similar comparison due to the much different internal boundaries, although the entire Elbrus Massif was also selected as a single outline with only outer/external boundaries.
We used a debris-covered glacier dataset from Tielidze et al. (2020a) [38] to compare geodetic mass balance and thickness changes between debris-free and debris-covered glaciers. This dataset was compiled based on the Glacier Classification Guidance from the Global Land Ice Measurements from Space (GLIMS) initiative for remote-sensing observations [39]. According to this guideline, all glaciers with a debris coverage of more than 10% were considered to be debris-covered and otherwise to be debris-free glaciers. We selected 34 glaciers from this dataset with an area of >2.0 km2.
We also used the ASTER Global Digital Elevation Model (GDEM, 17 November 2011) version 3 to determine topographic details such as aspect, slope, and elevation distribution of glaciers. The DEM was downloaded from NASA LP DAAC Collections (http://earthexplorer.usgs.gov/) (Last access 13 December 2021).
Change in the mass (M) for all Caucasus glaciers over the last 20 years was calculated based on geodetic mass balance data by Hugonnet et al. (2021) [3] and the recently published Caucasus glacier inventory by Tielidze et al. (2021) [37] based on two different satellite sources from 2000 (Landsat) and 2020 (Sentinel).
This was calculated as follows:
where dm is the average surface balance (−0.53 m w.e. a−1) (meter water equivalent per year, no mentioned in the rest part of this paper) for the entire Caucasus in 2000–2019 by Hugonnet et al. (2021) [3]; ∆t is the duration of the observation period (20 years); S1 and S2 are the glacier areas at the beginning (1381.5 km2 in 2000) and at the end (1069.1 km2 in 2019/2020) of the observation period, according to Tielidze et al. (2021) [37].
M = dm • ∆t • (S1 + S2)/2
We converted an ice volume (km3) to a mass of ice (in Gt) by using the following equation:
Mass of ice (Gt) = Volume of ice (km3) × Density of ice (Gt/km3 or 850 ± 60 kg/m3)
Monthly climate data (temperature and precipitation) from two different meteorological stations were also used in this study. The Terskol station is located at an elevation of 2143 m a.s.l. on the Russian side of the Greater Caucasus, while the Mestia station is located at an elevation of 1441 m a.s.l. on the Georgian side (see location on Figure 1). Observations are available for the period of 2000–2018 for Terskol (temperatures and precipitation) and 2000–2015 for the Mestia station.
4. Results
4.1. Mass Balance and Thickness Change for the Entire Region
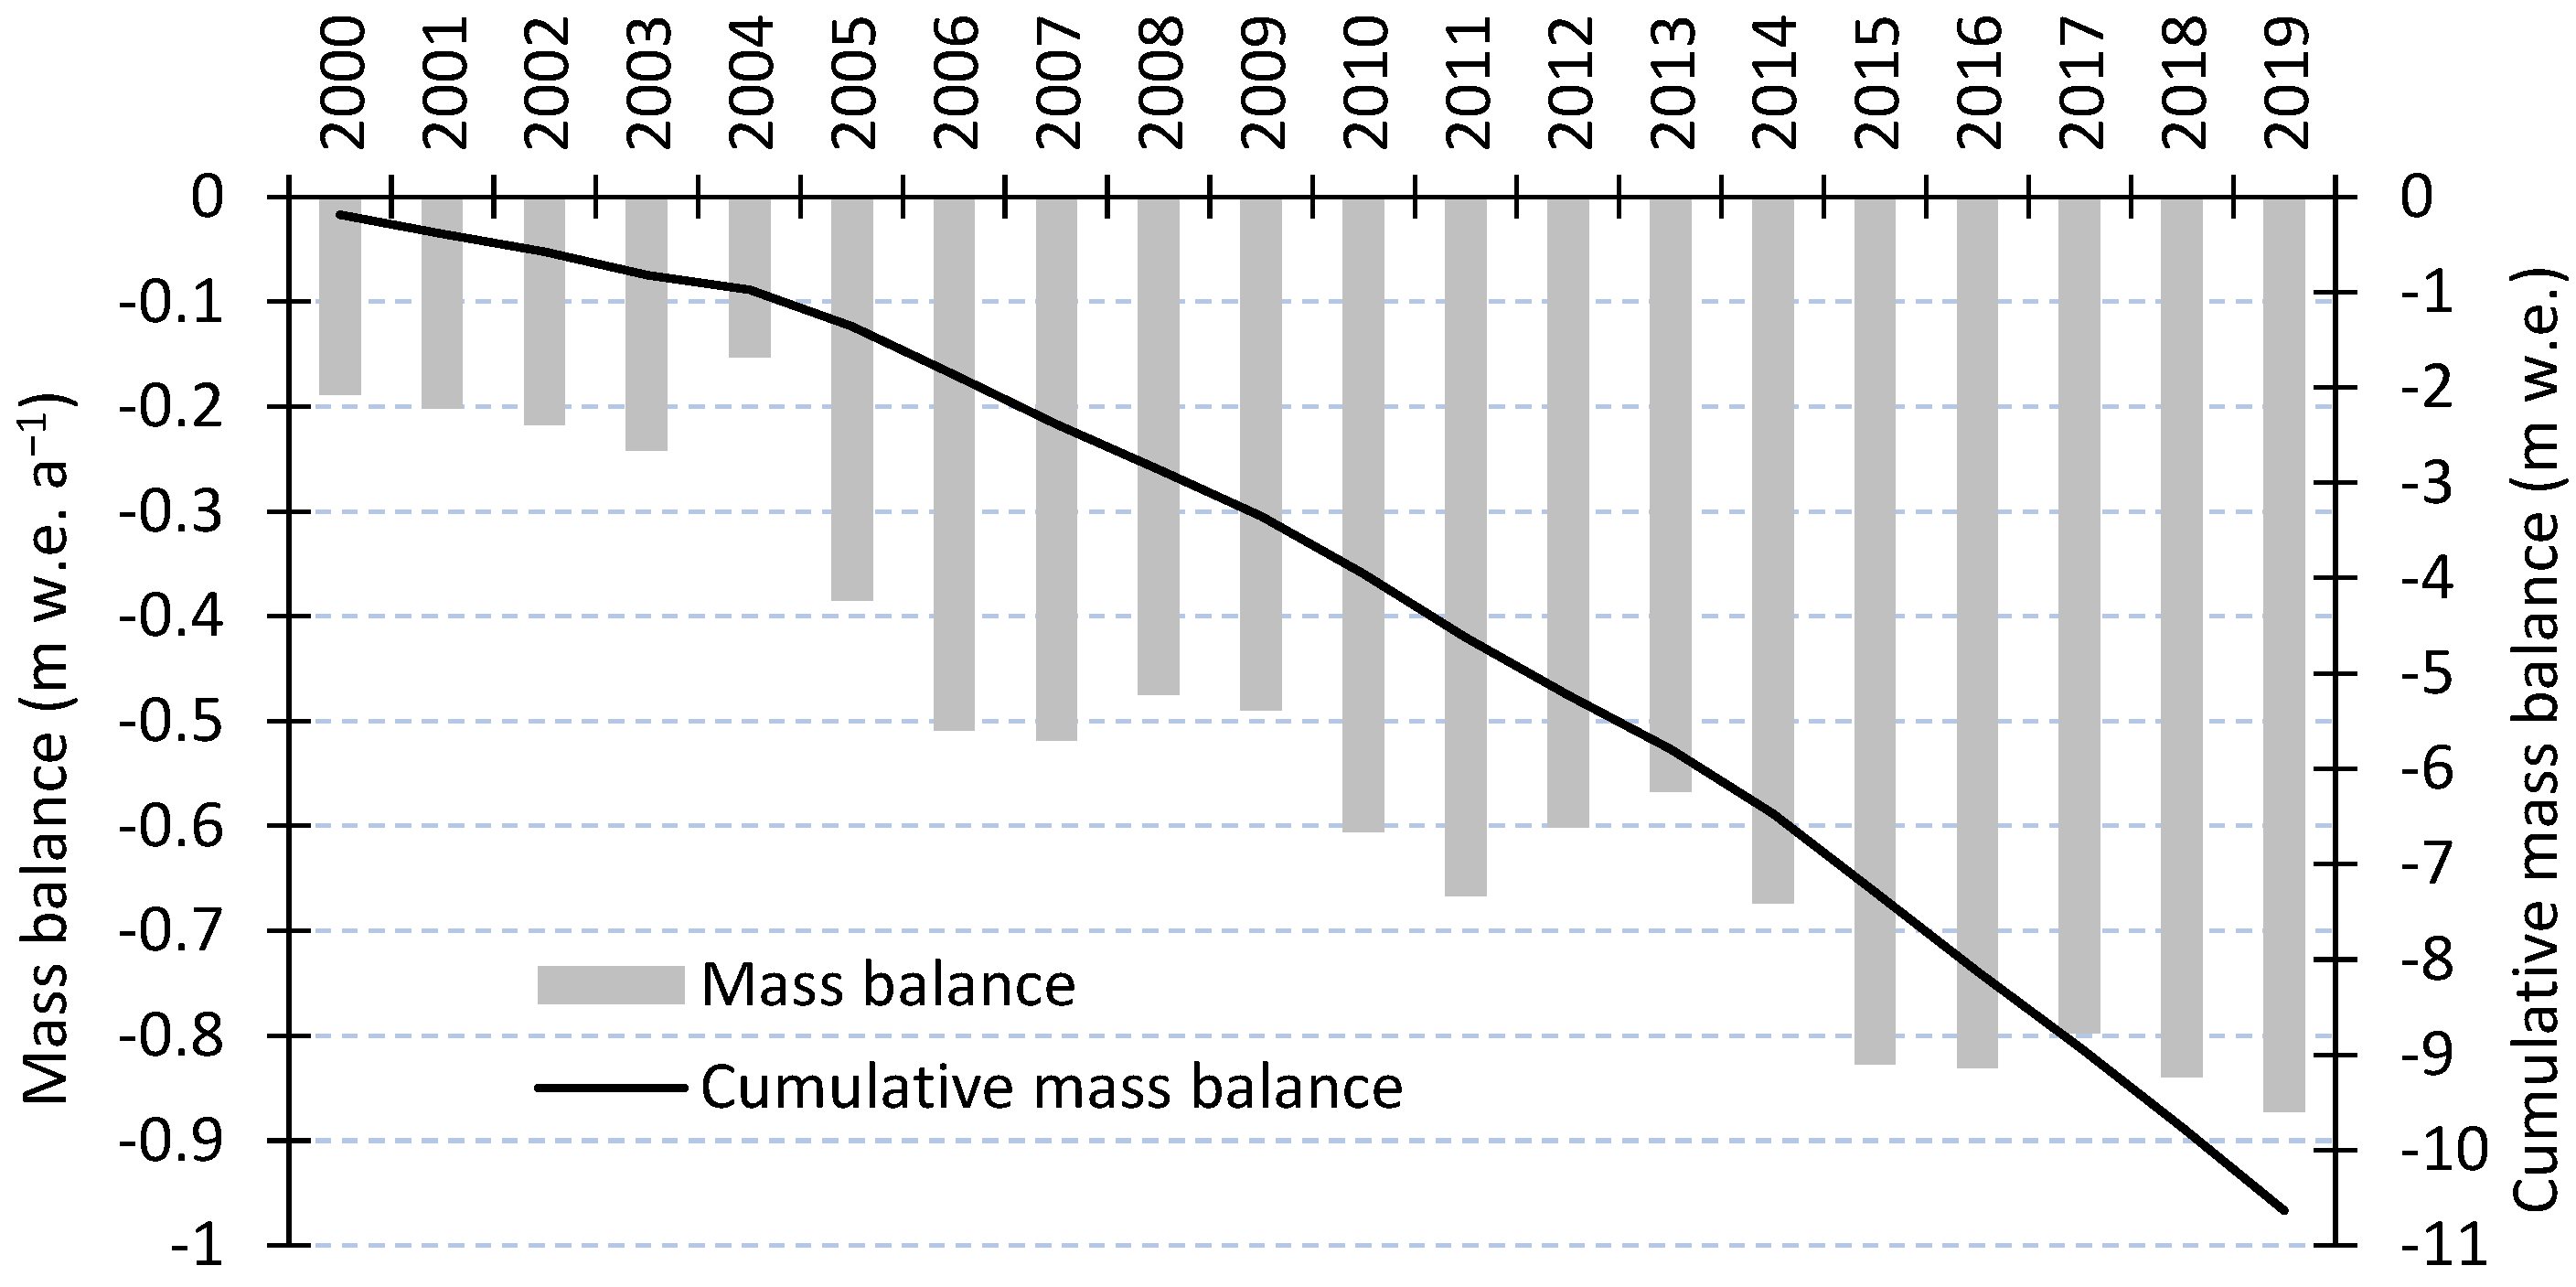
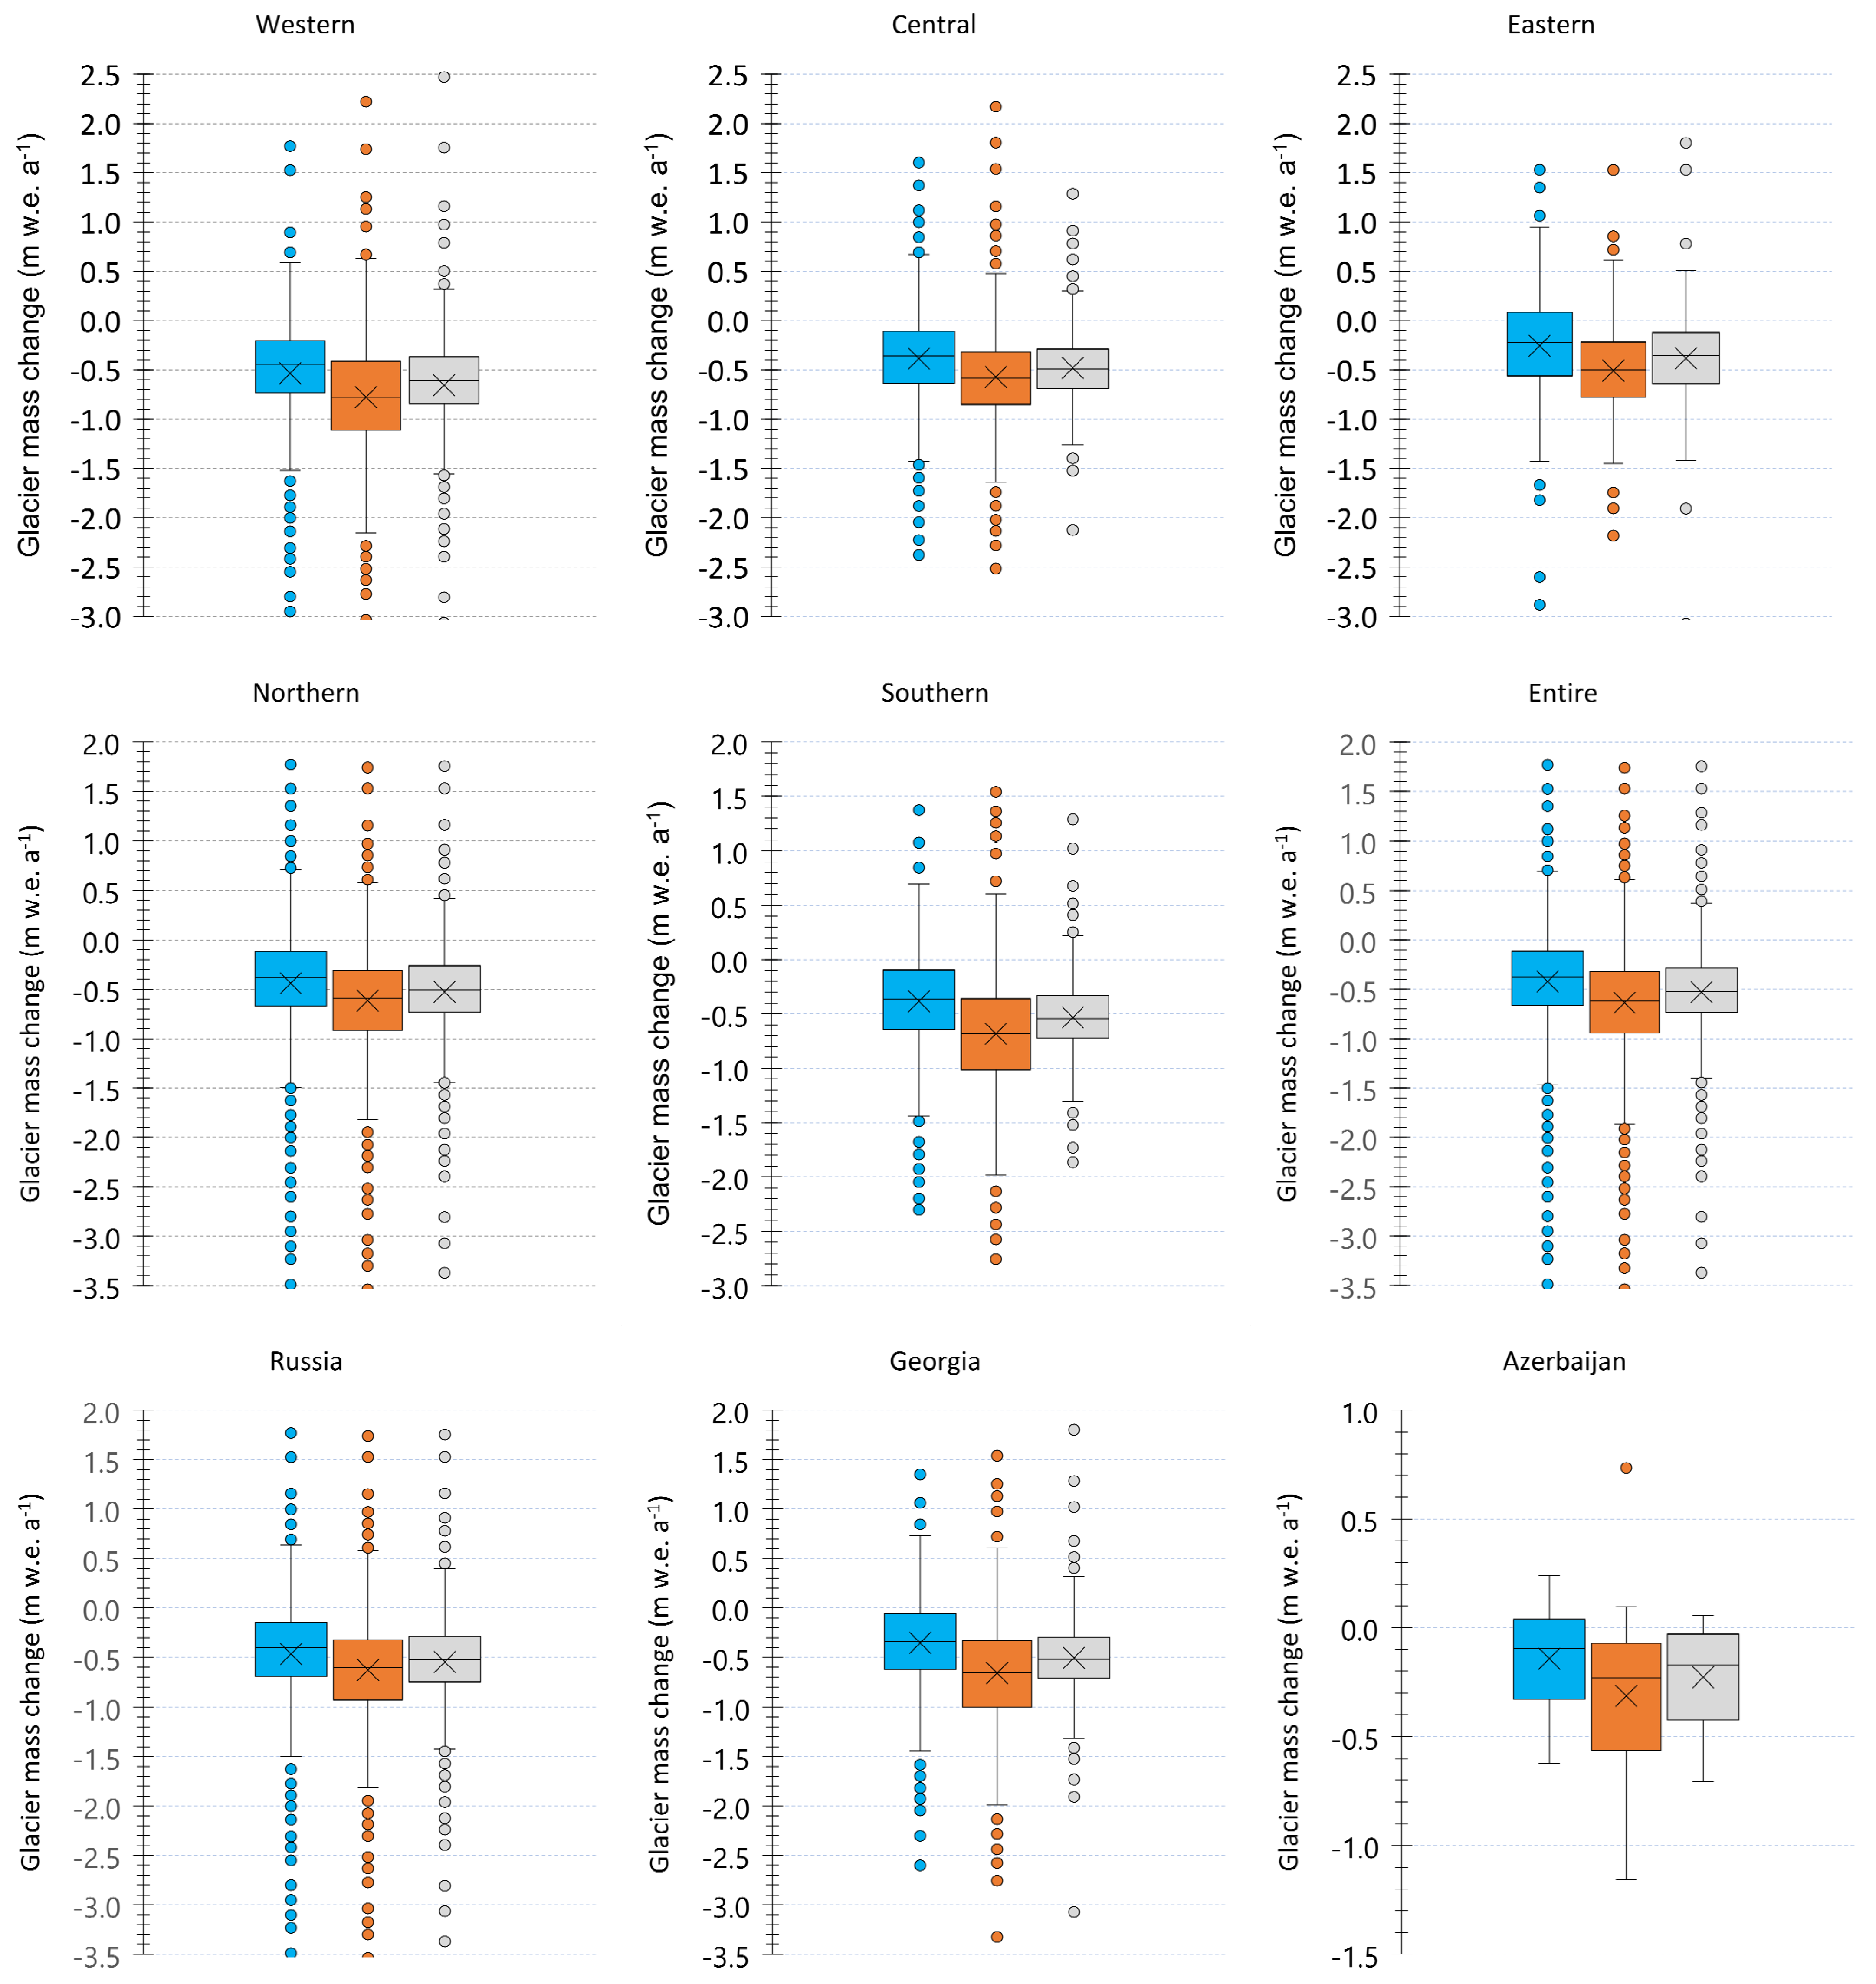
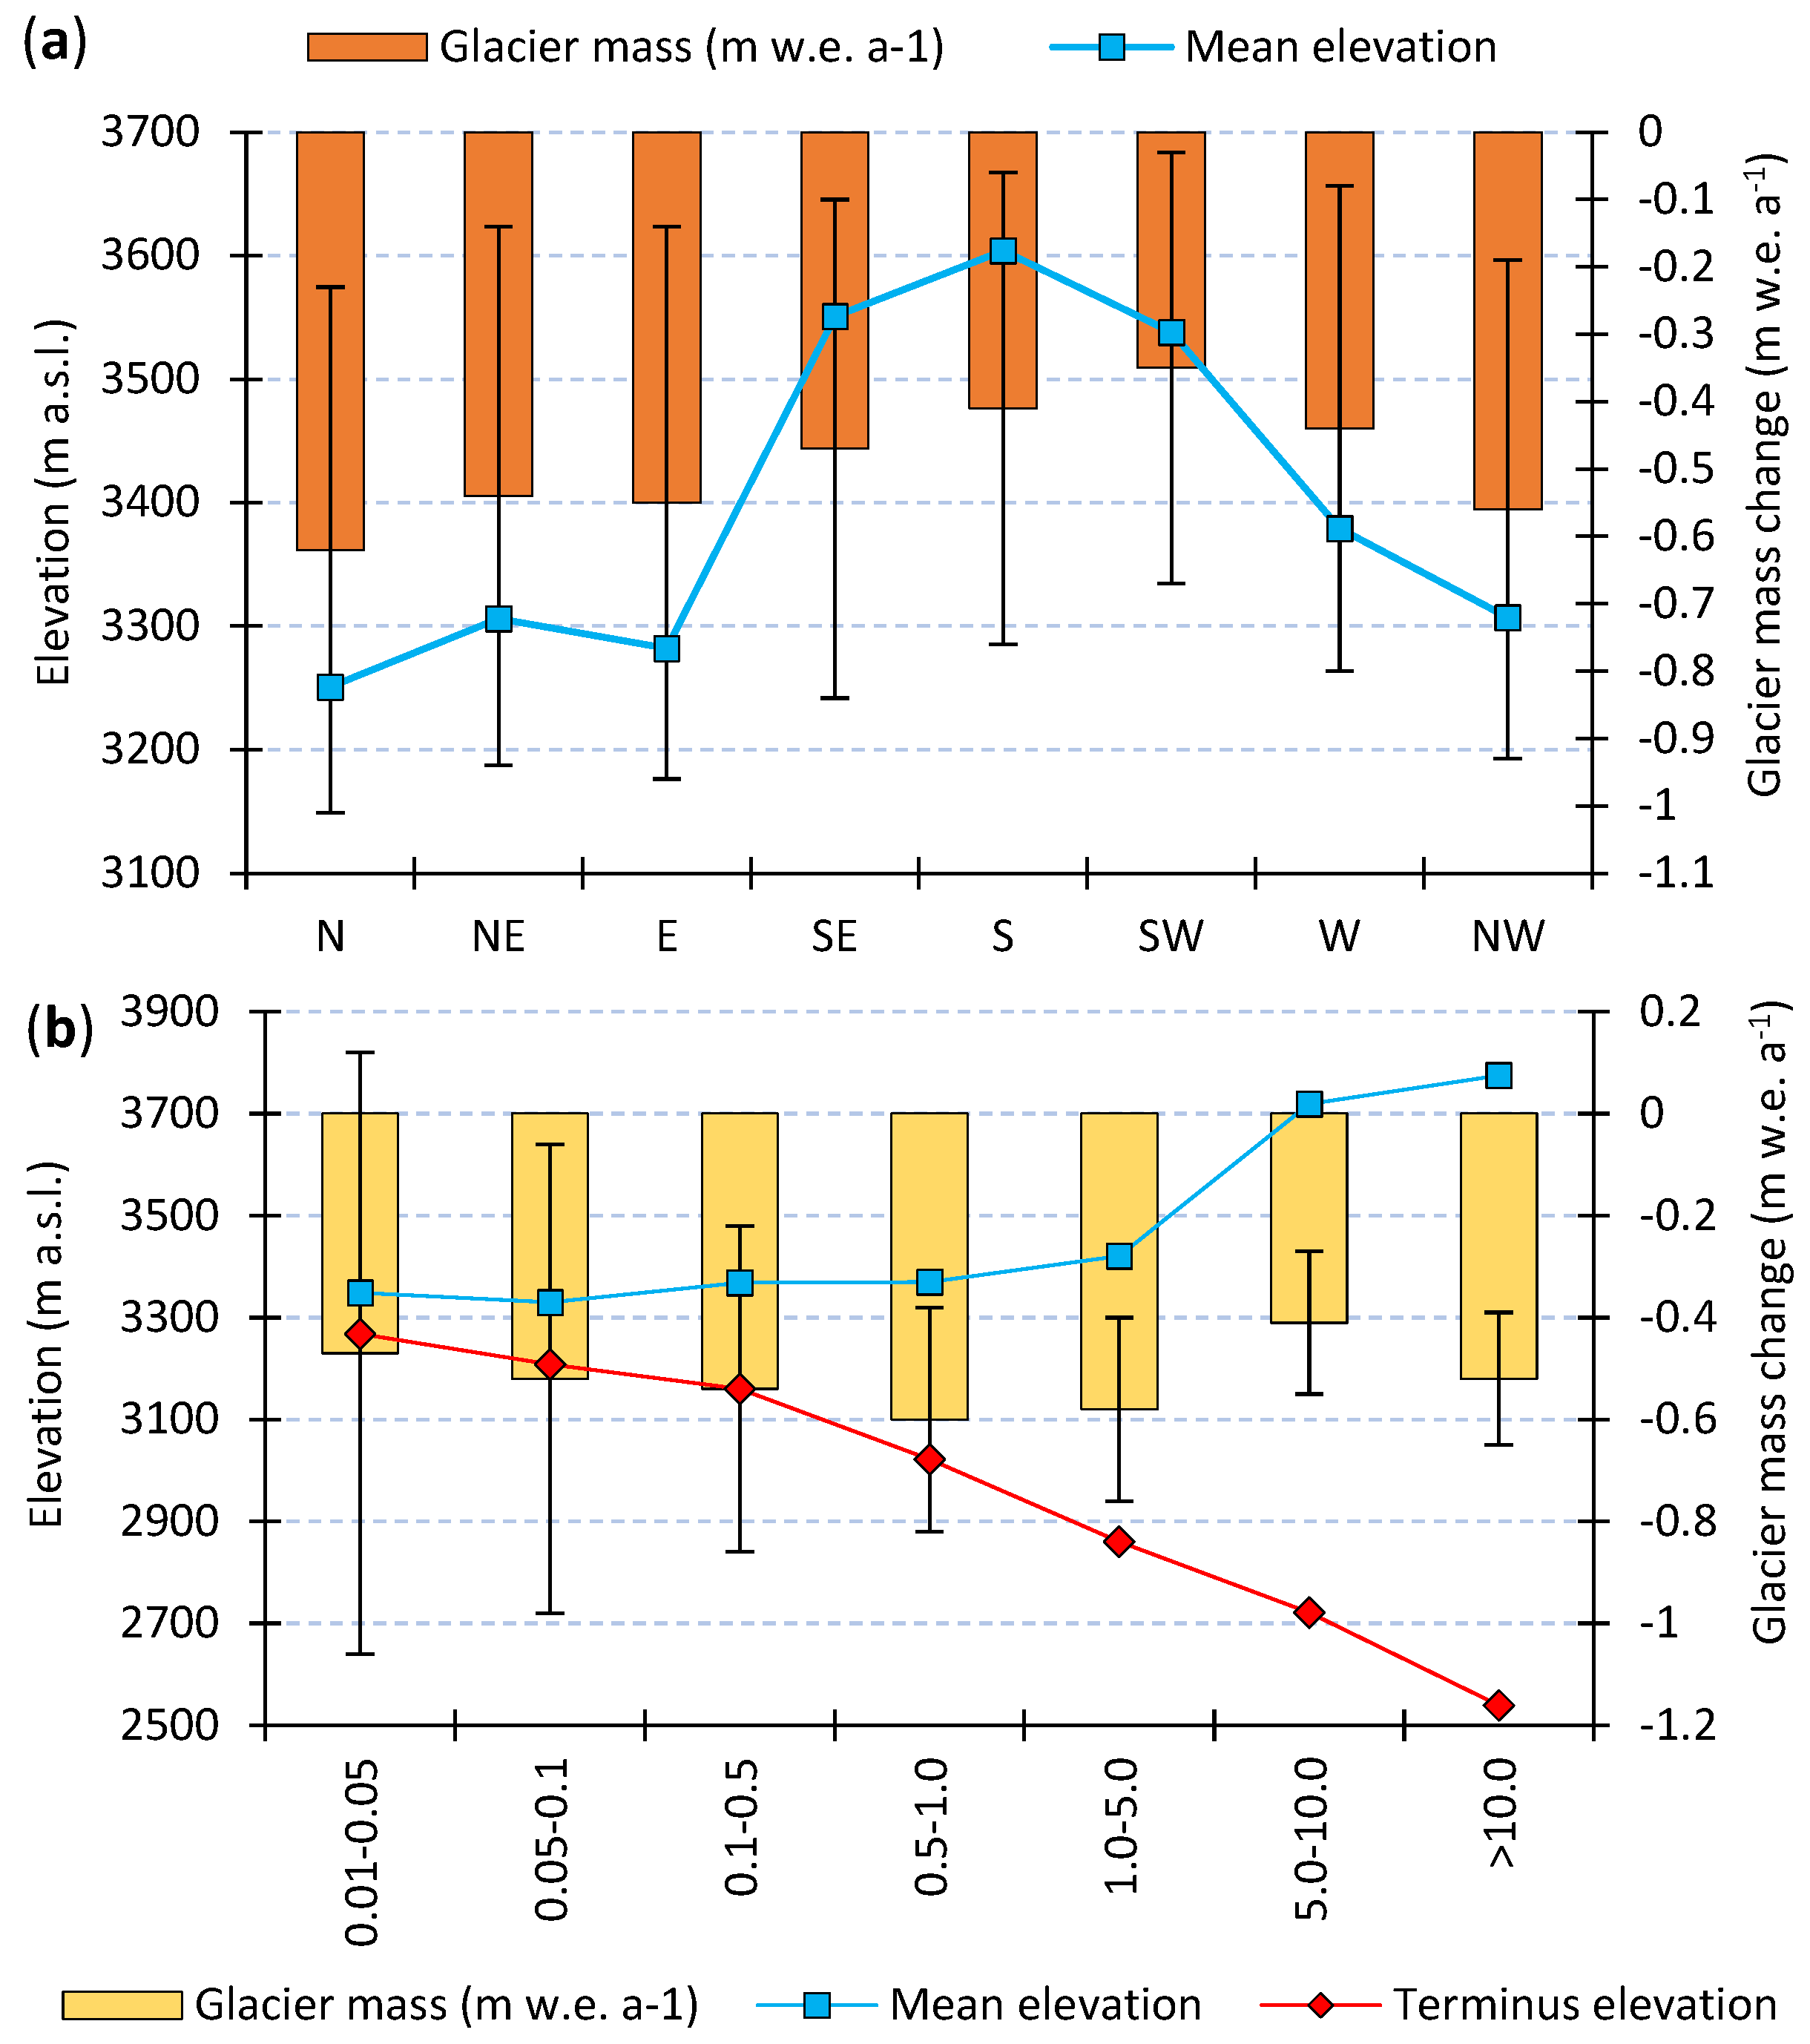
Changes in annual geodetic mass balance along with cumulative mass balance in the entire Greater Caucasus over the last twenty years are shown in Figure 3 (see also Table A1). We computed mean annual mass loss of 0.53 ± 0.38 m w.e. a−1 for all glaciers in the Greater Caucasus between 2000 and 2019 with a cumulative mass change of −10.07 ± 7.22 m w.e. Calculated decrease in the mass of all glaciers in the Greater Caucasus over the past 20 years amounted to the ~12.99 km3 or 11.04 ± 0.78 Gt water (~0.58 Gt per year). The mean annual geodetic mass balance between 2000 and 2010 was −0.42 ± 0.61 m w.e. a−1 for the entire mountain range, while it was −0.64 ± 0.66 m w.e. a−1 between 2010 and 2019 (Figure 4). The rates of mass loss vary between the western, central, and eastern Greater Caucasus. This was relatively higher in the western section with 0.65 ± 0.43 m w.e. a−1 in 2000–2019 (Figure 4 and Figure 5a) and much lower in the eastern section (0.38 ± 0.37 m w.e. a−1) (Figure 4 and Figure 5c). The colour-coded map in Figure 5 shows spatial distribution of changes of surface mass for both slopes of western, central, and eastern Greater Caucasus glaciers in 2000–2019. No difference was found between the northern and southern slopes over the study period (0.53 ± 0.38 m w.e. a−1 on both slopes). Mean annual mass balance on the glaciers of Russian Caucasus was slightly higher (−0.55 ± 0.39 m w.e. a−1) than those on the Georgian counterparts (−0.51 ± 0.36 m w.e. a−1). Glaciers in Azerbaijan experienced the lowest mass balance (−0.23 ± 0.29 m w.e. a−1) over the last twenty years (Figure 4, Table A2). Mean annual surface mass balance of the north-and north-west-oriented glaciers was more negative than those of the south and south-western-oriented glaciers (Figure 6a). Figure 6b shows the mean annual geodetic mass balance rates for glaciers of seven size classes of the entire mountain range between 2000 and 2019 relative to the mean and minimum (terminus) elevations, indicating that glaciers with a size class of 0.5–1.0 km2 experienced the highest mean annual mass loss (0.60 m w.e. a−1). The large size class of glaciers with an area of 5.0–10.0 km2 had the lowest annual mass loss (0.41 m w.e. a−1) during the investigated period. Changes of geodetic mass balance and thickness for individual glaciers larger than 2.0 km2 of the Greater Caucasus in 2000–2010, 2010–2019, and 2000–2019 are shown in Table A3.
Correlation between the thinning rates and mean elevation for all Caucasus glaciers in observed periods suggests that lower elevation glaciers experienced higher annual surface lowering, i.e., the thinning rate varied significantly at an altitudinal range (Figure A1). The rate of thickness changes varies between investigated periods. We observed 1.5 times more negative values of thickness changes in 2010–2019 (0.75 ± 0.70 m a−1) than in 2000–2010 (0.50 ± 0.67 m a−1) for the entire mountain region, suggesting an acceleration of ice thinning rates starting in 2010′s (Table A1; Figure A2). The most negative values of thickness changes were observed in Russian Caucasus (0.65 ± 0.38 m a−1) between 2000 and 2019, while the lowest thinning rate was observed in Azerbaijan (0.27 ± 0.31 m a−1). Georgian glaciers experienced thickness changes of −0.60 ± 0.36 m a−1 during the same time (Table A2; Figure A2). In terms of individual river basins, the most negative elevation and mass balance change were observed between 2000 and 2010 in Bolshaya Laba basin (north-west Greater Caucasus) with 1.57 ± 1.10 m a−1 and 1.34 ± 1.20 m w.e. a−1 loss respectively (27 glaciers with a total area of 4.4 ± 0.2 km2) (Table A1, Figure 1).
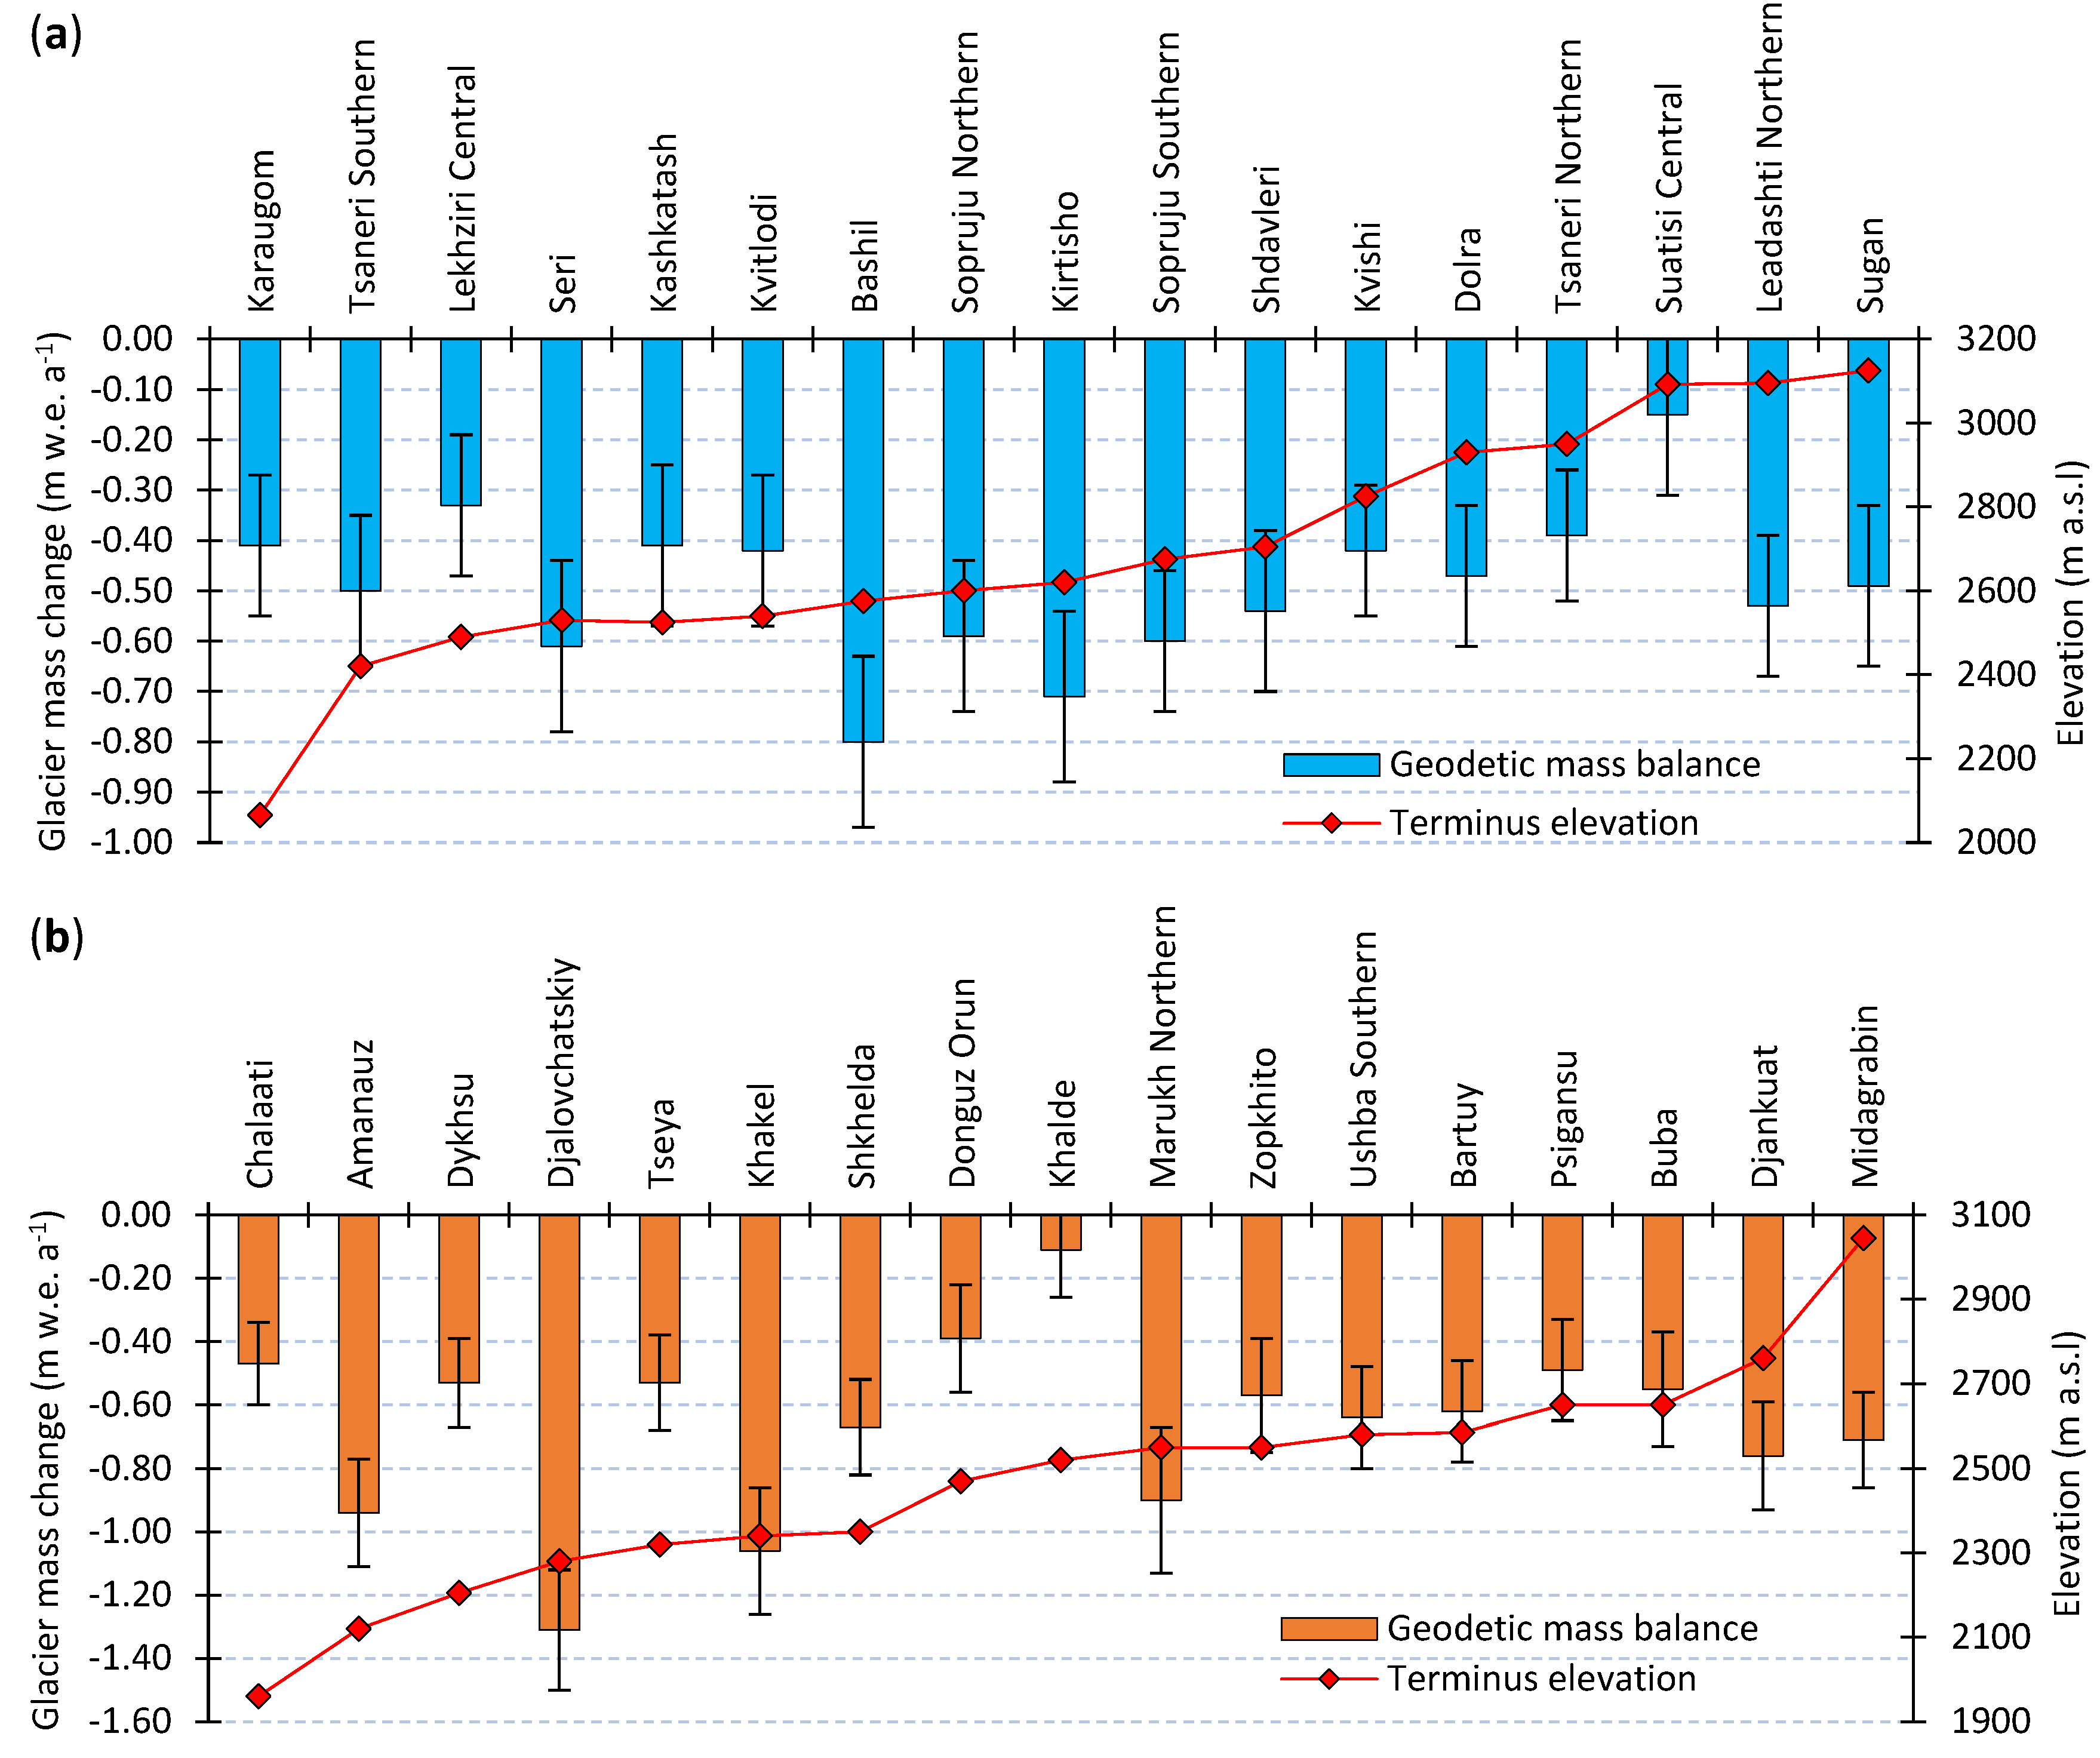
A comparison of 34 selected glaciers (>2.0 km2) shows that 17 debris-covered glaciers experienced higher mass loss (0.66 ± 0.17 m w.e. a−1) than other 17 debris-free glaciers (0.49 ± 0.15 m w.e. a−1) (Figure 7). An average terminus elevation for all debris-covered glaciers was 2466 m a.s.l., while it was 2661 m a.s.l. for debris-free glaciers.
4.2. Comparison with Previous Observations
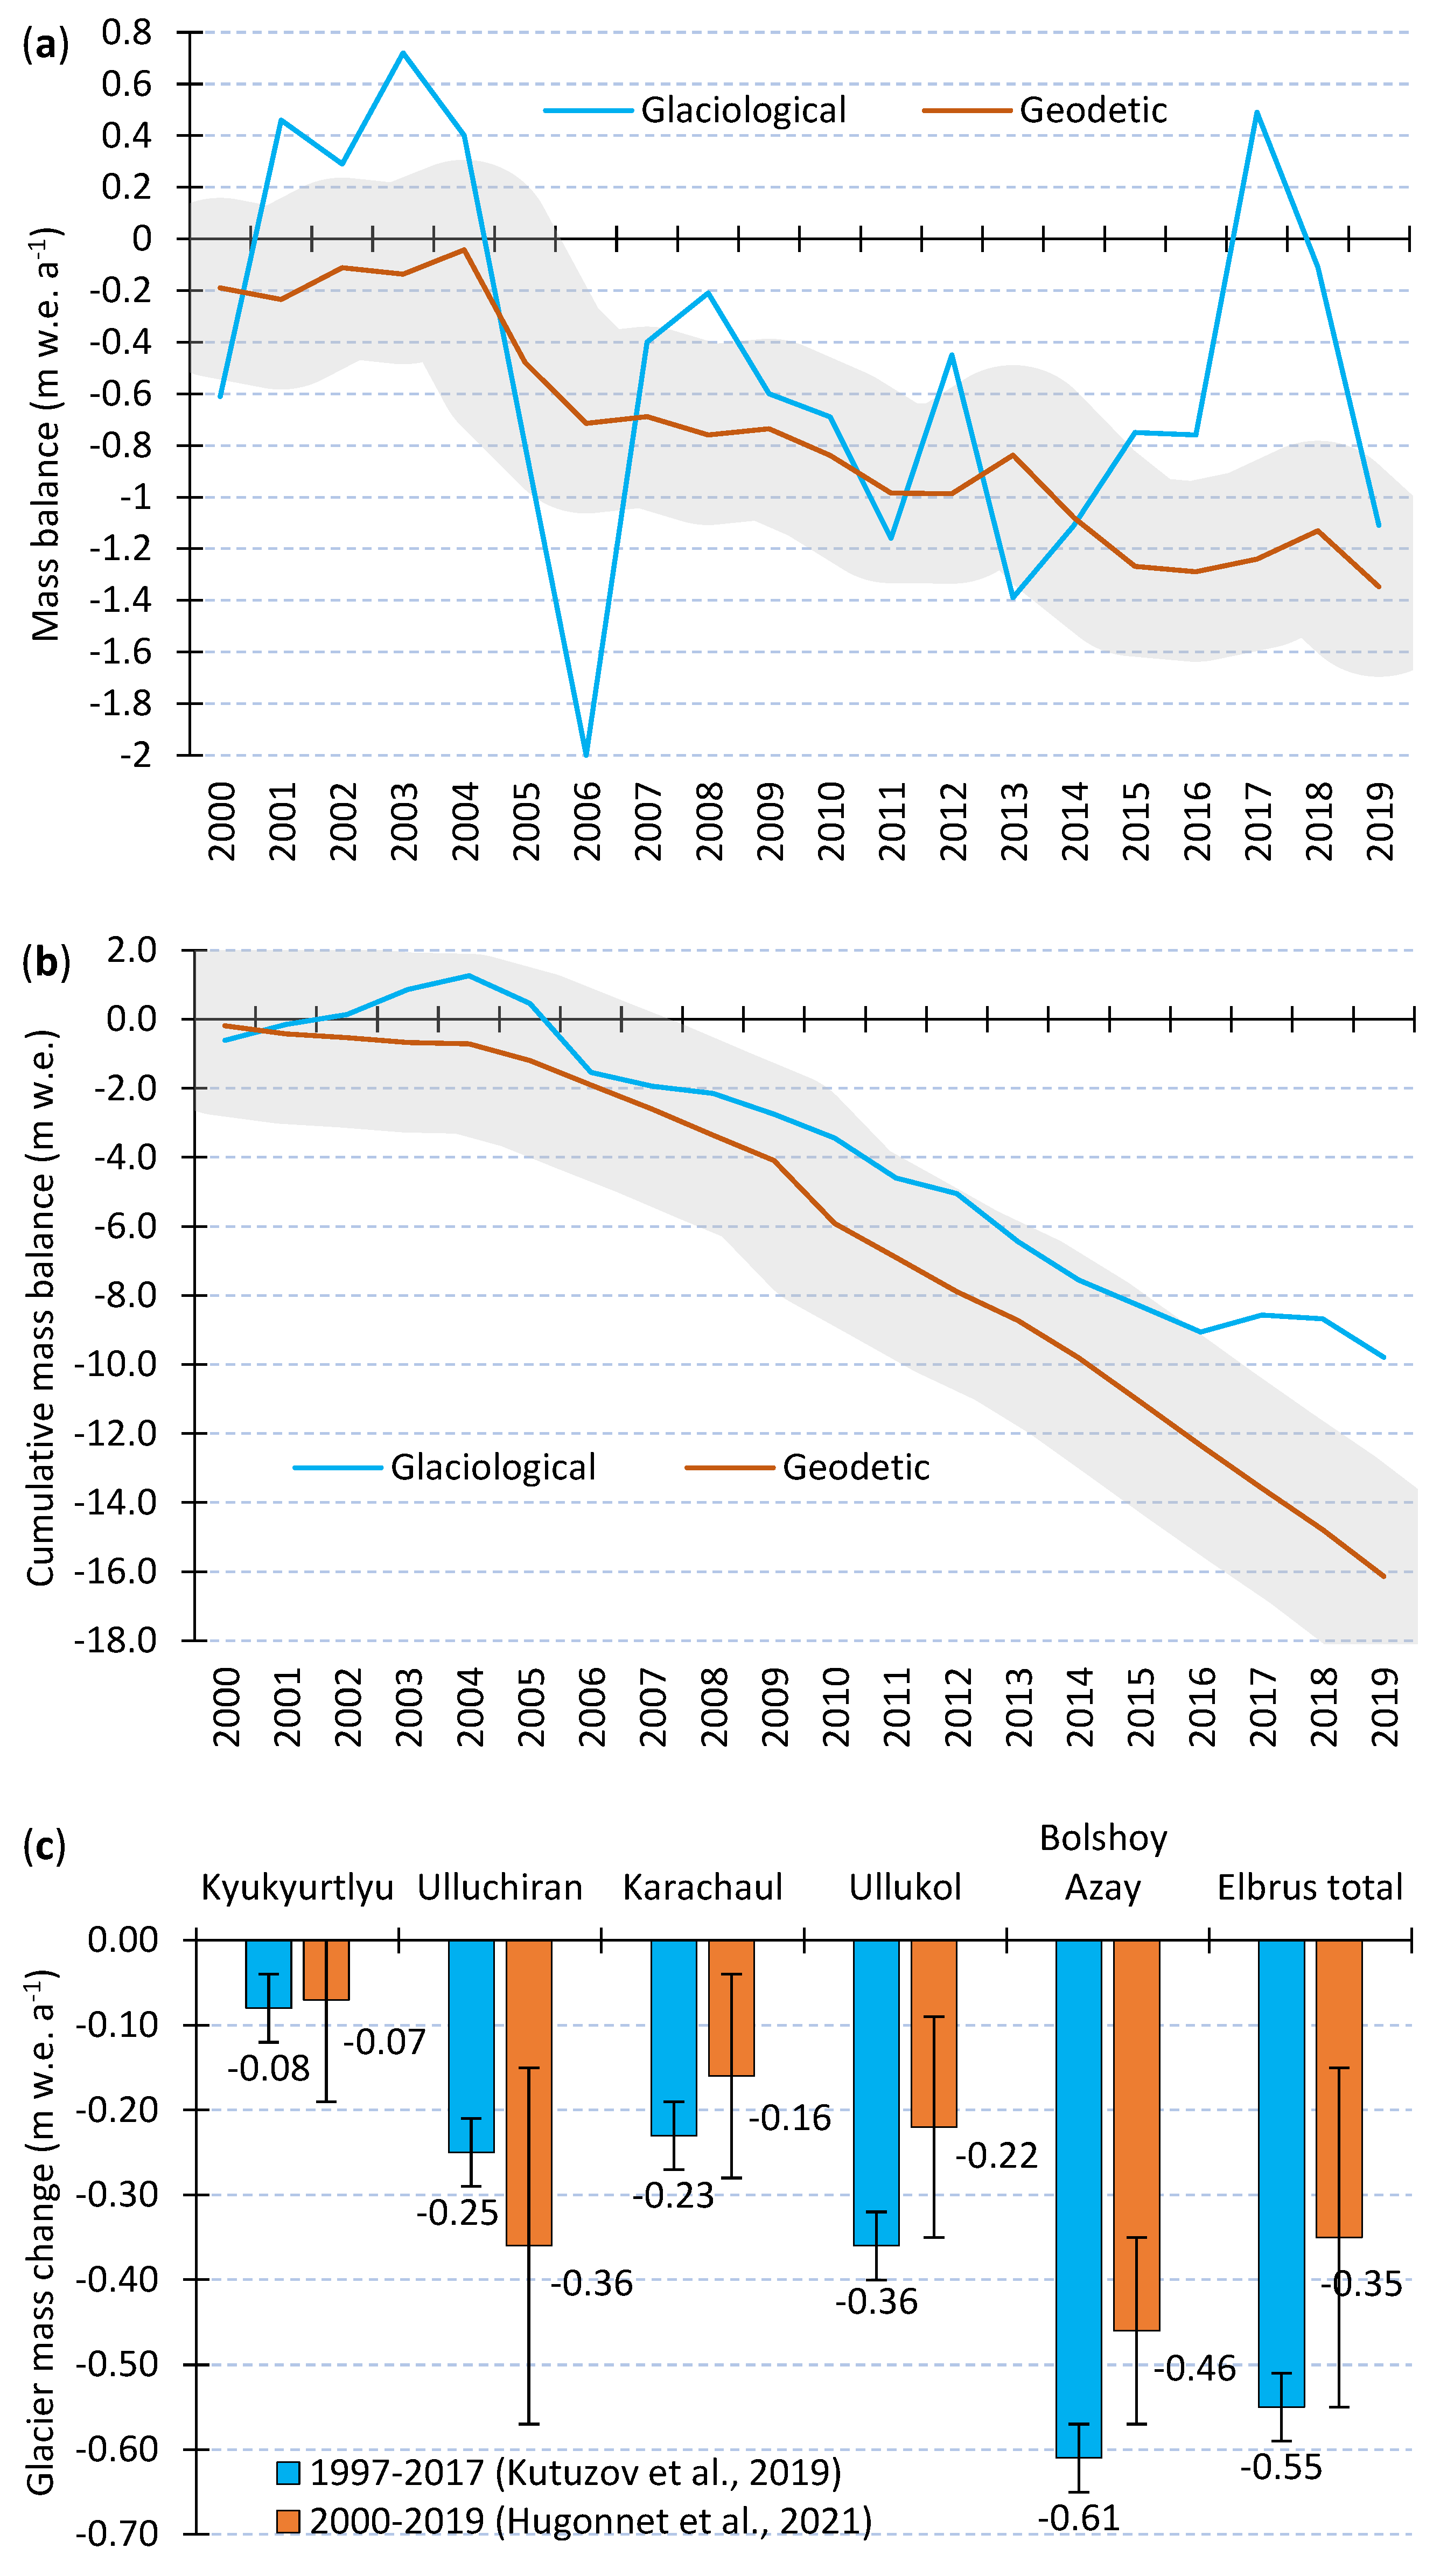
Comparison with glaciological measurements from Djankuat Glacier [20] shows that values by Hugonnet et al. (2021) [3] from the period of 2007–2015 match within the uncertainty, while the rates from the other periods (2001, 2003, 2006, and 2017) show different changes (Figure 8a). In a total of twenty years, the mean (relative) difference between both methods is 55 ± 35% with a p-value of 0.172 and a standard deviation of 0.14 (Figure 8b).
The geodetic mass balance data from selected glaciers (Kyukyurtyu, Ulluchiran, Karachaul, and Bolshoy Azau) from the Elbrus Massif in 2000–2019 by Hugonnet et al. (2021) [3] agree with those from geodetic measurements in 1997–2017 by Kutuzov et al. (2019) [27] (Figure 8c). In most cases, values by Hugonnet et al. (2021) [3] are slightly lower (except the Ulluchiran Glacier) than those from Kutuzov et al. (2019) [27]; however, values from selected glaciers match within the uncertainty. Overall, the annual geodetic mass balance between 2000 and 2019 was −0.35 ± 0.20 m w.e. a−1 for the entire Elbrus Massif according to Hugonnet et al. (2021) [3], while it was −0.55 ± 0.04 m w.e. a−1 between 1997 and 2017 according to Kutuzov et al. (2019) [27]. Over the last two decades, the mean (relative) difference between both methods is 57 ± 56% with a standard deviation of 0.10.
4.3. Temperature and Precipitation Change
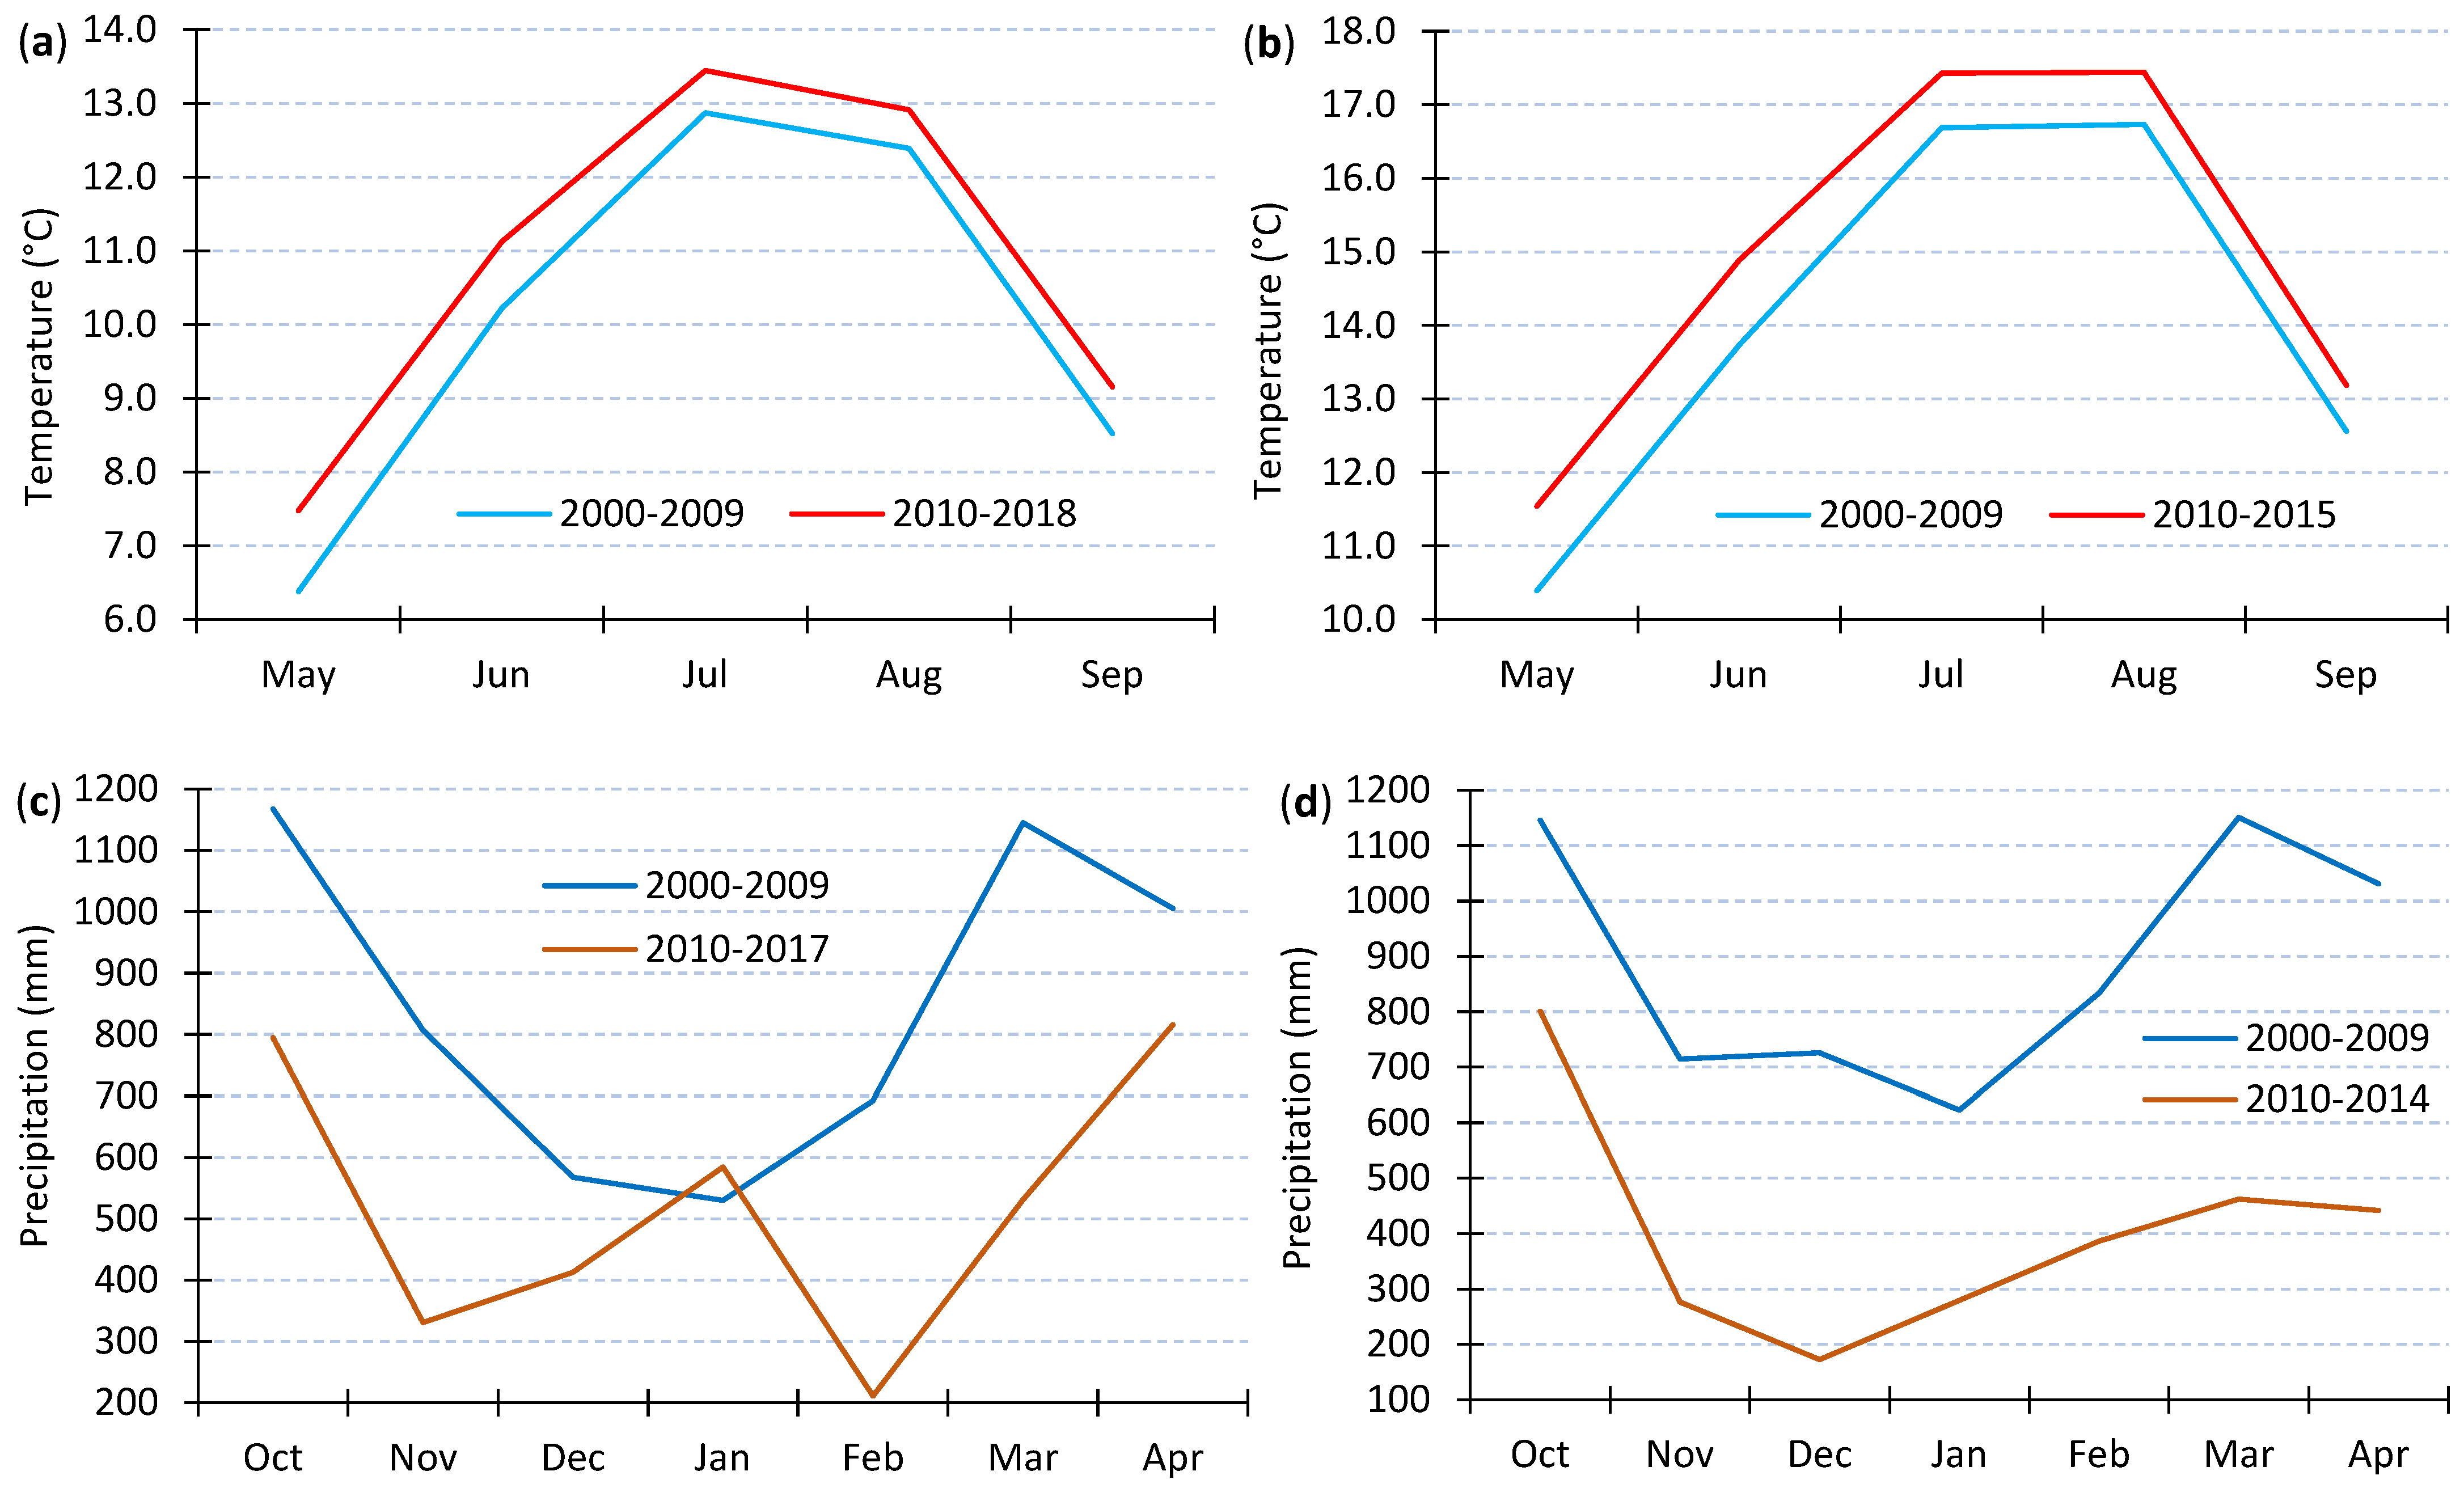
Mean annual May-September air temperatures at the Terskol weather station show a significant positive trend in the years 2000–2018, rising by 0.7 °C from 2000–2009 (10.1 °C) to 2010–2018 (10.8 °C) (Figure 9a). The warming trend is also positive for the Mestia weather station, rising by 0.9 °C from 2000–2009 (14.0 °C) to 2010–2015 (14.9 °C). A significant negative trend is seen in the October-April monthly precipitation data for the Terskol station in the years 2000–2017, decreasing by 132 mm from 2000–2009 (592 mm) to 2010–2017 (460 mm). This was also negative for the Mestia station, decreasing by 58 mm from 2000–2009 (622 mm) to 2010–2014 (564 mm) (Figure 9b).
5. Discussion
Results obtained from Hugonnet et al. (2021) [3] show that negative values of geodetic mass balance dominated between 2000 and 2019, but with positive values in some river basins and individual glaciers in 2000–2010 (Table A1). There was a negative and accelerated trend in the second investigated period (2010–2019) for almost all individual glaciers, with very few exceptions (e.g., Adishi, Khalde, and Kolka glaciers) (Table A3).
Overall, observed mass loss and thickness lowering of all Caucasus glaciers with increased values since 2010 are in good agreement with recent findings of the latest glacier inventory from this region, resulting in accelerated glacier area loss over the past two decades (1.16% yr−1), especially since 2014 (1.85% yr−1) [37].
5.1. Causes of Regional Change
The decrease of surface mass balance of glaciers on different sections of the Greater Caucasus was not homogenous. The highest mean annual mass loss between 2000 and 2019 was observed in the western Greater Caucasus, while this was relatively low in the central and eastern sections. The highest mass loss in the western section can be explained by low hypsometry corresponding the lowermost mean elevation of the glaciers. A comparison of decrease rates relative to the glacier mean elevation clearly shows this linkage (Figure 10). Furthermore, western Greater Caucasus experienced the highest increase of supra-glacial debris-covered area over the past several decades [38]. This part of the region is also characterized by the highest glacier retreat after the eastern Greater Caucasus [37]. It is, therefore, possible that glaciers are also rapidly thinning, favouring debris-covered area over the ablation area [40,41].
Similar decrease rates between the northern and southern slopes over the study period (0.53 ± 0.38 m w.e. a−1 on both slopes) may be due to the influence of the eastern Greater Caucasus. Glaciers on the eastern Greater Caucasus only exist on the northern slopes (i.e., glaciers do not exist on the southern slopes), where we observed the lowest mass loss. This may offset (reduce) the overall regional mass balance decrease rates of the glaciers from the northern Greater Caucasus relative to their southern counterparts.
The fact that mean annual mass balance on the glaciers of the Russian Caucasus was slightly higher (−0.55 ± 0.39 m w.e. a−1) than those on the Georgian counterparts (−0.51 ± 0.36 m w.e. a−1) can be explained by more favorable conditions of Georgian glaciers due to the prevailing southwestern transport of precipitation [32]. Moreover, glaciers situated in the western-central section of the Georgian Caucasus exist in high cirques with a much steeper surface. Glaciers in the western-central section of the Russian side are, on average, less steep than on the Georgian side, mainly because most valley glacier tongues in Russia are longer and reach lower altitudes than the Georgian glaciers [38], causing more ice melt on large glacier tongues on the Russian side.
5.2. Glacier Mass Change Relative to Aspect and Size Class
Glacier mass loss was in a linear relationship between aspect and mean elevation (Figure 6a), but in a non-linear relationship between size class and mean elevation. For example, glaciers with a size class of 0.5–1.0 and 1.0–5.0 km2 experienced the highest mean annual mass loss; however they did not experience the lowest mean elevation (Figure 6b). A more linear relationship was found between size class and terminus elevation. For example, glaciers with the same size class (0.5–1.0 and 1.0–5.0 km2) had lower terminus elevation than the rest of the glaciers with a size class of <0.5 km2. The lowest terminus elevation, but not the highest mass loss, with all glaciers > 5 km2 can be explained due to the large accumulation areas situated in high altitudes of large glaciers (e.g., Elbrus, Bezingi, Dykhsu, Karaugom, etc.). Hence, the mass loss for large glaciers occurred at the expense of glacier tongues; meanwhile, the majority of regional mass loss occurred at the expense of relatively small (<5.0 km2) glaciers.
5.3. Debris-Covered and Debris-Free Glaciers
A comparison of geodetic mass balance change for debris-covered and debris-free glaciers during the investigated period showed that mean annual mass balance decrease rates are higher for debris-covered glaciers (Figure 7, Table A3). Although the debris-covered glaciers, in general, present negative rates, the supraglacial debris clearly reduces the thinning compared with debris-free surfaces at the same elevation [42]. However, it is likely that altitudinal difference between those two types of glaciers can change this assumption and play a significant role in glacier thinning. For example, an average terminus elevation for the investigated debris-covered glaciers was ~200 m lower (2466 m a.s.l.) than those for the debris-free glaciers (2661 m a.s.l.), suggesting relatively warm temperatures for debris-covered glaciers based on the average regional lapse rate in summer (−0.52 °C per 100 m) [33]. Supra-glacial debris thickness can also play a key role in changes of mass balance for individual glaciers. This is broadly confirmed that supra-glacial debris cover affects surface melt with increasing ablation in cases of thin debris cover (less than a few cm) or decreasing ablation under continuous thick debris cover [43,44,45]. It is also possible that ice cliffs and supra-glacial ponds play a key role by enhancing the total ablation of debris-covered glaciers in the Greater Caucasus. Ice cliffs have been identified as an important contribution to the ablation of debris-covered glaciers, even when their spatial extent is very small [46]. This phenomenon was studied by terrestrial photogrammetry and unmanned air vehicle (UAV) surveys confirming that ice cliffs have a net ablation rate about 3 times higher than the average glacier tongue surface [42]. We note that further studies with high-resolution imagery (e.g., UAV, LiDAR) are required to understand the influence of ice cliffs in the mass balance for individual debris-covered glaciers, or at the basin and region scale in the Greater Caucasus.
5.4. Difference between the Global and Local Studies
The difference between Hugonnet et al. (2021) [3] and Kutuzov et al. (2019) [27] from Elbrus glaciers may be due to the high-resolution DEMs used by Kutuzov (2019) [27] and the internal boundaries of the selected glaciers, which were very similar, but not the same. In addition, the study by Hugonnet et al. (2021) [3] covers 2000–2019, which is slightly different (1997–2017) than in Kutuzov et al. (2019) [27]. Overall, the difference between those measurements match within the uncertainties, while the difference in geodetic mass balance from Hugonnet et al. (2021) [3] and glaciological mass balance from ground-based measurement [20] of the Djankuat Glacier was relatively high. This can be due to the much higher accuracy of ground-based measurement [47] or lower accuracy of geodetic measurement [3]. However, the results from those two measurements match within the uncertainties and tightly match the first time-period (2000–2010), suggesting that they are comparable in terms of long-time measurement.
5.5. Glacier Mass Balance Relative to Local Climate Change
Glacier mass balance in the Greater Caucasus is very sensitive to summer temperatures and winter precipitation [47]. Accelerated mass balance decrease from the second investigated periods (2010–2019) may be explained by a sustained increase in summer temperatures and a decrease in winter precipitation associated with regional global warming. The average summer temperature in the mountainous region of the Greater Caucasus has increased by 0.5–0.7 °C over the past 30 years [48], which was also confirmed from our observation from Terskol and Mestia meteorological stations (Table 1 and Table 2; Figure 11). In parallel of the increased summer temperatures, extension of melting period was observed in the northern Greater Caucasus. For example, melting on the Garabashi Glacier at the snowline altitude (3800–4000 m a.s.l.) ended up 2–3 weeks later (in early October) over the recent years [17]. Furthermore, the extension of ablation season over the last two decades was also confirmed by instrumental measurement from the southern Greater Caucasus (Zopkhito and Chalaati glaciers) (Figure 7 in [19]).
The increased incoming shortwave radiation, observed since the 1980s (10 W/m2 over 10 years), may also play a triggering role in the accelerated mass loss of the Caucasus glaciers over the past several decades. It has been proposed that this trend is associated with a weakening of the processes of formation of high and low clouds, which is due to an increase in the frequency of anticyclones in the warm season [49].
Snow-ice-covered areas of the Greater Caucasus are subject to dust outbreak events originating from desert regions able to significantly decrease snow albedo. Several dust depositions events that originated from the Sahara between the 2009–2012 and 2018 period were observed in this region [50,51]. Dust events systematically shortened the snow cover duration, especially in the western Greater Caucasus. The shortening was higher for locations with higher accumulation and higher elevation [51] considering one of the significant indicators for glacier thinning in this region.
The decrease in albedo, along with increased temperatures over the ablation period causes up-glacier migration of the snowline. This has a strong impact on small glaciers that have practically lost their firn reserves over the past two decades. Consequently, the firn can no longer protect the ice, and the process of ice melting becomes even more intense due to the lower albedo (Figure 12).
6. Conclusions
In this study, we used glacier mass balance and thickness data obtained from geodetic method by Hugonnet et al. (2021) [3] to clarify the response of region-wide glacier mass balance to climate change in the Greater Caucasus over the last two decades (2000–2019). We also analyzed the long-term spatio-temporal glacier surface elevation and mass change for the regional, river basin, and individual glaciers. Besides, we provided a key dataset (see Supplement) that can be useful for further studies, including, for example, hydrological modeling of runoff changes, as well as for the implementation of water management plans in this region. The main limitation of this study is related to the resolution of the data. This generally affects small glaciers more than larger complexes. Applying relatively high uncertainties was a conservative solution to this issue. This can be improved by using the high-resolution stereo imagery and continuous ground-based investigation in the future. However, the estimates of Djankuat and Elbrus glaciers from this dataset agree with glaciological and geodetic mass balance measurements from previous studies.
The main results indicated a mean regional glacier mass balance change of −0.53 ± 0.38 m w.e. a−1 in 2000–2019 with an equivalent cumulative mass change of −10.07 ± 7.22 m w.e. Calculated loss in the mass of all glaciers in the Greater Caucasus over the past 20 years amounted to the ~12.99 km3 or 11.04 ± 0.78 Gt water. Strong acceleration in mass loss and the thinning rates were observed since 2010, which likely occurred due to an increase in summer temperatures, accompanied by a reduction in winter precipitation.
The highest mass loss in the western Greater Caucasus was due to the lowest mean elevation of glaciers. We also hypothesized that the deposition events that originated from the Sahara between the 2009–2012 and 2018 periods may have increased glacier melting in the western section.
Lower terminus elevation in debris-covered glaciers indicated a strong decrease of surface mass balance relative to the high-terminated debris-free glaciers. Debris thickness, ice cliffs, and supraglacial ponds may also play a key role in enhancing the total ablation of debris-covered glaciers in the Greater Caucasus.
Author Contributions
Conceptualization, L.G.T. and V.J.; methodology, L.G.T. and G.A.N.; software, L.G.T.; validation, L.G.T., V.J. and G.A.N.; formal analysis, L.G.T., V.J. and G.A.N.; investigation, L.G.T., V.J. and G.A.N.; writing—original draft preparation, L.G.T.; review and editing, L.G.T., V.J. and G.A.N.; visualization, L.G.T., V.J. and G.A.N.; funding acquisition, V.J. All authors have read and agreed to the published version of the manuscript.
Funding
This research was funded by the French-Russian-Georgian collaborative project “DEGLaciation dans le grAnd Caucase—DEGLAC” (IRP 00008 Deglac).
Institutional Review Board Statement
Not applicable.
Informed Consent Statement
Not applicable.
Data Availability Statement
The data presented in this study are openly available in Zenodo https://doi.org/10.5281/zenodo.5816997 (Last access 2 February 2022).
Acknowledgments
We gratefully acknowledge the support of the two anonymous reviewers for useful suggestions and detailed comments which clearly enhanced the quality of the paper.
Conflicts of Interest
The authors declare no conflict of interest. The funders had no role in the design of the study; in the collection, analyses, or interpretation of data; in the writing of the manuscript, or in the decision to publish the results.
Appendix A

Table A1.
Change in glacier thickness (m a−1) and surface mass balance (m w.e. a−1) for individual river basins of the Greater Caucasus in 2000–2010, 2010–2019, and 2000–2019. See also Figure 1 to check the location of all river basins relative to the Greater Caucasus.
Table A1.
Change in glacier thickness (m a−1) and surface mass balance (m w.e. a−1) for individual river basins of the Greater Caucasus in 2000–2010, 2010–2019, and 2000–2019. See also Figure 1 to check the location of all river basins relative to the Greater Caucasus.
| Main River Basin | Tributary River Basin | Based on Landsat 2014 (Tielidze and Wheate, 2018) [21] | Change of Glacier Thickness (m a−1) Hugonnet et al. (2021) [3] | Change in Glacier Surface Mass Balance (m w.e. a−1) Hugonnet et al. (2021) [3] | |||||
|---|---|---|---|---|---|---|---|---|---|
| Number | Area km2 | 2000–2010 | 2010–2019 | 2000–2019 | 2000–2010 | 2010–2019 | 2000–2019 | ||
| Mzimta | 10 | 1.9 ± 0.2 | −0.43 ± 0.88 | −1.35 ± 1.03 | −0.89 ± 0.52 | −0.37 ± 0.79 | −1.15 ± 0.97 | −0.76 ± 0.53 | |
| Kuban | Belaya | 41 | 6.5 ± 0.4 | −1.05 ± 1.04 | −1.01 ± 1.06 | −1.03 ± 0.57 | −0.89 ± 1.05 | −0.86 ± 1.04 | −0.88 ± 0.67 |
| Malaya Laba | 34 | 7.4 ± 0.5 | −0.73 ± 0.88 | −1.12 ± 1.02 | −0.93 ± 0.52 | −0.62 ± 0.83 | −0.96 ± 0.97 | −0.79 ± 0.57 | |
| Bolshaya Laba | 27 | 4.4 ± 0.2 | −1.57 ± 1.10 | −1.04 ± 1.34 | −1.30 ± 0.67 | −1.34 ± 1.20 | −0.88 ± 1.31 | −1.11 ± 0.84 | |
| Bolshoy Zelenchuk | 59 | 24.6 ± 1.3 | −1.12 ± 0.94 | −0.94 ± 1.11 | −1.03 ± 0.56 | −0.95 ± 0.89 | −0.80 ± 1.02 | −0.88 ± 0.59 | |
| Maliy Zelenchuk | 42 | 24.5 ± 1.1 | −0.70 ± 0.67 | −0.96 ± 0.73 | −0.83 ± 0.38 | −0.59 ± 0.62 | −0.81 ± 0.69 | −0.70 ± 0.40 | |
| Teberda | 89 | 52.9 ± 2.5 | −0.47 ± 0.59 | −0.90 ± 0.64 | −0.68 ± 0.34 | −0.40 ± 0.53 | −0.77 ± 0.60 | −0.58 ± 0.34 | |
| Daut | 23 | 4.8 ± 0.4 | −0.49 ± 0.59 | −0.77 ± 0.65 | −0.63 ± 0.34 | −0.42 ± 0.54 | −0.65 ± 0.61 | −0.54 ± 0.35 | |
| Uchkulan | 68 | 19.1 ± 1.4 | −0.38 ± 0.58 | −0.99 ± 0.63 | −0.68 ± 0.33 | −0.32 ± 0.51 | −0.84 ± 0.61 | −0.58 ± 0.35 | |
| Ullukam | 93 | 42.8 ± 2.2 | −0.38 ± 0.57 | −0.69 ± 0.59 | −0.53 ± 0.32 | −0.32 ± 0.50 | −0.59 ± 0.55 | −0.45 ± 0.31 | |
| Malka | 12 | 52.2 ± 0.8 | −0.38 ± 0.50 | −0.45 ± 0.50 | −0.42 ± 0.27 | −0.33 ± 0.44 | −0.39 ± 0.45 | −0.36 ± 0.26 | |
| Baksan | 147 | 146.2 ± 6.0 | −0.51 ± 0.57 | −0.74 ± 0.56 | −0.62 ± 0.30 | −0.44 ± 0.52 | −0.63 ± 0.52 | −0.53 ± 0.31 | |
| Chegem | Bashil-Auzusu | 30 | 25.3 ± 1.0 | −0.39 ± 0.64 | −0.90 ± 0.61 | −0.65 ± 0.33 | −0.34 ± 0.56 | −0.77 ± 0.57 | −0.55 ± 0.33 |
| Gara-Auzusu | 15 | 24.6 ± 0.9 | −0.30 ± 0.55 | −0.65 ± 0.55 | −0.47 ± 0.30 | −0.26 ± 0.48 | −0.55 ± 0.49 | −0.40 ± 0.28 | |
| Bulungu | 8 | 2.9 ± 0.2 | 0.04 ± 0.82 | −0.90 ± 0.94 | −0.43 ± 0.49 | 0.04 ± 0.74 | −0.77 ± 0.90 | −0.37 ± 0.48 | |
| Cherek | Cherek-Bezingskiy | 38 | 72.9 ± 2.2 | −0.24 ± 0.70 | −0.51 ± 0.77 | −0.37 ± 0.41 | −0.21 ± 0.61 | −0.43 ± 0.71 | −0.32 ± 0.39 |
| Cherek-Balkarskiy | 80 | 96.5 ± 3.5 | −0.51 ± 0.65 | −0.47 ± 0.68 | −0.49 ± 0.37 | −0.43 ± 0.59 | −0.40 ± 0.60 | −0.42 ± 0.36 | |
| Psigansy | 11 | 12.7 ± 0.6 | −0.56 ± 0.73 | −0.61 ± 0.75 | −0.59 ± 0.35 | −0.48 ± 0.66 | −0.52 ± 0.67 | −0.50 ± 0.36 | |
| Urukh | Khanzidon | 10 | 6.2 ± 0.4 | −0.33 ± 0.70 | −0.42 ± 0.74 | −0.38 ± 0.38 | −0.28 ± 0.66 | −0.36 ± 0.73 | −0.32 ± 0.40 |
| Biliagikom | 5 | 1.0 ± 0.1 | −0.88 ± 0.74 | −1.11 ± 0.76 | −1.00 ± 0.41 | −0.75 ± 0.67 | −0.94 ± 0.70 | −0.85 ± 0.42 | |
| Urukh headwaters | 31 | 25.0 ± 1.2 | −0.54 ± 0.65 | −0.59 ± 0.64 | −0.57 ± 0.34 | −0.46 ± 0.58 | −0.50 ± 0.57 | −0.48 ± 0.32 | |
| Karaugom | 29 | 41.7 ± 1.4 | −0.76 ± 0.72 | −0.45 ± 0.71 | −0.61 ± 0.39 | −0.65 ± 0.67 | −0.38 ± 0.62 | −0.51 ± 0.38 | |
| Aigamuga | 20 | 14.7 ± 0.8 | −0.49 ± 0.79 | −0.41 ± 0.79 | −0.45 ± 0.42 | −0.42 ± 0.71 | −0.35 ± 0.70 | −0.38 ± 0.41 | |
| Ardon | Tseyadon | 20 | 16.8 ± 0.6 | −0.49 ± 0.92 | −0.43 ± 0.88 | −0.46 ± 0.48 | −0.42 ± 0.81 | −0.36 ± 0.77 | −0.39 ± 0.44 |
| Sidan | 1 | 0.03 ± 0.004 | −0.07 ± 1.50 | −0.74 ± 1.47 | −0.41 ± 0.80 | −0.06 ± 1.28 | −0.63 ± 1.31 | −0.35 ± 0.71 | |
| Vilsa | 4 | 0.9 ± 0.08 | −0.79 ± 0.76 | −0.71 ± 0.72 | −0.75 ± 0.40 | −0.67 ± 0.71 | −0.61 ± 0.68 | −0.64 ± 0.44 | |
| Adaikom | 7 | 4.6 ± 0.2 | −0.33 ± 0.64 | −0.79 ± 0.60 | −0.56 ± 0.33 | −0.28 ± 0.56 | −0.67 ± 0.56 | −0.47 ± 0.32 | |
| Mamikhdon | 15 | 3.7 ± 0.2 | −0.82 ± 0.68 | −0.79 ± 0.66 | −0.81 ± 0.36 | −0.70 ± 0.67 | −0.67 ± 0.60 | −0.69 ± 0.38 | |
| Nar | 10 | 1.5 ± 0.07 | −0.24 ± 0.66 | −0.67 ± 0.62 | −0.45 ± 0.34 | −0.20 ± 0.61 | −0.57 ± 0.59 | −0.38 ± 0.36 | |
| Kasaidon | 2 | 0.2 ± 0.02 | −0.71 ± 0.91 | −0.39 ± 0.87 | −0.55 ± 0.47 | −0.60 ± 0.81 | −0.33 ± 0.76 | −0.47 ± 0.44 | |
| Labagkomdon | 1 | 0.06 ± 0.008 | 0.51 ± 1.01 | −0.48 ± 0.93 | 0.02 ± 0.52 | 0.43 ± 0.87 | −0.41 ± 0.81 | 0.01 ± 0.44 | |
| Baddon | 8 | 2.6 ± 0.2 | −0.66 ± 0.71 | −0.45 ± 0.68 | −0.55 ± 0.37 | −0.56 ± 0.63 | −0.38 ± 0.61 | −0.47 ± 0.36 | |
| Arkhondon | 4 | 3.5 ± 0.2 | −0.95 ± 0.54 | −0.63 ± 0.52 | −0.79 ± 0.29 | −0.81 ± 0.49 | −0.54 ± 0.46 | −0.67 ± 0.28 | |
| Fiagdon | 25 | 6.2 ± 0.6 | −0.23 ± 0.66 | −0.50 ± 0.65 | −0.36 ± 0.35 | −0.20 ± 0.59 | −0.42 ± 0.59 | −0.31 ± 0.34 | |
| Gizeldon | 24 | 25.2 ± 1.0 | −0.46 ± 0.56 | −0.43 ± 0.55 | −0.44 ± 0.30 | −0.39 ± 0.50 | −0.36 ± 0.50 | −0.38 ± 0.28 | |
| Tergi (Terek) headwaters | 94 | 42.7 ± 3.0 | −0.04 ± 0.68 | −0.64 ± 0.70 | −0.34 ± 0.37 | −0.03 ± 0.60 | −0.54 ± 0.65 | −0.29 ± 0.36 | |
| Sunja right tributaries | Assa | 10 | 2.1 ± 0.2 | −0.13 ± 0.64 | −0.35 ± 0.68 | −0.24 ± 0.36 | −0.11 ± 0.56 | −0.30 ± 0.59 | −0.20 ± 0.31 |
| Arghuni | 18 | 5.2 ± 0.4 | −0.10 ± 0.66 | −0.55 ± 0.67 | −0.33 ± 0.36 | −0.08 ± 0.58 | −0.47 ± 0.60 | −0.28 ± 0.33 | |
| Sharo Argun | 31 | 15.7 ± 0.8 | −0.57 ± 0.83 | −0.64 ± 0.82 | −0.61 ± 0.43 | −0.49 ± 0.75 | −0.54 ± 0.73 | −0.52 ± 0.41 | |
| Sulak | Andiyskoye Koysu | 35 | 11.8 ± 0.6 | −0.70 ± 0.68 | −0.68 ± 0.66 | −0.69 ± 0.35 | −0.60 ± 0.70 | −0.58 ± 0.60 | −0.59 ± 0.39 |
| Avarskoye Koysu | 34 | 5.9 ± 0.4 | −0.53 ± 0.76 | −0.54 ± 0.79 | −0.53 ± 0.42 | −0.45 ± 0.69 | −0.46 ± 0.72 | −0.45 ± 0.41 | |
| Samur | 13 | 2.4 ± 0.2 | −0.19 ± 0.54 | −0.71 ± 0.55 | −0.45 ± 0.30 | −0.16 ± 0.47 | −0.60 ± 0.51 | −0.38 ± 0.28 | |
| Kusarchai | 14 | 0.8 ± 0.1 | −0.21 ± 0.62 | −0.34 ± 0.59 | −0.28 ± 0.32 | −0.18 ± 0.54 | −0.29 ± 0.55 | −0.24 ± 0.30 | |
| Bzipi | 16 | 3.1 ± 0.3 | −1.07 ± 0.73 | −0.22 ± 0.86 | −0.65 ± 0.44 | −0.91 ± 0.73 | −0.19 ± 0.81 | −0.55 ± 0.45 | |
| Kelasuri | 2 | 0.9 ± 0.06 | −1.04 ± 0.69 | −1.11 ± 0.90 | −1.07 ± 0.45 | −0.89 ± 0.62 | −0.94 ± 0.85 | −0.91 ± 0.47 | |
| Kodori | 154 | 42.0 ± 2.6 | −046 ± 0.60 | −0.96 ± 0.68 | −0.71 ± 0.36 | −0.39 ± 0.54 | −0.81 ± 0.67 | −0.60 ± 0.37 | |
| Enguri | 289 | 223.6 ± 8.8 | −0.31 ± 0.60 | −0.84 ± 0.60 | −0.57 ± 0.32 | −0.26 ± 0.53 | −0.71 ± 0.58 | −0.49 ± 0.33 | |
| Khobistkali | 11 | 0.6 ± 0.08 | −1.08 ± 0.97 | −0.71 ± 0.97 | −0.89 ± 0.52 | −0.92 ± 0.97 | −0.60 ± 0.89 | −0.76 ± 0.57 | |
| Rioni | 117 | 50.6 ± 2.3 | −0.64 ± 0.71 | −0.61 ± 0.73 | −0.62 ± 0.39 | −0.54 ± 0.67 | −0.52 ± 0.66 | −0.53 ± 0.39 | |
| Liakhvi | 12 | 2.0 ± 0.2 | −0.22 ± 0.72 | −0.76 ± 0.69 | −0.49 ± 0.38 | −0.18 ± 0.62 | −0.65 ± 0.65 | −0.42 ± 0.37 | |
| Aragvi | 1 | 0.3 ± 0.04 | 0.06 ± 0.47 | −0.56 ± 0.49 | −0.25 ± 0.26 | 0.05 ± 0.40 | −0.47 ± 0.43 | −0.21 ± 0.23 | |
| Total, Greater Caucasus | 1861 | 1186.1 ± 53.3 | −0.50 ± 0.67 | −0.75 ± 0.70 | −0.62 ± 0.37 | −0.42 ± 0.61 | −0.64 ± 0.66 | −0.53 ± 0.38 | |
Table A2.
Change in glacier thickness (m a−1) and surface mass balance (m w.e. a−1) for Caucasus countries (Russia, Georgia, Azerbaijan) in 2000–2010, 2010–2019, and 2000–2019.
Table A2.
Change in glacier thickness (m a−1) and surface mass balance (m w.e. a−1) for Caucasus countries (Russia, Georgia, Azerbaijan) in 2000–2010, 2010–2019, and 2000–2019.
| Countries | Based on Landsat 2014 (Tielidze and Wheate, 2018) [21] | Change of Glacier Thickness (m a−1) Hugonnet et al. (2021) [3] | Change in Glacier Surface Mass Balance (m w.e. a−1) Hugonnet et al. (2021) [3] | |||||
|---|---|---|---|---|---|---|---|---|
| Number | Area km2 | 2000–2010 | 2010–2019 | 2000–2019 | 2000–2010 | 2010–2019 | 2000–2019 | |
| Russia | 1161 | 817.8 ± 35.1 | −0.55 ± 0.70 | −0.74 ± 0.73 | −0.65 ± 0.38 | −0.47 ± 0.63 | −0.63 ± 0.67 | −0.55 ± 0.39 |
| Georgia | 683 | 367.1 ± 16.8 | −0.41 ± 0.64 | −0.77 ± 0.67 | −0.60 ± 0.36 | −0.35 ± 0.58 | −0.66 ± 0.64 | −0.51 ± 0.36 |
| Azerbaijan | 17 | 1.2 ± 0.2 | −0.17 ± 0.61 | −0.37 ± 0.58 | −0.27 ± 0.31 | −0.14 ± 0.53 | −0.31 ± 0.53 | −0.23 ± 0.29 |
Table A3.
Change in glacier thickness (m a−1) and surface mass balance (m w.e. a−1) for individual glaciers > 2.0 km2 of the Greater Caucasus in 2000–2010, 2010–2019, and 2000–2019.
Table A3.
Change in glacier thickness (m a−1) and surface mass balance (m w.e. a−1) for individual glaciers > 2.0 km2 of the Greater Caucasus in 2000–2010, 2010–2019, and 2000–2019.
| Glacier Name | GLIMS_id | Area (km2) | Change of Glacier Thickness (m a−1) Hugonnet et al. (2021) [3] | Change in Glacier Surface Mass Balance (m w.e. a−1) Hugonnet et al. (2021) [3] | ||||
|---|---|---|---|---|---|---|---|---|
| 2000–2010 | 2010–2019 | 2000–2019 | 2000–2010 | 2010–2019 | 2000–2019 | |||
| Glaciers with >10 km2 Area | ||||||||
| Bezingi | G043100E43030N | 37.49 | −0.22 ± 0.26 | −0.78 ± 0.24 | −0.50 ± 0.14 | −0.19 ± 0.22 | −0.67 ± 0.21 | −0.43 ± 0.12 |
| Dykhsu | G043183E42984N | 27.53 | −0.48 ± 0.27 | −0.76 ± 0.26 | −0.62 ± 0.15 | −0.41 ± 0.23 | −0.65 ± 0.23 | −0.53 ± 0.14 |
| Karaugom | G043748E42782N | 23.99 | −0.28 ± 0.28 | −0.69 ± 0.26 | −0.49 ± 0.15 | −0.24 ± 0.24 | −0.59 ± 0.23 | −0.41 ± 0.14 |
| Lekhziri | G042766E43151N | 23.77 | −0.46 ± 0.26 | −1.44 ± 0.22 | −0.95 ± 0.13 | −0.39 ± 0.23 | −1.22 ± 0.23 | −0.81 ± 0.14 |
| Dzhikiugankez | G042506E43356N | 21.44 | −1.01 ± 0.23 | −1.45 ± 0.22 | −1.23 ± 0.12 | −0.86 ± 0.21 | −1.23 ± 0.21 | −1.04 ± 0.13 |
| Agashtan | G043291E42928N | 18.94 | −1.04 ± 0.28 | −1.02 ± 0.31 | −1.03 ± 0.18 | −0.89 ± 0.25 | −0.86 ± 0.28 | −0.88 ± 0.17 |
| Azay Bolshoy | G042429E43293N | 17.72 | −0.39 ± 0.24 | −0.69 ± 0.23 | −0.54 ± 0.13 | −0.33 ± 0.21 | −0.59 ± 0.21 | −0.46 ± 0.11 |
| Ulluchiran | G042432E43372N | 12.79 | −0.08 ± 0.25 | −0.29 ± 0.23 | −0.19 ± 0.13 | −0.07 ± 0.21 | −0.25 ± 0.20 | −0.16 ± 0.11 |
| Midjirgi | G043165E43066N | 12.74 | −0.05 ± 0.30 | −0.35 ± 0.33 | −0.20 ± 0.18 | −0.04 ± 0.26 | −0.30 ± 0.28 | −0.17 ± 0.15 |
| Tsaneri Southern | G042999E43050N | 12.32 | −0.51 ± 0.29 | −0.67 ± 0.29 | −0.59 ± 0.16 | −0.43 ± 0.25 | −0.57 ± 0.26 | −0.50 ± 0.15 |
| Tseya | G043844E42752N | 11.87 | −0.21 ± 0.31 | −1.04 ± 0.28 | −0.63 ± 0.17 | −0.18 ± 0.26 | −0.89 ± 0.26 | −0.53 ± 0.15 |
| Tsaneri Northern | G043005E43089N | 11.28 | −0.46 ± 0.29 | −0.45 ± 0.26 | −0.46 ± 0.14 | −0.39 ± 0.25 | −0.38 ± 0.22 | −0.39 ± 0.13 |
| Irik | G042501E43334N | 10.97 | −0.34 ± 0.26 | −0.75 ± 0.25 | −0.54 ± 0.13 | −0.29 ± 0.22 | −0.63 ± 0.22 | −0.46 ± 0.12 |
| Glaciers with 5–10 km2 area | ||||||||
| Shaurty | G043051E43105N | 9.89 | −0.37 ± 0.29 | −0.80 ± 0.26 | −0.58 ± 0.15 | −0.31 ± 0.25 | −0.68 ± 0.24 | −0.49 ± 0.14 |
| Adishi | G043016E43017N | 9.59 | −0.07 ± 0.34 | 0.32 ± 0.33 | 0.12 ± 0.18 | −0.06 ± 0.29 | 0.27 ± 0.28 | 0.10 ± 0.15 |
| Kvitlodi | G042950E43105N | 9.58 | −0.10 ± 0.29 | −0.88 ± 0.30 | −0.49 ± 0.17 | −0.08 ± 0.25 | −0.75 ± 0.27 | −0.42 ± 0.15 |
| Terskol | G042488E43308N | 9.48 | −0.12 ± 0.26 | −0.21 ± 0.25 | −0.17 ± 0.14 | −0.11 ± 0.23 | −0.17 ± 0.21 | −0.14 ± 0.12 |
| Azay Maliy | G042449E43302N | 9.45 | 0.00 ± 0.27 | −0.22 ± 0.26 | −0.11 ± 0.14 | 0.00 ± 0.23 | −0.19 ± 0.22 | −0.09 ± 0.12 |
| Chalaati | G042713E43130N | 9.24 | −0.01 ± 0.28 | −1.09 ± 0.27 | −0.55 ± 0.15 | −0.01 ± 0.24 | −0.92 ± 0.25 | −0.47 ± 0.13 |
| Suatisi_Eastern | G044443E42706N | 8.89 | −0.11 ± 0.30 | −0.86 ± 0.29 | −0.48 ± 0.16 | −0.09 ± 0.26 | −0.73 ± 0.26 | −0.41 ± 0.14 |
| Khalde | G043043E42994N | 8.59 | −0.37 ± 0.31 | 0.11 ± 0.32 | −0.13 ± 0.17 | −0.31 ± 0.27 | 0.09 ± 0.27 | −0.11 ± 0.15 |
| Shkhelda | G042663E43151N | 8.28 | −0.44 ± 0.29 | −1.13 ± 0.27 | −0.79 ± 0.15 | −0.38 ± 0.25 | −0.96 ± 0.26 | −0.67 ± 0.15 |
| Midagrabin | G044390E42722N | 8.16 | −0.53 ± 0.31 | −1.14 ± 0.28 | −0.83 ± 0.16 | −0.45 ± 0.27 | −0.97 ± 0.26 | −0.71 ± 0.15 |
| Ullauzna | G043238E43064N | 7.53 | −0.09 ± 0.31 | −0.27 ± 0.36 | −0.18 ± 0.19 | −0.08 ± 0.26 | −0.23 ± 0.30 | −0.16 ± 0.17 |
| Bashil | G042901E43169N | 7.35 | −0.25 ± 0.31 | −1.09 ± 0.28 | −0.67 ± 0.16 | −0.21 ± 0.27 | −0.93 ± 0.25 | −0.57 ± 0.14 |
| Kvishi | G042497E43168N | 7.33 | 0.04 ± 0.28 | −1.03 ± 0.28 | −0.50 ± 0.15 | 0.03 ± 0.24 | −0.88 ± 0.26 | −0.42 ± 0.13 |
| Hrumkol | G043202E43023N | 7.01 | 0.04 ± 0.30 | −0.50 ± 0.32 | −0.23 ± 0.18 | 0.03 ± 0.26 | −0.42 ± 0.28 | −0.20 ± 0.15 |
| Mikelchiran | G042487E43376N | 6.85 | −0.15 ± 0.27 | −0.44 ± 0.25 | −0.30 ± 0.14 | −0.13 ± 0.23 | −0.38 ± 0.21 | −0.25 ± 0.12 |
| Psigansu | G043482E42972N | 6.76 | −0.26 ± 0.31 | −0.90 ± 0.30 | −0.58 ± 0.17 | −0.22 ± 0.26 | −0.77 ± 0.27 | −0.49 ± 0.16 |
| Maili | G044477E42719N | 6.57 | −0.19 ± 0.31 | −0.44 ± 0.30 | −0.31 ± 0.16 | −0.16 ± 0.27 | −0.38 ± 0.25 | −0.27 ± 0.14 |
| Djalovchatskiy | G041493E43296N | 6.42 | −1.07 ± 0.28 | −2.01 ± 0.27 | −1.54 ± 0.14 | −0.91 ± 0.26 | −1.71 ± 0.30 | −1.31 ± 0.19 |
| Bartuitsete | G043638E42825N | 6.30 | −0.65 ± 0.32 | −0.81 ± 0.30 | −0.73 ± 0.17 | −0.56 ± 0.28 | −0.68 ± 0.27 | −0.62 ± 0.16 |
| Lekhziri Central | G042751E43175N | 6.27 | 0.09 ± 0.32 | −0.88 ± 0.29 | −0.39 ± 0.16 | 0.08 ± 0.27 | −0.74 ± 0.26 | −0.33 ± 0.14 |
| Kulakchegemchiran | G042967E43132N | 6.00 | −0.41 ± 0.35 | −1.12 ± 0.32 | −0.77 ± 0.18 | −0.35 ± 0.30 | −0.95 ± 0.30 | −0.65 ± 0.17 |
| Karachaul | G042453E43381N | 5.94 | −0.07 ± 0.28 | −0.30 ± 0.26 | −0.19 ± 0.14 | −0.06 ± 0.23 | −0.26 ± 0.22 | −0.16 ± 0.12 |
| Gergeti | G044499E42692N | 5.77 | −0.03 ± 0.32 | −0.65 ± 0.30 | −0.34 ± 0.16 | −0.03 ± 0.27 | −0.55 ± 0.26 | −0.29 ± 0.14 |
| Alibekskiy | G041523E43281N | 5.73 | −1.12 ± 0.28 | −1.30 ± 0.28 | −1.21 ± 0.14 | −0.95 ± 0.26 | −1.10 ± 0.27 | −1.03 ± 0.16 |
| Kyukyurtlyu | G042404E43354N | 5.69 | 0.07 ± 0.28 | −0.24 ± 0.27 | −0.08 ± 0.15 | 0.06 ± 0.24 | −0.20 ± 0.23 | −0.07 ± 0.13 |
| Songutidontsete | G043809E42798N | 5.66 | −0.55 ± 0.34 | −0.84 ± 0.32 | −0.69 ± 0.18 | −0.46 ± 0.30 | −0.71 ± 0.29 | −0.59 ± 0.17 |
| Dolra | G042522E43171N | 5.36 | 0.03 ± 0.29 | −1.12 ± 0.30 | −0.55 ± 0.16 | 0.02 ± 0.25 | −0.95 ± 0.27 | −0.47 ± 0.14 |
| Ullukol | G042464E43376N | 5.35 | −0.14 ± 0.28 | −0.37 ± 0.26 | −0.26 ± 0.14 | −0.12 ± 0.24 | −0.32 ± 0.22 | −0.22 ± 0.12 |
| 493v | G042811E43183N | 5.32 | −0.42 ± 0.34 | −0.86 ± 0.31 | −0.64 ± 0.17 | −0.35 ± 0.29 | −0.73 ± 0.28 | −0.54 ± 0.16 |
| Glaciers with 2–5 km2 area | ||||||||
| Ushba Southern | G042633E43131N | 4.72 | −0.43 ± 0.33 | −1.09 ± 0.32 | −0.76 ± 0.17 | −0.36 ± 0.28 | −0.92 ± 0.29 | −0.64 ± 0.16 |
| Seri | G042838E43120N | 4.65 | −0.25 ± 0.34 | −1.17 ± 0.32 | −0.71 ± 0.18 | −0.22 ± 0.29 | −1.00 ± 0.30 | −0.61 ± 0.17 |
| Amanauz | G041626E43230N | 4.63 | −0.75 ± 0.29 | −1.46 ± 0.29 | −1.10 ± 0.15 | −0.63 ± 0.26 | −1.24 ± 0.29 | −0.94 ± 0.17 |
| Boko | G043719E42767N | 4.62 | −0.03 ± 0.34 | −0.60 ± 0.33 | −0.31 ± 0.19 | −0.03 ± 0.29 | −0.51 ± 0.28 | −0.27 ± 0.16 |
| Nageba | G042959E43036N | 4.60 | −0.16 ± 0.32 | −0.24 ± 0.33 | −0.20 ± 0.18 | −0.14 ± 0.27 | −0.21 ± 0.28 | −0.17 ± 0.16 |
| Kirtisho | G043596E42832N | 4.51 | −0.71 ± 0.33 | −0.97 ± 0.31 | −0.84 ± 0.18 | −0.60 ± 0.29 | −0.82 ± 0.28 | −0.71 ± 0.17 |
| Devdoraki | G044517E42715N | 4.41 | 0.03 ± 0.32 | −0.30 ± 0.30 | −0.13 ± 0.16 | 0.02 ± 0.28 | −0.25 ± 0.26 | −0.11 ± 0.14 |
| Tviberi | G042838E43099N | 4.33 | −0.30 ± 0.32 | −1.46 ± 0.31 | −0.88 ± 0.18 | −0.26 ± 0.27 | −1.24 ± 0.31 | −0.75 ± 0.18 |
| Bashkara | G042734E43194N | 4.05 | −0.48 ± 0.35 | −1.02 ± 0.33 | −0.75 ± 0.18 | −0.41 ± 0.31 | −0.87 ± 0.30 | −0.64 ± 0.18 |
| Sopruju Southern | G041572E43240N | 3.96 | −0.32 ± 0.29 | −1.09 ± 0.29 | −0.70 ± 0.14 | −0.27 ± 0.25 | −0.92 ± 0.27 | −0.60 ± 0.14 |
| Belalakaiskiy | G041561E43266N | 3.88 | −0.74 ± 0.30 | −1.52 ± 0.29 | −1.13 ± 0.15 | −0.63 ± 0.26 | −1.29 ± 0.30 | −0.96 ± 0.18 |
| Tanantsete | G043500E42888N | 3.88 | −0.53 ± 0.34 | −0.23 ± 0.34 | −0.38 ± 0.19 | −0.45 ± 0.29 | −0.20 ± 0.29 | −0.32 ± 0.16 |
| Djailik | G042922E43239N | 3.86 | −0.49 ± 0.38 | −0.73 ± 0.35 | −0.61 ± 0.19 | −0.42 ± 0.32 | −0.62 ± 0.30 | −0.52 ± 0.17 |
| Sugan | G043454E42991N | 3.84 | −0.42 ± 0.33 | −0.76 ± 0.32 | −0.59 ± 0.18 | −0.36 ± 0.29 | −0.65 ± 0.28 | −0.50 ± 0.16 |
| Tyutyun | G043249E43041N | 3.79 | −0.41 ± 0.35 | −0.76 ± 0.41 | −0.59 ± 0.22 | −0.35 ± 0.30 | −0.65 ± 0.36 | −0.50 ± 0.20 |
| Laila | G042534E42928N | 3.73 | −0.08 ± 0.30 | −1.12 ± 0.29 | −0.60 ± 0.16 | −0.07 ± 0.26 | −0.95 ± 0.27 | −0.51 ± 0.14 |
| Zaramag | G043845E42727N | 3.67 | −0.61 ± 0.36 | −0.80 ± 0.33 | −0.70 ± 0.19 | −0.51 ± 0.31 | −0.68 ± 0.29 | −0.60 ± 0.18 |
| Edena Bigger | G043380E42886N | 3.66 | −0.52 ± 0.33 | −0.86 ± 0.31 | −0.69 ± 0.18 | −0.44 ± 0.29 | −0.73 ± 0.28 | −0.59 ± 0.17 |
| Shkhara | G043106E42983N | 3.61 | −0.54 ± 0.37 | −0.08 ± 0.37 | −0.31 ± 0.20 | −0.46 ± 0.32 | −0.07 ± 0.32 | −0.26 ± 0.17 |
| Tanantsete | G043521E42874N | 3.55 | −0.80 ± 0.35 | −0.83 ± 0.34 | −0.81 ± 0.19 | −0.68 ± 0.31 | −0.70 ± 0.30 | −0.69 ± 0.18 |
| Gerti | G043276E43053N | 3.50 | −0.83 ± 0.34 | −0.53 ± 0.40 | −0.68 ± 0.22 | −0.70 ± 0.30 | −0.45 ± 0.35 | −0.58 ± 0.19 |
| Leadashti Northern | G042479E43178N | 3.46 | −0.17 ± 0.30 | −1.08 ± 0.30 | −0.63 ± 0.16 | −0.15 ± 0.26 | −0.92 ± 0.27 | −0.53 ± 0.14 |
| Khasautskiy | G041439E43313N | 3.32 | −0.95 ± 0.40 | −1.47 ± 0.39 | −1.21 ± 0.19 | −0.81 ± 0.35 | −1.25 ± 0.35 | −1.03 ± 0.20 |
| Shtulu Western | G043371E42899N | 3.30 | −0.79 ± 0.34 | −0.81 ± 0.32 | −0.80 ± 0.18 | −0.67 ± 0.30 | −0.69 ± 0.28 | −0.68 ± 0.18 |
| Buba | G043762E42752N | 3.26 | −0.72 ± 0.36 | −0.59 ± 0.33 | −0.65 ± 0.19 | −0.61 ± 0.32 | −0.50 ± 0.29 | −0.55 ± 0.18 |
| Mostotsete | G043421E42899N | 3.24 | −1.09 ± 0.34 | −1.07 ± 0.33 | −1.08 ± 0.19 | −0.93 ± 0.31 | −0.91 ± 0.30 | −0.92 ± 0.20 |
| Morde-auzh | G042112E43216N | 3.07 | −0.50 ± 0.29 | −0.98 ± 0.31 | −0.74 ± 0.16 | −0.43 ± 0.25 | −0.84 ± 0.28 | −0.63 ± 0.16 |
| Sopruju Northern | G041588E43250N | 3.06 | −0.44 ± 0.31 | −0.95 ± 0.31 | −0.70 ± 0.16 | −0.37 ± 0.27 | −0.81 ± 0.28 | −0.59 ± 0.15 |
| Kashkatash | G042693E43189N | 3.05 | −0.18 ± 0.34 | −0.79 ± 0.32 | −0.48 ± 0.17 | −0.15 ± 0.29 | −0.67 ± 0.29 | −0.41 ± 0.16 |
| Donguz_Orun | G042509E43213N | 3.01 | −0.18 ± 0.38 | −0.74 ± 0.37 | −0.46 ± 0.19 | −0.15 ± 0.32 | −0.63 ± 0.32 | −0.39 ± 0.17 |
| Gvandra | G042078E43218N | 2.95 | −0.50 ± 0.29 | −1.00 ± 0.34 | −0.75 ± 0.18 | −0.43 ± 0.26 | −0.85 ± 0.31 | −0.64 ± 0.17 |
| Ushba Northern | G042613E43151N | 2.89 | 0.06 ± 0.32 | −0.80 ± 0.32 | −0.37 ± 0.17 | 0.05 ± 0.27 | −0.68 ± 0.28 | −0.31 ± 0.15 |
| Marukhi Northern | G041420E43362N | 2.82 | −0.52 ± 0.50 | −1.60 ± 0.50 | −1.06 ± 0.24 | −0.44 ± 0.43 | −1.36 ± 0.45 | −0.90 ± 0.23 |
| Lakra | G042468E43152N | 2.69 | −0.38 ± 0.32 | −1.27 ± 0.32 | −0.82 ± 0.16 | −0.32 ± 0.27 | −1.08 ± 0.30 | −0.70 ± 0.17 |
| Shtulu Eastern | G043395E42903N | 2.67 | −0.61 ± 0.34 | −0.63 ± 0.33 | −0.62 ± 0.19 | −0.52 ± 0.29 | −0.54 ± 0.29 | −0.53 ± 0.17 |
| Chalinginitsete | G043785E42817N | 2.65 | −1.01 ± 0.35 | −1.03 ± 0.34 | −1.02 ± 0.19 | −0.86 ± 0.32 | −0.87 ± 0.31 | −0.87 ± 0.20 |
| Tebulo | G045335E42577N | 2.62 | −0.25 ± 0.33 | −0.25 ± 0.34 | −0.25 ± 0.19 | −0.21 ± 0.28 | −0.21 ± 0.29 | −0.21 ± 0.16 |
| Tiutiurgy | G043081E43122N | 2.62 | −0.16 ± 0.34 | −0.61 ± 0.34 | −0.38 ± 0.19 | −0.14 ± 0.29 | −0.52 ± 0.30 | −0.33 ± 0.16 |
| Dvuyazichniy | G041519E43299N | 2.62 | −0.68 ± 0.31 | −1.05 ± 0.31 | −0.86 ± 0.16 | −0.58 ± 0.27 | −0.89 ± 0.28 | −0.73 ± 0.15 |
| Kichkinekol Boshoy | G042177E43228N | 2.60 | −0.69 ± 0.33 | −0.99 ± 0.34 | −0.84 ± 0.18 | −0.59 ± 0.29 | −0.84 ± 0.32 | −0.71 ± 0.18 |
| Ezengi | G042534E43202N | 2.59 | −0.02 ± 0.32 | −1.13 ± 0.30 | −0.58 ± 0.16 | −0.02 ± 0.27 | −0.96 ± 0.29 | −0.49 ± 0.16 |
| Tiutiu | G042879E43260N | 2.56 | −0.29 ± 0.71 | −0.73 ± 0.70 | −0.51 ± 0.36 | −0.24 ± 0.60 | −0.62 ± 0.61 | −0.43 ± 0.31 |
| Kolka | G044447E42733N | 2.51 | −0.83 ± 0.38 | 0.53 ± 0.35 | −0.15 ± 0.19 | −0.71 ± 0.34 | 0.45 ± 0.30 | −0.13 ± 0.16 |
| Nakhagibita | G043451E42962N | 2.49 | 0.00 ± 0.35 | −0.92 ± 0.34 | −0.46 ± 0.19 | 0.00 ± 0.30 | −0.78 ± 0.30 | −0.39 ± 0.17 |
| Karaugom | G043704E42797N | 2.48 | −0.78 ± 0.37 | −0.41 ± 0.35 | −0.59 ± 0.20 | −0.66 ± 0.32 | −0.35 ± 0.30 | −0.50 ± 0.18 |
| Zopkhito | G043422E42884N | 2.45 | −0.48 ± 0.35 | −0.85 ± 0.34 | −0.67 ± 0.20 | −0.41 ± 0.30 | −0.72 ± 0.30 | −0.57 ± 0.18 |
| Lailchala | G042581E42915N | 2.38 | −0.07 ± 0.33 | −0.93 ± 0.32 | −0.50 ± 0.17 | −0.06 ± 0.28 | −0.79 ± 0.29 | −0.42 ± 0.15 |
| Kharikhra | G042093E43100N | 2.36 | −0.42 ± 0.30 | −0.47 ± 0.31 | −0.45 ± 0.16 | −0.36 ± 0.26 | −0.40 ± 0.27 | −0.38 ± 0.14 |
| Garabashi | G042470E43302N | 2.33 | −0.45 ± 0.31 | −0.61 ± 0.31 | −0.53 ± 0.16 | −0.38 ± 0.27 | −0.52 ± 0.27 | −0.45 ± 0.15 |
| Mna | G044483E42698N | 2.32 | 0.26 ± 0.34 | −0.54 ± 0.34 | −0.14 ± 0.18 | 0.22 ± 0.29 | −0.46 ± 0.29 | −0.12 ± 0.15 |
| Namkvami | G043128E42966N | 2.29 | −0.53 ± 0.35 | −0.15 ± 0.38 | −0.34 ± 0.20 | −0.45 ± 0.30 | −0.12 ± 0.32 | −0.29 ± 0.18 |
| Koruldashi | G043157E42956N | 2.29 | −0.38 ± 0.36 | −0.51 ± 0.39 | −0.44 ± 0.21 | −0.32 ± 0.31 | −0.43 ± 0.34 | −0.37 ± 0.19 |
| Agbek | G041673E43238N | 2.28 | −0.72 ± 0.34 | −0.82 ± 0.33 | −0.77 ± 0.17 | −0.61 ± 0.30 | −0.70 ± 0.30 | −0.65 ± 0.18 |
| Shdavleri | G042337E43141N | 2.28 | −0.46 ± 0.32 | −0.81 ± 0.32 | −0.63 ± 0.17 | −0.39 ± 0.28 | −0.69 ± 0.28 | −0.54 ± 0.16 |
| Iriti | G042877E43141N | 2.27 | 0.12 ± 0.42 | −0.93 ± 0.40 | −0.40 ± 0.21 | 0.10 ± 0.35 | −0.79 ± 0.35 | −0.34 ± 0.18 |
| Djankuat | G042766E43192N | 2.23 | −0.47 ± 0.34 | −1.31 ± 0.30 | −0.89 ± 0.17 | −0.40 ± 0.30 | −1.11 ± 0.29 | −0.76 ± 0.17 |
| Khakel | G041843E43225N | 2.22 | −0.77 ± 0.30 | −1.71 ± 0.31 | −1.24 ± 0.16 | −0.66 ± 0.28 | −1.45 ± 0.34 | −1.06 ± 0.20 |
| Rtsivashki | G043434E42978N | 2.13 | −0.46 ± 0.36 | −0.54 ± 0.35 | −0.50 ± 0.19 | −0.39 ± 0.31 | −0.46 ± 0.30 | −0.42 ± 0.17 |
| Khasankoi-siuriulgen | G042386E43249N | 2.08 | −0.71 ± 0.32 | −1.20 ± 0.31 | −0.96 ± 0.16 | −0.61 ± 0.28 | −1.02 ± 0.29 | −0.81 ± 0.17 |
| Murkvami | G042813E43111N | 2.08 | −0.37 ± 0.35 | −0.50 ± 0.32 | −0.44 ± 0.18 | −0.32 ± 0.30 | −0.43 ± 0.28 | −0.37 ± 0.16 |
| Suatisi Central | G044416E42704N | 2.07 | 0.41 ± 0.36 | −0.75 ± 0.35 | −0.17 ± 0.19 | 0.35 ± 0.31 | −0.64 ± 0.31 | −0.15 ± 0.16 |
| Phastagtsete | G043655E42811N | 2.06 | −1.21 ± 0.37 | −1.17 ± 0.36 | −1.19 ± 0.20 | −1.03 ± 0.35 | −1.00 ± 0.34 | −1.01 ± 0.23 |
| Bulungy | G043105E43134N | 2.02 | −0.38 ± 0.34 | −0.50 ± 0.39 | −0.44 ± 0.21 | −0.32 ± 0.29 | −0.43 ± 0.34 | −0.37 ± 0.19 |
Figure A1.
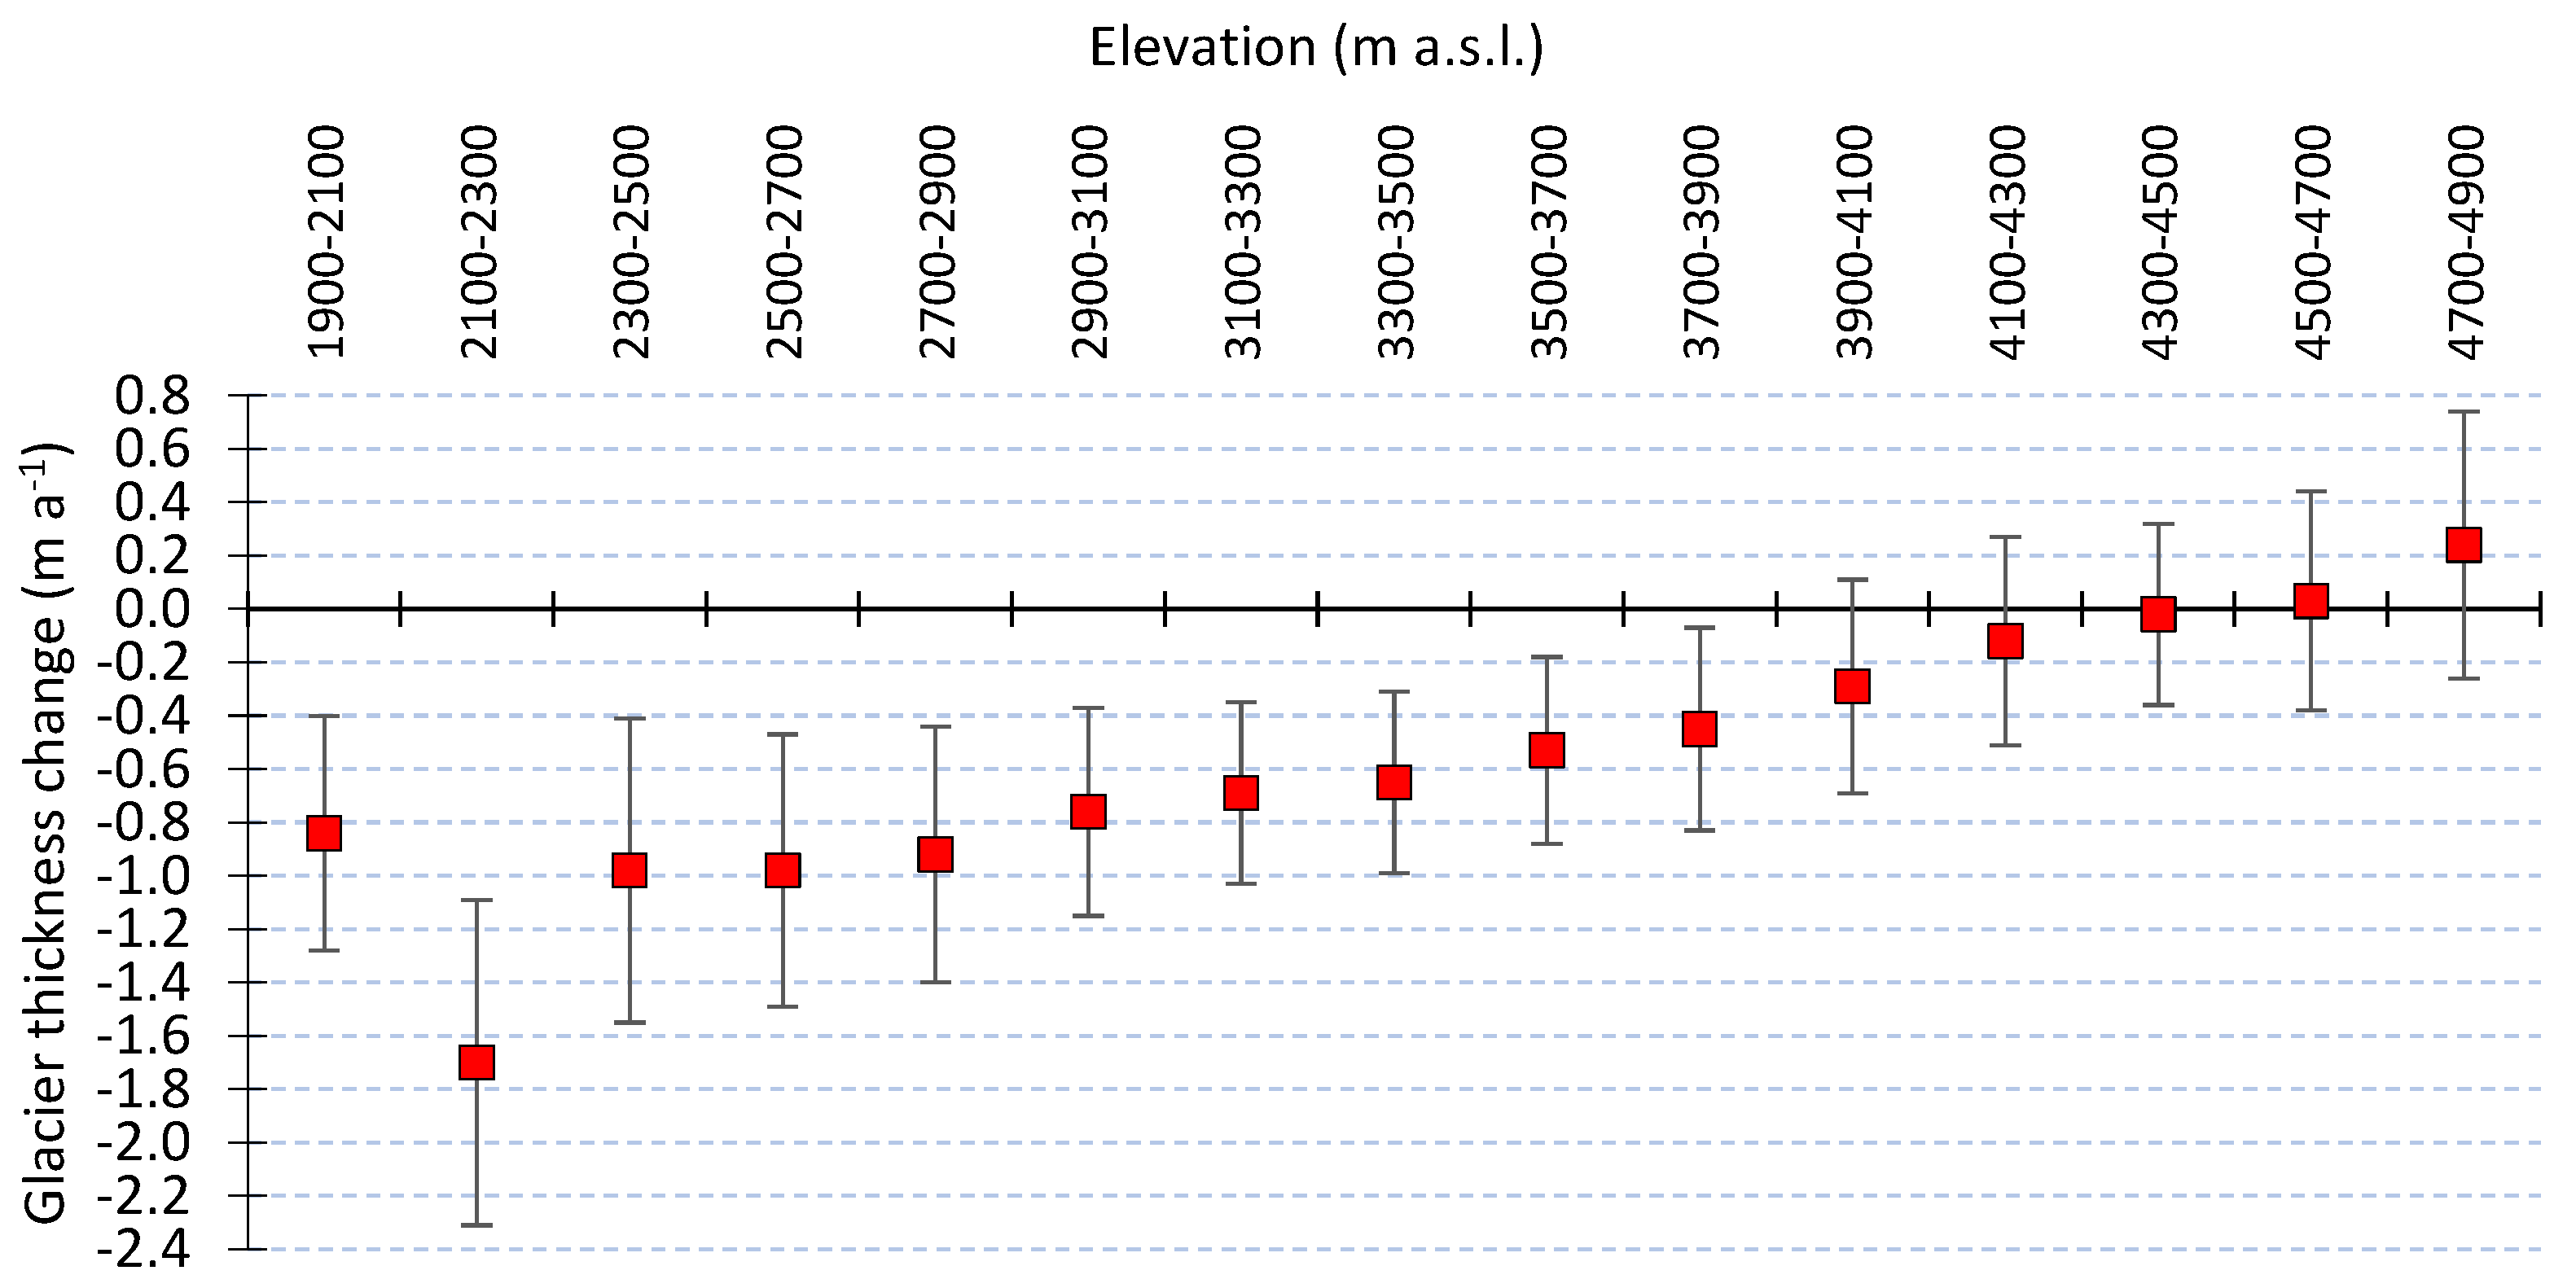
Change in in glacier thickness or surface elevation (m a−1) as a function of glacier mean elevation (m a.s.l.) in the Greater Caucasus between 2000 and 2019. Elevation bands in 200 m. Vertical stems show an uncertainty estimation of the mean values.
Figure A1.
Change in in glacier thickness or surface elevation (m a−1) as a function of glacier mean elevation (m a.s.l.) in the Greater Caucasus between 2000 and 2019. Elevation bands in 200 m. Vertical stems show an uncertainty estimation of the mean values.

Figure A2.
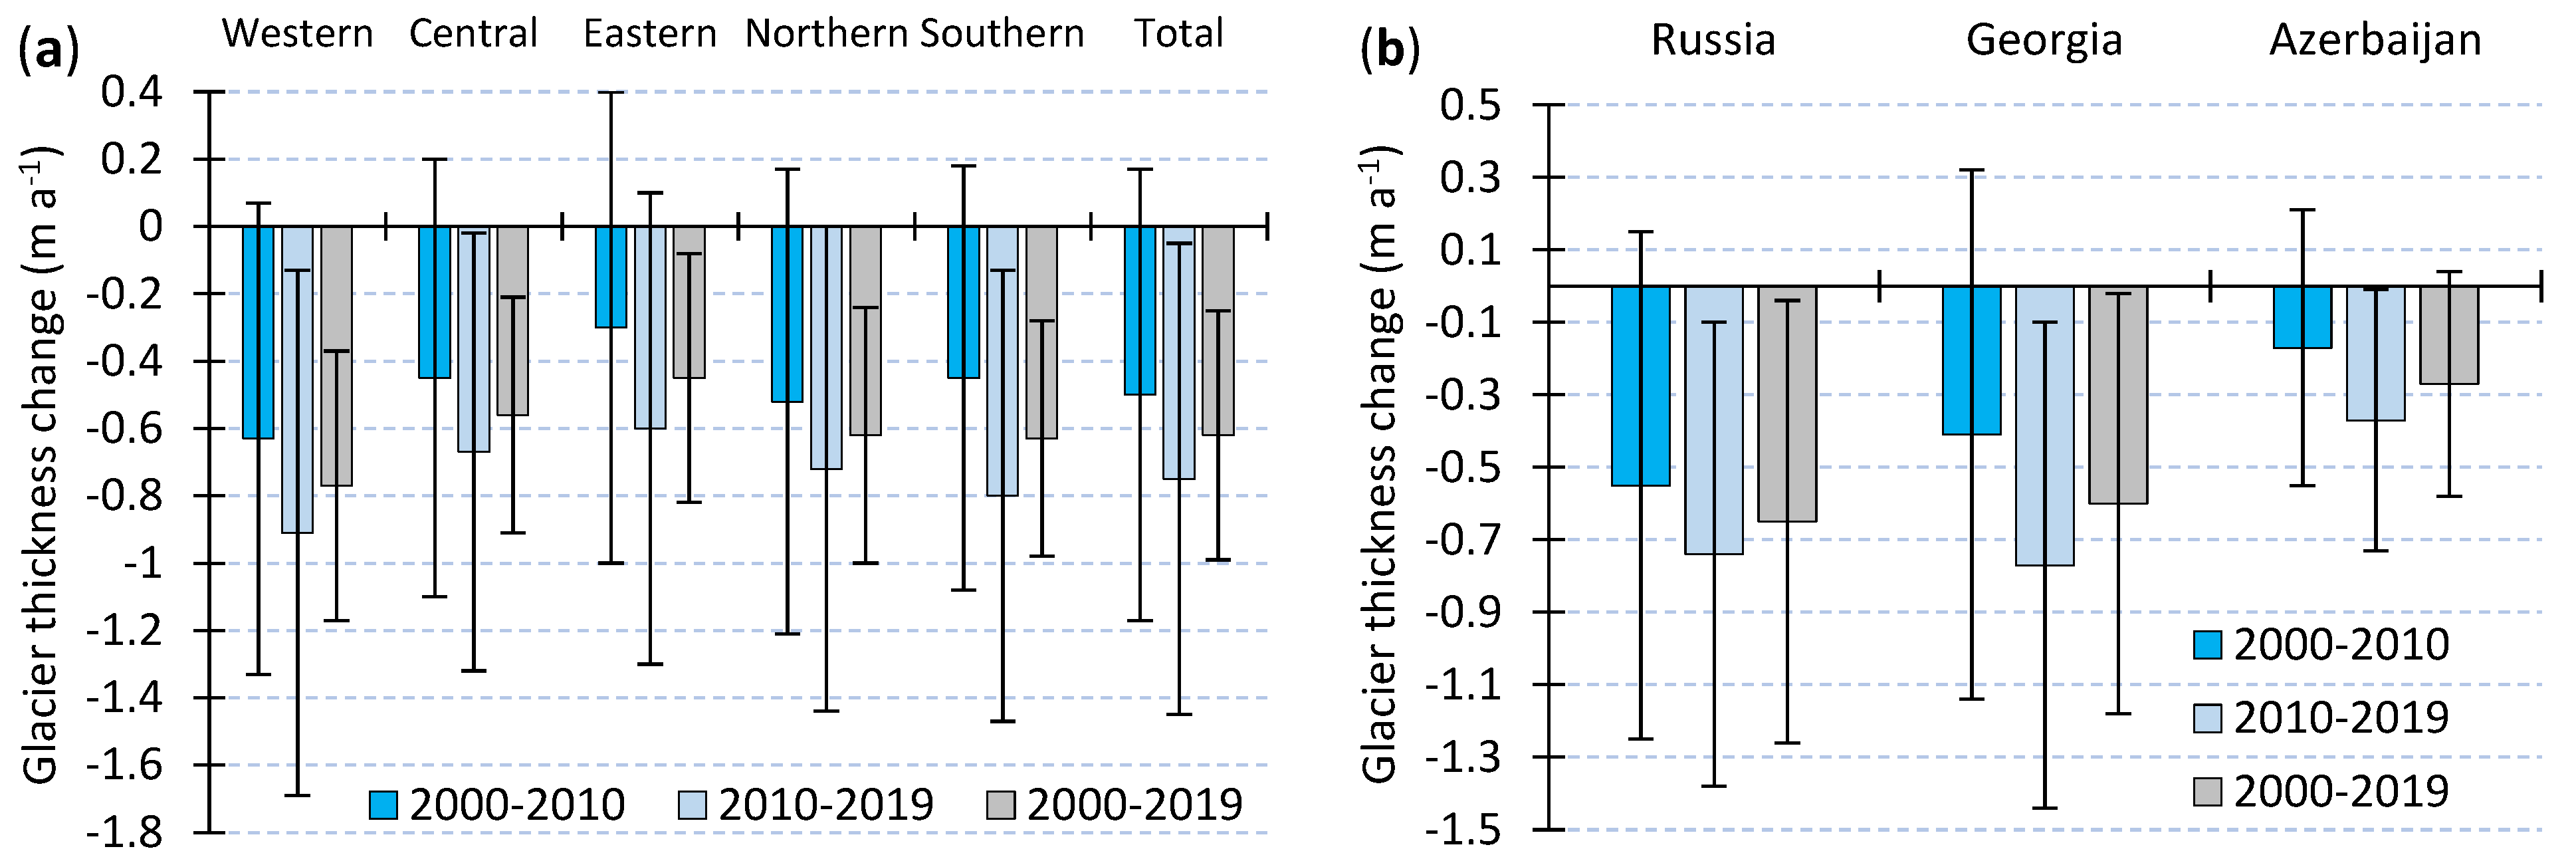
Changes in glacier thickness or surface elevation (m a−1) for all Caucasus glaciers according to the regions (western, central, and eastern), slopes (northern, southern) (a), and countries (b) in 2000–2010, 2010–2019, and 2000–2019. Vertical stems showing an uncertainty estimation of the mean values.
Figure A2.
Changes in glacier thickness or surface elevation (m a−1) for all Caucasus glaciers according to the regions (western, central, and eastern), slopes (northern, southern) (a), and countries (b) in 2000–2010, 2010–2019, and 2000–2019. Vertical stems showing an uncertainty estimation of the mean values.

References
- Cogley, J.G.; Hock, R.; Rasmussen, L.A.; Arendt, A.A.; Bauder, A.; Braithwaite, R.J.; Jansson, P.; Kaser, G.; Möller, M.; Nicholson, L. Glossary of Glacier Mass Balance and Related Terms; IHP-VII Technical Documents in Hydrology No. 86; IACS Contribution No. 2; UNESCO-IHP: Paris, France, 2011. [Google Scholar]
- Huss, M.; Hock, R. A new model for global glacier change and sea-level rise. Front. Earth Sci. 2015, 3, 54. [Google Scholar] [CrossRef] [Green Version]
- Hugonnet, R.; McNabb, R.; Berthier, E.; Menounos, B.; Nuth, C.; Girod, L.; Farinotti, D.; Huss, M.; Dussaillant, I.; Brun, F.; et al. Accelerated global glacier mass loss in the early twenty-first century. Nature 2021, 592, 726–731. [Google Scholar] [CrossRef] [PubMed]
- Zemp, M.; Huss, M.; Thibert, E.; Eckert, N.; McNabb, R.; Huber, J.; Barandun, M.; Machguth, H.; Nussbaumer, S.U.; Gärtner-Roer, I.; et al. Global glacier mass changes and their contributions to sea-level rise from 1961 to 2016. Nature 2019, 568, 382–386. [Google Scholar] [CrossRef]
- Hock, R.; Rasul, G.; Adler, C.; Cáceres, B.; Gruber, S.; Hirabayashi, Y.; Jackson, M.; Kääb, A.; Kang, S.; Kutuzov, S.; et al. High Mountain Areas. In IPCC Special Report on Ocean and the Cryosphere in a Changing Climate (SROCC); IPCC: Geneva, Switzerland, 2019. [Google Scholar]
- Nuth, C.; Kääb, A. Co-registration and bias corrections of satellite elevation data sets for quantifying glacier thickness change. Cryosphere 2011, 5, 271–290. [Google Scholar] [CrossRef] [Green Version]
- Fischer, M.; Huss, M.; Kummert, M.; Hoelzle, M. Application and validation of long-range terrestrial laser scanning to monitor the mass balance of very small glaciers in the Swiss Alps. Cryosphere 2016, 10, 1279–1295. [Google Scholar] [CrossRef] [Green Version]
- Klug, C.; Bollmann, E.; Galos, S.P.; Nicholson, L.; Prinz, R.; Rieg, L.; Sailer, R.; Stötter, J.; Kaser, G. Geodetic reanalysis of annual glaciological mass balances (2001–2011) of Hintereisferner, Austria. Cryosphere 2018, 12, 833–849. [Google Scholar] [CrossRef] [Green Version]
- Basantes-Serrano, R.; Rabatel, A.; Vincent, C.; And Sirguey, P. An optimized method to calculate the geodetic mass balance of mountain glaciers. J. Glaciol. 2018, 64, 917–931. [Google Scholar] [CrossRef] [Green Version]
- Vincent, C.; Cusicanqui, D.; Jourdain, B.; Laarman, O.; Six, D.; Gilbert, A.; Walpersdorf, A.; Rabatel, A.; Piard, L.; Gimbert, F.; et al. Geodetic point surface mass balances: A new approach to determine point surface mass balances on glaciers from remote sensing measurements. Cryosphere 2021, 15, 1259–1276. [Google Scholar] [CrossRef]
- Evans, S.G.; Tutubalina, O.V.; Drobyshev, V.N.; Chernomorets, S.S.; McDougall, S.; Petrakov, D.A.; Hungr, O. Catastrophic detachment and high-velocity long-runout flow of Kolka Glacier, Caucasus Mountains, Russia in 2002. Geomorphology 2009, 105, 314–321. [Google Scholar] [CrossRef]
- Chernomorets, S.S.; Petrakov, D.A.; Aleynikov, A.A.; Bekkiev, M.Y.; Viskhadzhieva, K.S.; Dokukin, M.D.; Kalov, R.K.; Kidyaeva, V.M.; Krylenko, V.V.; Krylenko, I.V.; et al. The Outburst of Bashkara Glacier Lake (Central Caucasus, Russia) on 1 September 2017. Kriosf. Zemli 2018, XXII, 61–70. [Google Scholar] [CrossRef]
- Tielidze, L.G.; Kumladze, R.M.; Wheate, R.D.; Gamkrelidze, M. The Devdoraki Glacier Catastrophes, Georgian Caucasus. Hung. Geogr. Bull. 2019, 68, 21–35. [Google Scholar] [CrossRef]
- Tsereteli, D.; Khazaradze, R.; Lomtatidze, G.; Inashvili, S.; Lashkhi, T.; Kurdghelaidze, G.; Kalandadze, G.; Chekurishvili, R. Glaciological observations on the Chalaati and Lechziri Glaciers (Upper Svaneti) in the spring of 1959. Georgian Natl. Acad. Sci. —Work. Vakhushti Inst. Geogr. 1962, XVIII, 223–256. (In Georgian) [Google Scholar]
- Menshutin, V.M. Mass balance of the Marukh Glacier (Western Caucasus) 1966–1968. Data Glaciol. Stud. 1970, 17, 292–296. (In Russian) [Google Scholar]
- Boyarsky, I.Y. (Ed.) Lednik Djankuat (Djankuat Glacier); Gidrometeoizdat: Saint Petersburg, Russia, 1978. [Google Scholar]
- Rototaeva, O.V.; Nosenko, G.A.; Kerimov, A.M.; Kutuzov, S.S.; Lavrentiev, I.I.; Nikitin, S.A.; Kerimov, A.A.; Tarasova, L.N. Changes of the mass balance of the Garabashy Glacier, Mount Elbrus, at the turn of 20th and 21st centuries. Ice Snow 2019, 59, 5–22. [Google Scholar] [CrossRef]
- Gigineishvili, G. (Ed.) Tbilisa Glacier—Glacial-Hydro-Meteorological Investigation. Monograph; Institute of Geography at Georgian National Academy of Sciences: Tbilisi, Georgia; Publishing house Metsniereba: Tbilisi, Georgia, 1986; p. 116. (In Russian) [Google Scholar]
- Tielidze, L.G.; Svanadze, D.; Gadrani, L.; Asanidze, L.; Wheate, R.D.; Hamilton, G.S. A 54-year record of changes at Chalaati and Zopkhito glaciers, Georgian Caucasus, observed from archival maps, satellite imagery, drone survey and ground-based investigation. Hung. Geogr. Bull. 2020, 69, 175–189. [Google Scholar] [CrossRef]
- WGMS; Zemp, M.; Nussbaumer, S.U.; GärtnerRoer, I.; Bannwart, J.; Paul, F.; Hoelzle, M. (Eds.) Global Glacier Change Bulletin No. 4 (2018–2019); ISC (WDS)/IUGG (IACS)/UNEP/UNESCO/WMO; World Glacier Monitoring Service: Zurich, Switzerland, 2021; p. 278. [Google Scholar] [CrossRef]
- Tielidze, L.G.; Wheate, R.D. The Greater Caucasus Glacier Inventory (Russia, Georgia and Azerbaijan). Cryosphere 2018, 12, 81–94. [Google Scholar] [CrossRef] [Green Version]
- Lur’e, P.M.; Panov, V.D. Variations of Contemporary Glaciation of the Northern Slope of the Greater Caucasus in the 20th Century and the Forecast of Its Degradation in the 21st Century. Russ. Meteorol. Hydrol. 2014, 39, 254–259. [Google Scholar] [CrossRef]
- Kotlyakov, V.M.; Khromova, T.E.; Nosenko, G.A.; Popova, V.V.; Chernova, L.P.; Murav’ev, A.Y. New Data on Current Changes in the Mountain Glaciers of Russia. In Doklady Earth Sciences; Pleiades Publishing: Warrensburg, MO, USA, 2015; Volume 464. [Google Scholar] [CrossRef]
- Tielidze, L.G. Glacier change over the last century, Caucasus Mountains, Georgia, observed from old topographical maps, Landsat and ASTER satellite imagery. Cryosphere 2016, 10, 713–725. [Google Scholar] [CrossRef] [Green Version]
- Rets, E.P.; Popovnin, V.V.; Toropov, P.A.; Smirnov, A.M.; Tokarev, I.V.; Chizhova, J.N.; Budantseva, N.A.; Vasil’chuk, Y.K.; Kireeva, M.B.; Ekaykin, A.A.; et al. Djankuat glacier station in the North Caucasus, Russia: A database of glaciological, hydrological, and meteorological observations and stable isotope sampling results during 2007–2017. Earth Syst. Sci. Data 2019, 11, 1463–1481. [Google Scholar] [CrossRef] [Green Version]
- Zolotarev, E.A.; Kharkovets, E.G. Development of glaciers of Mount Elbrus after the Little Ice Age. Ice Snow 2012, 52, 15–22. [Google Scholar] [CrossRef]
- Kutuzov, S.; Lavrentiev, I.; Smirnov, A.; Nosenko, G.; Petrakov, D. Volume Changes of Elbrus Glaciers From 1997 to 2017. Front. Earth Sci. 2019, 7, 153. [Google Scholar] [CrossRef] [Green Version]
- Moussavi, M.; Zoej, M.; Vaziri, F.; Sahebi, M.; Rezaei, Y. A new glacier inventory of Iran. Ann. Glaciol. 2009, 50, 93–103. [Google Scholar] [CrossRef] [Green Version]
- Azzoni, R.S.; Sarıkaya, M.A.; Fugazza, D. Turkish glacier inventory and classification from high-resolution satellite data. Mediterr. Geosci. Rev. 2020, 2, 153–162. [Google Scholar] [CrossRef]
- Olawuyi, D. Climate Change Law and Policy in the Middle East and North Africa Region, 1st ed.; Routledge: London, UK, 2021; pp. 1–340. ISBN 9780367490324. [Google Scholar]
- World Atlas of Snow and Ice Resources, V. 1.; (V. Kotlyakov editor) Russian Academy of Sciences: Moscow, Russian, 1997; 372p, (In Russian/English).
- Volodicheva, N. The Caucasus. In The Physical Geography of Northern Eurasia; Shahgedanova, M., Ed.; Oxford University Press: Oxford, UK, 2002; pp. 350–376. [Google Scholar]
- Kozachek, A.; Mikhalenko, V.; Masson-Delmotte, V.; Ekaykin, A.; Ginot, P.; Kutuzov, S.; Legrand, M.; Lipenkov, V.; Preunkert, S. Large-scale drivers of Caucasus climate variability in meteorological records and Mt El'brus ice cores. Clim. Past 2017, 13, 473–489. [Google Scholar] [CrossRef] [Green Version]
- Sylvén, M.; Reinvang, R.; Andersone-Lilley, Ž. Climate Change in Southern Caucasus: Impacts on nature, people and society (WWF overview report). In WWF Norway WWF Caucasus Programme; WWF Norway: Washington, DC, USA, 2008. [Google Scholar]
- Solomina, O.; Bushueva, I.; Dolgova, E.; Jomelli, V.; Alexandrin, M.; Mikhalenko, V.; Matskovsky, V. Glacier variations in the Northern Caucasus compared to climatic reconstructions over the past millennium. Glob. Planet. Chang. 2016, 140, 28–58. [Google Scholar] [CrossRef]
- Tielidze, L.G.; Solomina, O.N.; Jomelli, V.; Dolgova, E.A.; Bushueva, I.S.; Mikhalenko, V.N.; Brauche, R.; ASTER, T. Change of Chalaati Glacier (Georgian Caucasus) since the Little Ice Age based on dendrochronological and Beryllium-10 data. Ice Snow 2020, 60, 453–470. [Google Scholar] [CrossRef]
- Tielidze, L.G.; Nosenko, G.A.; Khromova, T.E.; Paul, F. Strong acceleration of glacier area loss in the Greater Caucasus over the past two decades. Cryosphere Discuss 2021, 8, 1–21. [Google Scholar] [CrossRef]
- Tielidze, L.G.; Bolch, T.; Wheate, R.D.; Kutuzov, S.S.; Lavrentiev, I.I.; Zemp, M. Supra-glacial debris cover changes in the Greater Caucasus from 1986 to 2014. Cryosphere 2020, 14, 585–598. [Google Scholar] [CrossRef] [Green Version]
- Rau, F.; Mauz, F.; Vogt, S.; Singh Khalsa, S.J.; Raup, B. Illustrated GLIMS Glacier Classification Manual, Glacier Classification Guidance for the GLIMS Glacier Inventory; 2005. [Google Scholar]
- Benn, D.; Bolch, T.; Hands, K.; Gulley, J.; Luckman, A.; Nicholson, L.; Quincey, D.; Thompson, S.; Toumi, R.; Wiseman, S. Response of debris-covered glaciers in the Mount Everest region to recent warming, and implications for outburst flood hazards. Earth-Sci. Rev. 2012, 114, 156–174. [Google Scholar] [CrossRef] [Green Version]
- Pratap, B.; Dobhal, D.; Mehta, M.; Bhambri, R. Influence of debris cover and altitude on glacier surface melting: A case study on Dokriani Glacier, central Himalaya, India. Ann. Glaciol. 2015, 56, 9–16. [Google Scholar] [CrossRef] [Green Version]
- Brun, F.; Wagnon, P.; Berthier, E.; Shea, J.M.; Immerzeel, W.W.; Kraaijenbrink, P.D.A.; Vincent, C.; Reverchon, C.; Shrestha, D.; Arnaud, Y. Ice cliff contribution to the tongue-wide ablation of Changri Nup Glacier, Nepal, central Himalaya. Cryosphere 2018, 12, 3439–3457. [Google Scholar] [CrossRef] [Green Version]
- Östrem, G. Ice Melting under a Thin Layer of Moraine, and the Existence of Ice Cores in Moraine Ridges. Geogr. Ann. 1959, 41, 228–230. [Google Scholar] [CrossRef]
- Nicholson, L.I.; Benn, D.I. Calculating ice melt beneath a debris layer using meteorological data. J. Glaciol. 2006, 52, 463–470. [Google Scholar] [CrossRef] [Green Version]
- Nicholson, L.; Benn, D.I. Properties of Natural Supraglacial Debris in Relation to Modelling Sub-debris Ice Ablation. Earth Surf. Process. Landf. 2013, 38, 490–501. [Google Scholar] [CrossRef]
- Reid, T.; Brock, B. Assessing ice-cliff backwasting and its contribution to total ablation of debris-covered Miage glacier, Mont Blanc massif, Italy. J. Glaciol. 2014, 60, 3–13. [Google Scholar] [CrossRef] [Green Version]
- Shahgedanova, M.; Stokes, C.R.; Gurney, S.D.; Popovnin, V.V. Interactions between mass balance, atmospheric circulation and recent climate change on the Djankuat Glacier, Caucasus Mountains, Russia. J. Geophys. Res. Atmos. 2005, 110, D04108. [Google Scholar] [CrossRef]
- Toropov, P.A.; Aleshina, M.A.; Grachev, A.M. Large-scale climatic factors driving glacier recession in the Greater Caucasus, 20th–21st century. Int. J. Climatol. 2019, 39, 4703–4720. [Google Scholar] [CrossRef]
- Toropov, P.A.; Mikhalenko, V.N.; Kutuzov, S.S.; Morozova, P.A.; Shestakova, A.A. Temperature and radiation regime of glaciers on slopes of the Mount Elbrus in the ablation period over last 65 years. Ice Snow 2016, 1, 5–19. [Google Scholar] [CrossRef]
- Kutuzov, S.; Shahgedanova, M.; Mikhalenko, V.; Ginot, P.; Lavrentiev, I.; Kemp, S. High-resolution provenance of desert dust deposited on Mt. Elbrus, Caucasus in 2009–2012 using snow pit and firn core records. Cryosphere 2013, 7, 1481–1498. [Google Scholar] [CrossRef] [Green Version]
- Dumont, M.; Tuzet, F.; Gascoin, S.; Picard, G.; Kutuzov, S.; Lafaysse, M.; Cluzet, B.; Nheili, R.; Painter, T.H. Accelerated snow melt in the Russian Caucasus mountains after the Saharan dust outbreak in March 2018. J. Geophys. Res. Earth Surf. 2020, 125, e2020JF005641. [Google Scholar] [CrossRef]
Figure 1.
Glacier extent in 2014 in the Greater Caucasus according to the main river basins. Green circles correspond to changes in glacier surface mass balance (m w.e. a−1) according to individual river basins. See also Table A1 to compare mass balance data relative to all river basins.
Figure 1.
Glacier extent in 2014 in the Greater Caucasus according to the main river basins. Green circles correspond to changes in glacier surface mass balance (m w.e. a−1) according to individual river basins. See also Table A1 to compare mass balance data relative to all river basins.

Figure 2.
Location of Djankuat (a) and Elbrus (b) glaciers. Glaciers with blue colour from the Elbrus Massif were used for further comparison (see Chapter 4.2). SPOT image 2019 and ALOS PALSAR DEM was used as a background. See also Figure 1 for relative location of these glaciers to the Greater Caucasus.

Figure 3.
Mean annual geodetic mass balance (m w.e. a−1) and cumulative mass balance (m w.e.) for all Caucasus glaciers in 2000–2019.
Figure 3.
Mean annual geodetic mass balance (m w.e. a−1) and cumulative mass balance (m w.e.) for all Caucasus glaciers in 2000–2019.

Figure 4.
Boxplots based on data of the individual glaciers showing changes in glacier annual geodetic mass balance (m w.e. a−1) for all Caucasus glaciers according to the regions (western, central, and eastern), slopes (northern, southern, entire) and countries in 2000–2010 (blue), 2010–2019 (brown), and 2000–2019 (grey). Box gives lower and upper quartiles (vertical stems) along with the mean (black horizontal line inside of the box) and median (X symbol inside of the box) value of glacier mass change rate. The circles correspond to the outliers.

Figure 5.
Changes in mean annual geodetic mass balance (m w.e. a−1) (color coded) for western (a), central (b), and eastern (c) Greater Caucasus glaciers in 2000–2019.
Figure 5.
Changes in mean annual geodetic mass balance (m w.e. a−1) (color coded) for western (a), central (b), and eastern (c) Greater Caucasus glaciers in 2000–2019.

Figure 6.
Changes in mean annual mass balance (m w.e. a−1) vs. mean and minimum elevation according to the aspect (a) and seven size classes (b) for all Caucasus glaciers in 2000–2019. Vertical stems show an uncertainty estimation of the mean values.
Figure 6.
Changes in mean annual mass balance (m w.e. a−1) vs. mean and minimum elevation according to the aspect (a) and seven size classes (b) for all Caucasus glaciers in 2000–2019. Vertical stems show an uncertainty estimation of the mean values.

Figure 7.
Changes in mean annual mass balance (m w.e. a−1) for debris-free (a) and debris-covered (b) glaciers vs. terminus elevation in 2000–2019. Red dots indicate the terminus elevation of each glacier. Vertical stems show an uncertainty estimation of the mean values.
Figure 7.
Changes in mean annual mass balance (m w.e. a−1) for debris-free (a) and debris-covered (b) glaciers vs. terminus elevation in 2000–2019. Red dots indicate the terminus elevation of each glacier. Vertical stems show an uncertainty estimation of the mean values.

Figure 8.
Comparison of mean annual mass balance (m w.e. a−1) (a) and cumulative mass balance (m w.e.) (b) for Djankuat Glacier using glaciological (blue) [20] and geodetic (brown) [3] methods. The light gray color corresponds to the uncertainty of the geodetic method. Comparison of mean annual mass changes (m w.e. a−1) for Elbrus glaciers using geodetic methods (c) by Kutuzov et al. (2019) [27] (blue) and Hugonnet et al. (2021) (brown) [3]. Vertical stems on panel c show an uncertainty estimation of the mean values.

Figure 9.
Mean annual May-September air temperatures (a) and sum of the October–April precipitation (b) at the Terskol and Mestia meteorological stations over the last twenty years. The dotted lines are the trend showing a temperature/precipitation course with time.
Figure 9.
Mean annual May-September air temperatures (a) and sum of the October–April precipitation (b) at the Terskol and Mestia meteorological stations over the last twenty years. The dotted lines are the trend showing a temperature/precipitation course with time.

Figure 10.
Change in mean annual geodetic mass balance (m w.e. a−1) as a function of mean elevation (m a.s.l.) in western (a), central (b), and eastern (c) Greater Caucasus between 2000 and 2019. Elevation bands in 200 m. Vertical stems show an uncertainty estimation of the mean values.
Figure 10.
Change in mean annual geodetic mass balance (m w.e. a−1) as a function of mean elevation (m a.s.l.) in western (a), central (b), and eastern (c) Greater Caucasus between 2000 and 2019. Elevation bands in 200 m. Vertical stems show an uncertainty estimation of the mean values.

Figure 11.
Average May–September monthly air temperatures for the Terskol meteorological station in 2000–2009 and 2010–2018 (a) and for the Mestia meteorological station in 2000–2009 and 2010–2015 (b); Sum of the October–April precipitation for the Terskol meteorological station in 2000–2009 and 2010–2017 (c) and for the Mestia meteorological station in 2000–2009 and 2010–2014 (d).

Figure 12.
Khasankoi glaciers (north-western Greater Caucasus) during the late summer without snowlines. Sentinel 2B image (04/09/2020) is used as a background.
Figure 12.
Khasankoi glaciers (north-western Greater Caucasus) during the late summer without snowlines. Sentinel 2B image (04/09/2020) is used as a background.

Table 1.
Mean monthly air temperatures (°C) for the Terskol and Mestia meteorological stations.
| Jan | Feb | Mar | Apr | May | Jun | Jul | Aug | Sep | Oct | Nov | Dec | |
|---|---|---|---|---|---|---|---|---|---|---|---|---|
| Terskol | ||||||||||||
| 2000–2009 | −8.6 | −7.3 | −3.3 | 1.2 | 6.4 | 10.2 | 12.9 | 12.4 | 8.5 | 4.0 | −2.1 | −6.4 |
| 2010–2018 | −6.7 | −5.4 | −2.1 | 2.0 | 7.5 | 11.1 | 13.4 | 12.9 | 9.2 | 3.8 | −1.8 | −5.1 |
| Change | 2.0 | 1.9 | 1.1 | 0.8 | 1.1 | 0.9 | 0.6 | 0.5 | 0.6 | −0.2 | 0.3 | 1.3 |
| Mestia | ||||||||||||
| 2000–2009 | −5.9 | −3.3 | 0.1 | 5.4 | 10.4 | 13.7 | 16.7 | 16.7 | 12.6 | 8.1 | 1.3 | −4.0 |
| 2010–2015 | −3.7 | −2.6 | 0.7 | 5.6 | 11.5 | 14.9 | 17.4 | 17.4 | 13.2 | 7.6 | 2.7 | −2.9 |
| Change | 2.2 | 0.6 | 0.6 | 0.2 | 1.1 | 1.2 | 0.7 | 0.7 | 0.6 | −0.5 | 1.3 | 1.2 |
Table 2.
Sum of the monthly precipitation (mm) for the Terskol meteorological station in 2000–2009 and 2010-2017, and for the Mestia meteorological station in 2000–2009 and 2010–2014.
Table 2.
Sum of the monthly precipitation (mm) for the Terskol meteorological station in 2000–2009 and 2010-2017, and for the Mestia meteorological station in 2000–2009 and 2010–2014.
| Jan | Feb | Mar | Apr | May | Jun | Jul | Aug | Sep | Oct | Nov | Dec | |
|---|---|---|---|---|---|---|---|---|---|---|---|---|
| Terskol | ||||||||||||
| 2000–2009 | 530.1 | 692.7 | 1144.9 | 1005.2 | 1019.2 | 994.9 | 1089.0 | 929.7 | 1063.2 | 1167.4 | 807.0 | 568.0 |
| 2010–2017 | 584.4 | 211.1 | 531.2 | 815.6 | 834.1 | 735.4 | 738.8 | 810.9 | 798.2 | 794.4 | 331.1 | 413.0 |
| Change | 54.3 | −481.6 | −613.7 | −189.6 | −185.1 | −259.5 | −350.2 | −118.8 | −265.0 | −373.0 | −475.9 | −155.0 |
| Mestia | ||||||||||||
| 2000–2009 | 623 | 833.5 | 1150.8 | 1030.9 | 1058.2 | 974.7 | 927.8 | 945 | 930.2 | 1145.9 | 714.6 | 725.7 |
| 2010–2014 | 279.5 | 386.4 | 462.5 | 441.8 | 548.9 | 634.4 | 518.4 | 478.3 | 608.1 | 800.8 | 276.4 | 172.4 |
| Change | −343.5 | −447.1 | −688.3 | −589.1 | −509.3 | −340.3 | −409.4 | −466.7 | −322.1 | −345.1 | −438.2 | −553.3 |
Publisher’s Note: MDPI stays neutral with regard to jurisdictional claims in published maps and institutional affiliations. |
© 2022 by the authors. Licensee MDPI, Basel, Switzerland. This article is an open access article distributed under the terms and conditions of the Creative Commons Attribution (CC BY) license (https://creativecommons.org/licenses/by/4.0/).
Share and Cite
MDPI and ACS Style
Tielidze, L.G.; Jomelli, V.; Nosenko, G.A. Analysis of Regional Changes in Geodetic Mass Balance for All Caucasus Glaciers over the Past Two Decades. Atmosphere 2022, 13, 256. https://doi.org/10.3390/atmos13020256
AMA Style
Tielidze LG, Jomelli V, Nosenko GA. Analysis of Regional Changes in Geodetic Mass Balance for All Caucasus Glaciers over the Past Two Decades. Atmosphere. 2022; 13(2):256. https://doi.org/10.3390/atmos13020256
Chicago/Turabian StyleTielidze, Levan G., Vincent Jomelli, and Gennady A. Nosenko. 2022. "Analysis of Regional Changes in Geodetic Mass Balance for All Caucasus Glaciers over the Past Two Decades" Atmosphere 13, no. 2: 256. https://doi.org/10.3390/atmos13020256
Note that from the first issue of 2016, this journal uses article numbers instead of page numbers. See further details here.