
Air Quality during New Year’s Eve: A Biomonitoring Study with Moss


1
Institute of Biology, University of Opole, 45-022 Opole, Poland
2
Institute of Environmental Engineering and Biotechnology, University of Opole, 45-032 Opole, Poland
*
Authors to whom correspondence should be addressed.
Atmosphere 2021, 12(8), 975; https://doi.org/10.3390/atmos12080975
Submission received: 6 July 2021
/
Revised: 23 July 2021
/
Accepted: 26 July 2021
/
Published: 29 July 2021
(This article belongs to the Special Issue Air Quality in Poland)
Abstract
:Mosses are one of the best bioindicators in the assessment of atmospheric aerosol pollution by heavy metals. Studies using mosses allow both short- and long-term air quality monitoring. The increasing contamination of the environment (including air) is causing a search for new, cheap and effective methods of monitoring its condition. Once such method is the use of mosses in active biomonitoring. The aim of the study was to assess the atmospheric aerosol pollution with selected heavy metals (Ni, Cu, Zn, Cd, Hg and Pb) from the smoke of fireworks used during New Year’s Eve in the years 2019/2020 and 2020/2021. In studies a biomonitoring moss-bag method with moss Pleurozium schreberi (Willd. ex Brid.) Mitt. genus Pleurozium was used. The research was conducted in the town Prószków (5 km in south direction from Opole, opolskie voivodship, Poland). The moss was exposed 14 days before 31 December (from 17 to 30 of December), on New Year’s Eve (31 December and 1 January) and 2 weeks after the New Year (from 2–15 January). Higher concentrations of analysed elements were determined in samples exposed during New Year’s Eve. Increases in concentrations were demonstrated by analysis of the Relative Accumulation Factor (RAF). The results indicate that the use of fireworks during New Year’s Eve causes an increase in air pollution with heavy metals. In addition, it was shown that the COVID-19 induced restrictions during New Year’s Eve 2020 resulted in a reduction of heavy metal content in moss samples and thus in lower atmospheric aerosol pollution with these analytes. The study confirmed moss usefulness in monitoring of atmospheric aerosol pollution from point sources.
1. Introduction
Air quality in Poland is one of the most important research topics concerning atmospheric aerosol pollution [1,2,3]. Special attention is given to air pollution by heavy metals and particulate matter (PM) in areas of high exposure and smog [4,5,6,7,8]. The main causes of poor air quality in Poland include: quality of heating systems used in households [8,9,10,11] and emissions generated by vehicular traffic [8,10,11].
Among the different types of pollutants involved in the overall atmospheric aerosol contamination, short-lasting but active point sources of pollution should also be considered [12,13], which include fireworks shows [14]. This is one of the most unusual sources of air pollution, which has been investigated quite frequently and on a large scale in the literature [15,16,17] which allows the identification of specific pollutants related only to the burning of fireworks [18,19]. Although the show associated with the New Year celebrations only takes place once a year, it has a very significant impact on the air quality. The environmental pollution burden is enormous in terms of sudden increases in pollution by selected heavy metals, PM of various fractions and also negative health effects [18,20].
People’s activity related to celebrating the New Year in such a way causes that, along with the increase of social awareness of the bad condition of the environment (including the atmosphere), people ′′run away′′ from polluted places and move, if only for a short time, to places where the air quality is better [21]. This choice is made possible by increasingly better ways of predicting and forecasting air pollution, based for example on various types of air pollution indices (APIs) [22]. Such methods are also used in the air pollution mathematical model for comparison with moss biomonitoring results [23]. This biological method of environmental assessment is becoming increasingly competitive with instrumental methods for measuring environmental pollution [24], but due to its lack of referenceability in relation to classical measurement methods, it is an object of continuous standardisation and review [25], which does not prevent it from being included in the national system for assessing environmental quality and monitoring pollution [26].
For active biomonitoring studies using mosses, however, it is crucial to use a biomonitor whose (research) value matches its definition [27]. Moss as a biological indicator of air quality is not only a chemical adsorbent [28], but above all a living organism [29], so it is important to control and measure vital parameters during the experiment [30]. Research to date indicates that moss as a biomonitor of air pollution, e.g., heavy metals, is most often used for short exposure periods. Such studies were performed for a minimum of one day [31], several days [32,33] or a week of time [34]. This is mainly related to the fast feedback time about the air condition at the study site [25]. So far, only a laboratory experiment was encountered in the literature [35], in which moss was used as a biomonitor of air quality analytes from fireworks being fired. In the second case, the authors only suspected contamination of the biomonitors due to fireworks being fired [36]. It was used as a space to use in an environmental the use of a moss bioindicator to assess the concentrations of pollutants emitted by fireworks as they are set off on New Year’s Eve under field conditions.
The aim of this study was to measure the concentrations of heavy metals accumulated by the moss Pleurozium schreberi in a town during the fireworks show on New Year’s Eve at the turn of 2 consecutive years. The moss species Pleurozium schreberi has also been shown to be a sensitive biomonitor of point sources of pollution.
2. Materials and Methods
2.1. Materials
The species used for this study was the moss Pleurozium schreberi. It was collected in December 2019 and December 2020 from forests in the Świetokrzyskie voivodship, PL.
2.2. Methods
Moss samples were taken and pretreated before exposure in accordance with the International Cooperative Programme on Effects of Air Pollution on Natural Vegetation (ICP Vegetation) program guidelines for moss species, field sampling and cleaning and storing of moss samples [37]. Before exposure, the mosses were conditioned in demineralised water in accordance with a previously-developed methodology specific for mosses [38]. Then 3 g of mosses (3 samples per period) were packed into nets and exposed at a height of about 1.50–2.00 m from ground level. Mosses were exposed during several study periods: 2 weeks before New Year’s Eve (B) [from 17 to 30 of December], before New Year’s Eve and during New Year’s Eve (B_NYE) [from 17 to 1 January], only on New Year’s Eve for 2 days (NYE) [31 December and 1st January], during New Year’s Eve and 2 weeks after (NYE_Af) [from 31 December to 15 January], only 2 weeks after New Year’s Eve (Af) [from 2–15 January], for the whole experimental period—1 month: from mid-December to mid-January (Al.) [from 17 December to 15 January]. The survey was conducted in 2019/2020 and 2020/2021 in the same periods. Mosses were exposed in the city town of Prószków (15 km south of Opole, opolskie voivodship, PL). Each time, samples were collected and heavy metal concentrations were determined. Photographs of the mosses and exposure site are shown in Figure 1.
To determine the heavy metals (Ni, Cu, Zn, Cd and Pb), each moss sample, with a mass of 1.000 ± 0.001 g dry mass (d.m.), was mineralised in a mixture of HNO3 and H2O2 using a Speedwave Four microwave oven (Berghof, Eningen, Germany). The mineralisation process was carried out at a temperature of 180 °C. Heavy metals (Ni, Cu, Zn, Cd and Pb) were determined using an atomic absorption flame spectrometer (F-AAS) type iCE 3500 (Thermo Scientific, Grand Island, NY, USA). Concentrations of metals were determined in solution after mineralisation and dilution and were filtered into volumetric flasks of 25 cm3. The results were converted into 1 kg of sample of dry mass (mg/kg d.m.). The concentration of mercury in the samples (0.04 g ± 0.001 g d.m.) was determined with AMA 254 mercury analyzer (Altec Ltd., Prague, Czech Republic). The results were in mg/kg d.m. Measurements were made in 3–5 replicates (control, samples).
The RAF—Relative Accumulation Factor was used to determine increases of concentrations of the analytes in the exposed mosses samples [39].
Chlorophyll fluorescence of photosystem II (PSII) was also measured (but only in the second year of the study) using the modulated portable fluorometer (Opti-Sciences, Hudson, NH, USA). Actual photochemical efficiency (yield) was measured under ambient light [40]. Mosses were collected in the field after each term of exposure separately. In 10 (control) and 15 replicates (samples) actual photochemical efficiency (yield) were determined.
2.3. Quality Control
Table 1 presents the instrumental detection limits (IDL) and instrumental quantification limits (IQL) of the iCE 3500 spectrometer which was used for heavy metals (Ni, Cu, Zn, Cd and Pb) detection. Calibration of the spectrometer was performed with a standard solution (ANALYTIKA Ltd., Prague, Czech Republic). The values of the highest concentrations of the models used for calibration (2 mg/dm3 for Cd, 5 mg/dm3 for Ni, Cu, Zn and Pb) were approved as linear limits to signal dependence on concentration. For mercury, the instrumental detection limits (IDL) and instrumental quantification limits (IQL) of the apparatus are 0.003 ng (0.03 μg Hg/dm3) and 0.01 ng (0.1 μg Hg/dm3) in the test sample, respectively. Calibration of the apparatus was performed with a standard solution (ANALYTIKA Ltd., Prague, Czech Republic) [41].
Table 2 shows the concentrations of heavy metals in certified reference materials BCR-482 lichen, produced at the Institute for Reference Materials and Measurements, Belgium [42].

Table 1.
The instrumental detection limits (IDL) and instrumental quantification limits (IQL) for the iCE 3500 (mg/dm3) spectrometer [43].
Table 1.
The instrumental detection limits (IDL) and instrumental quantification limits (IQL) for the iCE 3500 (mg/dm3) spectrometer [43].
| Metal | IDL | IQL |
|---|---|---|
| Ni | 0.0043 | 0.050 |
| Cu | 0.0045 | 0.033 |
| Zn | 0.0033 | 0.010 |
| Cd | 0.0028 | 0.013 |
| Pb | 0.0130 | 0.070 |
2.4. Statistical Analysis of Data
3. Results
Table 3 shows the statistical parameters of heavy metal concentrations in moss samples.
At least up to the upper quartile Ni content in moss samples was lower than the instrumental quantification limit. Similarly, in most of the samples Cd concentration was lower than the IQL.
The presented metal concentrations in mosses are comparable to those obtained in the woods of Turawa commune in opolskie voivodship [46], although they are low in relation to industrial sites of Upper Silesia [47].
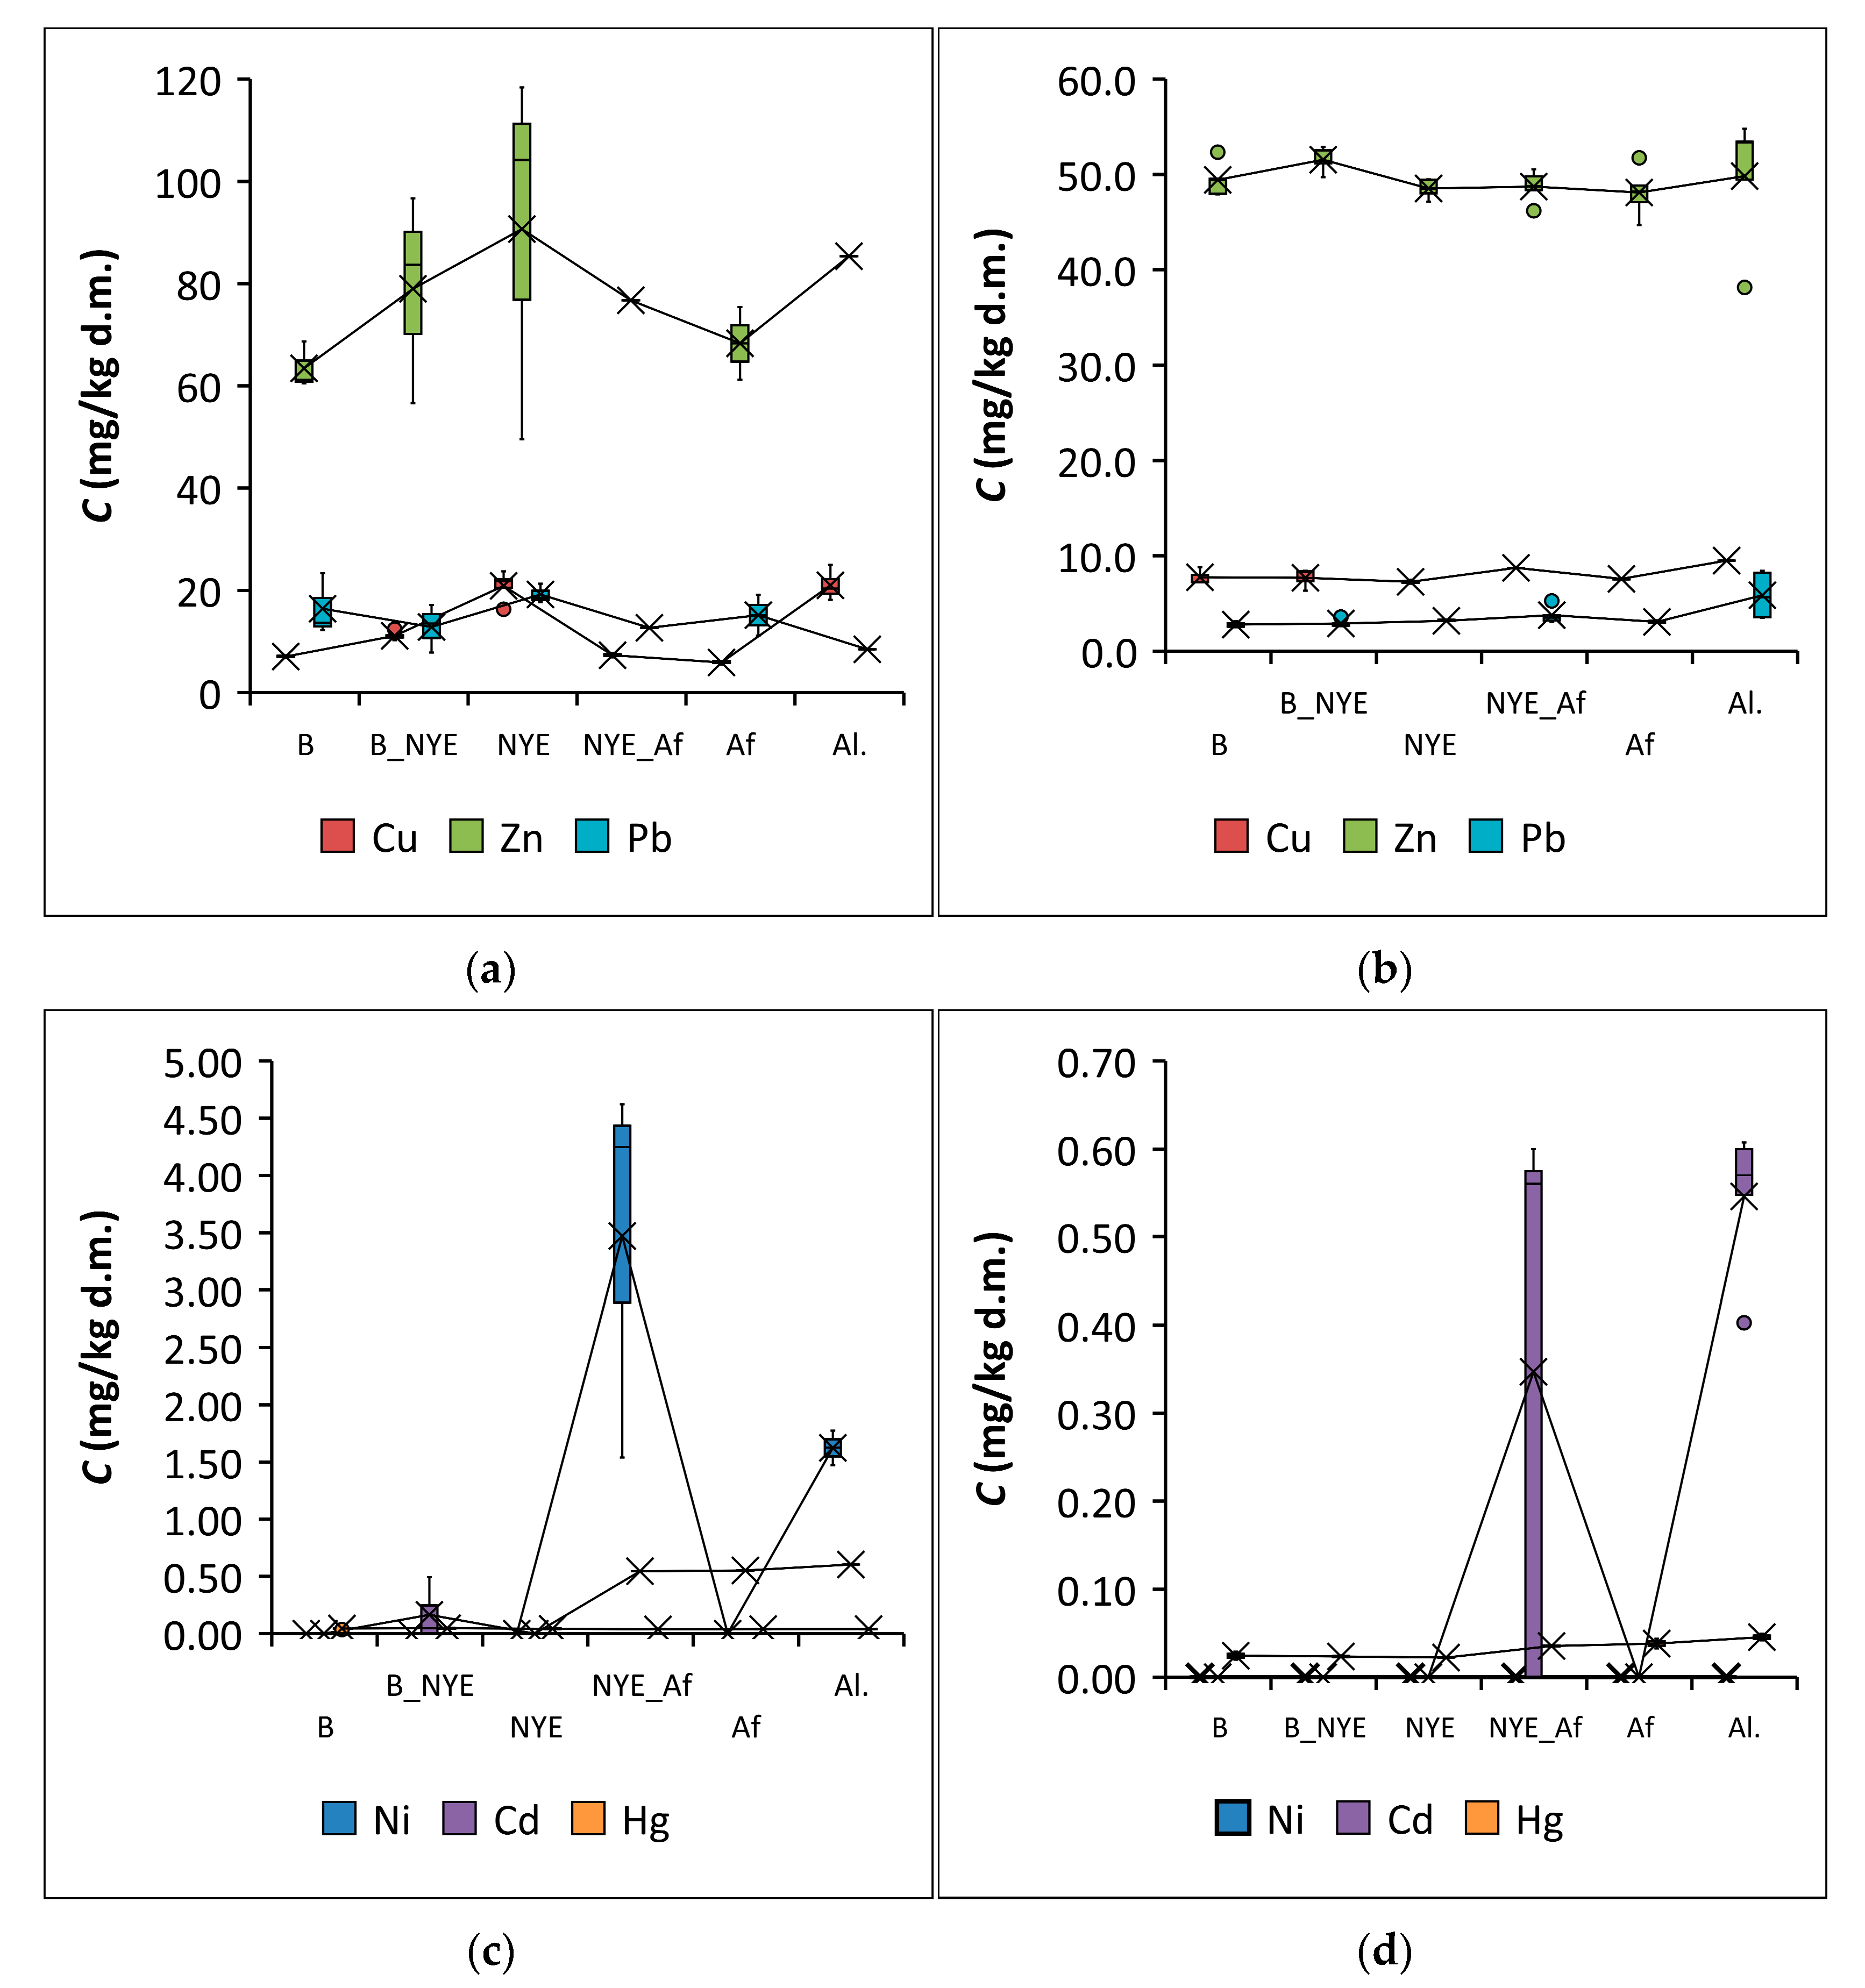
Figure 2a–d shows a comparison of heavy metal concentrations accumulated by mosses over two exposure periods: mid December 2019/mid January 2020 and mid December 2020/mid January 2021. The mean concentrations of determined heavy metals (mg/kg dm) naturally accumulated in mosses exposed during the first year of the study were for: Ni—<1.25, Cu—5.85, Zn—53.5, Cd—<0.325, Hg—0.038, Pb—7.85. and in mosses exposed in the second year of the study were respectively: Ni—<1.25, Cu—6.42, Zn—42.8, Cd—<0.325, Hg—0.019, Pb—2.12.
In Figure 2, it can be seen that heavy metal accumulation by mosses was observed during both study periods. Elemental concentrations from 2019/2020 are higher than for the second study period. For copper, zinc, lead and mercury the values for the “NYE” in 2019/2020 period only were 20.9, 90.7, 19.2, 0.04 mg/kg d.m., respectively, though during the same period in 2020/2021 they were half as high. For nickel and cadmium, depending on the survey year and exposure period, the concentration of these metals in some moss samples was below the limit of quantification of the analytical method used. Additionally, the values for Cu, Zn and Pb for 2019/2020 reach their highest values only during the 2-day “NYE” exposure [31 December and 1 January]. In the following year, the concentrations of these elements are more homogeneous across the different periods of moss exposure.
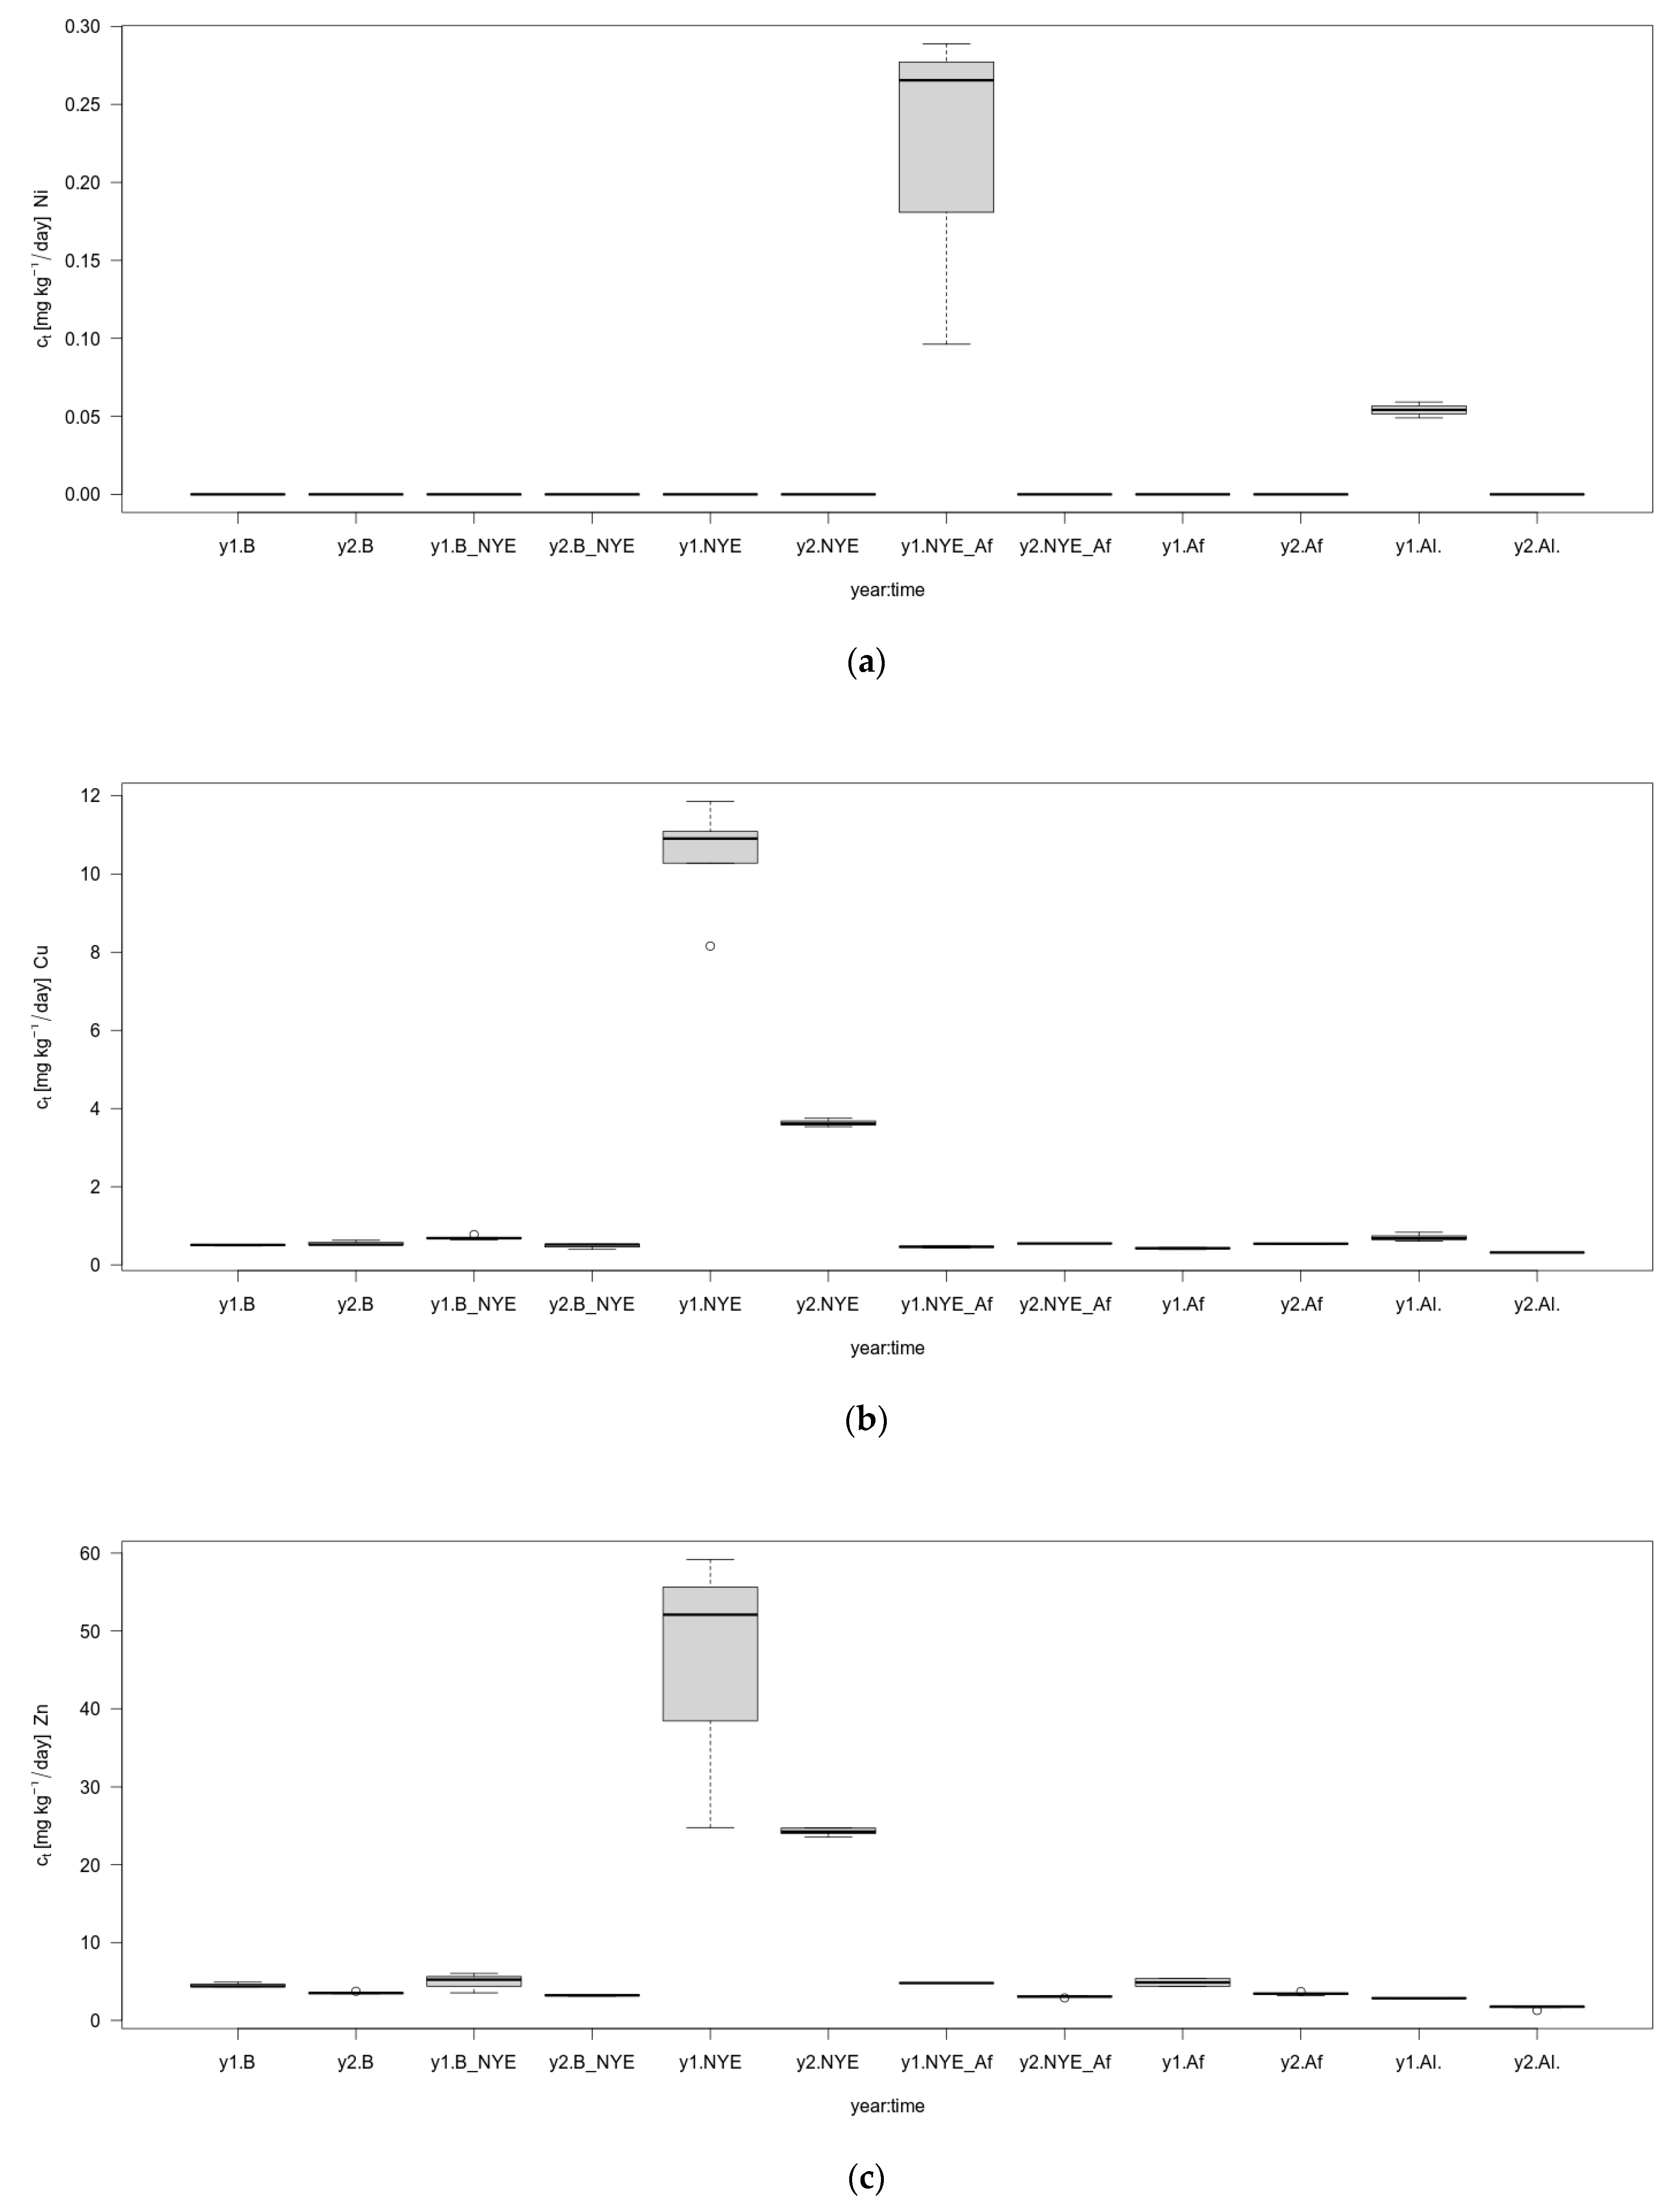
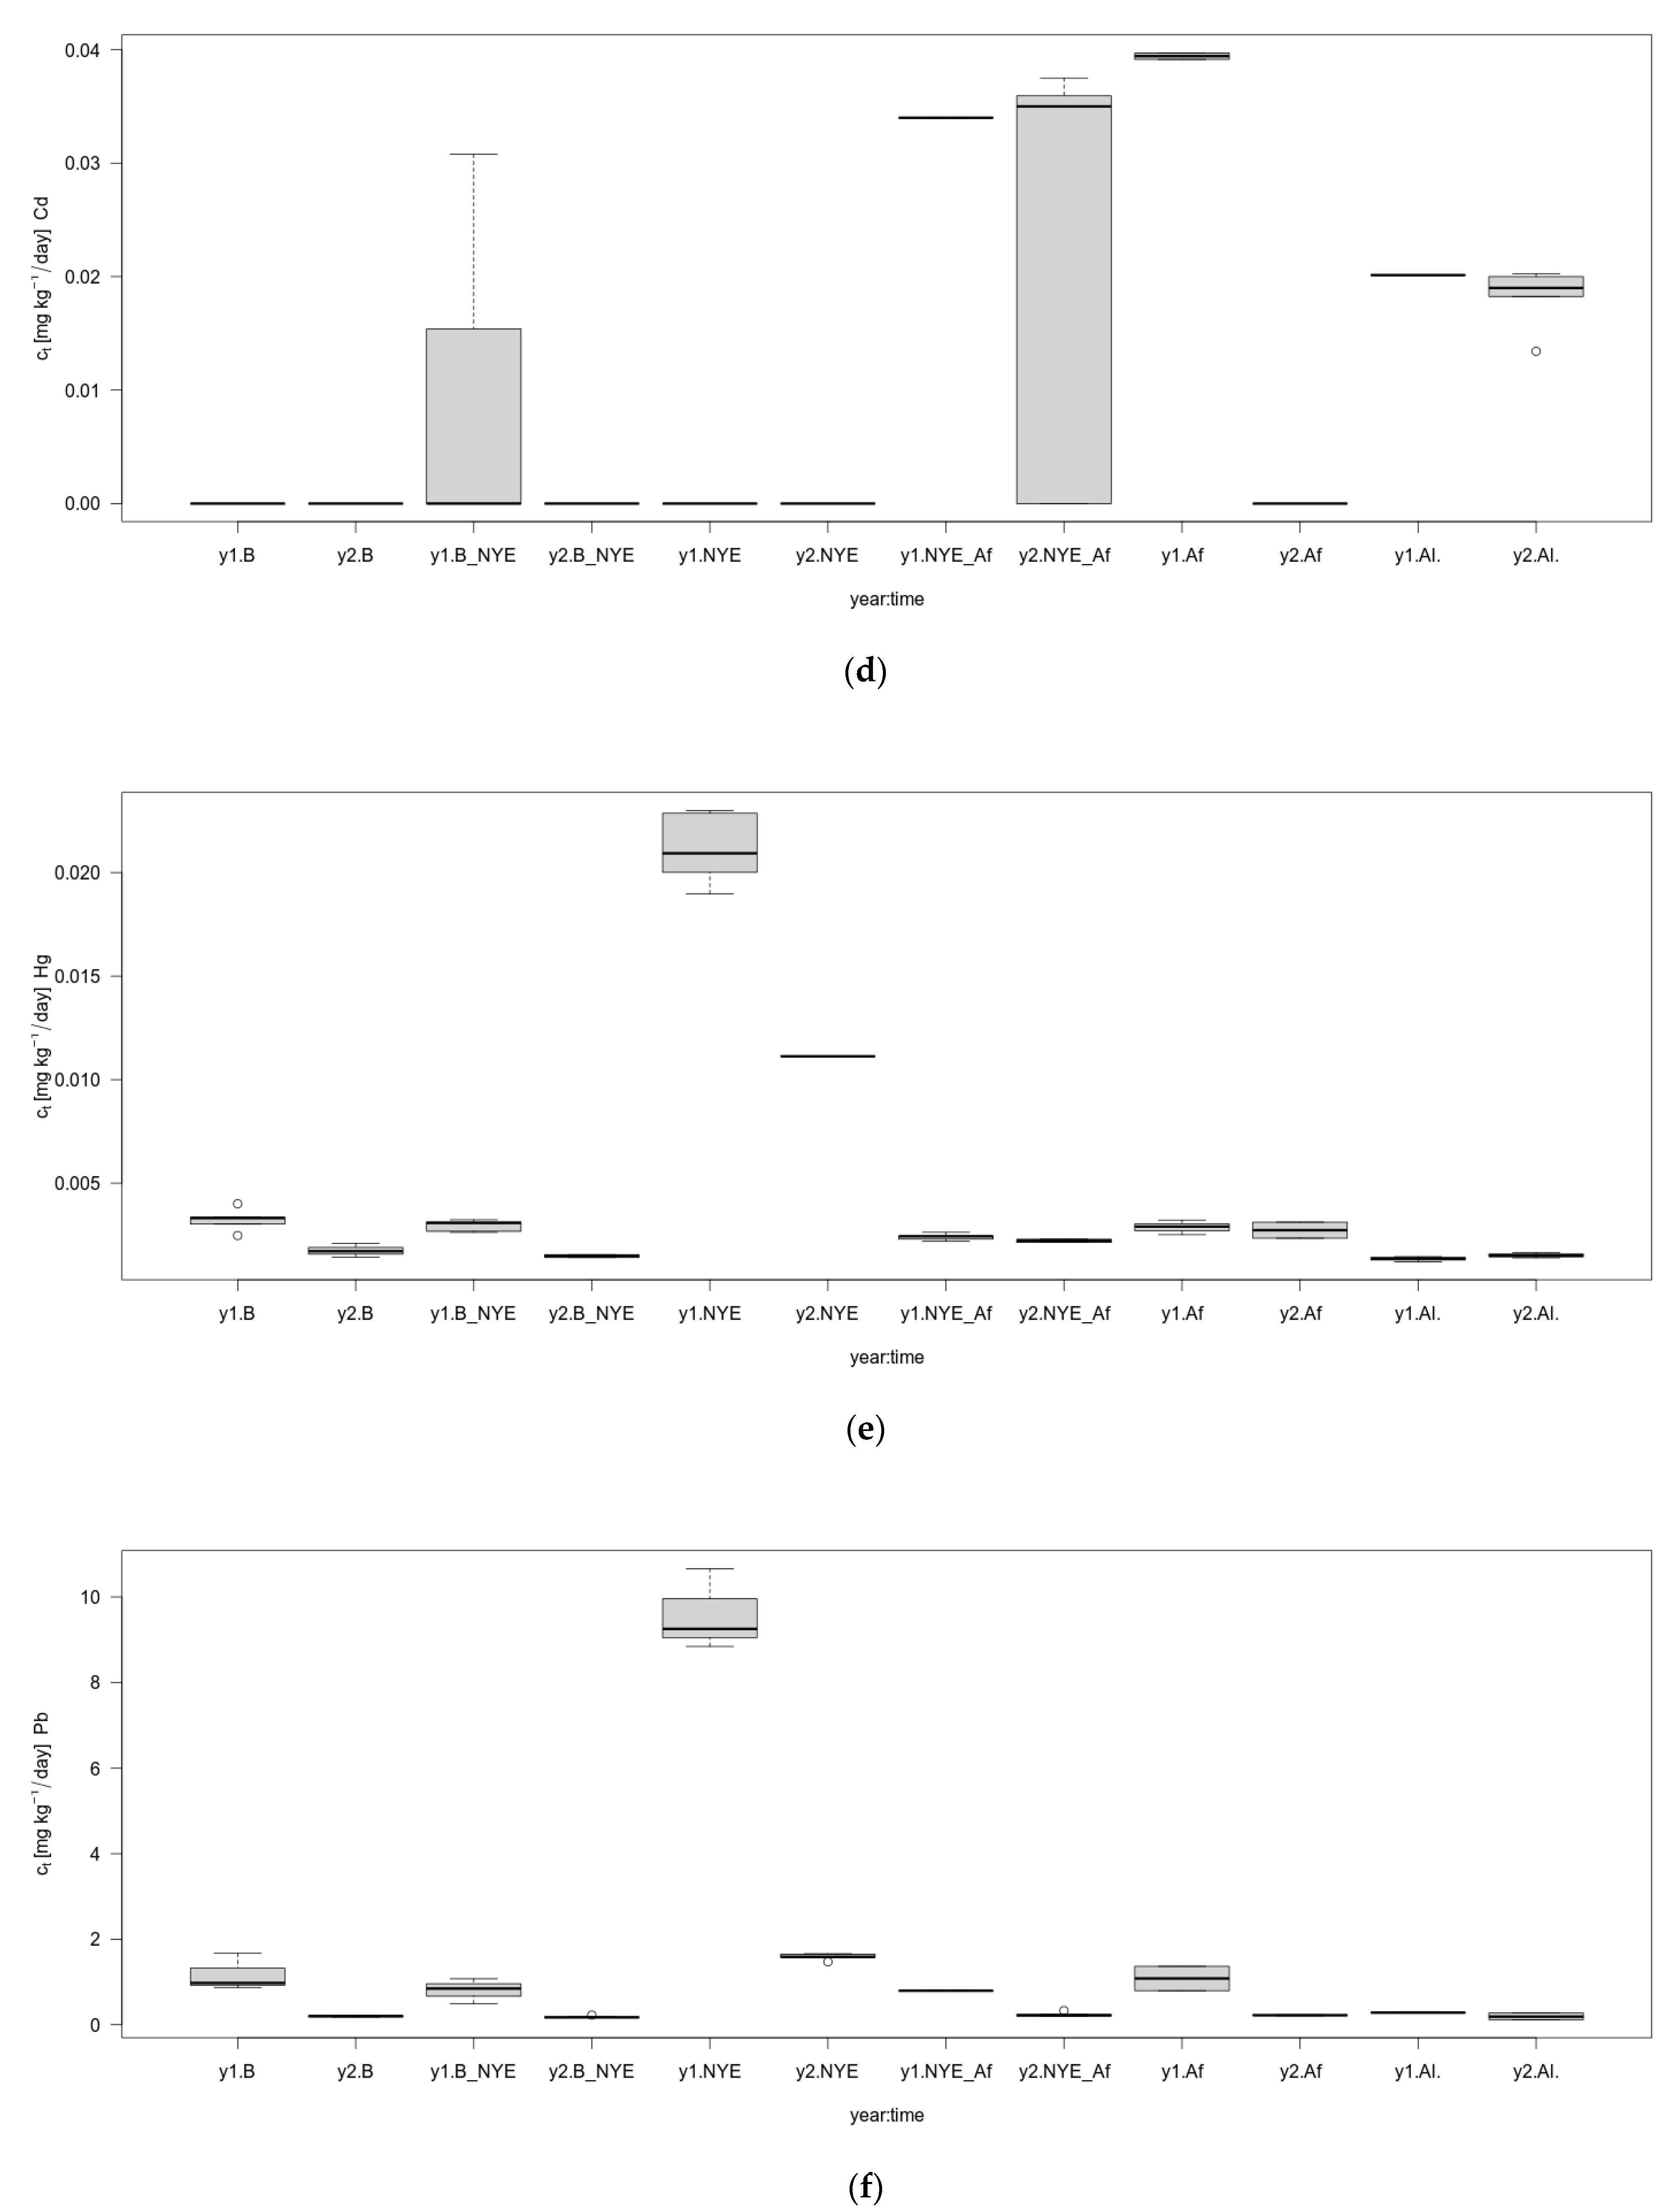
The effect of meteo conditions on heavy metal concentrations in moss samples was also analyzed. The source of data was the Institute of Meteorology and Water Management [48]. During 1st half of both exposure periods an irregular decrease in mean air temperature T was observed. Starting from NYE the mean temperatures did not exhibit a clear trend of changes. At NYE 2019/2020 and 2020/2021 the difference in T was 5.1 °C. It should be noticed that T at 2019/2020 was positive, and negative at 2020/2021. Time patterns of relative air humidity Hr changes were different during exposure periods. The humidity difference at the first and second NYE was 23.5%. In a period from 30 December to 2 January no precipitation was observed at both NYE. Additionally, a few days before and after this period precipitation was poor. During exposure periods wind speed v was in the range 1.0–5.8 m/s. At the two NYE the wind speed difference was 2.6 m/s. In Figure S1 in the supplementary material parameters describing weather conditions during the moss samples exposure are presented. For moss samples duration of deposition was different. To estimate an intensity of the deposition, a ratio ct of chemical elements’ concentration and the deposition time t was calculated. In Figure 3. boxplots of the calculated ct are presented. For the metals studied, clear differences in deposition intensities are observed.
To test uniformity of central values in the grouped ct the Kruskal-Wallis test was used. In calculations the group data were pooled over years 2019–2020. The p-values calculated were 6.4 × 10⁻⁵ (Ni), 4.8 × 10⁻⁵ (Cu), 4.9 × 10⁻⁶ (Zn), 1.0 × 10⁻³ (Cd), 1.7 × 10⁻³ (Pb), and 2.7 × 10⁻⁵ (Hg). For comparisons of median ct in pairs of individual periods the pairwise Wilcoxon test was used. For p-values multiple testing Bonferroni correction was applied. A critical p-value = 0.05 was applied in the test result interpretation.
In Table 4 the p-values calculated in Wilcoxon test for intensity of Ni deposition during the periods studied are presented. Numerous IQL results disables comparison of some groups. Pairs of groups which cannot be compared are marked using “x” symbol. For Cu, Zn, Cd, Pd and Hg, results are included in Tables S1–S5 in the supplementary material).
In all pairs of the periods the null hypothesis cannot be rejected. This conclusion is apparently inconsistent with observation on Figure 3a where cl for NYE_Af and y1 clearly dominates all other periods. But in contrast, ct in NYE_Af and y2 is considerably lower than that during y1, and as a result an effect of NYE_Af become statistically insignificant.
For Cu, Zn, Cd, Pb and Hg deposition intensity in group NYE and deposititions in the remaining groups all p-values were lower than the critical one. This result indicates statistically significant difference between metal deposition intensities during NYE and during the other periods.
In Figure 3, it can be seen that metal concentrations vary considerably between the study periods when relating them to exposure time (number of days). For Cu, Zn, Hg and Pb, concentrations in 2019/2020 for the NYE period significantly exceed the corresponding period in the following year. In the next step of the analysis of the results, the increments in the concentrations of heavy metals accumulated in the mosses were determined. Table 5 shows a summary of the RAF values for both study periods for each element separately.
Due to the fact that in some of the moss samples the concentration of nickel and cadmium was below the limit of quantification of the analytical method used, no RAF increments were noted (n.d.). For the other elements, high RAF values were observed for copper, zinc and lead, especially during the 2019/2020 period. In the ‘NYE’ period itself, RAF values are higher or comparable to other periods where exposure has been longer. The exceptions are cadmium and mercury, where increases are higher after New Year’s Eve and in 2020/2021.
To assess the condition of the mosses during the exposure period, chlorophyll fluorescence was measured (Table 6).
The chlorophyll fluorescence values varied between the study periods. The lowest value was measured in the period before New Year’s Eve and the highest value was observed during the “B_NYE” exposure. Since this period the Photosynthetic Yield of Photo System (II) has decreased by about 64% to “Af”. The sample exposed for the whole time was not statistically significantly different from the control.
4. Discussion
Concentrations of the heavy metals Ni, Cu, Zn, Cd, Pb and Hg, accumulated by Pleurozium schreberi mosses samples differ from each other within and between study periods of a given year. The concentration of individual elements is influenced by the moss species used and their accumulation capacity, exposure time and other environmental factors (interactions among elements, temperature, humidity) [49,50,51]. The changes in concentrations between the two study periods are also due to the global lockdown situation caused by the coronavirus pandemic restrictions. In the literature, one can find results indicating that air pollution has decreased significantly in this period in comparison to the values previously reported [52,53]. The impact of the pandemic on air pollution in terms of biological monitoring has so far been described by only one known publication, where is indicated that concentrations of selected metals accumulated by the moss Pleurozium schreberi, as part of passive biomonitoring studies, decreased by lockdown [54]. Our study confirms the above statements that heavy metal concentrations during the “NYE” period and in 2020/2021 were lower compared to the same period a year earlier (see Figure 3). This was influenced by national restrictions related to the limited possibility of overcrowding and participation in mass events celebrating the New Year, which had an impact on the reduced emissions from fireworks fired. According to the literature, air concentrations of heavy metals such as Cu, Zn and Pb are related to their emission during the fireworks burning [17,18,20,55,56,57] as was also confirmed by this research. During moss exposure for only 2 days (NYE period) [31 December and 1 January], concentrations of these elements were characterised by values comparable or higher to periods of longer exposure to moss contamination with these analytes (see also Figure 3). In our opinion, the results presented here represent the first environmental experiment using the moss-bag technique to determine the concentrations of heavy metals accumulated by mosses during New Year’s Eve (due to fireworks burning), together with the impact of the pandemic on air pollution at this time using active moss biomonitoring.
RAF values higher than 1.00 indicate significant elemental enrichment [58]. Such values were recorded for copper and lead in 2019/2020 and the impact of increases in these elements was related to the fireworks being fired. In contrast, high increments for nickel and mercury may be related to other air pollutants sources such as local, low level emissions [59].
The actual quantum efficiency of PSII photochemistry in the light measures the fraction of the absorbed light energy that is actually being used to drive photochemistry at PSII [60]. Its value is influenced by a number of factors, such as a change in metal concentration [61,62] and a positive effect on the increase in fluorescence yield over the course of the experiment may have been due to variable hydration [63]. The dependence of chlorophyll fluorescence yield variability on water content has been reported previously for Pleurozium moss [64] and our actual quantum yield values of PSII photochemistry were comparable with the results obtained by other authors for this species [65,66]. Due to the association of chlorophyll fluorescence with other vital parameters (chlorophyll content, osmotic indices, antioxidant enzyme activities) [67], we know that biomonitoring studies have been conducted on a living air quality bioindicator [68].
5. Conclusions
The results of the biomonitoring study indicate a variable air quality in the town of Prószków during New Year’s Eve on the example of a two-year study. Increased concentrations of copper, zinc and lead only during the 2-day “NYE” exposure confirm the effect of fired fireworks on the accumulation of these elements in the moss Pleurozium schreberi. This demonstrates the good accumulation capacity of this species for use during short periods of exposure to air pollution. Further research should focus on finding the best moss species for the determination of heavy metals in air from fireworks smoke.
Deposition of metals on moss during and after fireworks show could be affected by weather conditions. During the periods studied, the temperature, humidity, and wind speed were similar but not the same. A common feature at both NYE was no precipitation.
Actually the results of our research did not provide feasible information to estimate an influence of weather conditions on metals′ deposition after fireworks show. Valid conclusions could be drawn from repeated observations. This assertion implies continuation of the research with extension to other than NYE celebrations.
In the literature, the use of classical methods for determination of metals concentration in the air during fireworks show has been already described, but our study confirms the possibility of using bioindicators in air quality monitoring as a complementary method. Biomonitoring studies using the moss-bag method for the determination of other pollutants from fireworks shows should be continued.
In addition, the positive impact of the 2020/2021 lockdown on air pollution from emissions of fireworks launched was demonstrated, which was confirmed by determining lower concentrations of selected heavy metals accumulated by mosses. The practice of welcoming the New Year should change the accepted way of celebrating to one that does not cause deterioration of air quality and further pollution emissions.
Supplementary Materials
The following are available online at https://www.mdpi.com/article/10.3390/atmos12080975/s1, Figure S1: The parameters describing weather conditions during the moss samples exposure. The parameters are daily means of temperature T (in subplot a), relative humidity Hr (subplot b), precipitation h (subplot c) and wind speed v (subplot d), Table S1: The p-values calculated in Wilcoxon test for intensity of Cu deposition during the periods studied, Table S2: The p-values calculated in Wilcoxon test for intensity of Zn deposition during the periods studied, Table S3: The p-values calculated in Wilcoxon test for intensity of Cd deposition during the periods studied, Table S4: The p-values calculated in Wilcoxon test for intensity of Pb deposition during the periods studied, Table S5: The p-values calculated in Wilcoxon test for intensity of Hg deposition during the periods studied.
Author Contributions
Conceptualization, P.Ś.; methodology, P.Ś. and M.R.; validation, M.R. and Z.Z.; formal analysis, P.Ś. and Z.Z.; investigation, P.Ś.; measurements, P.Ś. and M.R.; writing—original draft preparation, P.Ś.; writing—review and editing, M.R. and Z.Z.; visualization, P.Ś. and Z.Z.; supervision, M.R.; project administration, M.R. All authors have read and agreed to the published version of the manuscript.
Funding
This research received no external funding.
Institutional Review Board Statement
Not applicable.
Informed Consent Statement
Not applicable.
Data Availability Statement
The datasets used and/or analyzed during the current study are available from the corresponding author on reasonable request.
Conflicts of Interest
The authors declare no conflict of interest.
References
- Leśniok, M.R.; Caputa, Z.A. The role of atmospheric circulation in air pollution distribution in Katowice Region (Southern Poland). Int. J. Environ. Waste Manag. 2009, 4, 62–74. [Google Scholar] [CrossRef]
- Łowicki, D. Landscape pattern as an indicator of urban air pollution of particulate matter in Poland. Ecol. Indic. 2019, 97, 17–24. [Google Scholar] [CrossRef]
- Tainio, M.; Juda-Rezler, K.; Reizer, M.; Warchałowski, A.; Trapp, W.; Skotak, K. Future climate and adverse health effects caused by fine particulate matter air pollution: Case study for Poland. Reg. Environ. Chang. 2013, 13, 705–715. [Google Scholar] [CrossRef] [Green Version]
- Wielgosinski, G.; Czerwinska, J. Smog Episodes in Poland. Atmosphere 2020, 11, 277. [Google Scholar] [CrossRef] [Green Version]
- Mikrut, M.; Macyk, W.; van Eldik, R.; Stochel, G. Physicochemical analysis of water extracts of particulate matter from polluted air in the area of Kraków, Poland. Atmosphere 2021, 12, 565. [Google Scholar] [CrossRef]
- Traczyk, P.; Gruszecka-Kosowska, A. The condition of air pollution in kraków, poland, in 2005–2020, with health risk assessment. Int. J. Environ. Res. Public Health 2020, 17, 6063. [Google Scholar] [CrossRef]
- Gruszecka-Kosowska, A. Deposited Particulate Matter Enrichment in Heavy Metals and Related Health Risk: A Case Study of Krakow, Poland. Proceedings 2019, 44, 1. [Google Scholar] [CrossRef] [Green Version]
- Wiśniewska, K.; Lewandowska, A.U.; Staniszewska, M. Air quality at two stations (Gdynia and Rumia) located in the region of Gulf of Gdansk during periods of intensive smog in Poland. Air Qual. Atmos. Health 2019, 12, 879–890. [Google Scholar] [CrossRef] [Green Version]
- Kobza, J.; Geremek, M.; Dul, L. Characteristics of air quality and sources affecting high levels of PM10 and PM2.5 in Poland, Upper Silesia urban area. Environ. Monit. Assess. 2018, 190, 1–13. [Google Scholar] [CrossRef] [PubMed] [Green Version]
- Mądziel, M.; Campisi, T.; Jaworski, A.; Tesoriere, G. The Development of Strategies to Reduce Exhaust Emissions from Passenger Cars in Rzeszow City—Poland. A Preliminary Assessment of the Results Produced by the Increase of E-Fleet. Energies 2021, 14, 1046. [Google Scholar] [CrossRef]
- Chambers, S.D.; Podstawczy, A. Improved method for characterising temporal variability in urban air quality part II: Particulate matter and precursors in central Poland. Atmos. Environ. 2019, 219, 117040. [Google Scholar] [CrossRef]
- Jabłońska, M.; Janeczek, J. Identification of industrial point sources of airborne dust particles in an urban environment by a combined mineralogical and meteorological analyses: A case study from the Upper Silesian conurbation, Poland. Atmos. Pollut. Res. 2019, 10, 980–988. [Google Scholar] [CrossRef]
- Baghani, A.N.; Sorooshian, A.; Heydari, M.; Sheikhi, R.; Golbaz, S.; Ashournejad, Q.; Kermani, M.; Golkhorshidi, F.; Barkhordari, A.; Jafari, A.J.; et al. A case study of BTEX characteristics and health effects by major point sources of pollution during winter in Iran. Environ. Pollut. 2019, 247, 607–617. [Google Scholar] [CrossRef]
- Pongpiachan, S.; Iijima, A.; Cao, J. Hazard quotients, hazard indexes, and cancer risks of toxic metals in PM10 during firework displays. Atmosphere 2018, 9, 144. [Google Scholar] [CrossRef] [Green Version]
- Drewnick, F.; Hings, S.S.; Curtius, J.; Eerdekens, G.; Williams, J. Measurement of fine particulate and gas-phase species during the New Year’s fireworks 2005 in Mainz, Germany. Atmos. Environ. 2006, 40, 4316–4327. [Google Scholar] [CrossRef]
- Resmi, C.T.; Nishanth, T.; Satheesh Kumar, M.K.; Balachandramohan, M.; Valsaraj, K.T. Temporal changes in air quality during a festival season in Kannur, India. Atmosphere 2019, 10, 137. [Google Scholar] [CrossRef] [Green Version]
- Tanda, S.; Ličbinský, R.; Hegrová, J.; Goessler, W. Impact of New Year’s Eve fireworks on the size resolved element distributions in airborne particles. Environ. Int. 2019, 128, 371–378. [Google Scholar] [CrossRef] [PubMed]
- Wang, Y.; Zhuang, G.; Xu, C.; An, Z. The air pollution caused by the burning of fireworks during the lantern festival in Beijing. Atmos. Environ. 2007, 41, 417–431. [Google Scholar] [CrossRef]
- Hu, X.; Yin, Y.; Duan, L.; Wang, H.; Song, W.; Xiu, G. Temporal and spatial variation of PM2.5 in Xining, Northeast of the Qinghai-Xizang (Tibet) Plateau. Atmosphere 2020, 11, 953. [Google Scholar] [CrossRef]
- Vecchi, R.; Bernardoni, V.; Cricchio, D.; D’Alessandro, A.; Fermo, P.; Lucarelli, F.; Nava, S.; Piazzalunga, A.; Valli, G. The impact of fireworks on airborne particles. Atmos. Environ. 2008, 42, 1121–1132. [Google Scholar] [CrossRef]
- Chen, S.; Chen, Y.; Lei, Z.; Tan-Soo, J.S. Impact of air pollution on short-term movements: Evidence from air travels in China. J. Econ. Geogr. 2021, 20, 939–968. [Google Scholar] [CrossRef]
- Đurić, M.; Vujović, D. Short-term forecasting of air pollution index in Belgrade, Serbia. Meteorol. Appl. 2020, 27, 1–15. [Google Scholar] [CrossRef]
- Svozilík, V.; Krakovská, A.S.; Bitta, J.; Jančík, P. Comparison of the Air Pollution Mathematical Model of PM 10 and Moss Biomonitoring Results in the Tritia Region. Atmosphere 2021, 12, 656. [Google Scholar] [CrossRef]
- Vuković, G.; Aničić Uroševic, M.; Razumenić, I.; Kuzmanoski, M.; Pergal, M.; Škrivanj, S.; Popović, A. Air quality in urban parking garages (PM10, major and trace elements, PAHs): Instrumental measurements vs. active moss biomonitoring. Atmos. Environ. 2013, 85, 31–40. [Google Scholar] [CrossRef]
- Ares, A.; Aboal, J.R.; Carballeira, A.; Giordano, S.; Adamo, P.; Fernández, J.A. Moss bag biomonitoring: A methodological review. Sci. Total Environ. 2012, 432, 143–158. [Google Scholar] [CrossRef]
- Ștefănuț, S.; Öllerer, K.; Manole, A.; Ion, M.C.; Constantin, M.; Banciu, C.; Maria, G.M.; Florescu, L.I. National environmental quality assessment and monitoring of atmospheric heavy metal pollution—A moss bag approach. J. Environ. Manag. 2019, 248, 109224. [Google Scholar] [CrossRef] [PubMed]
- Markert, B. From biomonitoring to integrated observation of the environment—The multi-markered bioindication concept. Ecol. Chem. Eng. 2008, 15, 315–333. [Google Scholar]
- Boquete, M.T.; Aboal, J.R.; Carballeira, A.; Fernández, J.A. Do mosses exist outside of Europe? A biomonitoring reflection. Sci. Total Environ. 2017, 593, 567–570. [Google Scholar] [CrossRef]
- Tretiach, M.; Adamo, P.; Bargagli, R.; Baruffo, L.; Carletti, L.; Crisafulli, P.; Giordano, S.; Modenesi, P.; Orlando, S.; Pittao, E. Lichen and moss bags as monitoring devices in urban areas. Part I: Influence of exposure on sample vitality. Environ. Pollut. 2007, 146, 380–391. [Google Scholar] [CrossRef] [PubMed]
- Capozzi, F.; Sorrentino, M.C.; Di Palma, A.; Mele, F.; Arena, C.; Adamo, P.; Spagnuolo, V.; Giordano, S. Implication of vitality, seasonality and specific leaf area on PAH uptake in moss and lichen transplanted in bags. Ecol. Indic. 2020, 108, 105727. [Google Scholar] [CrossRef]
- Cesa, M.; Nimis, P.L.; Buora, C.; Lorenzonetto, A.; Pozzobon, A.; Raris, M.; Rosa, M.; Salvadori, M. Moss bags as sentinels for human safety in mercury-polluted groundwaters. Environ. Sci. Pollut. Res. 2014, 21, 6714–6722. [Google Scholar] [CrossRef]
- Arndt, J.; Planer-Friedrich, B. Moss bag monitoring as screening technique to estimate the relevance of methylated arsine emission. Sci. Total Environ. 2018, 610, 1590–1594. [Google Scholar] [CrossRef]
- Debén, S.; Fernández, J.A.; Carballeira, A.; Aboal, J.R. Using devitalized moss for active biomonitoring of water pollution. Environ. Pollut. 2016, 210, 315–322. [Google Scholar] [CrossRef] [PubMed]
- Cesa, M.; Bertossi, A.; Cherubini, G.; Gava, E.; Mazzilis, D.; Piccoli, E.; Verardo, P.; Nimis, P.L. Development of a standard protocol for monitoring trace elements in continental waters with moss bags: Inter- and intraspecific differences. Environ. Sci. Pollut. Res. 2015, 22, 5030–5040. [Google Scholar] [CrossRef]
- Bowden, J.A.; Nocito, B.A.; Lowers, R.H.; Guillette, L.J.; Williams, K.R.; Young, V.Y. Environmental indicators of metal pollution and emission: An experiment for the instrumental analysis laboratory. J. Chem. Educ. 2012, 89, 1057–1060. [Google Scholar] [CrossRef]
- Içel, Y.; Çobanoǧlu, G. Biomonitoring of atmospheric heavy metal pollution using lichens and mosses in the city of Istanbul, Turkey. Fresenius Environ. Bull. 2009, 18, 2066–2071. [Google Scholar]
- ICP Vegetation. Heavy Metals, Nitrogen and Pops in European Mosses: 2020 Survey. 2020. Available online: https://icpvegetation.ceh.ac.uk/sites/default/files/ICP%20Vegetation%20moss%20monitoring%20manual%202020.pdf (accessed on 27 July 2021).
- Świsłowski, P.; Kosior, G.; Rajfur, M. The influence of preparation methodology on the concentrations of heavy metals in Pleurozium schreberi moss samples prior to use in active biomonitoring studies. Environ. Sci. Pollut. Res. 2021, 28, 10068–10076. [Google Scholar] [CrossRef]
- Zinicovscaia, I.; Urošević, M.A.; Vergel, K.; Vieru, E.; Frontasyeva, M.V.; Povar, I.; Duca, G. Active Moss Biomonitoring of Trace Elements Air Pollution in Chisinau, Republic of Moldova. Ecol. Chem. Eng. 2018, 25, 361–372. [Google Scholar] [CrossRef] [Green Version]
- Šraj Kržič, N.; Gaberščik, A. Photochemical efficiency of amphibious plants in an intermittent lake. Aquat. Bot. 2005, 83, 281–288. [Google Scholar] [CrossRef]
- Rajfur, M.; Kłos, A.; Wacławek, M. Kinetyka sorpcji jonów Hg2+ Na glonach Spirogyra sp. (kinetics of Hg2+ ions sorption on algae Spirogyra sp.). Proc. ECOpole 2011, 5, 589–594. [Google Scholar]
- Kłos, A.; Ziembik, Z.; Rajfur, M.; Dołhańczuk-Sródka, A.; Bochenek, Z.; Bjerke, J.W.; Tømmervik, H.; Zagajewski, B.; Ziółkowski, D.; Jerz, D.; et al. The Origin of Heavy Metals and Radionuclides Accumulated in the Soil and Biota Samples Collected in Svalbard, Near Longyearbyen. Ecol. Chem. Eng. 2017, 24, 223–228. [Google Scholar] [CrossRef] [Green Version]
- Thermo Fisher Scientific Inc. iCE 3000 Series AA Spectrometers Operator’s Manual. Available online: http://photos.labwrench.com/equipmentManuals/9291-6306.pdf (accessed on 28 July 2021).
- Gibbons, J.D.; Chakraborti, S. Nonparametric Statistical Inference, Revised and Expanded, 4th ed.; CRC Press: Boca Raton, FL, USA, 2014; ISBN 0203911563. [Google Scholar]
- R Core Team. R: A Language and Environment for Statistical Computing; R Core Team: Vienna, Austria, 2021. [Google Scholar]
- Słonina, N.; Świsłowski, P.; Rajfur, M. Passive and active biomonitoring of atmospheric aerosol with the use of mosses. The research methodology. Ecol. Chem. Eng. 2021, 28, 163–172. [Google Scholar]
- Kosior, G.; Samecka-Cymerman, A.; Kolon, K.; Kempers, A.J. Bioindication capacity of metal pollution of native and transplanted Pleurozium schreberi under various levels of pollution. Chemosphere 2010, 81, 321–326. [Google Scholar] [CrossRef]
- Institute of Meteorology and Water Management. Available online: https://dane.imgw.pl (accessed on 27 July 2021).
- Motyka, O.; Macečková, B.; Seidlerová, J.; Krejčí, B. Environmental factors affecting trace metal accumulation in two moss species. Carpath. J. Earth Environ. Sci. 2015, 10, 57–63. [Google Scholar]
- Samecka-Cymerman, A.; Kosior, G.; Kolon, K.; Wojtuń, B.; Zawadzki, K.; Rudecki, A.; Kempers, A.J. Pleurozium schreberi as bioindicator of mercury pollution in heavily industrialized region. J. Atmos. Chem. 2013, 70, 105–144. [Google Scholar] [CrossRef] [Green Version]
- Cesa, M.; Campisi, B.; Bizzotto, A.; Ferraro, C.; Fumagalli, F.; Nimis, P.L. A factor influence study of trace element bioaccumulation in moss bags. Arch. Environ. Contam. Toxicol. 2008, 55, 386–396. [Google Scholar] [CrossRef]
- Giani, P.; Castruccio, S.; Anav, A.; Howard, D.; Hu, W.; Crippa, P. Short-term and long-term health impacts of air pollution reductions from COVID-19 lockdowns in China and Europe: A modelling study. Lancet Planet. Health 2020, 4, e474–e482. [Google Scholar] [CrossRef]
- Skirienė, A.F.; Stasiškienė, Ž. COVID-19 and air pollution: Measuring pandemic impact to air quality in five European countries. Atmosphere 2021, 12, 290. [Google Scholar] [CrossRef]
- Yushin, N.; Chaligava, O.; Zinicovscaia, I.; Grozdov, D.; Vergel, K. Mosses as bioindicators of heavy metal air pollution in the lockdown period adopted to cope with the COVID-19 pandemic. Atmosphere 2020, 11, 1194. [Google Scholar] [CrossRef]
- Lin, Y.; Wang, J. Concentrations, enrichment, and sources of metals in PM2.5 in Beijing during winter. Air Qual. Atmos. Health 2020, 13, 5–14. [Google Scholar] [CrossRef]
- Fu, H.; Yang, Z.; Liu, Y.; Shao, P. Ecological and human health risk assessment of heavy metals in dust affected by fireworks during the Spring Festival in Beijing. Air Qual. Atmos. Health 2021, 14, 139–148. [Google Scholar] [CrossRef]
- Do, T.M.; Wang, C.F.; Hsieh, Y.K.; Hsieh, H.F. Metals present in ambient air before and after a firework festival in Yanshui, Tainan, Taiwan. Aerosol Air Qual. Res. 2012, 12, 981–993. [Google Scholar] [CrossRef]
- Vuković, G.; Urošević, M.A.; Škrivanj, S.; Vergel, K.; Tomašević, M.; Popović, A. The first survey of airborne trace elements at airport using moss bag technique. Environ. Sci. Pollut. Res. 2017, 24, 15107–15115. [Google Scholar] [CrossRef] [PubMed]
- Kłos, A.; Rajfur, M.; Šrámek, I.; Wacławek, M. Mercury concentration in lichen, moss and soil samples collected from the forest areas of Praded and Glacensis Euroregions (Poland and Czech Republic). Environ. Monit. Assess. 2012, 184, 6765–6774. [Google Scholar] [CrossRef] [PubMed] [Green Version]
- Henriques, F.S. Leaf chlorophyll fluorescence: Background and fundamentals for plant biologists. Bot. Rev. 2009, 75, 249–270. [Google Scholar] [CrossRef]
- Sutter, K.; Jung, K.; Krauss, G.-J. Effects of Heavy Metals on the Nitrogen Metabolism of the. Environ. Sci. Pollut. Res. 2002, 9, 417–421. [Google Scholar] [CrossRef] [PubMed]
- Bellini, E.; Maresca, V.; Betti, C.; Castiglione, M.R.; Fontanini, D.; Capocchi, A.; Sorce, C.; Borsò, M.; Bruno, L.; Sorbo, S.; et al. The moss Leptodictyum riparium counteracts severe cadmium stress by activation of glutathione transferase and phytochelatin synthase, but slightly by phytochelatins. Int. J. Mol. Sci. 2020, 21, 1583. [Google Scholar] [CrossRef] [PubMed] [Green Version]
- Yamakawa, H.; van Stokkum, I.H.M.; Heber, U.; Itoh, S. Mechanisms of drought-induced dissipation of excitation energy in sun- and shade-adapted drought-tolerant mosses studied by fluorescence yield change and global and target analysis of fluorescence decay kinetics. Photosynth. Res. 2018, 135, 285–298. [Google Scholar] [CrossRef] [Green Version]
- Williams, T.G.; Flanagan, L.B. Measuring and modelling environmental influences on photosynthetic gas exchange in Sphagnum and Pleurozium. Plant. Cell Environ. 1998, 21, 555–564. [Google Scholar] [CrossRef]
- Kangas, L.; Maanavilja, L.; Hájek, T.; Juurola, E.; Chimner, R.A.; Mehtätalo, L.; Tuittila, E.S. Photosynthetic traits of Sphagnum and feather moss species in undrained, drained and rewetted boreal spruce swamp forests. Ecol. Evol. 2014, 4, 381–396. [Google Scholar] [CrossRef]
- Hájek, T.; Tuittila, E.S.; Ilomets, M.; Laiho, R. Light responses of mire mosses—A key to survival after water-level drawdown? Oikos 2009, 118, 240–250. [Google Scholar] [CrossRef]
- Zhang, Y.; Zhou, X.; Yin, B.; Downing, A. Sensitivity of the xerophytic moss Syntrichia caninervis to prolonged simulated nitrogen deposition. Ann. Bot. 2016, 117, 1153–1161. [Google Scholar] [CrossRef] [PubMed] [Green Version]
- Świsłowski, P.; Rajfur, M.; Wacławek, M. Influence of Heavy Metal Concentration on Chlorophyll Content in Pleurozium schreberi Mosses. Ecol. Chem. Eng. 2020, 27, 591–601. [Google Scholar] [CrossRef]
Figure 1.
Photos of mosses: (a) Pleurozium schreberi close-up, (b) moss exposure.

Figure 2.
Heavy metal concentrations in moss samples (mg/kg dm): (a) Cu, Zn, and Pb concentrations in 2019/2020; (b) Cu, Zn, and Pb concentrations in 2020/2021; (c) Ni, Cd, and Hg concentrations in 2019/2020; (d) Ni, Cd, and Hg concentrations in 2020/2021. “X” in the bar represents the mean value connected by a line and “–” represents the median, “whiskers” at the bottom and top represent min-max values, “circles” represent extreme values.

Figure 3.
Concentrations of heavy metals in mosses samples (mg kg−1/day): (a) Ni, (b) Cu, (c) Zn, (d) Cd, (e) Hg and (f) Pb depending on the exposure time (y1, y2—period 2019/2020 and 2020/2021 respectively).
Figure 3.
Concentrations of heavy metals in mosses samples (mg kg−1/day): (a) Ni, (b) Cu, (c) Zn, (d) Cd, (e) Hg and (f) Pb depending on the exposure time (y1, y2—period 2019/2020 and 2020/2021 respectively).


Table 2.
Comparison of measured and certified concentrations in BCR-482 lichen [42].
Table 2.
Comparison of measured and certified concentrations in BCR-482 lichen [42].
| BCR-482 Lichen | AAS (n = 5) | Dev. ** | |||
|---|---|---|---|---|---|
| Metal | Concentration | Measurement Uncertainty | Average | ±SD * of the Concentrations | |
| [mg/kg dm] | [%] | ||||
| Ni | 2.47 | 0.07 | 2.16 | 0.32 | −13.0 |
| Cu | 7.03 | 0.19 | 6.63 | 0.17 | −5.70 |
| Zn | 100.6 | 2.20 | 95.1 | 2.30 | −5.50 |
| Cd | 0.56 | 0.02 | 0.53 | 0.03 | −5.30 |
| Pb | 40.9 | 1.40 | 38.2 | 1.00 | −6.60 |
* standard deviation. ** relative difference between the measured (cm) and certified (cc) concentration 100% (cm − cc)/cc.
Table 3.
Statistical parameters of metals’ concentration (mg/kg dm) pooled for all periods of moss exposition. min minimal concentration, ql lower quartile, ME median, mean arithmetic mean, qu upper quartile, max maximum, SD standard deviation, and n number of moss samples.
Table 3.
Statistical parameters of metals’ concentration (mg/kg dm) pooled for all periods of moss exposition. min minimal concentration, ql lower quartile, ME median, mean arithmetic mean, qu upper quartile, max maximum, SD standard deviation, and n number of moss samples.
| Ni | Cu | Zn | Cd | Pb | Hg | |
|---|---|---|---|---|---|---|
| min | <1.25 | 5.48 | 38.2 | <0.325 | 2.50 | 0.0201 |
| ql | <1.25 | 7.13 | 48.6 | <0.325 | 3.04 | 0.0357 |
| ME | <1.25 | 7.66 | 50.5 | <0.325 | 3.50 | 0.0406 |
| mean | 1.45 | 10.9 | 57.7 | 0.390 | 7.09 | 0.0394 |
| qu | <1.25 | 11.8 | 58.5 | 0.473 | 9.80 | 0.0443 |
| max | 4.62 | 25.0 | 118 | 0.608 | 23.4 | 0.0561 |
| SD | 0.71 | 5.92 | 16.9 | 0.110 | 6.06 | 0.0081 |
| n | 39 | 43 | 43 | 43 | 43 | 43 |
Table 4.
The p-values calculated in Wilcoxon test for intensity of Ni deposition during the periods studied.
Table 4.
The p-values calculated in Wilcoxon test for intensity of Ni deposition during the periods studied.
| B | B_NYE | NYE | NYE_Af | Af | |
|---|---|---|---|---|---|
| B_NYE | x | − | − | − | − |
| NYE | x | x | − | − | − |
| NYE_Af | 0.093 | 0.093 | 0.093 | − | − |
| Af | x | x | x | 0.146 | − |
| Al. | 0.093 | 0.093 | 0.093 | 1.000 | 0.146 |
x — pairs of groups which cannot be compared. − — no comparison.
Table 5.
Mean RAF values for the metals analysed (n.d.: no data).
| Metal | 2019/2020 | 2020/2021 | ||||||||||
|---|---|---|---|---|---|---|---|---|---|---|---|---|
| B | B_NYE | NYE | NYE_Af | Af | Al. | B | B_NYE | NYE | NYE_Af | Af | Al. | |
| Ni | n.d. | n.d. | n.d. | 1.78 | n.d. | 0.30 | n.d. | n.d. | n.d. | n.d. | n.d. | n.d. |
| Cu | 0.21 | 0.90 | 2.57 | 0.25 | 0.01 | 2.59 | 0.21 | 0.20 | 0.13 | 0.36 | 0.18 | 0.48 |
| Zn | 0.19 | 0.48 | 0.70 | 0.43 | 0.28 | 0.60 | 0.15 | 0.20 | 0.13 | 0.14 | 0.12 | 0.16 |
| Cd | n.d. | n.d. | n.d. | 0.03 | 0.05 | 0.14 | n.d. | n.d. | n.d. | 0.78 | n.d. | 0.68 |
| Hg | 0.19 | 0.24 | 0.11 | 0.01 | 0.05 | 0.06 | 0.27 | 0.23 | 0.16 | 0.85 | 0.99 | 1.37 |
| Pb | 1.09 | 0.64 | 1.44 | 0.62 | 0.93 | 0.08 | 0.32 | 0.37 | 0.50 | 0.78 | 0.46 | 1.77 |
Table 6.
Chlorophyll fluorescence of mosses samples [-].
| Parameter | Fs | Fms | Y(II) | Ft |
|---|---|---|---|---|
| Exposure Period | Average ± SD | |||
| control | 113 ± 27.7 | 158 ± 49.1 | 0.273 ± 0.07 | 107 ± 26.1 |
| B | 125 ± 25.0 | 144 ± 30.7 | 0.125 ± 0.03 | 124 ± 24.9 |
| B_NYE | 128 ± 16.8 | 264 ± 96.3 | 0.509 ± 0.11 | 117 ± 16.1 |
| NYE | 137 ± 28.8 | 214 ± 77.9 | 0.332 ± 0.11 | 133 ± 25.5 |
| NYE_Af | 107 ± 10.4 | 139 ± 14.0 | 0.224 ± 0.08 | 105 ± 10.1 |
| Af | 112 ± 20.2 | 138 ± 26.8 | 0.184 ± 0.07 | 110 ± 19.9 |
| Al. | 115 ± 39.1 | 161 ± 74.5 | 0.257 ± 0.11 | 115 ± 36.3 |
Fs: Fluorescence under steady state; Fms: Maximum fluorescence at steady state; Y(II): Quantum Photosynthetic Yield of Photo System (II); Ft: Instantaneous fluorescence.
Publisher’s Note: MDPI stays neutral with regard to jurisdictional claims in published maps and institutional affiliations. |
© 2021 by the authors. Licensee MDPI, Basel, Switzerland. This article is an open access article distributed under the terms and conditions of the Creative Commons Attribution (CC BY) license (https://creativecommons.org/licenses/by/4.0/).
Share and Cite
MDPI and ACS Style
Świsłowski, P.; Ziembik, Z.; Rajfur, M. Air Quality during New Year’s Eve: A Biomonitoring Study with Moss. Atmosphere 2021, 12, 975. https://doi.org/10.3390/atmos12080975
AMA Style
Świsłowski P, Ziembik Z, Rajfur M. Air Quality during New Year’s Eve: A Biomonitoring Study with Moss. Atmosphere. 2021; 12(8):975. https://doi.org/10.3390/atmos12080975
Chicago/Turabian StyleŚwisłowski, Paweł, Zbigniew Ziembik, and Małgorzata Rajfur. 2021. "Air Quality during New Year’s Eve: A Biomonitoring Study with Moss" Atmosphere 12, no. 8: 975. https://doi.org/10.3390/atmos12080975
Note that from the first issue of 2016, this journal uses article numbers instead of page numbers. See further details here.