
Air Mercury Monitoring at the Baikal Area
by
 ,
,
Nikolay Mashyanov
1,2,*, 
Vladimir Obolkin
3,
Sergey Pogarev
1,2,
Vladimir Ryzhov
4,
Sergey Sholupov
2,
Vladimir Potemkin
3,
Elena Molozhnikova
3 and
Tamara Khodzher
3 1
Institute of Earth Sciences, St. Petersburg State University, 199034 St Petersburg, Russia
2
Lumex-Marketing LLC, 195220 St Petersburg, Russia
3
Limnological Institute, Siberian Branch of RAS, 664033 Irkutsk, Russia
4
Lumex Analytics GmbH, 24558 Wakendorf II, Germany
*
Author to whom correspondence should be addressed.
Atmosphere 2021, 12(7), 807; https://doi.org/10.3390/atmos12070807
Submission received: 3 June 2021
/
Revised: 18 June 2021
/
Accepted: 18 June 2021
/
Published: 23 June 2021
(This article belongs to the Special Issue Air Quality Assessment and Management)
Abstract
:The GMOS (Global Mercury Observation System) project has the overall goal to develop a coordinated observing system to monitor mercury on a global scale. Here we present the long-term (2011–2020) air mercury monitoring data obtained at the Listvyanka station located at a shore of Lake Baikal, Siberia. The long-term monitoring shows obvious seasonal variation of the background mercury concentration in air, which increases in the cold and decreases in the warm season. The short-term anomalies are associated with the wind carrying the air from the industrial areas where several big coal-fired power plants are located. A positive correlation between the mercury, SO2 and NO2 concentrations is observed both in the short-term variations and in the monthly average concentrations. The analysis of forward and backward trajectories obtained with the HYSPLIT model demonstrates revealing of the mercury emissions sources. During the cruise of 2018, the continuous air mercury survey over Lake Baikal covered 1800 km. The average mercury concentration over Baikal is notably less in comparison with the average value obtained at the onshore Listvyanka station during the same days of the cruise. That can lead to the conclusion that Baikal is a significant sink of the atmospheric mercury.
1. Introduction
The GMOS (Global Mercury Observation System) project has the overall goal to develop a coordinated observing system to monitor mercury on a global scale to assess its emissions to atmosphere, transport, atmospheric chemistry, and deposition processes. The GMOS program included developing of the standard operational procedures (SOPs) for air mercury monitoring and mercury deposition assessment harmonized with the international standards, data acquisition and data quality management system, creation of a network of ground-based monitoring stations, periodic oceanographic cruises, and airborne measurements. More than 40 ground-based stations in the Northern and Southern hemispheres were involved in the monitoring network covering many regions where little to no observational data were available before GMOS [1]. One of such new points has been founded, as a secondary GMOS site, based on the Listvyanka monitoring station located at a shore of Lake Baikal, Siberia, far away from the existing mercury monitoring sites in Asia. Long-term air mercury monitoring started in October 2011. In July 2018, for the first time, the air mercury survey had been carried out throughout all the Baikal area during the cruise of the research vessel “Akademik Koptyug”.
2. Experimental
2.1. Monitoring Site
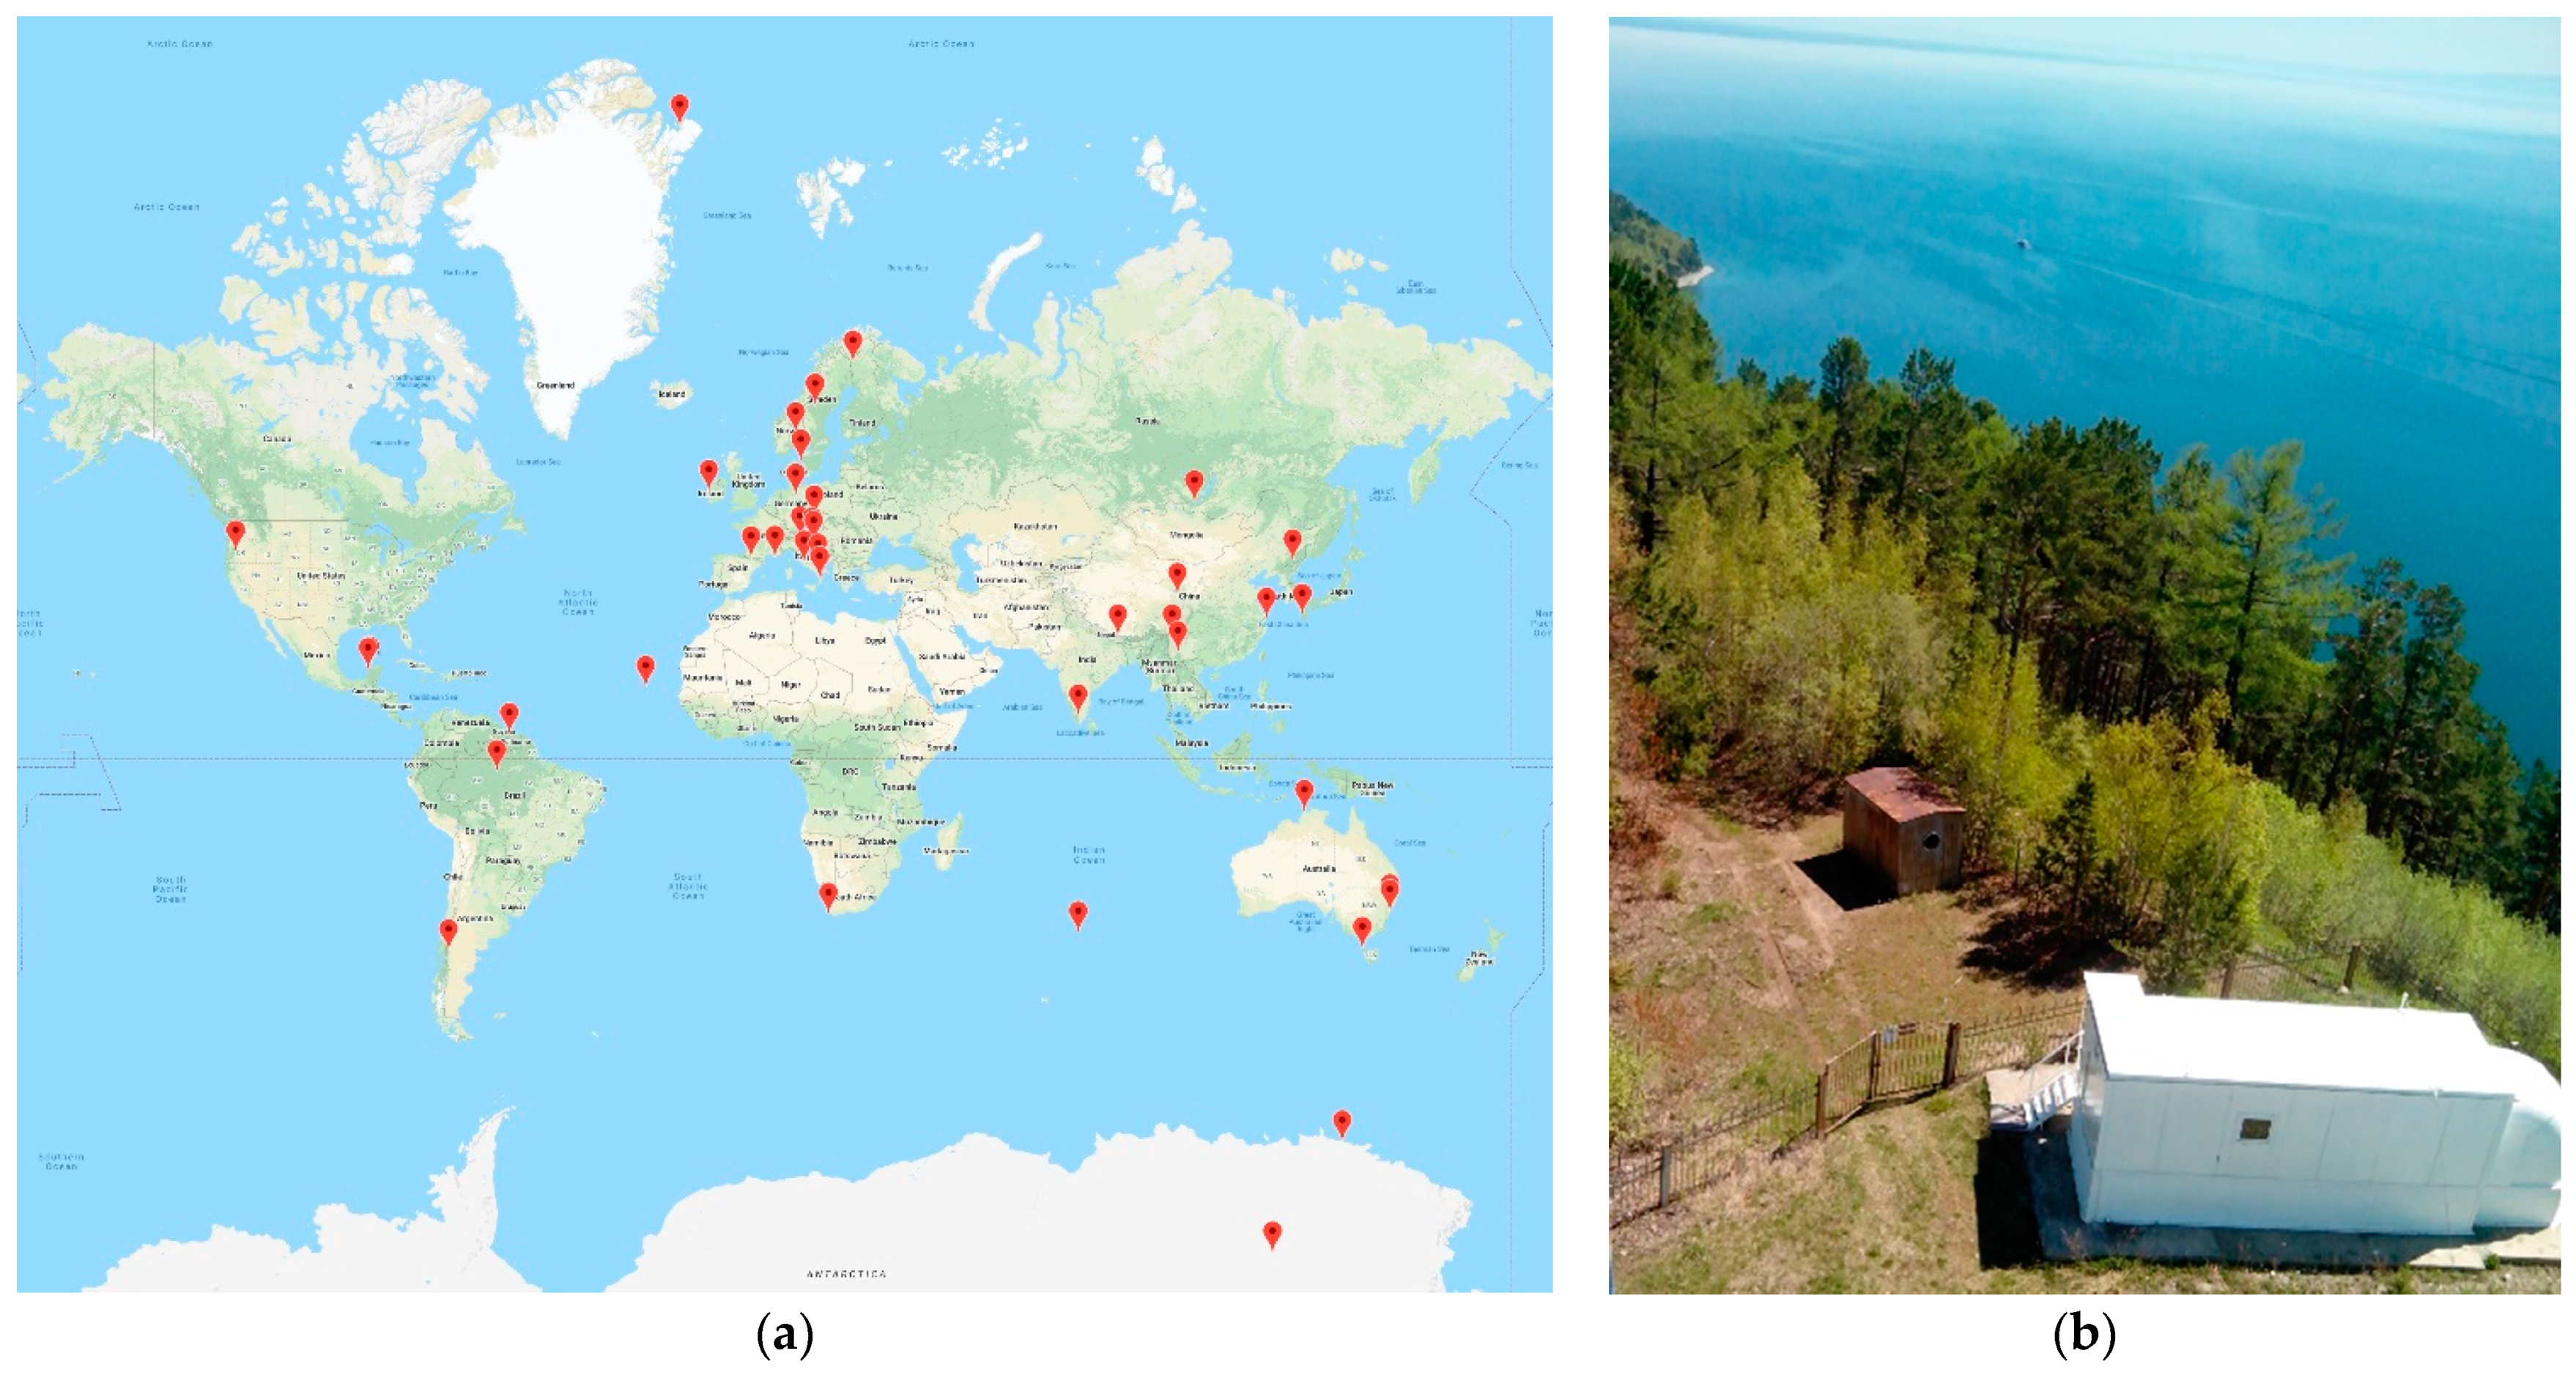
The monitoring station “Listvyanka” is located in a rural area of the southwestern coast of Lake Baikal (51.8467 N, 104.8930 E, 670 m a.s.l.) on the top of a coastal hill approximately 200 m above the lake (Figure 1). The nearest major anthropogenic source of atmospheric pollution is the city of Irkutsk, located 70 km away to the Northwest of Lake Baikal. The location of the station on a hill and outskirts of the same name settlement minimizes the impact of local sources of pollution and contributes to the monitoring of regional and global transport of atmospheric impurities. The climate of the region where the station is located is typical for the south of South-Eastern Siberia: cold winters and relatively hot summers. Over the past 15 years, the air temperature in January was −17.6 ± 4.2 °C; the average temperature in July +19.0 ± 1.0 °C, the average annual air temperature varied over this period in the range from −0.5 to +3.0 °C. The amount of atmospheric precipitation is approximately 400 mm/year (60–100 mm fall during the cold half of the year and approximately 300–350 mm during the warm half). Prevailing wind directions: north-west (especially in the cold season) and south-east. Average wind speeds are relatively low: 1.5–2.5 m/s (stronger in spring, weaker in winter and summer).
In the Baikal region, the largest contribution to air pollution is made by emissions of sulfur and nitrogen oxides from thermal power plants of the Irkutsk-Angarsk industrial complex (Angarsk, Irkutsk and Shelekhov cities). Annual emissions of SO2 and NO2 (in thousand tons) are estimated as 98 and 54 for Angarsk, 49.5 and 19 for Irkutsk, and 6.5 and 1.7 for Shelekhov, respectively. The main fuel for the electrical power plants and industrial boilers is coal from the Irkutsk and Buryatia regions, which amounts to more than 90%. Due to the prevalence of the NW air mass transfers, the area of the most probable atmospheric influence of the emission sources extends in the direction of South Baikal, located at only 70–100 km from these sources. The station is a part of the EANET network (Acid Deposition Monitoring Network in East Asia) whereby numerous parameters of the air pollution, wet and dry deposition, as well as the conditions of the terrestrial and aquatic environment are measured. The station equipment carries out continuous automatic registration of the following atmospheric gases with a time resolution of 1–2 min: SO2 and H2S (CB-320), NO and NO2 (P-310A), CO (K-100), CO2 (OPTOGAS-500)—all manufactured by OPTEC, Russia; O3 (Dylec 1006-AHJ, Japan), and some others (Obolkin et al., 2017). The meteorological characteristics are measured with the Meteo-2M ultrasonic meteorological station (IAO, SB RAS, Russia). Within the GMOS program, the monitoring at the Listvyanka site includes gaseous elemental mercury (GEM) measurement (RA-915AM, Lumex, Russia) and precipitation sampling. In addition to this program, particulate bound mercury (PBM) was measured with a portable multifunctional RA-915M analyzer (Lumex, Russia) that was also used for air survey over Lake Baikal.
2.2. Stationary Air Mercury Monitoring
The ongoing air mercury monitoring within the GMOS project started on 26 October 2011. Stationary air measurements were made using a Lumex RA-915AM automated mercury monitor, which provides direct continuous background mercury (GEM) determination in compliance with the EN standard method for the determination of total gaseous mercury (EN 15852:2010 Ambient air quality) adopted as a SOP for the GMOS monitoring network. The monitoring data with 5 min averaging were acquired by the GMOS Cyber-(e)-Infrastructure and stored in the GMOS central databases [2].
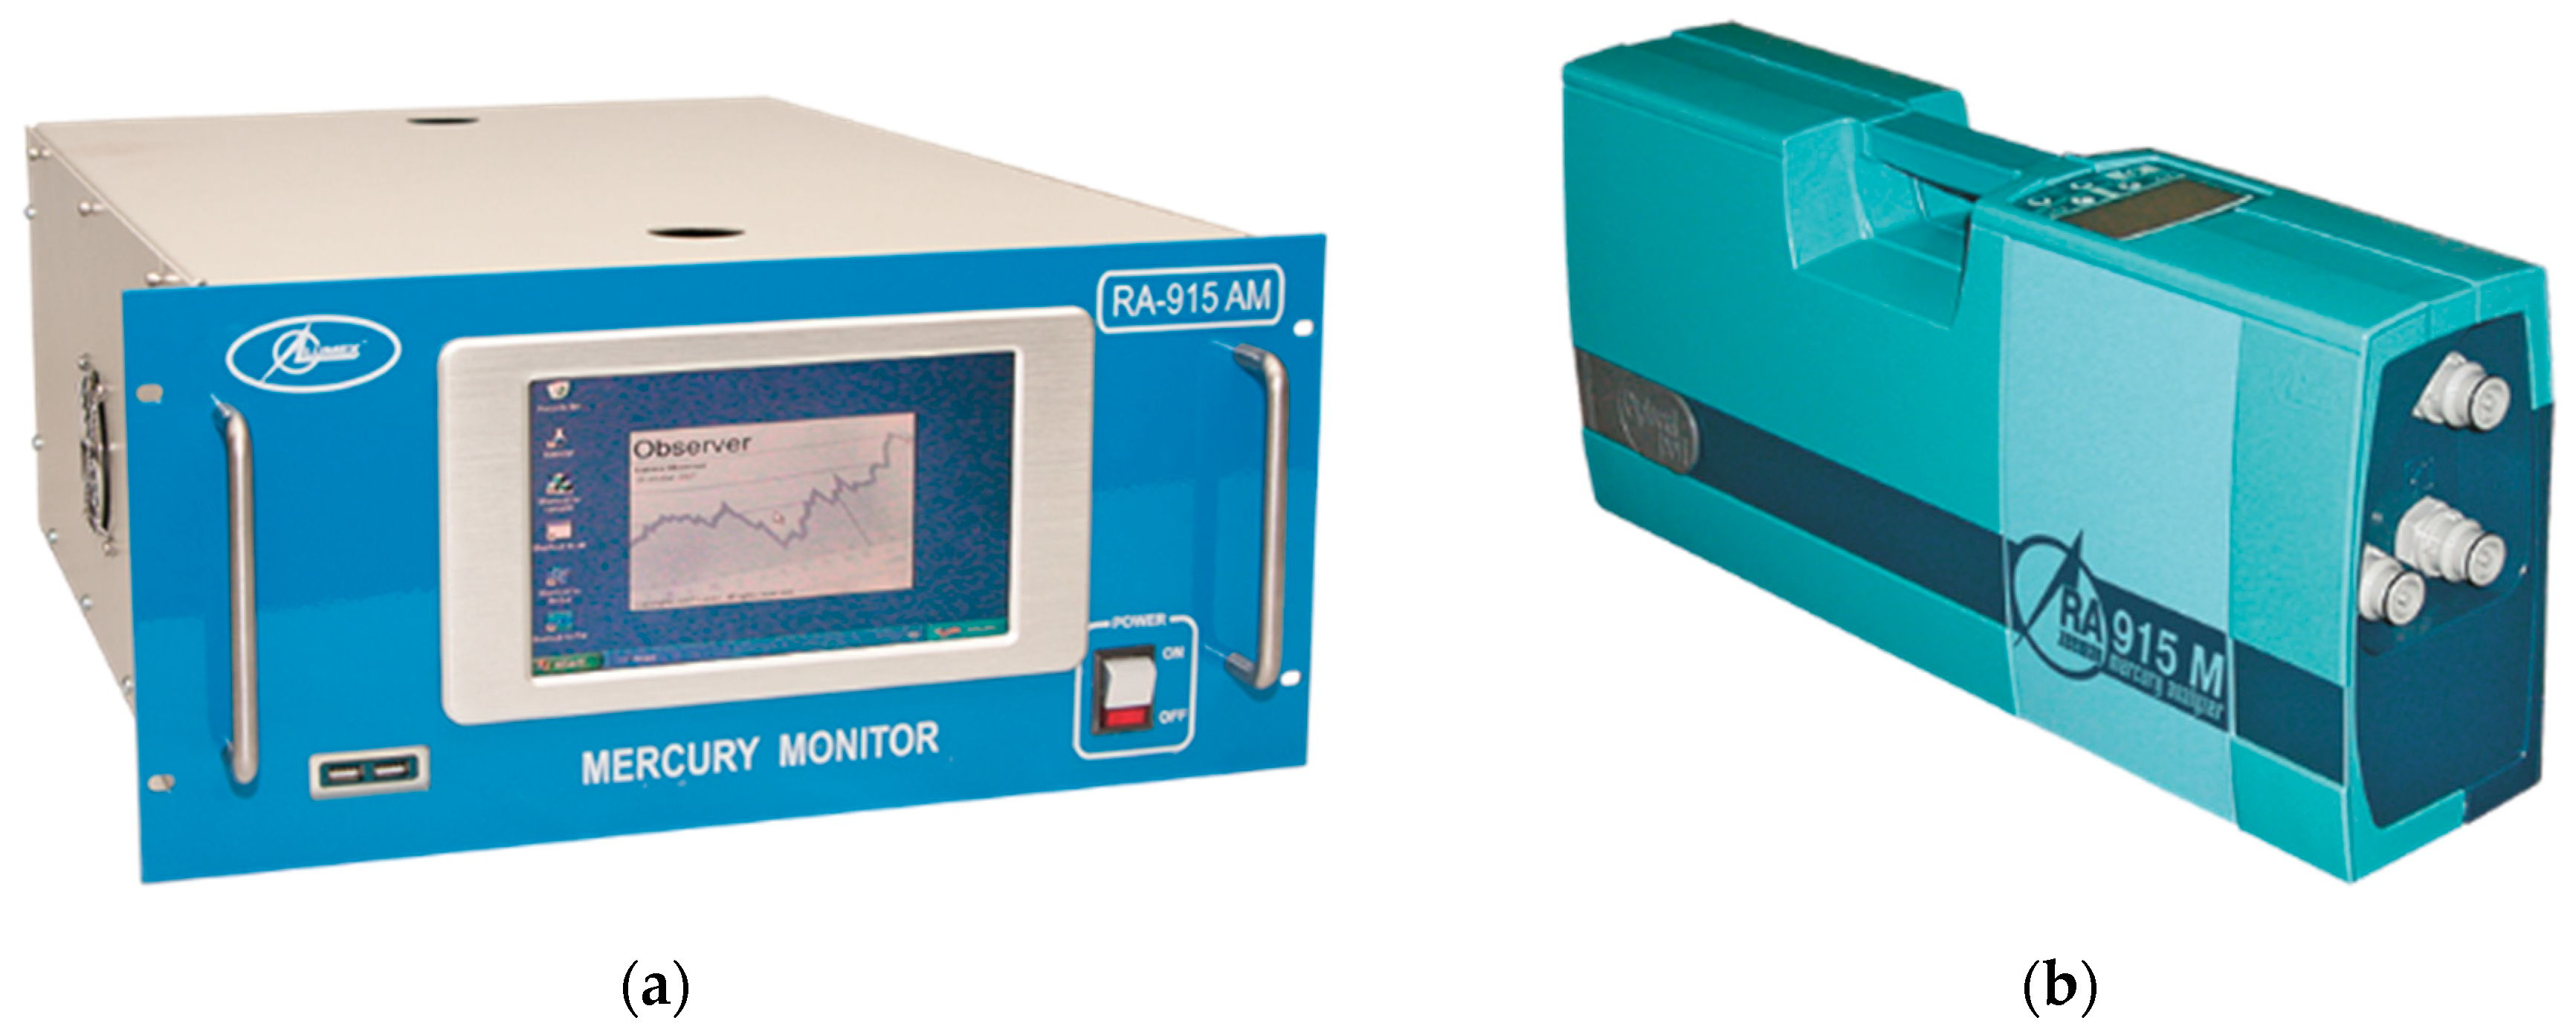
The principle of operation of the RA-915AM mercury monitor (Figure 2a), as well as that of the multifunctional RA-915M analyzer (Figure 2b), is based on the differential atomic absorption spectroscopy with the Zeeman background correction [3].
The RA-915AM mercury monitor is designed for direct, long-term, non-attended mercury measurement; it has a built-in PC for data acquisition and processing, self-diagnostics, and data transfer. Ambient air at the flowrate of ca. 8 L/min is continuously pumped through the multipath cell of the monitor having the effective optical length of 9.6 m. The readings are collected continuously each 1 s and are averaged for reporting at any chosen time interval, as a rule for 5 min. The combination of the multipath cell with the Zeeman background correction makes continuous real-time measurement of background mercury concentration in ambient air possible.
The limit of detection (LoD) is defined as a signal that three times exceeds the standard deviation (SD) of the blank when ambient air is sucked through an external mercury absorbing filter placed at the monitor inlet. The SD value was determined as 0.1–0.15 ng/m3 at 5-min averaging. Thus, the instrumental LoD of the monitor is 0.3–0.5 ng/m3 that corresponds to the data obtained during EN 15852 preparatory field tests [4]. Further reduction of the LoD can be achieved by increasing the averaging interval (e.g., at 30-min averaging the LoD is 0.1–0.2 ng/m3). Automatic zero drift correction and auto-calibration functions provide stable analytical parameters, operational reliability and safety.
Each measuring cycle consists of four steps: the actual measurement when the ambient air is directly entered to the analytical cell, the measurement of the zero level when the ambient air is passed through the built-in mercury-absorbing filter, and two intermediate intervals between these two to replace the ambient air by the “zero air” and vice versa. Assuming that the drift is linear between two consecutive zero-level tests, a zero-drift corrected signal is calculated. By default, durations of the actual measurement, the zero-level test, and sum of the two intermediate intervals are 4, 0.5 and 0.5 min respectively.
The sensitivity of the spectrometer is automatically (RA-915 AM monitor, once per 6 h by default), or manually (portable RA-915M), checked by installing the sealed quartz test cell with the saturated mercury vapour in the optical beam. No mercury containing devices and operator’s contact with liquid mercury or mercury vapour are required. By concentration obtained from the measured temperature using the Dumarey equation and the width of the test cell, the calculated signal produced by the test cell can be obtained. The calibration coefficient is checked by comparing the response produced by the cell and the calculated signal. Experience showed that the sensitivity was very stable, varying within 5% over years.
Main atmospheric components have no spectroscopic effect on the mercury measurement with differential ZAAS: N2, O2, CO2, water vapours have no absorption bands in the near-UV region, some trace gases (e.g., ozone, acetone) have absorption bands in the near range, but due to the Zeeman background correction their effect is negligible. To maintain the 0.5 ng/m3 mercury LoD, the following concentrations of trace gases are tolerable: for both of SO2 and H2S it is 10 mg/m3, for NO2—100 mg/m3. Non-specific for atmosphere volatile organic compounds having vibrational-rotational bands near mercury resonance line of 254 nm (such as benzene, toluene, ethylbenzene, xylenes, and others) also do not produce false response at the allowable level of their concentrations in ambient air.
The RA-915AM monitor is convenient for long-term, non-attended operation at remote sites as it does not require argon or any other compressed gases, parts replacement, regular maintenance, and has the autorun function in case of power supply failures (this was the most common reason for the records interruptions at the Listvyanka station). Besides stationary measurements, the monitor is used for other applications, such as continuous air surveys when being mounted on an automobile, boat, or aircraft [5], and mercury flux measurements [6,7].
2.3. Air Mercury Survey over Baikal
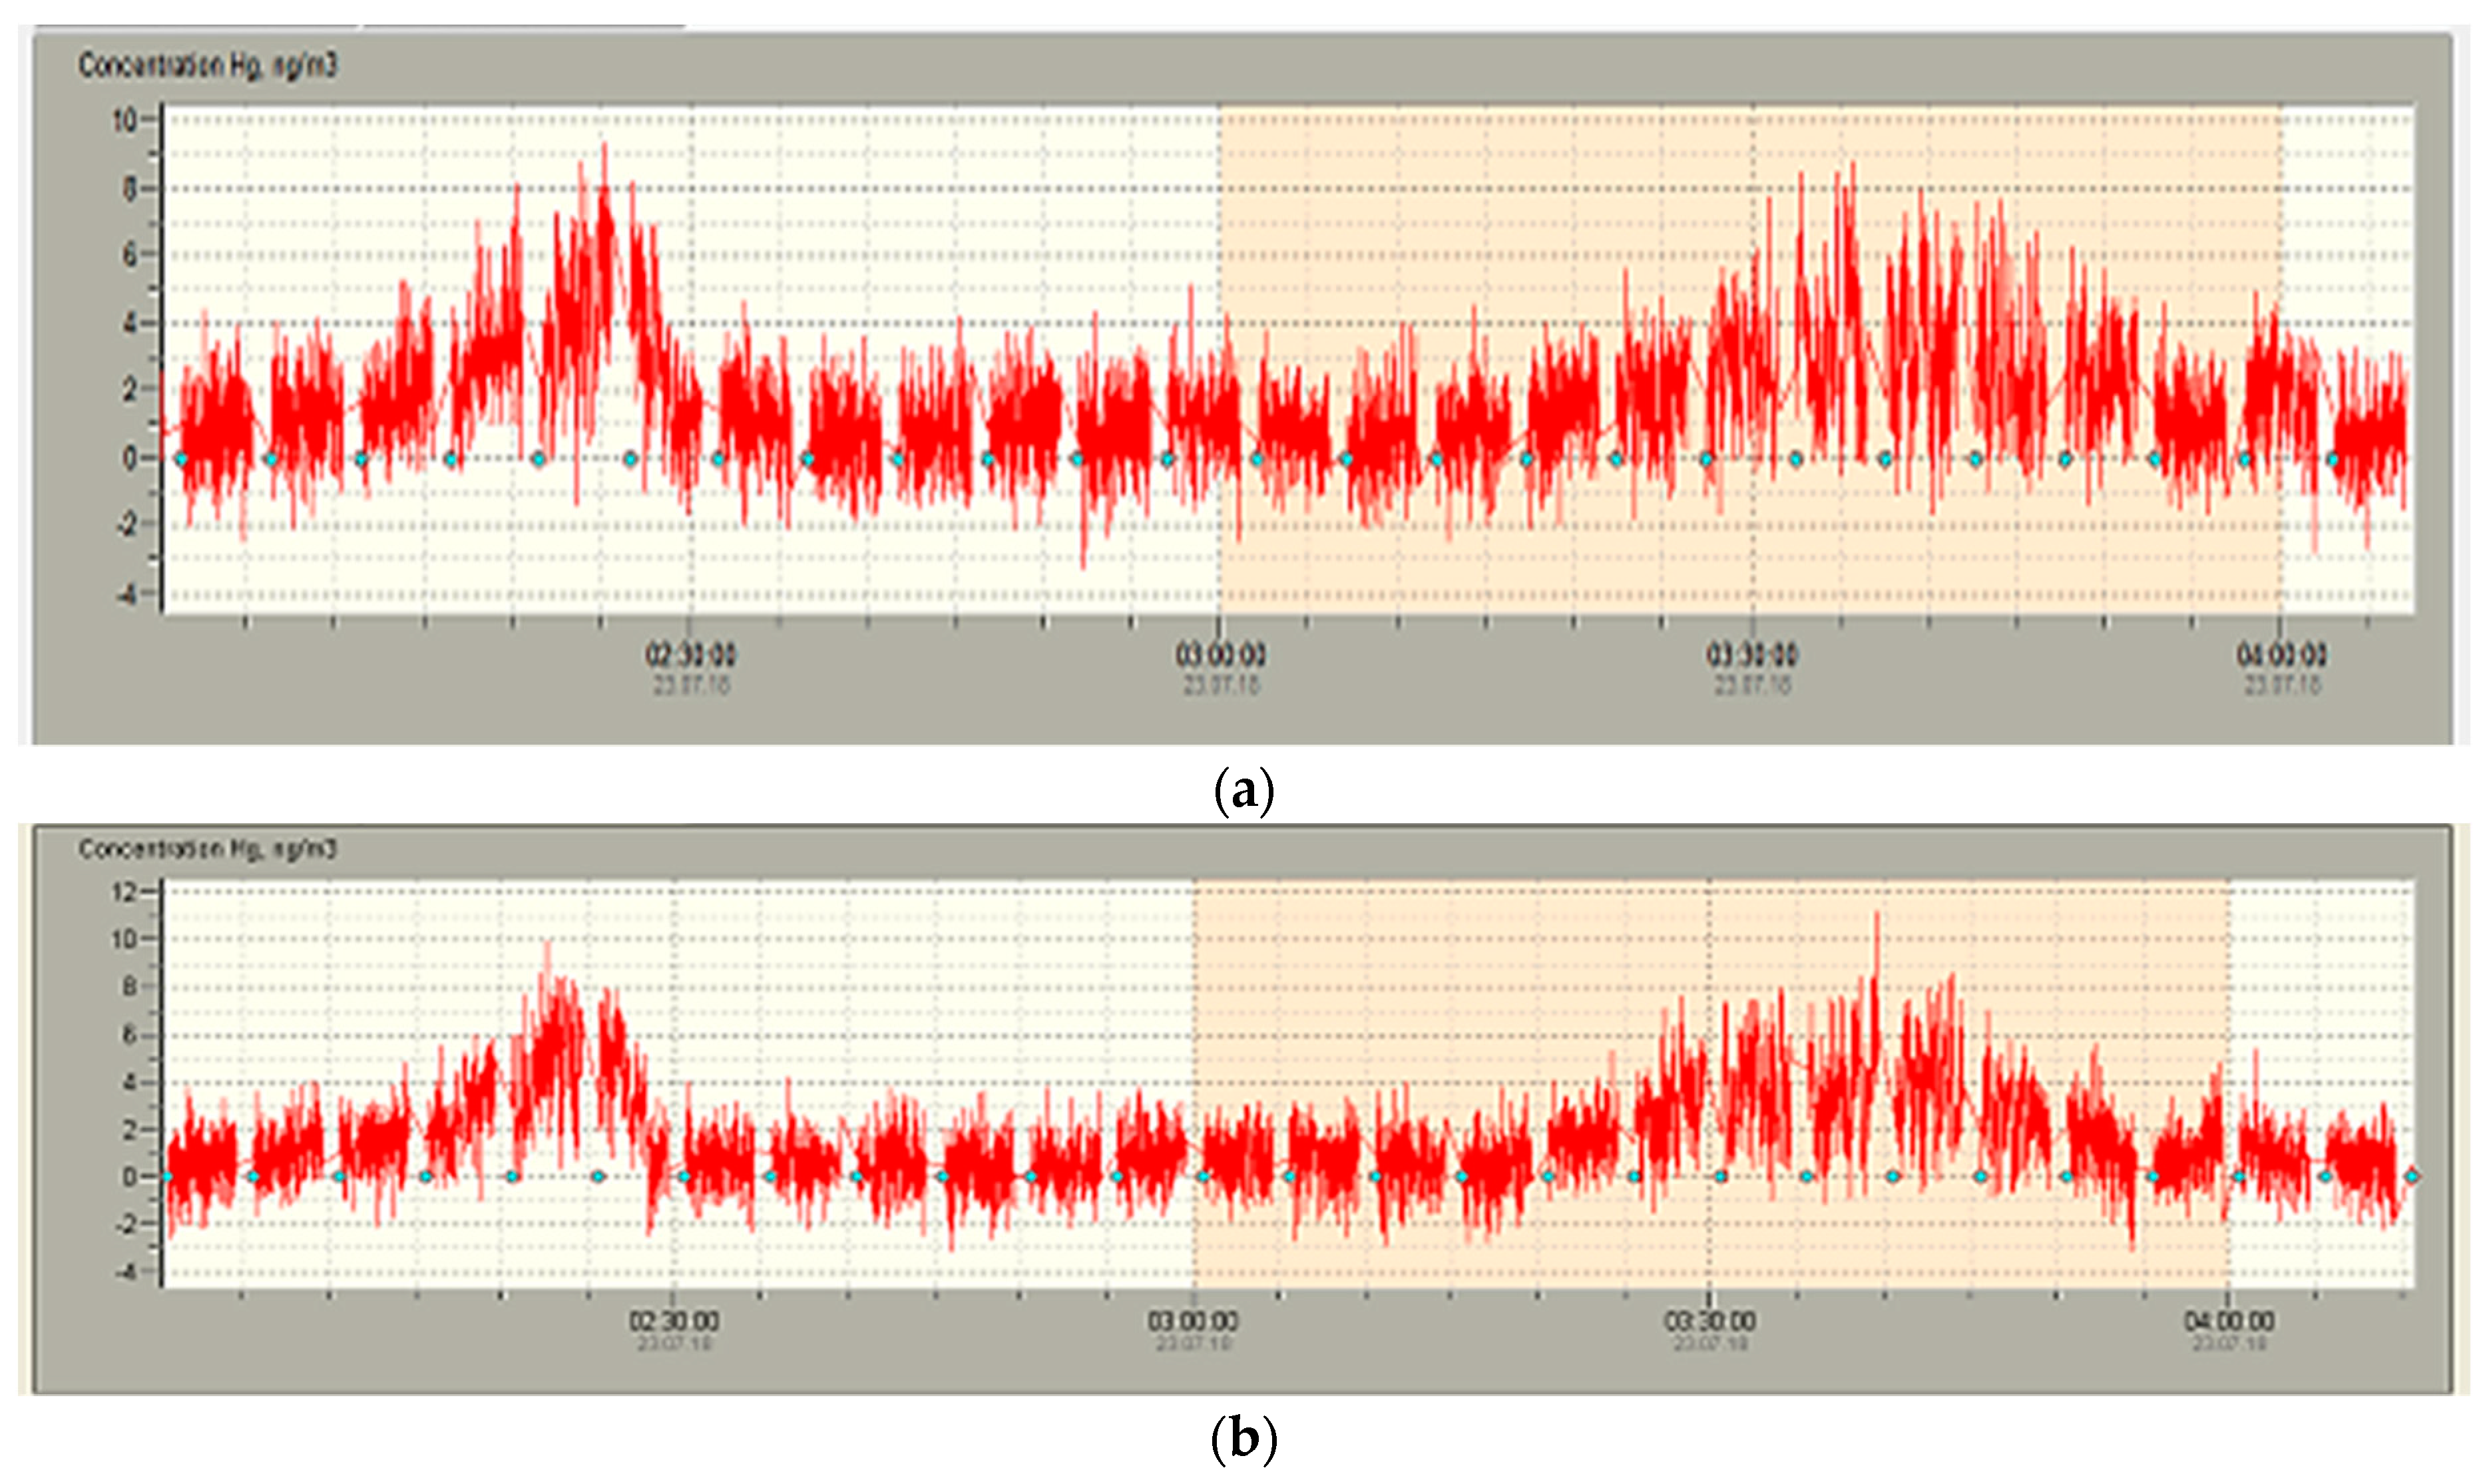
The portable RA-915M analyzer (Figure 2b) is applicable for real-time air mercury surveys on board of moving vehicles (car, helicopter, boat). The air mercury survey during the cruise of the research vessel “Akademik Koptyug” over Lake Baikal in July 2018 was made with two portable mercury analyzers RA-915M operated concurrently. Data were collected continuously with the response time of 1 s, averaging over 4 min, and zero control every 5 min (Figure 3). Limit of detection was defined, as described above, as 0.5 ng/m3 at 5-min averaging. Throughout the cruise, the calibration coefficients for both analyzers were stable within 3%. During concurrent measurements, the difference in the averaged readings between the analyzers did not exceed 10%.
2.4. Determination of Particulate Bound Mercury
Within the GMOS project, no mercury speciation measurement is required at the secondary stations. Nevertheless, during February 2015–November 2017, 40 air samples were collected for the particulate bound mercury (PBM) determination. Several types of aerosol filters were tested to choose those with the minimum blank value. The PolyFlon PF060 filters, with a pore size of 6 µm (Advantec, Japan), showed the minimal blank value of 0.2 ng on the average as compared with the other filters.
The multifunctional RA-915M mercury analyzer with a PYRO-915+ attachment was used for determination of the PBM concentration by direct pyrolysis of the whole filters (Figure 4). Mean air volume for PBM sampling was 300 m3, with the air flow rate of approximately 70 L/min. For such sampling conditions, the LoD value was determined as 1 pg/m3.
3. Air Mercury Monitoring at the Listvyanka Station
This section covers stationary air mercury measurement at the Listvyanka site from November 2011 to December 2020.
3.1. Seasonal Variations
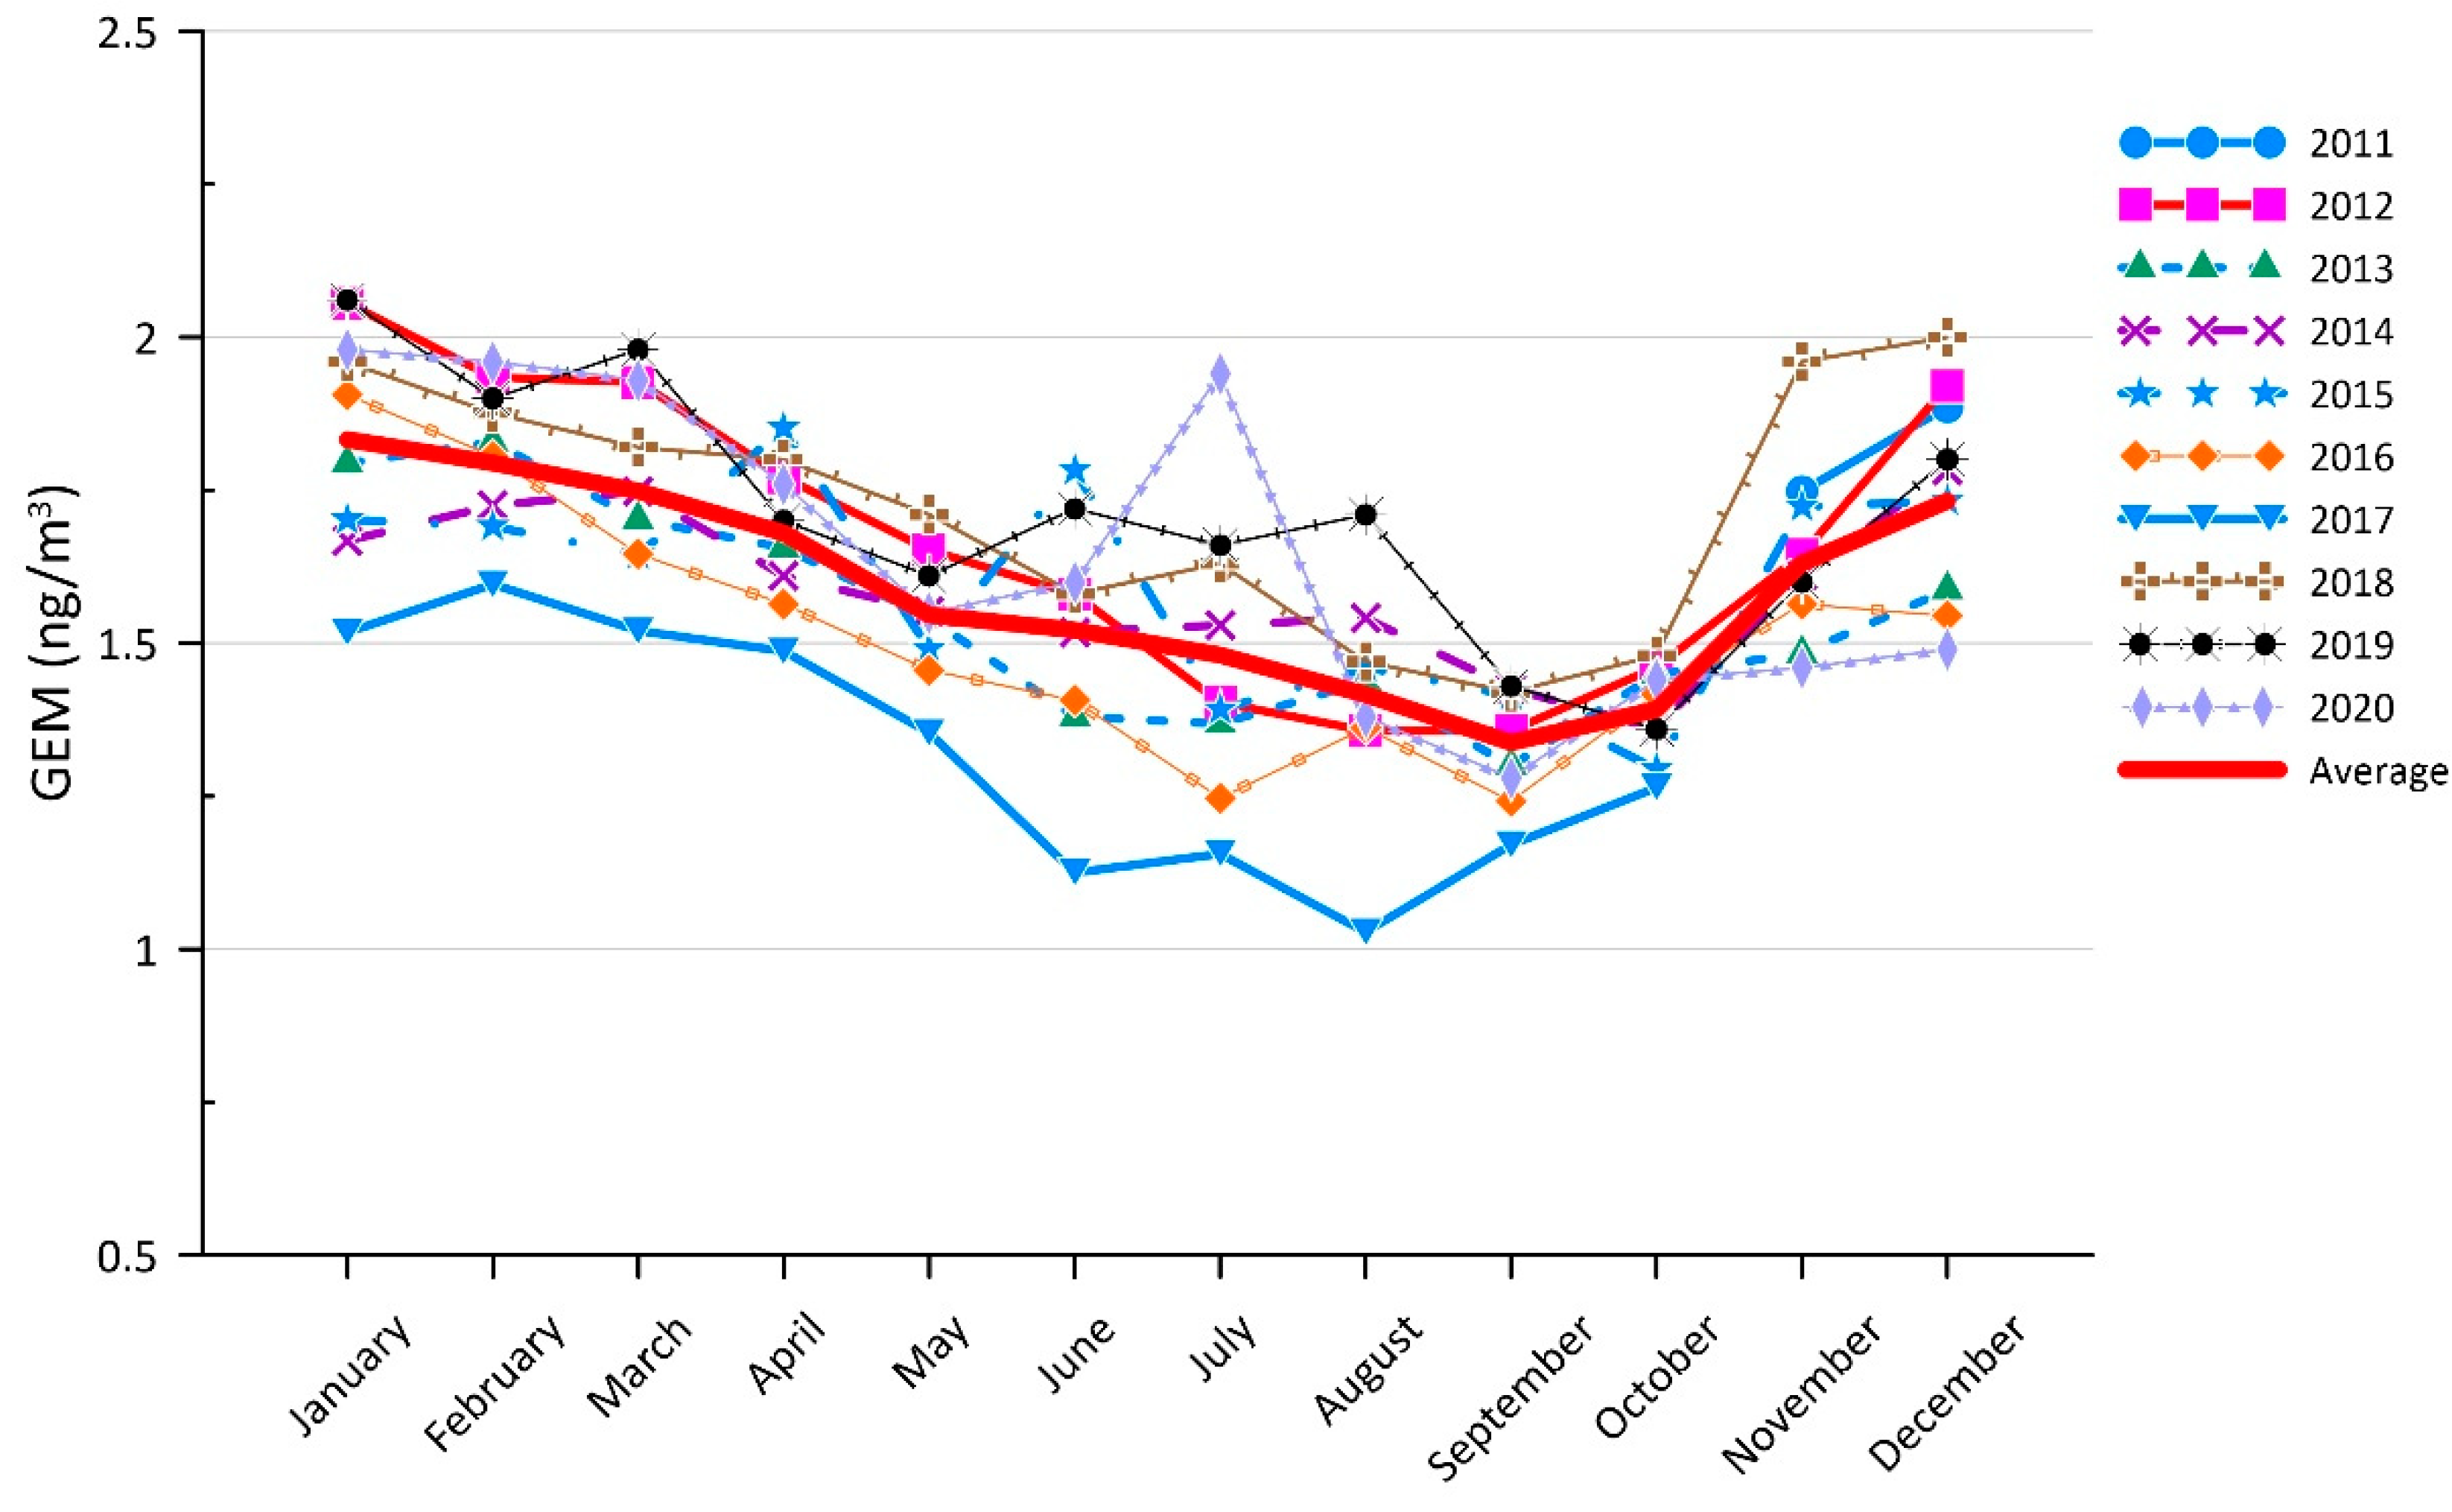
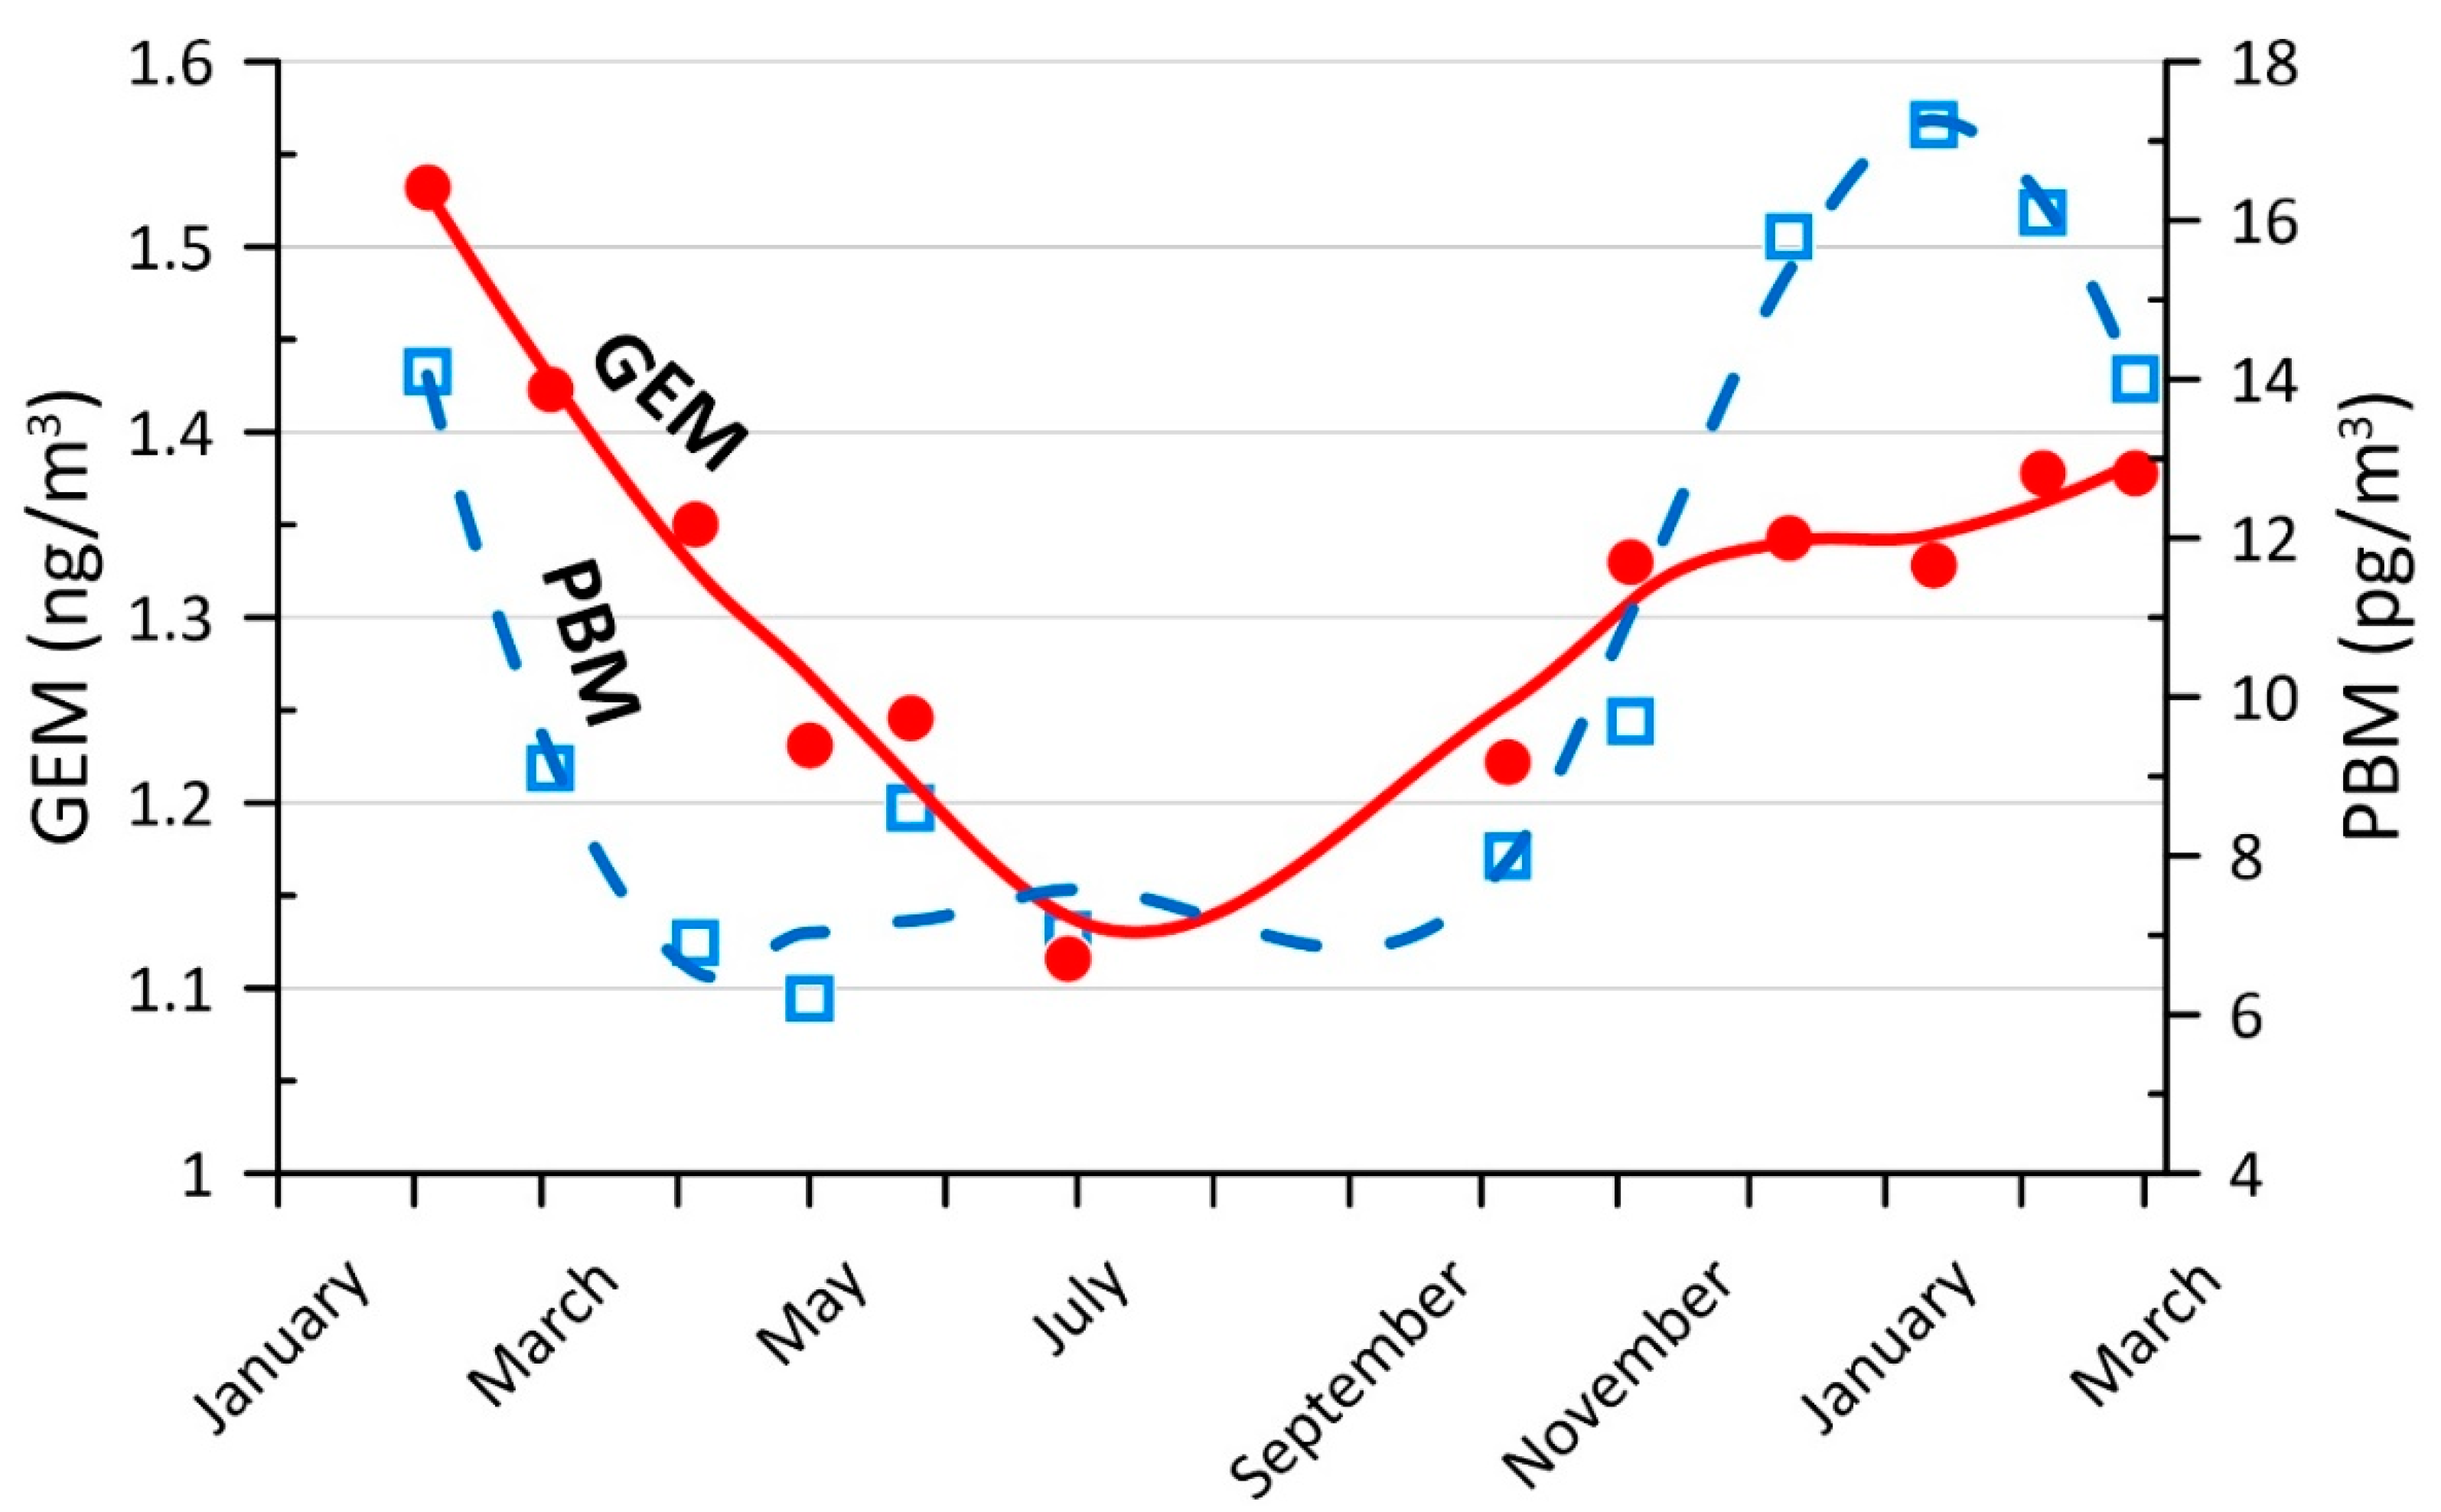
The obtained data show obvious seasonal variation of the background mercury concentration in air, increasing in the cold seasons (November–February) with the monthly average of 1.56–1.95 ng/m3, and decreasing in the warm seasons (June–September) with the monthly average of 1.12–1.63 ng/m3 (Figure 5):
The average mercury background concentration (Cav) for the overall reporting period of November 2011–December 2020 is 1.59 ng/m3. For cold seasons, Cav has a value of 1.75 ng/m3 that is higher as compared with Cav obtained for warm seasons: 1.44 ng/m3. The difference between the mercury concentrations in the cold and warm seasons amounts to 0.31 ng/m3 (Table 1).
The variability of the mercury concentration is also higher in cold months due to elevated emissions from coal-fired power plants.
The behavior similar to the GEM seasonal variation is observed for the particulate bound mercury (PBM), which was being measured from January 2016 to March 2017 (Figure 6):
During this period, the GEM concentration averaged at 1.33 ng/m3, whereas the PBM concentration was 11 pg/m3, which is approximately 0.8% of the former one. Seasonal variations of both GEM and PBM species are obviously explained by elevating mercury emissions from coal combustion during the cold season, giving rise to background mercury concentration at a regional and global level. An additional evidence of mercury emissions from coal-fired power plants is revealed from an analysis of the short-term air mercury variations (see Section 3.3).
3.2. Diurnal Variations
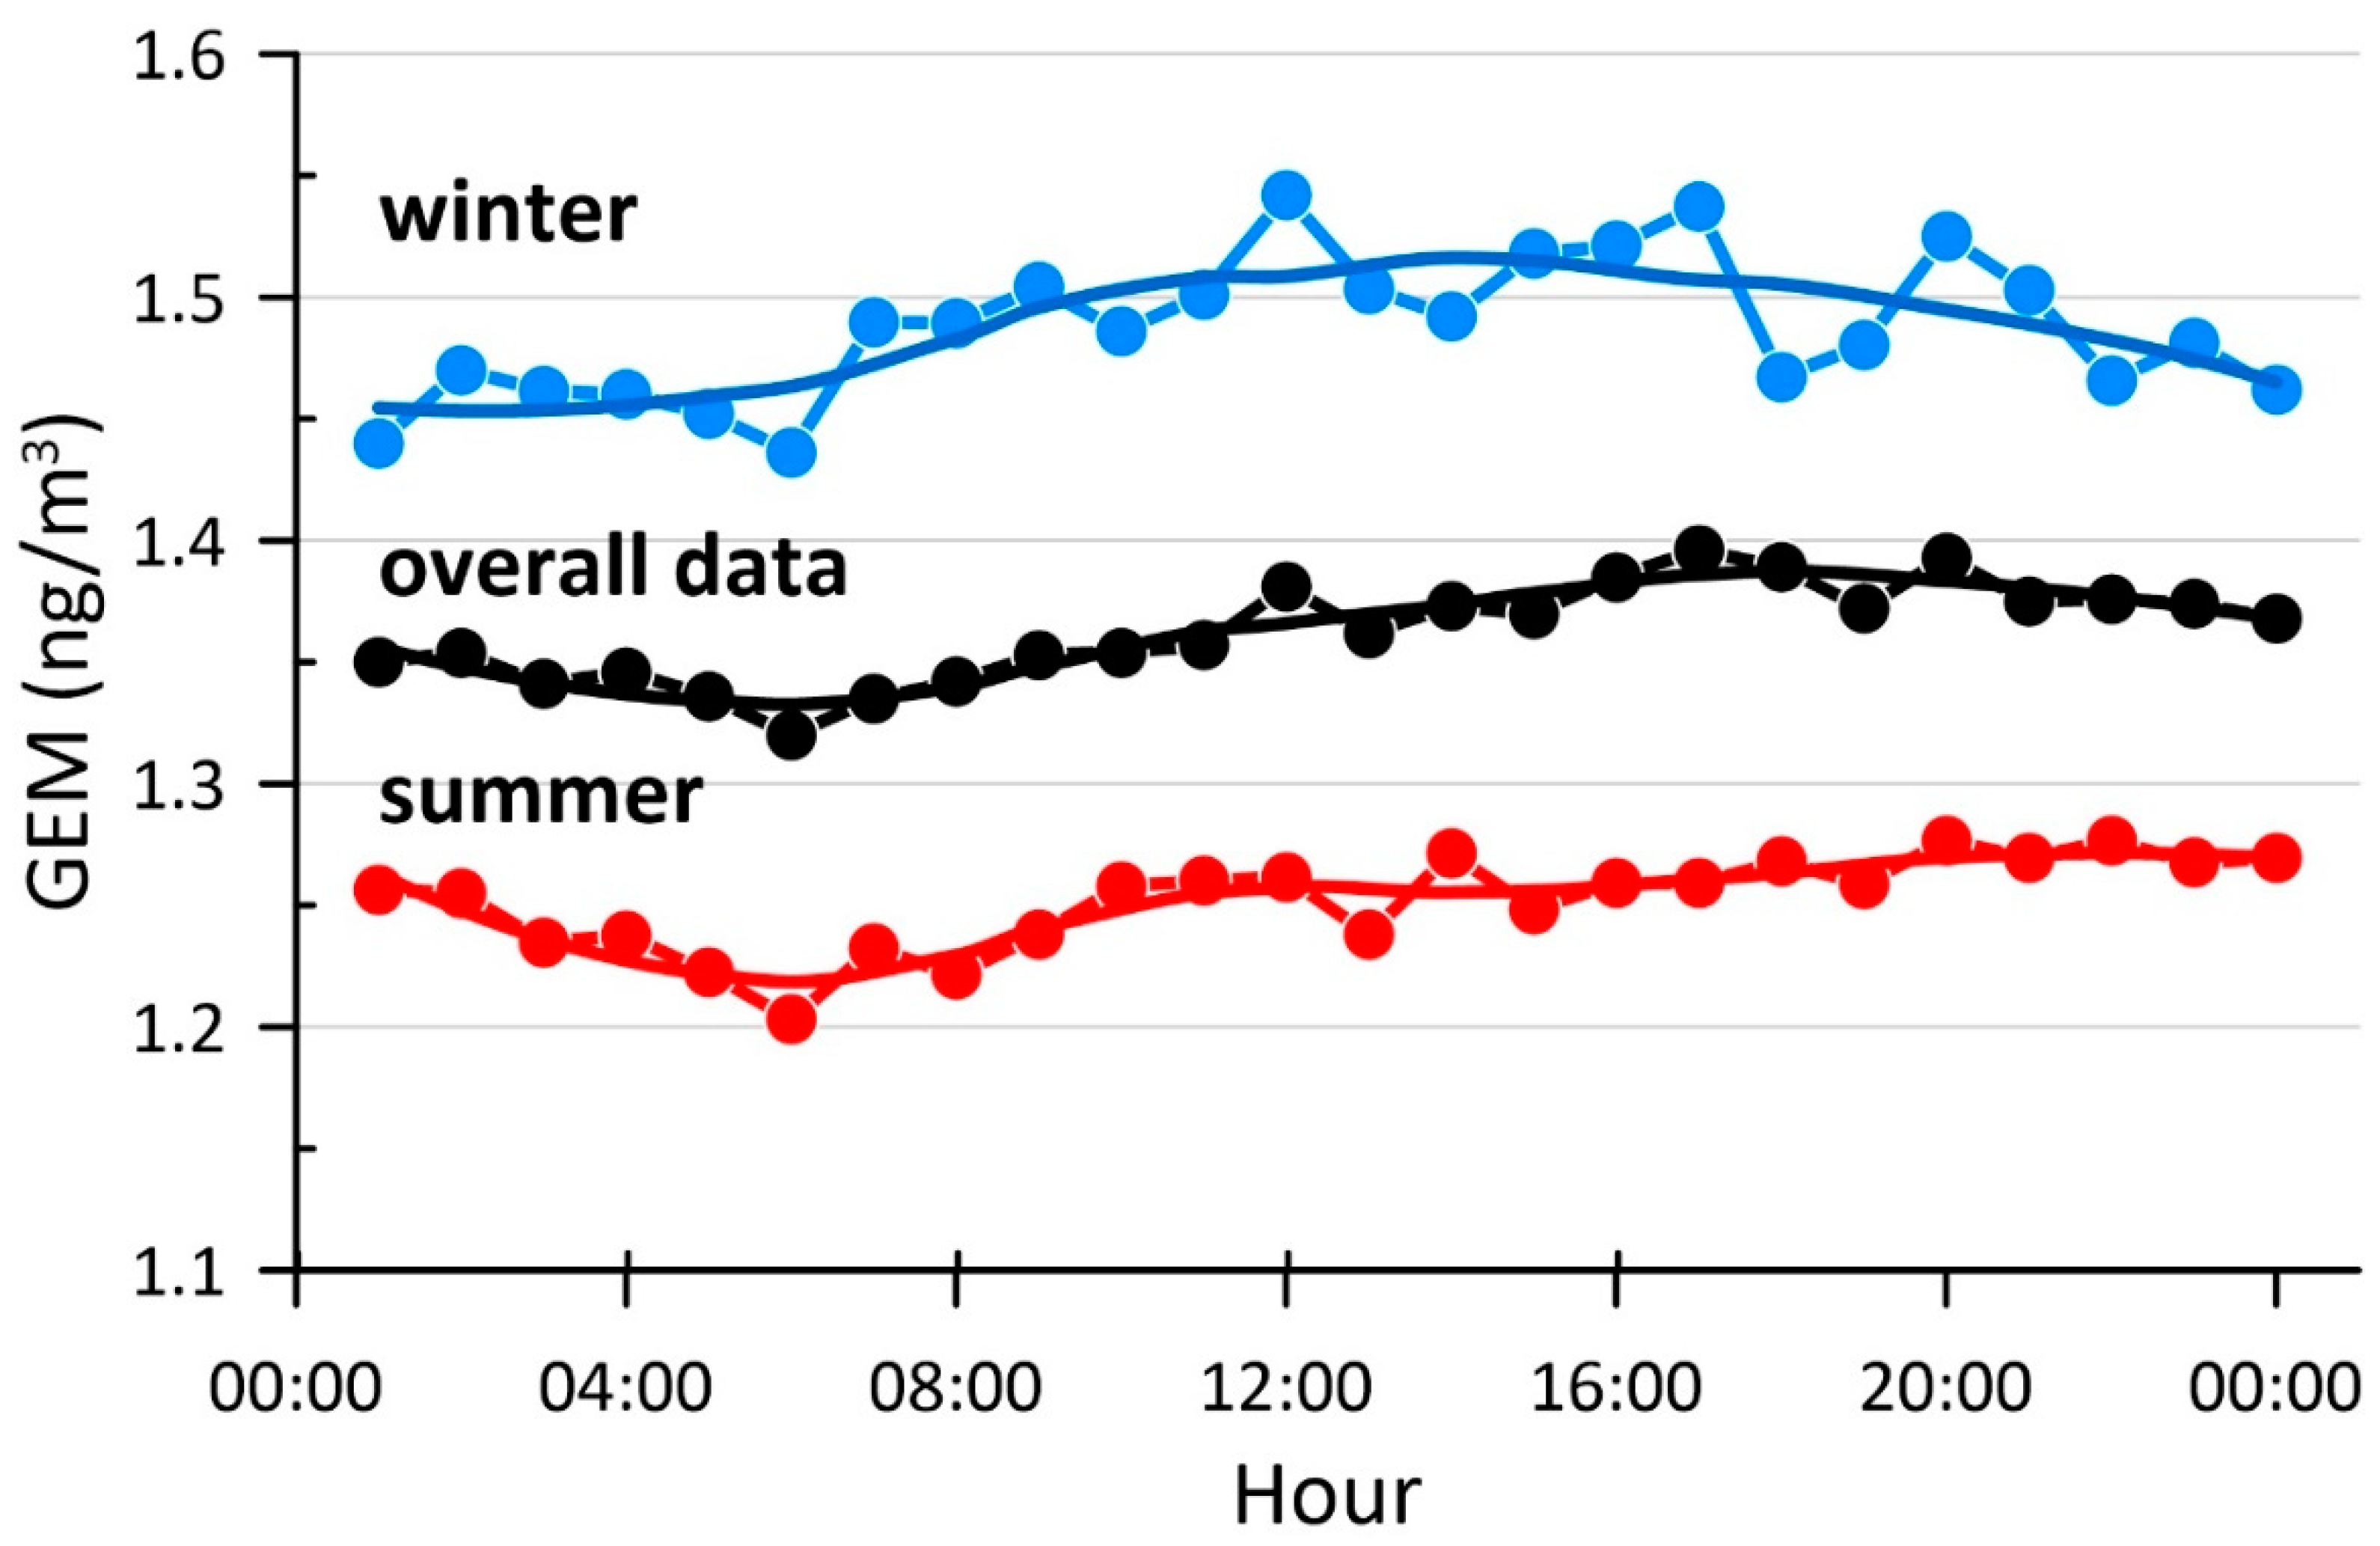
Data processing reveals a moderate, statistically significant, diurnal cycle of the mercury concentration both in the warm and cold seasons. Minimum concentration is observed at 1–6 a.m. local time, and then the concentration increases by 0.05 ng/m3 during daytime (Figure 7).
Mercury concentration and its variability are higher in the daytime. The increase in the concentration in the daytime may be attributed to the elevation of the ambient temperature and intensity of the surface and anthropogenic emissions. The corresponding increase in the concentration variability is explained by the air turbulence enhancement.
3.3. Short-Term Variations
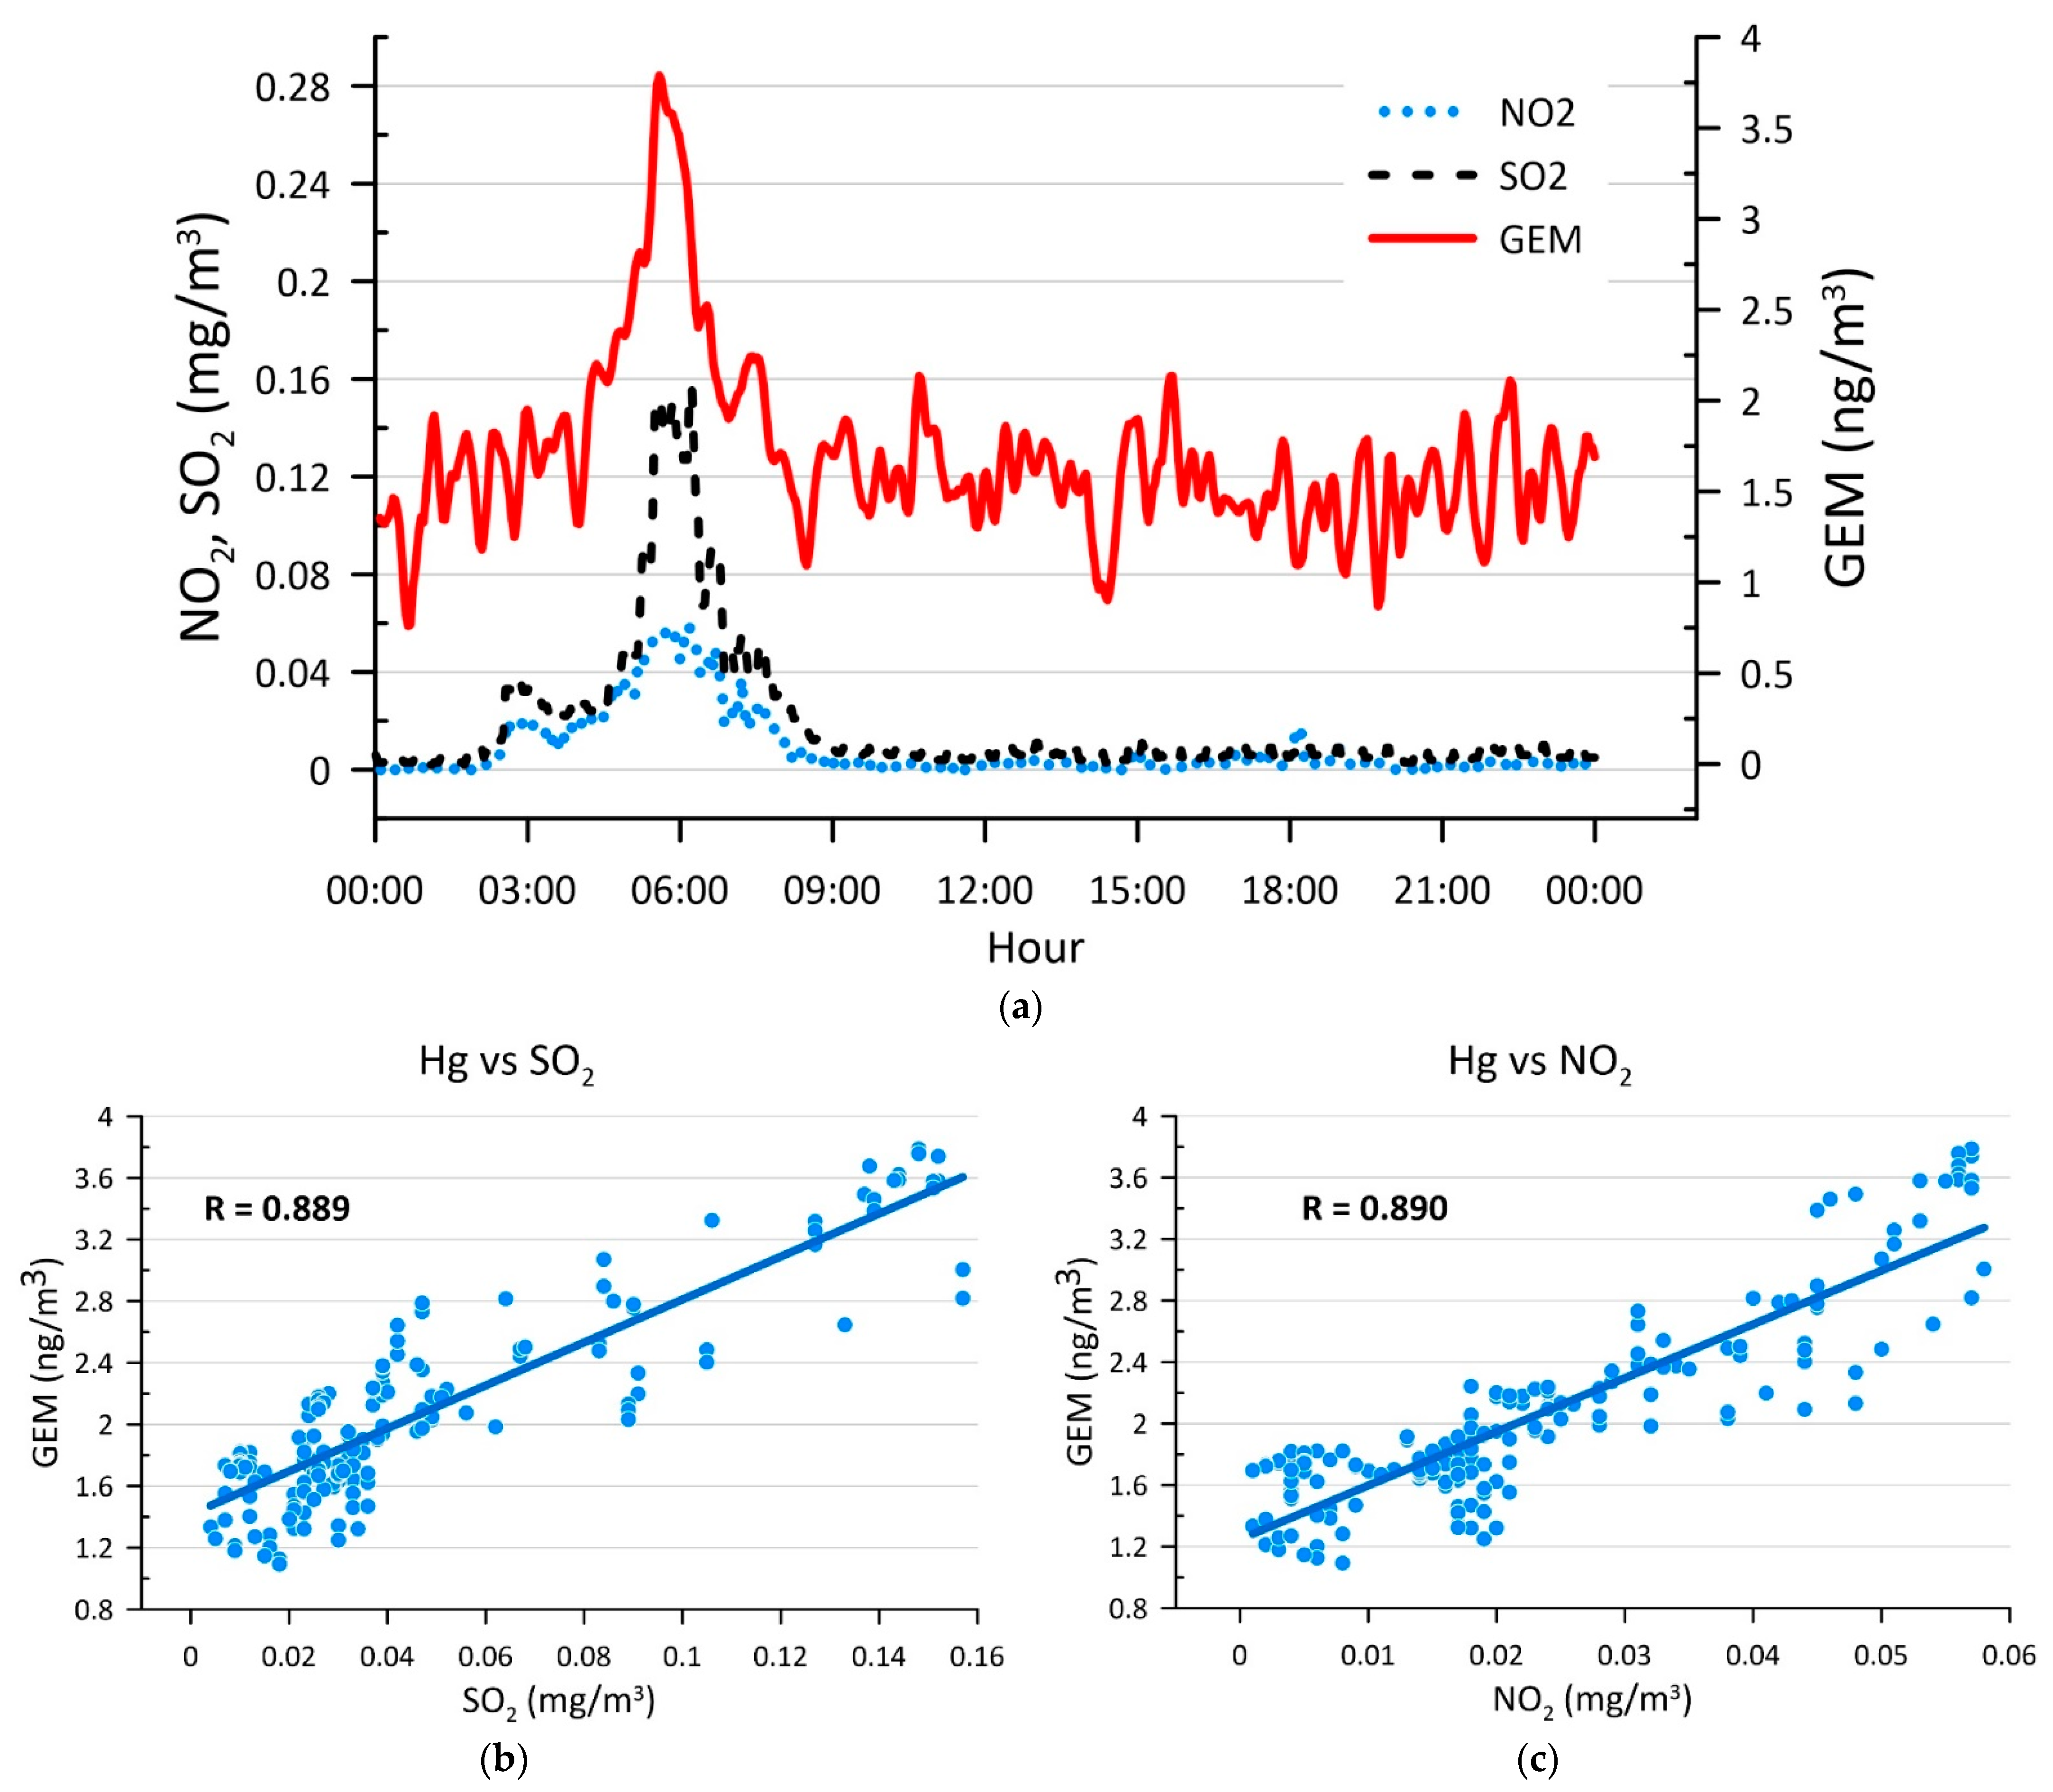
The short-term (minutes–hours) anomalies of the mercury concentration can reach the value up to 5–7, sometimes up to 15–20 ng/m3. There are no significant local sources of mercury emissions in the rural surroundings of the Listvyanka site. These short-term anomalies are traced to the mercury air transfer from regional sources of emissions, first of all, from coal-fired power plants located in Irkutsk, Angarsk, and Shelekhov cities 70 and 100 km away from the monitoring points. The long-range transport of acid gases with plumes from regional coal-fired power plants to the South Baikal area was proven by the monitoring data at the Listvyanka site and backward trajectories modelling [8,9]. The mercury observation within the GMOS program shows positive correlation of the mercury peaks with the local anomalies of the acid gases typical for the coal combustion emissions, such as SO2, and NO2 (Figure 8).
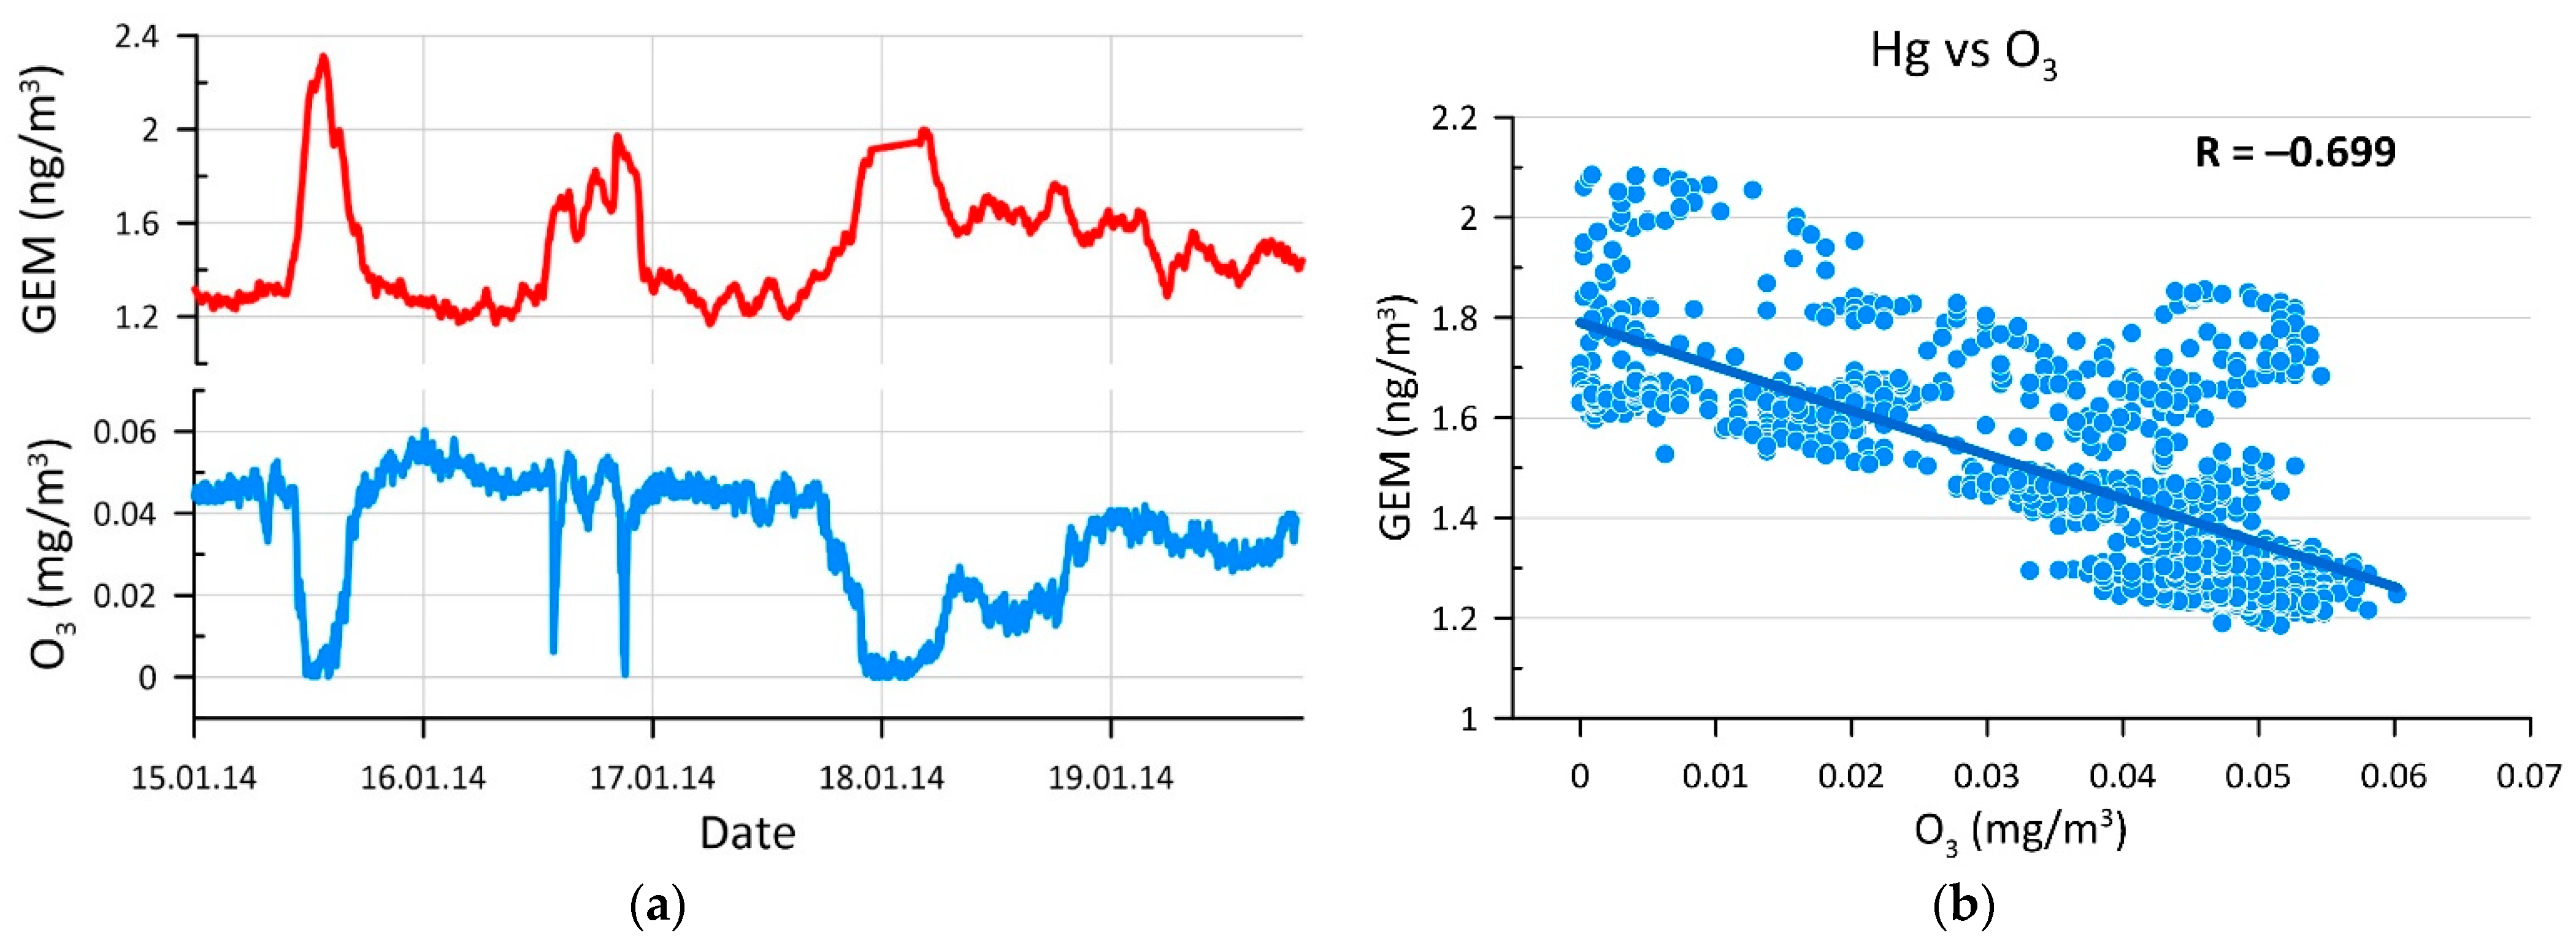
The initial composition of stack gas changes during atmospheric transport from the point source of emissions due to gas phase reactions [10,11]. Atmospheric ozone plays an important role in NO oxidation within plumes. The dominating reaction:
is faster as compared to the mixing rate that leads to the ozone deficit within the plume, relative to the background air [11]. Such reaction leads to the negative correlation of the mercury and ozone concentrations (Figure 9).
NO + O3 → NO2 + O2
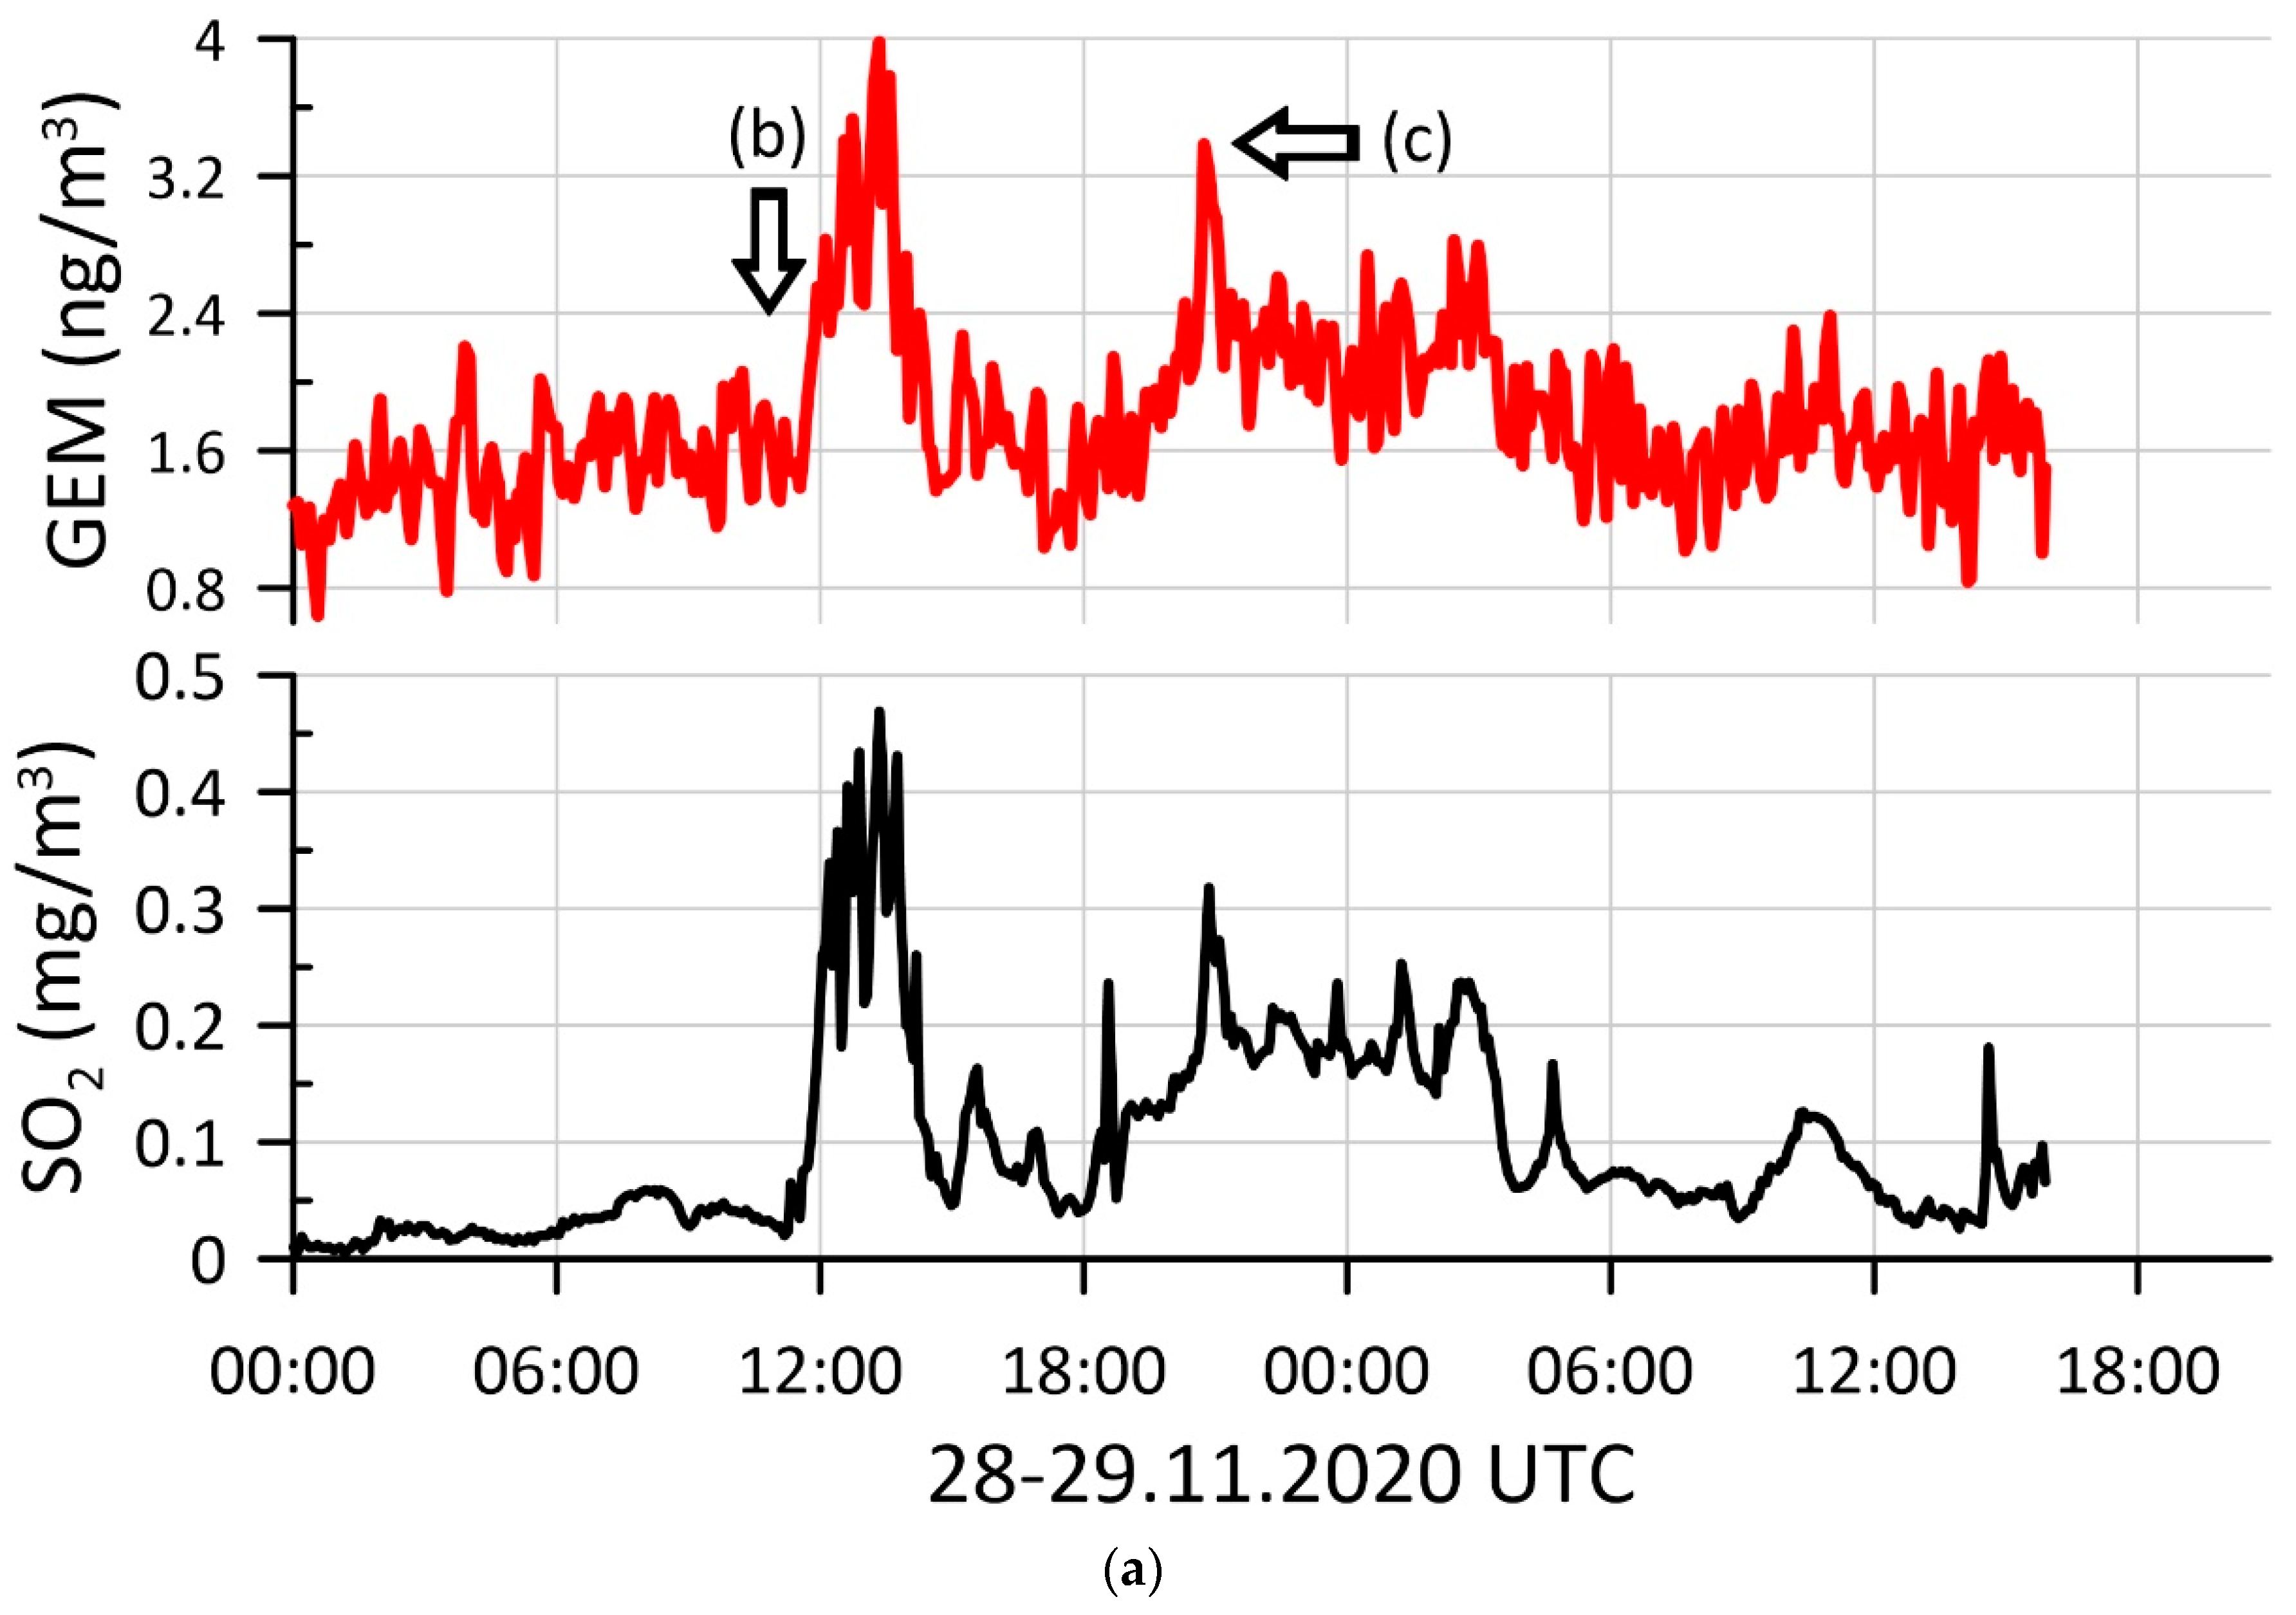
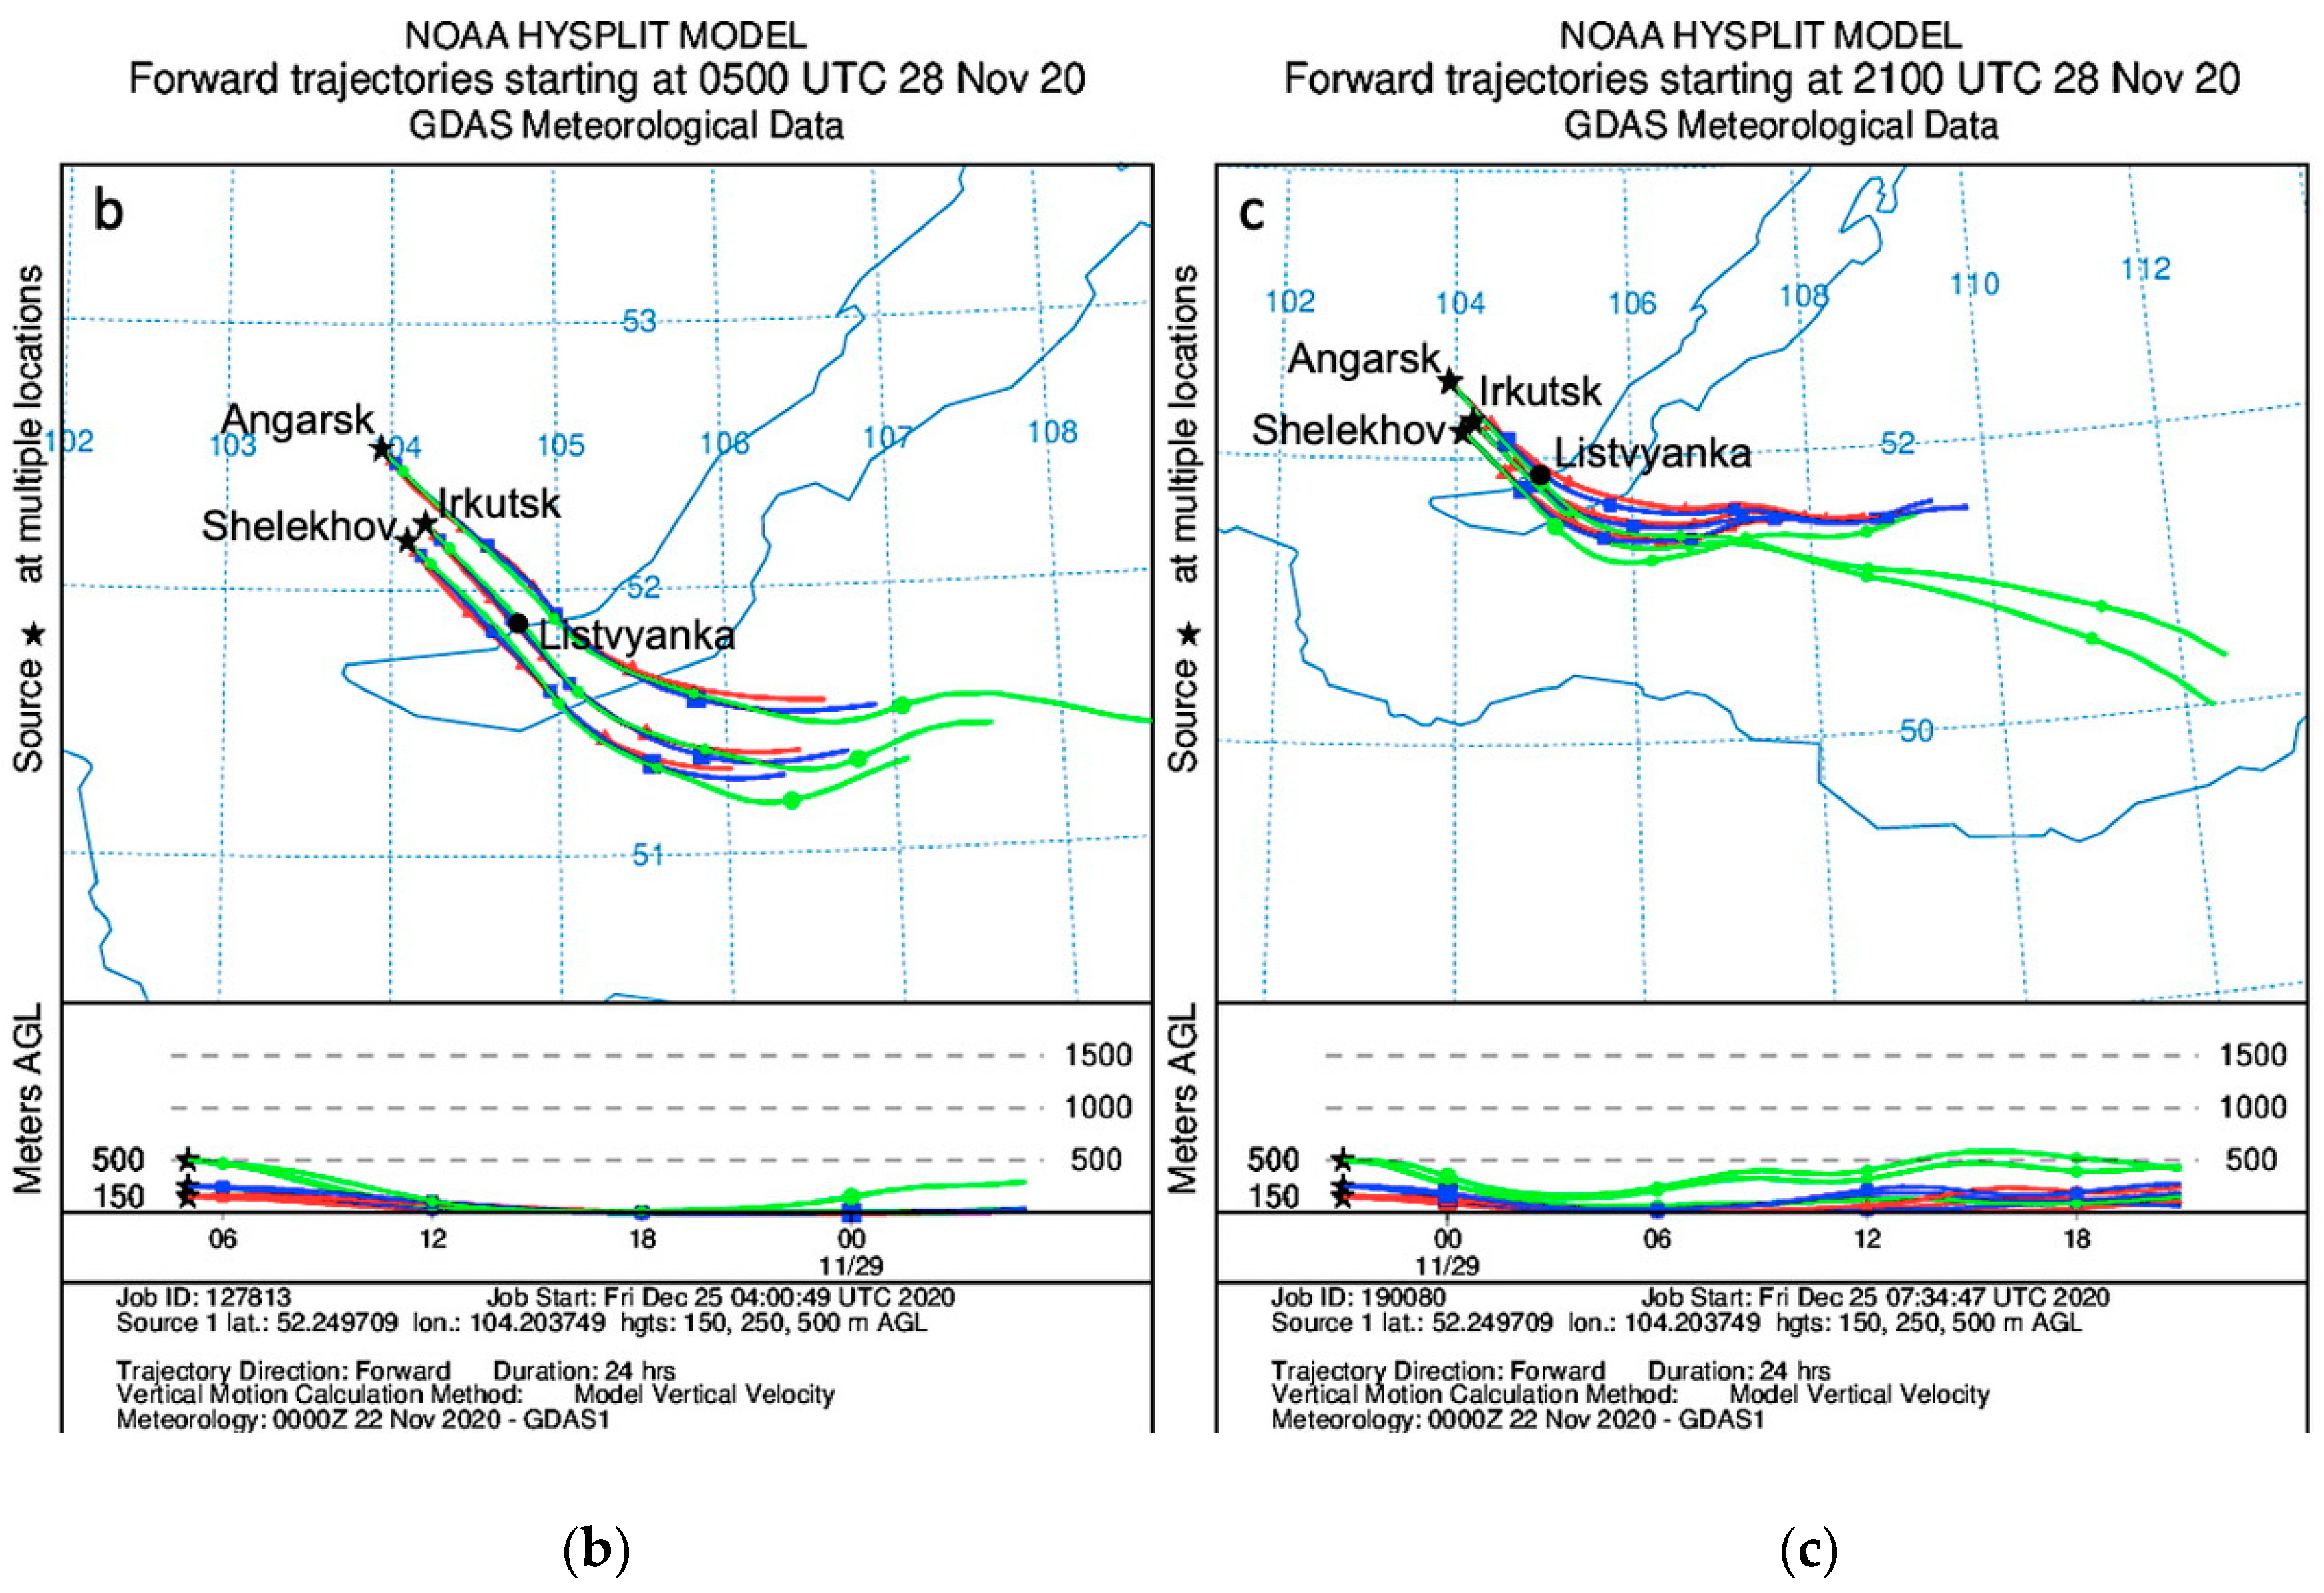
As it was shown earlier [8], the anomalies of acid gases combined with the ozone depletion are well explained by the meteorological phenomenon known as “low-level jet streams”: the long-distance plume transfer from remote sources of emissions in Angarsk, Irkutsk, and Shelekhov cities to South Baikal. To assess the relationship between mercury and acid gases anomalies registered at the Listvyanka site and the largest sources of industrial emissions, we used the HYSPLIT (Hybrid Single-Particle Lagrangian Integrated Trajectory) model [12], with air mass trajectories calculation at the three vertical levels of 50, 150, and 500 m.
An example of the long-distance air pollutants transfer with low-level jet streams is shown in Figure 10.
The correlated maxima of the SO2 and mercury concentrations at the Listvyanka monitoring site (Figure 10) are observed during superposition of air masses carrying plumes of coal-fired power plants from Angarsk, Irkutsk and Shelekhov cities.
4. Mercury in the Air over Lake Baikal
Baikal is the largest freshwater lake by volume containing approximately 22–23% of the world’s fresh water reserves. The largest length and width of the lake are 636 and 79.5 km, respectively. Baikal is the world’s deepest lake with a maximum depth of 1642 m. The lake is fed by more than 300 inflowing rivers and is drained through a single outlet located near Listvyanka village, called the Angara River.
To date, there is no data on the air mercury distribution over the vast Baikal basin. In July 2018, for the first time, the air mercury survey had been carried out throughout all the Baikal area during the cruise of the research vessel (RV) “Akademik Koptyug”. The continuous air mercury survey over Lake Baikal covered 1800 km.
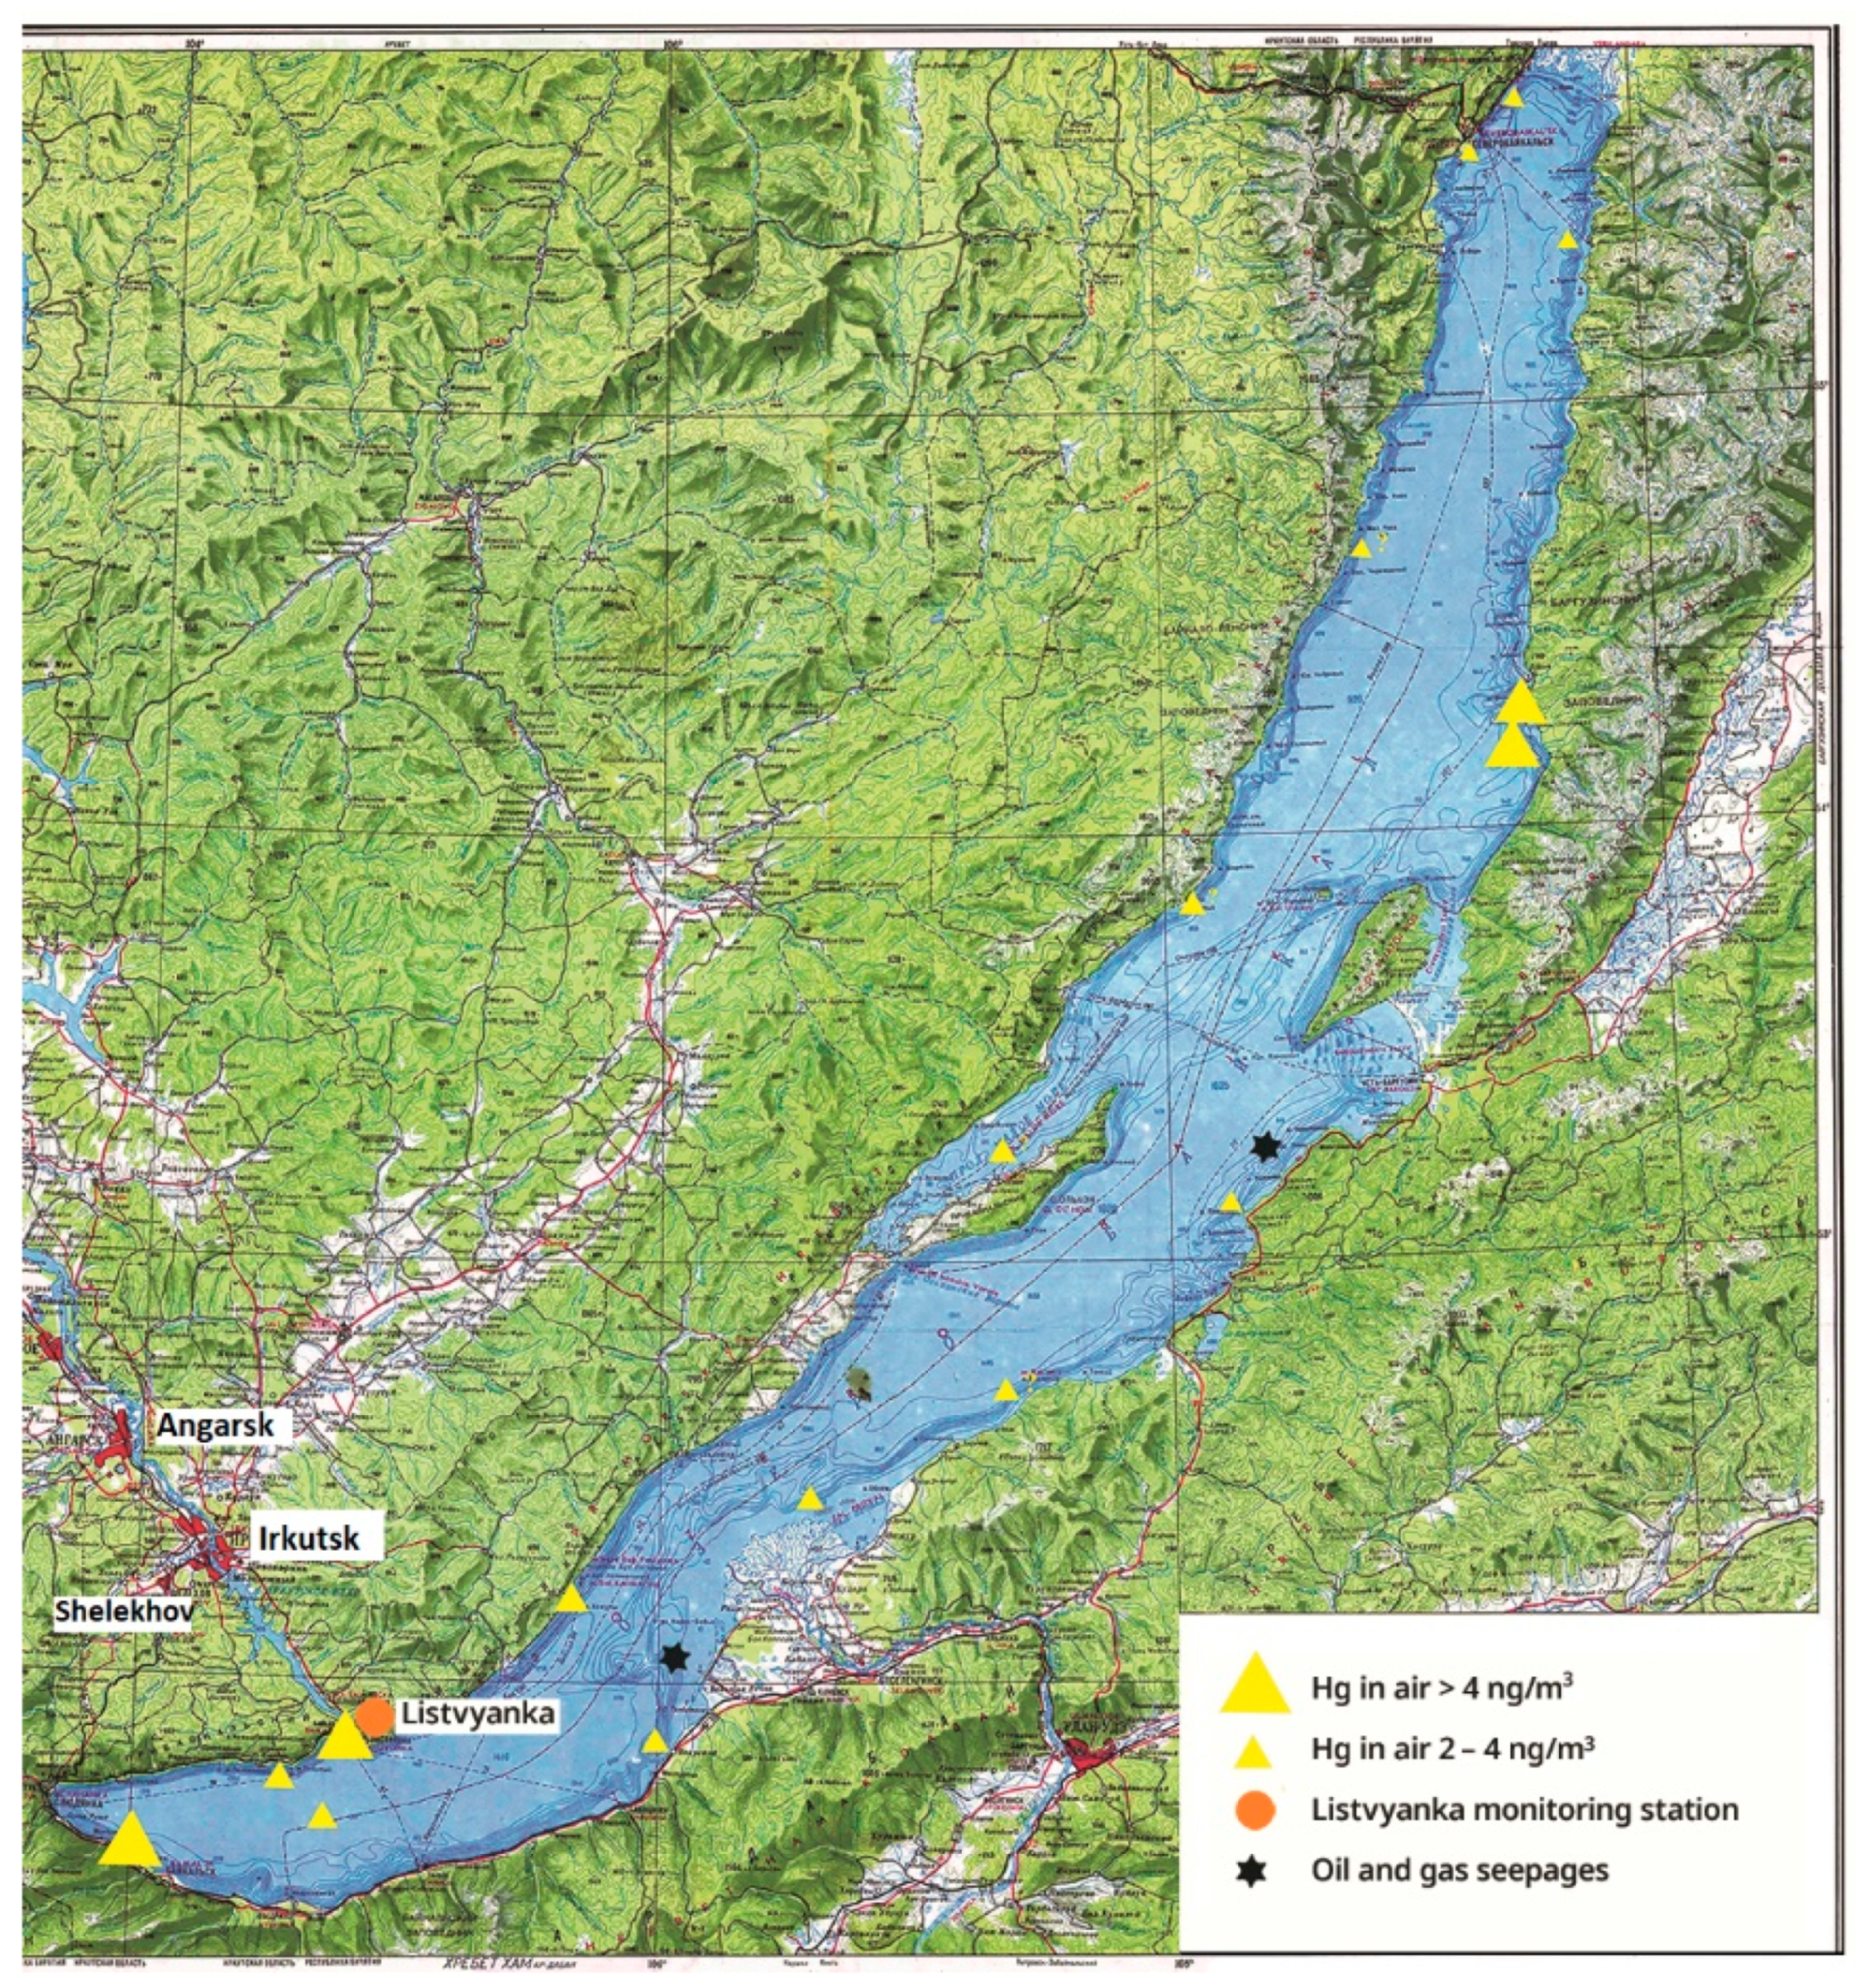
During the cruise, no significant anomalies of the mercury concentration in the air above the lake were found. The potential sources of the elevated mercury concentration up to 3–5 ng/m3 (see Figure 3) can be explained by the long-distance mercury transfer from the coal-fired power plants of industrial cities (Irkutsk, Angarsk, Shelekhov), described above, and the emissions sources of towns located along the lake shore (Figure 11).
Lake Baikal is located within the seismically active Baikal Rift Zone. Numerous hot springs and oil and gas seepages both on land and at lake bottom are present. Mercury degassing through deep fault zones could be potential natural sources of mercury emissions. However, we did not find unequivocal evidence of the connection of the air mercury anomalies with tectonic structures. The mercury concentration over the gas hydrate pools and oil seepages to the lake surface, up to 1.6 ng/m3, is slightly elevated as compared with the local background level of 1.0–1.1 ng/m3.
The average mercury concentration of 1.10 ng/m3 recorded over Baikal is notably less in comparison with the average value of 1.60 ng/m3 obtained at the onshore Listvyanka monitoring station during the same days of the cruise.
The explanation of this phenomenon may be in the specific air circulation over the Baikal water area in summer time. Due to the huge mass of cold water (with the average temperature of about 4 °C and surface temperature in summer of 10–12 °C), an inverted layer is formed in the atmosphere above the lake surface, which prevents the mixing of the air above the surface with the air masses coming from the continent. In June–July, over most of the lake area, the process of condensation of air moisture over the cold water surface occurs over most of the lake area. This leads to the enhanced polluting gaseous and aerosol impurities deposition enhancement. Under such conditions, Baikal can be considered as a sink of atmospheric mercury.
5. Conclusions
According to the long-term air mercury monitoring at the Listvyanka station, the following conclusions are drawn:
The average total (GEM) concentration is 1.59 ng/m3 throughout the 2011–2020 years of observation. The particulate bound mercury (PBM) makes up approximately 0.8% of GEM.
The daily average concentration of GEM varies within a range of 1.44 to 1.75 ng/m3 and that of PBM in a range of 7.8–15 pg/m3 in the warm and cold seasons, respectively, which is evidence of the elevated mercury emissions from coal combustion during the cold season.
Statistical data processing shows the moderate diurnal cycling of the mercury concentration at a lower level at night and higher level at daytime.
The space-time distribution and short-term variations of the mercury concentration indicate the long-distance (70–100 km) mercury transfer from the industrial sites where the coal-fired power plants are located.
The coal combustion plants are the main sources of the elevated mercury concentration at the Listvyanka site, which is confirmed by the evident correlation between the average Hg and SO2, NO2, and O3 concentrations.
The average mercury concentration measured during the cruise above Lake Baikal is 1.10 ng/m3, which is notably less as compared with the average value of 1.60 ng/m3 obtained at the onshore Listvyanka GMOS station during the same days of the cruise. Thus, Baikal can be a sink of the atmospheric mercury due to the air temperature inversion in the warm season.
The possibility of using the data of air mercury monitoring at stationary points and route surveys demonstrates feasible revealing of mercury emission sources.
Author Contributions
Conceptualization, N.M. and T.K.; methodology, N.M., V.O., V.R. and S.P.; software, S.S. and E.M.; formal analysis, S.S. and V.O.; investigation, V.O., N.M., S.P., V.P., data curation, S.S., V.O. and N.M.; writing—original draft preparation, N.M., V.O., S.S., S.P. and V.R. and; visualization, N.M., V.O., V.R., S.S., V.P. and E.M.; supervision, N.M. and T.K.; funding acquisition, N.M. and T.K. All authors have read and agreed to the published version of the manuscript.
Funding
This study was carried out in accordance with project “Global Mercury Observation System” FP7, grant Agreement No 265113. The cruise monitoring of 2018 was supported by the Russian Foundation for Basic Research, grant No 17-29-05044. The results obtained in 2020 were supported by the Ministry of Science and Higher Education of the Russian Federation (No 075-15-2020-787) for implementation of the large scientific project “Fundamentals, methods and technologies for digital monitoring and forecasting of the environmental situation on the Baikal natural territory”.
Institutional Review Board Statement
Not applicable.
Informed Consent Statement
Not applicable.
Data Availability Statement
Data supporting reported results can be found at https://sdi.iia.cnr.it/gmos/ (accessed on 21 June 2021).
Conflicts of Interest
The authors declare no conflict of interest.
References
- Sprovieri, F.; Pirrone, N.; Bencardino, M.; D’amore, F.; Carbone, F.; Cinnirella, S.; Mannarino, V.; Landis, M.; Ebinghaus, R.; Weigelt, A.; et al. Atmospheric mercury concentrations observed at ground-based monitoring sites globally distributed in the framework of the GMOS network. Atmos. Chem. Phys. 2016, 16, 11915–11935. [Google Scholar] [CrossRef] [PubMed] [Green Version]
- Cinnirella, S.; D’Amore, F.; Bencardino, M.; Sprovieri, F.; Pirrone, N. The GMOS cyber(e)-infrastructure: Advanced services for supporting science and policy. Environ. Sci. Pollut. 2014, 21, 4193–4208. [Google Scholar] [CrossRef]
- Sholupov, S.; Pogarev, S.; Ryzhov, V.; Mashyanov, N.; Stroganov, A. Zeeman atomic absorption spectrometer RA-915 for direct determination of mercury in air and complex matrix samples. Fuel Process. Technol. 2004, 85, 473–485. [Google Scholar] [CrossRef]
- Brown, R.J.C.; Pirrone, N.; van Hoek, C.; Sprovieri, F.; Fernandez, R.; Tote, K. Standardisation of a European measurement method for the determination of total gaseous mercury: Results of the field trial campaign and determination of a measurement uncertainty and working range. J. Environ. Monit. 2010, 12, 689–695. [Google Scholar] [CrossRef] [PubMed]
- Weigelt, A.; Ebinghaus, R.; Pirrone, N.; Bieser, J.; Bödewadt, J.; Esposito, G.; Slemr, F.; van Velthoven, P.F.J.; Zahn, A.; Ziereis, H. Tropospheric mercury vertical profiles between 500 and 10 000 m in central Europe. Atmos. Chem. Phys. 2015, 15, 28217–28247. [Google Scholar]
- Osterwalder, S.; Eugster, W.; Feigenwinter, I.; Jiskra, M. First eddy covariance flux measurements of gaseous elemental mercury (Hg0) over a grassland. Atmos. Meas. Tech. 2020, 13, 2057–2074. [Google Scholar] [CrossRef] [Green Version]
- Sommar, J.; Osterwalder, S.; Zhu, W. Recent advances in understanding and measurement of Hg in the environment: Surface-atmosphere exchange of gaseous elemental mercury (Hg0). Sci. Total Environ. 2020, 721, 137648. [Google Scholar] [CrossRef] [PubMed]
- Obolkin, V.A.; Potemkin, V.L.; Makukhin, V.L.; Chipanina, E.V.; Marinayte, I.I. Low-level atmospheric jets as main mechanism of long-range transport of power plant plumes in the Lake Baikal Region. Intern. J. Environ. Stud. 2014, 71, 391–397. [Google Scholar]
- Obolkin, V.A.; Potemkin, V.L.; Makukhin, V.L.; Khodzher, T.V.; Chipanina, E.V. Long-range transport of plumes of atmospheric emissions from regional coal power plants to the South Baikal water basin. Atmos. Ocean Opt. 2017, 30, 360–365. [Google Scholar] [CrossRef]
- Hegg, D.; Hobbs, P.V.; Radke, L.F.; Harrison, H. Reactions of ozone and nitrogen oxides in power plant plumes. Atmos. Environ. 1977, 11, 521–526. [Google Scholar] [CrossRef]
- Cocks, A.T.; Kallend, A.S.; Marsh, A.R.W. Dispersion limitations of oxidation in power plant plumes during long-range transport. Nature 1983, 305, 122–123. [Google Scholar] [CrossRef]
- Draxler, R.R.; Rolph, G.D. HYSPLIT (Hybrid Single-Particle Lagrangian Integrated Trajectory Model). 2013. Available online: https://www.scienceopen.com/document?vid=3c4d79f1-5098-4dbd-83f3-64a0020f78da (accessed on 21 June 2021).
Figure 1.
Listvyanka monitoring station: (a) location within the GMOS network; (b) aerial view.

Figure 2.
Measurement technique: (a) The RA-915AM air mercury monitor; (b) The RA-915M portable mercury analyzer.
Figure 2.
Measurement technique: (a) The RA-915AM air mercury monitor; (b) The RA-915M portable mercury analyzer.

Figure 3.
An example of concurrent measurements with two RA-915M analyzers during Baikal cruise. Record of 23.07.2018: (a) Analyzer № 1865; (b) Analyzer № 1621. Dots: zero control.
Figure 3.
An example of concurrent measurements with two RA-915M analyzers during Baikal cruise. Record of 23.07.2018: (a) Analyzer № 1865; (b) Analyzer № 1621. Dots: zero control.

Figure 4.
Direct analysis of the whole aerosol filters: (a) The set of the RA-915M analyzer and PYRO-915+ attachment; (b) The analyses of two filters exposed in parallel. The measured PBM concentration is (1) 17.1 and (2) 15.9 pg/m3.
Figure 4.
Direct analysis of the whole aerosol filters: (a) The set of the RA-915M analyzer and PYRO-915+ attachment; (b) The analyses of two filters exposed in parallel. The measured PBM concentration is (1) 17.1 and (2) 15.9 pg/m3.

Figure 5.
Listvyanka: seasonal variation of the Hg (GEM) concentration through November 2011–December 2020, monthly average.
Figure 5.
Listvyanka: seasonal variation of the Hg (GEM) concentration through November 2011–December 2020, monthly average.

Figure 6.
Listvyanka: Seasonal variations of the GEM and PBM during 20 January 2016–20 March 2017, monthly average.
Figure 6.
Listvyanka: Seasonal variations of the GEM and PBM during 20 January 2016–20 March 2017, monthly average.

Figure 7.
Diurnal behavior of the mercury concentration (local time, UTC +8). ‘Winter’ (1 December 2013–28 February 2014 and 1 December 2014–28 February 2015); each point is the average over 170 h (2040 individual 5-min readings). ‘Overall data’ (1 April 2013–1 April 2015); each point is the average over 650 h (7800 individual 5-min readings). ‘Summer’ (1 July–30 September 2013 and July–30 September 2014); each point is the average over 150 h (1800 individual 5-min readings).

Figure 8.
Measurement on 17.10.2020, 5-min average (a). Correlation between: (b) Hg and SO2, (c) Hg and NO2.
Figure 8.
Measurement on 17.10.2020, 5-min average (a). Correlation between: (b) Hg and SO2, (c) Hg and NO2.

Figure 9.
An example of the negative mercury and ozone correlation: (a) Data of 16–20 January 2014, 5-min average; (b) Ozone vs. mercury concentration.
Figure 9.
An example of the negative mercury and ozone correlation: (a) Data of 16–20 January 2014, 5-min average; (b) Ozone vs. mercury concentration.

Figure 10.
Evidence of the SO2 and Hg long-distance plumes transfer with low-level jet streams: (a) Simultaneous record of the SO2 and Hg concentrations; the forward air trajectories modelling: (b) At UTC 11:00 plumes pass the Listvyanka monitoring point; (c) At UTC 23:00 a superposition of the plumes from Angarsk, Irkutsk and Shelekhov at the monitoring point.


Figure 11.
Local mercury anomalies in the air over Lake Baikal. Cruise of the RV “Akademik Koptyug”, July 2018.
Figure 11.
Local mercury anomalies in the air over Lake Baikal. Cruise of the RV “Akademik Koptyug”, July 2018.


Table 1.
Monthly average air mercury concentration at the Listvyanka station for cold and warm seasons (ng/m3).
Table 1.
Monthly average air mercury concentration at the Listvyanka station for cold and warm seasons (ng/m3).
| Season | 2011–2012 | 2012–2013 | 2013–2014 | 2014–2015 | 2015–2016 | 2016–2017 | 2017–2018 | 2018–2019 | 2019–2020 | Seasonal Average |
|---|---|---|---|---|---|---|---|---|---|---|
| Cold (November–February) | 1.89 | 1.67 | 1.70 | 1.71 | 1.70 | 1.56 | 1.95 | 1.84 | 1.72 | 1.75 |
| Warm (June–September) | 1.42 | 1.37 | 1.50 | 1.51 | 1.31 | 1.12 | 1.53 | 1.63 | 1.55 | 1.44 |
Publisher’s Note: MDPI stays neutral with regard to jurisdictional claims in published maps and institutional affiliations. |
© 2021 by the authors. Licensee MDPI, Basel, Switzerland. This article is an open access article distributed under the terms and conditions of the Creative Commons Attribution (CC BY) license (https://creativecommons.org/licenses/by/4.0/).
Share and Cite
MDPI and ACS Style
Mashyanov, N.; Obolkin, V.; Pogarev, S.; Ryzhov, V.; Sholupov, S.; Potemkin, V.; Molozhnikova, E.; Khodzher, T. Air Mercury Monitoring at the Baikal Area. Atmosphere 2021, 12, 807. https://doi.org/10.3390/atmos12070807
AMA Style
Mashyanov N, Obolkin V, Pogarev S, Ryzhov V, Sholupov S, Potemkin V, Molozhnikova E, Khodzher T. Air Mercury Monitoring at the Baikal Area. Atmosphere. 2021; 12(7):807. https://doi.org/10.3390/atmos12070807
Chicago/Turabian StyleMashyanov, Nikolay, Vladimir Obolkin, Sergey Pogarev, Vladimir Ryzhov, Sergey Sholupov, Vladimir Potemkin, Elena Molozhnikova, and Tamara Khodzher. 2021. "Air Mercury Monitoring at the Baikal Area" Atmosphere 12, no. 7: 807. https://doi.org/10.3390/atmos12070807
Note that from the first issue of 2016, this journal uses article numbers instead of page numbers. See further details here.