Changes in Precipitation and Drought Extremes over the Past Half Century in China


1
Institute of Hydrogeology and Environmental Geology, Chinese Academy of Geological Sciences, Shijiazhuang 050061, China
2
Center for Agricultural Resources Research, Institute of Genetics and Developmental Biology, Chinese Academy of Sciences, Shijiazhuang 050021, China
3
Center for Remote Sensing of Natural Resources and Environment, College of Land Resource and Urban and Rural Planning, Hebei GEO University, Shijiazhuang 050031, China
*
Author to whom correspondence should be addressed.
Atmosphere 2019, 10(4), 203; https://doi.org/10.3390/atmos10040203
Submission received: 1 March 2019
/
Revised: 9 April 2019
/
Accepted: 10 April 2019
/
Published: 15 April 2019
(This article belongs to the Special Issue Weather and Climate Extremes: Current Developments)
Abstract
:Changes in climate extremes have become a hot issue in the research field of climate change recently. Many studies have reported that climate extremes have occurred more frequently and with increasing intensity in recent decades. In this study, thresholds of precipitation and drought extremes were determined by the cumulative distribution function, and their spatiotemporal changes over the past half-century in China were analyzed by relative change rate. The results show that: (1) precipitation extremes increased in all regions except North China, while increasing trends of drought extremes were detected in all regions except Northwest China and the Qing–Tibet Plateau; (2) the maximum change rates in frequency of precipitation extremes were found in Northwest China and the Qing–Tibet Plateau, with values of 16.13% and 8.12%, and the maximum change rates in frequency of drought extremes were in Southwest and Southeast China, whose increases in intensity of drought extremes were also the maximum; (3) variation in precipitation extremes showed a relatively mixed pattern with higher heterogeneity compared to that of drought extremes; and (4) changes in precipitation and drought extremes relate to mid-intensity, lower-intensity, and annual precipitation.
1. Introduction
Nowadays, one of the hottest issues of global concern is climate change and its impacts. In recent years, extreme climate events have occurred more frequently under continuous global warming [1,2]. A climate extreme is defined as the occurrence of an extreme weather or climate event with a weather or climate variable having a value above (or below) a threshold near the upper (or lower) end of the range of observed values of the variable [3]. Climate extremes, especially precipitation extreme (PE) and drought extreme (DE), interacting with exposed and vulnerable human and natural systems can lead to disasters. Shifts in the frequency and intensity of climate extremes have more profound and lasting impacts on nature and human society than do gradual changes in climate.
The number of studies on climate extremes all over the world has risen sharply in recent years. Most of these studies are mainly focused on the trends of extremes, their attributes, and socioeconomic impacts, both globally and regionally, observed and projected [4,5,6,7,8,9,10,11,12,13,14]. There was a general perception that climate extremes have occurred more frequently in recent decades based on natural hazard records, as compiled by the insurance sector [15]. Climate extreme studies usually include two categories of indices: precipitation and temperature. Precipitation indices are mainly used in studies of precipitation and drought extremes. Many studies have found that extreme precipitation has increased due to global warming. Frich et al. (2002) [12] investigated the changes in 10 indicators of climatic extremes, and found significant increases in the amount derived from wet spells and the number of heavy rainfall events, though more mixed patterns of changes were shown by indicators based on daily precipitation data. Increasing extreme rainfall trends were reported in the United States [16,17], Argentina [18], Australia, southern China [19,20,21], South Africa [22], and New Zealand [23], among other places. Globally, areas affected by extreme drought have increased since the 1970s. Nastos et al. (2009) [24] investigated changes in extremes in Greece during the period 1958–2007 and found an insignificant increasing trend of consecutive dry days (CDD) in almost the whole country, with an emphasis on the southeastern region. In the first decade of the 21st century, Australia experienced one of the worst droughts in the region in the last 200 years [25,26].
Changes of climate extremes in China have usually been 5–10 times the magnitude of average climate change, and sometimes showed an opposite trend to that of the average climate in the past half-century [27]. In indices of PE and DE, Zhai et al. (1999) [28] found a statistically significant reduction in the numbers of annual rain days and in rain days with different daily precipitation intensity, but a positive trend of precipitation intensity during 1951–1995. This may indicate an increase in both PE and DE. Wang et al. (2009) [29] found that the frequency of extreme precipitation increased in most of China, except North and Southwest China, but average intensity showed a decreasing trend from 1951 to 2004. Yang et al. (2008) [30] also concluded that PE decreased in Northeast China, North China, and the eastern part of Northwest China, but increased in the western part of Northwest China and the middle and lower reaches of the Yangtze River. Gong et al. (2005) [31] divided the dry spells into two levels according to the number of dry days, and reported that an increasing frequency of short dry spells was observed in Southwest, North, and Northeast China, and of long dry spells in North and Northeast China. Regionally, Wang et al. (2013) concluded that consecutive dry days significantly decreased in Northeast China [32]. Gong et al. (2004) [33] analyzed the characteristics of daily precipitation in semiarid regions in China and found that precipitation had a slightly decreasing tendency, while long dry spells became more frequent at a rate of 7.2% per decade. In the Loess Plateau of China, Li et al. (2010) also concluded that there were insignificant changes in precipitation extremes during 1961–2007, though heavy rainfall days spatially increased from the northwest to the southeast [34]. Su et al. (2008) [21] reported that heavy precipitation increased in the middle-lower reaches of the Yangtze. Li et al. (2011) [35] found an insignificant increasing trend in annual, winter, spring, and autumn extreme precipitation during 1960–2008 in the Hengduan Mountains. Wang et al. (2017) [36] investigated variations in extreme precipitation in the coastal areas, reporting a generally insignificant positive trend in the southern coastal area and a negative trend in the northern coastal area. Studies of climate extremes based on precipitation indices in China were more focused on PE, and less on DE. There has been more research in local regions or basins, and less in China as a whole due to strong regional and subregional variations in changes in PE. In DE analysis, several studies focusing on all of China were usually with the same threshold values spatially or specific threshold levels, e.g., short dry spell and long dry spell.
The goal of this study was to determine the threshold spatial distribution of PE and DE in China and analyze their spatiotemporal changes in frequency and intensity based on six regions. The threshold of drought extreme was determined by the cumulative distribution function (CDF) based on the relationship of a series of consecutive dry days with a series of occurrence probability. The threshold of precipitation extreme was also determined by the CDF, based on daily precipitation from 1971 to 2000, the recent World Meteorological Organization (WMO) standard climate period. The spatiotemporal change pattern was determined by analyzing the relative change rate between two different periods.
2. Experiments
2.1. Background of Climate in China
Located in the eastern part of Eurasia, China has a complex terrain and diverse climatic types, including a continental monsoon climate. Annual temperature decreases from southeast to northwest, with the highest temperature in South China and the lowest at the northern border and the Qing–Tibet Plateau (Figure 1a). Annual precipitation also decreases from southeast to northwest, with the highest precipitation greater than 1600 mm, in the southeast coastal region, and the lowest precipitation less than 50 mm, in the desert region of the northwest (Figure 1b). Regionally, annual temperature is on a significant increasing trend all over China (Figure 2a). It is reported that China experienced a warming trend with increased surface air temperature by 1.1 °C over the past 50 years and 0.5–0.8 °C over the past 100 years, slightly higher than the global temperature increase for the same periods [37]. Annual precipitation in the humid region (mainly including Southeast China and Southwest China) and the arid region (mainly including the Qing–Tibet Plateau and Northwest China) of China showed increasing trends, and a negative trend in the semihumid/semiarid regions (mainly including Northeast and North China, and the border area between the Qing–Tibet Plateau and Southwest China) (Figure 2b). The trends in aridity index indicate a warmer and wetter climate in the humid and arid regions, and a warmer and drier climate in the semihumid/semiarid regions [38]. Under the intricate background of hydrographical characteristics and climate change, climate extremes associated with heavy rainfalls, floods, and droughts in China usually give rise to catastrophic material damage and fatalities. Therefore, studying the changes of climate extremes in China is of great significance, not only regionally, but also globally, because they could be used as an indicator to deal with climate change over diverse settings.
2.2. Data
Data for this study were provided by the China Meteorological Administration from approximately 680 stations throughout China from 1 January 1961 to 31 January 2008. Observations mainly include daily precipitation, with the corresponding type and amount recorded. There are six types of readings: (1) no precipitation, (2) zero precipitation (trace precipitation, daily precipitation reading less than 0.1 mm), (3) precipitation from rainfall, (4) precipitation from snow and rain, (5) precipitation from pure snow, and (6) precipitation from frost, fog, and dew. All days with the latter type of precipitation are regarded as non-precipitation days because precipitation from frost, fog, and dew is considerably low in our analysis. Data in this study were quality controlled; if there were missing observations longer than 6 days, the data series of the meteorological station was not used; for stations with missing observations less than 6 days, the missing ones were interpolated by inverse distance weighted interpolation. After filtering data for missing observations, 500 stations were considered in this analysis. Since drought events are always related to consecutive dry days, we put the data in a time-consecutive order. Since the only way to get climatic information is to make measurements and to enlarge the available meteorological network, our analysis was based on the actual observation stations, but not the interpolated uniform grids due to the serious difficulties in interpolation measurements to a uniform grid [39].
2.3. Determination of Extreme Indices
Selecting an appropriate threshold is a critical problem in climate extreme analysis. An event with a too-low threshold cannot be called a climate extreme event, and a too-high threshold will generate few excesses. To examine the changes of such extremes over time, a variety of extreme climate indices should be selected first, such as the intensity of daily precipitation per year, which exceed or fail to exceed specific absolute thresholds. However, what is considered as an extreme threshold in one region might not be adaptable to another, e.g., a precipitation extreme in Northwest China could be considered quite normal in Southeast China. To overcome this problem, thresholds based on CDF for each meteorological station were also defined. To ensure that the index time series could be easily extended into the future, the base period was usually chosen to be consistent with a recent World Meteorological Organization (WMO) operational climatology base period (e.g., 1961–1990 or 1971–2000). In this study, the period 1971–2000 was used.
2.3.1. Thresholds of Precipitation and Drought Extremes
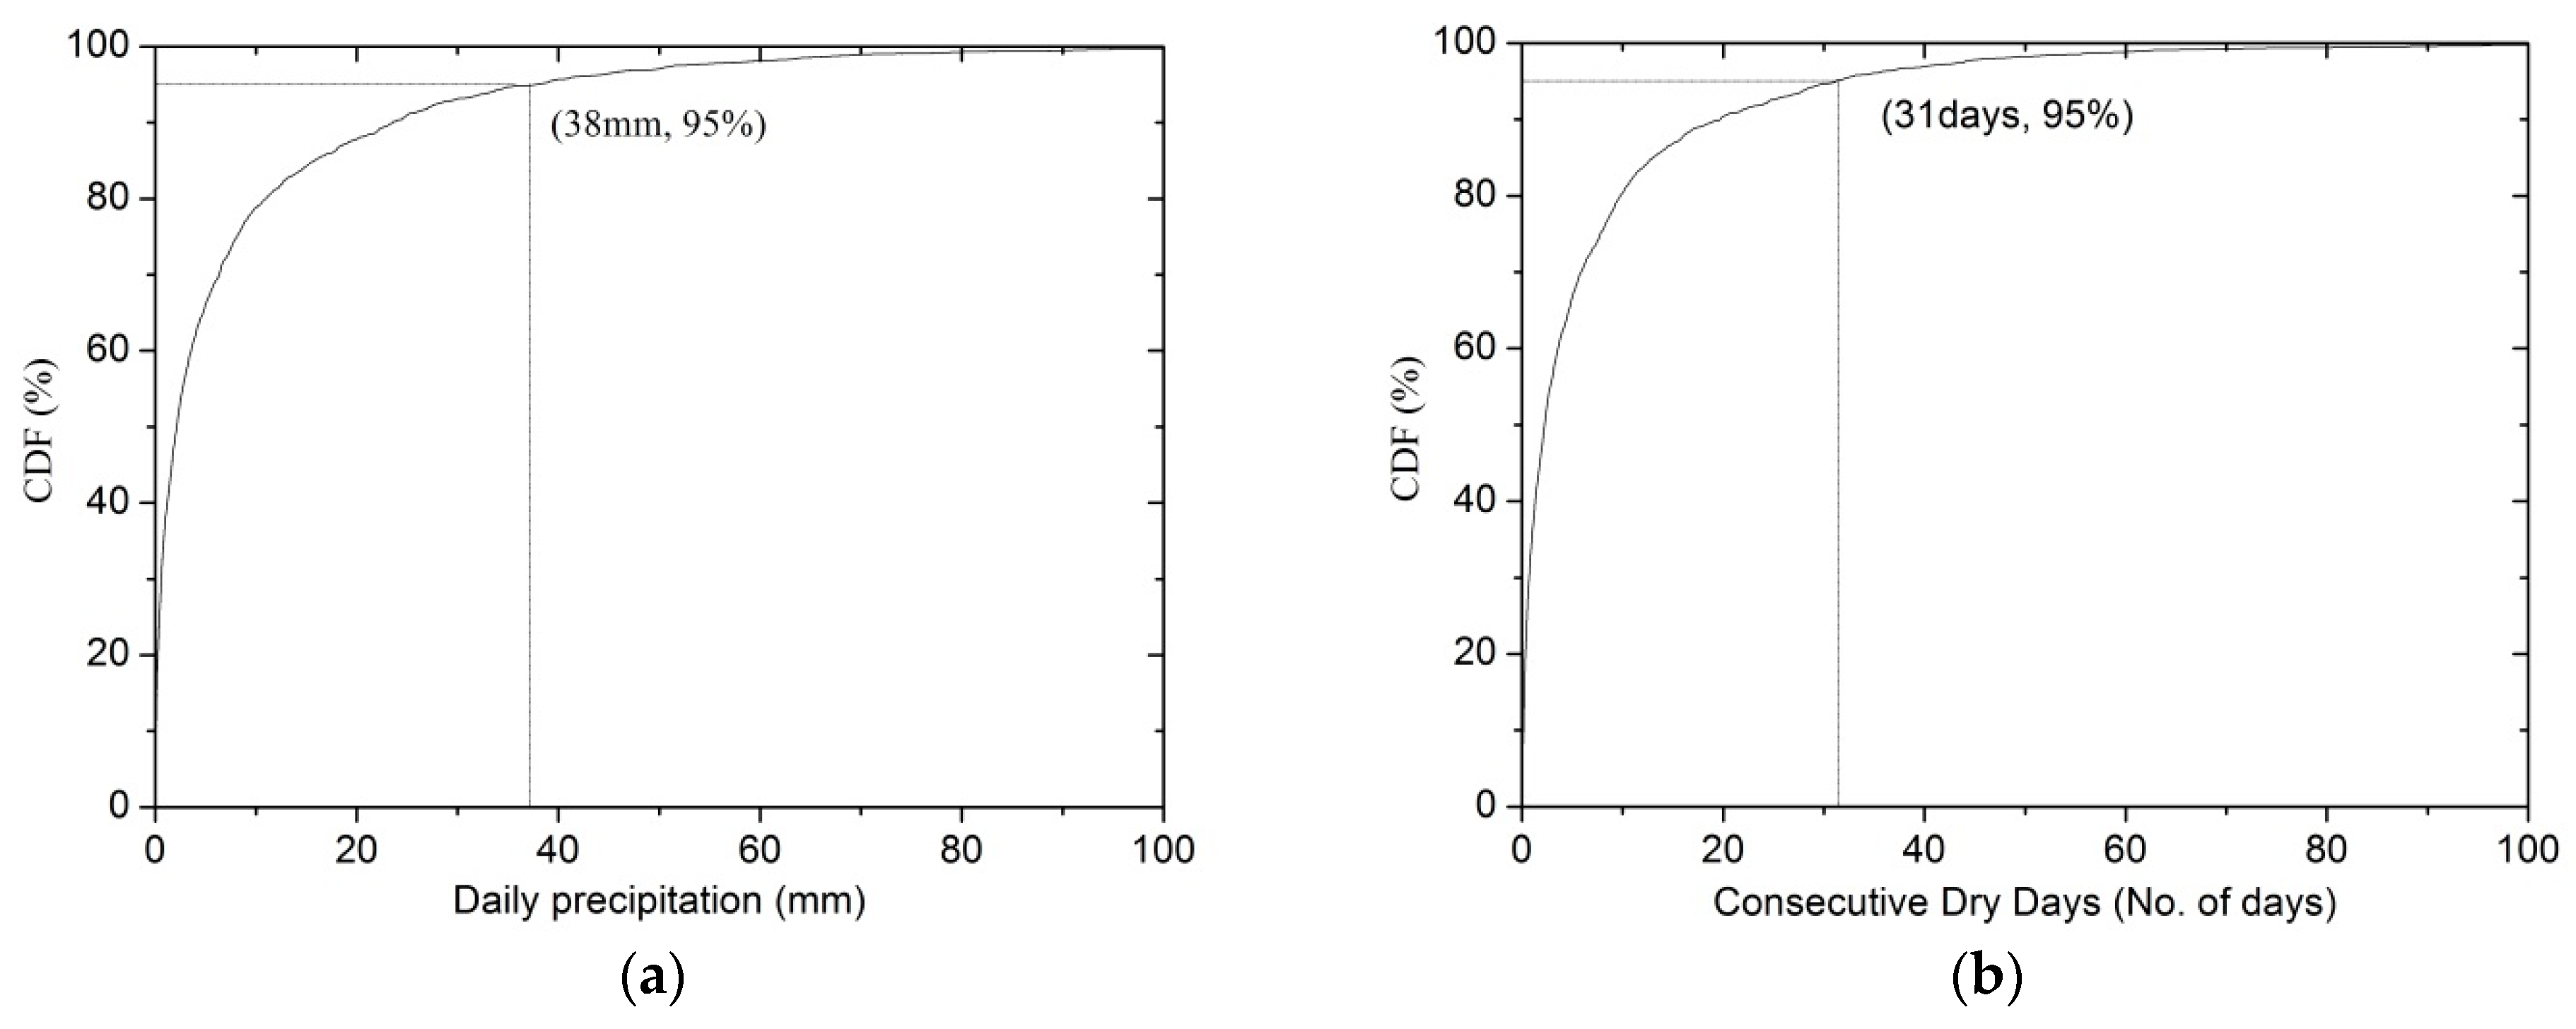
The cumulative distribution function (CDF) is a useful and efficient tool for comprehensive descriptions of distributions of any climatological variables. Supposing F(x) is the CDF, it can be regarded as the proportion of the population whose value is less than x. In this study, the 95th percentile was chosen as the PE threshold grade. This is a fraction of total daily precipitation that exceeds the 95th percentile of the distribution for daily amounts (daily precipitation greater than or equal to 0.1 mm) from 1971 to 2000, and the corresponding precipitation value is the PE threshold value (Figure 3a). For instance, in Figure 3a, daily precipitation greater than 38.0 mm can be regarded as a PE event. Using this method, PE thresholds at each meteorological station can be determined.
Consecutive dry days (CDD) without rainfall can lead to and enhance drought stress. The longer the rainless days, the greater the drought stress. In order to investigate the changes of DE in China, we chose a supposed level of CDD as the DE threshold for each meteorological station. That is, if an observed CDD is longer than the supposed CDD, it can be called a DE event. CDD in this study refers to consecutive days with daily rainfall less than 0.1 mm, which are climatically nonprecipitation days. The threshold value was obtained in the following ways. The CDD series were obtained by arithmetic progression, i.e., 2, 5, 8, …, and the corresponding times of occurrence of each CDD element during 1971 to 2000 were computed based on the relationship between the CDD series and its frequency occurrence series, the probability density function of CDD could be established, and then the cumulated distribution function (Figure 3b). The 95th percentile was also chosen as the DE threshold, i.e., if an observed CDD was longer than the corresponding 95th percentile CDD value, it could be called a DE event.
2.3.2. Frequency and Intensity Index Selections of Precipitation and Drought Extremes
Once the threshold was defined, the threshold exceedance time series was estimated to obtain our climate extreme indices. For the frequency of PE and DE, we took the times of their occurrence as the indices. For the intensity of PE, we chose the maximum daily precipitation (MDP) of each year instead of the average intensities of exceedance values. For the intensity of DE, we chose annual maximum consecutive dry days (MCDD) as the index instead of the average intensity of threshold exceedance.
2.4. Relative Change Rate
Issues with data availability are particularly important when examining changes in given climate extremes [40]. Indeed, the more rare the event, the more difficult it is to determine long-term changes, simply because there are fewer cases to evaluate [41,42]. Trend analysis of PE was usually done with low confidence due to the rare threshold exceedance and its high degree of dispersion, especially in arid areas, so we used the relative change rate method [43] in this study to evaluate the changes in frequency and intensity of precipitation and droughts extremes.
For better spatial comparison and analysis, the unit was normalized in the analysis of trends in PE and DE change rates between two periods, i.e., the ratio of the difference of annual mean between the two periods to the annual mean of the reference period. The formula can be described as follows [44]:
where is the relative change rate, is the annual mean frequency/intensity of PE (or DE) in the reference period, and is that of the target period.
3. Results
3.1. Threshold Spatial Patterns of Precipitation and Drought Extremes
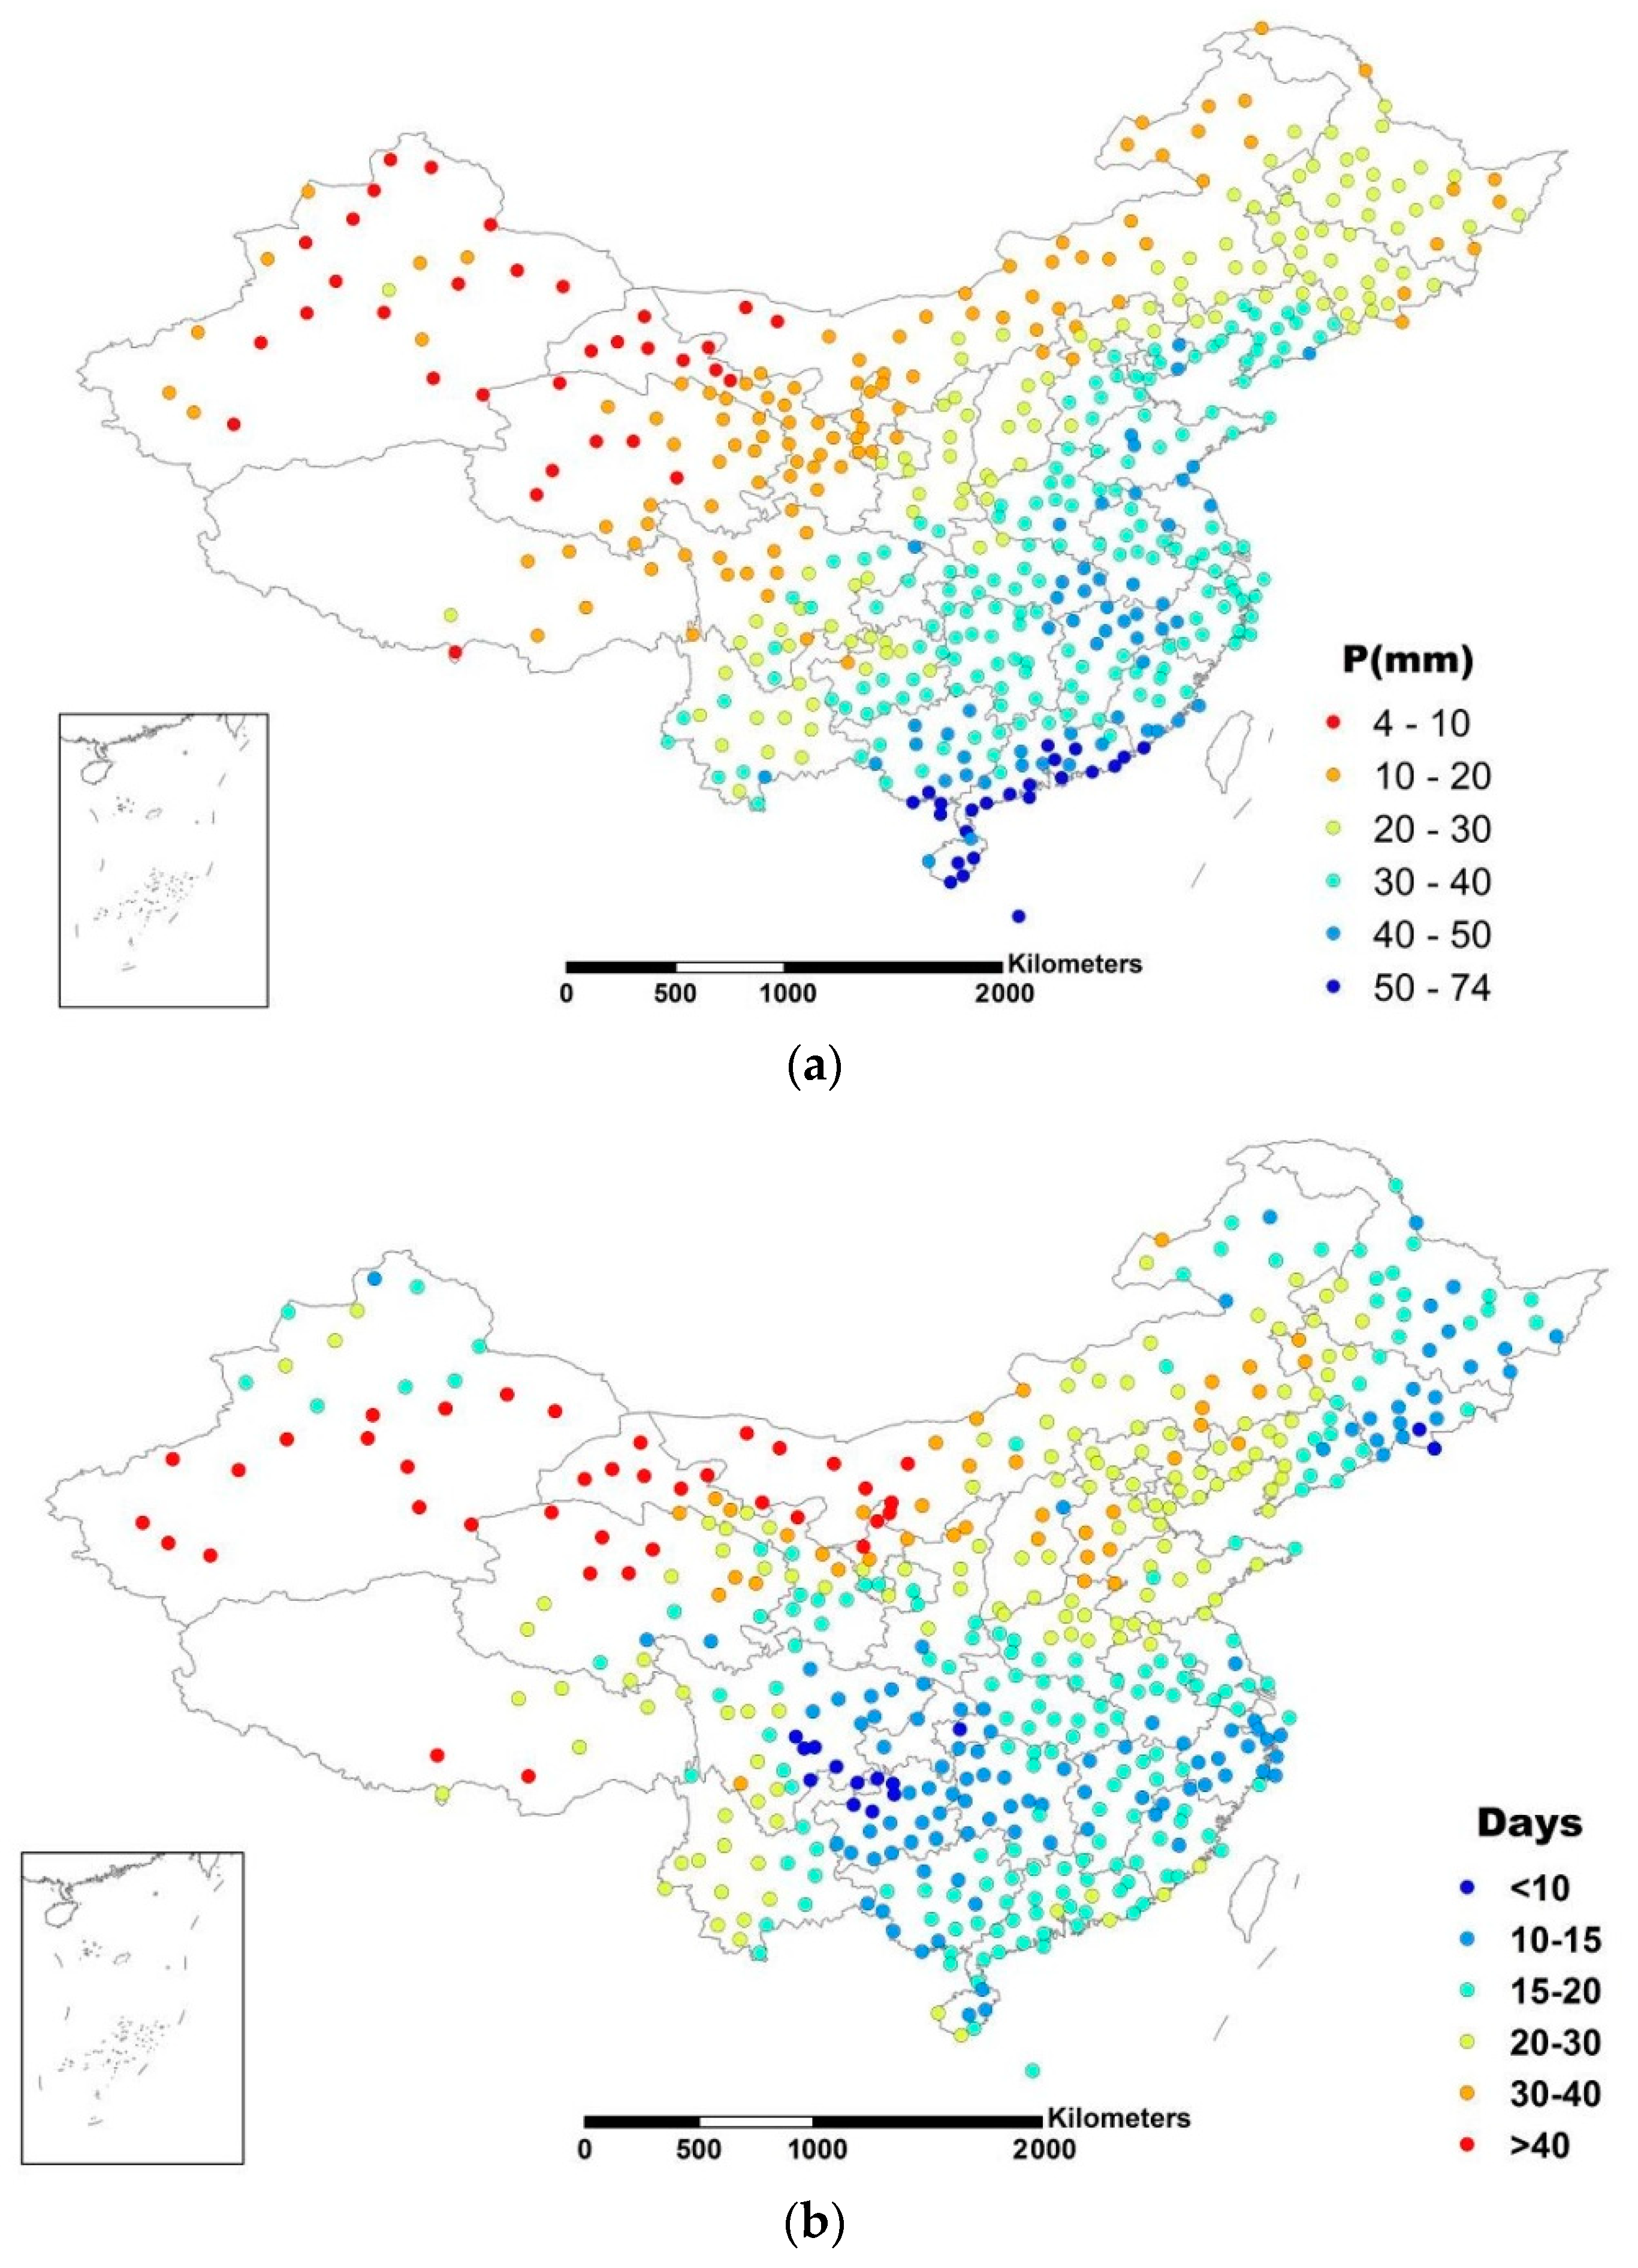
The spatial distribution of PE thresholds is shown in Figure 4a. The threshold distribution pattern was similar to the annual precipitation isohyet pattern. The value was lowest in the northwest and got larger from northwest to southeast. In Northwest China, an arid region, daily precipitation less than 10 mm could be recognized as an extreme precipitation event, while in South China, it should be greater than 50 mm to be called an extreme precipitation event. In semiarid/semihumid regions, the thresholds ranged from 10 mm to 30 mm in general, and in humid regions, the thresholds were all greater than 30 mm, and greater than 40 mm in the Jianghuai Basin in the lower reaches of the Yangtze region.
On the contrary, the DE threshold values increased from southeast to northwest generally (Figure 4b), with the minimum thresholds distributed in the middle-lower reaches of the Yangtze region and the maximum in the desert region of Northwest China. This means that CDD longer than about 10 days could be considered as DE events in the middle-lower reaches of the Yangtze region, while in the desert region of Northwest China, CCD longer than 40 days or even longer can be recognized as DE events, and in North China, the threshold ranges from 20 to 40 days.
3.2. Spatial Patterns of the Changes in Precipitation and Drought Extremes
3.2.1. Relative Change Rate of Precipitation Extreme
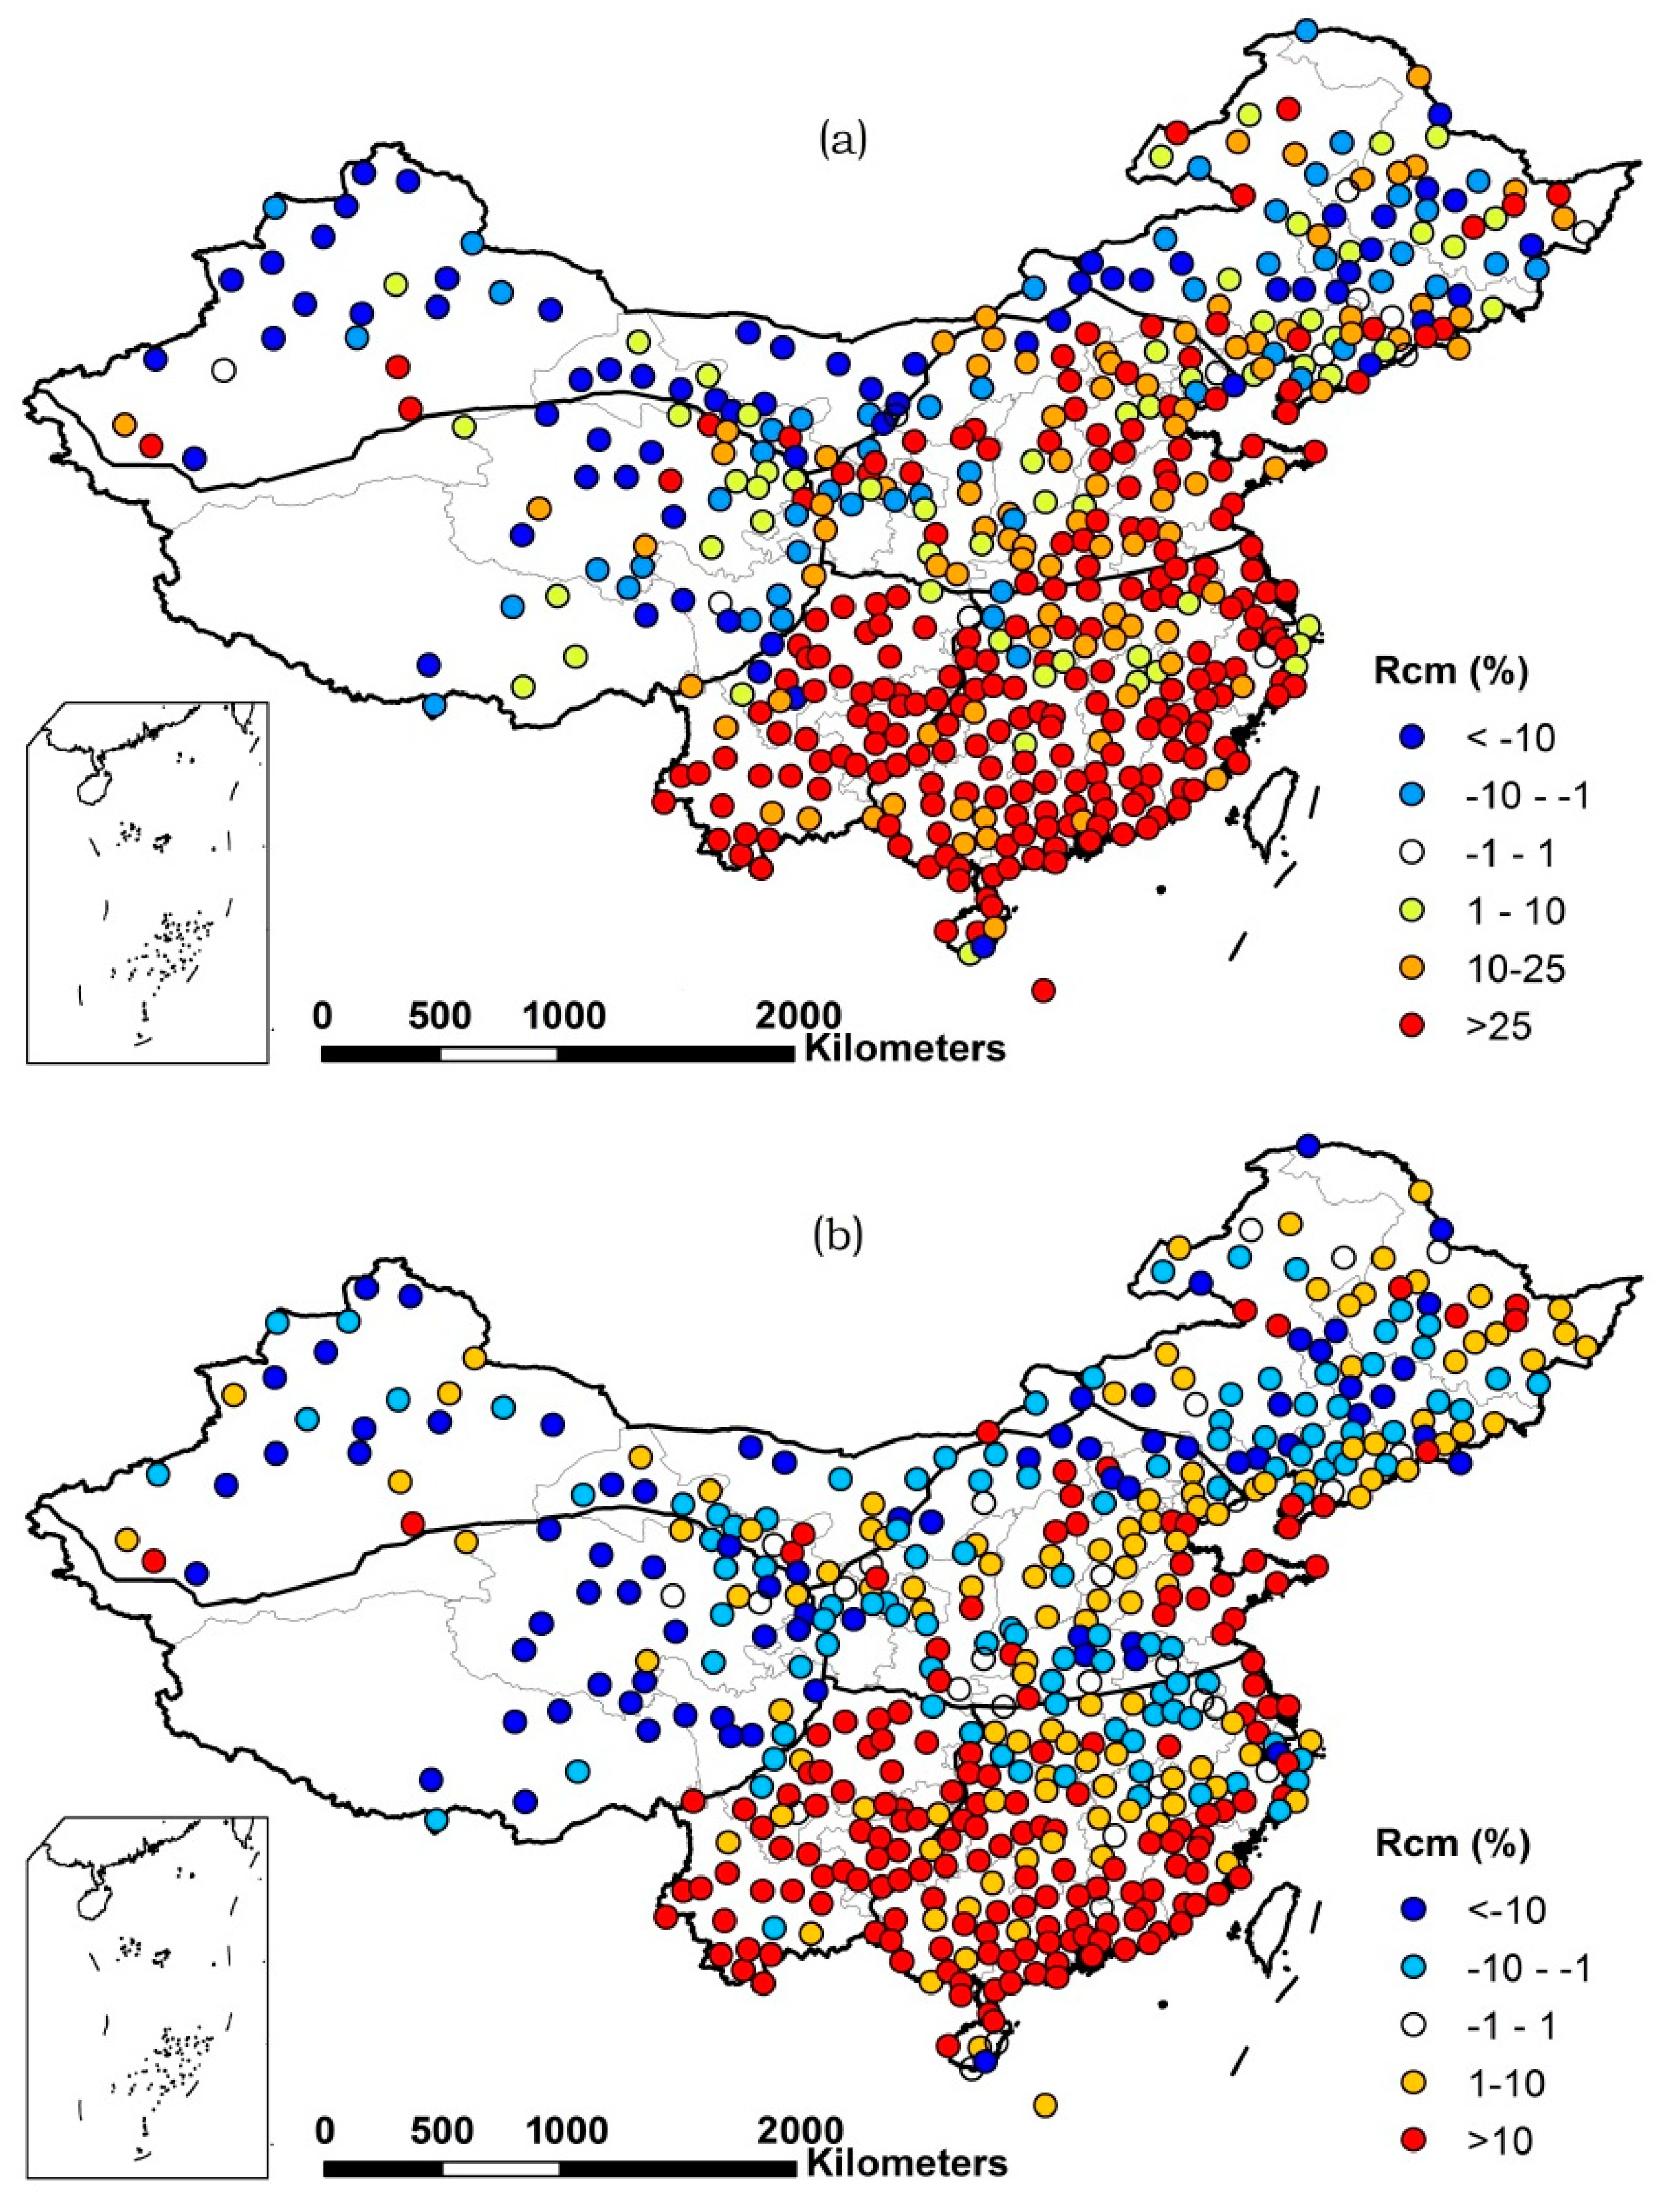
It has been reported that the large-scale climate background changed greatly in the early 1980s [45], and PE has occurred more since the 1980s in China [46]. In this section, we divided the threshold exceedance data into two periods to compare and analyze their relative change rate in frequency and intensity, using 1961–1984 as the reference period and 1985–2007 as the target period. For the different lengths of the two periods, annual change magnitudes were obtained by annual mean values of 1985–2007 minus those of 1961–1984. The spatial distribution of frequency relative change rate is shown in Figure 5a, and that of intensity is shown in Figure 5b. is the relative change rate.
Generally, the frequency of extreme precipitation increased during 1985–2007 in most of China, including most of Northeast and Southeast China, the Qing–Tibet Plateau, and Northwest China, and in most of Xinjiang, Gansu, the western part of Southwest China, and southeastern China exceeded 5%, while in most of North China and the eastern part of Southwest China a reduction in frequency of extreme precipitation was detected. These results were similar to those of Fu et al. [19]. The spatial distribution of intensity of precipitation extremes was similar to that of frequency, but had relatively higher heterogeneity and showed a more mixed pattern. There was a smaller increasing trend at stations than frequency trend, except North China showed a significant decreasing trend, and of many stations in North China exceeded 5%. Overall, stations with increasing frequency of precipitation extreme (FPE) account for 59.8% of the total, and those with increasing intensity of precipitation extreme (IPE) account for a somewhat lower 58.4%.
3.2.2. Relative Change Rate of Drought Extreme
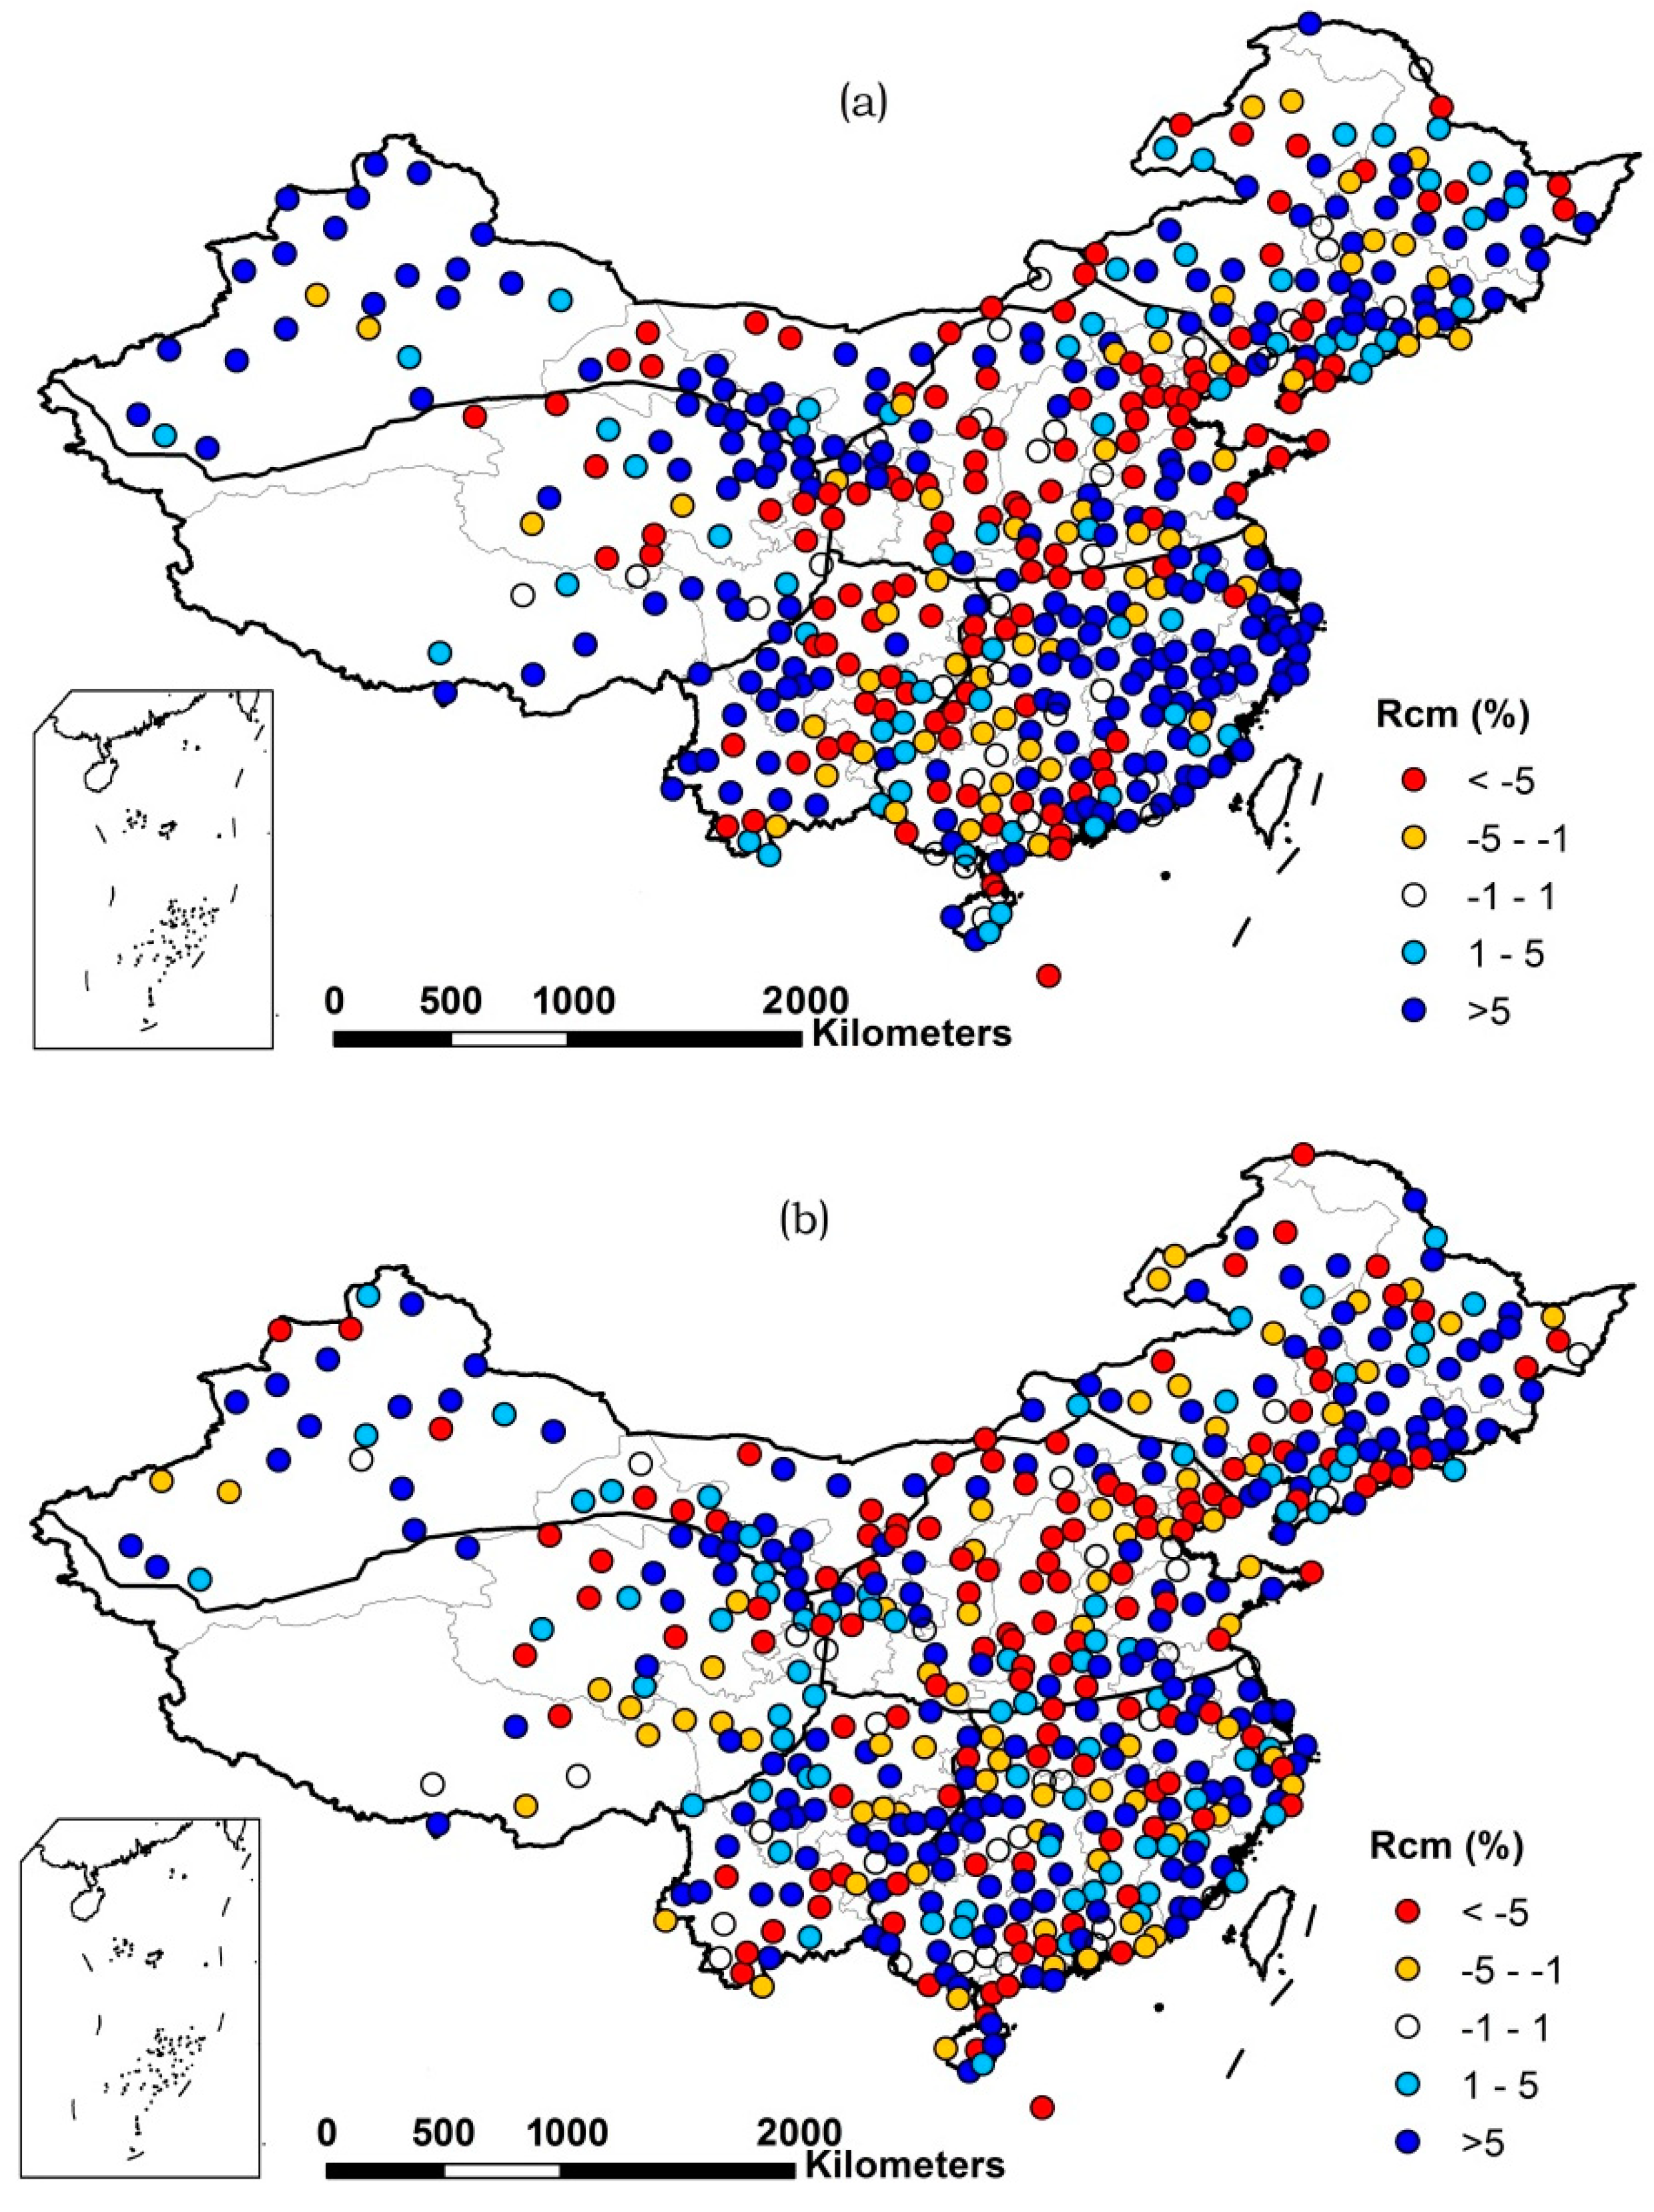
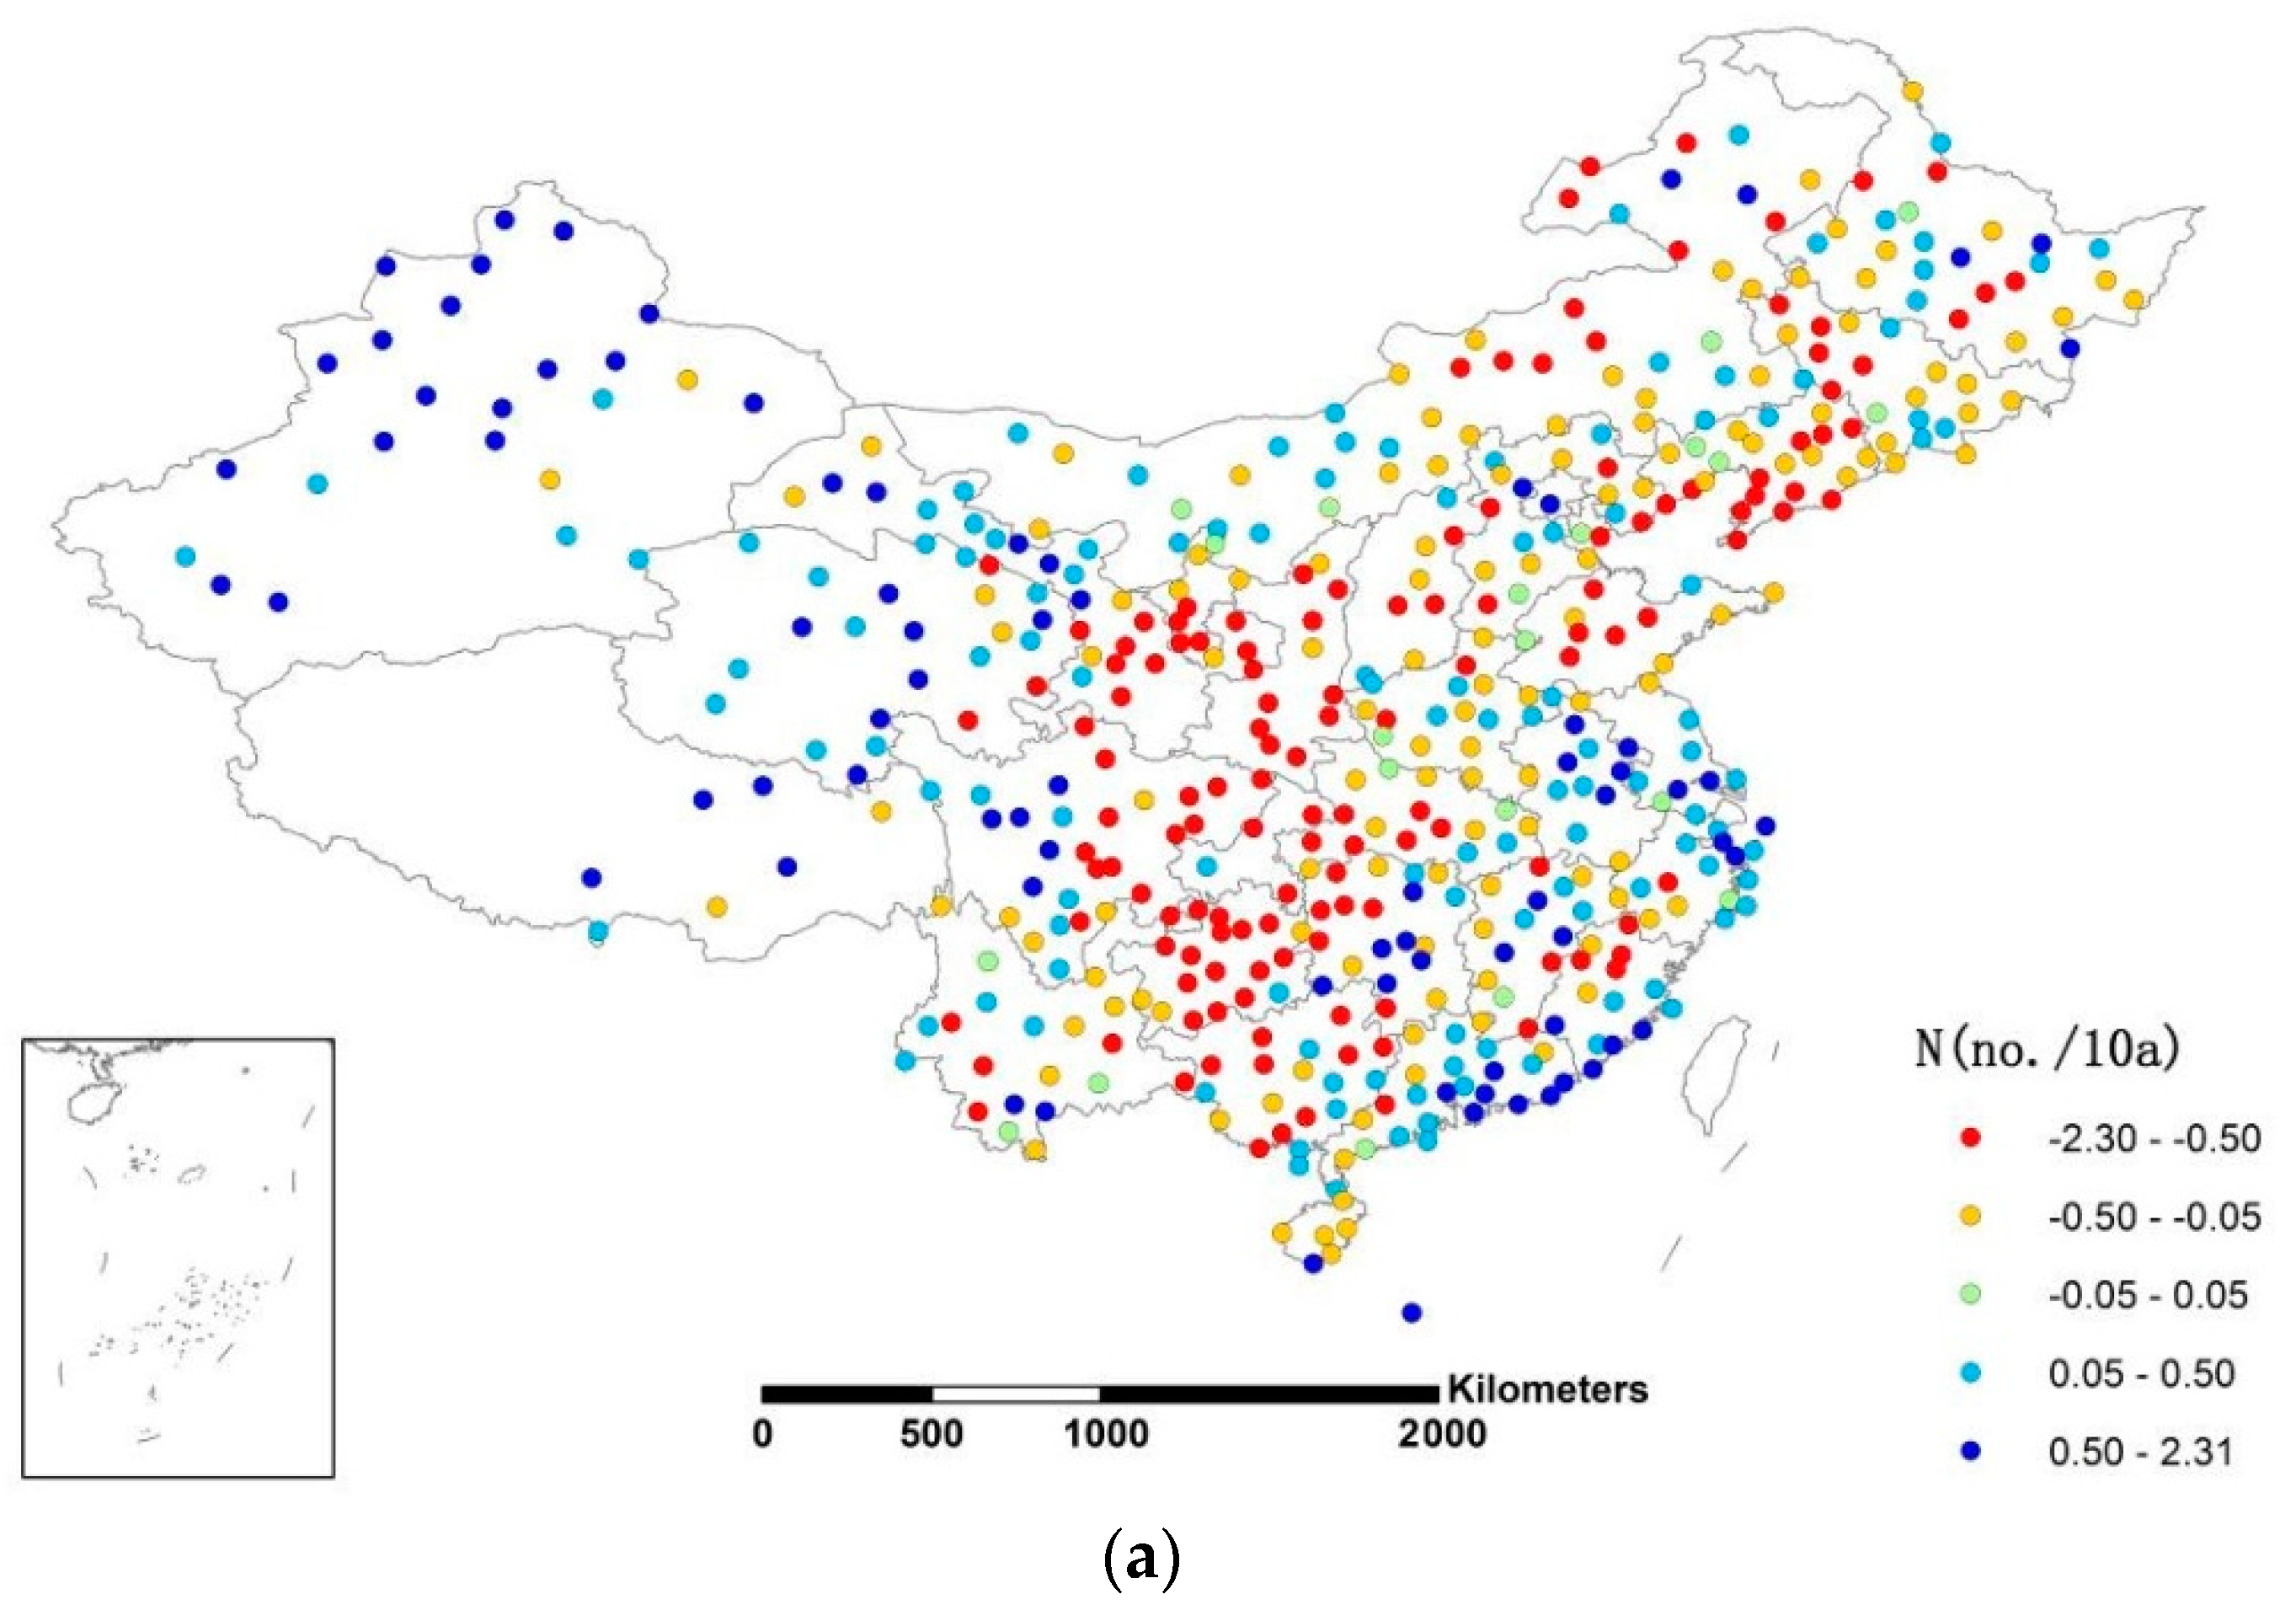
Once the thresholds of drought extremes were determined, the threshold exceedance time series were obtained. Similar to the precipitation analysis, we divided the threshold exceedance data into two periods, 1961–1984 and 1985–2007, and analyzed the annual relative change rates by the method described in Section 2.4. The spatial distribution of frequency of drought extreme (FDE) and intensity of drought extreme (IDE) are shown in Figure 6a,b, respectively.
Generally, drought extreme occurred less (Figure 6a) with decreasing intensity (Figure 6b) in most of Northwest China, the Qing–Tibet Plateau, and parts of Northeast China during 1985–2007 than 1961–1984. At many stations in Northwest China and the Qing–Tibet Plateau, decreasing frequency Rcm exceeded 10%. However, DE occurred much more, with a dramatic increasing trend in intensity in Southwest, Southeast, and parts of North China. Rcm of frequency and intensity in most of the middle-lower southern Yangtze area exceeded 20% and 10%, respectively. Areas between the lower reaches of the Yangtze and Yellow Rivers showed a slightly decreasing trend in intensity of drought extreme. Overall, stations with increasing frequency account for 74.8% of the total, and intensity for 60%.
3.2.3. Regional Frequencies and Intensities of Precipitation and Drought Extremes
We calculated the station mean Rcm of PE and DE in each region (regions in Figure 1b and Rcm in Table 1), and the results show that increased PE during 1985–2007 was detected in most of the six regions, except North China, while reduced DE was detected mainly in Northwest China and the Qing–Tibet Plateau, and a slight decrease in intensity in Northeast China. In detail, the maximum Rcm of FPE was found in Northwest China and the Qing–Tibet Plateau, with values of 16.13% and 8.12%, respectively. The maximum FDE Rcm increases were found in Southwest and Southeast China, whose IDE increments were also the maximum. North China took third place in DE increase.
To sum up, Southeast and Southwest China were under the threat of both PE and DE. North China showed a decrease in precipitation extremes, but an increase in drought extremes, while in the Qing–Tibet Plateau and Northwest China, there was a reduction in drought extremes but an increase in precipitation extremes. Generally, station-mean-increased frequency of PE and DE was relatively larger than mean-increased intensity. Also, station-mean-increased DE was generally larger than PE in China as a whole.
4. Discussion
From the above analysis, we got an idea of the spatiotemporal changes in frequency and intensity of PE and DE in different climatic regions in China. The stations with increasing trends all exceeded 50% in China as a whole (Section 3.2), and based on the statistics of China as whole (Table 2), the values of mean and 1/2 quantile were both positive, which may indicate that there were more stations with increasing than decreasing trends of frequency and intensity of PE and DE. Increased FDE was usually higher than increased FPE, so the values of 1/4, 2/4, and 3/4 quantiles and mean may illustrate that the increasing trend of DE was more common and significant than that that of PE. Compared to drought extremes, variations in precipitation extreme showed a relatively mixed pattern with higher heterogeneity. The variation coefficient (Cv) in Table 2 also illustrates this, as the Cv values of frequency and intensity of drought extremes were less than those of precipitation extremes, i.e., FDE < FPE and IDE < IPE. In addition, for increased frequency and intensity of PE and DE, there are always more stations detected with increasing frequency than intensity, with more clustered regional distribution, and this illustrates that the trend of increasing intensity of PE and DE was not as widely distributed as that of frequency.
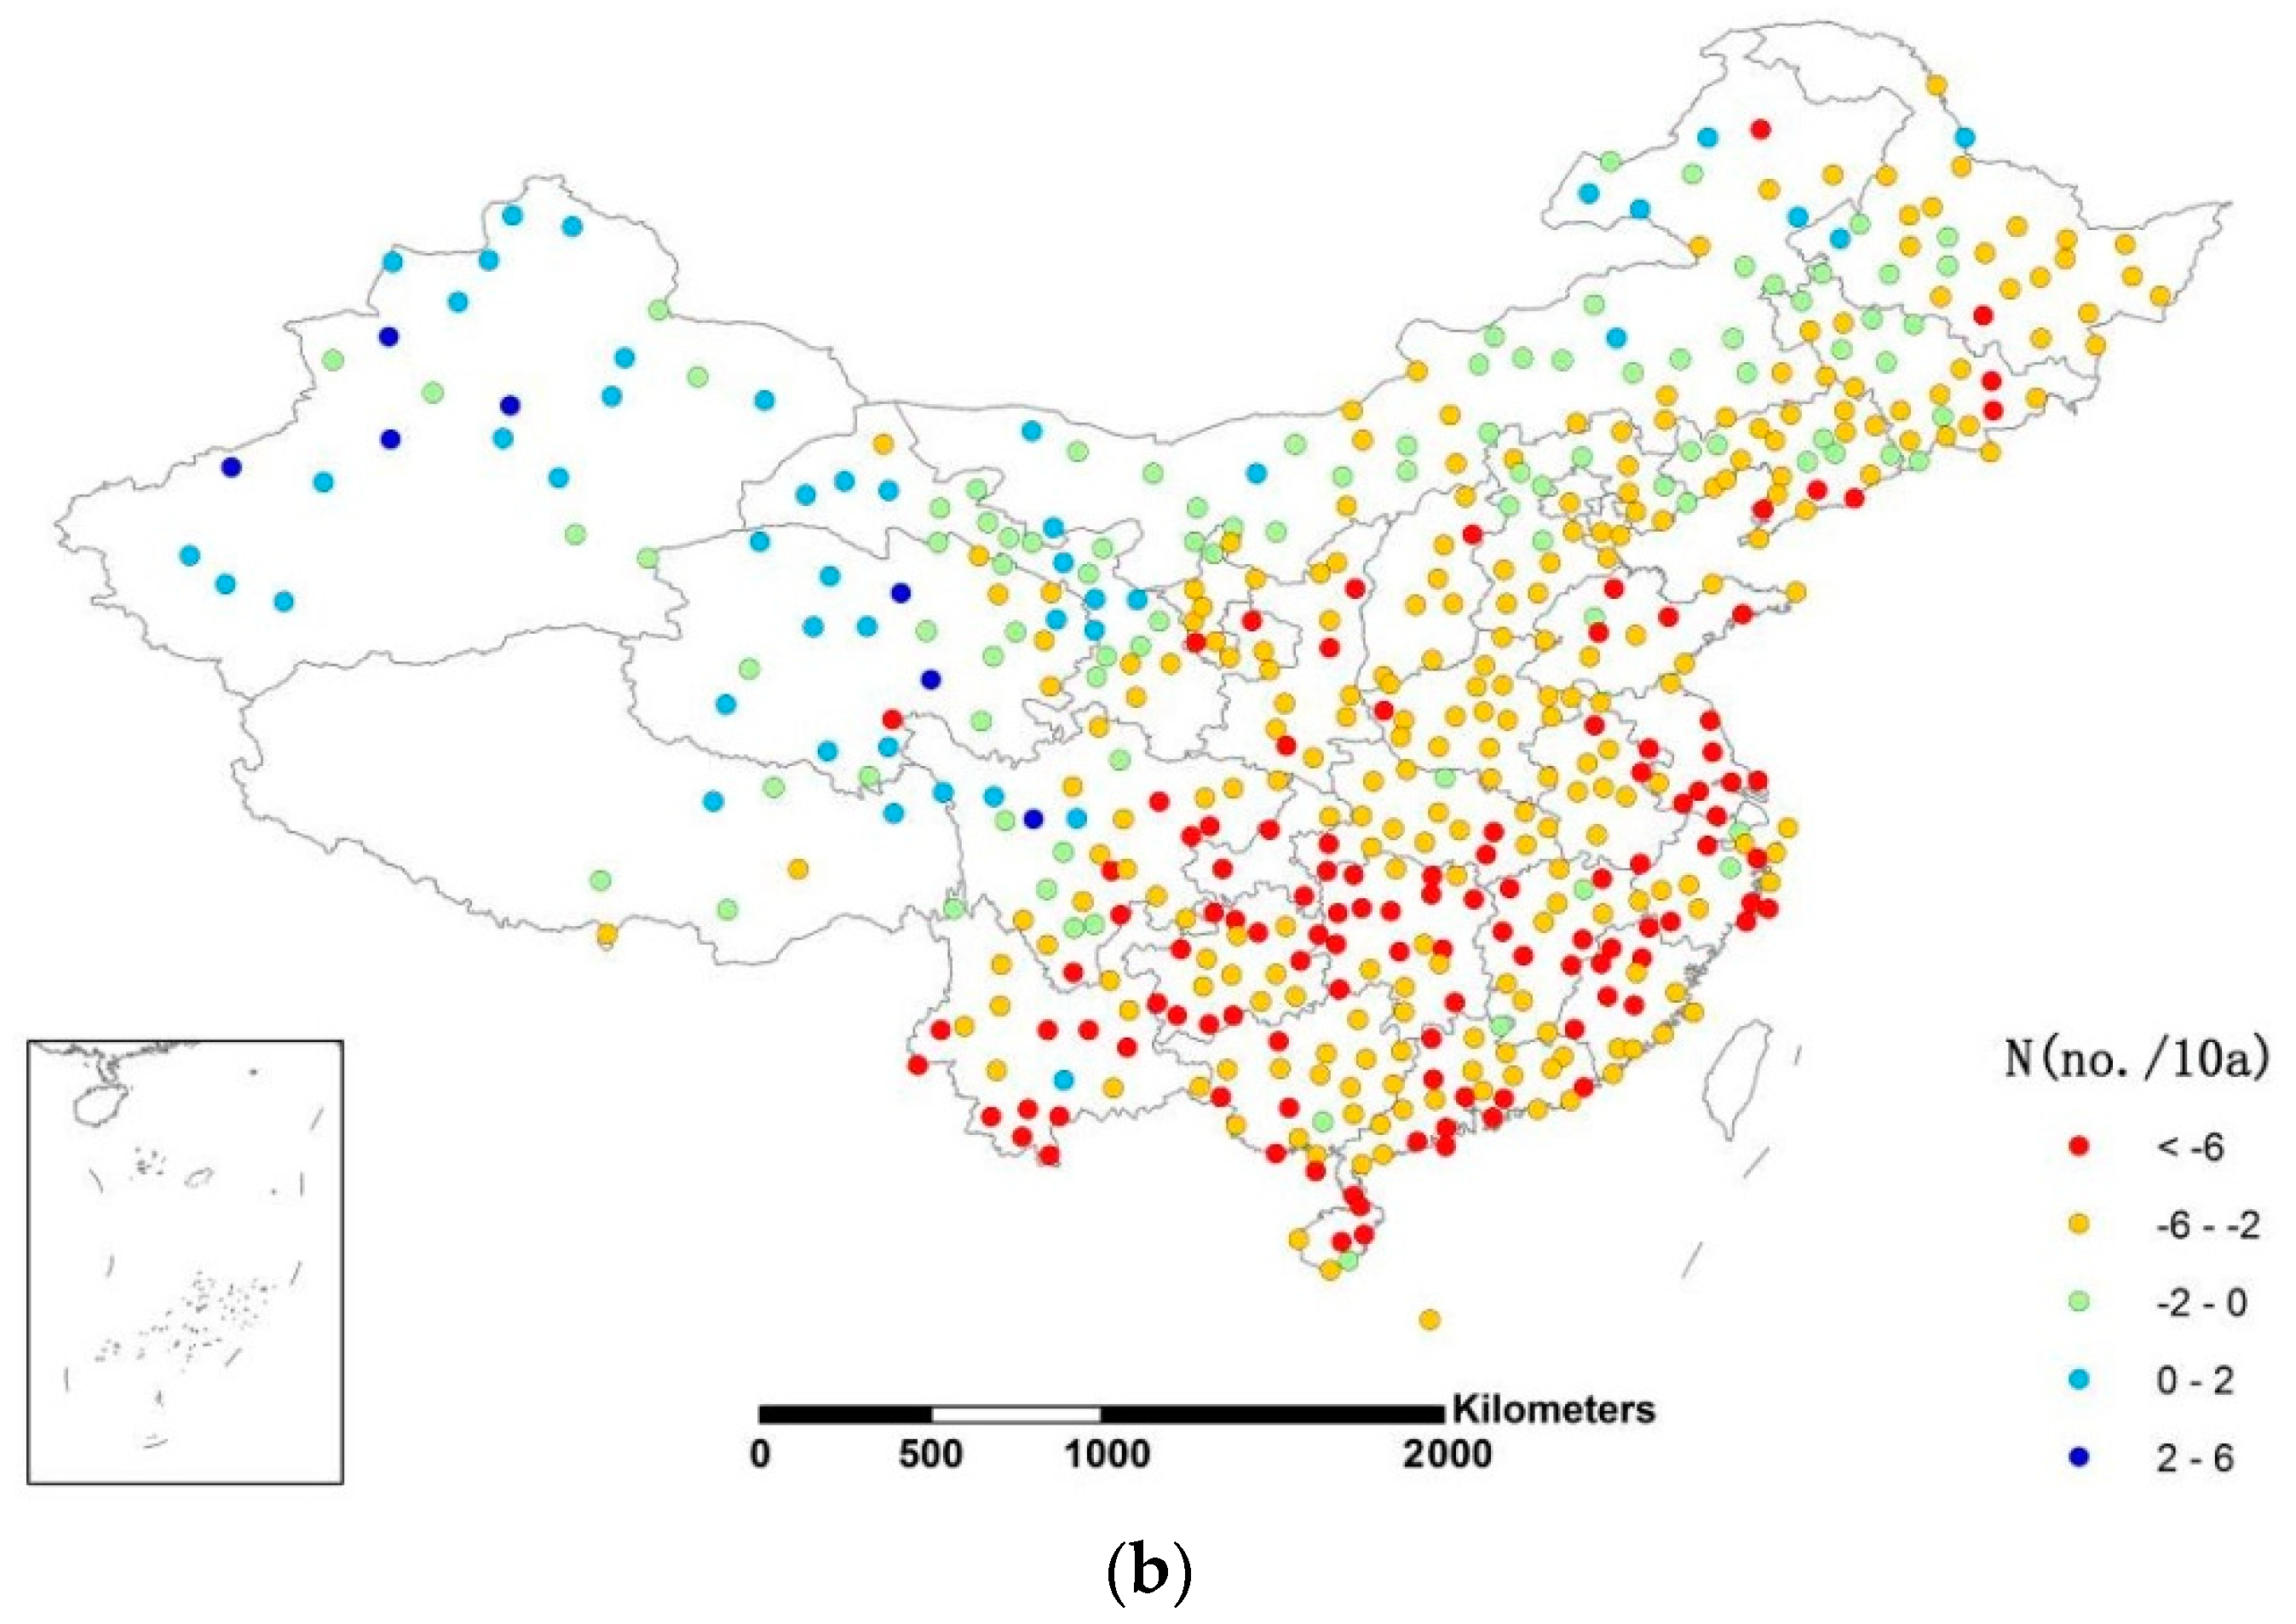
We also computed the trends in different intensities of daily precipitation to give a detailed interpretation (Figure 7) of the trend patterns of PE and DE in different regions. The levels of precipitation intensity were divided by the 75th percentile threshold value; precipitation intensity between 75% and 95% was called a mid-intensity level, and below 75%, a lower-intensity level. The trend analysis was conducted by the climate trend rate method. The results in Figure 7 show the following: (1) The two intensity levels of precipitation had an increasing trend in Northwest China and the Qing–Tibet Plateau, with a significant increasing trend in annual precipitation (Figure 2b). This may indicate an increasing trend of precipitation events of various intensities in these two regions, which coincides with the reduction of drought extremes and increase of precipitation extremes. (2) Stations in the southeastern part of China detected decreasing trends, particularly the spatial distribution of a decreasing trend of low-intensity precipitation similar to that of increasing DE. This may illustrate that lower-intensity precipitation related most to CCD. It was no wonder that DE had such a significant increasing trend in Southwest and Southeast China; combined with increased annual precipitation, South China was also at risk of increasing PE. (3) North China was identified to have slightly decreasing trends in both mid- and lower-intensity precipitation and annual precipitation, which may explain its second place in the increasing trend of DE and decreasing trend of PE. These findings are accordance with the conclusions of many previous studies: annual precipitation in Northwest China in the arid region had an obviously increasing trend [47], and an increasing trend was also detected in the humid region, but not as significantly as in the arid region, while a decreasing trend was reported in semihumid/semiarid regions in the past 50 years [38]; Yan et al. (2000) [27] found a reduction of lower-intensity rain in North China; Zhai et al. (1999) [28] reported a dramatic decrease of rain days in North and Southeast China; Zhi et al. (2006 and 2008) [45,48] pointed out that the decreased lower-intensity precipitation (especially 0–7 mm precipitation days) was the cause of the beginning of drought in northern China in the early 1980s, based on the fractal characteristics of daily precipitation in China; Feng et al. (2009) [49] predicted a decreasing trend of rainfall days in the southeastern part of China based on the fractal model. In addition, Hu et al. (2017) [43] predicted an increasing trend in North China in the future decade based on the fractal model.
To sum up, this study concentrated on the rapid extraction and analysis of changes in precipitation and drought extremes during the past half-century in China. However, the methods we used are just a standard, using simple statistics. In the future, we will investigate the fractal characteristics of daily precipitation and drought extremes and identify their attributions based on the power law model [14,50].
5. Conclusions
The spatial distribution pattern of extreme precipitation thresholds was similar to the annual precipitation isohyet pattern. The value was lowest in the northwest, and became larger from northwest to southeast. The extreme drought thresholds increased from southeast to northwest generally, with the minimum thresholds distributed in the middle-lower reaches of the Yangtze region and the maximums in the desert region of Northwest China.
Precipitation extremes increased in all regions except North China, while increasing trends of drought extremes were commonly detected in all regions except Northwest China and the Qing–Tibet Plateau. The maximum change rates in the frequency of precipitation extremes were found in Northwest China and the Qing–Tibet Plateau, with values of 16.13% and 8.12%, respectively. The maximum change rates in the frequency of drought extremes were in Southwest and Southeast China, whose increased intensity of drought extremes was also the maximum. Besides, variations in precipitation extremes showed a relatively mixed pattern with higher heterogeneity compared to drought extremes.
Changes in precipitation and drought extremes relate to mid-intensity, lower-intensity, and total precipitation. With decreased mid- and lower-intensity precipitation and increased total precipitation, Southwest and Southeast China were under a growing threat of both precipitation and drought extremes. With increased mid-intensity, lower-intensity, and total precipitation, Northwest China and the Qing–Tibet Plateau showed increasing trends in precipitation extremes but decreasing trends in drought extremes.
Author Contributions
M.L. and Y.S. conceived and designed the study. M.L. and Y.Q. analyzed the data and discussed the result. Y.W. and X.G. discussed the results. M.L. wrote the paper and X.G. edited the paper.
Acknowledgments
We acknowledge the support of National Key Research and Development Plan (No. 2017YFC0406100) and Fundamental Research Fund (No.YYWF201728 and No.SK201306) of Central Scientific and Research Institutes, Chinese Academy of Geological Sciences, the Institute of hydrogeology and Environmental Geology. We thank the China Meteorological Administration for the dataset. We also thank the two anonymous reviewers for their comments and suggestions.
Conflicts of Interest
The authors declare no conflict of interest.
References
- Leonard, M.; Westra, S.; Phatak, A.; Lambert, M.; Hurk, B.V.D.; Mcinnes, K.; Risbey, J.; Schuster, S.; Jakob, D.; Stafford-Smith, M. A compound event framework for understanding extreme impacts. Wiley Interdiscip. Rev. Clim. Chang. 2013, 5, 113–128. [Google Scholar] [CrossRef]
- Hao, Z.; Aghakouchak, A.; Phillips, T.J. Changes in concurrent monthly precipitation and temperature extremes. Environ. Res. Lett. 2013, 8, 1402–1416. [Google Scholar] [CrossRef]
- Seneviratne, S.I.; Nicholls, N.; Easterling, D.; Goodess, C.M.; Kanae, S.; Kossin, J.; Luo, Y.; Marengo, J.; Mcinnes, K.; Rahimi, M. Changes in Climate Extremes and Their Impacts on the Natural Physical Environment: An Overview of the IPCC SREX Report; Cambridge University Press: Cambridge, UK, 2012. [Google Scholar]
- Zhang, X.; Aguilar, E.; Sensoy, S.; Melkonyan, H.; Tagiyeva, U.; Ahmed, N.; Kutaladze, N.; Rahimzadeh, F.; Taghipour, A.; Hantosh, T.H. Trends in Middle East climate extreme indices from 1950 to 2003. J. Geophys. Res. Atmos. 2005, 110, 3159–3172. [Google Scholar] [CrossRef]
- Alexander, L.V.; Zhang, X.B.; Peterson, T.C.; Caesar, J.; Gleason, B.A.; Tank, A.; Haylock, M.; Collins, D.; Trewin, B.; Rahimzadeh, F. Global observed changes in daily climate extremes of temperature and precipitation. J. Geophys. Res. Atmos. 2006, 111, 1042–1063. [Google Scholar] [CrossRef]
- Yao, C.; Qian, W.; Yang, S.; Lin, Z. Regional features of precipitation over Asia and summer extreme precipitation over Southeast Asia and their associations with atmospheric–oceanic conditions. Meteorol. Atmos. Phys. 2010, 106, 57–73. [Google Scholar] [CrossRef]
- Li, H.; Feng, L.; Zhou, T. Multi-model projection of July–August climate extreme changes over China under CO2 doubling. Part I: Precipitation. Adv. Atmos. Sci. 2011, 28, 433–447. [Google Scholar] [CrossRef]
- Mittal, N.; Mishra, A.; Singh, R. Combining climatological and participatory approaches for assessing; changes in extreme climatic indices at regional scale. Clim. Chang. 2013, 119, 603–615. [Google Scholar] [CrossRef]
- Tong, S.; Li, X.; Zhang, J.; Bao, Y.; Bao, Y.; Na, L.; Si, A. Spatial and temporal variability in extreme temperature and precipitation events in Inner Mongolia (China) during 1960–2017. Sci. Total Environ. 2019, 649, 75–89. [Google Scholar] [CrossRef]
- Wu, J.; Chen, X. Spatiotemporal trends of dryness/wetness duration and severity: The respective contribution of precipitation and temperature. Atmos. Res. 2019, 216, 176–185. [Google Scholar] [CrossRef]
- Hawcroft, M.; Walsh, E.; Hodges, K.; Zappa, G. Significantly increased extreme precipitation expected in Europe and North America from extratropical cyclones. Environ. Res. Lett. 2018, 13, 2400612. [Google Scholar] [CrossRef]
- Frich, P.; Alexander, L.V.; Della-Marta, P.; Gleason, B.; Haylock, M.; Klein Tank, A.; Peterson, T. Observed coherent changes in climatic extremes during the second half of the twentieth century. Clim. Res. 2002, 19, 193–212. [Google Scholar] [CrossRef]
- Mazzarella, A.; Palumbo, F. Rainfall fluctuations over Italy and their association with solar activity. Theor. Appl. Climatol. 1992, 45, 201–207. [Google Scholar] [CrossRef]
- Laurenz, L.; Lüdecke, H.J.; Lüning, S. Influence of solar activity changes on European rainfall. J. Atmos. Sol.-Terr. Phys. 2019, 185, 29–42. [Google Scholar] [CrossRef]
- Munich, R. Topics, An Annual Review of Natural Catastrophes; Munich Reinsurance Company Publications: Munich, Germany, 2002; 49p. [Google Scholar]
- Re, M.; Barros, V.R. Extreme rainfalls in SE South America. Clim. Chang. 2009, 96, 119–136. [Google Scholar] [CrossRef]
- Figdor, E. When It Rains, It Pours: Global Warming and the Rising Frequency of Extreme Precipitation in the United States; Environment America Research & Policy Center: Washington, DC, USA, 2007. [Google Scholar]
- Viglizzo, E.F.; Roberto, Z.E.; Filippin, M.C.; Pordomingo, A.J. Climate variability and agroecological change in the Central Pampas of Argentina. Agric. Ecosyst. Environ. 1995, 55, 7–16. [Google Scholar] [CrossRef]
- Fu, G.; Yu, J.; Yu, X.; Ouyang, R.; Zhang, Y.; Wang, P.; Liu, W.; Min, L. Temporal variation of extreme rainfall events in China, 1961–2009. J. Hydrol. 2013, 487, 48–59. [Google Scholar] [CrossRef]
- Ning, L.; Qian, Y. Interdecadal change in extreme precipitation over South China and its mechanism. Adv. Atmos. Sci. 2009, 26, 109–118. [Google Scholar] [CrossRef]
- Su, B.; Gemmer, M.; Jiang, T. Spatial and temporal variation of extreme precipitation over the Yangtze River Basin. Quat. Int. 2008, 186, 22–31. [Google Scholar] [CrossRef]
- Mason, S.J.; Waylen, P.R.; Mimmack, G.M.; Rajaratnam, B.; Harrison, J.M. Changes in extreme rainfall events in South Africa. Clim. Chang. 1999, 41, 249–257. [Google Scholar] [CrossRef]
- Plummer, N.; Salinger, M.J.; Nicholls, N.; Suppiah, R.; Hennessy, K.J.; Leighton, R.M.; Trewin, B.; Page, C.M.; Lough, J.M. Changes in climate extremes over the Australian region and New Zealand during the twentieth century. Clim. Chang. 1999, 42, 183–202. [Google Scholar] [CrossRef]
- Nastos, P.T.; Zerefos, C.S. Spatial and temporal variability of consecutive dry and wet days in Greece. Atmos. Res. 2009, 94, 616–628. [Google Scholar] [CrossRef]
- Dijk, A.I.J.M.; Beck, H.E.; Crosbie, R.S.; Jeu, R.A.M.D.; Liu, Y.Y.; Podger, G.M.; Timbal, B.; Viney, N.R. The millennium drought in southeast Australia (2001–2009): Natural and human causes and implications for water resources, ecosystems, economy, and society. Water Resour. Res. 2013, 49, 1040–1057. [Google Scholar] [CrossRef]
- Heberger, M. Australia’s Millennium Drought: Impacts and Responses; Springer: Berlin/Heidelberg, Germany, 2012. [Google Scholar]
- Yan, Z.; Yang, C. Geographic patterns of extreme climate changes in China during 1951-1997. Clim. Environ. Res. 2000, 5, 267–272. [Google Scholar]
- Zhai, P.; Sun, A.; Ren, F.; Liu, X.; Bo, G.; Qiang, Z. Changes of climate extremes in China. Clim. Chang. 1999, 42, 203–218. [Google Scholar] [CrossRef]
- Wang, Z.; Qian, Y. Frequency and intensity of extreme precipitation events in China. Adv. Water Sci. 2009, 20, 1–9. [Google Scholar]
- Yang, J.H.; Jiang, Z.H.; Wang, P.X. Temporal and spatial characteristic of extreme precipitation event in China. Clim. Environ. Res. 2008, 13, 75–83. [Google Scholar]
- Gong, D.Y.; Wang, J.A.; Han, H. Trends of summer dry spells in China during the late twentieth century. Meteorol. Atmos. Phys. 2005, 88, 203–214. [Google Scholar] [CrossRef]
- Wang, B.; Zhang, M.; Wei, J.; Wang, S.; Li, X.; Li, S.; Zhao, A.; Li, X.; Fan, J. Changes in extreme precipitation over Northeast China, 1960–2011. Quatern. Int. 2013, 298, 177–186. [Google Scholar] [CrossRef]
- Gong, D.Y.; Shi, P.J.; Wang, J.A. Daily precipitation changes in the semi-arid region over northern China. J. Arid Environ. 2004, 59, 771–784. [Google Scholar] [CrossRef]
- Li, Z.; Zheng, F.; Liu, W. Spatial distribution and temporal trends of extreme temperature and precipitation events on the Loess Plateau of China during 1961–2007. Quatern. Int. 2010, 1–2, 93–100. [Google Scholar] [CrossRef]
- Li, Z.; He, Y.; Wang, C.; Wang, X.; Xin, H.; Wei, Z.; Cao, W. Spatial and temporal trends of temperature and precipitation during 1960–2008 at the Hengduan Mountains, China. Quatern. Int. 2011, 236, 127–142. [Google Scholar] [CrossRef]
- Wang, X.; Hou, X.; Wang, Y. Spatiotemporal variations and regional differences of extreme precipitation events in the Coastal area of China from 1961 to 2014. Atmos. Res. 2017, 197, 94–104. [Google Scholar] [CrossRef]
- Ding, Y.; Ren, G.; Zhao, Z.; Ying, X.; Yong, L.; Li, Q.; Jin, Z. Detection, causes and projection of climate change over China: An overview of recent progress. Adv. Atmos. Sci. 2007, 24, 954–971. [Google Scholar] [CrossRef]
- Liu, M.; Shen, Y.; Yan, Z.; Liu, C. Trend in pan evaporation and its attribution over the past 50 years in China. J. Geogr. Sci. 2010, 20, 557–568. [Google Scholar] [CrossRef]
- Lovejoy, S.; Schertzer, D.; Ladoy, P. Fractal characterization of inhomogeneous geophysical measuring networks. Nature 1986, 319, 43–44. [Google Scholar] [CrossRef]
- Nicholls, N. Long-term climate monitoring and extreme events. Clim. Chang. 1995, 31, 231–245. [Google Scholar] [CrossRef]
- Klein Tank, G.A.M.; Können, G.P. Trends in indices of daily temperature and precipitation extremes in Europe, 1946–1999. J. Clim. 2003, 16, 3665–3680. [Google Scholar] [CrossRef]
- Frei, C.; Schär, C. SCHÄR and Christoph, Detection probability of trends in rare events: Theory and application to heavy precipitation in the Alpine region. J. Clim. 1999, 14, 1568–1584. [Google Scholar] [CrossRef]
- Hu, S.; Cao, Z.; Liu, T. Change features of extreme drought events in North China. Meteorol. Environ. Sci. 2017, 40, 121–125. [Google Scholar]
- Zhang, G.; Fei, Y.; Liu, C.; Feng, H.; Yan, M.; Wang, J. Relationship between decline of shallow groundwater levels and irrigated agriculture on Hufu Plain of North China. Adv. Water Sci. 2013, 24, 228–234. [Google Scholar]
- Zhi, R.; Gong, Z. The detection and attribution of the abrupt change of precipitation in China based on the power-law exponent. Acta Phys. Sin.-Chin. Ed. 2008, 4629–4633. [Google Scholar]
- Liu, X. Climatic characteristic of extreme rainstorm events in China. J. Catastrophol. 1999, 14, 54–59. [Google Scholar]
- Shen, Y.J.; Liu, C.M.; Liu, M.; Zeng, Y.; Tian, C.Y.; Liu, C.M.; Chen, Y.N.; Xu, Z.X. Change in pan evaporation over the past 50 years in the arid region of China. Hydrol. Process. 2010, 24, 225–231. [Google Scholar] [CrossRef]
- Zhi, R.; Gong, Z.; Wang, D.; Feng, G. Analysis of the spatio-temporal characteristics of precipitation of China based on the power-law exponent. Acta Phys. Sin.-Chin. Ed. 2006, 55, 6185–6191. [Google Scholar]
- Feng, X.; Luo, L.; Feng, Z.; Liu, P.; Qiu, L. Fractal research on rainy day change trend in China. J. Nat. Disasters 2009, 18, 112–117. [Google Scholar]
- Lovejoy, S.; Schertzer, D. Multifractals, universality classes and satellite and radar measurements of cloud and rain Fields. J. Geophys. Res. 1990, 95, 2021–2034. [Google Scholar] [CrossRef]
Figure 1.
Spatial distribution of (a) annual temperature and (b) precipitation from 1971 to 2000. Numbers 1–6 in (b) represent Northeast, North, Southeast, and Southwest China, the Qing–Tibet Plateau, and Northwest China, respectively, in this study.
Figure 1.
Spatial distribution of (a) annual temperature and (b) precipitation from 1971 to 2000. Numbers 1–6 in (b) represent Northeast, North, Southeast, and Southwest China, the Qing–Tibet Plateau, and Northwest China, respectively, in this study.

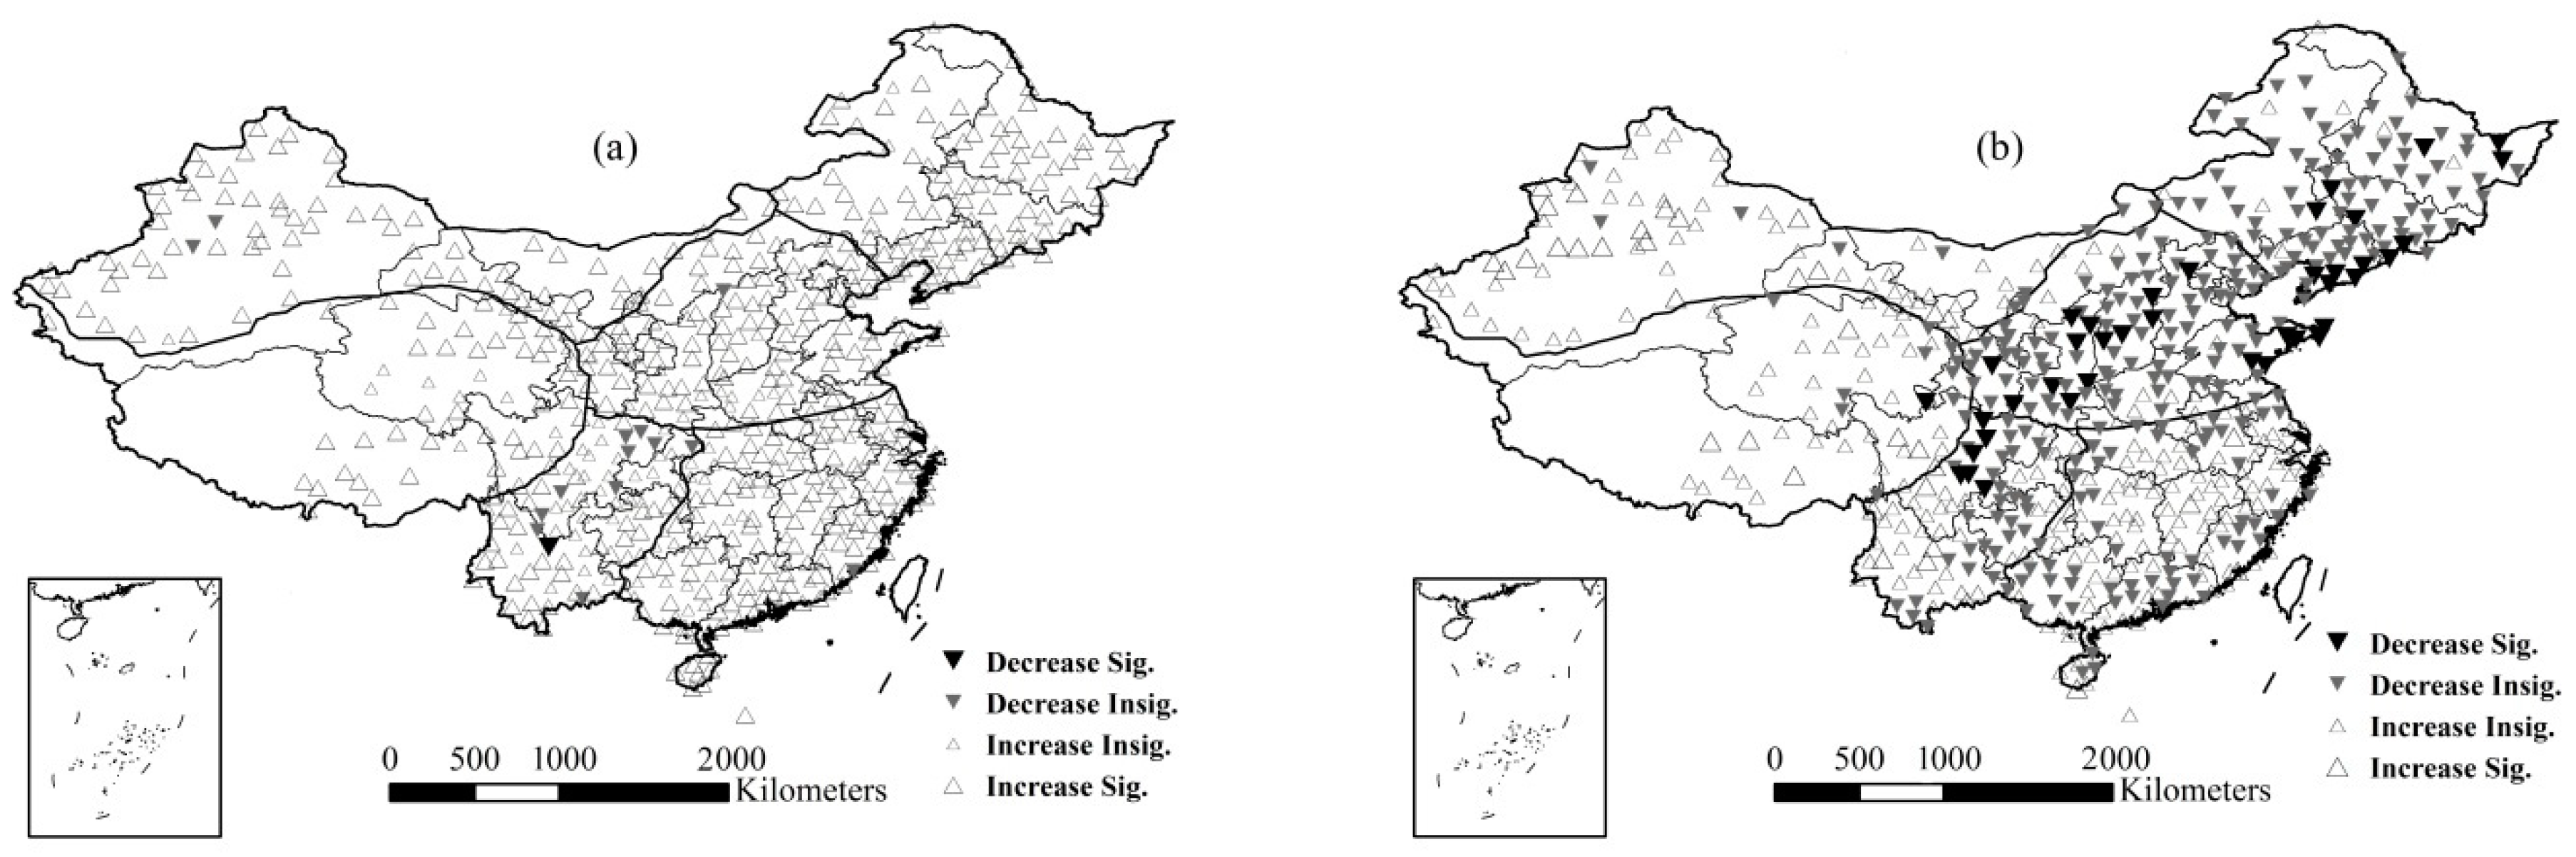
Figure 2.
(a) Annual temperature and (b) precipitation trends in China identified by Mann–Kendall test [38].
Figure 2.
(a) Annual temperature and (b) precipitation trends in China identified by Mann–Kendall test [38].

Figure 3.
Threshold determination of (a) precipitation extreme and (b) drought extreme by the cumulative distribution function (CDF).
Figure 3.
Threshold determination of (a) precipitation extreme and (b) drought extreme by the cumulative distribution function (CDF).

Figure 4.
Threshold spatial distributions of (a) precipitation extreme and (b) drought extreme.

Figure 5.
Relative change rates of spatial distributions of (a) frequency and (b) intensity of precipitation extremes.
Figure 5.
Relative change rates of spatial distributions of (a) frequency and (b) intensity of precipitation extremes.

Figure 6.
Relative change rate spatial distributions of (a) frequency and (b) intensity of drought extremes.
Figure 6.
Relative change rate spatial distributions of (a) frequency and (b) intensity of drought extremes.

Figure 7.
Trends of (a) mild-intensity and (b) lower-intensity precipitation evaluated by the climate trend rate method.
Figure 7.
Trends of (a) mild-intensity and (b) lower-intensity precipitation evaluated by the climate trend rate method.


Table 1.
Station mean change rate of precipitation and drought extremes in the six regions.
| Regions | Rcm of FPE (%) | Rcm of IPE (%) | Rcm of FDE (%) | Rcm of IDE (%) |
|---|---|---|---|---|
| NE | 4.61 | 3.84 | 4.99 | −0.92 |
| NC | −2.87 | −3.01 | 26.43 | 2.82 |
| SE | 6.45 | 3.80 | 64.24 | 14.73 |
| SW | 1.26 | 4.10 | 98.08 | 25.93 |
| QT | 8.12 | 1.12 | −1.83 | −11.21 |
| NW | 16.13 | 4.00 | −9.30 | −4.51 |
NE, Northeast China; NC, North China; SE, Southeast China; SW, Southwest China; QT, Qing–Tibet Plateau; NW, Northwest China; FPE, frequency of precipitation extreme; IPE, intensity of precipitation extreme; FDE, frequency of drought extreme; IDE, intensity of drought extreme.
Table 2.
Statistics of precipitation and drought extreme relative change rates in all of China.
| Statistics | Rcm of FPE (%) | Rcm of IPE (%) | Rcm of FDE (%) | Rcm of IDE (%) |
|---|---|---|---|---|
| 1/4 quantile | −5.14 | −5.06 | −0.29 | −5.39 |
| 1/2 quantile | 3.27 | 1.80 | 20.00 | 3.27 |
| 3/4 quantile | 12.65 | 9.54 | 47.32 | 13.74 |
| Mean | 4.76 | 2.25 | 35.34 | 6.24 |
| St. Dev. | 16.45 | 11.39 | 66.83 | 19.54 |
| Cv | 3.46 | 5.06 | 1.89 | 3.13 |
FPE, frequency of precipitation extreme; IPE, intensity of precipitation extreme; FDE, frequency of drought extreme; IDE, intensity of drought extreme; Cv, variation coefficient.
© 2019 by the authors. Licensee MDPI, Basel, Switzerland. This article is an open access article distributed under the terms and conditions of the Creative Commons Attribution (CC BY) license (http://creativecommons.org/licenses/by/4.0/).
Share and Cite
MDPI and ACS Style
Liu, M.; Shen, Y.; Qi, Y.; Wang, Y.; Geng, X. Changes in Precipitation and Drought Extremes over the Past Half Century in China. Atmosphere 2019, 10, 203. https://doi.org/10.3390/atmos10040203
AMA Style
Liu M, Shen Y, Qi Y, Wang Y, Geng X. Changes in Precipitation and Drought Extremes over the Past Half Century in China. Atmosphere. 2019; 10(4):203. https://doi.org/10.3390/atmos10040203
Chicago/Turabian StyleLiu, Min, Yanjun Shen, Yongqing Qi, Yanfang Wang, and Xinxin Geng. 2019. "Changes in Precipitation and Drought Extremes over the Past Half Century in China" Atmosphere 10, no. 4: 203. https://doi.org/10.3390/atmos10040203
Note that from the first issue of 2016, this journal uses article numbers instead of page numbers. See further details here.