Loss to Aviation Economy Due to Winter Fog in New Delhi during the Winter of 2011–2016
by
Rachana Kulkarni
1,3, 
Rajendra K. Jenamani
2,*,
Prakash Pithani
1,
Mahen Konwar
1,
Narendra Nigam
2 and
Sachin D. Ghude
1,* 1
Indian Institute of Tropical Meteorology, Pashan, Pune 411008, India
2
Indian Meteorological Department, New Delhi 110037, India
3
Department of Environment Sciences, Savitribai Phule Pune University, Pune 411007, India
*
Authors to whom correspondence should be addressed.
Atmosphere 2019, 10(4), 198; https://doi.org/10.3390/atmos10040198
Submission received: 31 January 2019
/
Accepted: 18 February 2019
/
Published: 12 April 2019
(This article belongs to the Special Issue Observation, Simulation and Predictability of Fog )
Abstract
:Stable and clear atmospheric conditions, lower surface temperatures, an ample moisture supply, and a strong low-level inversion persisting for most of the night usually facilitates the formation of dense fog during winter in Delhi. This severely hinders the flight operations at India’s busiest airport, the Indira Gandhi International (IGI) Airport, where more than 900 flight operations occur per day and an interruption can cause significant financial losses to the aviation industry. It is important to undertake a quantitative study of the estimated losses. This study, undertaken for the first time in India, aimed to evaluate the impact of dense fog at IGI Airport on economic losses which occurred during the winter season between 2011 and 2016. The breakdown of charges for different segments of flight operations for the domestic and international sectors was obtained from India’s Ministry of Civil Aviation and the Center for Asia Pacific Aviation (CAPA) India. A total of 653 h of dense fog between 2011 and 2016 at IGI Airport caused economic losses of approximately 3.9 million USD (248 million Indian rupees) to the airlines. The analysis further found that from 2014–2015 onwards, there has been a reduction in the number of flight delays, diversions, and cancellations by approximately 88%, 55%, and 36%, respectively, due to the strict implementation of guidelines to facilitate the Category (CAT)-III landing for aircraft during dense fog.
1. Introduction
Low-visibility conditions such as fog, dust, smoke, and haze, often create problems for aviation. The occurrence of dense fog often affects flight operations at airports in terms of flight delays, cancellations, and diversions, causing passengers to be severely affected and airlines to bear severe economic losses [1,2,3,4,5,6,7,8,9,10,11]. The north and northeast plains of India, especially the Indo-Gangetic plains (IGP) region, are well known for dense fog throughout the winter season. Recent studies on fog in India have highlighted considerable socio-economic concerns due to the alarming increase in fog and pollution and the persistence of fog in winter over the IGP [10,11,12,13]. Fog in the northern region of India is predominantly formed during the peak winter season over various temporal and spatial scales under a variety of meteorological conditions [11,12,13,14,15,16]. It shows significant variability from year to year depending on a combination of large-scale and meso-scale meteorological conditions [11,12,15,16]. The other unique characteristic of the fog layer in this region is that, once it is developed, it sometimes persists from a few days to weeks over vast areas, with only a partial lifting in the late afternoon. A stable atmosphere, lower surface temperatures, and calm winds persisting for most of the day or night as well as an ample moisture supply favor the development and persistence of fog in Delhi and the airport area [16,17]. Western disturbances (WDs) influence the northern region of India during the winter and advect large amounts of moisture into the lower troposphere. As soon as a lower-level ridge line forms over the northern region, it develops stable and clear atmospheric conditions and lower surface temperatures leading to the formation of strong low-level inversions, which facilitate fog formation and its persistence in Delhi [15,16,17,18]. In fact, both temporally and spatially, such fog events may be the fastest in formation, largest in area, and longest in duration, compared to fog observed in other parts of the world.
At present, India is the 9th largest aviation market in the world. In the last decade, domestic air traffic has quadrupled (from 13 million passengers to 52 million passengeres). An almost similar increase in international traffic has also been seen during the same period [2]. Located in the IGP region, Delhi is the one of the largest megacities of South Asia. The Indira Gandhi International (IGI) Airport of Delhi is one of the busiest airports in the country in terms of both passengers and cargo traffic. Delhi IGI Airport was ranked as the 25th busiest airport in the world in 2015 where more than 900 flight operations occur per day. A survey conducted by the National Council of Applied Economic Research suggests that IGI Airport is the one of the highest contributors of the Delhi Gross Development Product (GDP), contributing approximately 0.45% to the national GDP and 13.53% to the Delhi GDP (in 2009–2010 FY) [12]. Dense fog affects aviation severely at IGI Airport [13] and flight operations are often hindered due to delays, diversions, or cancellations, causing significant economic losses. Dense fog in the early morning or evening hours creates more loss to the airlines than if it occurs at midnight or in the late morning hours. Recent studies show that there has been an increase in the frequency and intensity of fog over the northern parts of the country during the winter season, and morning poor visibility days have increased significantly during the last five decades [5,6,7,8,9,10,11,12,13,14]. A new study by Ghude et al. (2017) showed that fog (visibility < 1000 m) and dense fog (visibility < 200 m) days over Delhi have doubled in the past three decades. An increase in dense fog hours at an airport will affect more flight operations and can create more economic losses to the airlines due to the increased diversion, delay, and cancellation of flights. Although it is generally well recognized that fog can cause financial losses to the aviation industry, it is important to undertake a quantitative study of the estimated losses. When fog occurs, (1) air traffic on the ground slows down due to a reduced taxiing speed and (2) runway occupancy time (ROT) increases. Air traffic controllers (ATCs) may have to increase the spacing between each aircraft landing and takeoff to ensure safe operations, which can reduce airport capacity by 40% compared to its normal capacity. Additionally, ATCs must protect landing system signals for an aircraft arrival at two nautical miles from touchdown. For this to occur, previous arrivals and departures must be cleared from these areas. Because of this, a scheduled flight may be held at its origin, diverted back to the other airport, or in the worst-case scenario it may be cancelled. The main aim of this study was to evaluate the impact of dense fog at IGI Airport on economic losses incurred by the airlines due to the delay, diversion, and cancellation of both domestic and international flights during the winter season of 2011–2016.
The Directorate General of Civil Aviation, Government of India (DGCA), the Indian Meteorology Department (IMD), and the Airports Authority of India (AAI) prepared strict guidelines [5] (better preparedness for landing, technical management, and training for the pilots) in 2014 for all flight landings at IGI Airport during periods of fog. Therefore, we have also explored the impact of those guidelines on the reduction in economic impact on the airlines before and after the 2014 fog period.
2. Data and Methodology
During foggy days, flights can be delayed, diverted, and cancelled due to very low visibility conditions (dense fog) when flight takeoff and landing are very difficult for the pilot. Table 1 shows the fog-type general visibility range and runway visibility range (RVR) for the various conditions. IGI Airport has a total of three runways (RWYs) (Figure 1a). Two of its main runways (RWY 29-MID-11 and RWY 28-MID-10) have a landing system with a capability of Category IIIB (CAT IIIB)-compliant flight landing up to an RVR value of 50 m. The third one is a small runway (RWY 27-MID-09) which has a capability of CAT I-compliant flight landing up to a 500 m RVR value. Figure 1b illustrates the technical aspects of CAT Operations. However, not all aircraft of all airlines are fully equipped with devices matching the CAT IIIB Instrument Landing Systems (ILS) or have trained crew to operate flights in low visibility conditions during fog at IGI Airport. The report prepared by the DGCA [5] found that, during 2011–2014 fog events, various airlines were unable to operate at IGI Airport due to CAT IIIB non-compliant flights, irrespective of the world-class landing facilities available at IGI Airport.
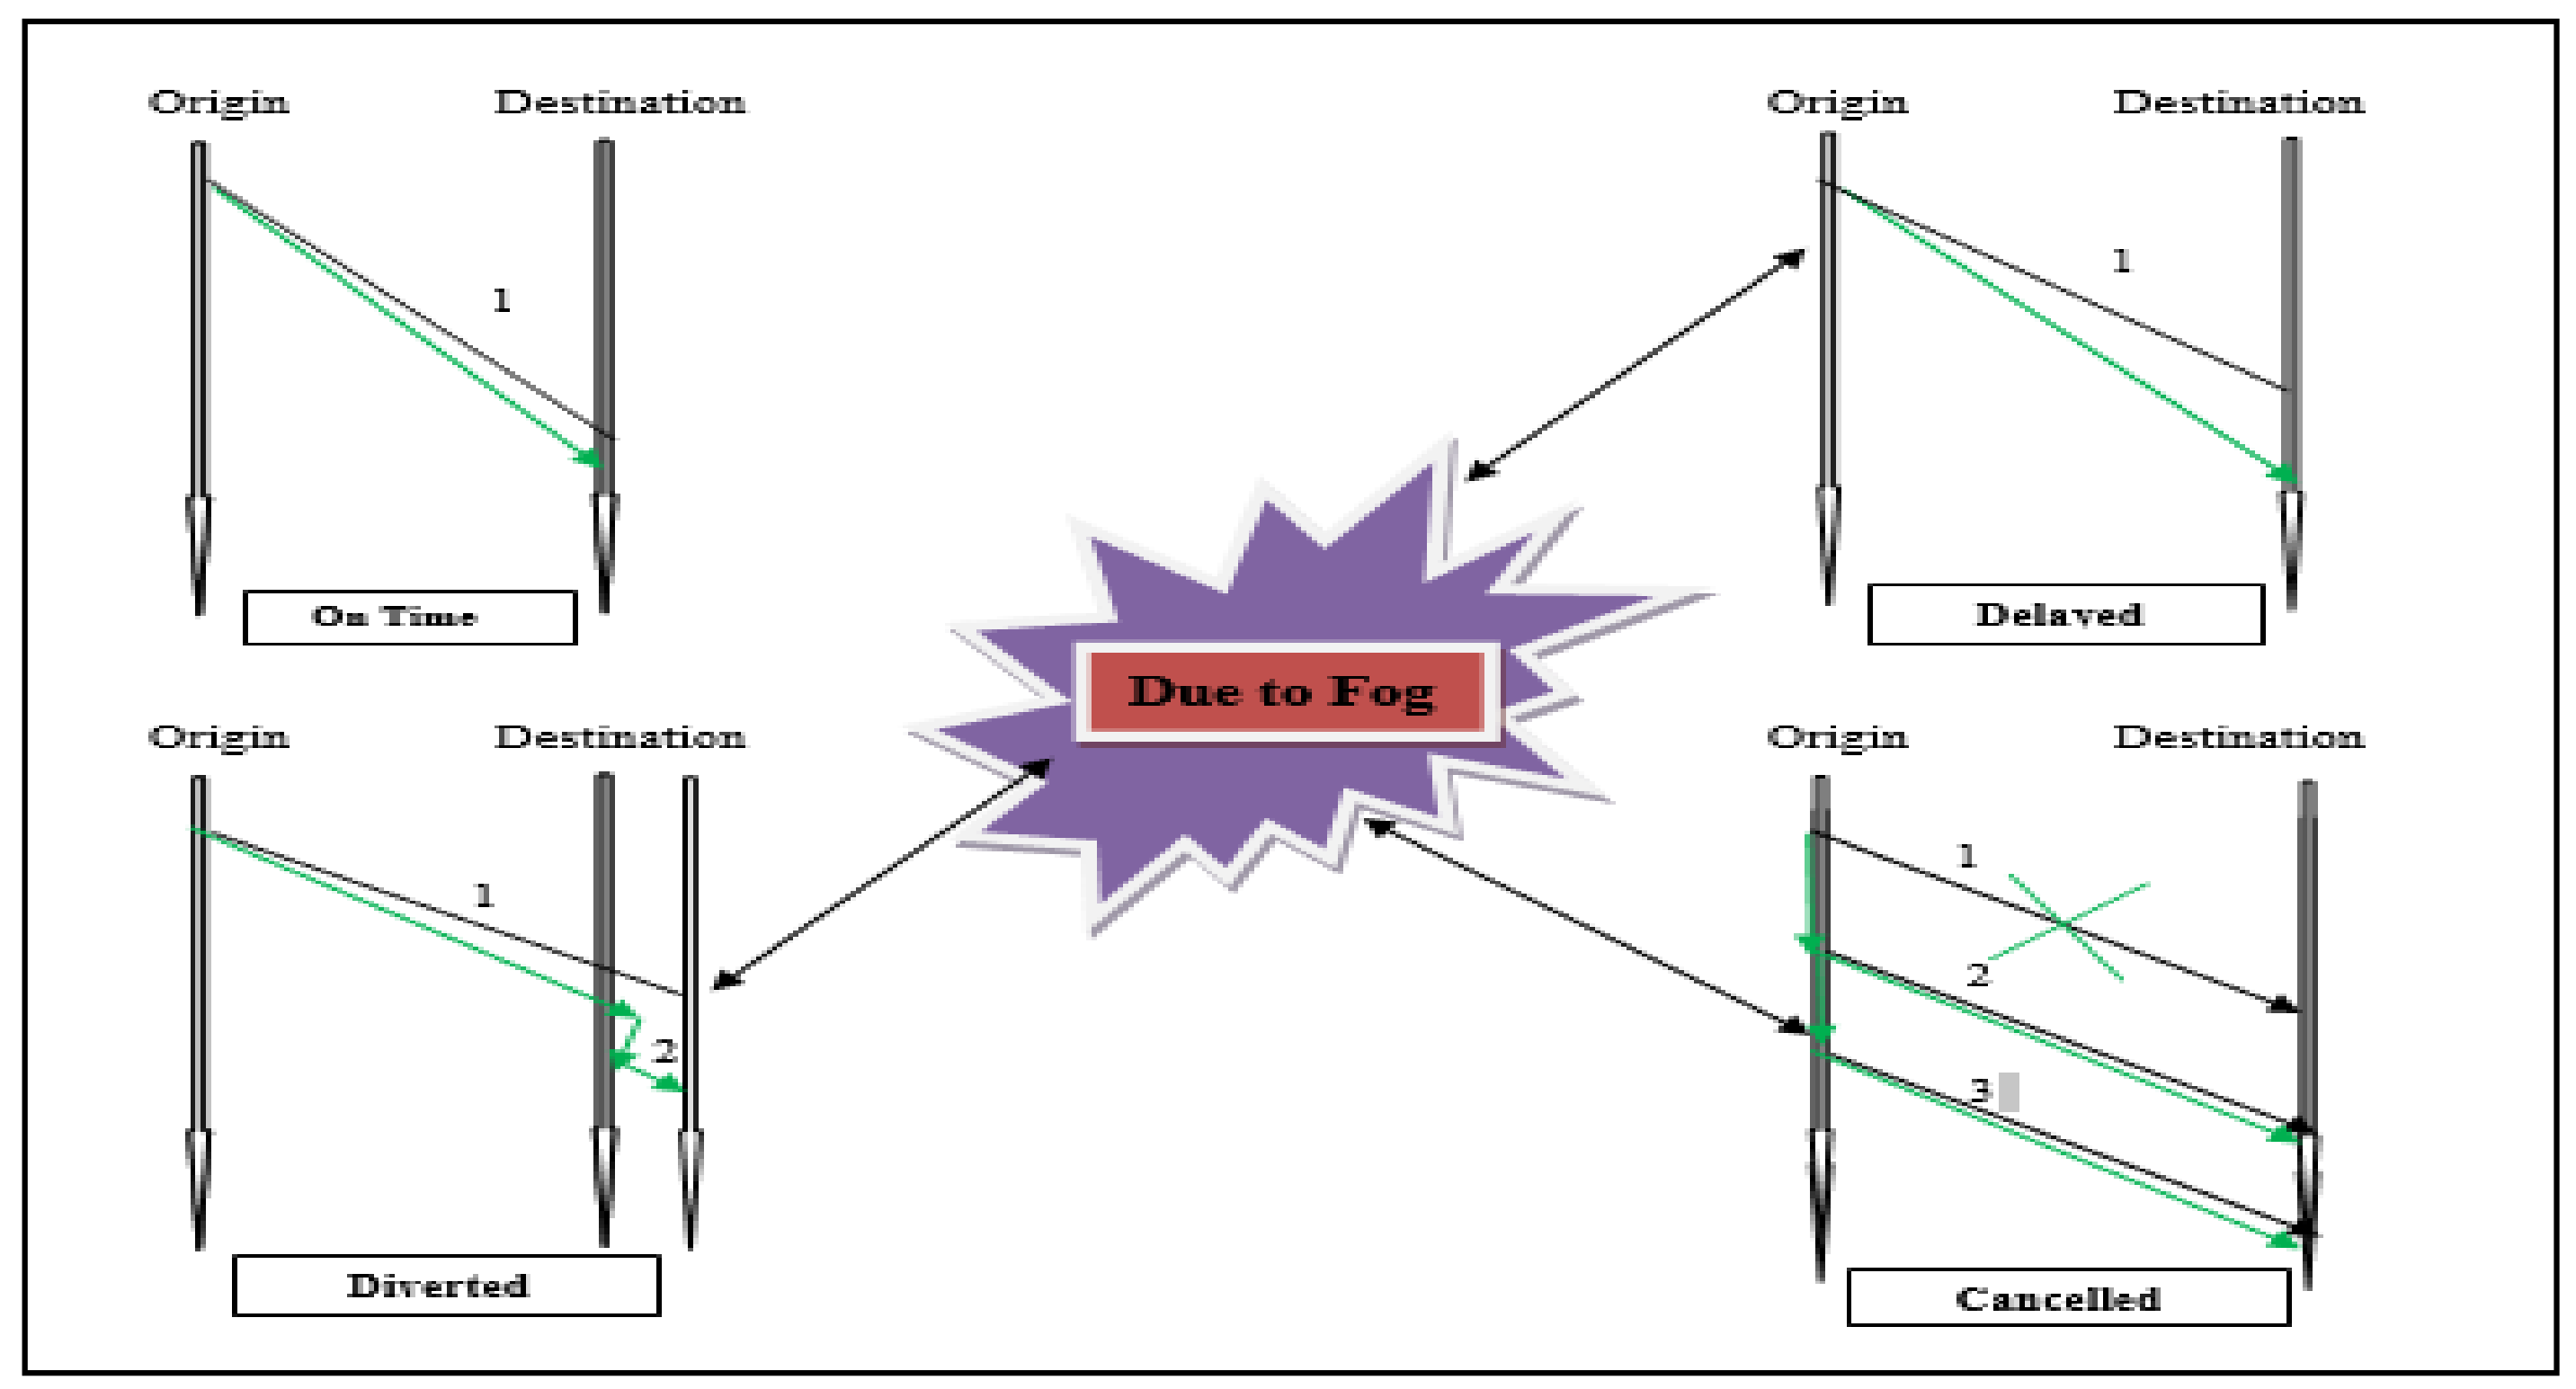
Figure 2 shows a schematic for flight operations during a normal event and a foggy event. During very low visibility conditions, a flight gets delayed, diverted, or cancelled based on the duration of the dense fog event. Subsequently, such an event creates a burden of charges on airlines which they will have to either pay back to the passengers or additional charges which they will have to bear in the form of ground handling and parking, Route Navigation Facilities Charges (RNFCs), extra hold fuel charges, as well as passenger food and accommodation charges for both domestic and international flights.
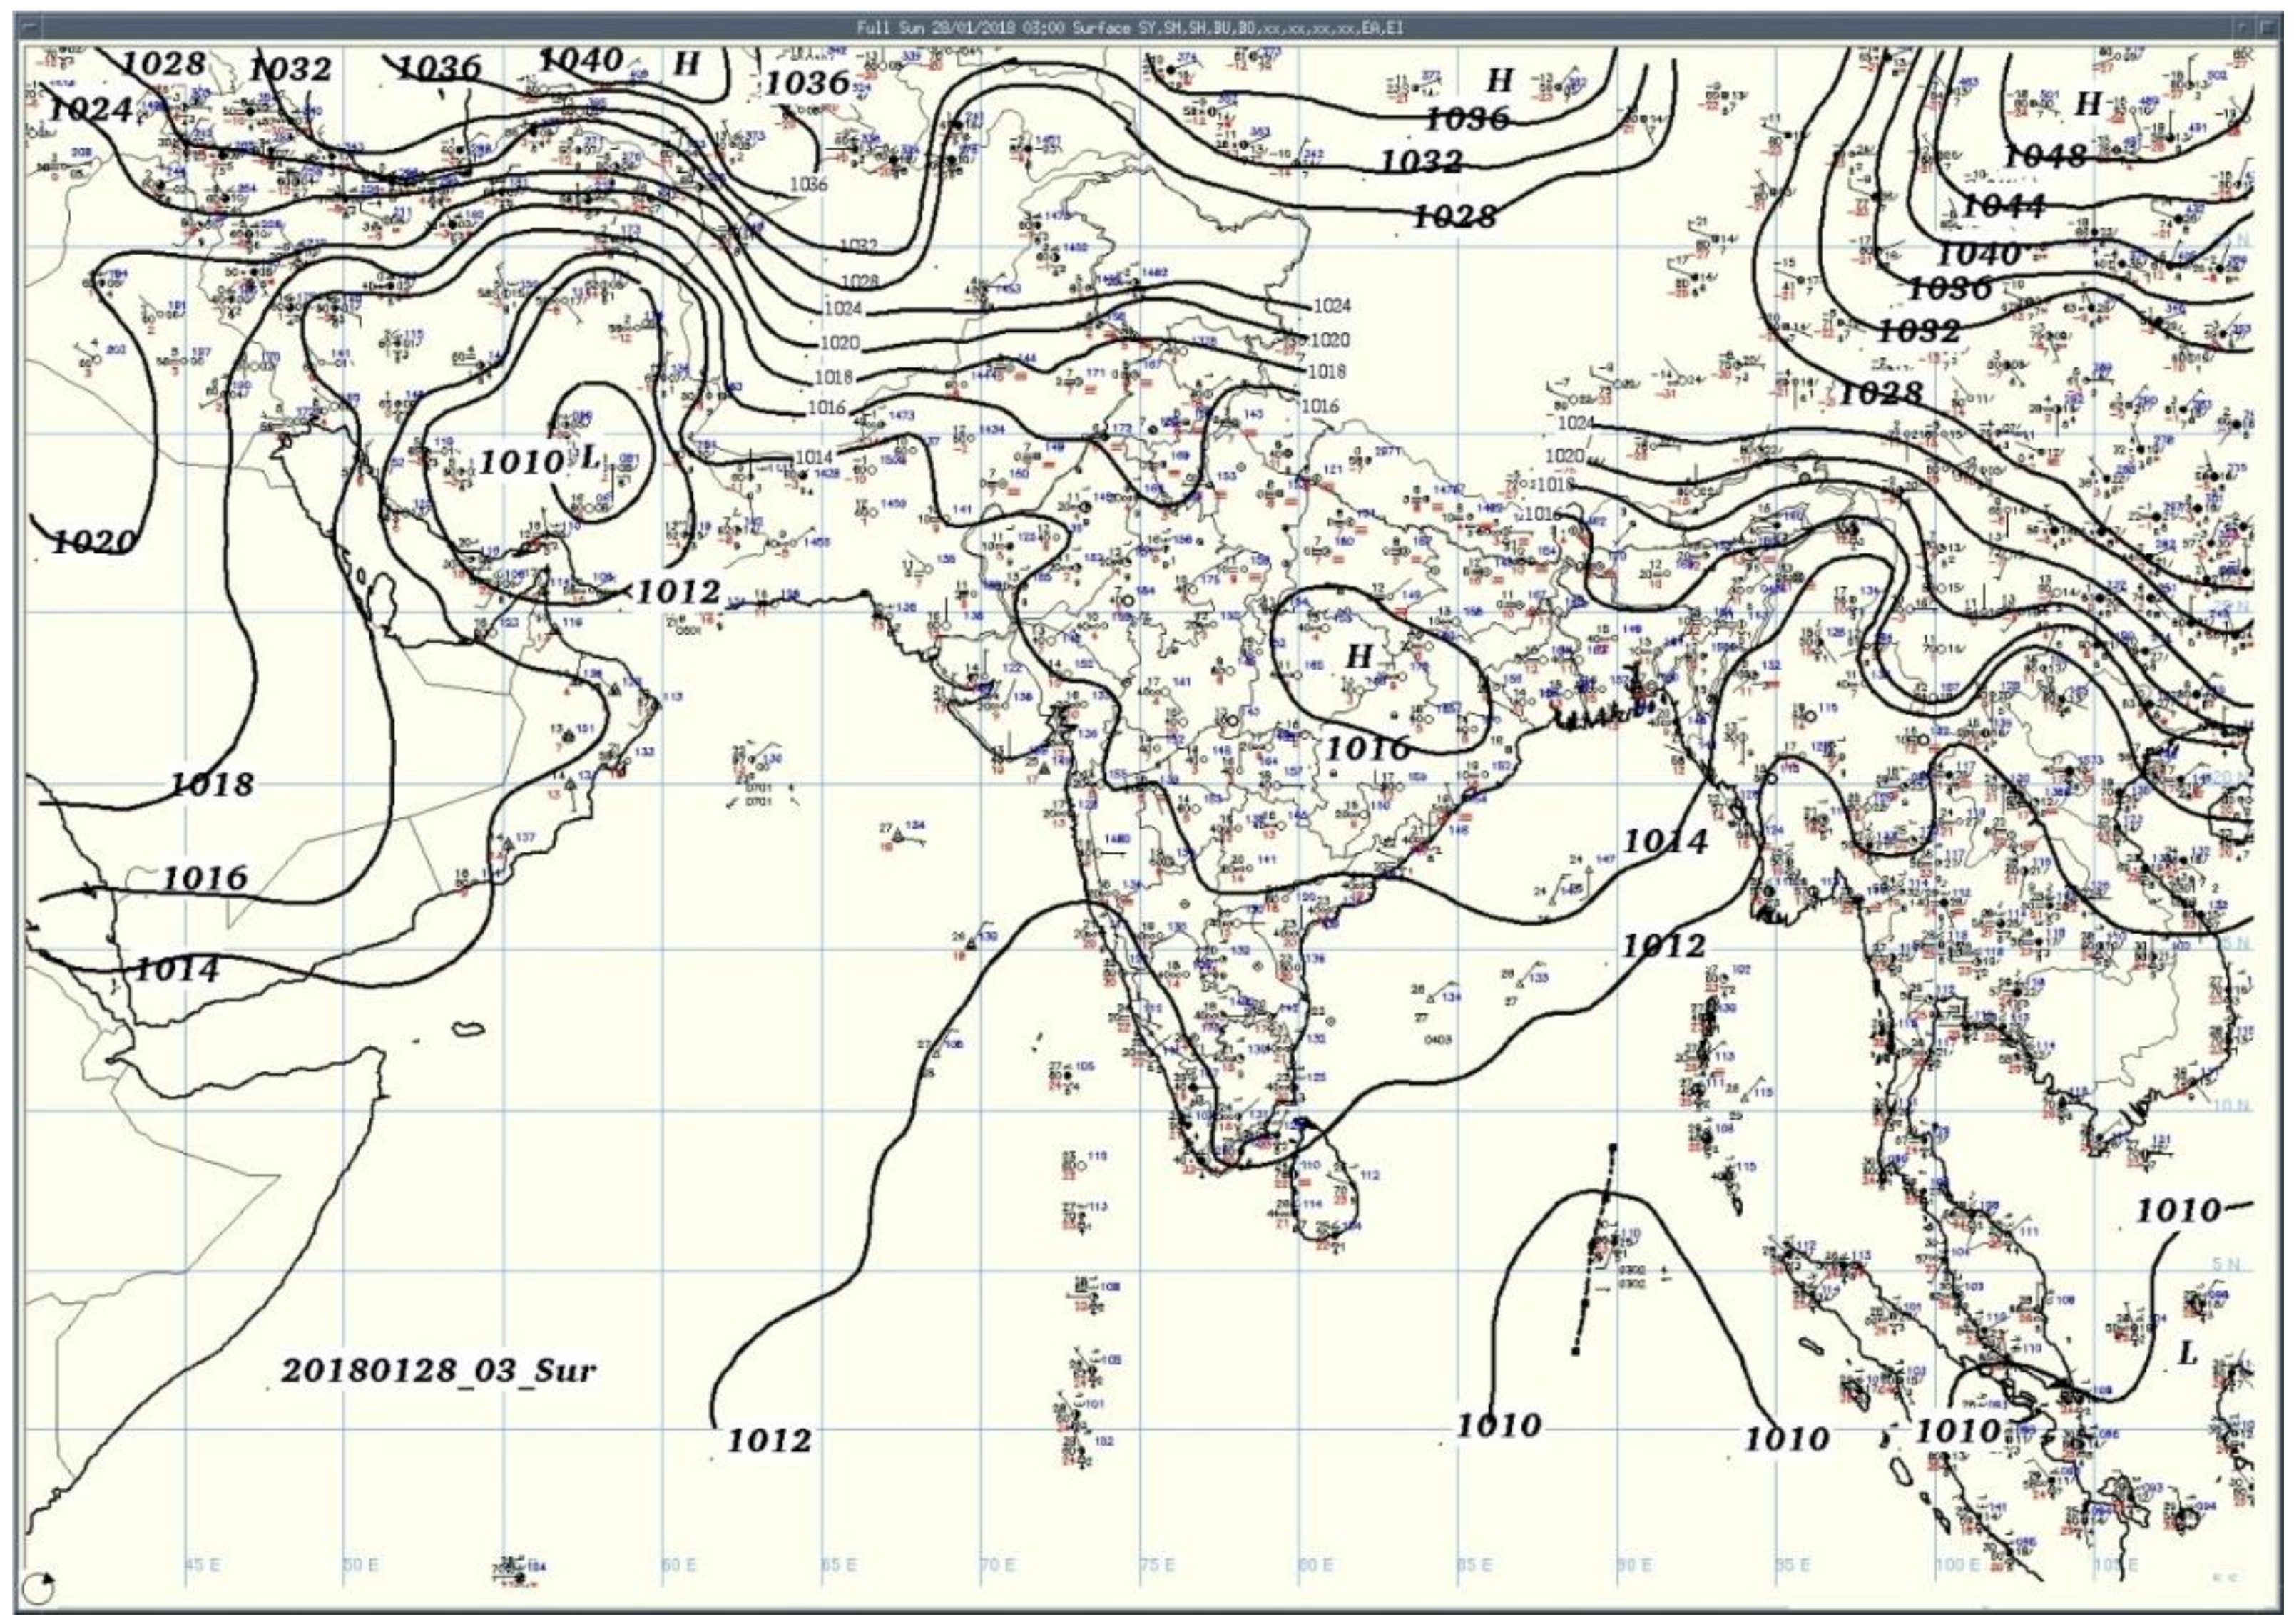
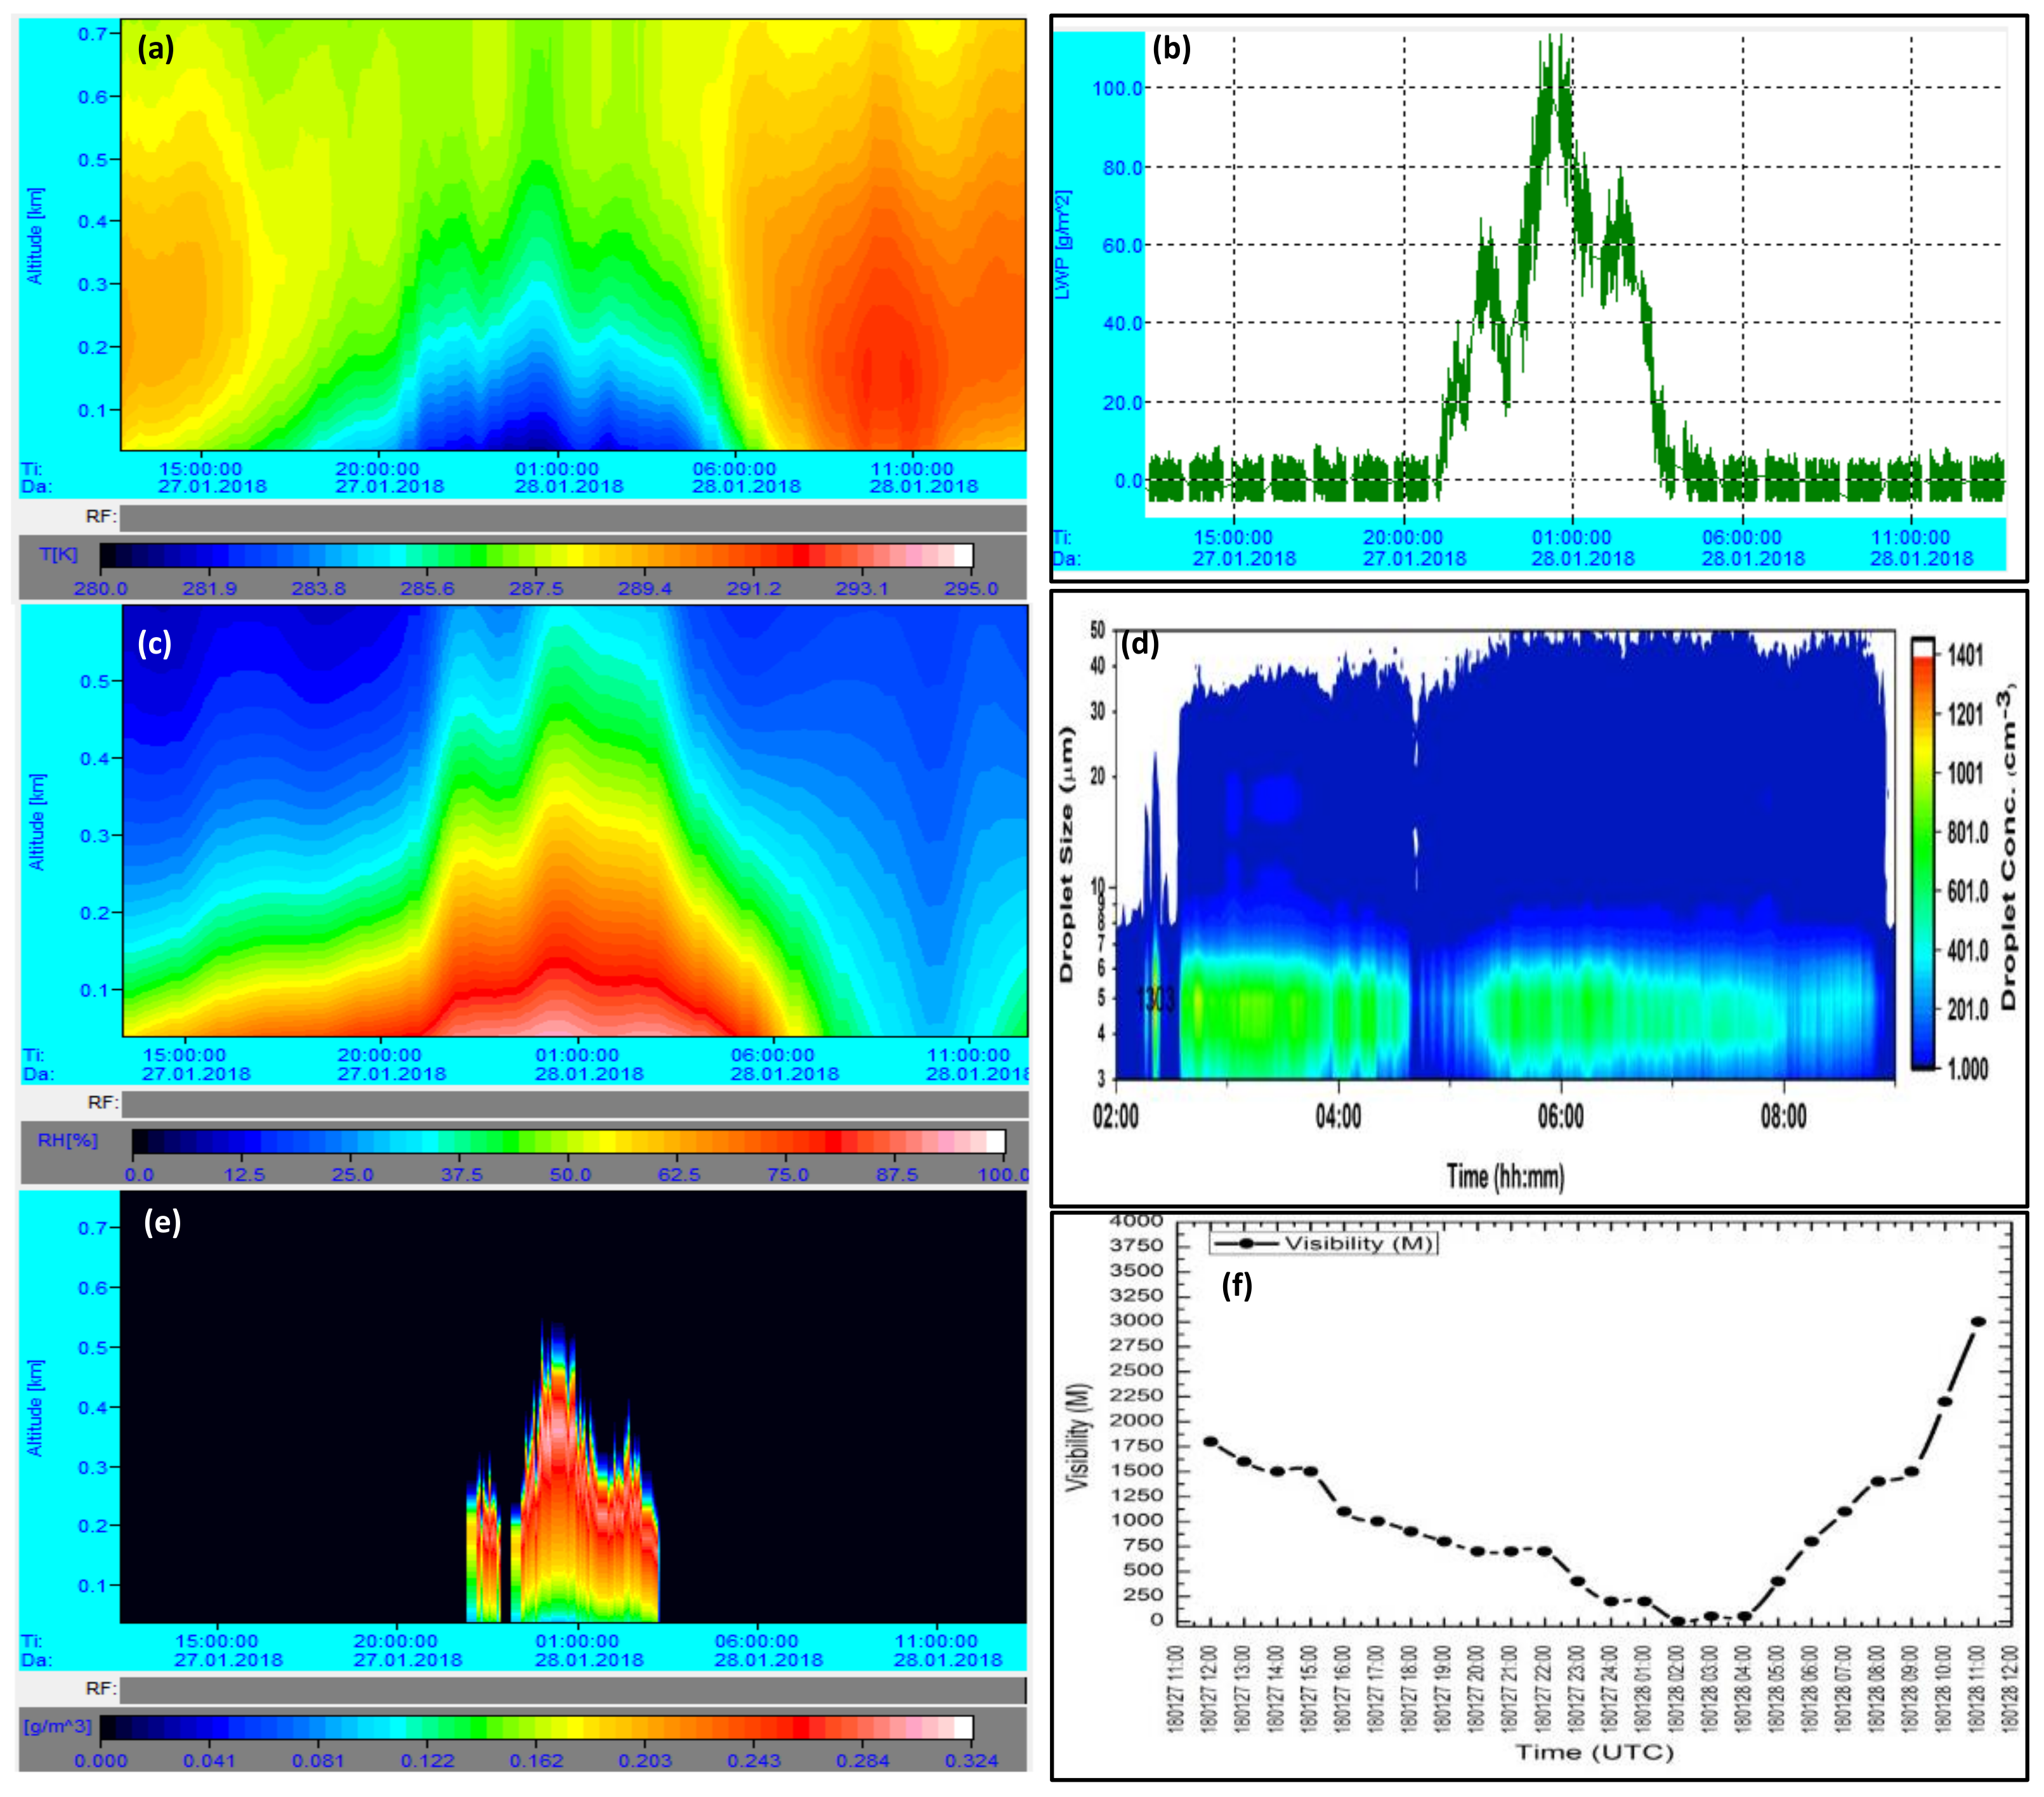
Typical synoptic-scale weather conditions and local meteorological conditions that usually trigger the dense fog at IGI Airport are shown in Figure 3; Figure 4 as an example (for the fog event which occurred on 28 January 2018). The surface visibility evolution at IGI Airport for this event indicates that dense fog formation started (visibility < 400 m) on 28 January, 01 UTC (Figure 4f), and that between 01 UTC and 04 UTC surface visibility reduced to close to a zero value, indicating very dense fog at IGI Airport (dense fog regime). A microwave radiometer (MWR) was installed at IGI Airport to measure the vertical profiles of air temperature, the water vapor mixing ratio, and cloud liquid water, and the fog monitor (FM120) was installed to measure the fog droplet number concentration. The fog layer vertical structure and its associated thermodynamic features can be noted from the microwave radiometer profiler (Figure 4). During 28 November, the synoptic-scale weather conditions were characterized by low wind speed and persistent subsidence of high pressure over a region with a northerly and northwesterly zonal advection supporting cold air advection (see synoptic charts in Figure 3) over the airport. The northerly and northwesterly advection affected the whole boundary layer and contributed to a net decrease in the temperature field. As a result, the vertical temperature and the humidity structure at IGI Airport indicated a strong temperature inversion (Figure 4a) located at 200 m close to the surface with a deep moist layer below that level (Figure 4c). This layer was persistent throughout the night. The cooling conditions eventually triggered the deep fog layer formation in the early morning of 28 January 2016 as evidenced by the highest liquid water contained near the surface (Figure 4e) and the increase in the total liquid water path (Figure 4b). During the dense fog hours (visibility < 200 m), large numbers of fog droplets in the size range of 2–50 µm were observed near the surface (Figure 4f). This suggested that the very low visibility conditions observed between 01 UTC and 04 UTC were not haze but were caused by fog droplets.
In this study, we focused on the number of flights delayed, diverted, and cancelled from India’s busiest international airport (IGI Airport) in New Delhi during the winter fog season between 2011 and 2016. Diversion data for 2011–2014 were taken from the DGCA report, 2014 [5], while the same for the period 2014–2016 were taken from Air Traffic Control (ATC) and Delhi International Airport Limited (DIAL), IGI Airport New Delhi. Data on cancellations and delays for 2011–2016 were collected from DIAL. DIAL records flight delays, diversions, and cancellations of flights on a daily basis when the airport encounters the CAT IIIB (visibility < 200 m) fog conditions. The data on the number of dense fog hours estimated from the visibility less than 200 m at IGI Airport were taken from the IMD [15]. Visibility at each runway at IGI Airport was measured using very accurate “Drishti” indigenious-transmissometer [19]. More details on the accuracy of the visibility data can be found in Mohan et al., 2015 [19]. To estimate the economic cost of fog for each delayed, diverted, and cancelled flight at IGI Airport, we used the actual cost of flight operations and its maintenance charges [1,2,3,4,5,6,7,8,9,10] for both domestic and international flight operations. This estimation is based on the distance between the arrival and departure places, passenger and fuel holding capacity, and weight of the flights. Table 2; Table 3 represent the breakdown of charges for different segments of flight operations for domestic and international flights, respectively. The breakdown of charges for different segments of flight operations indicates a fixed value for domestic and international as per the Ministry of Civil Aviation and the Center for Asia Pacific Aviation (CAPA) India [2]. The number of dense fog hours (visibility < 200 m) during each winter season was estimated based on the transmissometer installed at each runway. Visibility data from all the transmissometers were averaged to get overall visibility at IGI Airport. Table 2 and Table 3 illustrate that the economic cost of fog varies significantly and depends on whether flights are delayed, diverted, or cancelled. In this study, for domestic flights, we considered a flight capacity of 150 passengers and an average ticket cost of 52.23 USD (INR 3500)/person. For international flights, we considered a carrying capacity of 350 passengers (e.g., Air India Boeing 777-300 ER from London to Delhi) with an average ticket cost of 1343.28 USD (INR 90,000)/person.
3. Economic Impact
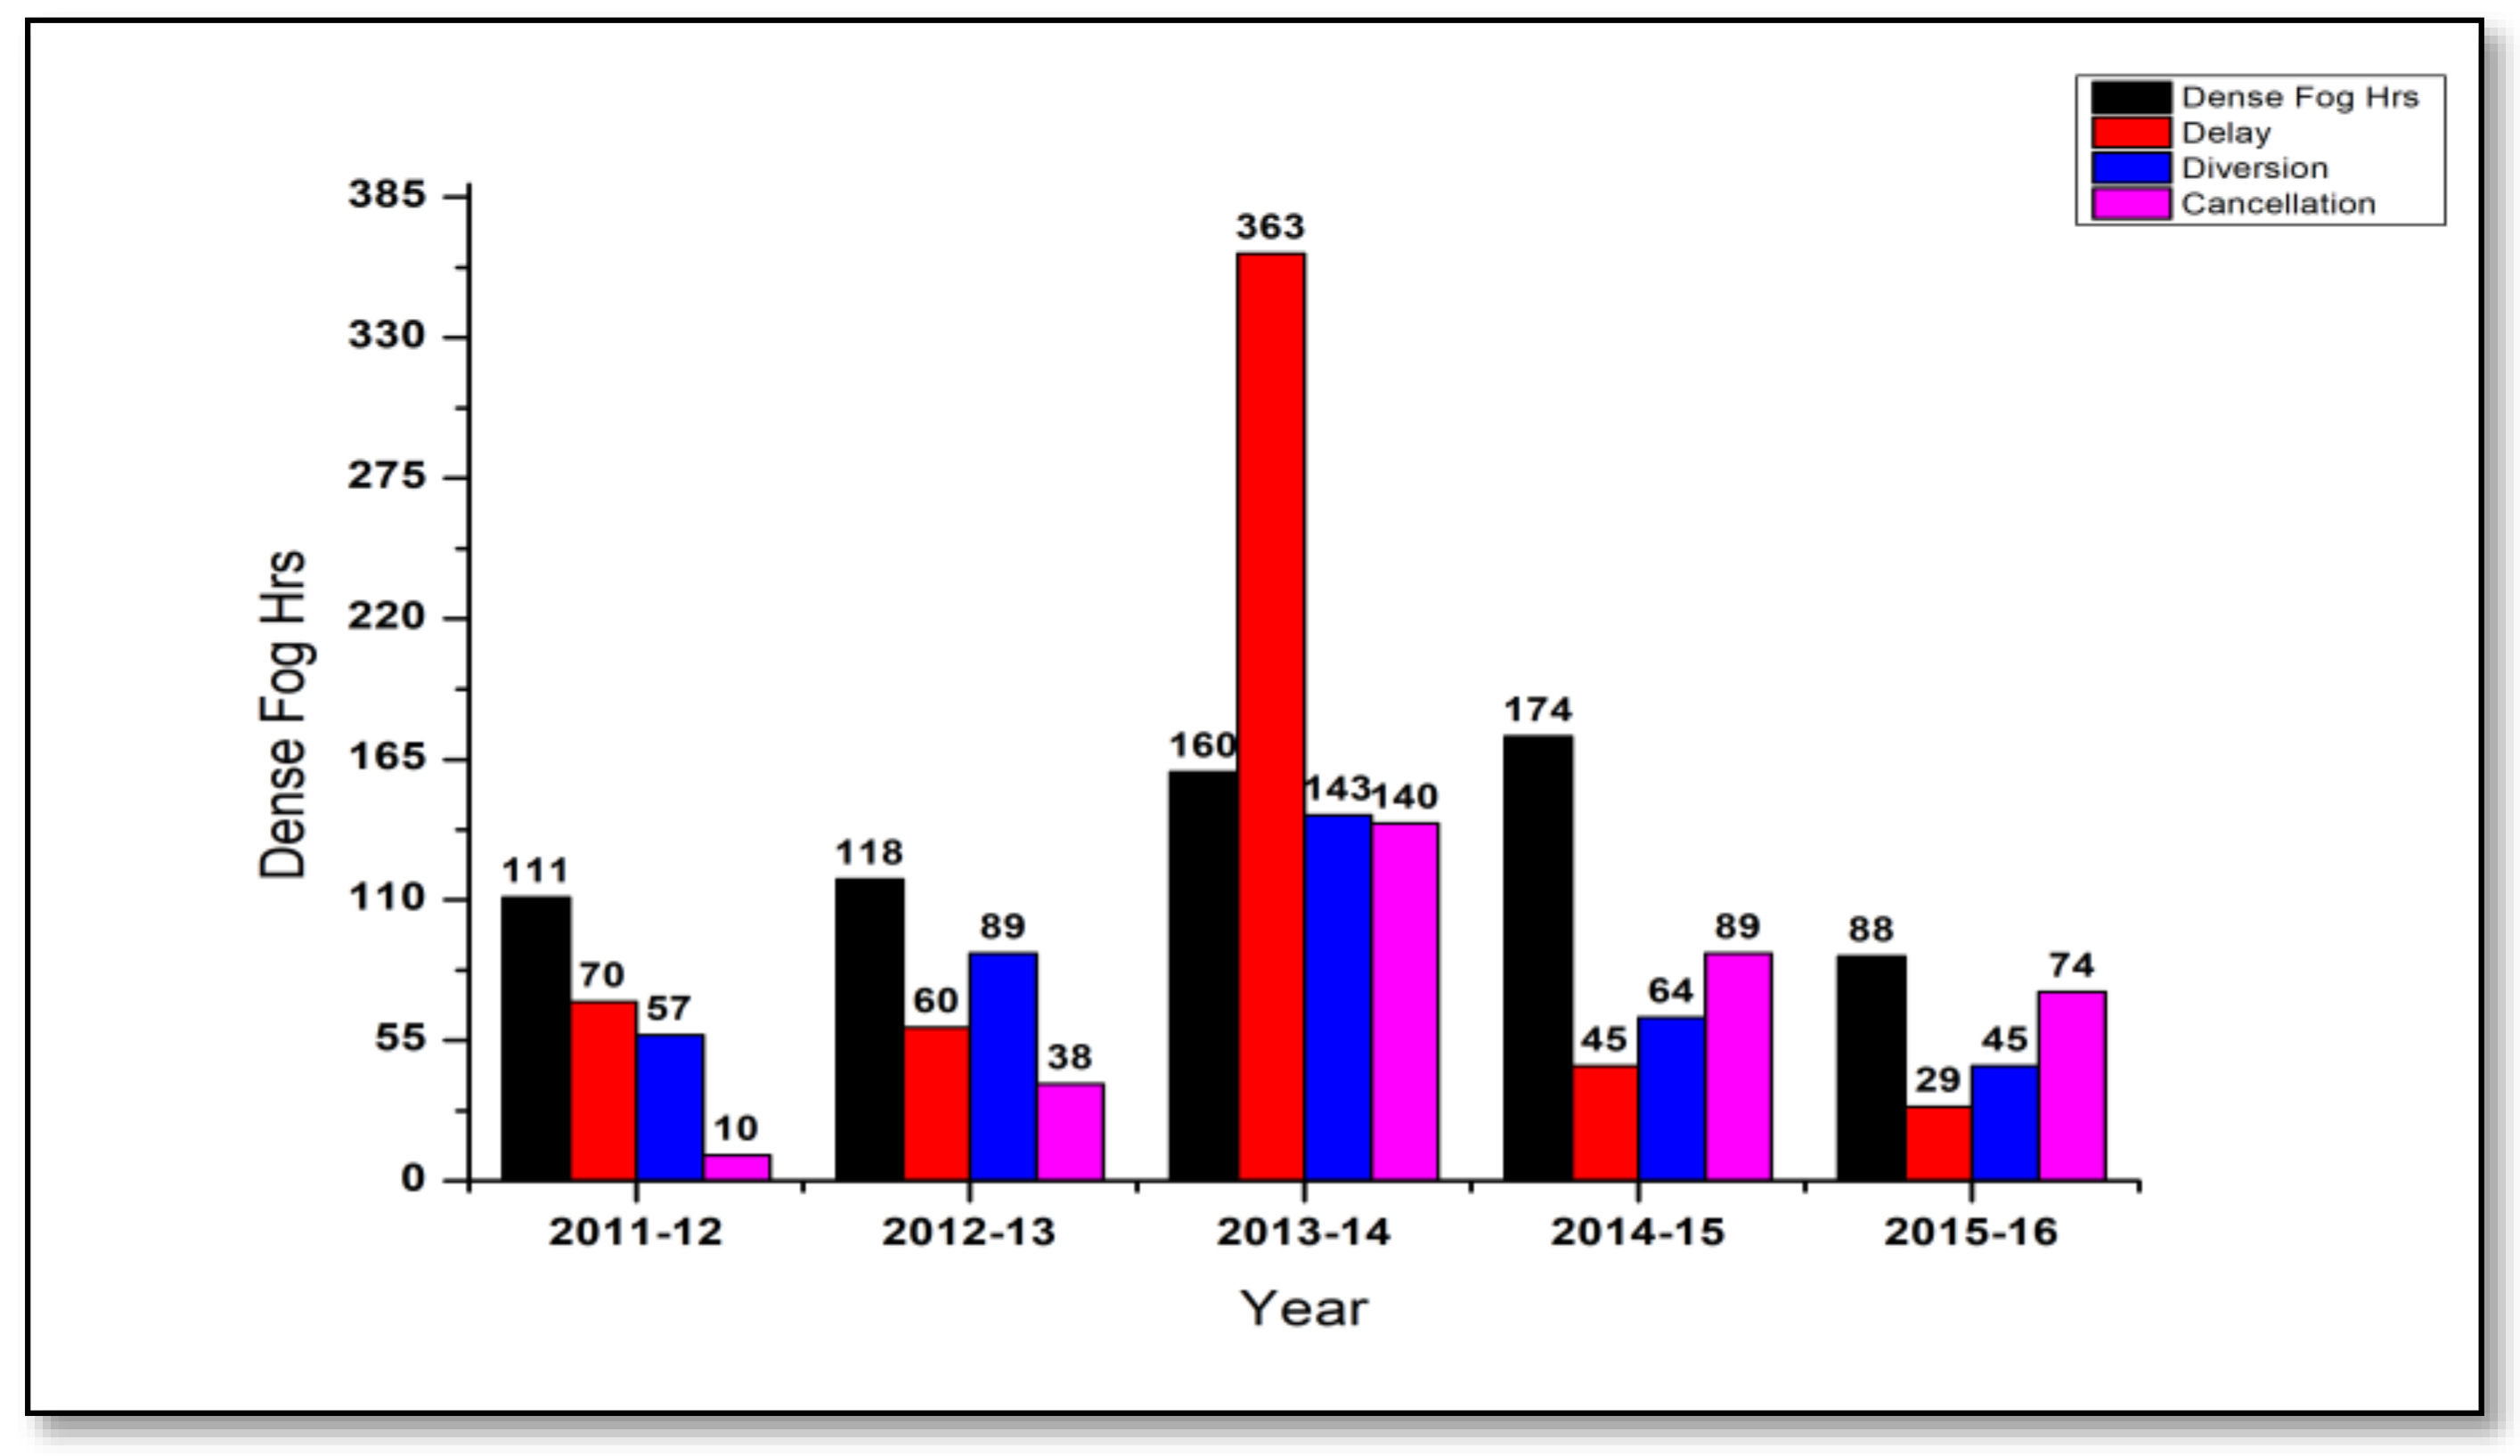
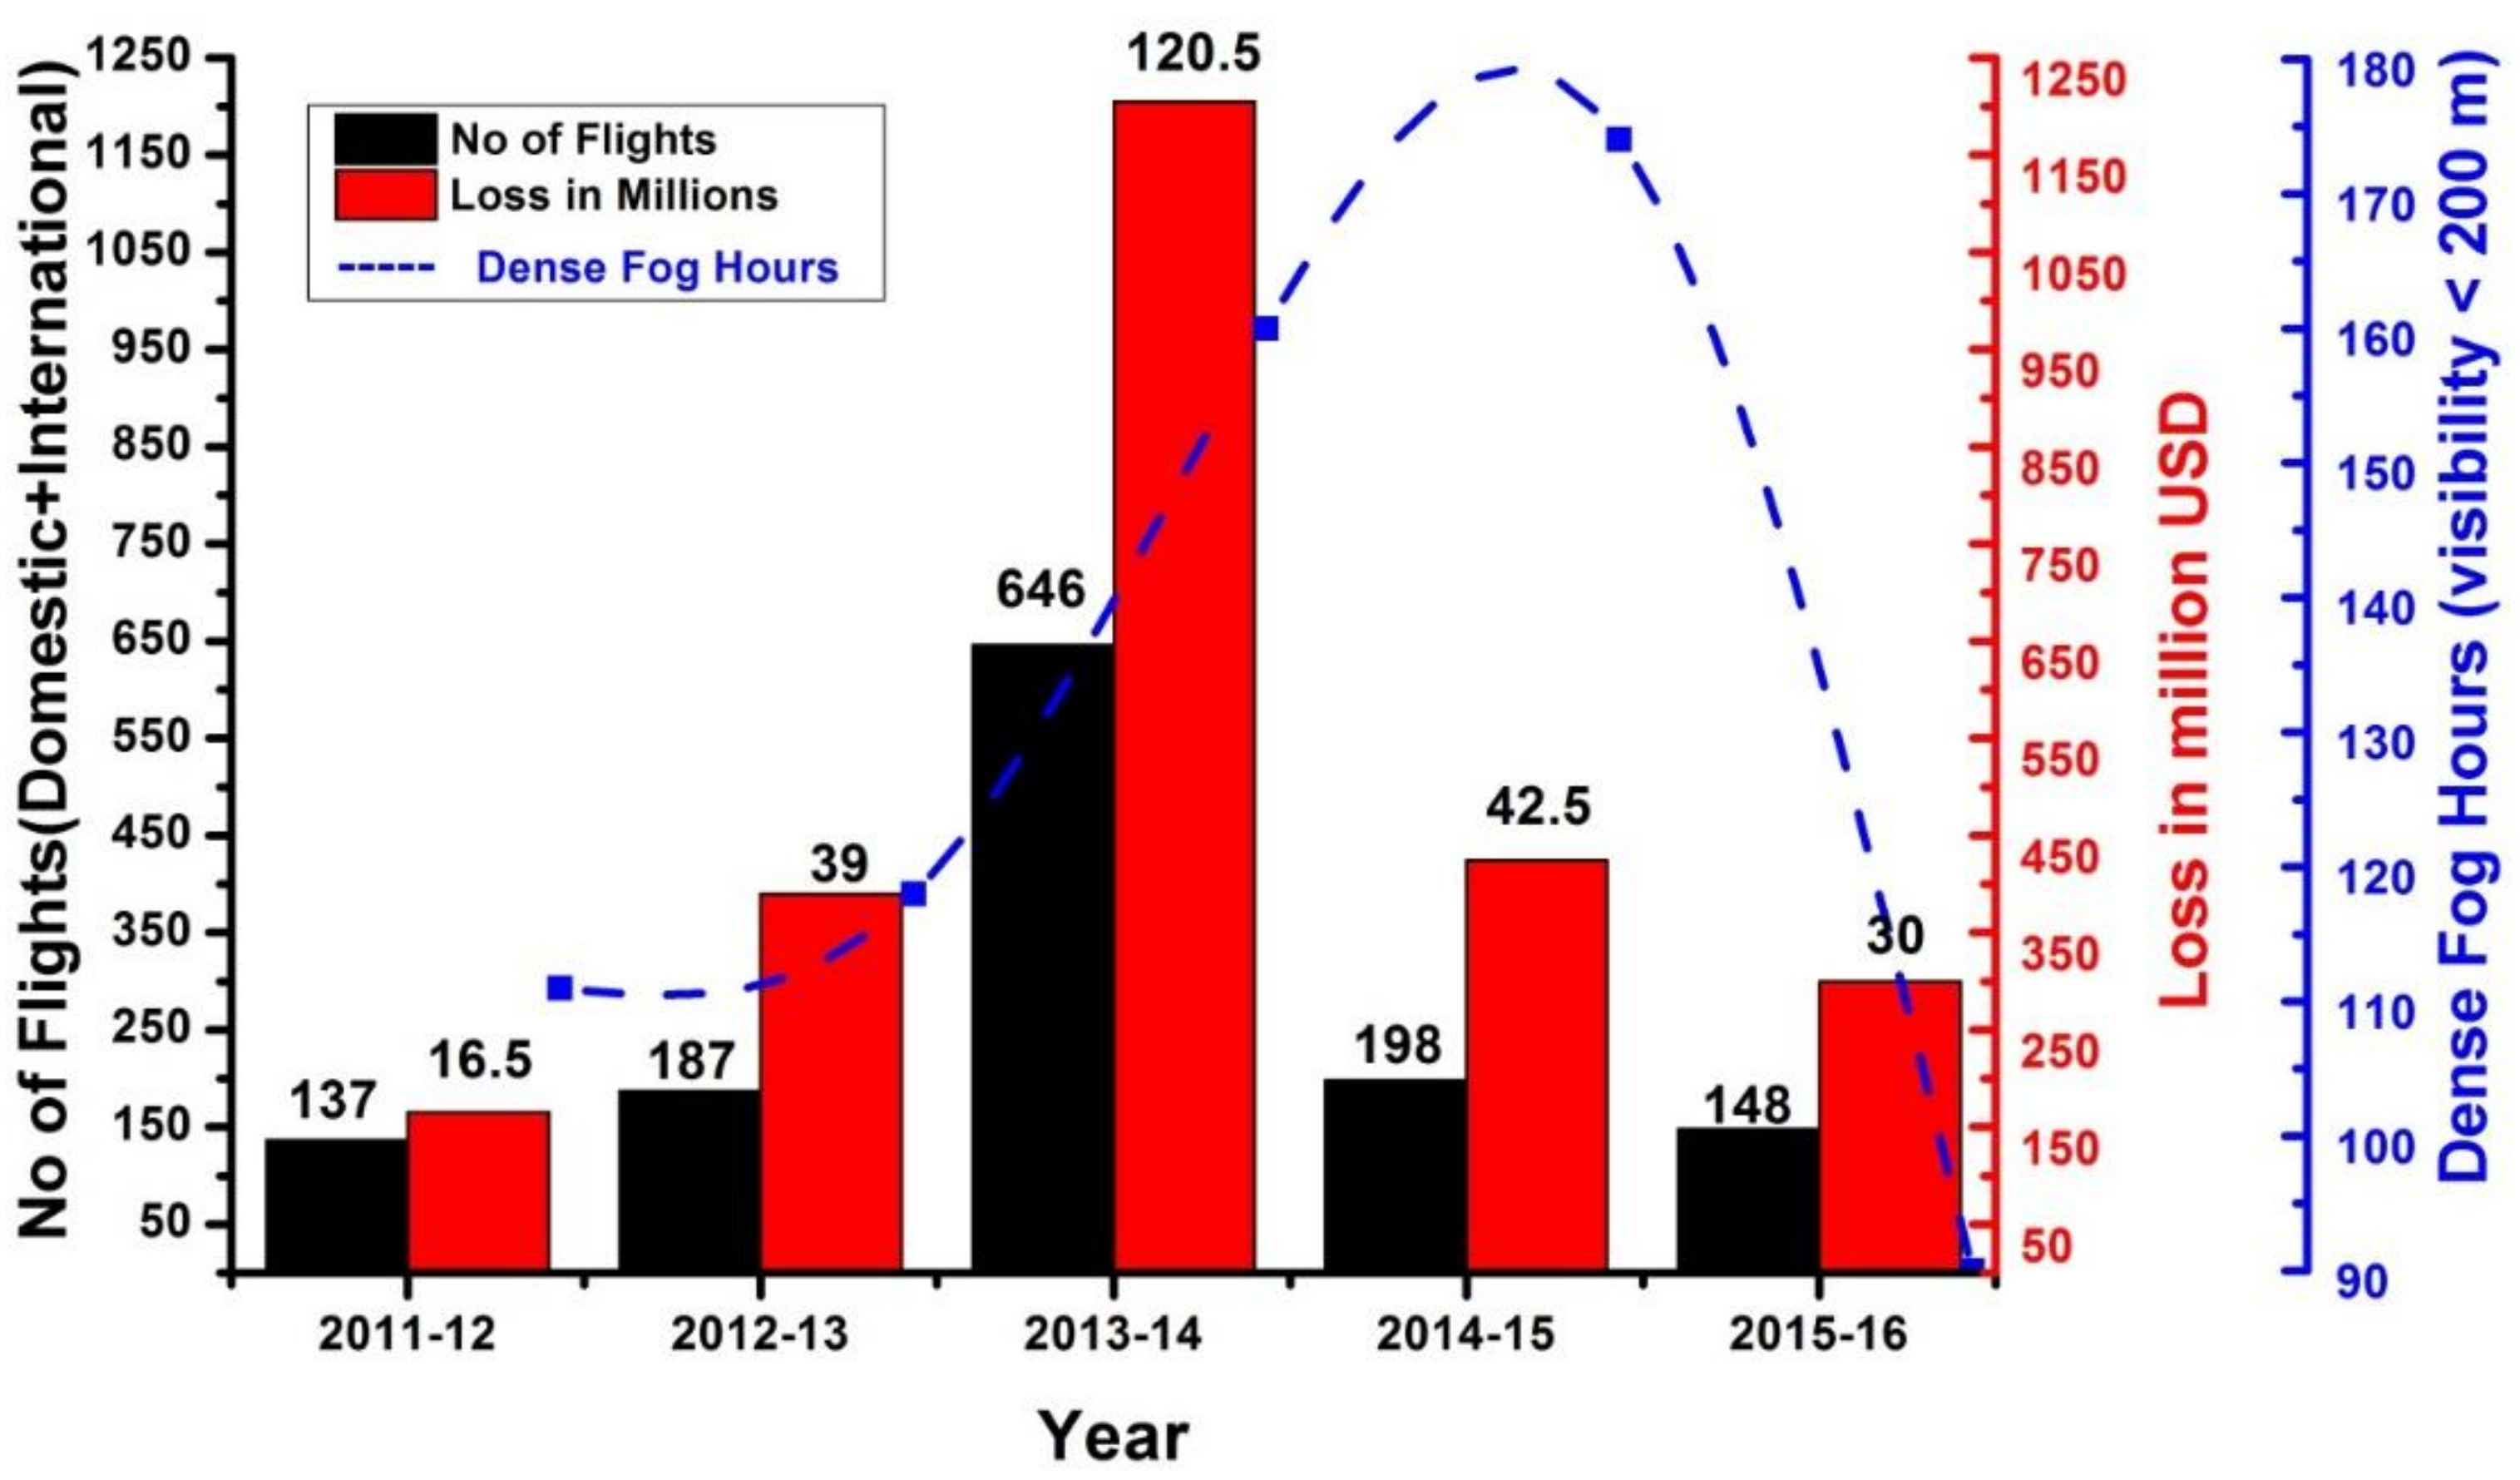
Figure 5 illustrates the number of dense fog hours (for visibility less than 200 m) for each year from 2011 to 2016 and corresponding numbers of delayed, diverted, and cancelled flights from both domestic and international sectors at IGI Airport, New Delhi. It can be seen that flight operations are related to the number of dense fog hours which occurred in each year. During the 2011–2012 and 2012–2013 winter seasons, the numbers of dense fog hours were fewer compared to the winter season of 2013–2014, which resulted in fewer disturbances to flight operations. Based on the breakdown of charges as per the CAPA [2] and reported values in Table 2, the estimated costs of delays, diversions, and cancellations are approximately 2681.35 USD, 7456.85 USD, and 8171.64 USD for one domestic flight, and 5665.96 USD, 21,934.53 USD, and 8171.64 USD for one international flight, respectively. Figure 6 presents the total numbers of flights affected and the respective economic losses for each winter season between 2011 and 2016. The numbers of dense fog hours are also overlaid (blue curve) with the total flights affected during the same period. The total number of flights cancelled, diverted, and delayed during this period was 351, 398, and 567, respectively. This led to a total economic cost of approximately 3.9 million USD (248 million Indian rupees) due to flights affected by heavy fog spells at IGI Airport over five years.
In 2013–2014, dense fog hours were approximately 160 h and most of the events occurred at midnight or in the early morning hours and continued until the next day [5]. This caused a maximum number of 363 delays (313 domestic and 50 international), 143 diversions (89 domestic and 54 international), and 141 cancellations (110 domestic and 30 international) of flights at IGI Airport. For example, in 2013–2014, due to a very dense fog episode on 5 January 2014, a total of 52 flight diversions occurred on a single day, a record of the highest ever number of flights diverted from Delhi airport in a single night due to unfavorable weather conditions. Compared to dense fog events which occurred between the years 1981–2014, the onset of the dense fog recorded on 5 January 2014 was the earliest. It started at 18:30 IST on 5 January and remained until 08:30 IST on 6 January. RVR data from all runways showed that visibility values were below 150 m between 20:30 IST and 02:30 IST leading to CAT IIIB/C conditions. Since the incoming flights on that date were mostly non-CAT compliant [5], they were unable to land at IGI Airport, which resulted in more diversions. It was the worst fog event recorded between 2008 and 2016 in terms of duration of a dense fog event. During this fog event, IGI Airport was equipped with a world-class CAT IIIB ILS facility and was fully working. However, the lack of preparedness with respect to trained pilots and CAT III-compliant flights to handle such an event resulted in a large disruption to the flight operations [5,12]. This resulted in the largest economic loss of approximately 1.78 million USD (120 million INR) due to the heavy fog spells in the winter of 2013–2014.
In order to avoid such incidents of high disruption and to bring flight diversions to zero, experts from DGCA-IMD-AAI prepared strict guidelines [5] to implement CAT III ILS effectively for all flight landings at IGI Airport during night–morning operations when the airport is vulnerable to the likely occurrence of fog events as per the IMD meteorological forecast. These guidelines cover all details, such as (1) aircraft should be fitted with devices matching CAT IIIB ILS and (2) airlines should train their pilots and crews to operate flights in low visibility conditions. More details on the guidelines can be found in the DGCA report [5]. It also describes the role of all stakeholders and the Standard Operating Procedure (SOP) to be followed to reduce diversions and cancellations so that the huge loss which occurred during 2013–2015 fog season can be minimized in the future.
Since the implementation of these guidelines in the winter of 2014–2015, IGI Airport has been better prepared by giving advanced training to pilots and improving their effective utility over the existing landing system to an advanced CAT III landing. As a result, we found drops of approximately 88%, 55%, and 36% in delays, diversions, and cancellations of flights, respectively (Figure 5), irrespective of a greater number of dense fog hours (~10% higher than the preceding winter season) in the winter of 2014–2015 (Figure 6). Consequently, a significant reduction in economic losses to the airlines due to dense fog was observed during the winter of 2014–2015 (0.675 million USD). This is approximately a 65% reduction in economic losses compared to the earlier winter season (2013–2014). Figure 6, overlaid with the duration of dense fog hour data (visibility < 200 m) also shows the relationship between the number of fog hours and economic losses for every year. It shows that the economic cost of fog is directly related to the number of dense fog hours, but that the implementation of the DGCA-IMD-AAI guidelines during 2014–2015 has reduced significantly the cost of fog to the airlines.
4. Conclusions
The Indira Gandhi International (IGI) Airport located in India’s capital, New Delhi, is one of the largest and busiest airports not only in the country but also in the world, in terms of passengers and cargo traffic. It is also frequently affected by the occurrence of dense fog events during every winter season. Therefore, it is important to assess the impact of fog on aviation economy and how advancements in landing systems prevent large losses. For this study, we assessed the economic impact of dense fog in New Delhi on flight operations at IGI Airport during the period 2011–2016. In addition, we also assessed the impact of the implementation of guidelines prepared jointly by DGCA, IMD, and AAI [1,5,19] for aircraft landing in very low visibility conditions at IGI Airport. The breakdown of charges to estimate the economic cost of delays, diversions, and cancellations is taken from the CAPA report. Dense fog occurred at IGI Airport, New Delhi during 2011–2016, causing a total economic loss of approximately 3.9 million USD (248 million Indian rupees) to the airlines. In 2013–2014, the number of fog hours reached 160 and resulted in an economic loss of approximately 1.78 million USD (120 million Indian rupees) even though RWY 29-MID-11 and RWY 28-MID-10 were equipped to support CAT IIIB operations at IGI Airport. However, the effective implementation of the CAT III landing guidelines and a better preparedness prior to the fog season of 2014–2015 have significantly reduced the economic loss due to fog spells at IGI Airport. In a recent study, Ghude et al. (2017) showed that the number of dense fog hours has almost doubled in the last three decades and may increase in the future. At the same time, the air traffic at IGI Airport has also increased significantly in the last decade and is expected to increase two-fold in the near future. This will lead to a further increase in economic losses to airlines in India during the winter season. To ensure arrival at a world-class airport like IGI Airport during all winter nights or mornings, airlines should totally convert all their flights scheduled to arrive at IGI Airport from 1300 UTC to 0600 UTC to CAT IIIB landing compliance. In addition to promoting the use of the landing training system and the effective air traffic guidance, accurate fog forecasts of the onset and dissipation of dense fog of various visibility ranges by IMD is important to minimize the economic losses to the aviation sector.
Author Contributions
All authors devised the research, analysed the results and wrote the paper; R.K. and S.D.G. took lead to conceive the idea and write the paper.
Funding
This research received no external funding.
Acknowledgments
We thank the Director, Indian Institute of Tropical Meteorology (IITM), Pune and the Director General India Meteorological Department (IMD) for their encouragement and all their support during the course of the Fog Campaign. We also thank the Grandhi Mallikarjuna Rao (GMR) group and Airports Authority of India (AAI) for providing the necessary data for IGI Airport, New Delhi.
Conflicts of Interest
The authors declare no conflict of interest
References
- Airport Authority of India “Airport Charged_ Revised” 2009. Available online: https://www.aai.aero/sites/default/files/eng_report_2011.pdf (accessed on 20 January 2019).
- Centre for Asia Pacific Aviation India Private Limited (CAPA) India Ground Handling Report 2014. Available online: https://docplayer.net/21483481-Capa-india-ground-handling-report-2014-table-of-contents-sample-extracts.html (accessed on 25 November 2018).
- Handbook on Civil Aviation Statistic—Glimse of Aviation Statistic, 2017–2018. 2018. Available online: http://www.dgca.nic.in/pub/HANDBOOK%202017-18/HANDBOOK%202017-18.pdf (accessed on 10 February 2019).
- Sharma, A.K. National Council of Applied Economic Research. 2012. annual_report_15. Available online: http://www.ncaer.org/uploads/annualreport/pdf/annual_report_15_Annual_Report_NCAER2013.pdf (accessed on 20 January 2019).
- DGCA Report of Working Group on Civil Aviation for Formulation of Twelfth Five Year Plan (2012–2017). Available online: http://dgca.nic.in/aic/aic08_07.pdf (accessed on 5 February 2019).
- Flight Operations Support & Line Assistance. Available online: https://www.skybrary.aero/bookshelf/books/1480.pdf (accessed on 5 February 2019).
- Subpart E-Low visibility operations (LV0). Available online: https://skybrary.aero/bookshelf/books/2119.pdf (accessed on 5 February 2019).
- MJETS- Ground Handling Services for Thailand Airports. 2014. Available online: http://www.tibahairports.com/en-EN/Airlines/Pages/ground-handling-services.aspx) (accessed on 25 November 2018).
- Zegreb International Airport—Price list of Ground Handling Services. 2017. Available online: http://www.zagreb-airport.hr/UserDocsImages/dokumenti/AO-AOP-MAN-02-3-Cjenik%20aer%20usl_EN_01032017.pdf (accessed on 28 February 2019).
- Press Clippings of Airport Authority of India—Public Relations Department; Financial Express: New delhi, India, 22 January 2016; 01-59.
- Singh, J.; Kant, S. Radiation fog over north India during winter from 1989–2004. Mausam 2006, 57, 271–279. [Google Scholar]
- Jenamani, R.K. Alarming rise in fog and pollution causing a fall in maximum temperature over Delhi. Curr. Sci. 2007, 93, 314–322. [Google Scholar]
- Jenamani, R.K.; Tyagi, A. Monitoring fog at IGI Airport and analysis of its runway-wise spatio-temporal variations using Meso-RVR network. Curr. Sci. 2011, 100, 491–501. [Google Scholar]
- Jenamani, R.K. Development of intensity based fog climatological information system (daily and hourly) at IGI airport, New Delhi for use in fog forecasting and aviation. Mausam 2012, 63, 89–112. [Google Scholar]
- Jenamani, R.K. Micro-climatic study and trend analysis of fog characteristics at IGI airport New Delhi using hourly data (1981–2005). Mausam 2012, 63, 203–218. [Google Scholar]
- Ghude, S.D.; Bhat, G.S.; Prabhakaran, T.; Jenamani, R.K.; Chate, D.M.; Safai, P.D.; Karipot, A.K.; Konvar, M.; Pithani, P.; Sinha, V.; et al. Winter Fog Experiment (WIFEX) over Indo-Gangetic Region of India:overview and preliminary results. Curr. Sci. 2017, 112, 767–784. [Google Scholar] [CrossRef]
- Sawaisarje, G.K.; khare, P.; Shirke, C.V.; Deepakumar, S.; Narkhede, N.M. Study of winter fog over Indian subcontinent: Climatological perspectives. Mausam 2014, 65, 19–28. [Google Scholar]
- Syed, F.S.; Kornich, H.; Tjernstrom, M. On the fog variability over south Asia. Clim. Dyn. 2012, 39, 2993–3005. [Google Scholar] [CrossRef]
- Mohan, K.N.; Arulpaligan, A.; Sivakumar, G.; Krishnamurthy, R.; Shubha, V.; Shinde, U.; Mali, R.R.; Bhatnagar, R. Performance study of Drishti transmissometer at CAT III B airport. Mausam 2015, 66, 713–718. [Google Scholar]
Figure 1.
(a) Airport areas of the Indira Gandhi International (IGI) Airport and runway (RWY) orientation. All three RWYs have been in operation at IGI Airport since August 2008. (b) Illustration of Category – Instrument Landing Systems (CAT-ILS) Operation.
Figure 1.
(a) Airport areas of the Indira Gandhi International (IGI) Airport and runway (RWY) orientation. All three RWYs have been in operation at IGI Airport since August 2008. (b) Illustration of Category – Instrument Landing Systems (CAT-ILS) Operation.

Figure 2.
Schematic showing the possible effects of fog on flight operations.

Figure 3.
The India Meteorology Department (IMD) synoptic chart for 28 January 2018.

Figure 4.
The time and height cross-section of (a) temperature profiles observed from the microwave radiometer (MWR), (b) liquid water path (g/m2) observed from the microwave radiometer (MWR), (c) humidity profiles observed from the microwave radiometer (MWR), (d) temporal evolution of the fog number droplet concentration as a function of droplet diameter during the dense fog event of 28 January 2018 (2–10 UTC), and (e) liquid water profiles from the surface to 700 m and observed from the microwave radiometer (MWR), and (f) hourly visibility from 27 January 2018 (12 UTC) to 28 January 2018 (12 UTC) at IGI Airport Delhi. MWR profiles are shown at IGI Airport, New Delhi from 27 January 2018 (12 UTC) to 28 January 2018 (12 UTC).

Figure 5.
Number of total flights delayed (red), diverted (blue), and cancelled(pink) every year due to fog at IGI Airport, New Delhi. Black bar shows total number of dense fog hours for visibility less than 200 m.
Figure 5.
Number of total flights delayed (red), diverted (blue), and cancelled(pink) every year due to fog at IGI Airport, New Delhi. Black bar shows total number of dense fog hours for visibility less than 200 m.

Figure 6.
Total economic losses due to dense fog which occurred at IGI Airport between 2011 and 2016. Black bar shows the total number of flights affected, red bar shows the economic loss (in millions USD), and blue line shows the total number of dense fog hours for visibility less than 200 m.
Figure 6.
Total economic losses due to dense fog which occurred at IGI Airport between 2011 and 2016. Black bar shows the total number of flights affected, red bar shows the economic loss (in millions USD), and blue line shows the total number of dense fog hours for visibility less than 200 m.


Table 1.
Fog types, general visibility range, and runway visibility range (RVR) for different conditions valid for Indira Gandhi International (IGI) Airport.
Table 1.
Fog types, general visibility range, and runway visibility range (RVR) for different conditions valid for Indira Gandhi International (IGI) Airport.
| General Visibility Range Valid for IGI Airport (in Meters) | RVR Range as per DGCA-CAR * (in Meters) | CAT # Types as per ICAO ## | General Visibility Range Valid for IGI Airport (in Meters) |
|---|---|---|---|
| Shallow | 1000–500 | 1200–800 | Safeguarding procedure to start |
| Moderate | 500–300 | 800–550 | CAT I |
| 350–200 | 550–300 | CAT II | |
| Dense | 200–50 | 300–175 | CAT IIIA |
| 175–50 | CAT IIIB | ||
| Very Dense | <50 | 175–50 | CAT IIIB |
| <50 | CAT IIIC |
* Directorate General of Civil Aviation (DGCA)- Civil Aviation Requirement (CAR); # Category (CAT); ## International Civil Aviation Organization (ICAO).
Table 2.
Breakdown of charges for domestic flight operations as per the Center for Asia Pacific Aviation (CAPA) (2013).
Table 2.
Breakdown of charges for domestic flight operations as per the Center for Asia Pacific Aviation (CAPA) (2013).
| One Diverted Domestic Flight | |
| Contents | USD (INR) |
| Extra Fuel Cost | 2985 USD (200,000 INR) |
| Landing Charge | 179.1 USD (12,000 INR) |
| Ground Handling | 671.6 USD (45,000 INR) (for 5 h) |
| RNFC | 68.95 USD (4620 INR) |
| Parking Charge | 194 USD (13,000 INR) |
| Food Charge | 7.46 USD (500 INR/person) (1119.4 USD) |
| Accommodation Charge (in case of night flight) | 14.92 USD (1000 INR/person/night (2238.8 USD) |
| Total Cost | 7456.85 USD (499,620 INR) |
| One Delayed Domestic Flight | |
| Hold Fuel Cost | 1493 USD (1000,000 INR) |
| RNFC | 68.95 USD (4620 INR) |
| Food Charge | 7.46 USD (500 INR/person) (1119.4 USD) |
| Total Cost | 2681.35 USD |
| One Cancelled Domestic Flight | |
| Returning all the Price of the Ticket + Compensation/person 150 INR | 7835.82 + 335.82 8171.64 USD |
Table 3.
Breakdown of charges for international flight operations.
| One Diverted International Flight | |
| Contents | USD (INR) |
| Extra Fuel Cost | 7462.68 USD (500,000 INR) |
| Landing Charge | 2985 USD (200,000 INR) |
| Ground Handling | 1343.28 USD (90,000 INR) (for 5 h) |
| RNFC | 68.95 USD (4620 INR) |
| Parking Charge | 2238.80 USD (150,000 INR) |
| Food Charge | 7.46 USD/person (2611.94 USD) |
| Accommodation Charge (in case of night flight) | 14.92 USD/person/night (5223.88 USD) |
| Total Cost | 21,934.53 USD |
| One Delayed International Flight | |
| Hold Fuel Cost | 2985.07 USD (200,000 INR) |
| RNFC Charge | 68.95 USD (4620 INR) |
| Food Charge | 7.46 USD (500 INR/person (2611.94 USD) |
| Total Cost | 5665.96 USD |
| One Cancelled International Flight | |
| Returning all the Price of the Ticket + Compensation/person 150 INR | 470,149.25 USD + 783.582 USD 470,932.83 USD |
© 2019 by the authors. Licensee MDPI, Basel, Switzerland. This article is an open access article distributed under the terms and conditions of the Creative Commons Attribution (CC BY) license (http://creativecommons.org/licenses/by/4.0/).
Share and Cite
MDPI and ACS Style
Kulkarni, R.; Jenamani, R.K.; Pithani, P.; Konwar, M.; Nigam, N.; Ghude, S.D. Loss to Aviation Economy Due to Winter Fog in New Delhi during the Winter of 2011–2016. Atmosphere 2019, 10, 198. https://doi.org/10.3390/atmos10040198
AMA Style
Kulkarni R, Jenamani RK, Pithani P, Konwar M, Nigam N, Ghude SD. Loss to Aviation Economy Due to Winter Fog in New Delhi during the Winter of 2011–2016. Atmosphere. 2019; 10(4):198. https://doi.org/10.3390/atmos10040198
Chicago/Turabian StyleKulkarni, Rachana, Rajendra K. Jenamani, Prakash Pithani, Mahen Konwar, Narendra Nigam, and Sachin D. Ghude. 2019. "Loss to Aviation Economy Due to Winter Fog in New Delhi during the Winter of 2011–2016" Atmosphere 10, no. 4: 198. https://doi.org/10.3390/atmos10040198
Note that from the first issue of 2016, this journal uses article numbers instead of page numbers. See further details here.