Evaluation of Sustainable Development in European Union Countries


1
Technical School of Industrial Engineering, University of Castilla-la Mancha, 13071 Ciudad Real, Spain
2
Centro de Estudos de Gestao, Instituto Superior Técnico, Universidade de Lisboa, 1649004 Lisboa, Portugal
*
Author to whom correspondence should be addressed.
Appl. Sci. 2019, 9(22), 4880; https://doi.org/10.3390/app9224880
Submission received: 14 October 2019
/
Revised: 8 November 2019
/
Accepted: 12 November 2019
/
Published: 14 November 2019
(This article belongs to the Section Environmental Sciences)
Abstract
:Despite the great importance of sustainable development for a country, it is possible to say, having reviewed the literature widely, that this research is the first to use a Multi-Criteria Decision Method (MCDM) to analyze the sustainability of EU countries, considering different dimensions and weighting the criteria with the help of a group of experts. This paper therefore sets out a Multi-Criteria Model for analyzing the development of sustainability in EU countries (and Norway and Iceland). This required prior filtering and analysis of the data from the Eurostat database. The model was built with the multi-criteria Analytic Hierarchy Process (AHP) technique. Four experts in sustainability participated in the weighting process. The results of the AHP model are identified by areas of sustainability, with the highest value found in Norway, and the rest are found around it forming rings of sustainability, where sustainability decreases the further a country is from Norway. This research could be used to identify the strengths and weaknesses of each country with regard to sustainable development, and by analyzing the measures taken by Norway and other countries with very high sustainability, by continuous improvement processes, reach similar levels of sustainable development.
1. Introduction
In recent decades, one of the greatest problems facing humanity has been the sustainability of the planet, which is compromised by such things as the indiscriminate use of resources, polluting emissions, etc. It is thus necessary to develop tools that enable critical avenues for achieving better progress towards sustainable development to be identified, as well as the use of techniques for reducing or eliminating the impact of these activities.
The definition of Sustainable Development (SD) has evolved over time. It was originally defined, in 1987, as “to seek equity, public awareness and cohesion and participation, to meet the needs and aspirations of the present without compromising the ability to meet those of the future” [1]. SD is defined by Nebel et al. [2] as a process, measurable by environmental, political and social indicators, which tends to improve people’s quality of life and productivity, which is based on appropriate measures of preservation of ecological balance, environmental protection, and use of natural resources, so as not to compromise the meeting of the needs of future generations. Thus, SD should seek an equilibrium between preserving the ecosystem and meeting human needs in three basic areas: environmental, social and economic sustainability [3].
Sustainability assessment is used to assess the level of implementation of sustainability measures [4]. In this way, it is possible to determine the SD of a country by analyzing its sustainability indicators. These are commonly categorized as: economic, environmental, institutional and social [5]. These categories can also interact with each other, giving mixed sustainability indicators. The results of this assessment can be used for decision-making and formulating policies in real-world SD applications [6].
Despite the importance that assessment of SD in these three areas can have for a country, no contribution was found in the literature review set out below analyzing this question in EU countries through objective analytic techniques, such as, for example, Multi-Criteria Decision Making (MCDM). These techniques are formulated to integrate multiple quantitative and qualitative indicators, and so they are ideal for integrating the various indicators required to obtain an overall assessment of SD, a process which may involve different stakeholders, decision groups, or scenarios. Furthermore, since they are easy to apply, and their objectivity can help in justifying the results obtained [7,8], they are of interest in the specific application of SD to countries.
The aim of this research is to identify the evolution over time of sustainability in EU countries (and Norway and Iceland). In order to build the model, a hierarchy of sustainability indicators was created from the database mentioned above, and different types of filters were used to determine the periods and countries to be studied. The multi-criteria Analytic Hierarchy Process (AHP) technique will be used to produce the model. As a result, the models provide a valuation for the countries year by year, and can evaluate their chronological development, identify levels of sustainability by regions, and patterns of behavior between nations. An analysis will also be carried out to integrate the sustainability record of the countries, using the weighted moving average and the weightings obtained for each year via an exponential smoothing. In addition, the sensitivity analysis will allow the strengths and weaknesses of these countries to be known, and guidelines can be produced so that, if they wish to increase their sustainability, they can identify the key factors necessary.
The main contributions of this study are:
- Development of a multi-criteria model for evaluating the SD of EU countries using AHP. This model assesses countries of the EU (and Norway and Iceland), using a total of 39 indicators or subcriteria organized into the following criteria: socioeconomic development, consumption and sustainable production, social inclusion, public health, demographic change, climate change and energy, sustainable transport, global alliance for development, and good policies. This evaluation allows a complete classification of the alternatives (countries) with a single value to be obtained, using the period 2005–2015.
- Although the original premise was to use the greatest possible amount of data with respect to alternatives, subcriteria and the years assessed, the following limits were recognized: scarcity of information, imprecision of valuations, erroneous data, or the need for MCDM techniques to guarantee the independence of the subcriteria (indicators) included in the model. Thus, in order to get an accurate model, which is non-redundant and has as much information as possible, a three-stage filter was designed: visual inspection to identify the periods and countries where there is a greater concentration of data, a filter using the Pearson correlation coefficient to identify redundant indicators, and a final stage in which the final structure is reviewed and the least significant elements discarded.
- The model, unlike most of the literature, weights the indicators, since, despite recognition of the difficulty of obtaining objective weightings, not all the indicators contribute equally to SD. This model uses judgements from four experts in different areas of SD to get weightings for the criteria and subcriteria.
- The model considers the record of each country using a weighted moving average of the valuations of each country, since this technique allows the results of the full chronological evolution to be used, giving greater importance to those that belong to the most recent periods. The weightings used in each period were calculated as the first eleven terms of a smooth first-order exponential, and so the smoothing constant was determined so as to find the weighting for each year.
- The model described can be easily applied to other countries, as long as the necessary data are available.
- The research could be used to find each country’s strengths and weaknesses in the field of SD, and to analyze the strategies and policies produced by the countries at the top of the ranking, in order to use continuous improvement processes to reach similar levels of sustainability.
This paper is structured as follows. Section 2 contains a literature review of contributions in the field of SD assessment in countries. Section 3 describes the analysis and treatment of the data, including the visual filtering, the filtering by Pearson correlation coefficient, and the final filtering of the available data. Section 4 sets out the model for assessing sustainable development in EU countries, including the criteria and subcriteria used, the hierarchy, and the weighting process. Next, Section 5 gives the results, including a description of how the valuations of countries with incomplete data were carried out. Section 6 sets out the sensitivity analysis, and then the Conclusions and References come at the end.
2. Literature Review
There are a number of contributions in the literature that analyze SD, wholly or partly, in different fields, such as, for example, Higher Education Institutes in India [9], the liquefied natural gas industry [10], the concrete industry [11], the construction industry in China [12], the textile industry in Brazil [13], urban sustainability in the Yangtze River Delta [14], etc. There are also authors and organizations around the world who have developed different systems or methodologies for evaluating SD that include its three dimensions. In 2015, the United Nations established the 2030 Agenda for Sustainable Development with 17 Sustainable Development Goals (SDG) which were intended to be considered as policies in all countries [15]. The 17 goals, comprising 169 targets and 244 indicators, have been implemented from 2015 to 2018 [16], becoming an international agreement that allows SDGs and their targets to be transformed into a tool for management and assistance to countries for formulating and implementing strategies that facilitate the distribution of resources and provide a framework for evaluating the evolution of SD [17]. Based on the Human Development Index (HDI) created by the United Nations, which classifies countries by the quality of life of their citizens, the Human Sustainable Development Index (HSDI) designed by Togtokh and Gaffney [18] adds the per capita carbon emissions to gross national income, life expectancy at birth, and years of schooling. An application of HSDI to the Beijing–Tianjin–Hebei urban agglomeration region from 2000 to 2015 is given in Chen et al. [19].
Lim et al. [20], Sachs et al. [21,22,23,24], Clark and Kavanagh [25,26], Fullman et al. [27], Campagnolo et al. [28], and Huan et al. [29] produce different frameworks, with different numbers of indicators, to assess all or a part of the SDGs formulated by the United Nations. It should be pointed out that the European Union (EU) has produced its own indicator set to monitor progress towards the SDG established by the United Nations in 2015. The set comprises 100 indicators, of which six are associated with each Sustainable Development Goal, with the exception of Oceans and Global partnership, which have five indicators [30]. The assessment method analyzes whether an indicator have moved towards or away from a sustainable development objective, as well as the speed of movement; the method, therefore, is a long-term trend analysis [31]. The results of the analysis by indicators for the 28 countries of the EU can be seen in [32]. However, there is no procedure for aggregating the information and obtaining a sustainability value by country and SDG, and an overall value which integrates SDG by country.
The latest sustainability ranking update by countries provided by the investment specialist focused on sustainable investing, RobecoSAM [33] shows that, from November 2018, Sweden is the most sustainable country in terms of investment, followed by Denmark and Switzerland. The dimensions of human, environmental and economic wellbeing are considered in the Sustainable Society Index [34] for the calculation of a country ranking. Public data are used; each of the 21 indicators considered is assigned the same weighting, and the totals are weighted by population size. Among the results of the most recent study, carried out in 2016 [35], is the fact that renewable energy and energy savings are, together with organic farming, the indicators with the highest scores. Nevertheless, from the results of the study of 155 countries, no overall ranking was given based on all the indicators, and so there is no ranking of the countries assessed consisting of a single number.
Yale and Columbia Universities, in collaboration with the World Economic Forum and the Joint Research Centre of the European Commission, developed the Environmental Sustainability Index (ESI), published between 1999 and 2005, and later renamed the Environmental Performance Index (EPI). EPI uses a simple weighted arithmetic mean to aggregate the valuations at each level. Thus, for example, environmental health is weighted at 40%, and the three categories within it, health impacts, air quality, and water and sanitation, are each weighted at 33% [36].
Tsai [37] shows a set of 40 indicators based on the Pressure–State Response (PSR) framework of the United Nations Commission on Sustainable Development; a weighted-sum method has been applied to obtain the score for sustainability, especially focussed on energy sustainability, for a year. Widomski et al. [38] describe the SD assessment of a region in Poland over the period 2004-2013, looking at 21 indicators. The results show that both the region, and the whole of Poland, has increased its development in all the aspects of sustainability analyzed, since its entry into the EU, although it is still below the mean for EU countries. Kroll [39] uses 34 indicators to give a global ranking of countries based on each indicator, and an SDG Index calculated as a mean of the 34 indicators. This SDG Index is used to compare the progress of a country with respect to the five highest-classified countries (Sweden, Norway, Denmark, Finland, and Switzerland), from an assessment of a total of 34 countries.
It can therefore be seen that the number of indicators used, and the indicators themselves, are different in each study or piece of research, depending on many cases on the information available. Although there are many studies aimed at indicators related to 17 SDGs set out by the UN, their number is also variable, and thus it may not be possible to compare the results.
The results obtained also differ, depending on the goal, and on the countries or towns included in the study, but it seems that European countries, and specifically the Nordic countries (Sweden, Norway, Finland, and Denmark) show up more frequently among those classified in the leading positions, together with Switzerland.
In general, indicator frameworks are created, which sometimes include a study of the trends. Park et al. [40] use Economic Input–Output Life-Cycle Assessment and Principal Component Analysis (PCA) to assess the transportation-focused sustainability performance of manufacturing sectors based on eco-efficiency, while Sueyoshi and Yuan [41] use data envelopment analysis (DEA) to measure the efficiency of municipalities. However, the application of multi-criteria techniques is very rare in assessing SD; the only such study is that of Bilbao et al. [42], which uses Technique for Order of Preference by Similarity to Ideal Solution (TOPSIS) to build a model to assess the sustainability of investments in sovereign bonds. The criteria used are: Adjusted Net Saving (ANS), the Ecological Footprint (ECF), the Environmental Performance Index (EPI), and the Human Development Index (HDI) are the criteria used. The model was applied to France, Italy, and the Netherlands. In this case, a unified measurement of the sustainability performance of investments was found, to support the decision-making process of the investor. In the same area of socially responsible investment is Bilbao-Terol et al. [43], which uses goal programming with incomplete information, analyzed with a fuzzy approach, to build an investment portfolio that takes into account financial, social, environmental, and ethical criteria. Shi et al. [44] produce an integrated indicator system over which 36 indicators are distributed. Correlation analysis and discrimination analysis were used to choose the indicators. A back propagation neural network allows the scores of each city in each category to be evaluated. AHP with entropy correction was used to calculate the weights of the categories. This allows an overall score for the regional sustainable development level to be produced for the 17 cities evaluated with a simple weighted multi-attribute system. Shen et al. [45] define four criteria, over which are distributed 63 subcriteria, for effective green supply chain management implementation in mining industries in India. The relative importances of the criteria and subcriteria are assessed with AHP. Frini and Amor [46] use the MUlti-criteria multi-Period Outranking Method (MUPOM) to select the best compromise sustainable forest management alternative, taking into account environmental impacts, economic benefits, and decision-maker preferences. Thus, it is seen that the methods of analysis and applied techniques vary between studies, although in general complex decision-making techniques are not used, and, especially, those include uncertainty of incomplete information analysis. This would improve the reliability of weightings assigned to the criteria, since, in general, the indicators or criteria used are not associated with a specific weighting depending on the group of expert decision makers.
No contributions have therefore been found in the literature analyzing SD in EU countries with objective analytic techniques, such as Multi-Criteria Decision Making (MCDM). This research uses AHP to build an assessment model and, unlike most of the literature, the criteria and subcriteria are weighted using judgements given by four experts in sustainability. Although these weightings might undergo some changes if other experts, or a greater number of experts, were used, the weighting process should be borne in mind as not all criteria and subcriteria make the same contribution to SD. This research also takes into account the SD record of each country, via the moving weighted average, which has not been seen before in the literature. The utility of AHP in real-world problems is widely recognized, and it also provides greater objectivity to the solutions, and so it is specifically applicable to the evaluation of country SD.
3. Analysis and Handling of Data
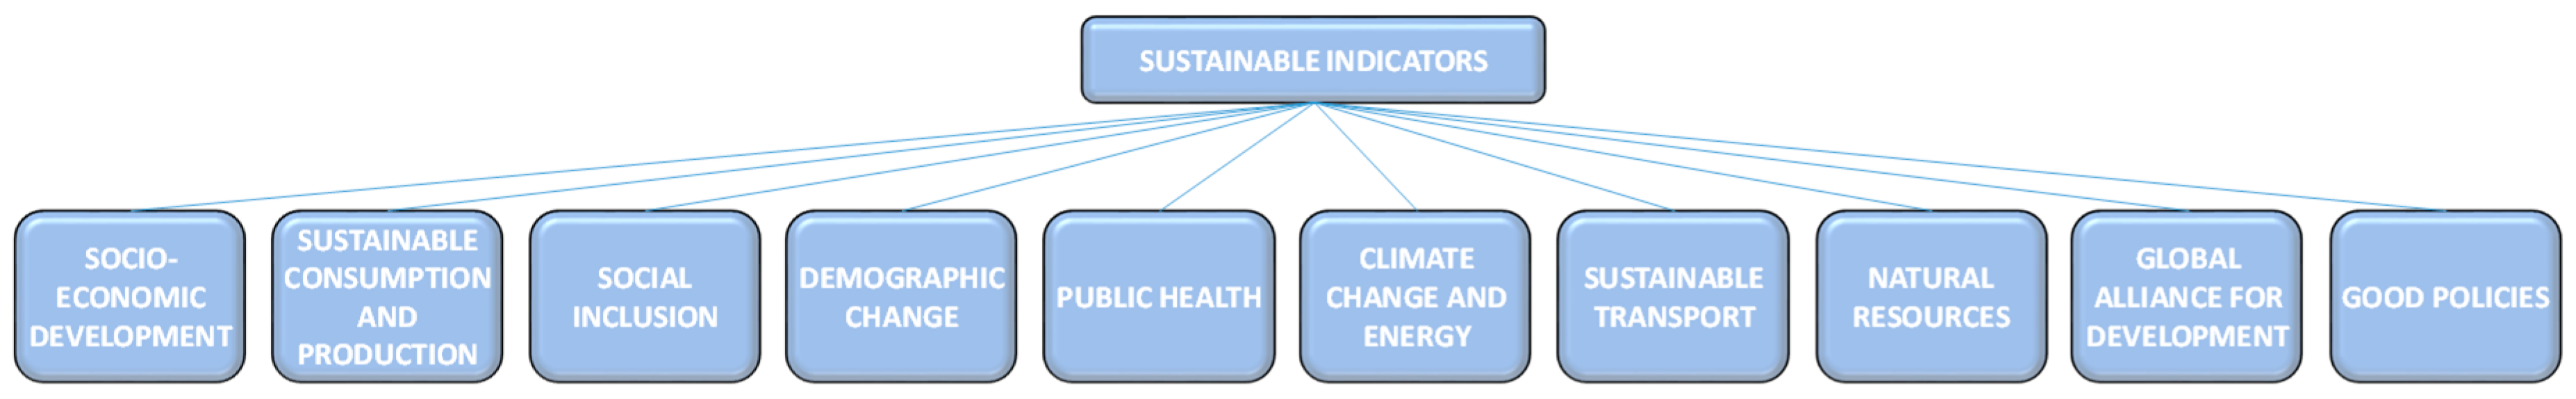
The Eurostat database catalogues sustainability indicators in ten categories (as set out in Figure 1), of which each comprises a number of subcriteria. As the modelling of the problem requires a division by nodes of criteria and subcriteria (where each node has a maximum of nine elements), the Eurostat classification will be used as a basis for structuring the model.
The sustainability indicators set out by Eurostat are as follows:
- Socioeconomic development: the capacity of countries to generate wealth with the aim of maintaining or improving social and economic well-being in the community.
- Sustainable consumption and production: the use of products and services which allow the basic needs of the population to be satisfied, improving their quality of life without compromising the needs of future generations. This is done by efficient use of resources, reduction of toxic emissions, improvement in access to health services, etc.
- Social inclusion: a dynamic and multi-factorial process which guarantees the social integration of all members of a community, ensuring their social well-being. In this way, each citizen will be able to make good use of their individual abilities and benefit from the opportunities to be found in the environment.
- Demographic change: this means transformations in the population make-up of a country, and is determined by studying factors such as aging, birth rates, death rates, and rates of immigration and emigration.
- Public health: elements that determine the population level health of a country (life expectancy, unsatisfied medical needs, etc.). Countries promote public health by promoting healthy lifestyles, funding scientific research, and through education and awareness campaigns.
- Climate change and energy: the study of the factors which contribute to global warming (emission of polluting agents) and analysis of energy production as a function of the existing technology.
- Sustainable transport: actions that help to reduce pollution produced by private vehicles; this is achieved by promoting sustainable mobility, the use of electric and hybrid vehicles, social awareness, etc.
- Natural resources: natural goods and services that have not been altered by humanity, catalogued as flora, fauna, and quality of land. Natural resources are important for the population as they contribute both to well-being and to development (food, raw materials, and minerals).
- Global alliance for development: initiatives for progress and globalization of countries through subsidies, aid, and support in international exchange (imports and exports).
- Good policies: measures taken by governments and public administrations (taxes) for sustainable development in countries.
The initial inspection of the database reveals a total of 161 subcriteria, which are number and codified so that the first three letters identify the higher criterion it belongs to, and the last three are specific to each subcriterion. Table 1 shows the number of subcriteria that each criterion originally contained, with the identifying acronym for each one.
There is also a sweep of the data to identify the countries (alternatives of the model) and the periods (years to be analyzed) for which the Eurostat database has valuations, totaling 35 countries over the period 1990–2016.
Nevertheless, the initial premise of covering as much data as possible with regard to alternatives, subcriteria, and development over time is limited in the following ways: scarcity of information, imprecise valuations, inaccurate data, or the characteristic of multi-variate analysis itself, which specifies that the criteria should be mutually independent. For this reason, to obtain a model that is true, non-redundant, and has the most possible information, it is necessary to apply a three-stage filter. These stages consist of the first stage, visual inspection to identify the periods and countries with the greatest concentration of data, the second, which consists of a filter using the Pearson correlation coefficient to determine the redundant elements, and a final stage which revises the structure and discards the least significant elements.
3.1. Visual Filtering of the Data
The visual inspection allows periods, alternatives, or subcriteria to be detected that have a systematic lack of data. The most common reasons for discarding elements in the visual analysis of the data are:
- Subcriteria: lack of information for most countries and periods.
- Alternatives: difficulty in obtaining measurements, or incomplete information. In some cases, there are alternatives that have sufficient data in certain subcriteria, but in others the information is scarce, and thus is discarded.
- Periods: the starting date for gathering data on the subcriteria is very variable, and some elements are measured only in even or odd years. In addition, in some criteria, the information is not updated to the year 2016.
This leads to a total of 67 subcriteria being identified whose information is insufficient, that is, 41.61% of all the subcriteria from the database. Table 1 summarizes the number of subcriteria discarded as a function of the higher-level criteria, underlining the references to natural resources, the global alliance for development and good policies, as, in all of these, over 70% of the subcriteria were eliminated.
The visual inspection has identified four countries, Albania, Macedonia, Serbia, and Turkey, for which data are missing for most of the subcriteria, and they are therefore discarded, causing a reduction from 35 to 31 alternatives (11.43%). Furthermore, periods can be found in which sustainability can be evaluated, and a range was set from 2005 to 2015 (eleven years), and so this first filter has led to a reduction from 27 periods to 11 (a reduction of 59.26%).
3.2. Filtering with the Pearson Correlation Coefficient
Correlation is a statistical procedure used to determine whether there is a linear relation between the two pairs of elements. It is defined by the Pearson correlation coefficient . To calculate this coefficient (between two sets and ), covariances are calculated and divided by the product of the standard deviation as shown in Equation (1):
In order for the AHP model to be solid and consistent, the subcriteria to be compared must be independent, so that the information is not redundant.
The range of results given by this coefficient is between the values and represents the level of correlation between a pair of elements, showing the level of intensity (as shown in Table 2). Likewise, the correlation intensities are classified as positive when the elements are directly correlated, and negative when they are inversely correlated.
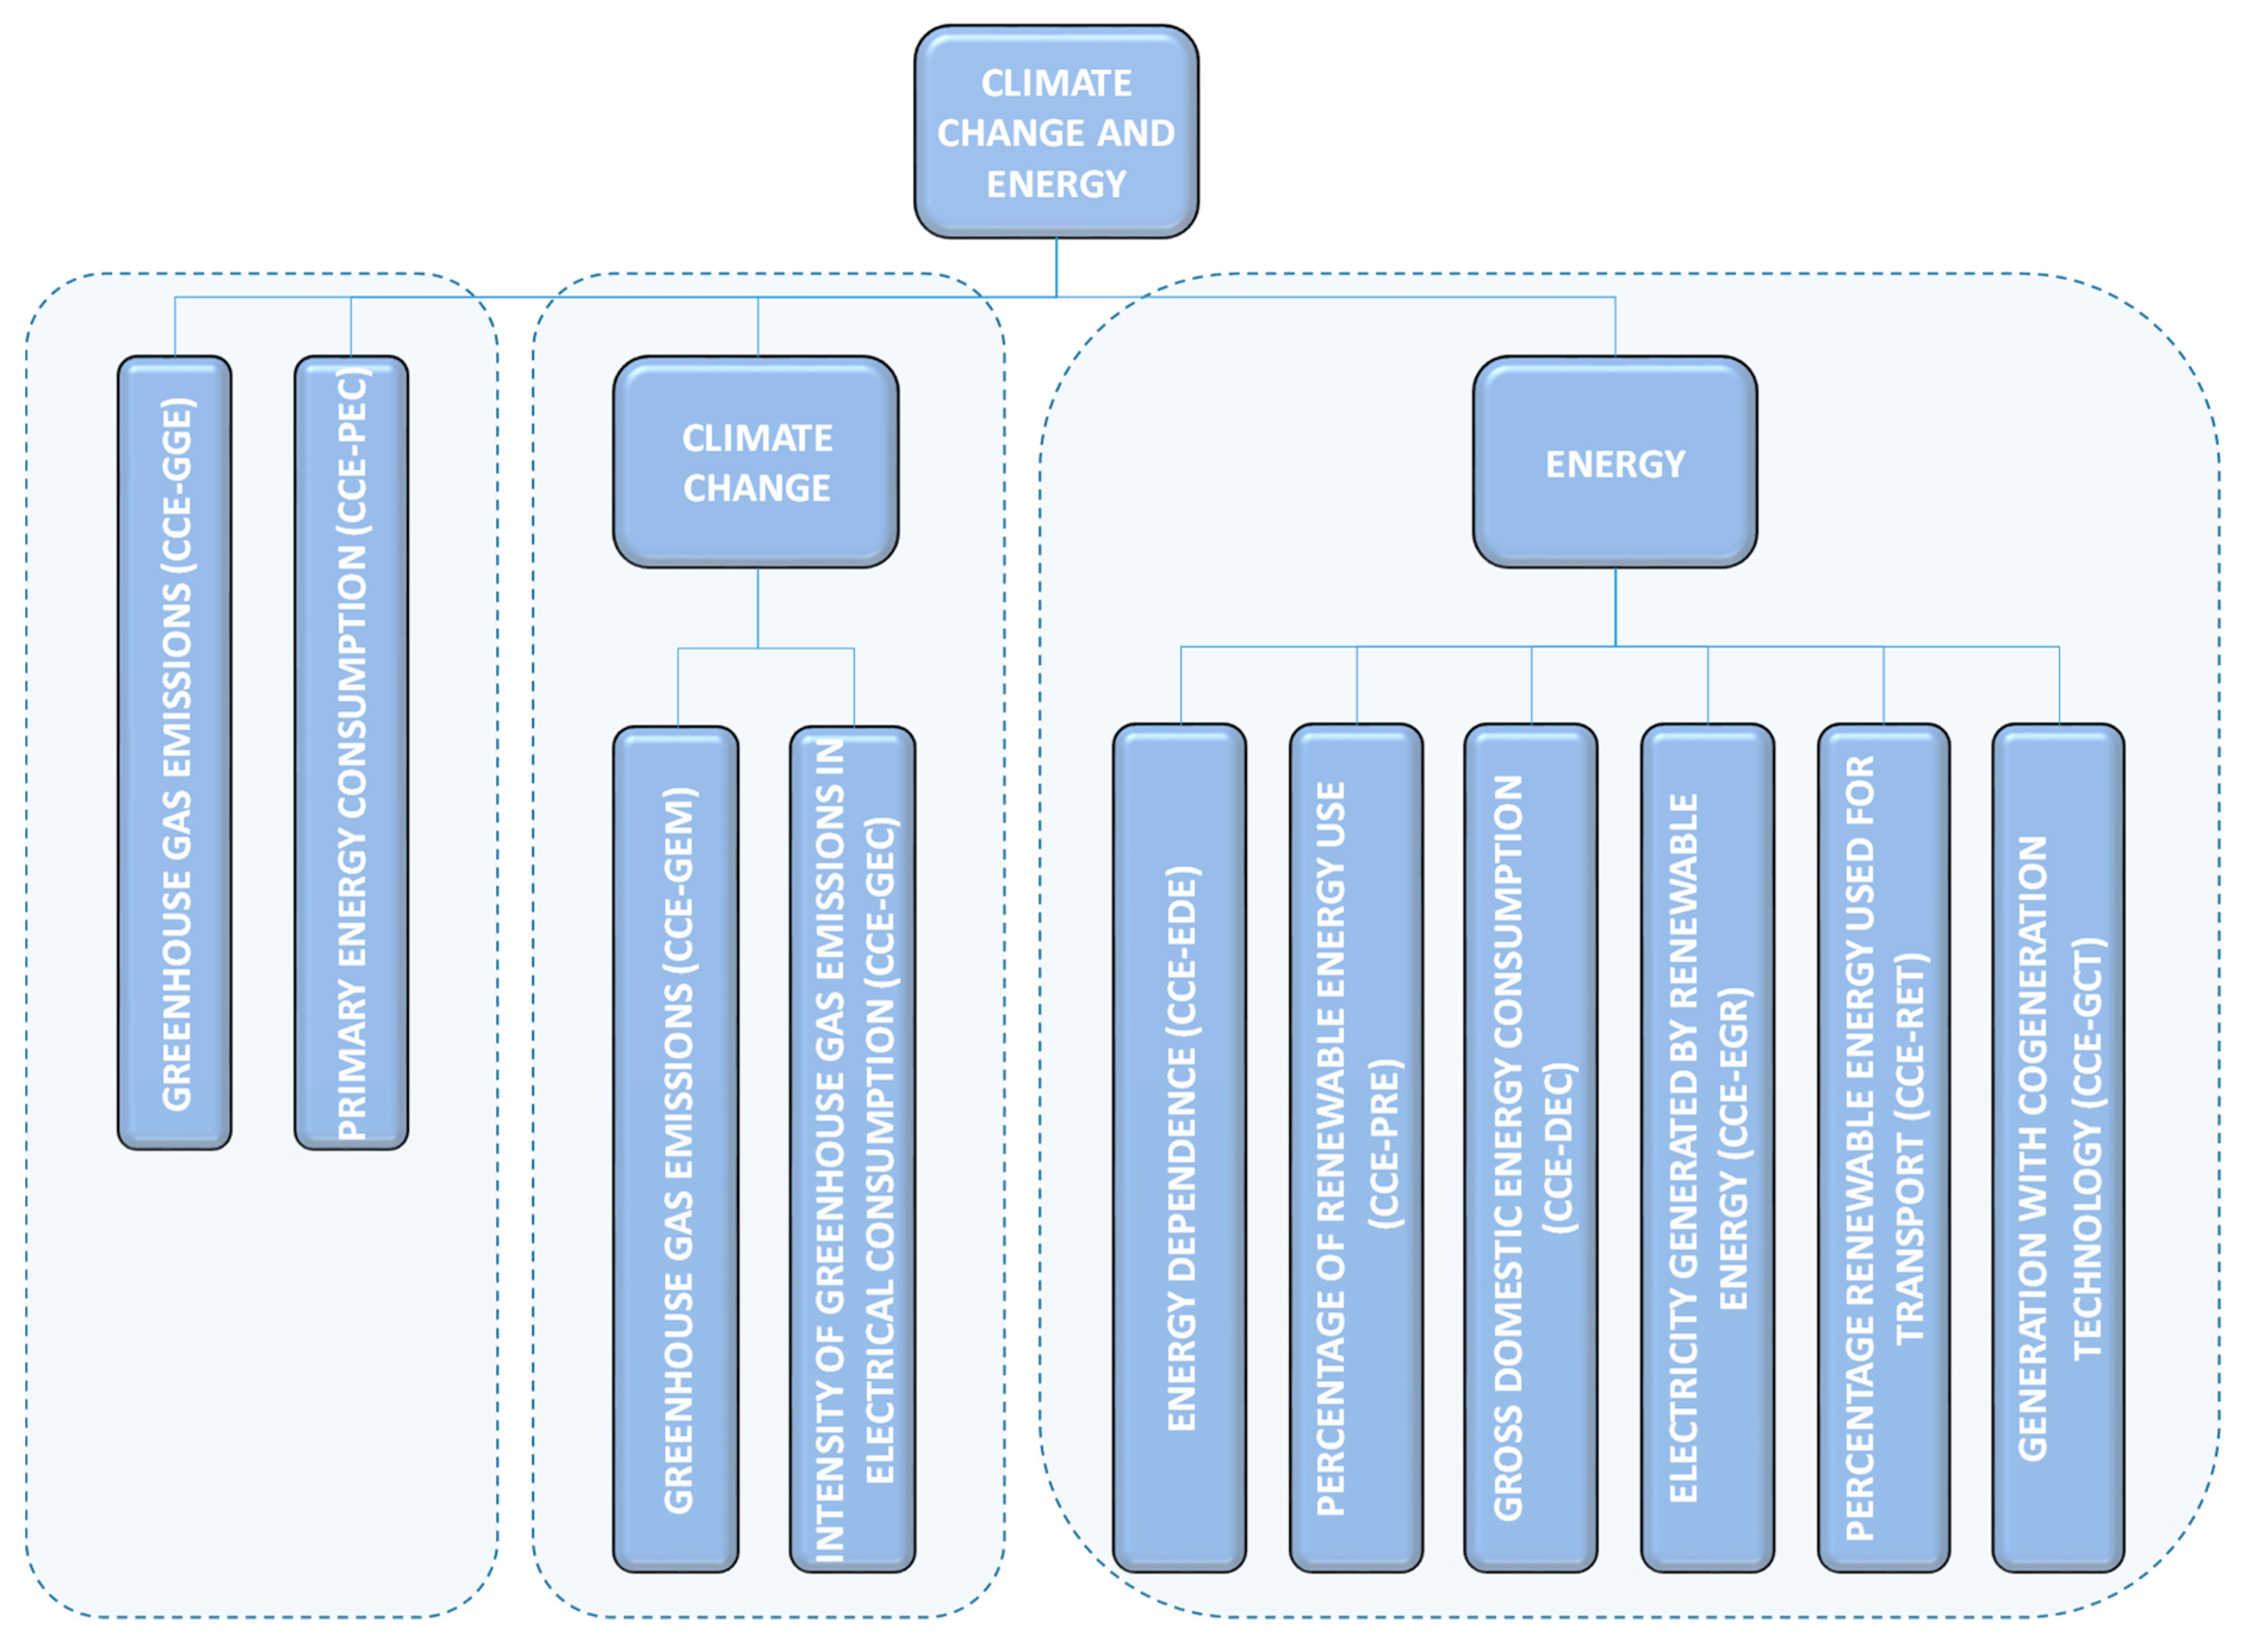
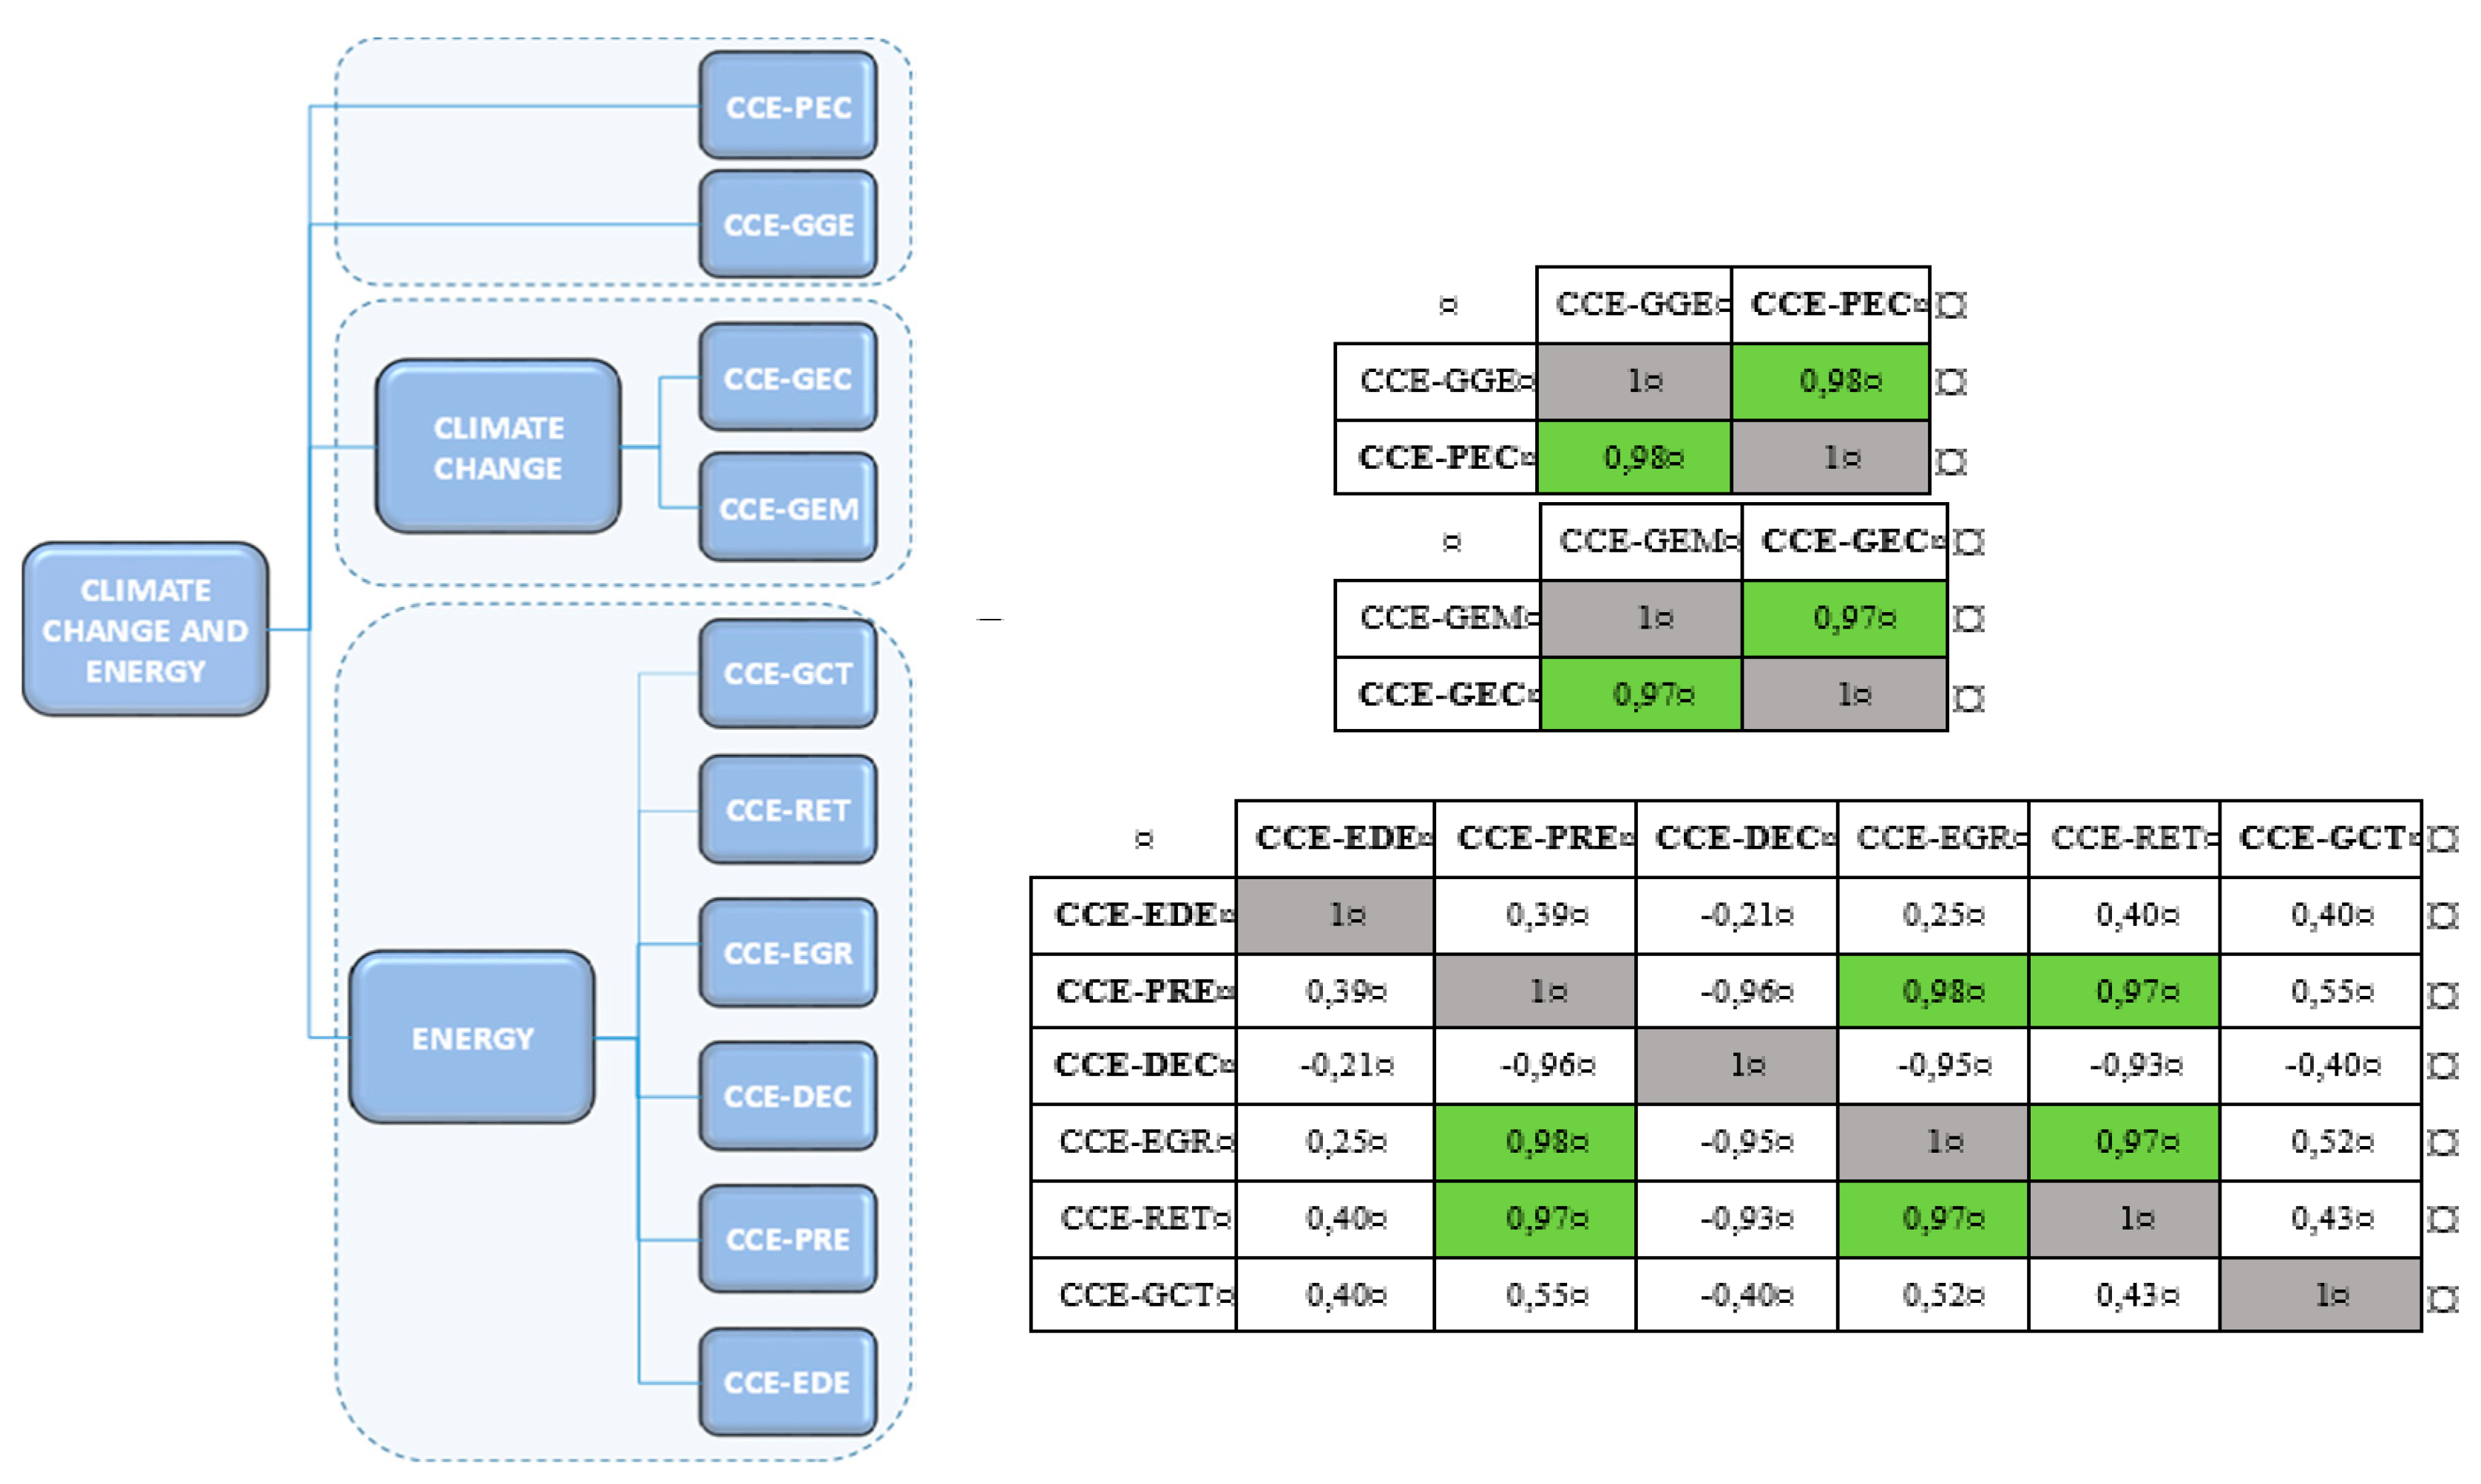
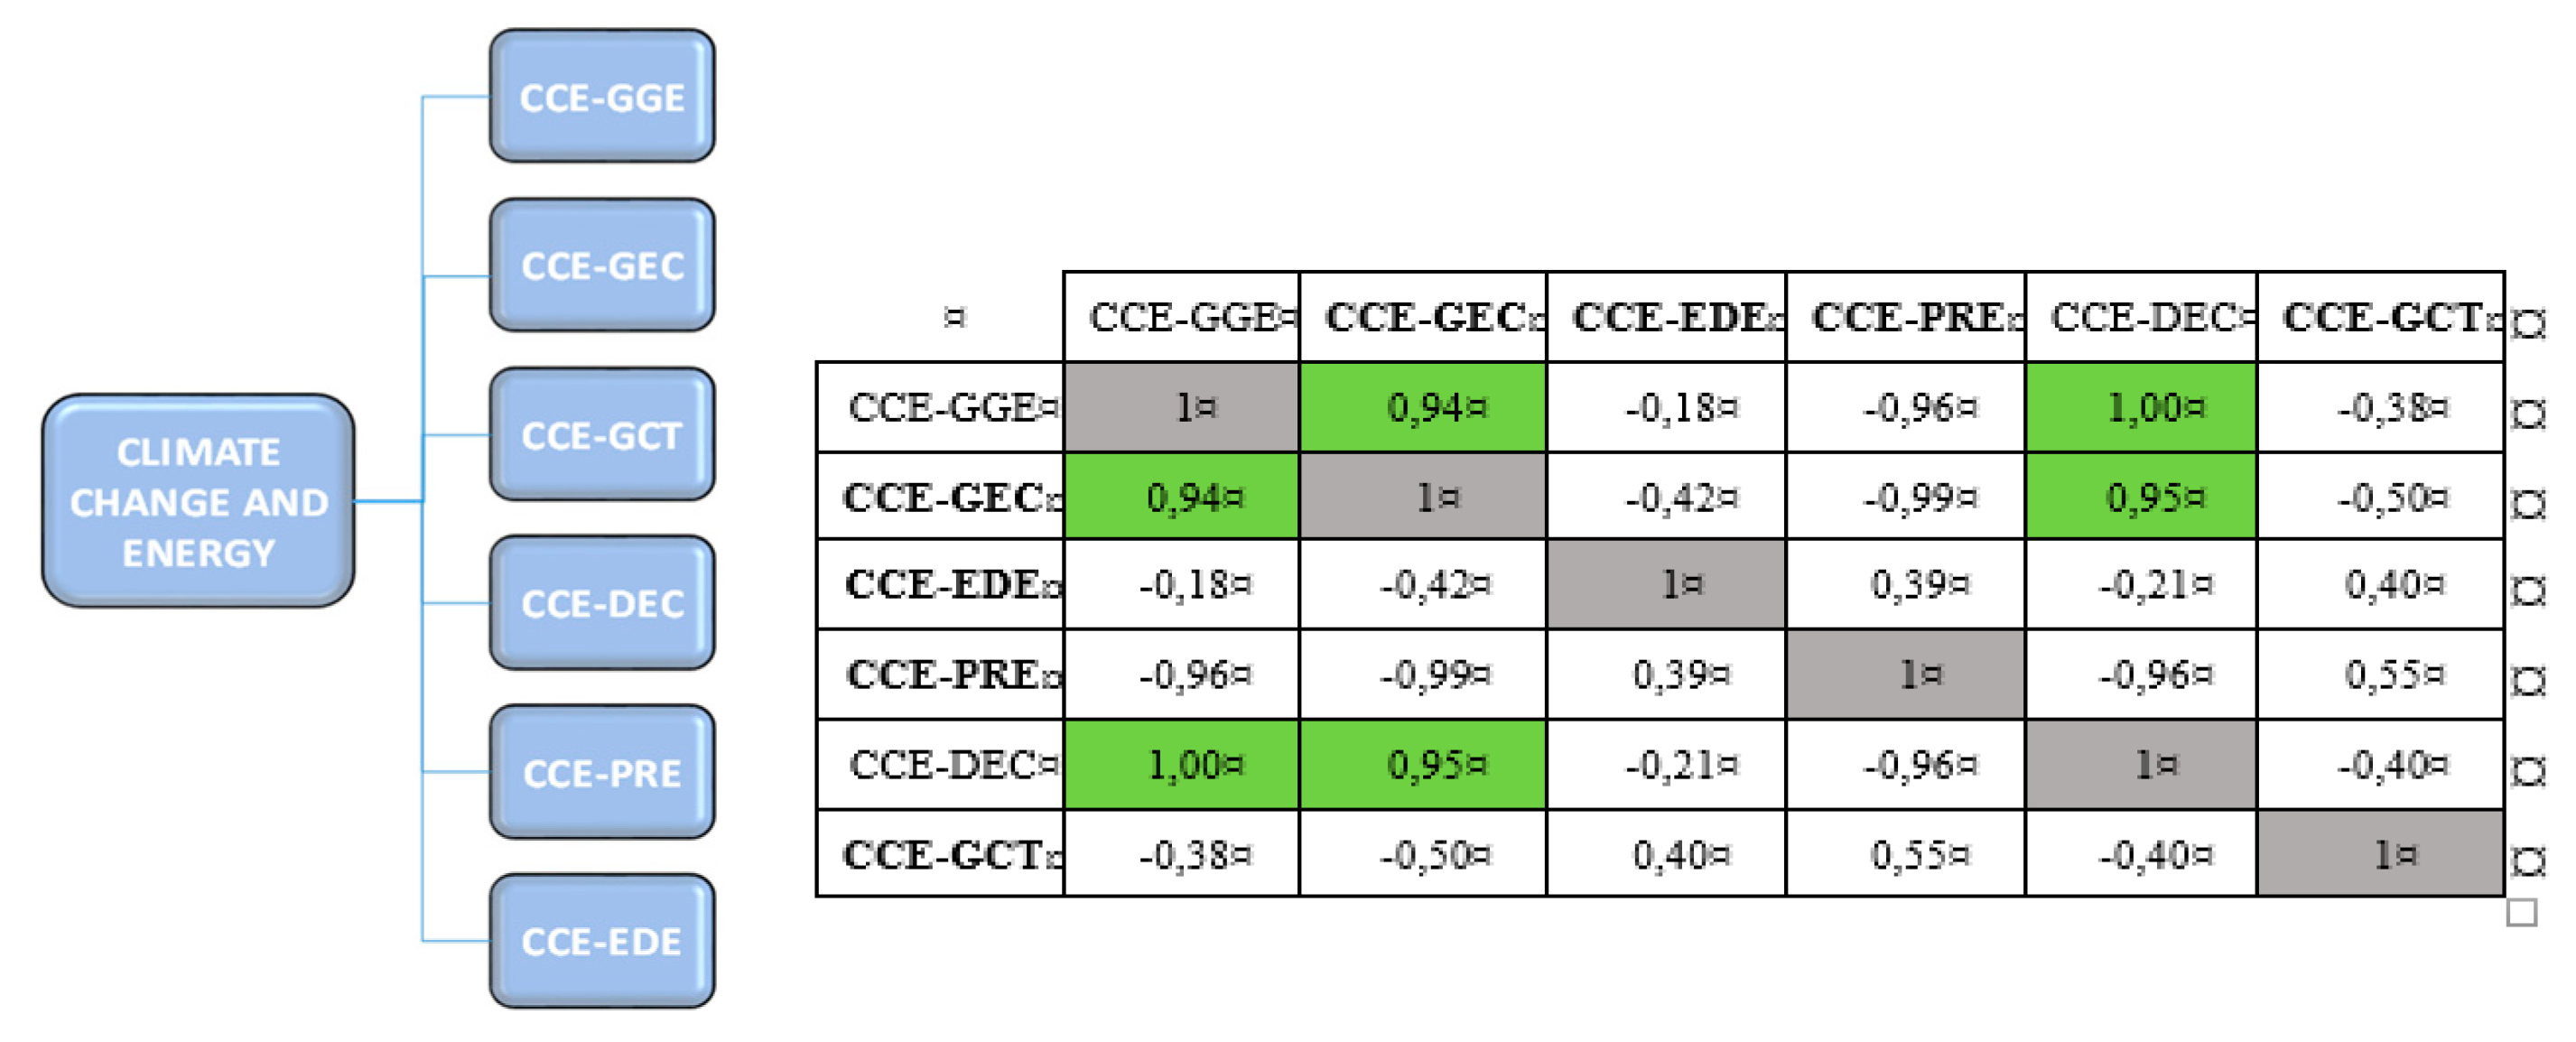
Nevertheless, the fact that the Pearson coefficient finds a linear relation between the subcriteria does not imply a real correlation between them, as they may have different behaviors over time for different reasons. To reduce the importance of this possibility, the analysis of the subcriteria is performed on groups of elements that are conceptually interrelated. Figure 2 shows, as an example, the criterion Climate change and energy (CCE), in which the subcriteria are compared in three groups: climate change, energy, and another which brings together the subcriteria Greenhouse gas emissions, taking as a baseline the year 1990 (CCE-GGE), and Primary energy consumption (CCE-PEC). A similar study is performed for each group of subcriteria, and once the redundant ones are discarded, a second comparison is made between those that remain, in order to find the subcriteria that will ultimately be used in the model.
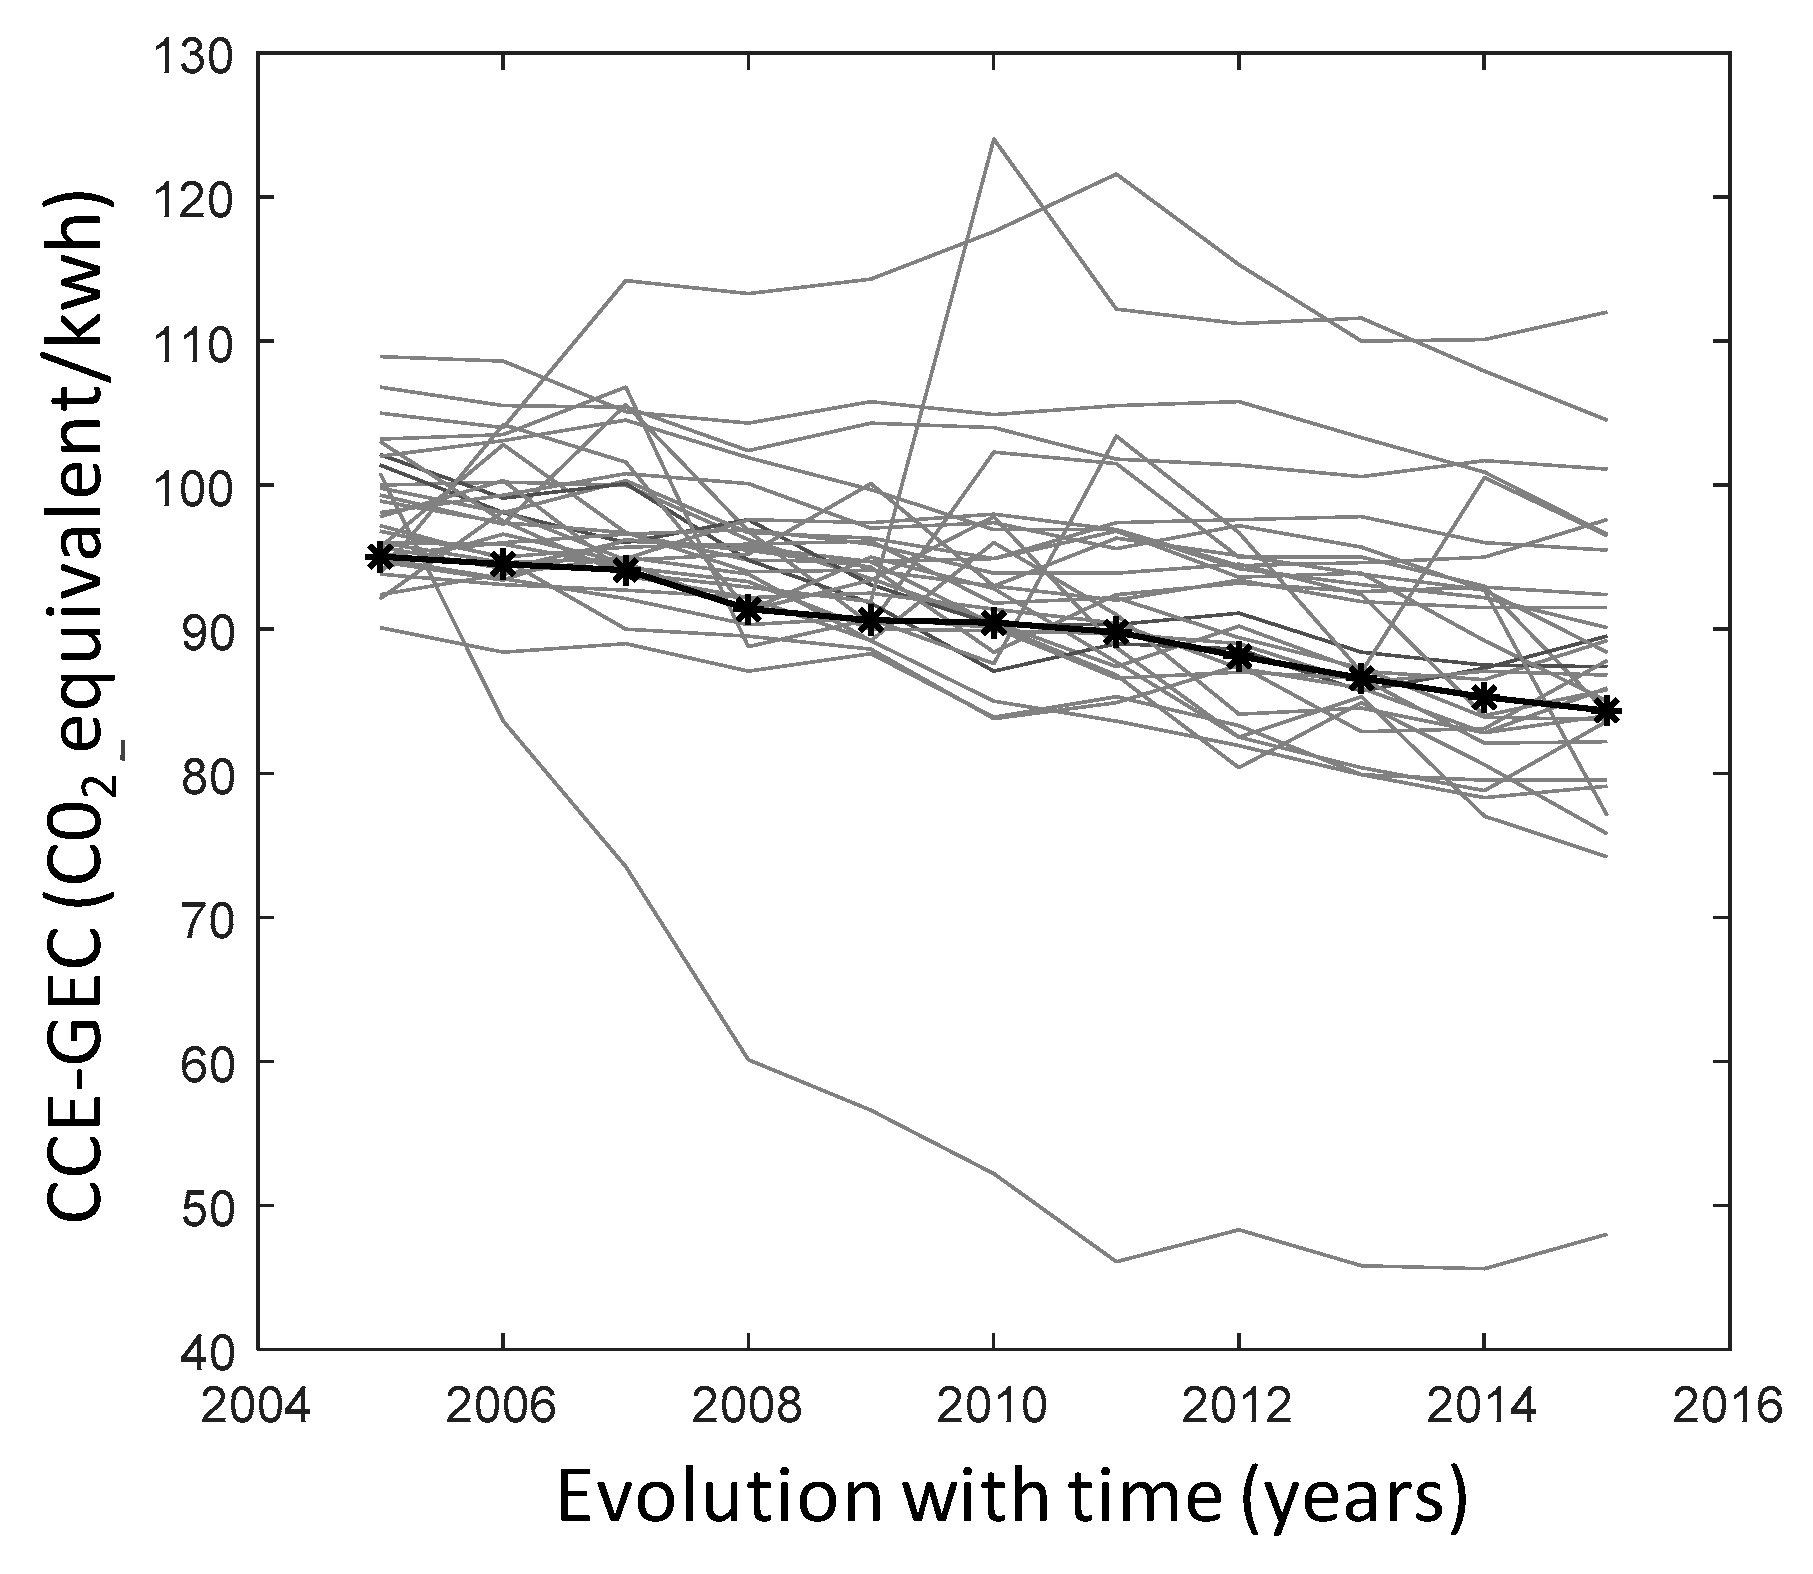
The Pearson correlation requires the prior preparation of the data because, in the data available, each alternative has a valuation per period, and in order to apply this technique, the subcriteria must be described as a single time evolution. This reduction is done by applying the arithmetic mean of all the valuations for each year (it is assumed that all the countries will have similar behavior) which gives a single time evolution for each subcriterion. Figure 3 shows this reduction for the subcriterion intensity of greenhouse gas emissions in electrical consumption (CCE-GEC), where the grey lines correspond to the individual evolution of each country, and the line marked with asterisks shows the arithmetic mean.
The Pearson correlation coefficient compares elements in pairs using, as a starting point, the matrix , where represents the number of periods, and the subcriteria to be confirmed, returning a symmetrical matrix of with the different comparisons. Thus, the results in the comparison matrix allow correlated pairs of subcriteria, and therefore those that should be discarded, to be identified. For a subcriterion to be discarded, it needs to show a strong positive correlation () with at least one other subcriterion, proving that they have a similar time evolution.
The two sweeps that were carried out are shown as an example, firstly by groups of subcriteria, and then comparing all those that pass the first filter, for the criterion Climate change and energy. Initially, the criterion Climate change and energy have ten subcriteria. The results of applying the second filter are shown in Figure 4.
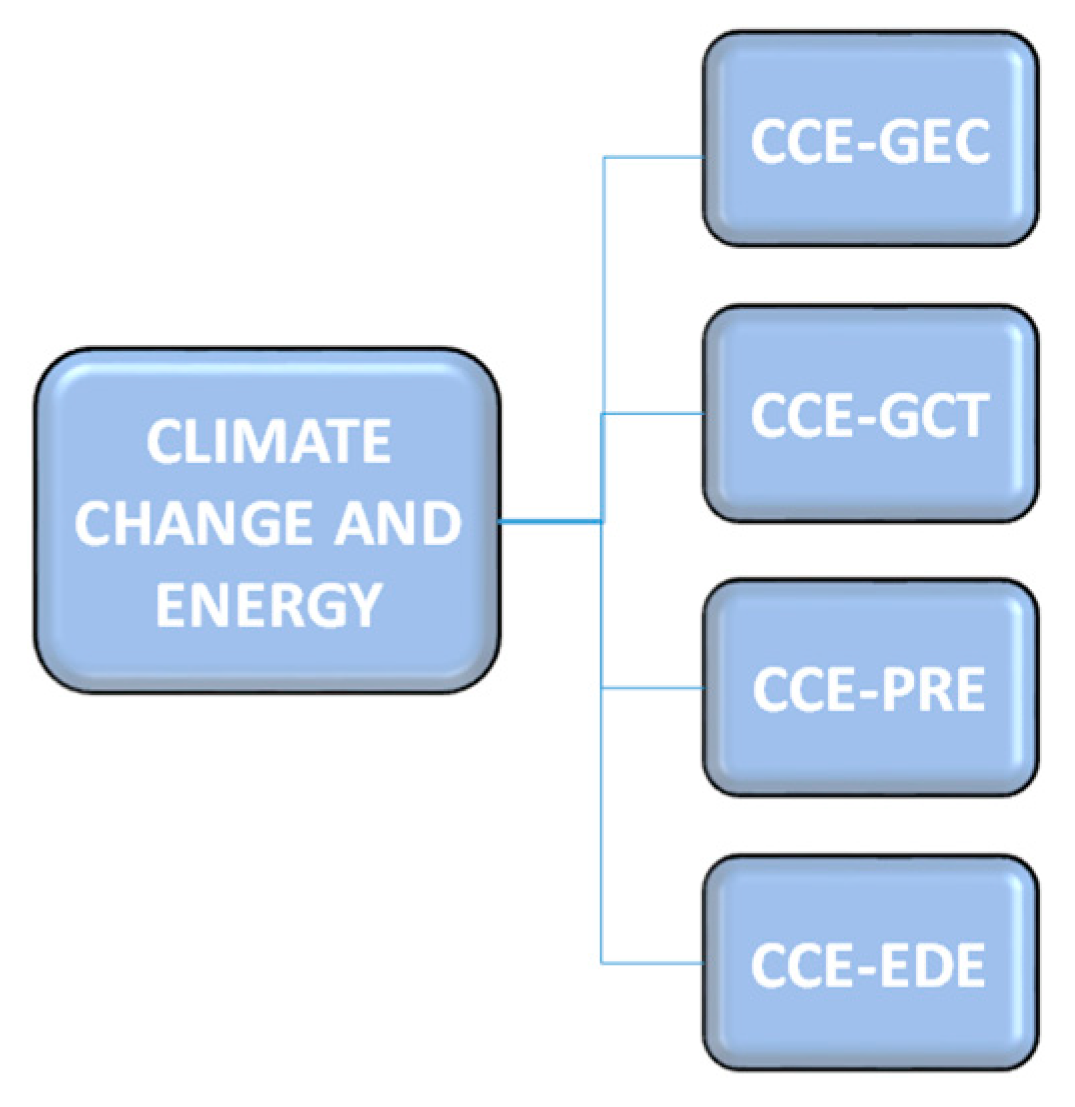
After the second filter, six subcriteria remain. There is then a second filtering, as shown in Figure 5. The final result is that the criterion Climate change and energy is made up of four subcriteria, which is a reduction of 60% with respect to the initial data (see Figure 6). This same process of study was applied to all the criteria. It should be mentioned that, in some cases, there are high correlations between more than two subcriteria, which means that in the filtering, only one of them will be valid, and the rest will be discarded.
Table 3 shows the number of subcriteria left after application of the double filter via the Pearson correlation coefficient, leaving a total of 41 subcriteria. This means that the second reduction leads to a decrease of 56.38% in the subcriteria with respect to those obtained with the first filter. It should be noted that the criteria with the greatest reduction were those that were not reduced during the visual filtering, with decreases ranging from 57.14% to 70%.
3.3. Final Filtering
Finally, an exploration is made of the subcriteria to identify those whose information is insufficiently meaningful as compared to the rest. This is done via an analysis of importance among the 41 subcriteria left after the Pearson filtering, concluding that the two which belong to the criterion Natural resources are not sufficiently relevant and so should be discarded. Thus, the final number of subcriteria to be used in the model is 39, as shown in Table 3.
4. Model for Assessment of Sustainable Development in EU Countries
AHP [47] uses hierarchies to produce a structured model and to interrelate criteria, subcriteria, alternatives, and the goal. AHP is based on four fundamental axioms from graph theory, which provides a solid mathematical grounding [48].
AHP has the following advantages: it has a solid mathematical base, it analyzes the problem in parts, it allows the joint interaction of qualitative and quantitative criteria, using a common scale, it is possible to have a number of decision centers or one decision group, it allows the logical consistency of the judgements given by the decision centers to be checked, it is possible to perform a sensitivity analysis, and it is easy to implement and allows additional mathematical optimization methods to be applied [49].
According to Saaty [47], the method has three basic stages: modelling the problem, valuing the elements, and prioritizing and synthesis. Nevertheless, to guarantee robustness of the models, a sensitivity analysis must be added, to analyze the answers with respect to different scenarios by modifying the model parameters.
AHP is widely used in the literature, and so is well known; it is therefore recommended to read [47,50,51] for a detailed description of the methodology. This paper sets out the detailed application of the model. However, it should be remarked that the priorities were calculated using the right main eigenvector method [47], instead of the method of geometric mean by rows [52] or goal programming [53].
Table 4 shows a brief description of each subcriterion which will be used in the hierarchical model. In addition, as the application of multi-criteria models requires that all valuations are on the same scale (0–10), it is necessary to establish a conversion factor to be applied to each criterion, depending on whether the relation is direct or inverse with respect to the goal of the model.
An inspection of the subcriteria is then carried out to identify those with incomplete information in any of the alternatives. This occurs a total of 27 times and therefore the number of measurements with no valuation is 2.31% of the total.
Once the exploration is complete, the conclusion is that no subcriterion should be discarded for this reason. Nevertheless, although the amount of missing information is not a large proportion of the total, it is interesting to perform the same inspection the other way around; that is, adding up the complete lack of data by country. Table 5 shows that Switzerland stands out above the other alternatives as, with 13 occurrences, it represents 48.4% of the occasions on which a country has no data for a particular subcriterion. Therefore, it was decided that there was insufficient information and so it was not included in the model. On the other hand, it is felt that the lack of data in the other alternatives can be handled, and thus they are not discarded, and the information gap is only 1.12% of the total.
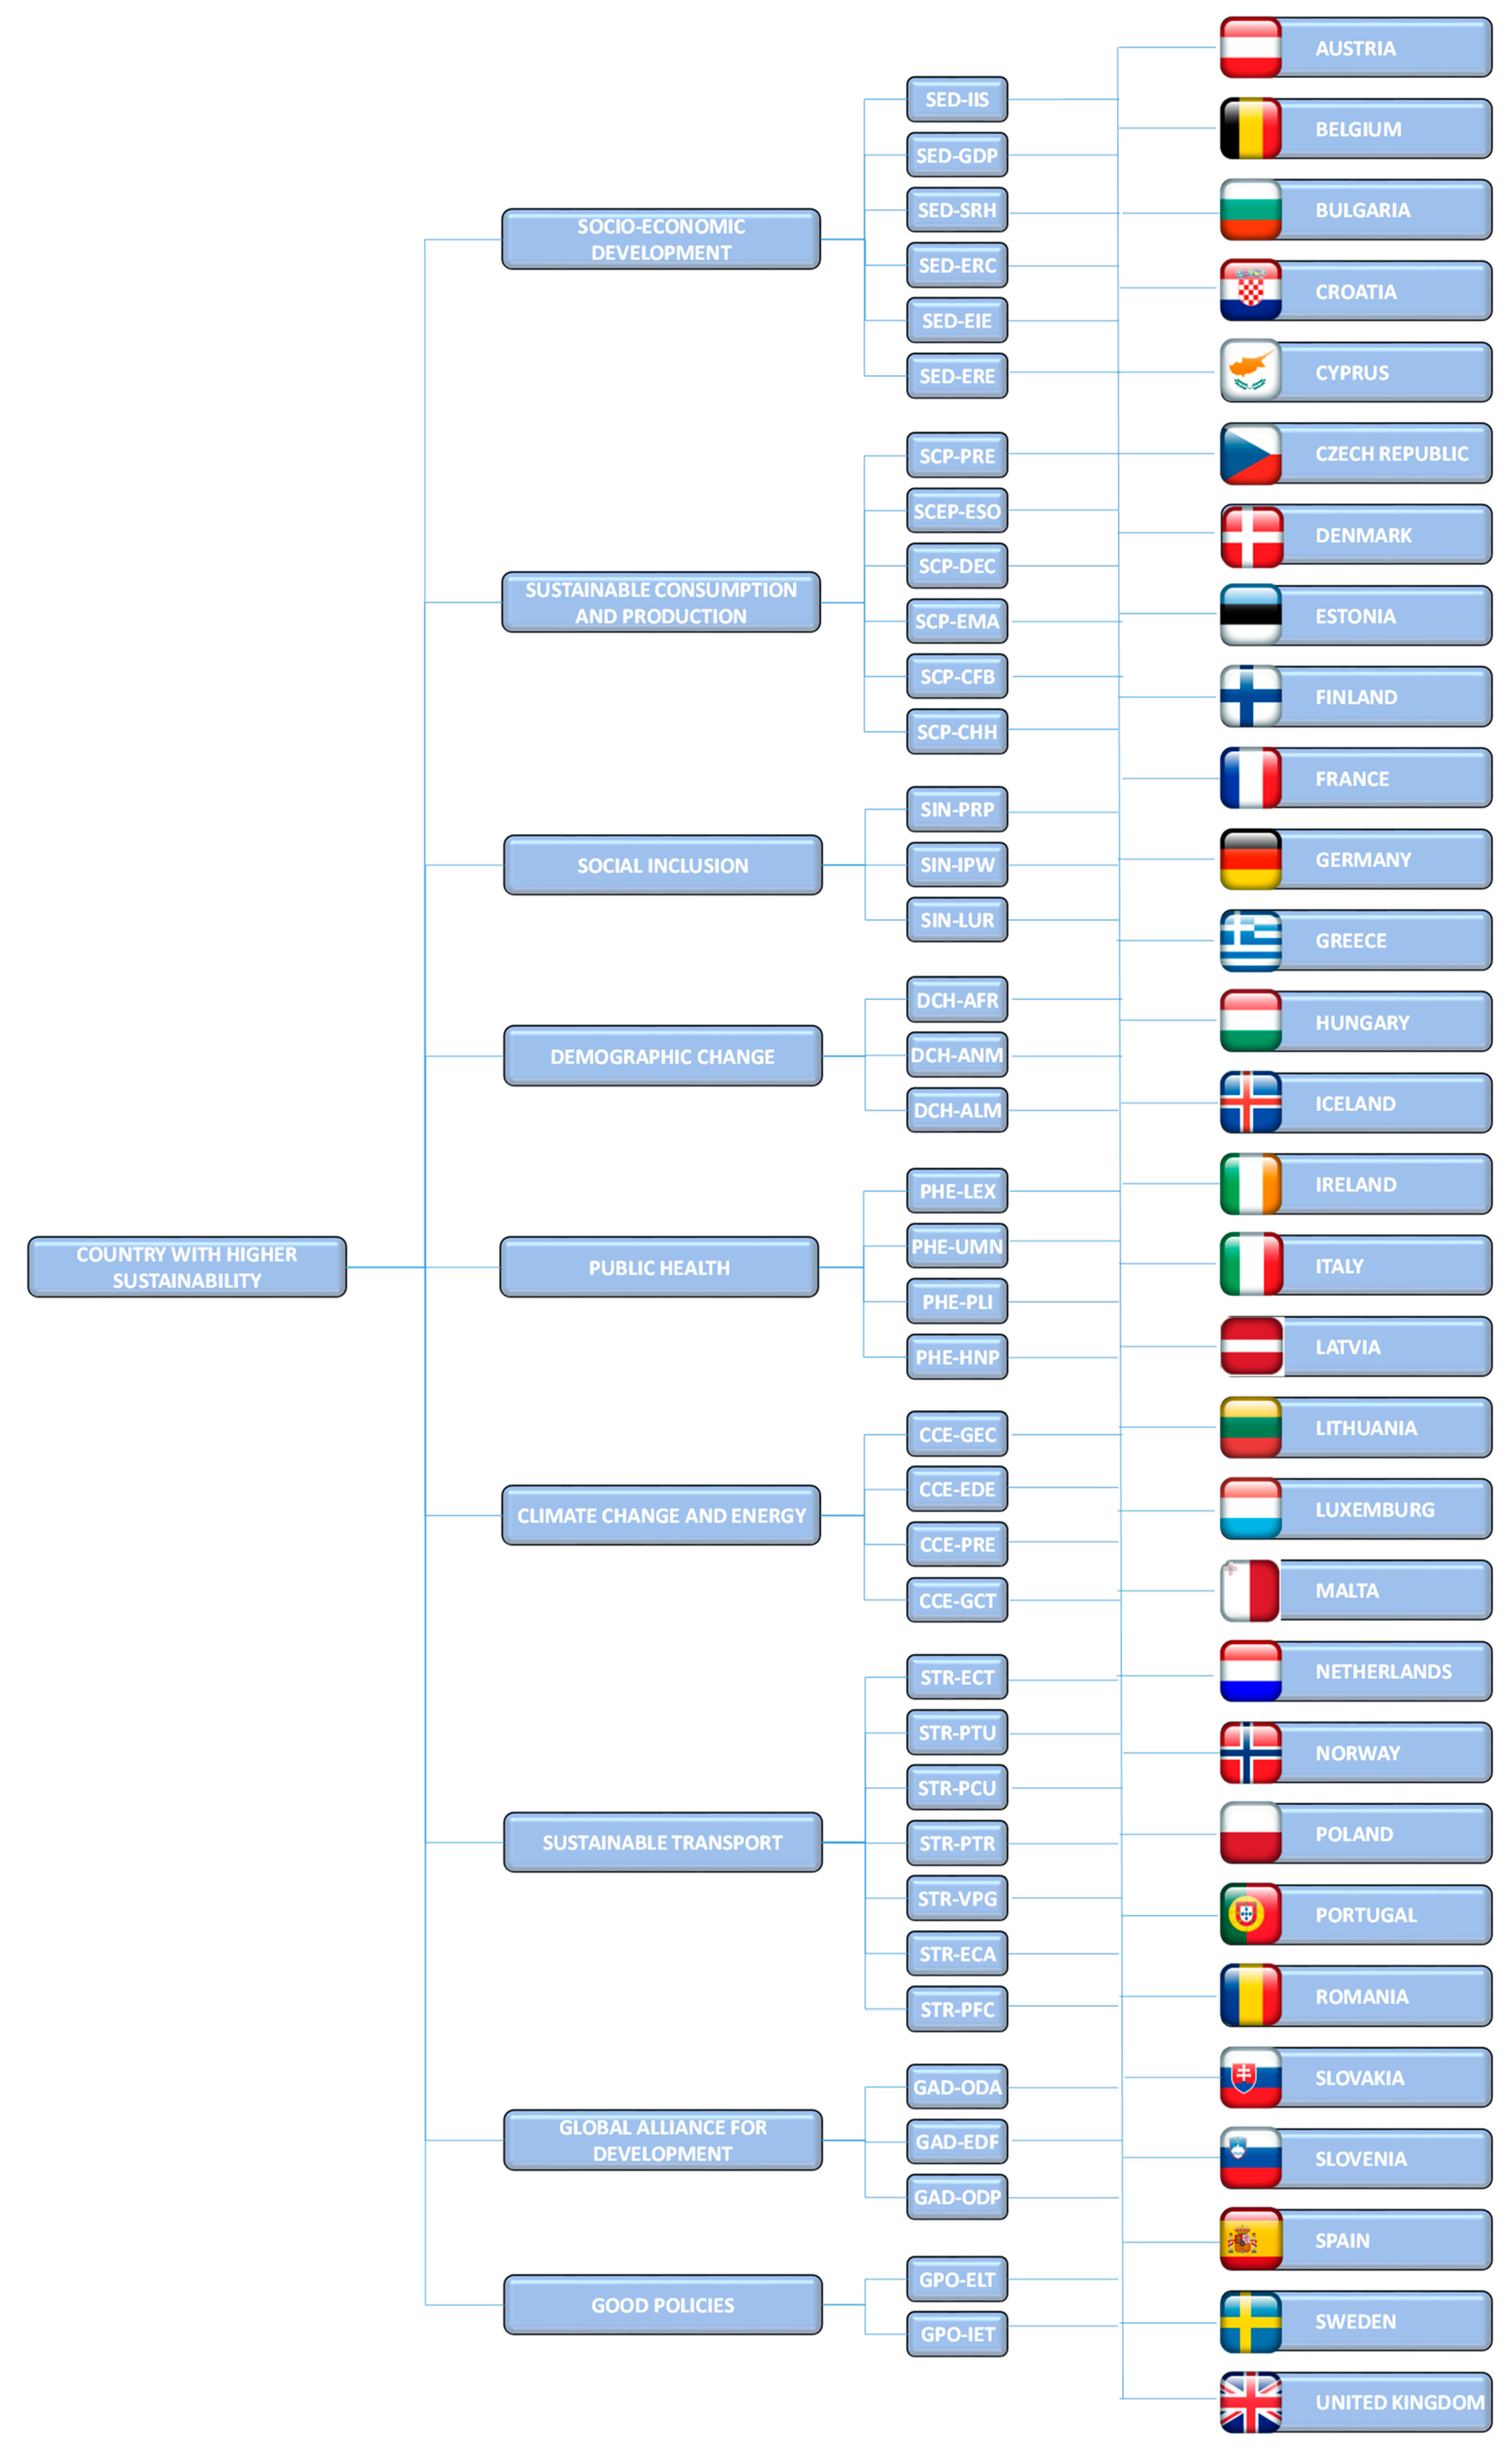
Finally, the resulting hierarchical model comprises 30 alternatives to be compared by valuation of a total of 39 subcriteria, as shown in Figure 7. This model must be evaluated eleven times (once per period), to establish the evolution over time of sustainability in each country.
Weighting Process
The first step is to produce a questionnaire, easily filled out, to evaluate simply the relative importance of the criteria and subcriteria of the model. Each expert should provide judgements to fill out a total of ten comparison matrices (one for the criteria and nine for the groups of subcriteria).
The second stage uses the judgements of experts to establish the relative importance of each criterion with respect to the final goal. This is done by sending out the questionnaire to four specialists in sustainability from different fields, who set out the priorities by filling out the comparison matrices they contain. Once the analyst has received the surveys completed by the experts, expert judgement aggregation strategy is applied using geometric means. In this way, a measurement is obtained that, as well as including the judgements of all the experts, is not compromised by the axiom reciprocal judgements () as otherwise this equality could not be satisfied.
Subsequently, the aggregated pairwise comparison judgement matrices are solved, in order to calculate the relative weightings of the criteria and subcriteria, using the main eigenvector method. Table 6 shows the aggregated pairwise judgement matrix for the criteria and the resulting weightings.
This process is carried out for all the groups of subcriteria, and Table 7, Table 8, Table 9, Table 10, Table 11, Table 12, Table 13, Table 14 and Table 15 show the comparison matrices after applying the geometric mean with the respective relative weightings (right), and the obtained, where it can be seen that is well below the limit for inconsistency.
Finally, multiplying the weightings of the criteria by the individual weightings of each subcriterion gives the relative weight of these with respect to the final goal, and these valuations are shown in Table 16.
5. Results
5.1. Valuations of Countries with Incomplete Information
Each subcriterion requires 330 valuations and, as previously mentioned, there are cases in which the database has no measurements for one or more of them. Thus, with the aim of mitigating this, the missing valuations must be identified, and estimates made for them.
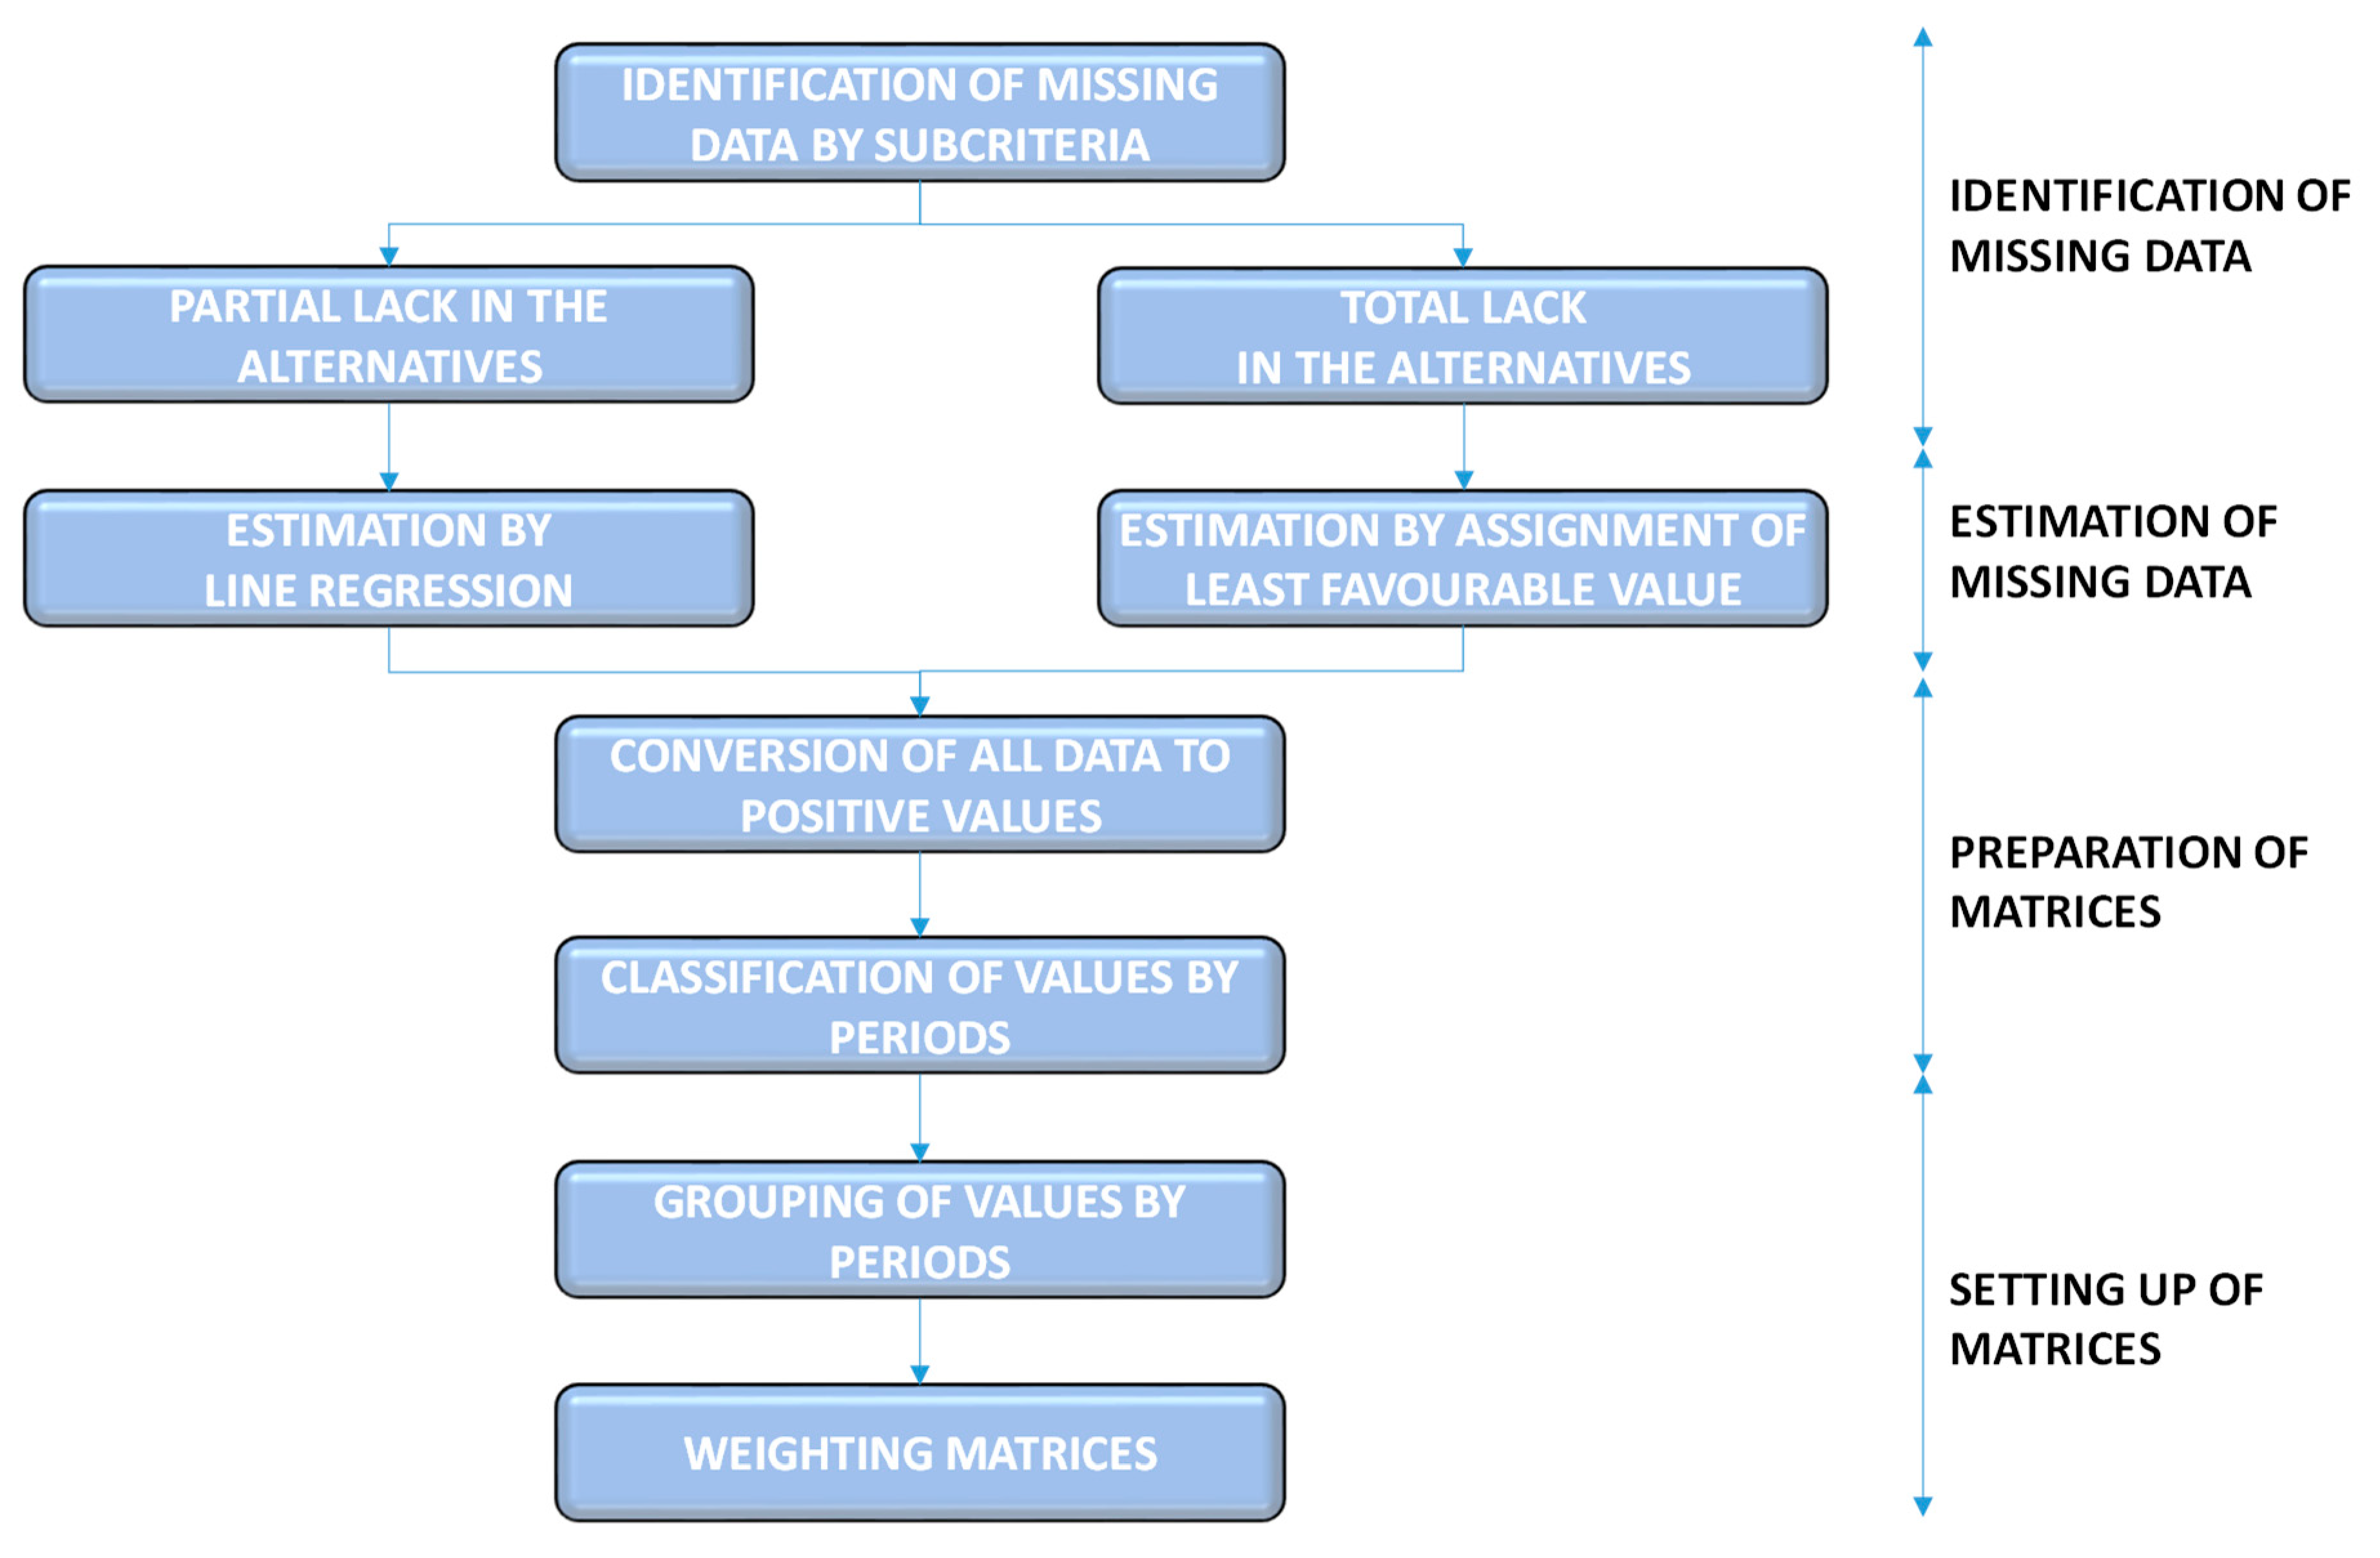
The missing values are identified by an individual analysis of the subcriteria, and the lack of information is classified by whether the lack of data is partial or total in the affected alternatives. This distinction is made because the methodology used to obtain the estimates is different in each case (see Figure 8).
A sweep of the subcriteria was first performed, to determine which have partially incomplete values in the alternatives, and the missing data were counted for each subcriterion.
Eighteen of the 39 subcriteria are affected by partial absence of data, where Number of companies respectful of the environment (SCP-CER) has the greatest lack of information (9.09%). Therefore, although the partial absence of valuations exists in almost half the subcriteria, the number of missing data points is a fairly small percentage of the total. In addition, given that the alternatives have valuations for other periods, it is possible to do estimates for the unvalued years by using a least squares approximation.
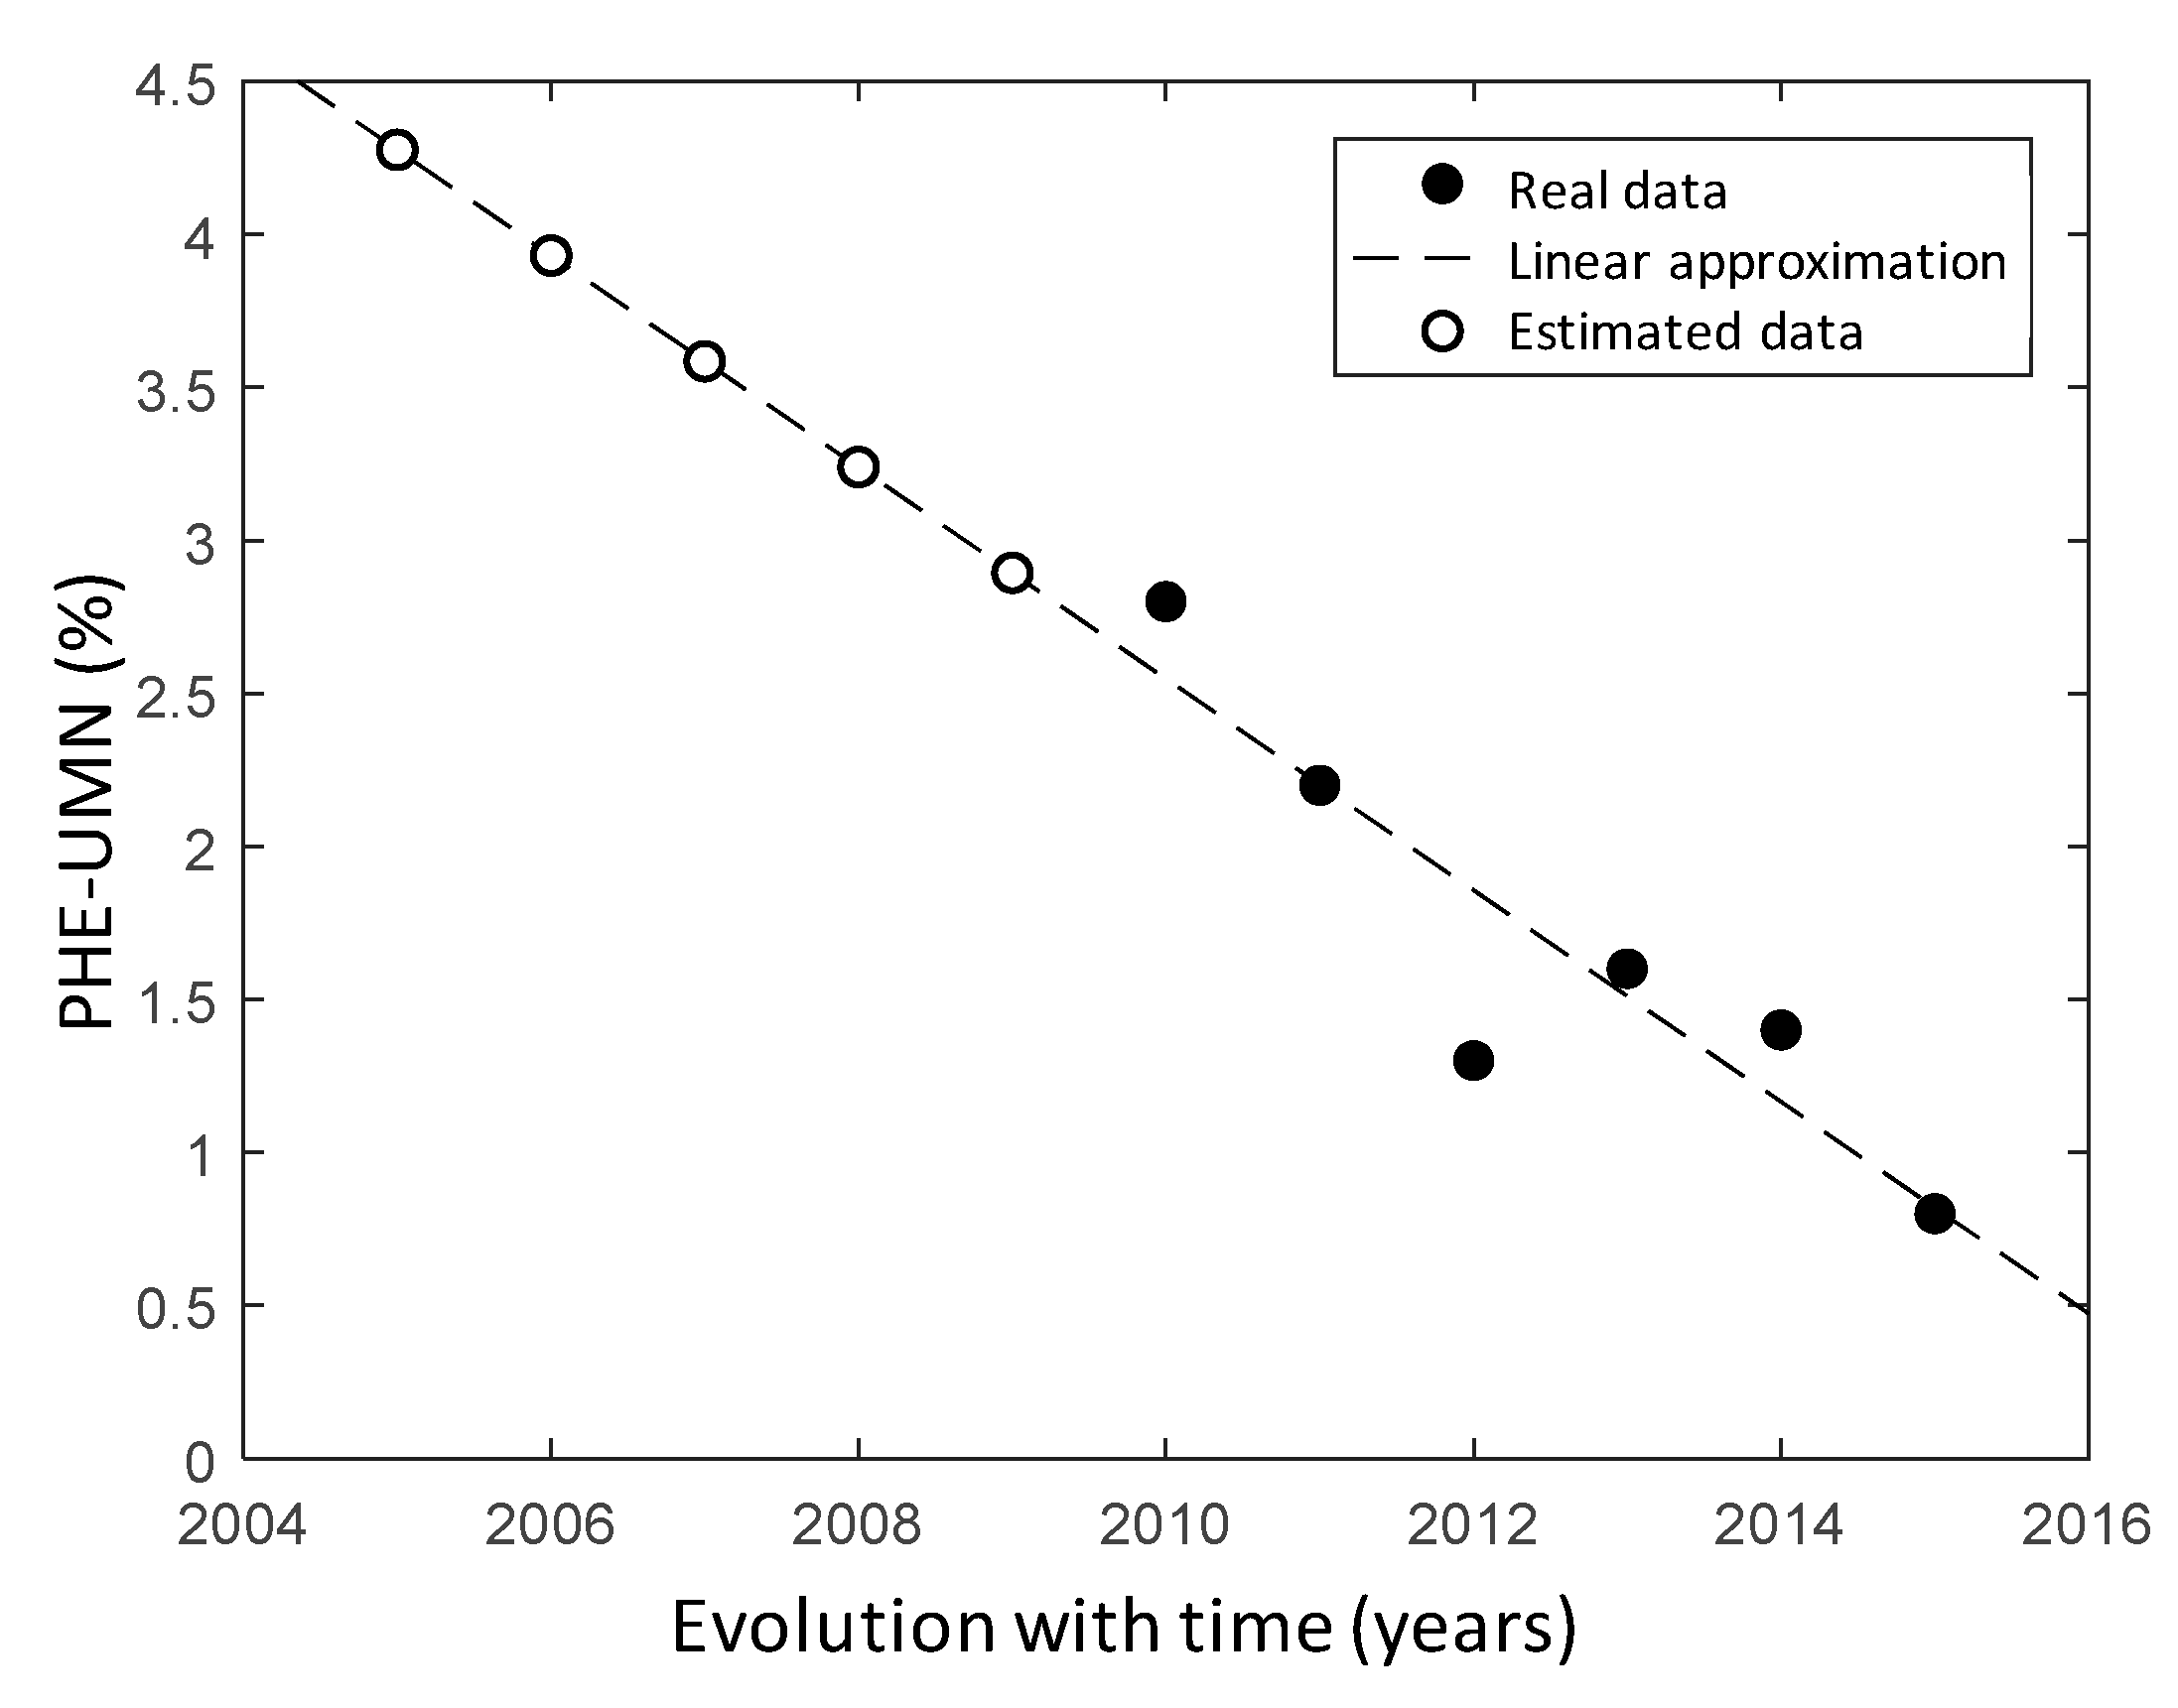
As an example, Figure 9 shows the least squares approximation for the alternative Croatia in the subcriterion Unmet medical needs (PHE-NMI). It can be seen that the database only contains information for six periods (from 2010 to 2015), and so the values for the years 2005–2009 must be estimated. The black dots in the figure represent real data, and so applying a linear adjustment gives the regression line best adapted to them (discontinuous line). The affected periods are then substituted into the regression line, obtaining estimates for the data on evolution over time of the alternative (shown in Figure 9 with white dots).
However, there is a case where the alternative has a single valuation for its evolution over time. This is the case of Iceland for the subcriterion Generation with cogeneration technology (CCE-GTC), and so it was decided to use the same value in all the periods to be assessed.
The second step consists of estimating the valuations of the subcriteria when there is no information about them for some alternative. Given that the affected alternatives have no reference, the estimates are made by assigning the least favorable value corresponding to the other alternatives in the same period. This is because it is held that the lack of data is as bad as the worst valuation of the other countries in this subcriterion. The lack of information suggests that the item is not controlled, which means that improvement strategies cannot be implemented.
The last step in assessing the countries in the subcriteria is to identify and modify those subcriteria that return negative values, since the transformation of scales requires all the values to be positive.
Then, the subcriteria are found that have returned a negative value, and they are classified depending on whether this does or does not make sense. This is because, in some cases, the estimates obtained by the regression line give negative values (when the real measurements are close to zero) causing inconsistencies with regard to the characteristics of some subcriteria. Table 17 shows that those subcriteria have negative values, and justifies their congruence.
Table 17 shows that three subcriteria have values that are not congruent with their definition (SCP-EMA, PHE-UMN and GAD-ODA), and so it was decided to change these values to zero. Furthermore, a transformation was applied to the remaining subcriteria (SED-SRH, DCH-ANM, CCE-EDE, and GAD-EDF) consisting of adding to all the alternatives of the same period the absolute value of the most negative value. In this way, all the assessments of the period will be positive, and any that had a negative value will be valued at zero.
5.2. Results
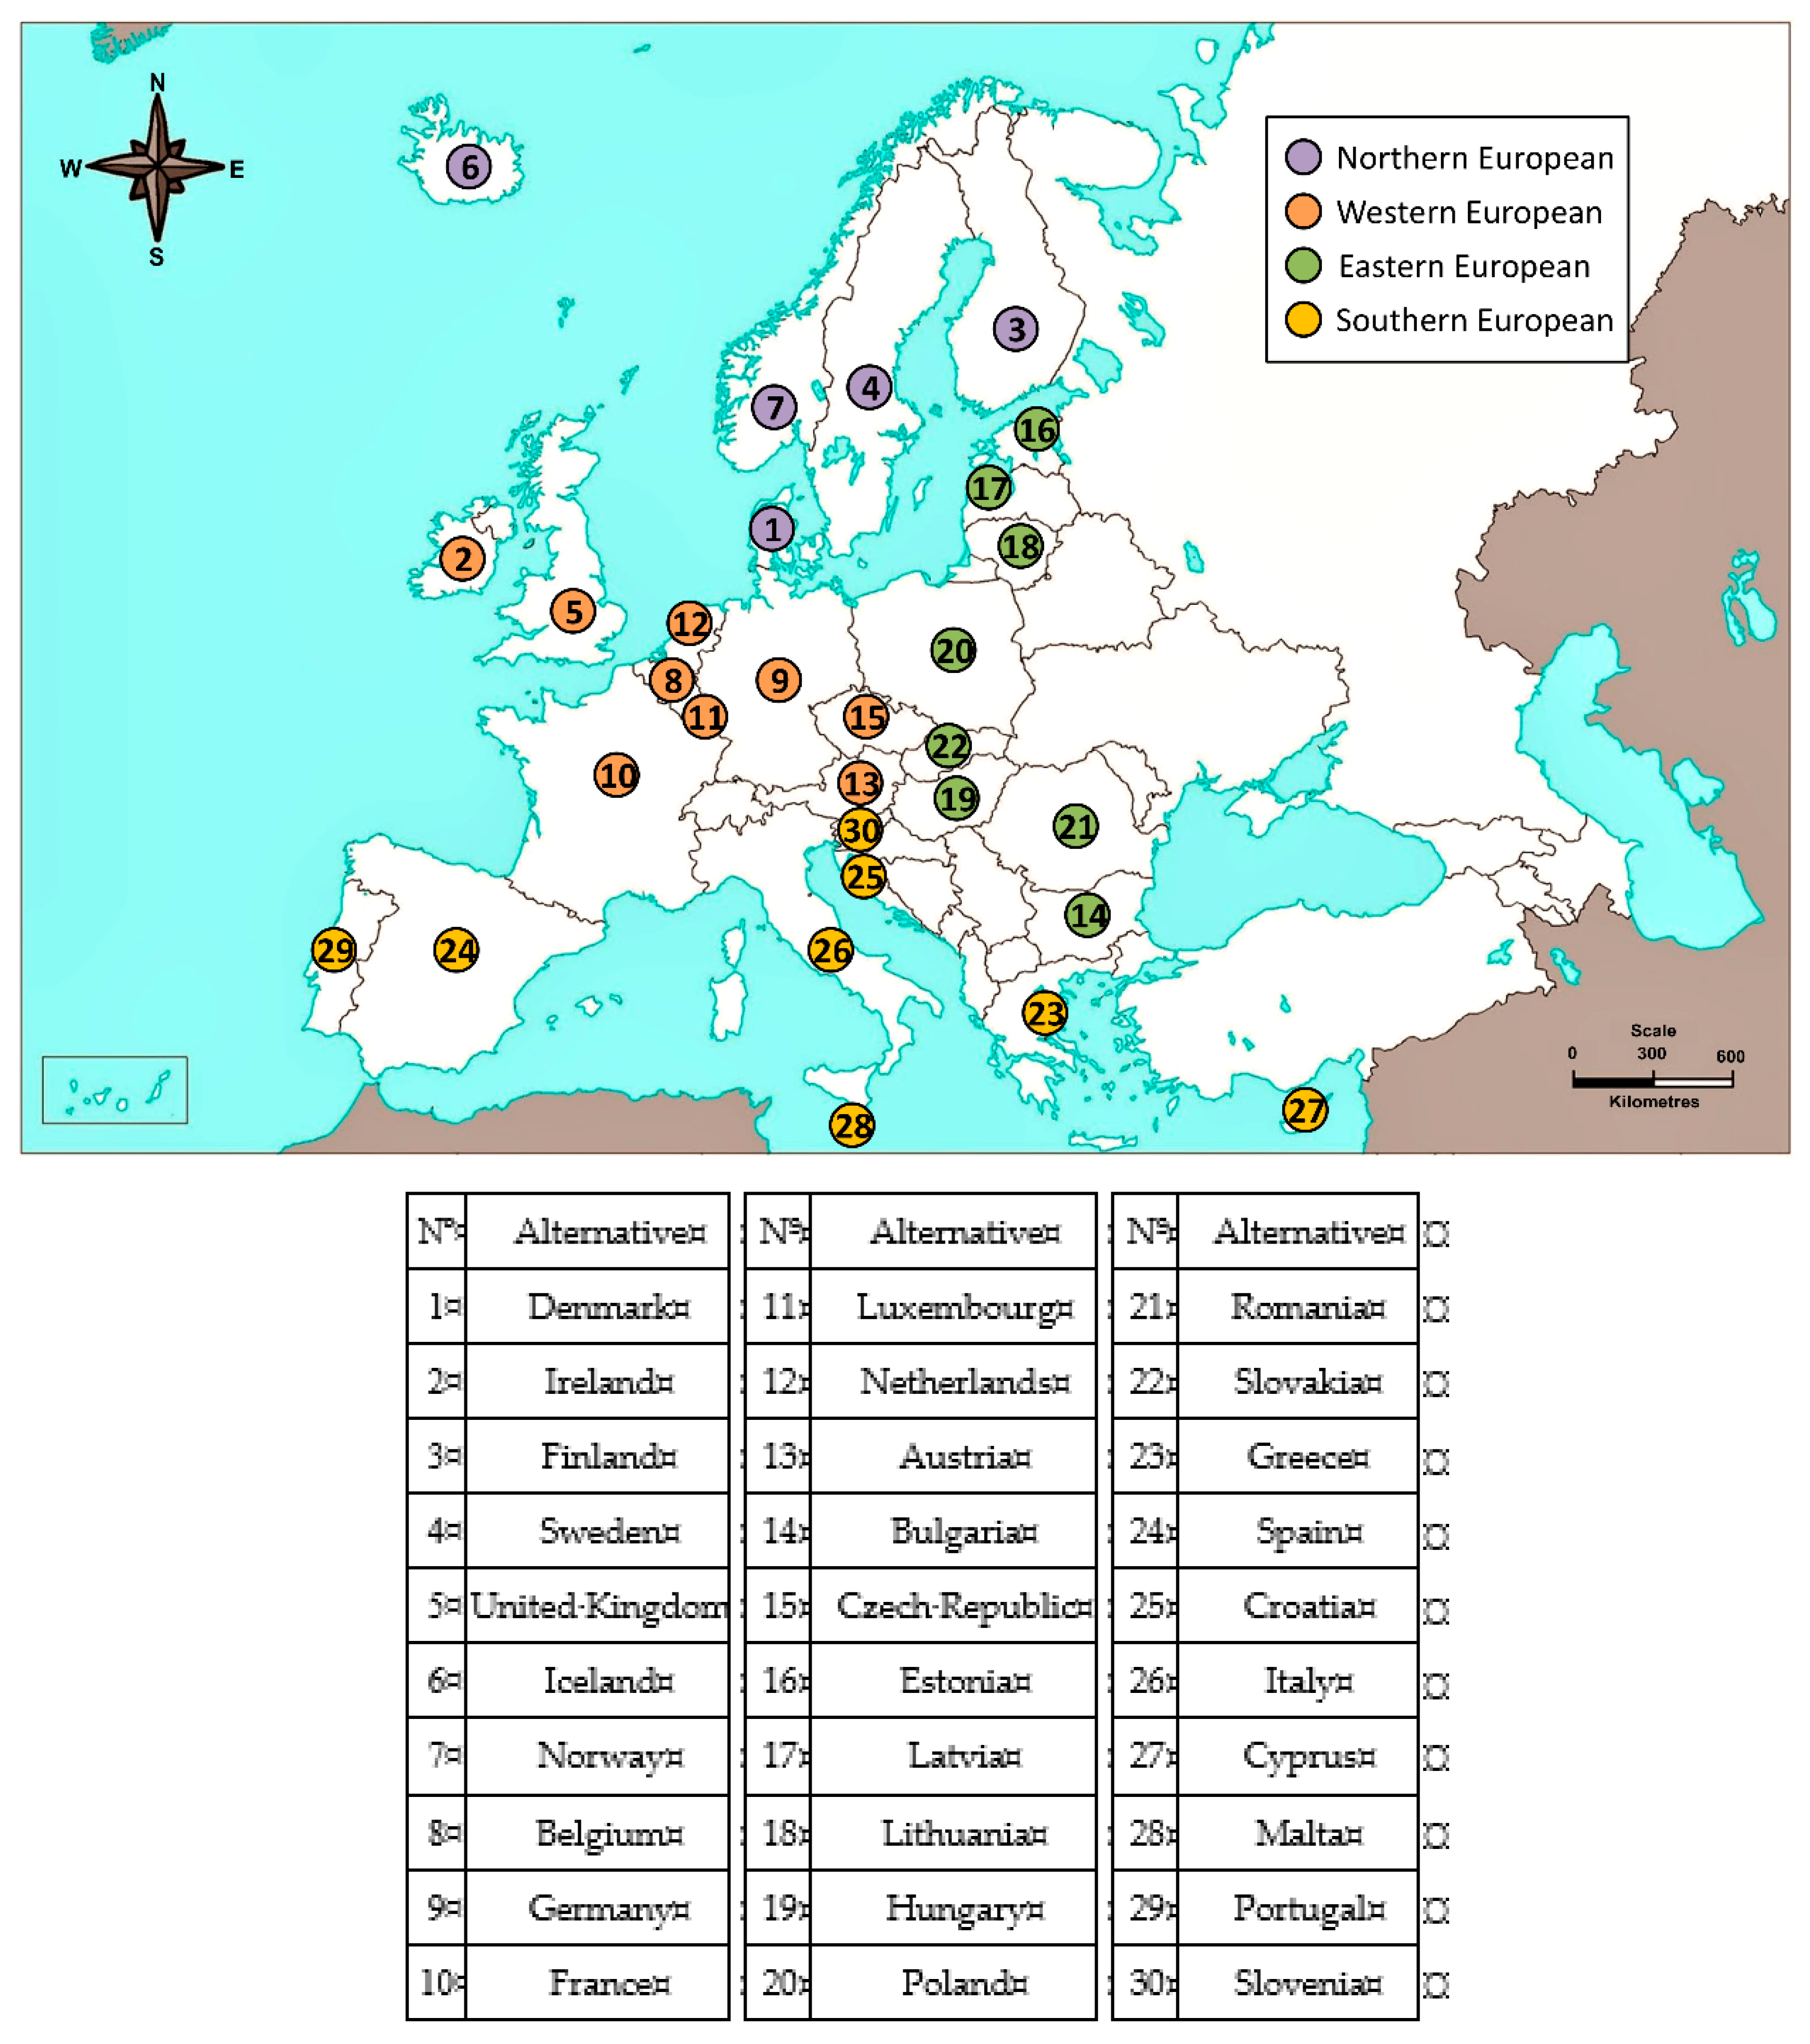
Given the number of countries to be analyzed, it was decided to classify the alternatives of the model depending on their geographical situation. They were categorized into four regions: Northern, Western, Eastern, and Southern Europe (see Figure 10).
Once the scaled matrices have been found, an AHP analysis is carried out for each period, introducing the weightings and value matrices in the Expert Choice software. This tool gives its judgements by percentages through relative assessments, where the alternative of greatest sustainability is the one whose percentage is highest, and a ranking is created between them. However, this is a handicap for the analysis of the evolution over time, since it is not possible to control whether all the alternatives increase or decrease their real sustainability in the same period.
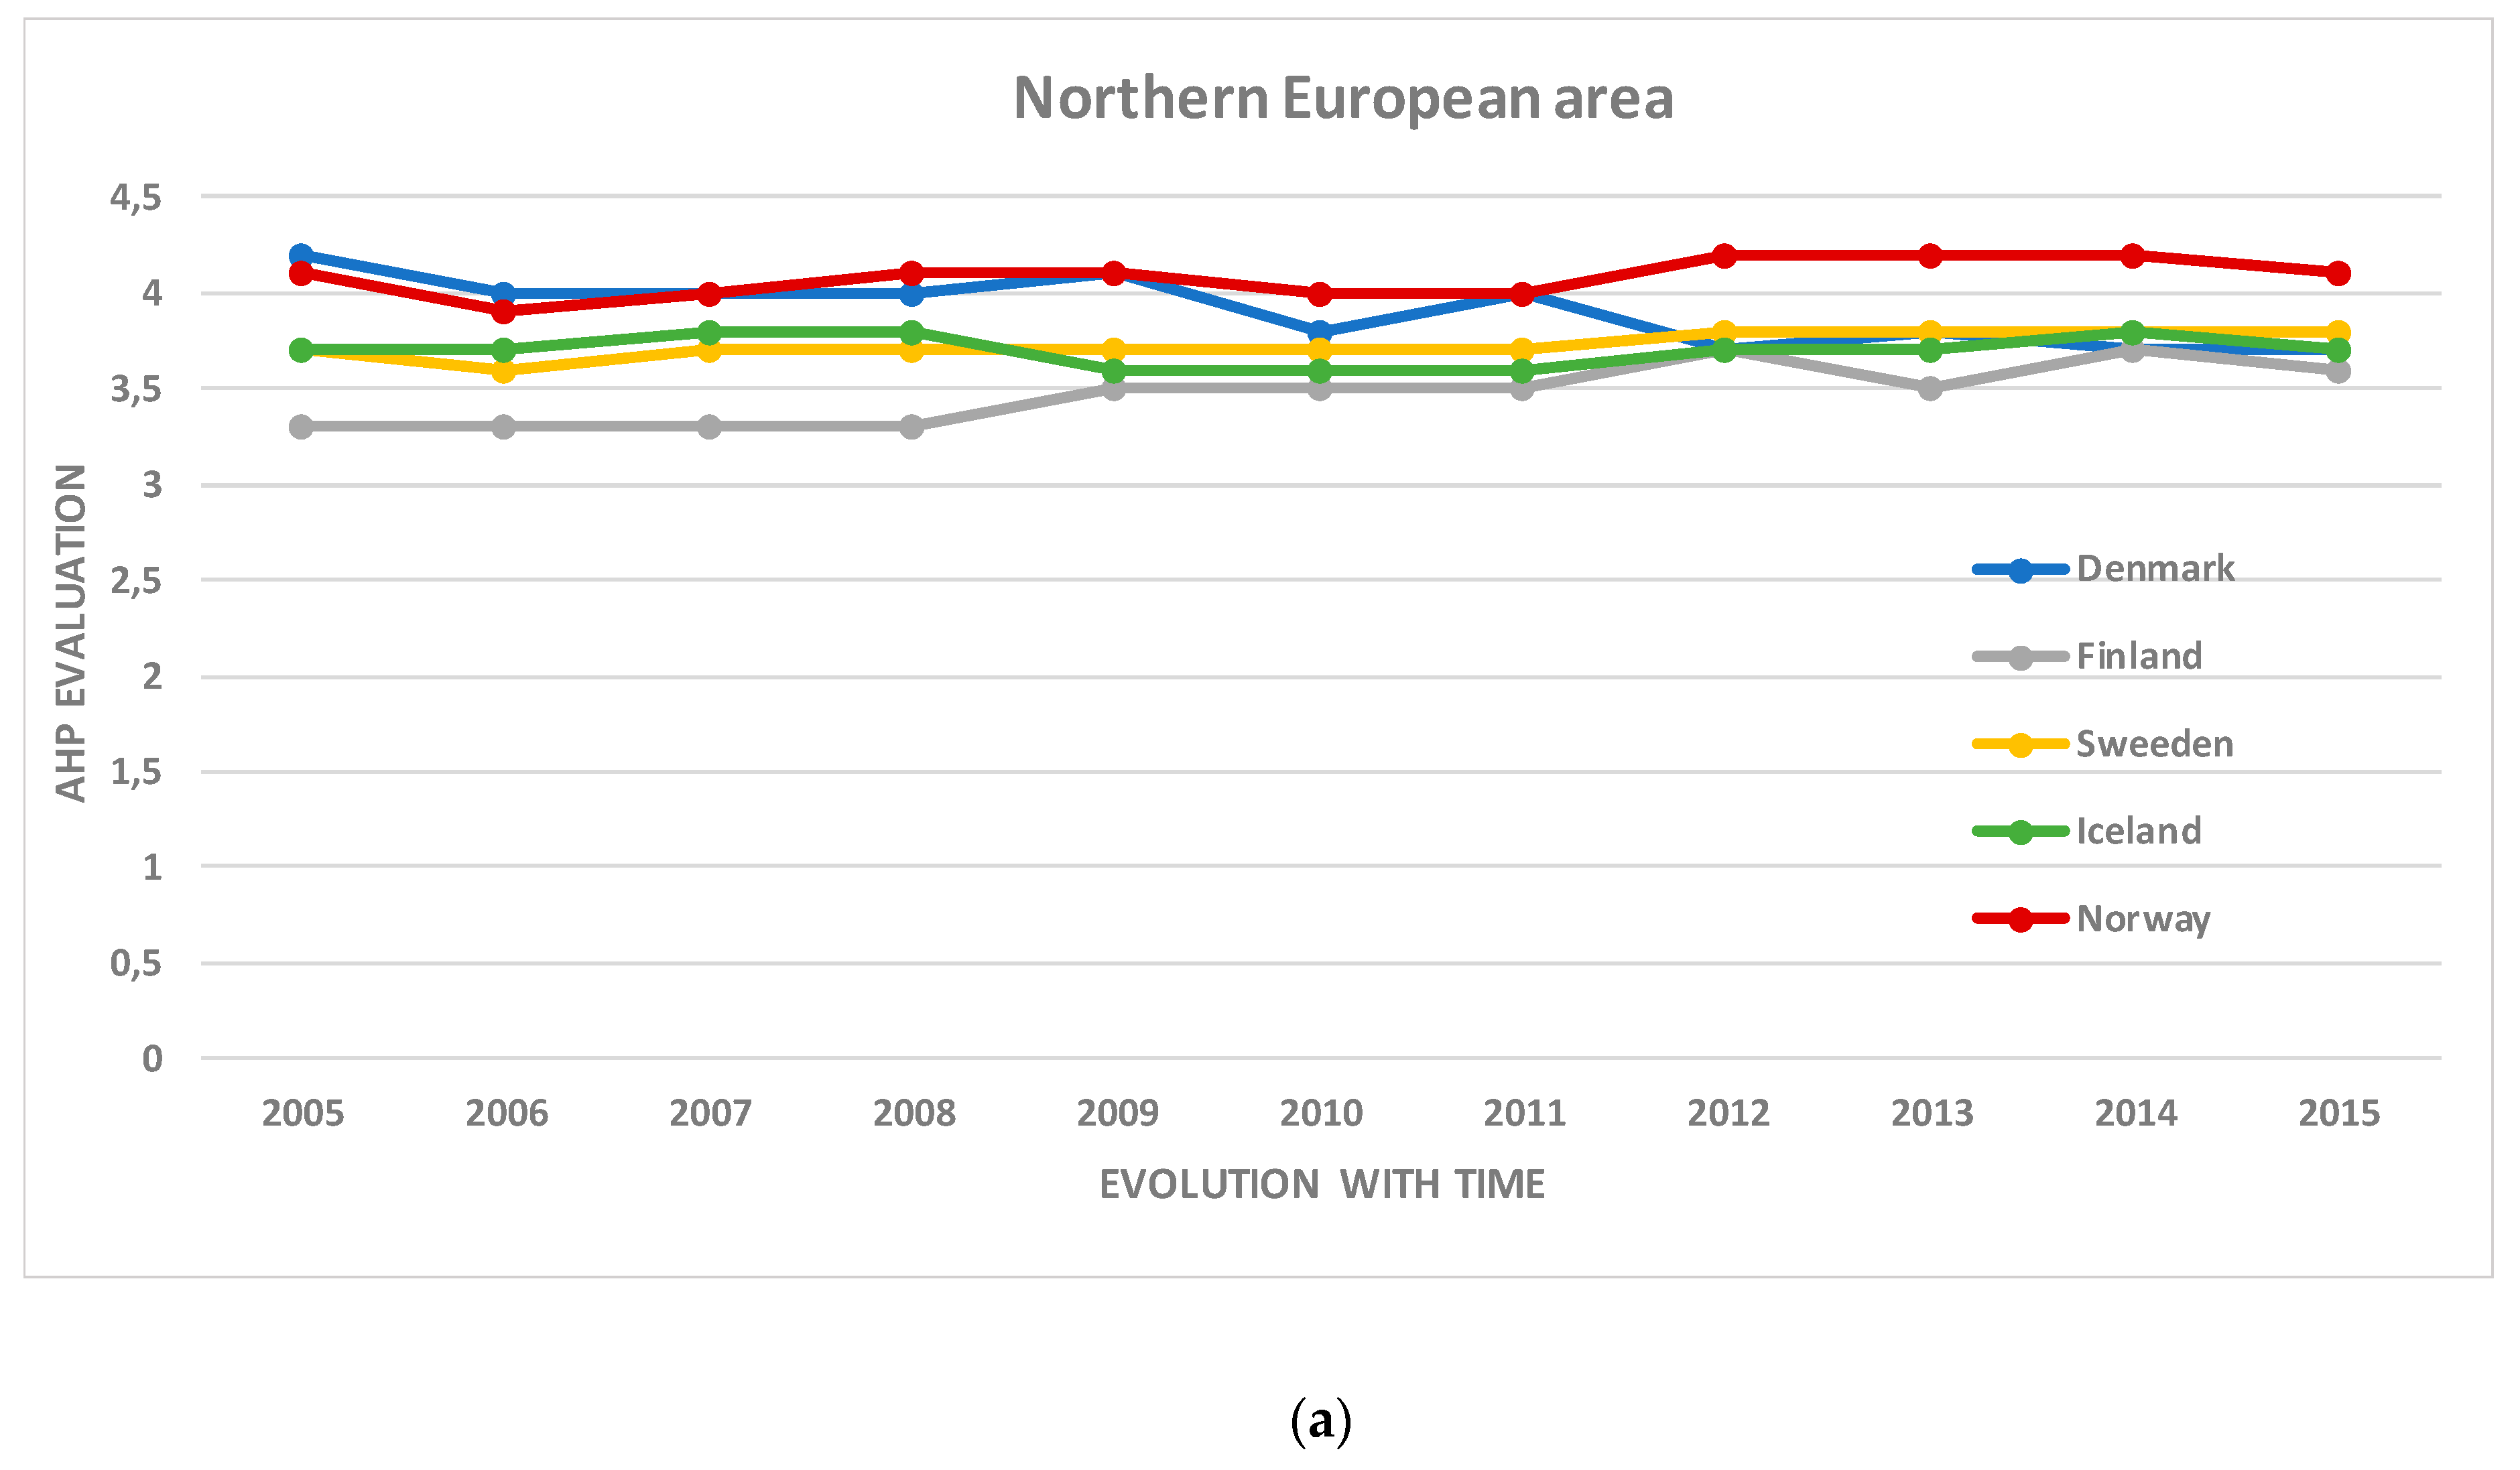
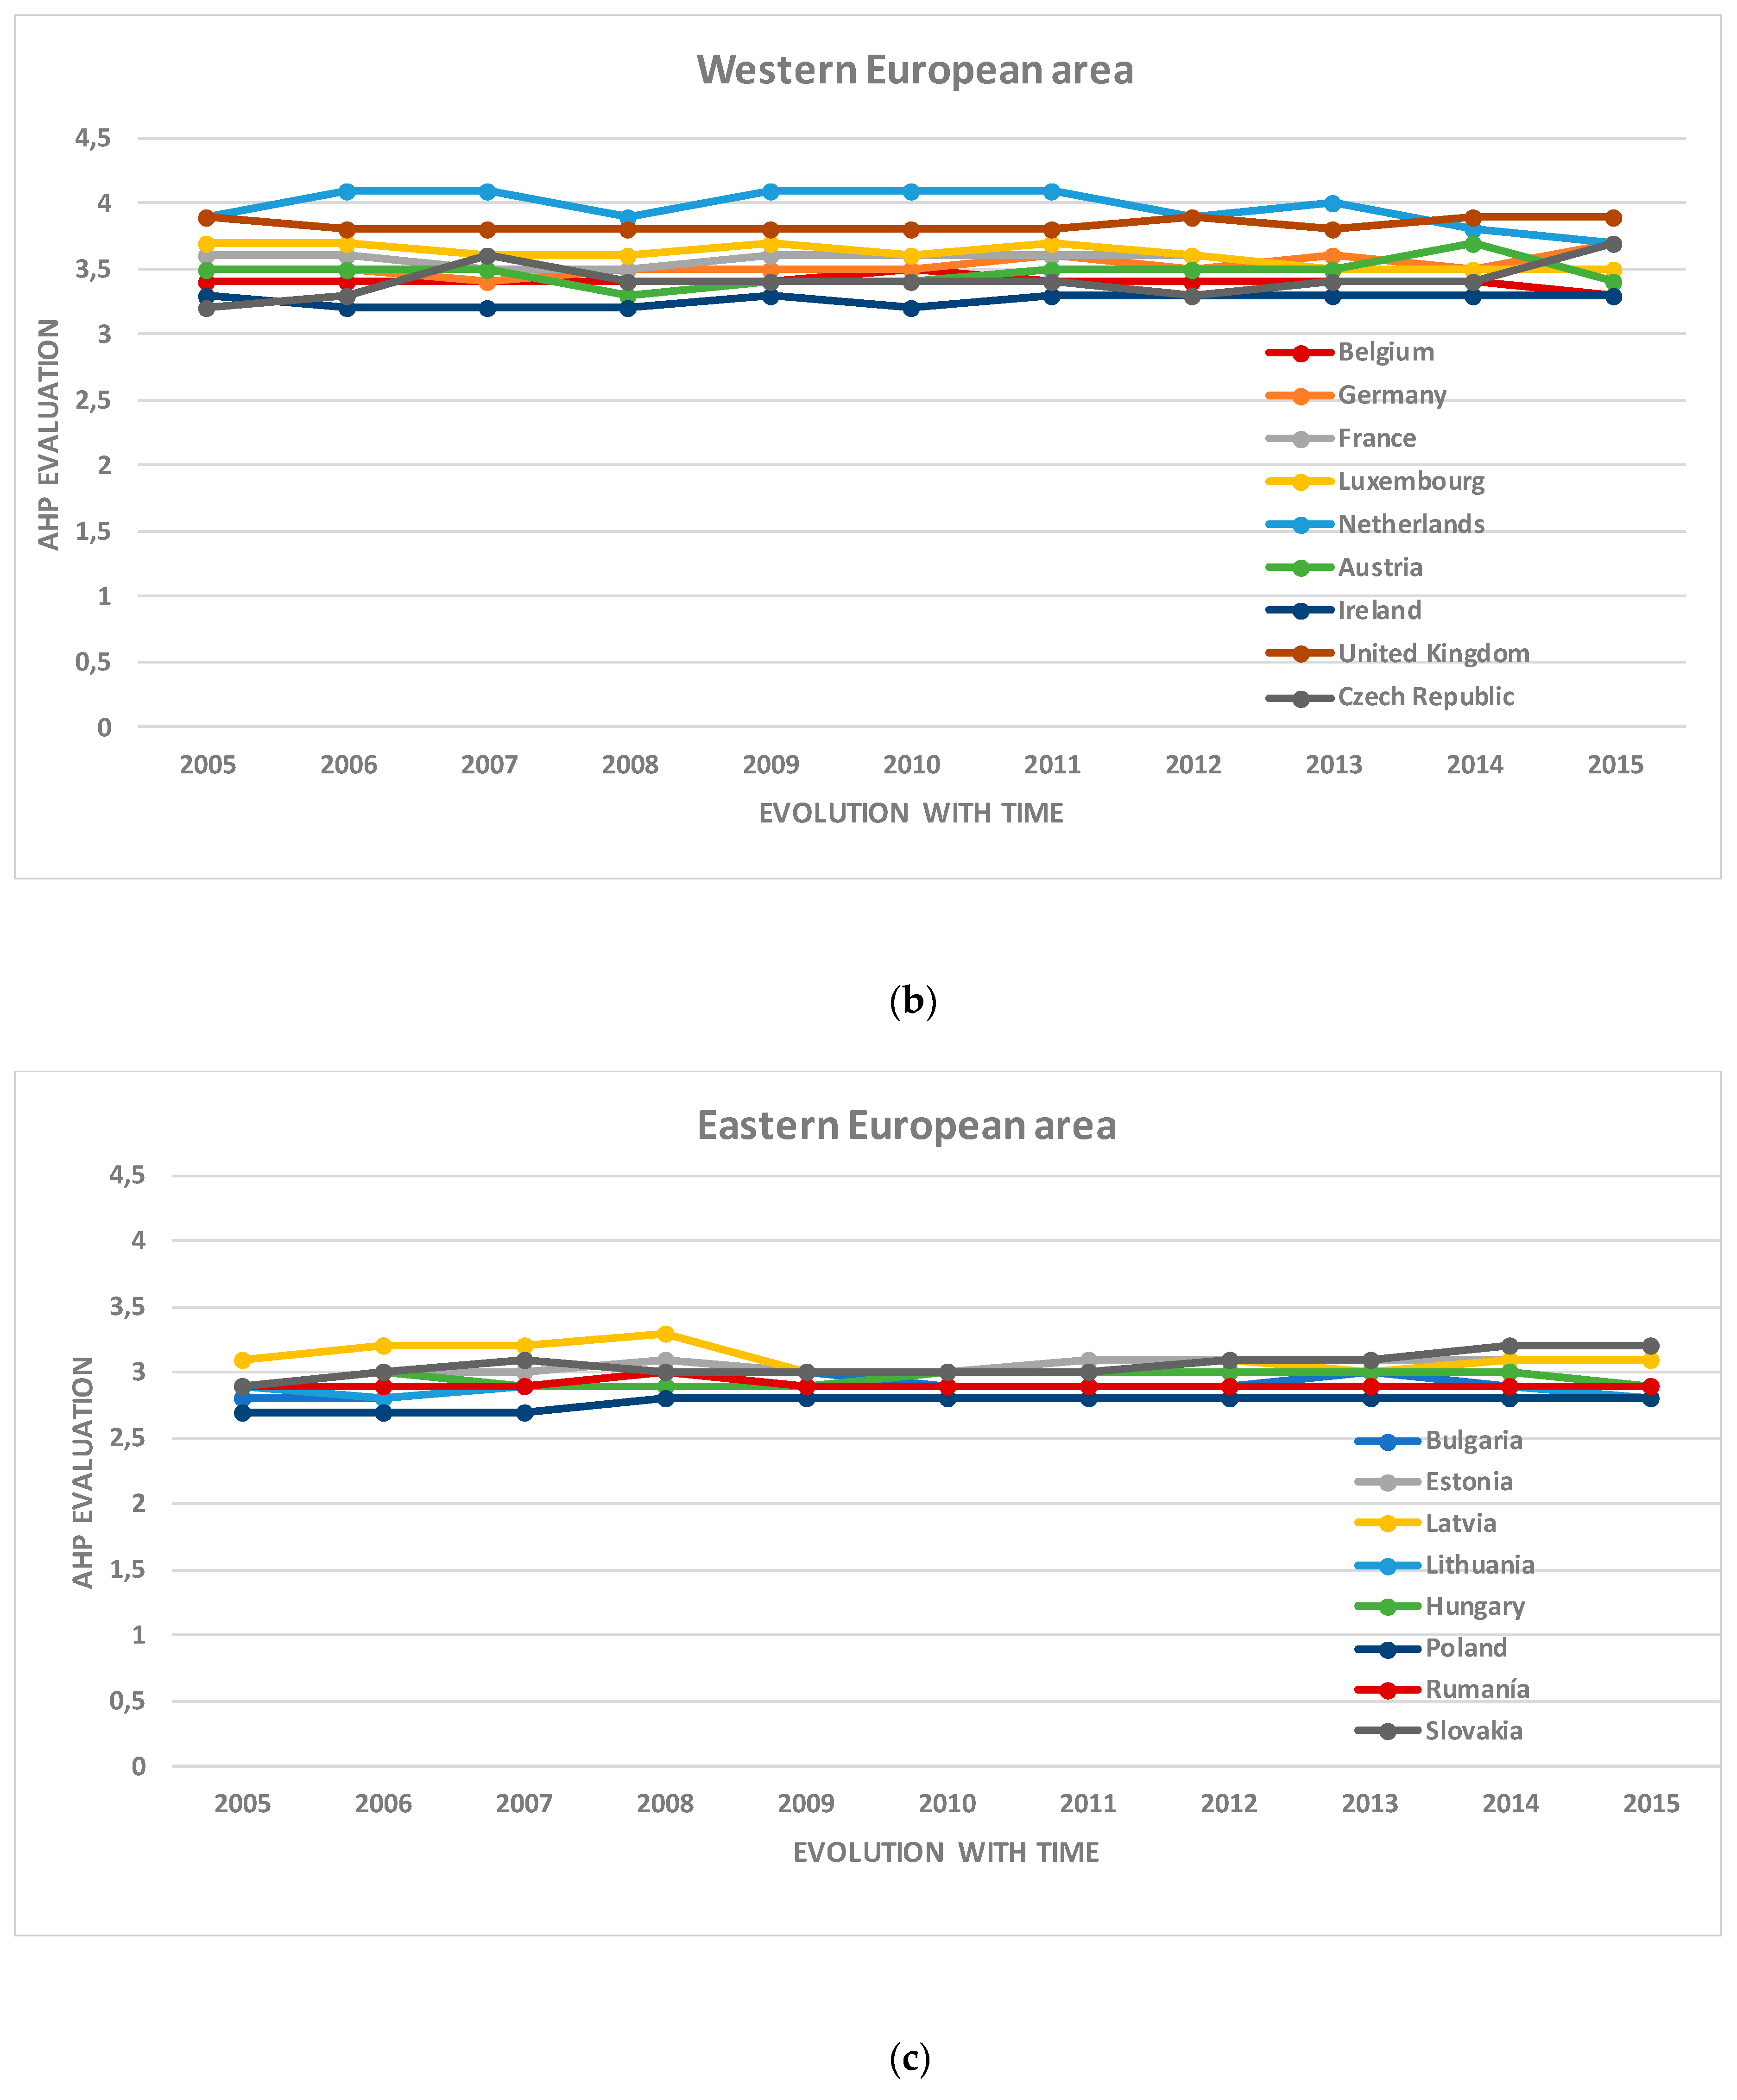
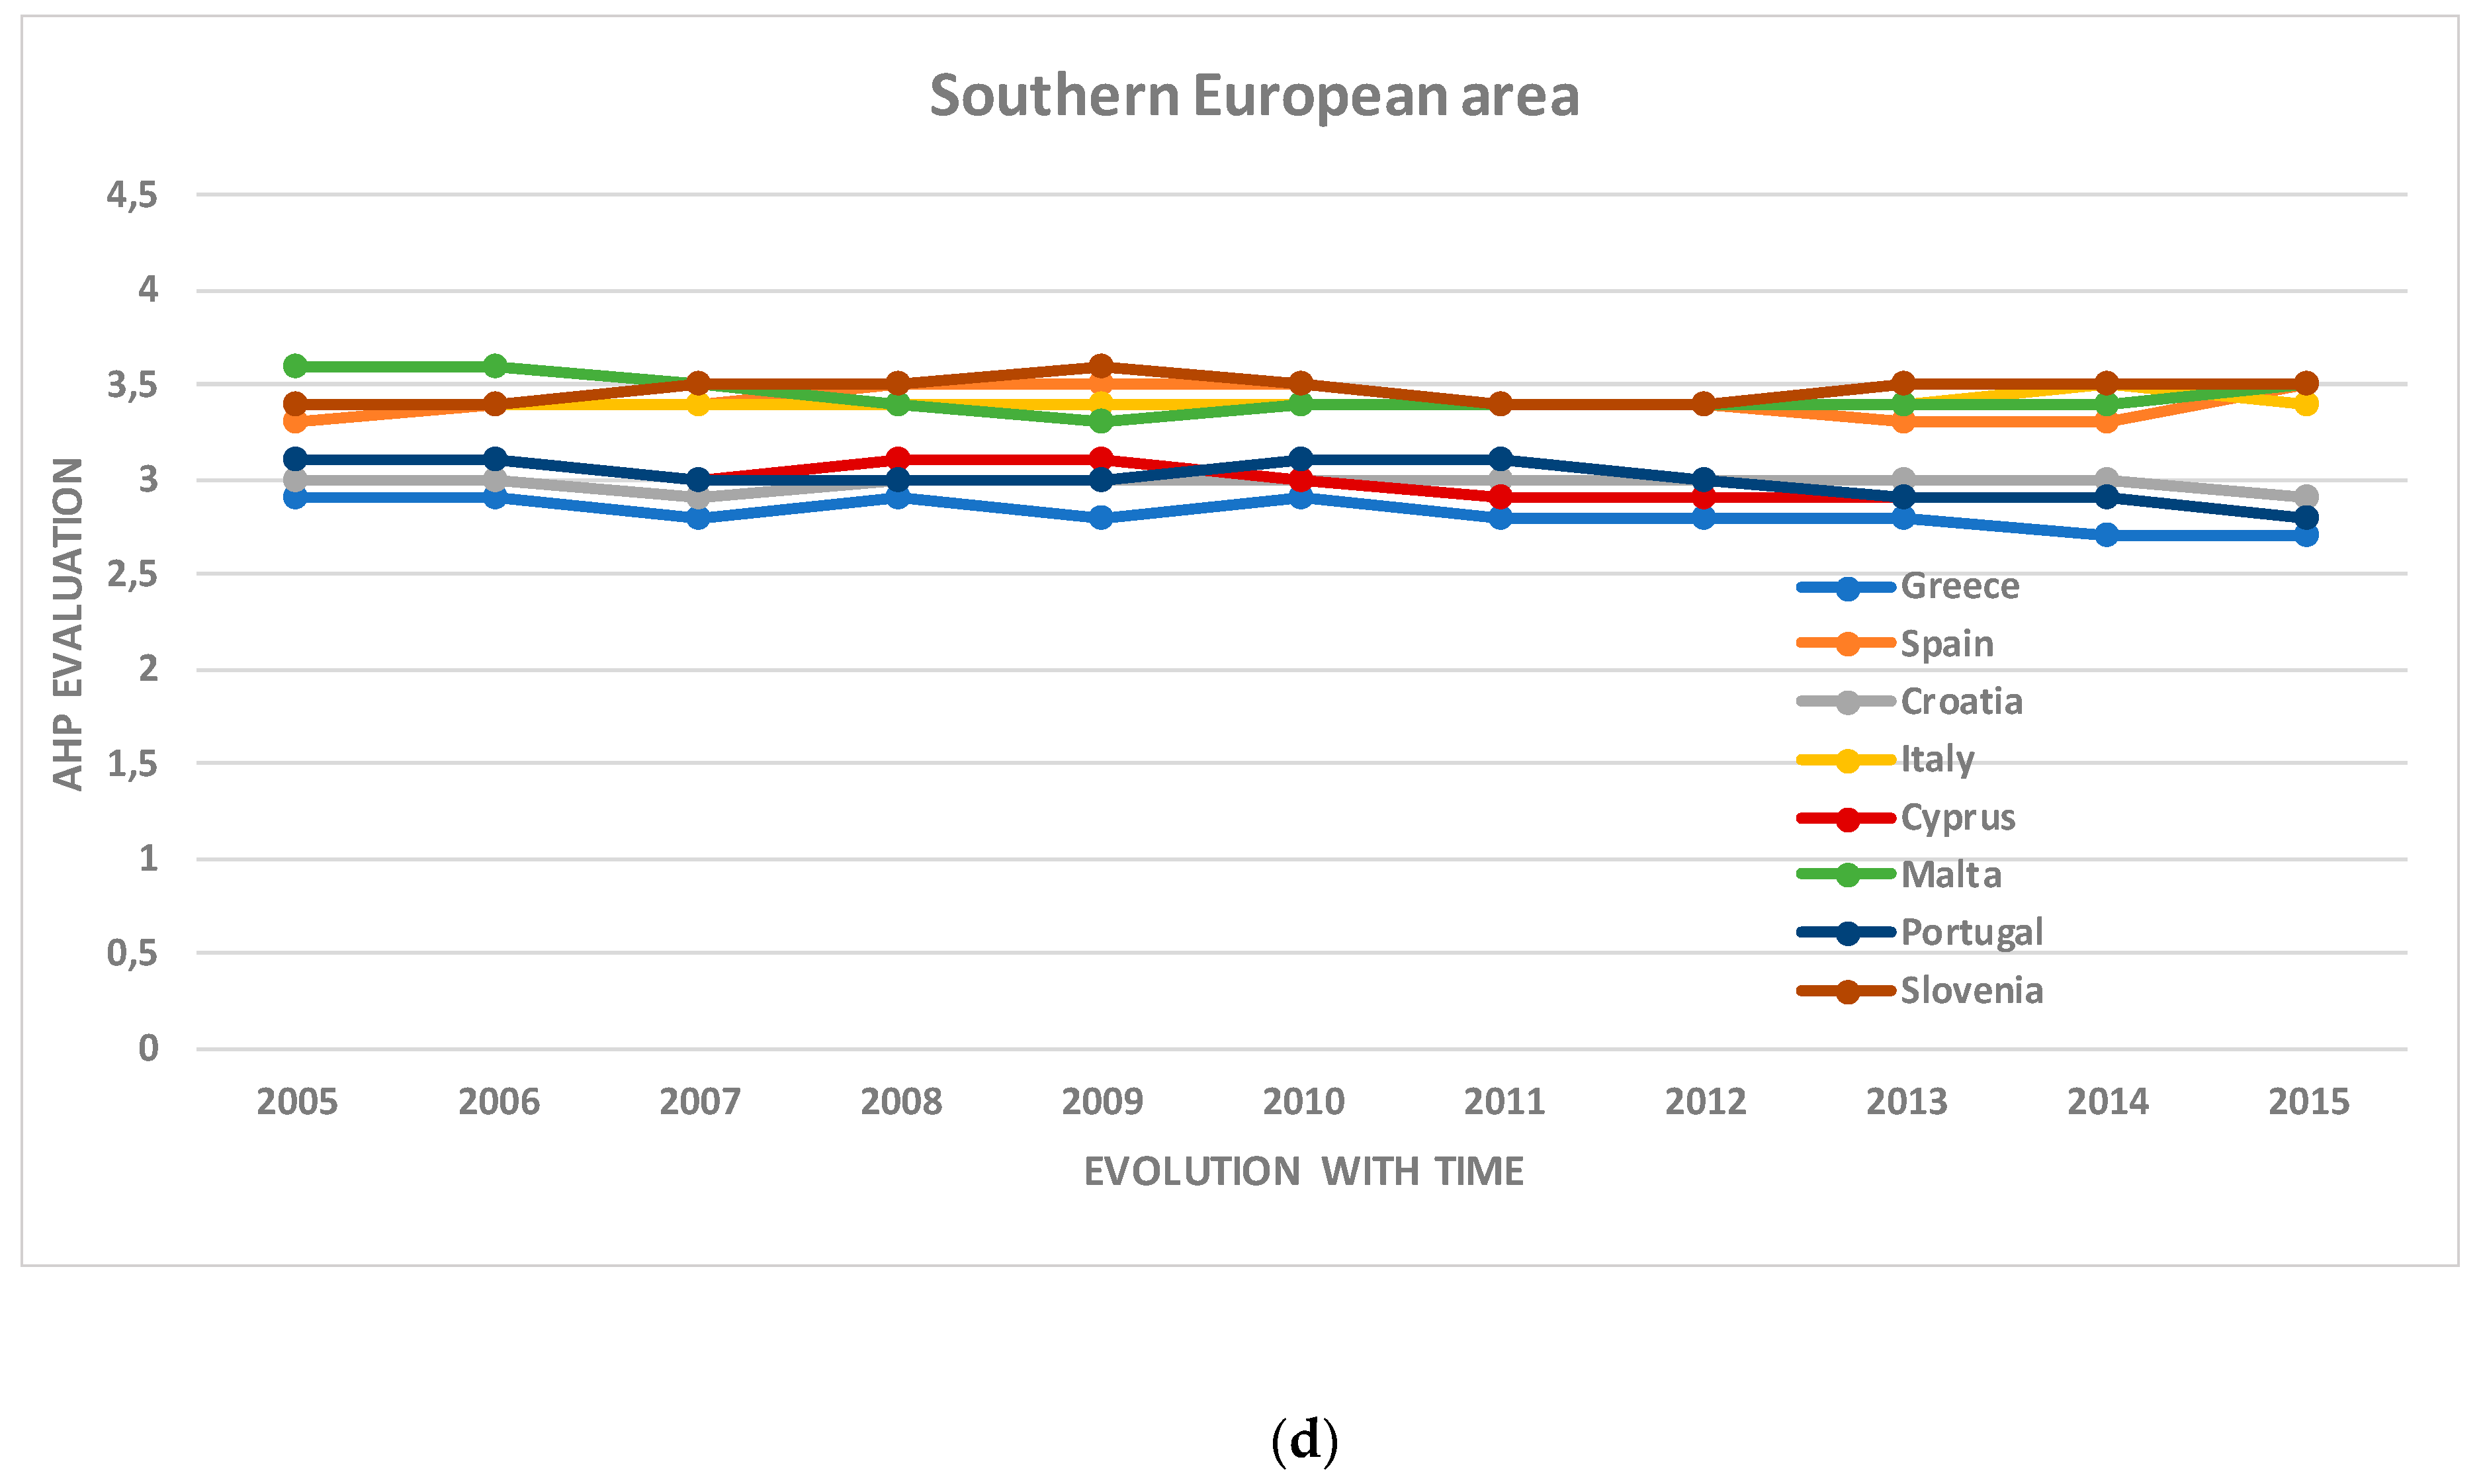
Applying the AHP methodology to all the periods gives an evolution over time of the sustainability of each of the alternatives. Figure 11 shows the resulting assessments for the countries for each period, classifying the results by the geographical area they belong to.
Analyzing the results, it is possible to classify the alternatives into different sustainability rankings, and so they are then categorized by their geographical area:
- Northern European area: this area shows a higher average than the others; it can be seen that Norway is the country with the highest SD, and an intermediate group with Sweden and Iceland. In addition, the evolution of Finland is very clear, starting at the lower level and finishing at the intermediate, and of Denmark, which starts at the higher level and ends at the intermediate. The variation of the Northern countries in terms of SD in 2015 with respect to 2005 shows a mean value of −0.02, essentially due to the decline of Denmark.
- Western European area: three levels of sustainability can be discerned, a lower one that includes Ireland, a medium level comprising Belgium, Germany, France, Luxembourg, Austria, and Czech Republic and a higher level where the Netherlands stands out at the alternative with greatest sustainability, followed by the United Kingdom. Looking at the variation of the countries in SD in 2015 with respect to 2005, we find a mean of 0, since the great increase of the Czech Republic balances the small declines of Belgium, France, Luxemburg, the Netherlands, and Austria.
- Eastern European area: two levels can be discerned, with clearly lower values that the other regions; a lower level comprising just Poland, and an intermediate level which covers Bulgaria, Estonia, Latvia, Lithuania, Hungary, Romania, and Slovakia. Nonetheless, the increasing development of Slovakia is notable, as is that of Latvia, which starts with values higher than the remaining Eastern countries, but in 2009 dropped significantly. Looking at the variation of the countries in SD in 2015 with respect to 2005, we find a mean of 0.075, since all the countries remained stable or increased except Lithuania.
- Southern European area: these regions show more inequality between the countries in it. Here a higher level can be seen, with Spain, Italy, Malta and Slovakia with values similar to Western European countries, and another lower level, comprising Greece, Croatia, Cyprus, and Portugal, whose values are similar to those of Eastern countries. Looking at the variation of the countries in SD in 2015 with respect to 2005, we find a mean value of −0.0875, since most of them underwent decline, with the exception of Spain and Slovenia.
Analyzing the evolution over time of these countries, it can be seen that in general there is no sustainable growth of the SD suggesting a trend in any country, as the small increases in one year are followed by similar decreases in the subsequent years and vice versa. 2007 and 2015 are the years when the greatest number of countries reduced their SD with respect to the previous year (9 and 12, respectively), and so it does not seem to be related to the economic recession which began in 2009. In fact, it was in 2008 and 2009 that the greatest number of countries increased their SD with respect to the previous year (10 and 8, respectively). It should be pointed out, therefore, that there is no greater observed concern for SD by countries in 2015 despite the increase in the importance that citizens attribute to this matter in recent years.
According to the results shown in Figure 11, it is not possible to conclude that there are great similarities in the evolution over time of these countries. However, the analysis by regions draws attention to the existence of different levels of sustainability, and so it is especially interesting to analyze all the alternatives together, to identify the situation with respect to the rest. It was decided to use a moving weighted mean of the evaluations for each country, as this technique allows the results of the full evolution over time to be used, giving greater importance to those belonging to more recent periods. The weighted mean is calculated as described in Equation (2), where the values are the assessments for each period, represent the number of periods, and their weightings:
The weightings () with respect to each period were calculated as the first eleven terms of the smoothed exponential (see Table 18), so the smoothing constant must be identified, in order to find the weighting for each year.
Therefore, considering the constraint that the sum of all the weightings must be unity (), the equation is solved to find the value of the smoothing constant of . Table 19 brings together the resulting weightings for each period.
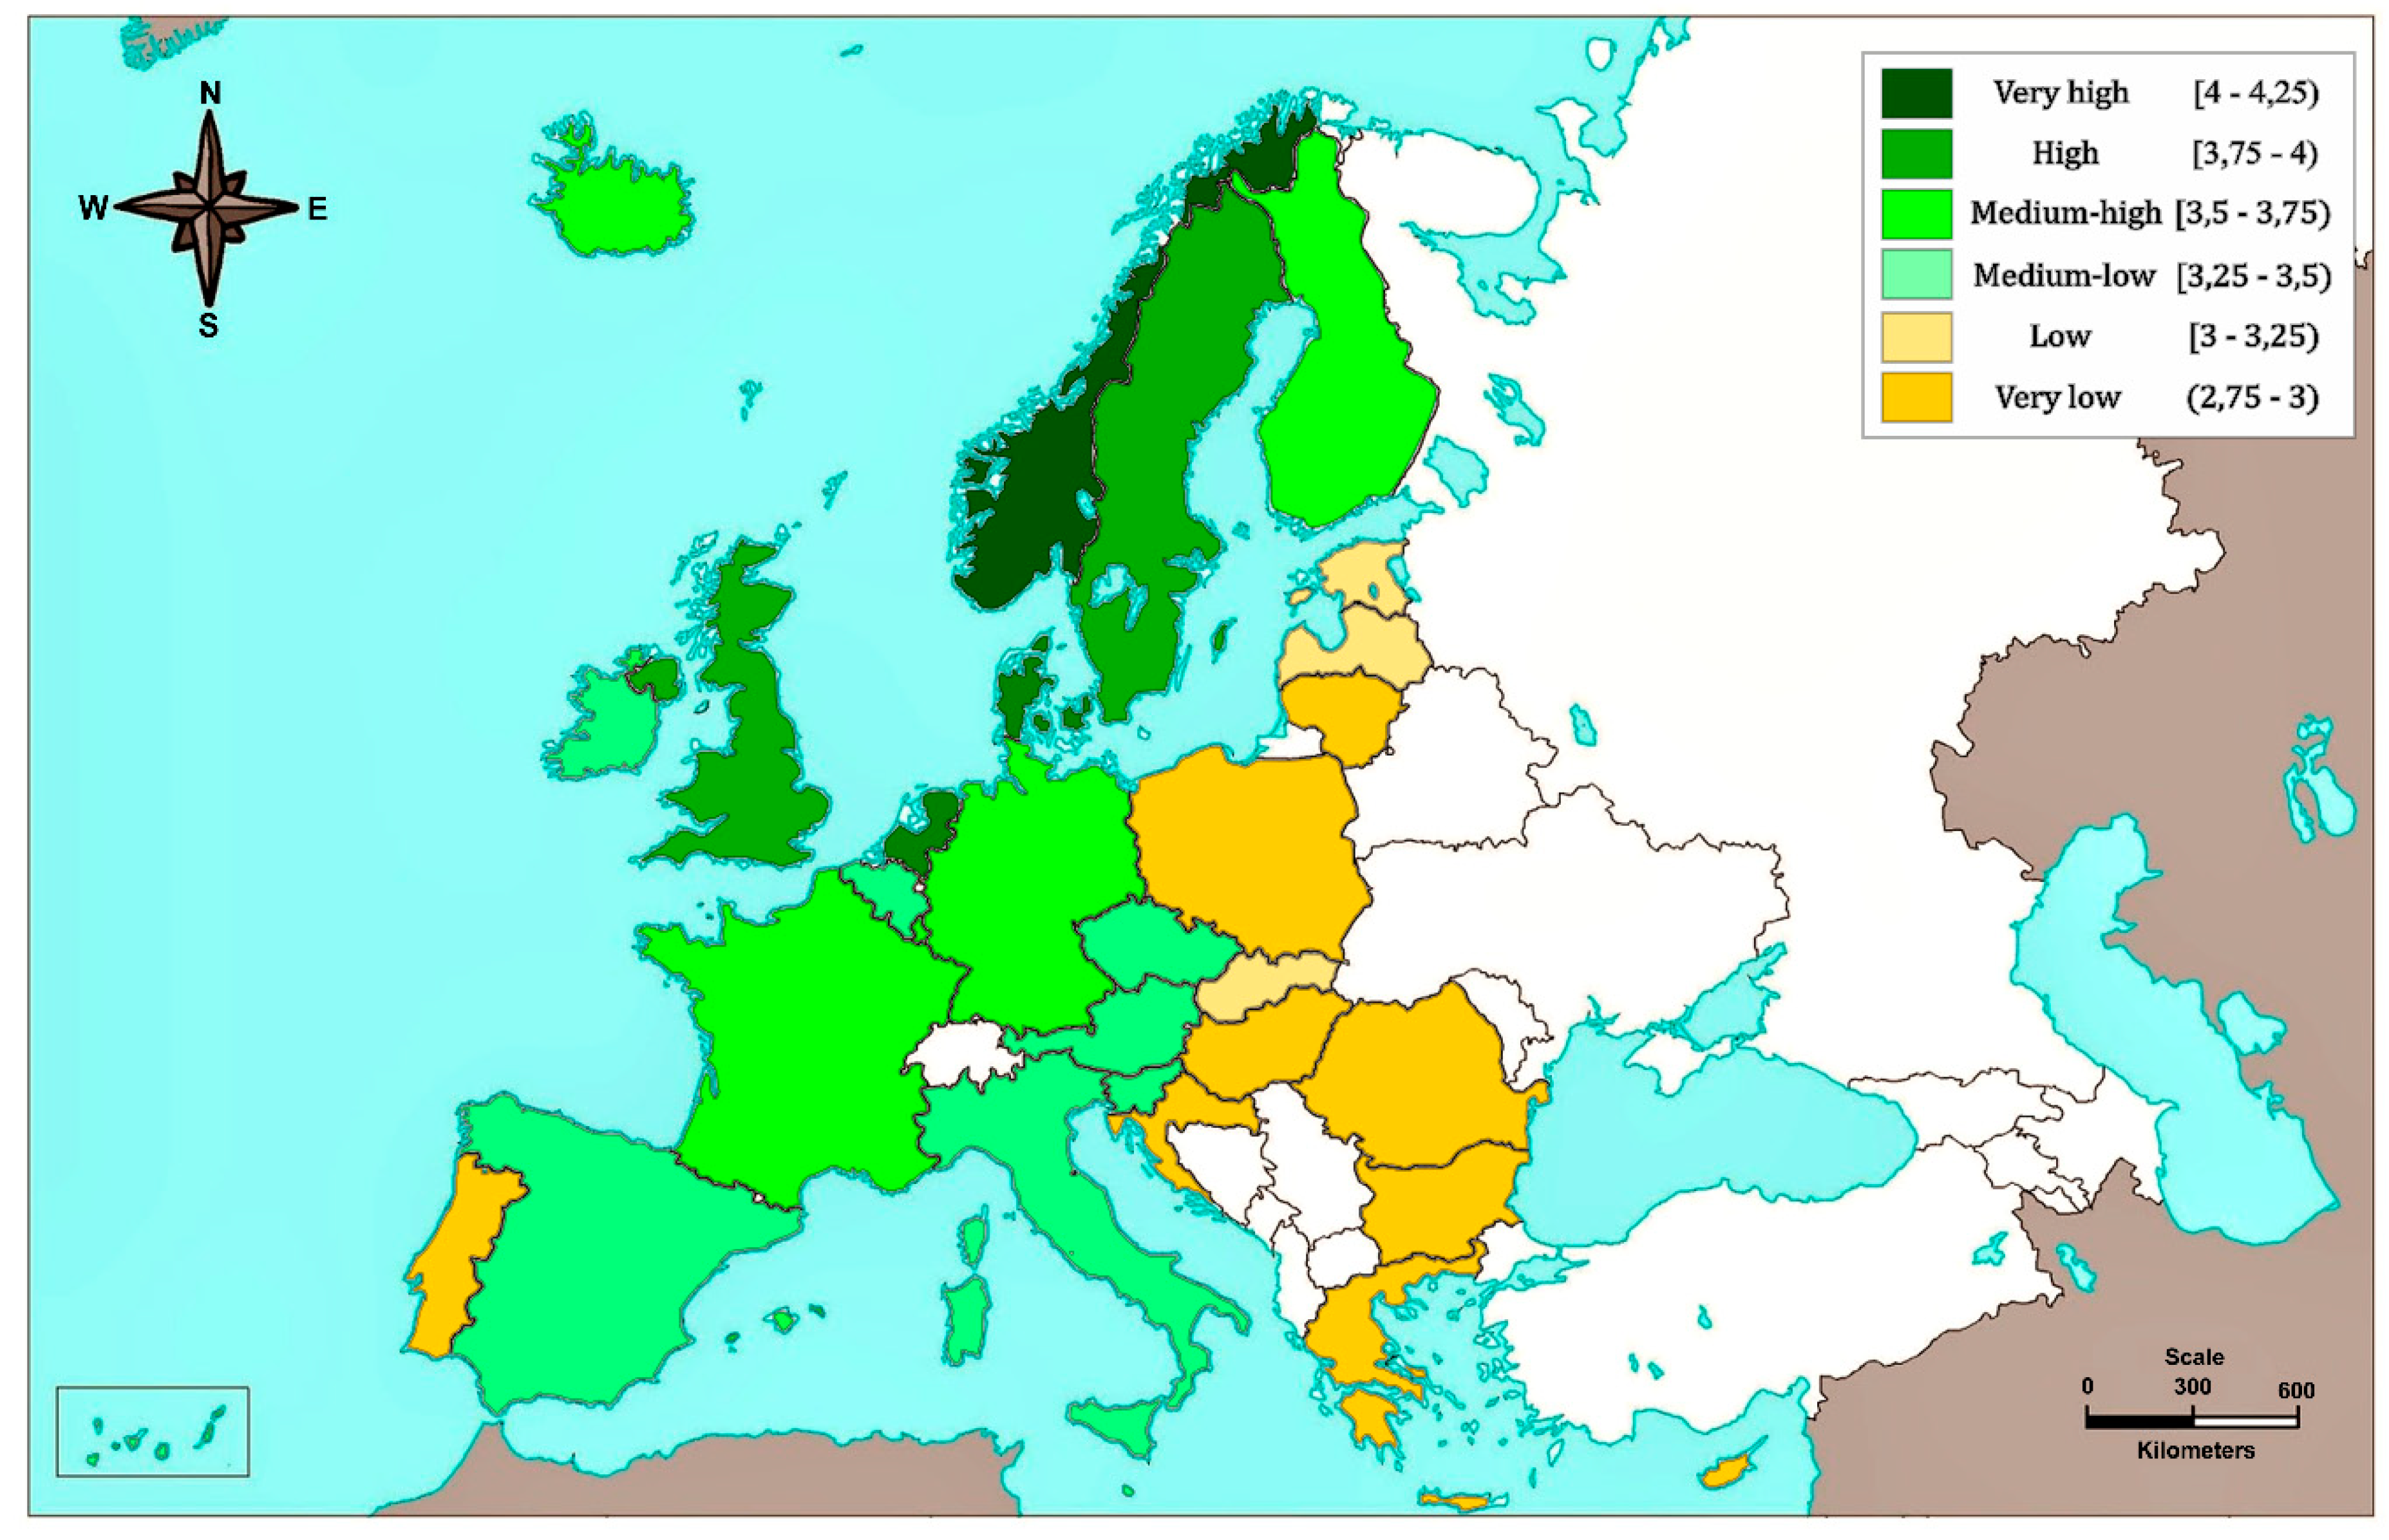
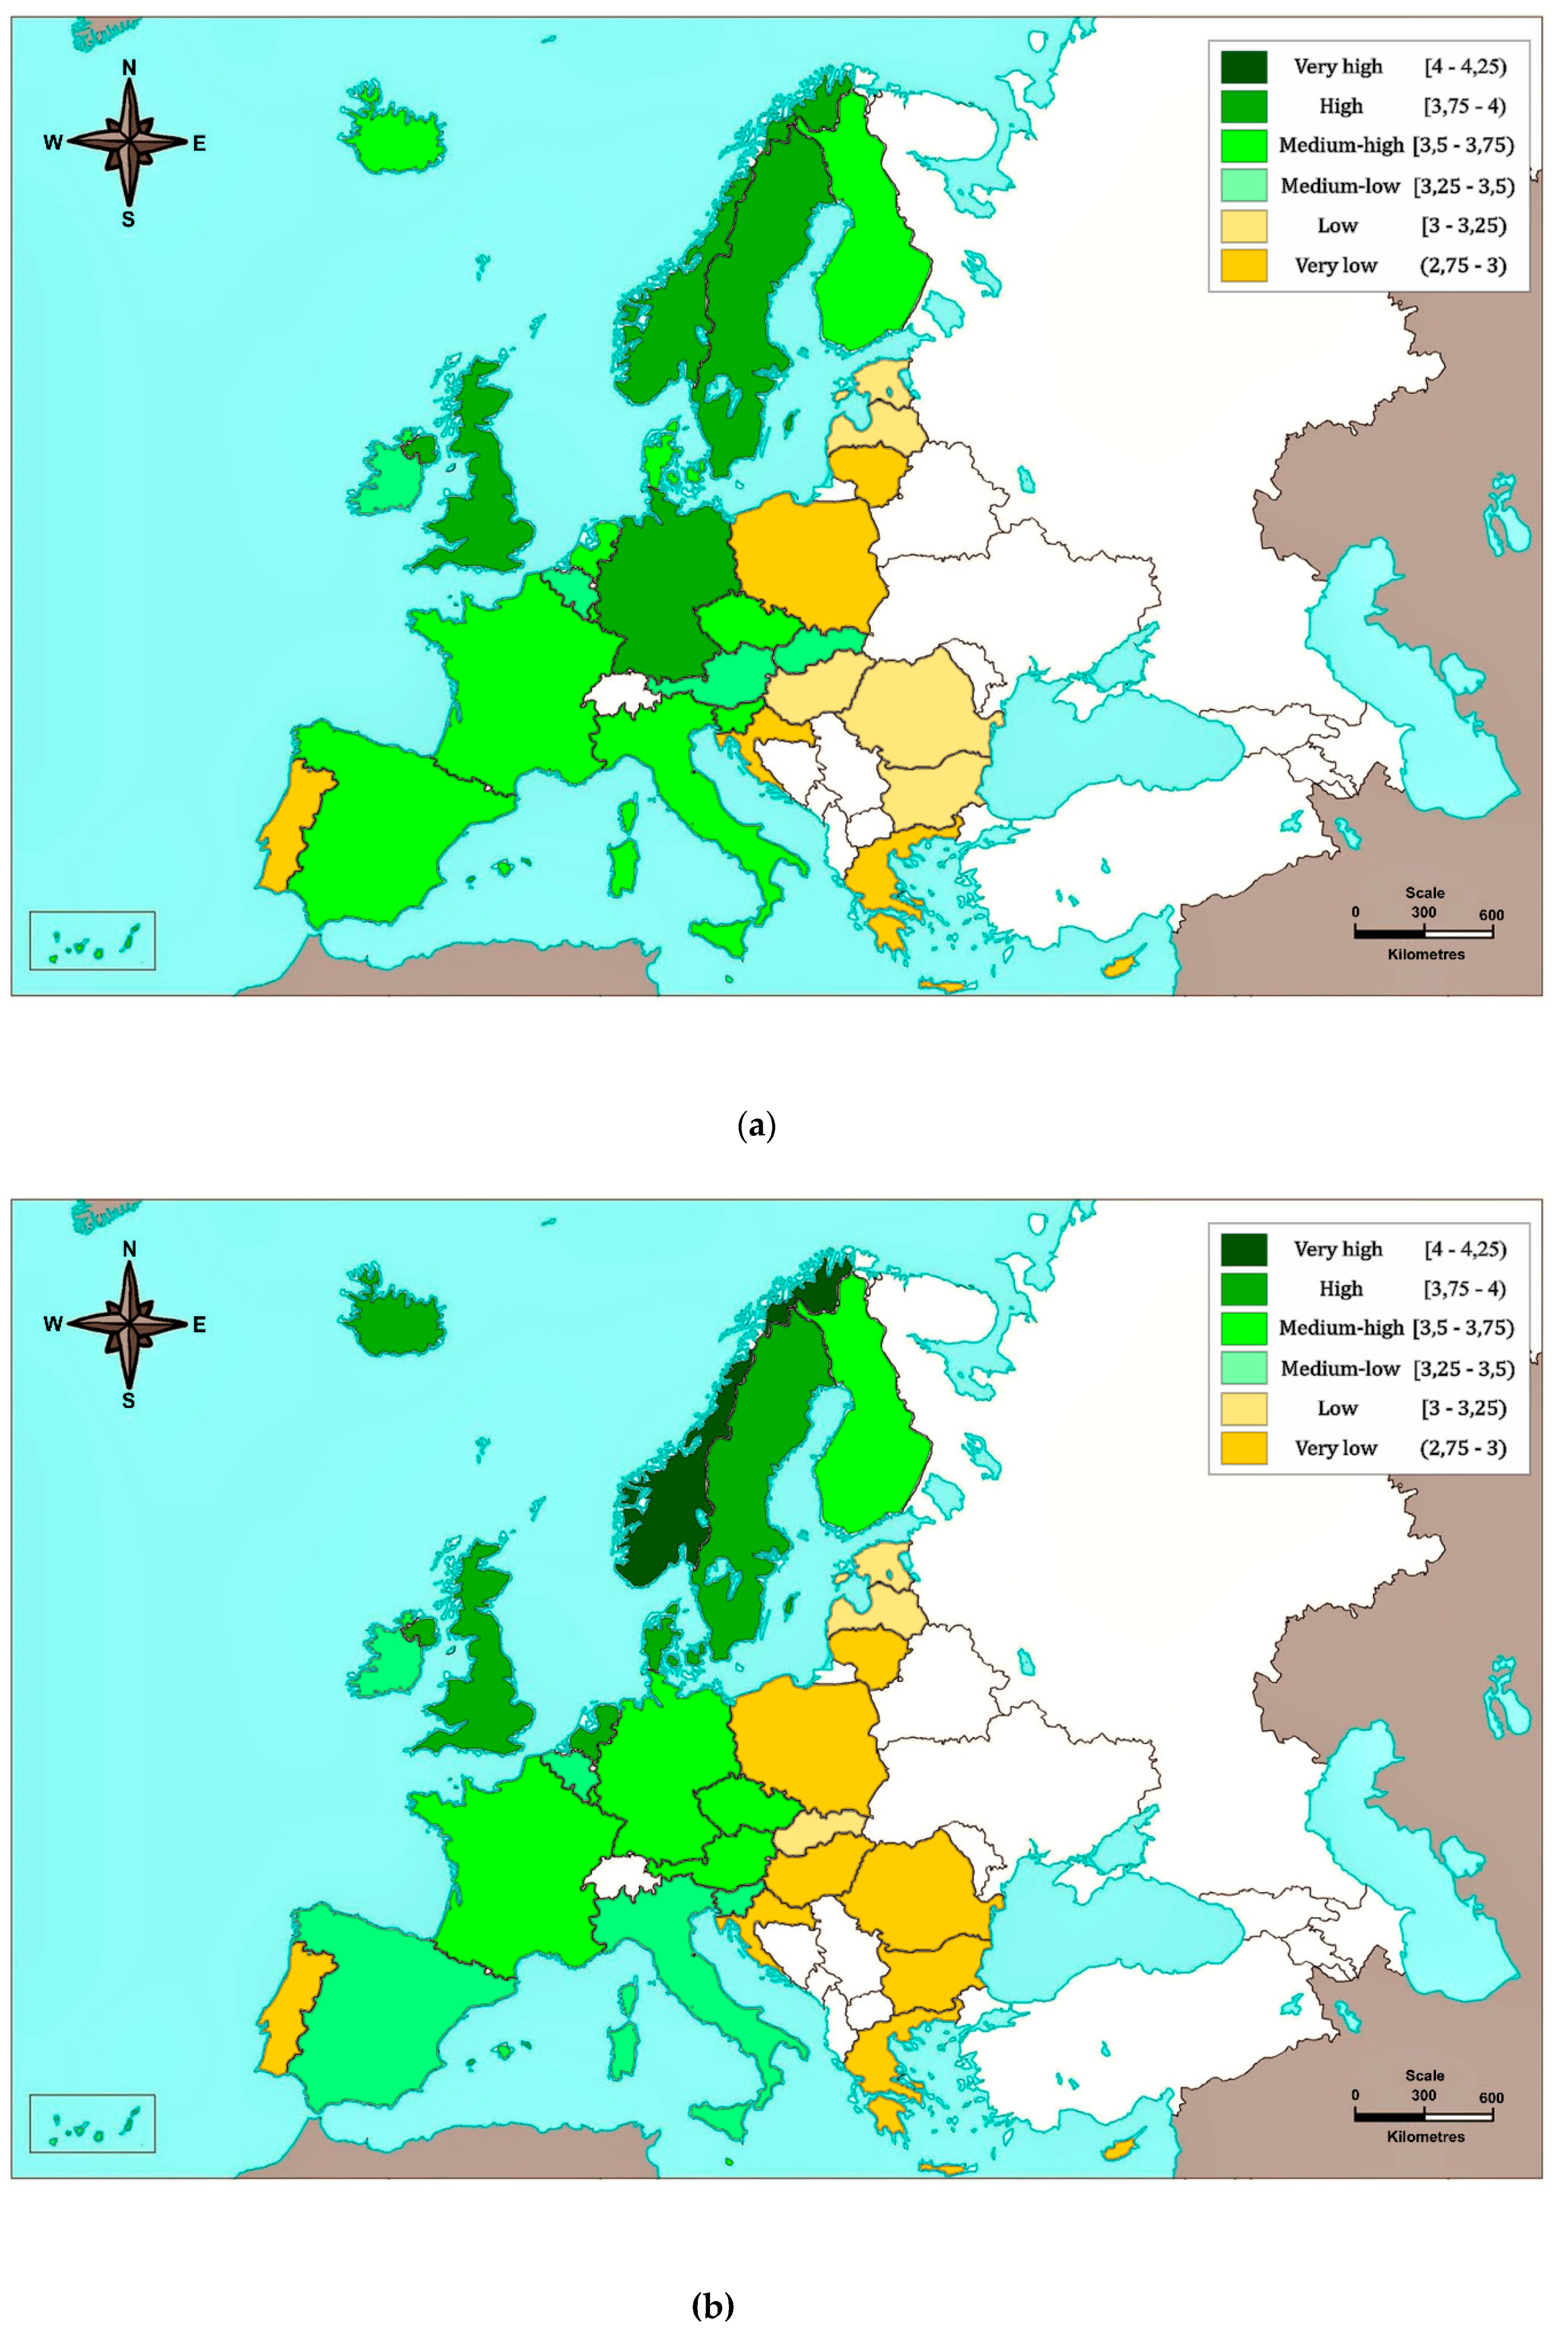
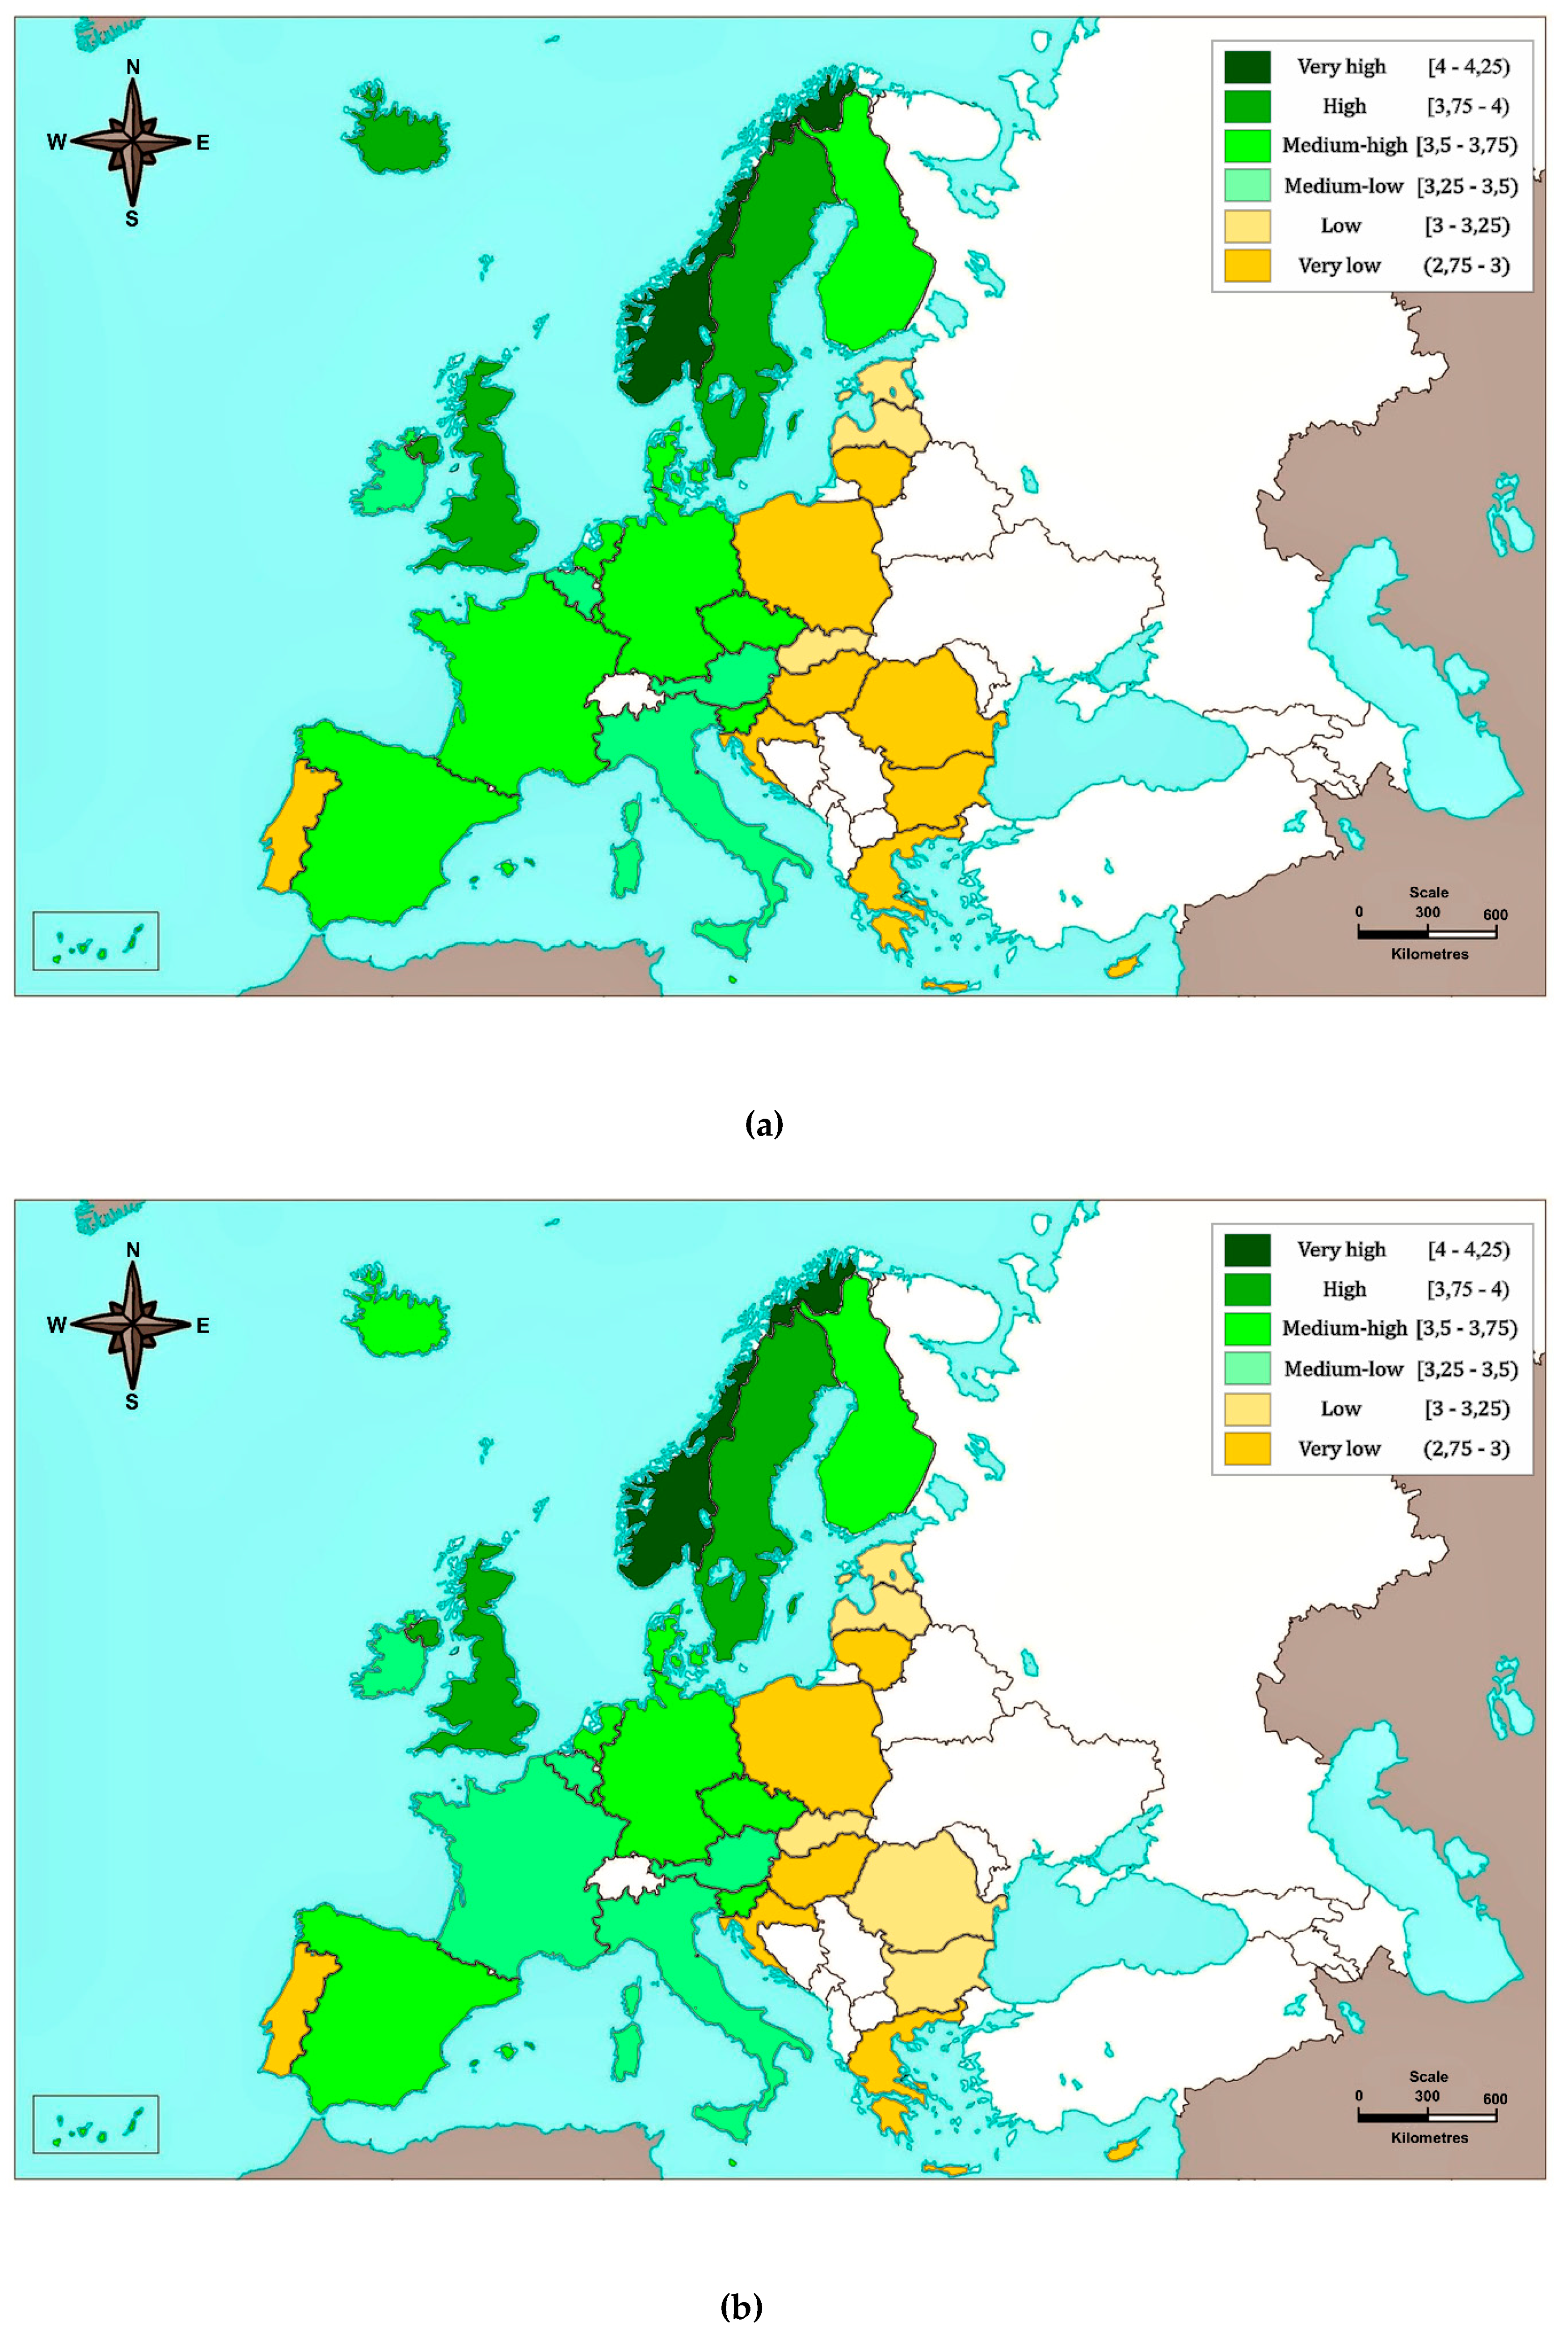
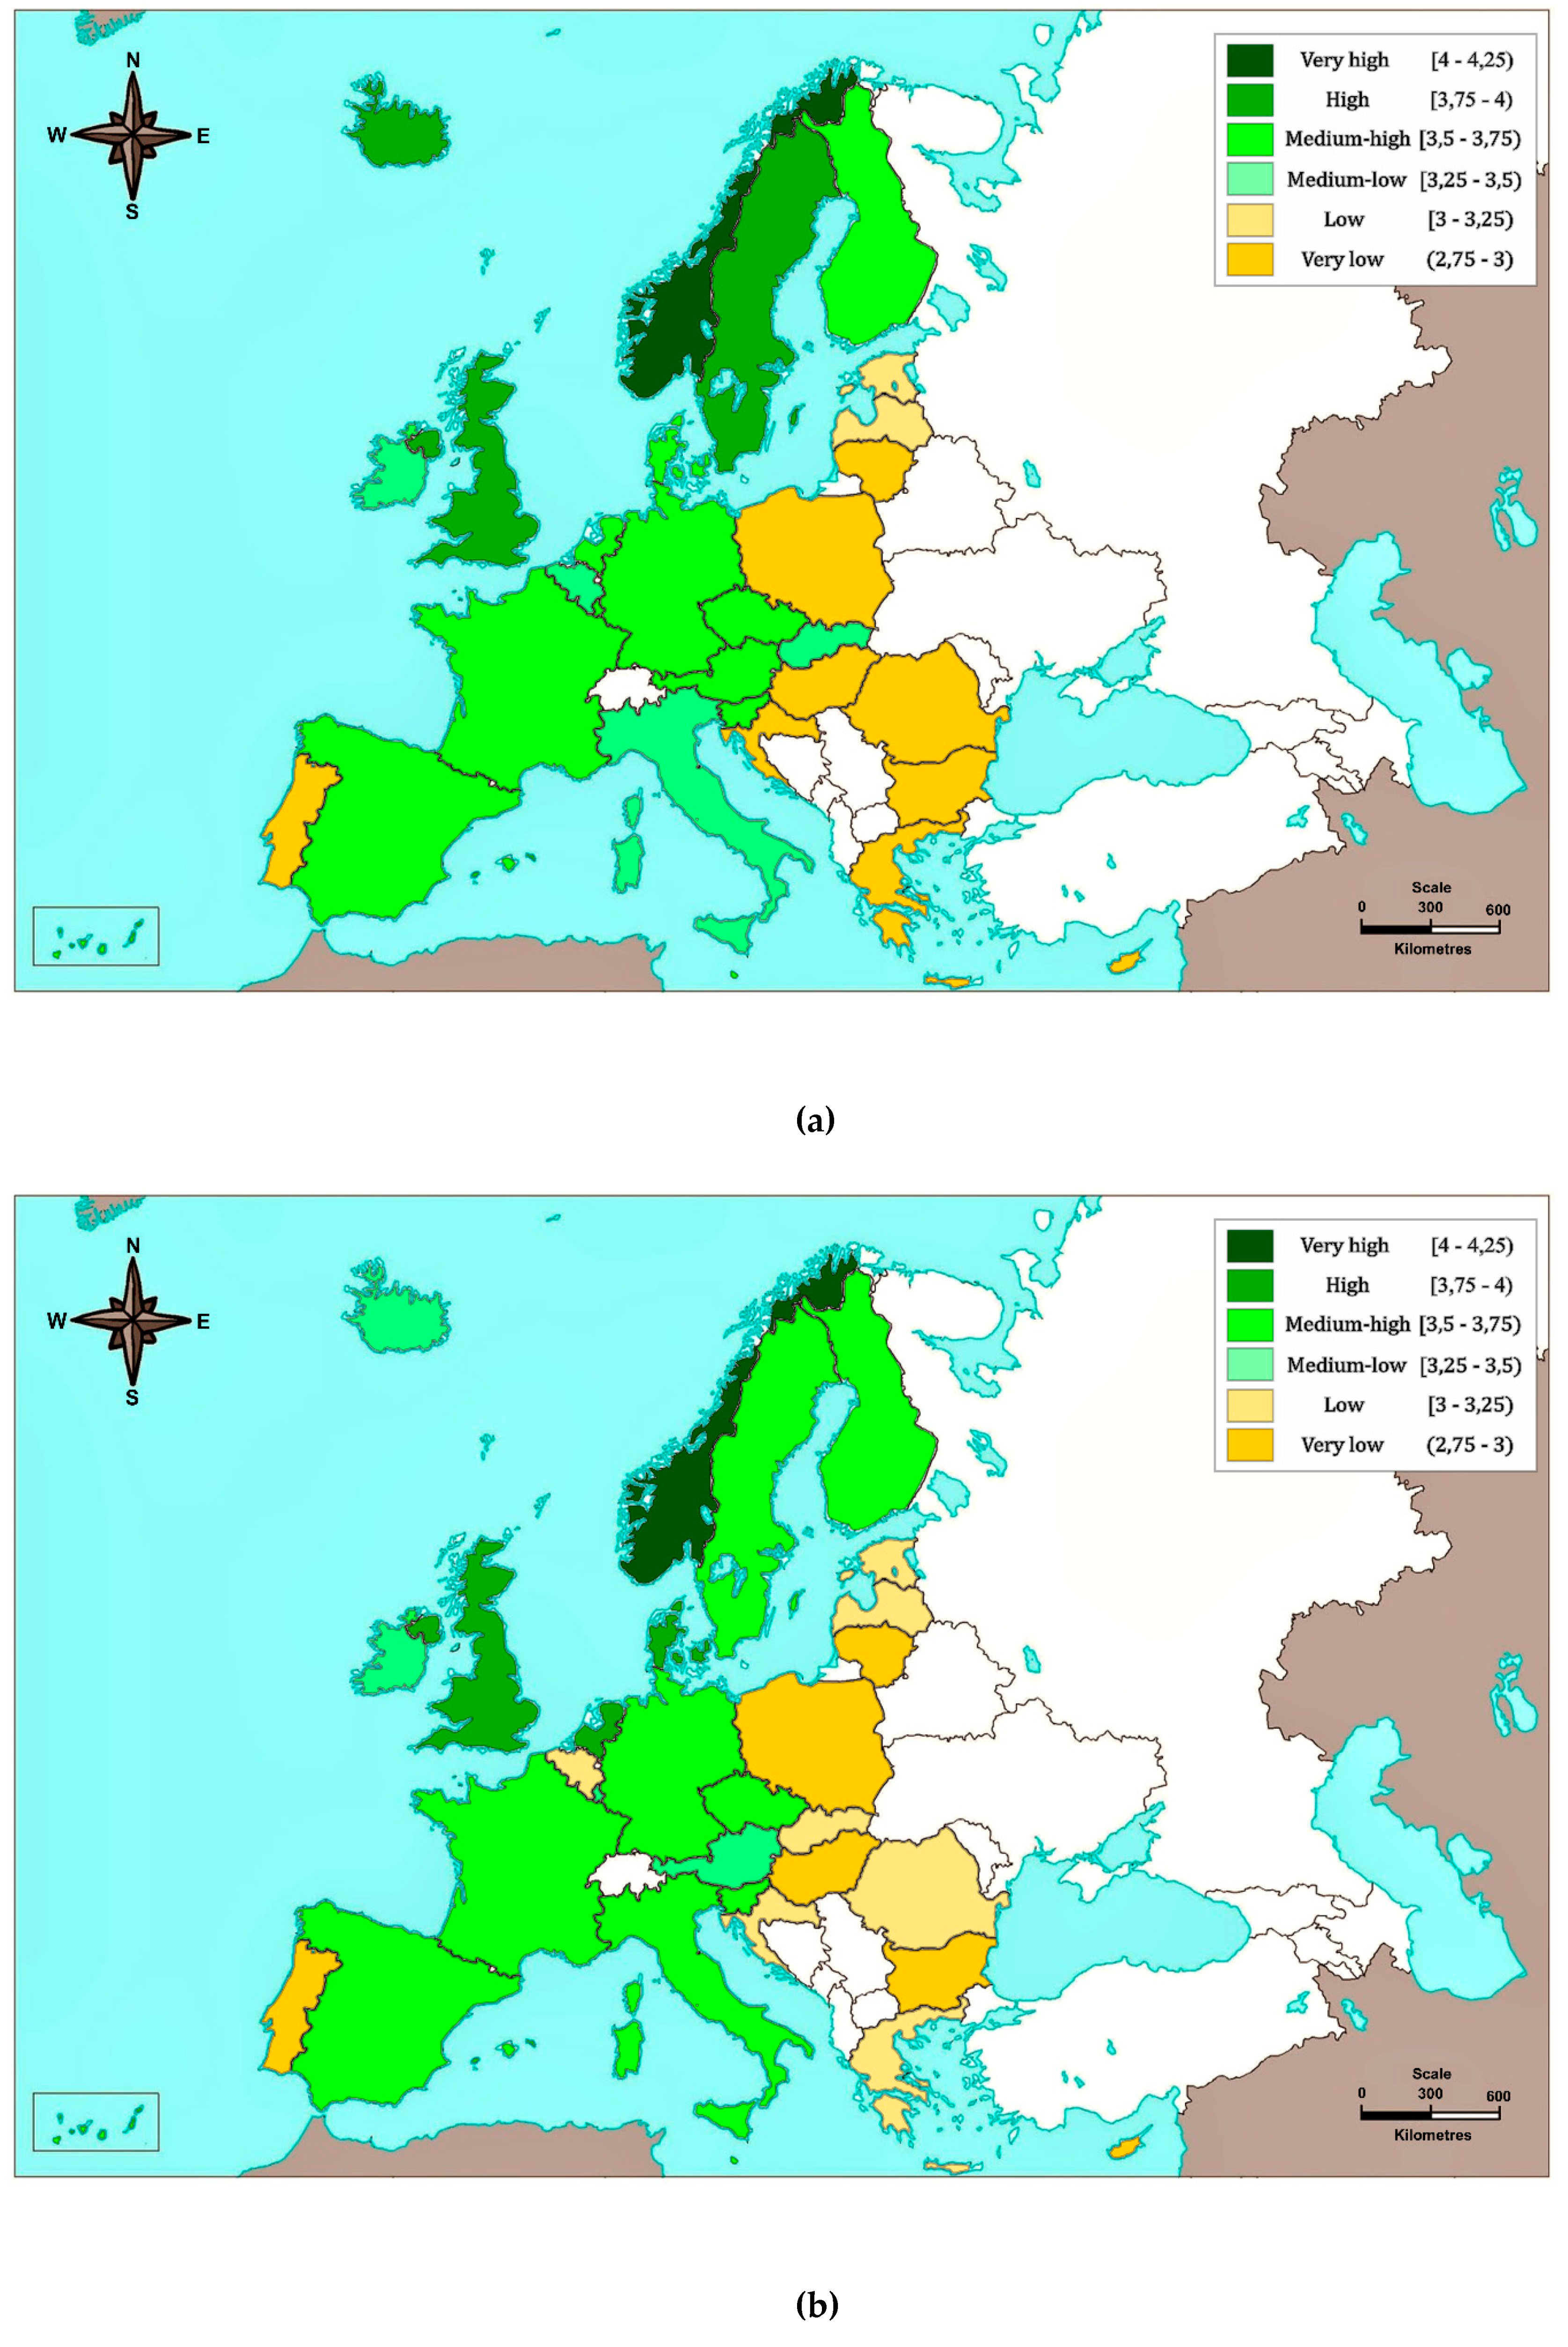
Once the weightings are determined, the moving weighted average is calculated by taking the product of these and the chronological valuations of each alternative. In this way, a single value is obtained for each country, and a ranking can be established to define the levels of sustainability and compare graphically the relative sustainability of each country on the map (see Figure 12).
Figure 12 shows the different regions of sustainability clearly, with Norway as the epicenter of greatest value, and the other levels around it. It is thus possible to distribute countries by their level of sustainability:
- Very high sustainability: Norway,
- High sustainability: Sweden, Denmark, the United Kingdom and the Netherlands,
- Medium-high sustainability: Iceland, Finland, Luxembourg, Germany, and France,
- Medium-low sustainability: Ireland, Belgium, Spain, Italy, Malta, Czech Republic, Austria, and Slovenia,
- Low sustainability: Estonia, Latvia, and Slovakia,
- Very low sustainability: Portugal, Lithuania, Poland, Hungary, Croatia, Romania, Bulgaria, Greece, and Cyprus.
The country ranking is thus as follows: firstly, Norway (4.10), secondly the Netherlands (3.93), Denmark and the United Kingdom with the same value (3.85) in third place, Sweden in fourth, and Iceland (3.70) in fifth. In the worst positions are Croatia (2.98), Portugal, and Hungary with the same SD (2.96), Cyprus (2.94), Bulgaria and Romania with the same value (2.91), Lithuania (2.88), Greece (2.79), and in last place Poland (2.78).
The most notable behaviors by criterion are these:
- Socio-economic development: Germany is ahead of the rest, which makes sense as it is the biggest economic power in Europe. Their GDP is by far the largest, followed by the United Kingdom, France and Italy. However, Sweden, followed by Germany, are the countries with the highest value of household savings. This behavior is similar in all the countries in the subcriterion Employment rate among citizens with at least secondary education, although Croatia, Spain, and Greece stand out for their poor contributions to this subcriterion.
- Sustainable consumption and production: practically all the Eastern and Nordic countries have unfavorable results, while countries such as Italy, Spain, Luxembourg, or Cyprus show strongly. In addition, this is the only criterion in which Norway is at a clear disadvantage compared to the other countries.
- Social inclusion: Bulgaria, followed by Croatia, Greece and Romania, are the countries with the poorest behavior with respect to a population at risk of poverty; including the working population at risk of poverty, Romania is the one with the poorest results, some distance behind the other countries, followed by Greece, Spain, Italy, Luxembourg, Poland, and Portugal; Finland, on the other hand, stands out above the other countries on this criterion. In long-term unemployment, Greece, closely followed by Spain, and Croatia, are those with the worst behavior, all of them Southern European countries. Overall behavior in this criterion is much better in Northern European Countries, with Iceland standing out particularly, ahead of Norway, although Malta and the Czech Republic rather surprisingly appear between these two.
- Demographic change: by geographical areas, Northern European countries show better behavior in this criterion, although they are not the ones with the highest valuation, which are Ireland and France followed by Lithuania and Latvia. This is because France and Ireland have better results for annual fertility rate. The behavior of all these countries shows similar values in the medium term in the job market, although Ireland stand out, while Italy does worse than the other countries.
- Public health: The country with the healthiest lifestyles, awareness campaigns, education and research, is Spain, some way ahead of the other countries, due to its national public health system which contributes to satisfying the medical needs of the population; it is followed by the Czech Republic and the United Kingdom. The results in the Northern European countries are rather high because of their higher achievements in life expectancy, with Sweden standing out. On the other hand, the Eastern countries have the worst results, especially Latvia.
- Climate change and energy: all the countries in the North have high or very high valuations, serving as an example to be followed to the other nations. On the other hand, the countries with the worst response are the United Kingdom, Spain, Luxembourg, and Malta.
- Sustainable transport: the countries that are most aware of sustainable mobility are the Eastern European countries (Slovakia, Estonia, Latvia, and Hungary) and Western European countries (Austria, Holland, France and the United Kingdom). Estonia and Slovenia stand out ahead of the other countries in energy consumption by international air transport. It should be pointed out that all the countries have a similar official measure of inflation in the prices of fuels and lubricants, as they are all affected similarly by the price of oil. In addition, all the countries show similar behavior in percentage use of trains and cars, with the Western countries, and especially Austria, Holland, Hungary and France. The Southern countries such as Greece, Cyprus, Malta and Slovenia, on the other hand, have poorer outcomes.
- Global alliance for development: this is the most unbalanced of all the criteria, showing the imbalance between funding and aid provided by international organizations. Germany has poorer results in this criterion, followed to Holland, Sweden, the United Kingdom, Norway and Denmark, and the weakest are all the Eastern countries, Iceland, Malta, and Cyprus.
- Good policies: Denmark leads in government measures aimed at sustainable development, followed by Greece and Italy. This is due largely to the subcriterion Implicit tax on energy in relation to final consumption. Iceland, by contrast, has the poorest outcomes, followed by Slovakia, Belgium, and the Czech Republic, which shows no clear relationship to geographical areas.
The results establish Norway as the reference to be followed in order for the other countries to become more sustainable.
The model could serve as a guide to any country that wants to increase its sustainability, identifying its strengths and weaknesses and pointing to the criteria that need to be improved.
6. Sensitivity Analysis
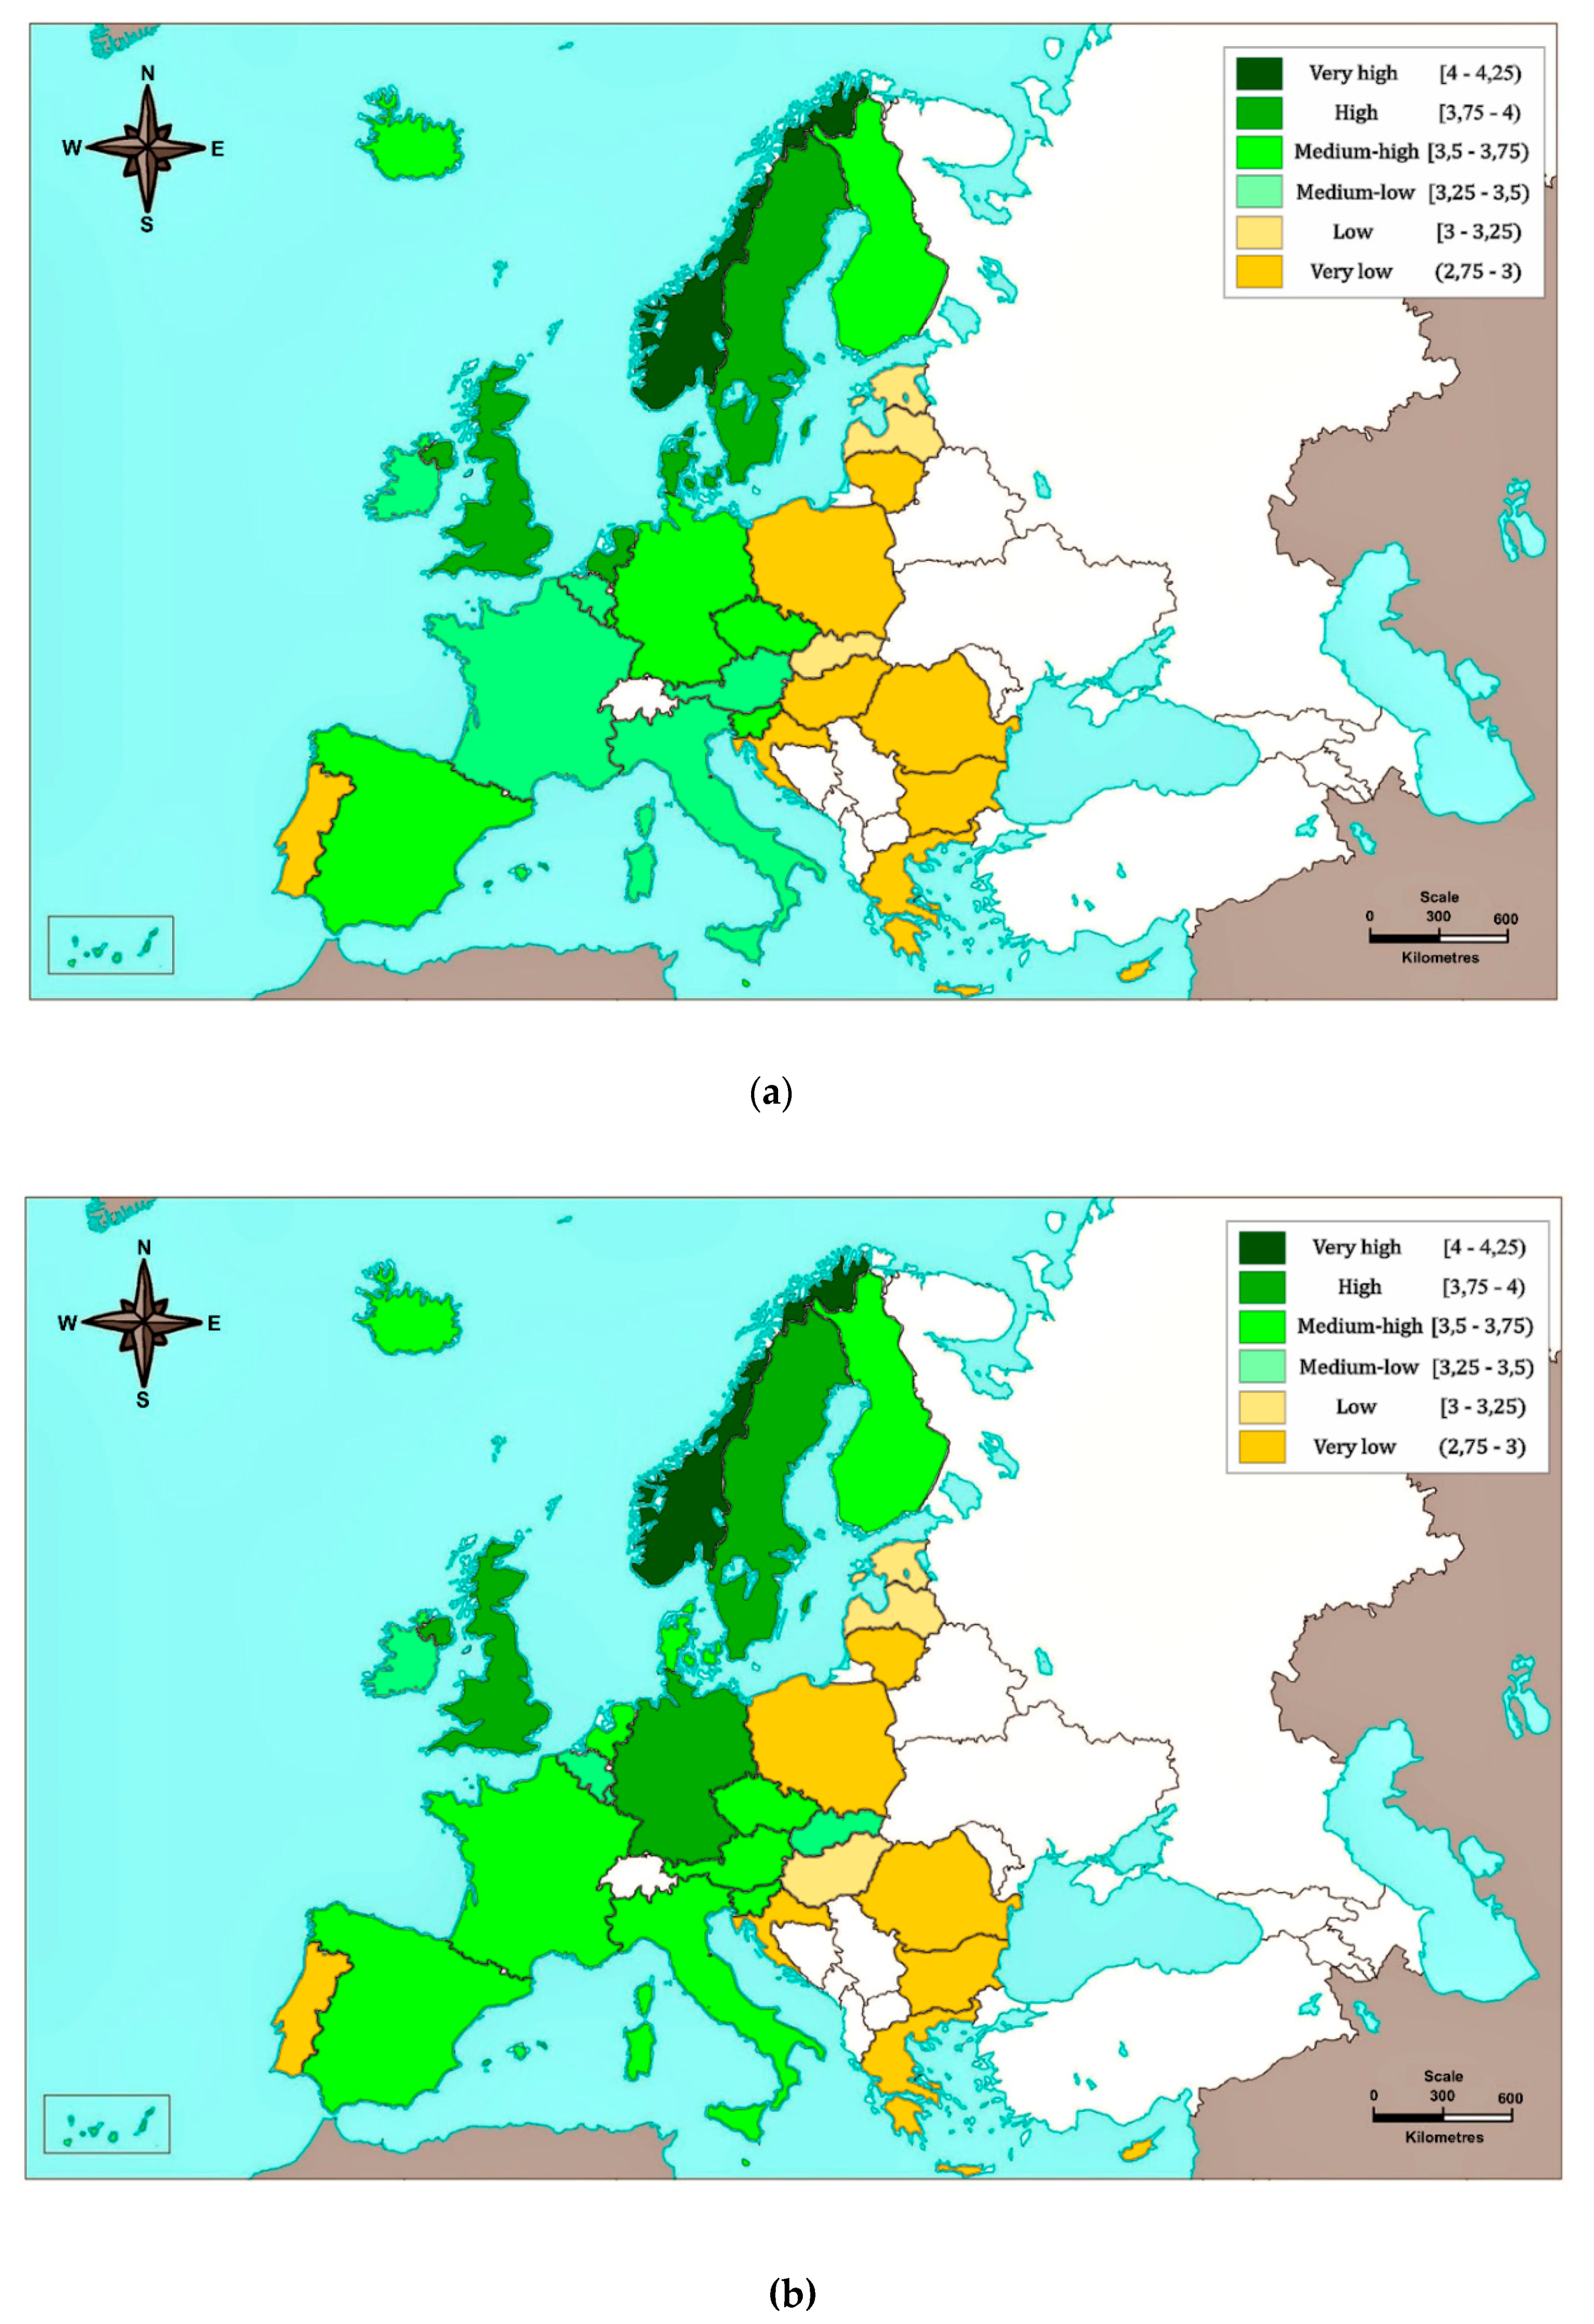
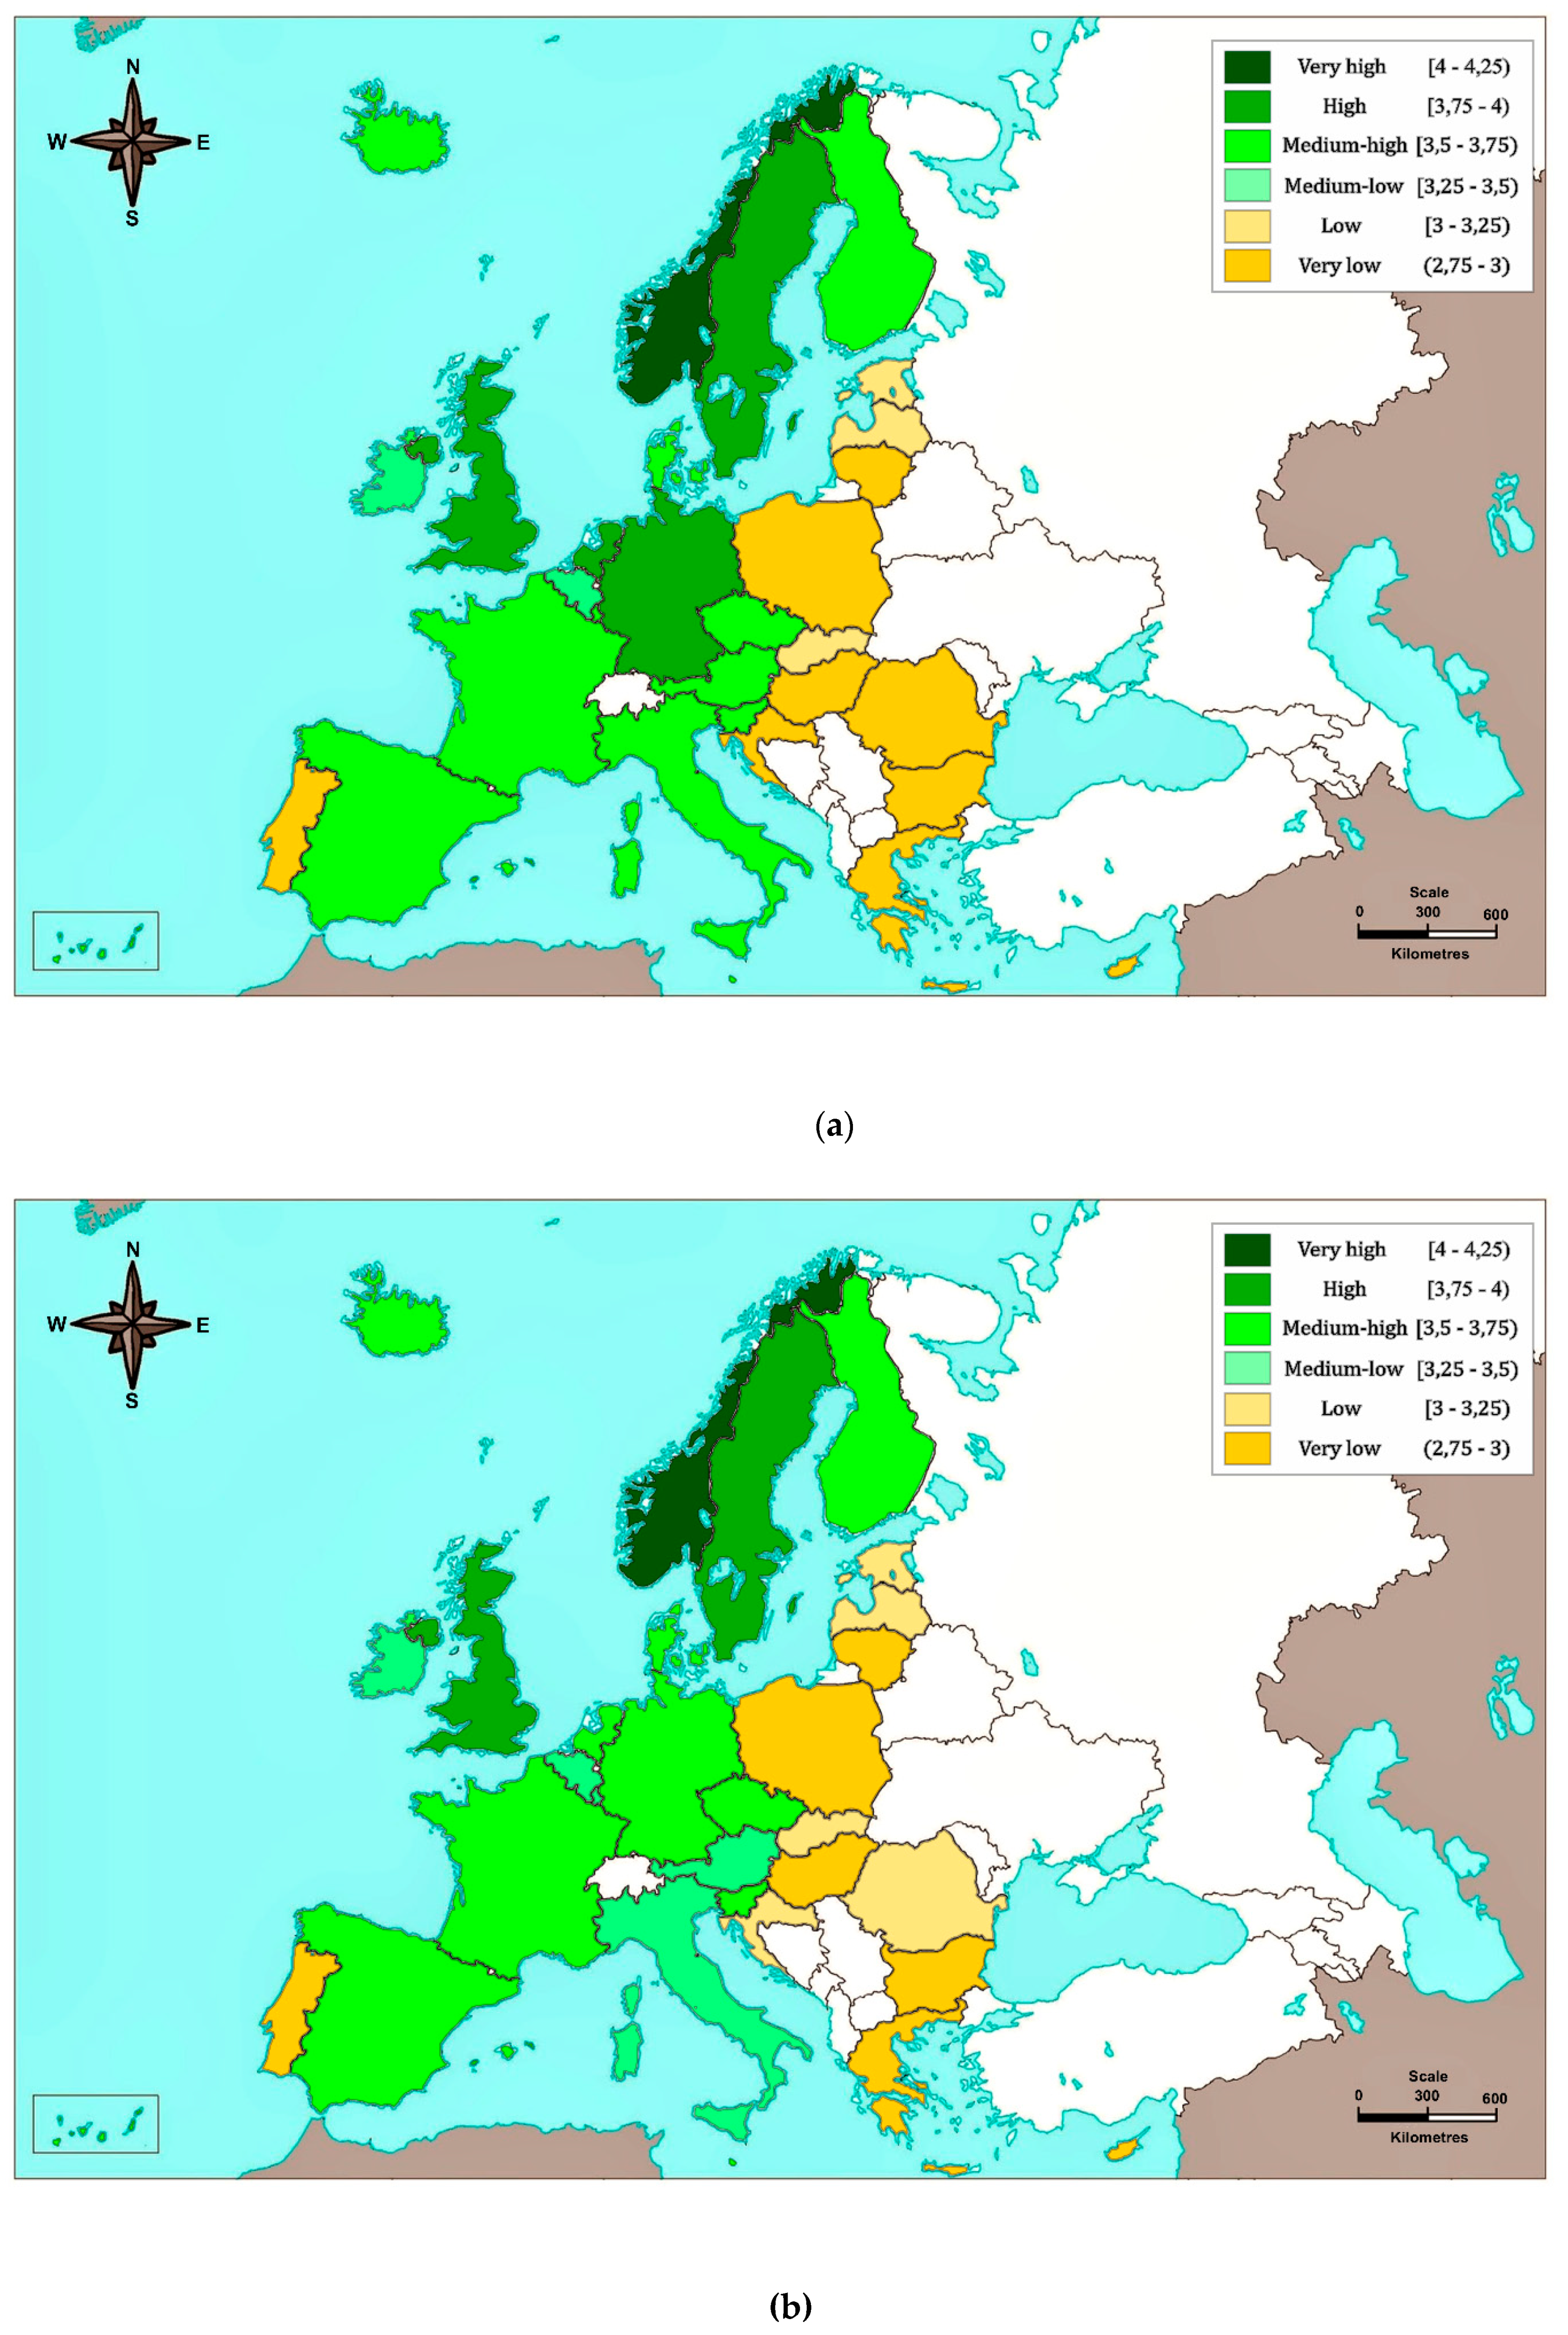
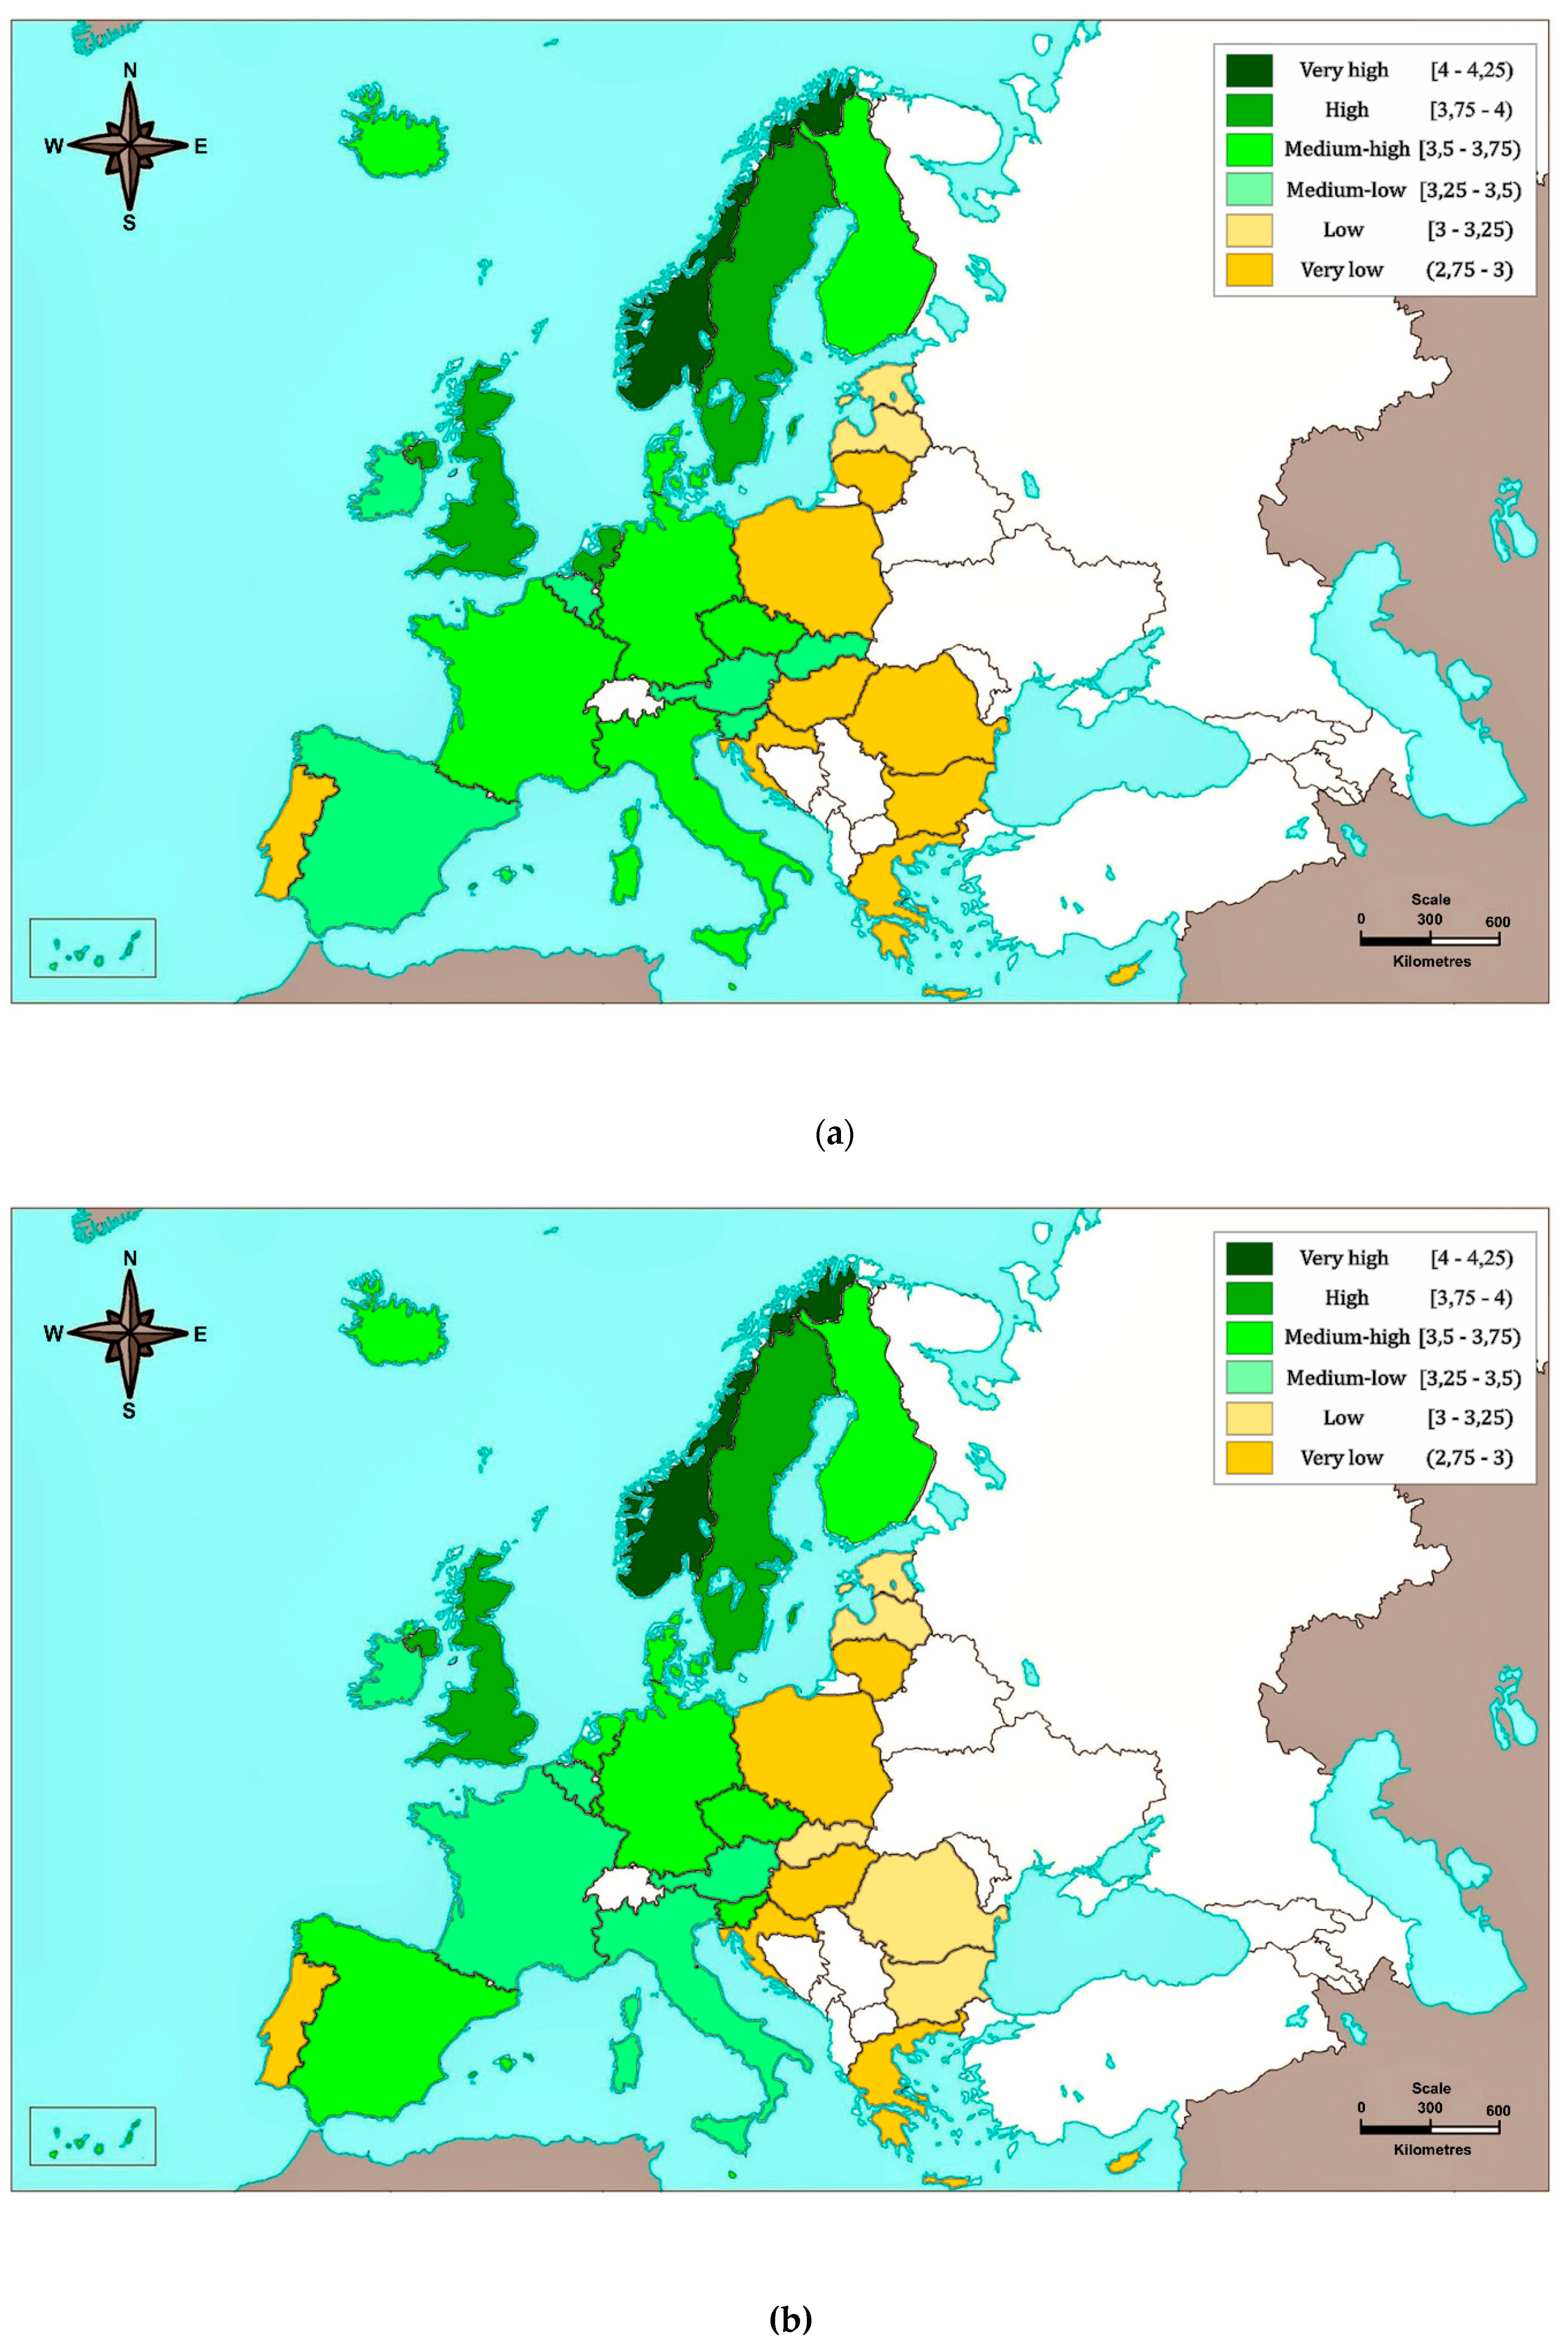
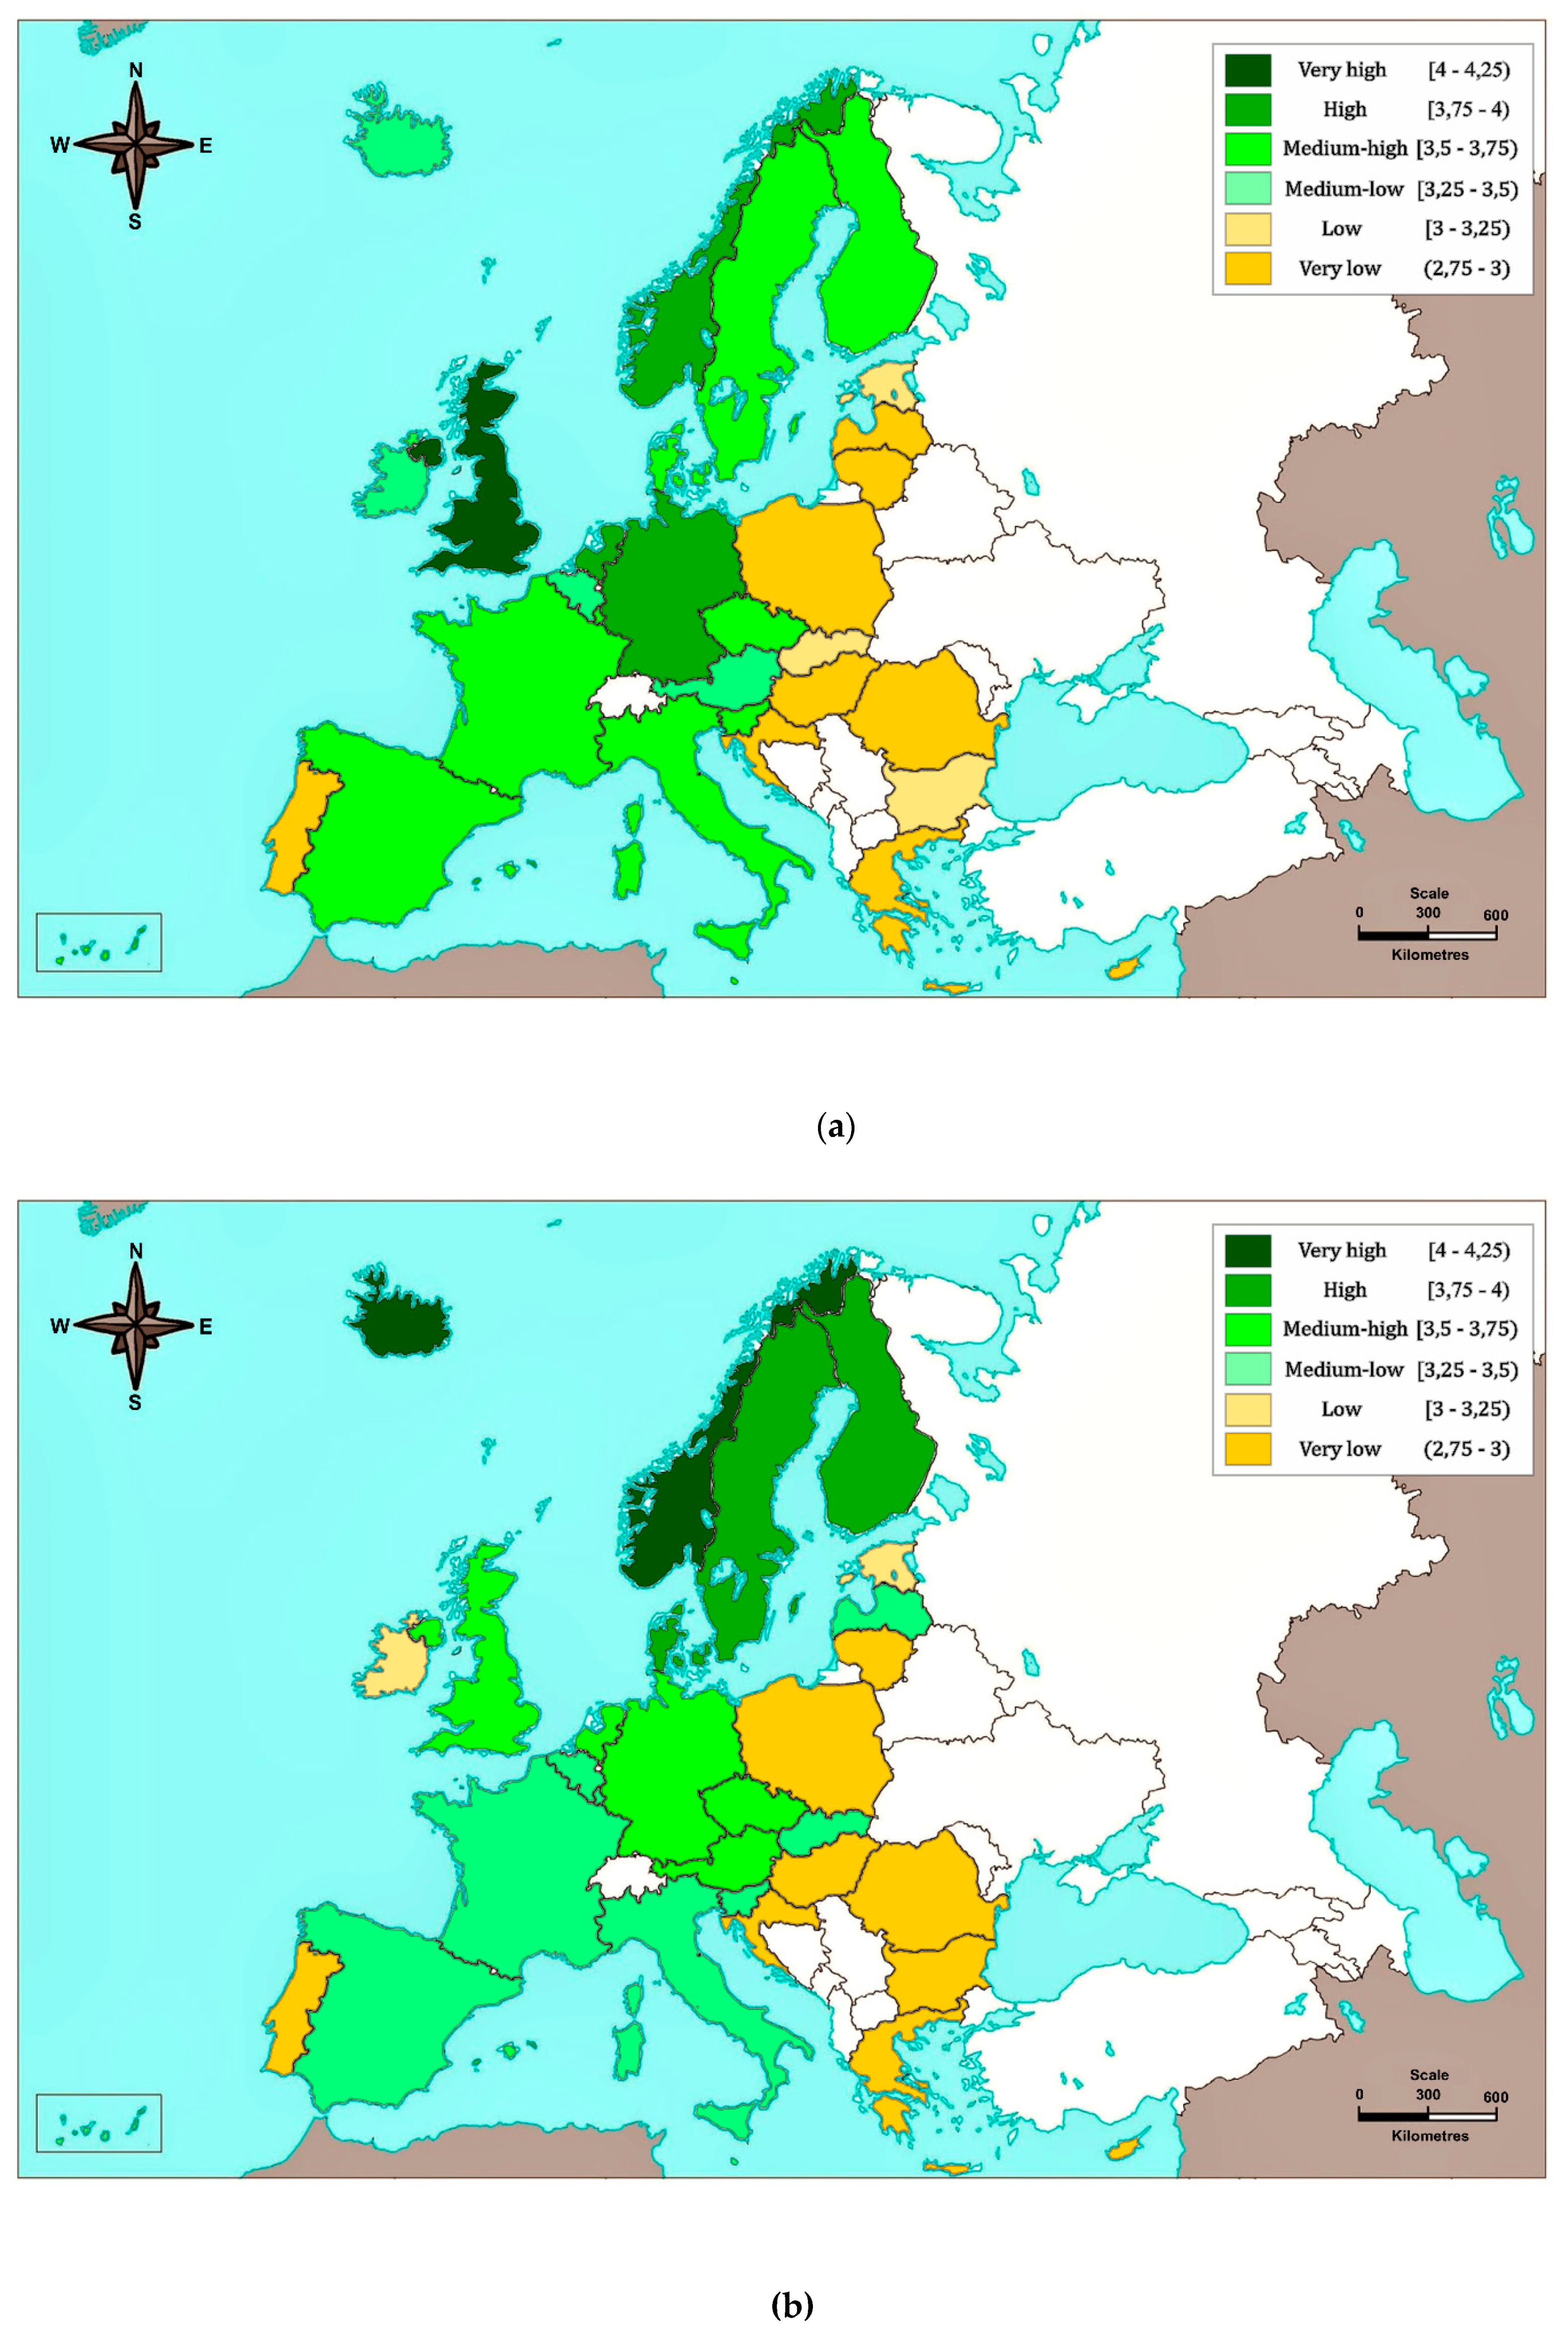
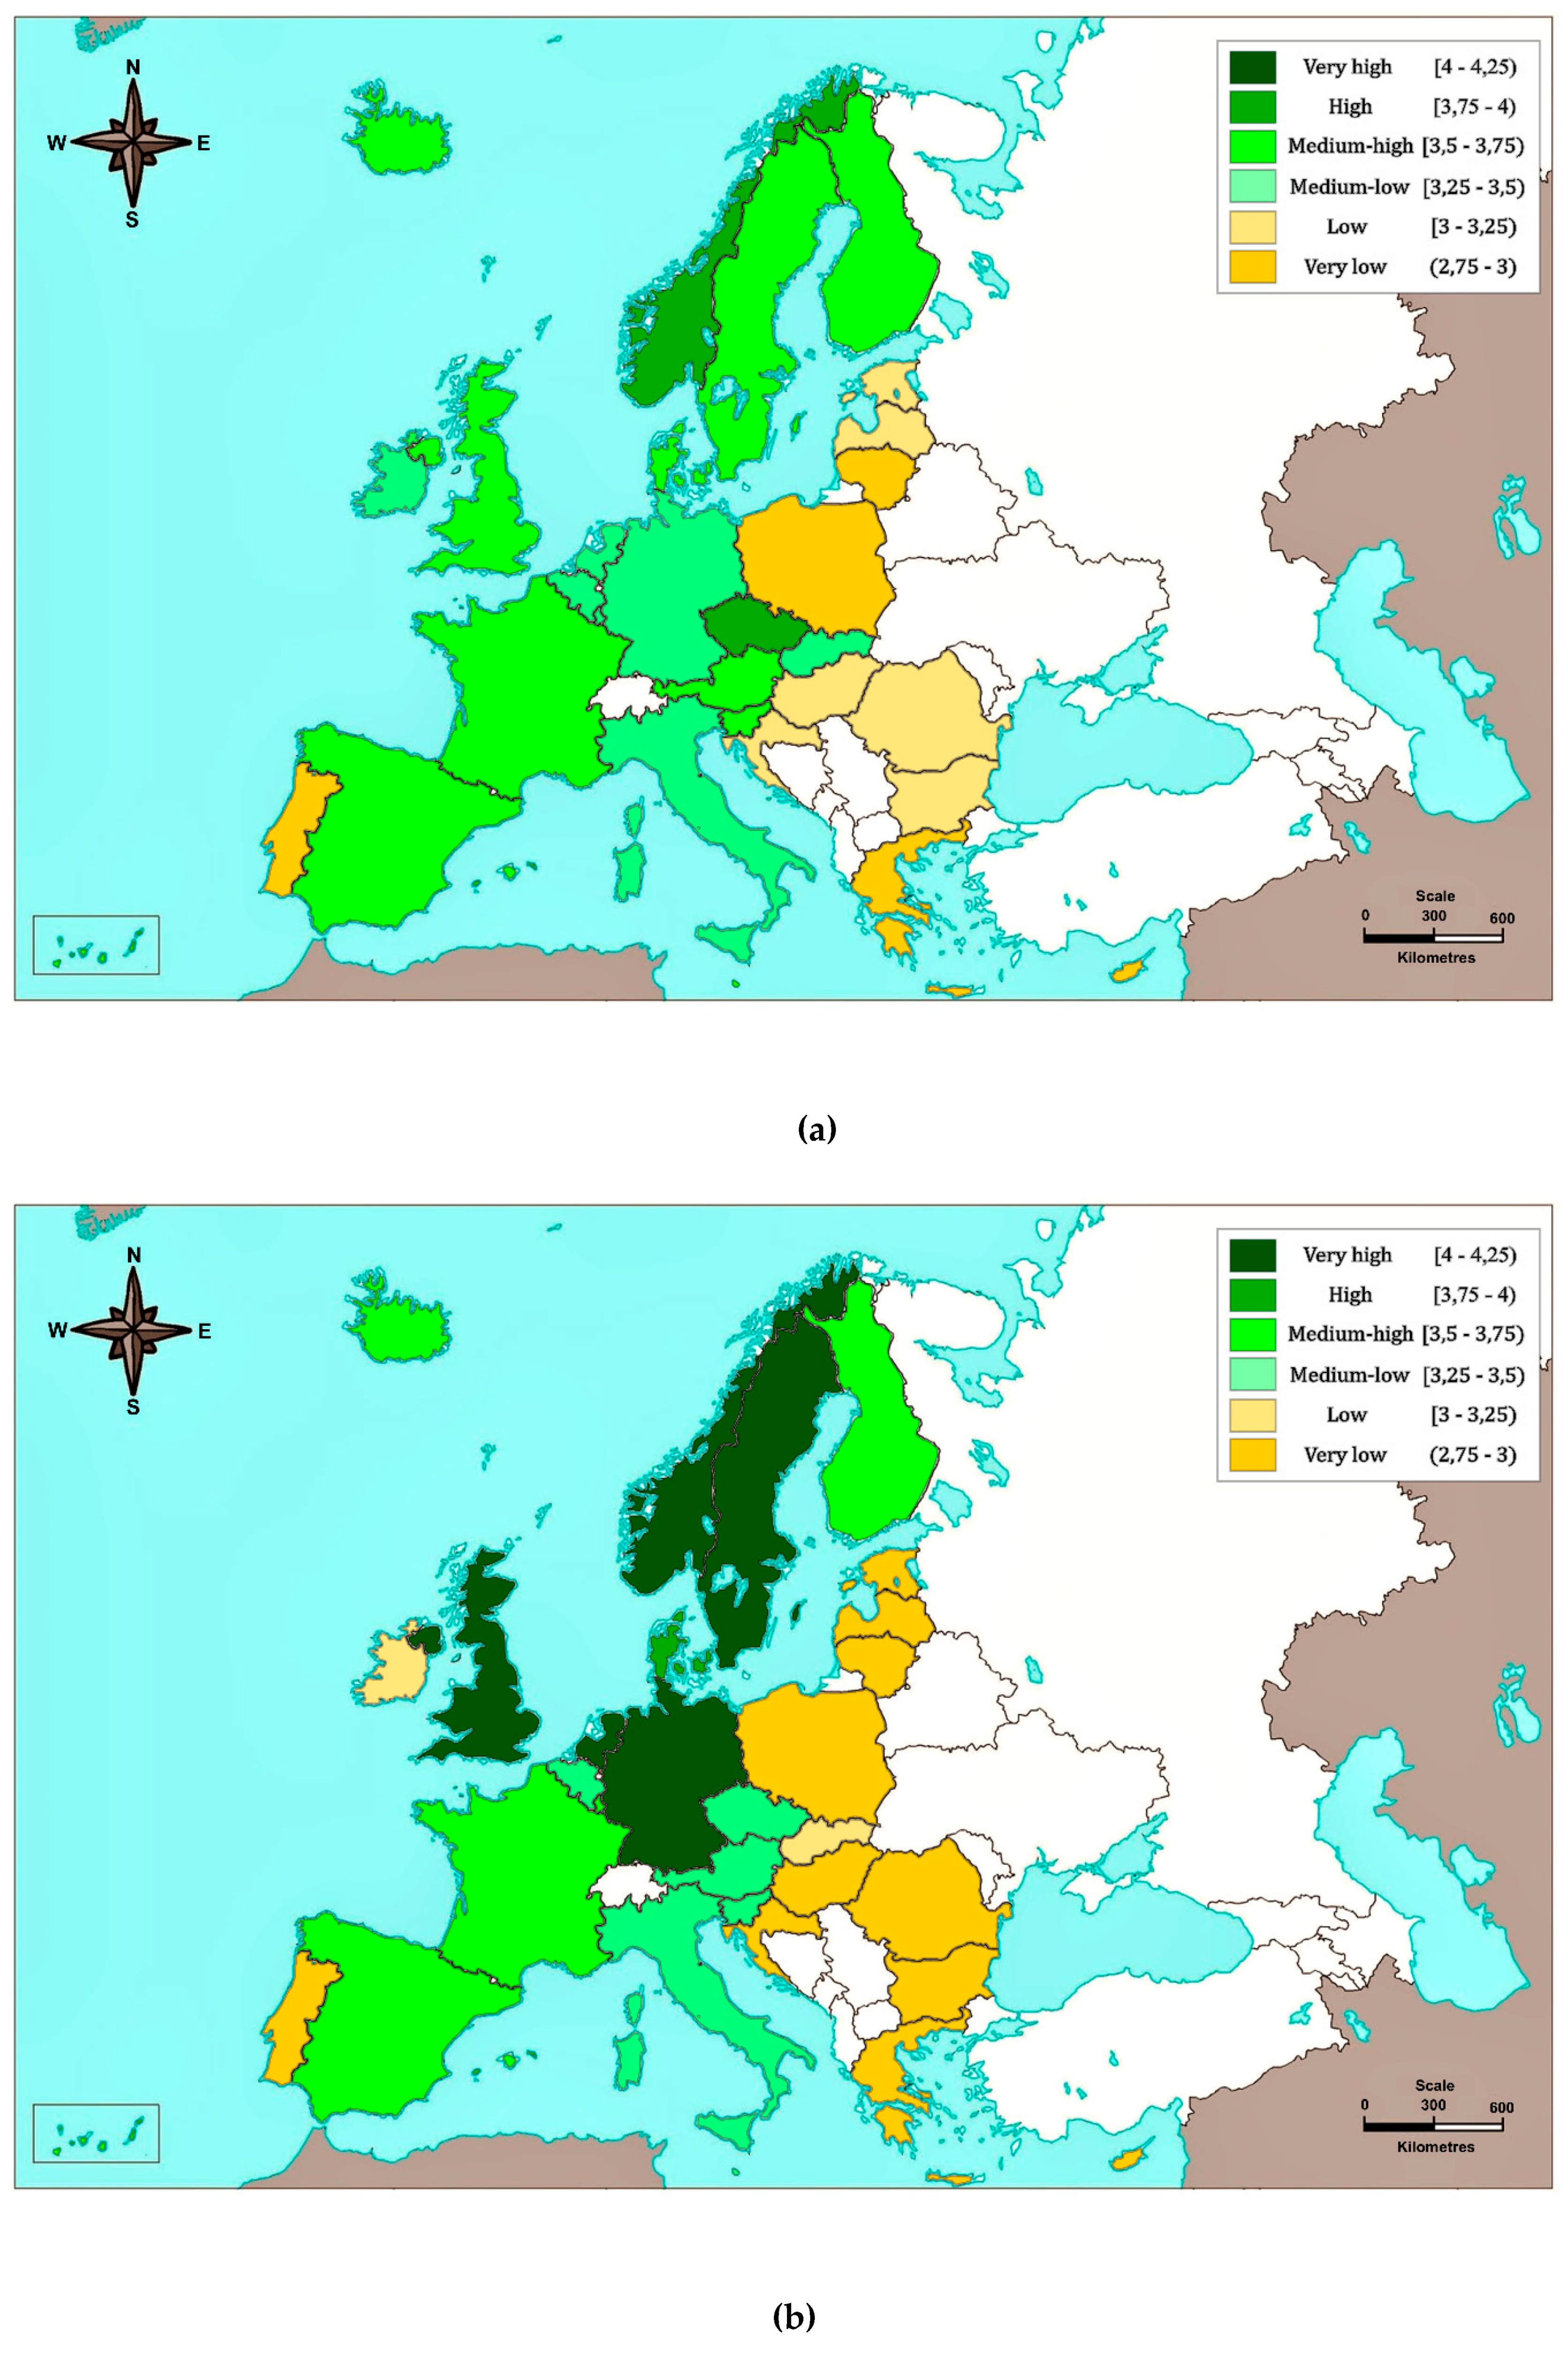
The sensitivity analysis allows the relative importance of the criteria to be identified, through the variation in the weightings. This was done by changing the weighting of each criterion, assigning values of ±5% and ±10% with respect to the base weighting, which means that, since the model comprises nine criteria, eighteen new studies must be performed for each period. Nevertheless, given that countries did not experience great changes in their evolution over time, the sensitivity analysis was only carried out for the most recent year (2015). The results of the sensitivity analysis for each criterion are shown in Figure 13, Figure 14, Figure 15, Figure 16, Figure 17, Figure 18, Figure 19, Figure 20 and Figure 21 for variations of ±10%. The values for the countries are quite close, and so the small differences in the weightings of the criteria can lead to a country’s classification varying its position to a higher or lower one, but quantitatively it is seen that the variations in sustainable development would be ±0.1 with variations in the weightings of the criteria of ±10%.
For modifications in the weightings of the criteria of ±5%, we see that the three leading countries, Norway, the United Kingdom, and Sweden, do not change position by varying Socio-economic development, Social inclusion, Demographic change, Public health, Sustainable transport, and Good policies; in Sustainable consumption and production, Norway and the United Kingdom keep their positions, although Luxembourg passes Sweden with an increase of 5% in this criterion. With increases of 5% in the weighting of Global alliance for development, Norway, United Kingdom, and Sweden tie for first place. Thus, Norway is still the country with the highest sustainability in all cases.
The three leading countries, Norway, the United Kingdom, and Sweden, do not change position with variations in the weightings of the criteria of ±10% in Socio-economic development, Demographic change, Public health, and Good policies. Norway, the United Kingdom, and Malta, with increases of 10% in Sustainable consumption and production, would have the same result, and only Luxembourg would surpass these countries. Norway is still the leader with a variation of −10% in this criterion. With a decrease of 10% in Climate change and energy, the United Kingdom surpasses Norway, while Sweden passes the United Kingdom for increases of 10%, with Norway still in first place. In Sustainable transport, the United Kingdom and Sweden would be equal in the classification for increases of 10%, with Norway still in first place. In Social inclusion, Iceland overtakes Sweden for third place and ties with the United Kingdom for increases of 10%, but Norway is still in first place. It should be remembered that a variation of ±10% in the weightings of the criteria leads to great variation, and, even so, Norway, the United Kingdom, and Sweden are still in first place, a few specific exceptions.
Therefore, the model is robust in the face of variations in the criteria of ±5%, and with a few exceptions, also in the case of variations of ±10%.
7. Conclusions
Despite the large number of contributions in the literature that analyze SD in countries and cities, there are no contributions analyzing this question in EU countries with objective analytic techniques, such as MCDM techniques. This study has, therefore, developed a multi-criteria model to evaluate SD in EU countries using AHP. The model evaluates EU countries (and Norway and Iceland), using a total of 39 indicators or subcriteria organized into the following criteria: socio-economic development, sustainable consumption and production, social inclusion, public health, demographic change, climate change and energy, sustainable transport, global alliance for development, and good policies. The assessment provided a full classification of countries via a single value, over the period 2005–2015.
The model was designed by performing a visual filter of the data available from the Eurostat database, followed by a double filter using the Pearson correlation coefficient for groups of subcriteria, and a final filter depending on the significance of the available information. These filters look at: scarcity of information, imprecise valuations, inaccurate data, and the need for MCDM techniques to guarantee independence between the subcriteria.
The model uses the judgements of four experts to weight the criteria and subcriteria, since, despite the recognized difficulty of assigning a weighting to these criteria/subcriteria, not all contribute equally to SD. To guarantee the robustness of the model and to ensure that a logical variation in the weightings assigned to the criteria will not alter the classification of countries, a sensitivity analysis was carried out. For modifications in the weightings of the criteria of ±5%, we see that Norway is still the country with highest sustainability in all cases, and the second placed country, the United Kingdom, does not change its position either, although it ties for first place with Norway and Sweden with increases of 5% in the criterion Global alliance. With respect to the variations in the weightings of the criteria of ±10%, the three leading countries, Norway, the United Kingdom, and Sweden, do not change position in most of the criteria, and there are only a few exceptional changes in a few positions. In any case, it can be seen that variations in Sustainable development would be at most ±0.1 with variations in the weightings of the criteria of ±10%. The model can therefore be considered sufficiently robust and gives greater reliability to the results obtained, unlike most of the studies that do not include this sensitivity analysis. This could lead to studies that assign weightings to the criteria, since they do not all contribute to the same degree to Sustainable development; moreover, to continue to assign a similar weighting could lead to a greater error than assigning different weightings. At the same time, it is also expected that a group of experts from different fields, and, if possible, under the umbrella of the UN, issues an agreement on the possible importance of each criterion or indicator related to SDG.
Besides the evolution over time of SD in the 30 countries studies, the model returns a single value for SD, taking into account the past record of each country using a moving weighted average of the valuations for each country; this technique allows the results of the full history to be used, giving greater importance to those that come from more recent periods. The weightings used at each period were calculated as the first eleven terms of a first order exponential smoothing.
The AHP methodology, which gives relative results by percentages, has allowed the existence of different levels of sustainability to be detected across the continent. These levels are identified by areas of sustainability, where the highest value is found in Norway, and the rest form rings of sustainability around it, such that the further a country is from Norway, the more its sustainability decreases.
The model could serve to identify the strengths and weaknesses of each country in the field of sustainability, and, by analyzing the measures taken by Norway and other countries with very high sustainability, and by continuous improvement processes, they can achieve similar levels of sustainability.
In future work, the intention is to build another multi-criteria model, applying different filter techniques to those used in this study, and to use a different technique to obtain the weightings (for example the Delphi method), as well as using a greater number of experts. It is also hoped to apply other multi-criteria methodologies, such as the Measuring Attractiveness by a Categorical Based Evaluation Technique (MACBETH) approach, or the Preference Ranking Organization METHod for Enrichment of Evaluations (PROMETHEE), and fuzzy logic to compare the results with those found by this study. It would also be interesting to update the model with the new data available from the Eurostat database as new data are included.
Author Contributions
Conceptualization, M.C.C.; methodology, C.J.M. and M.C.C.; software, C.J.M.; formal analysis, C.J.M. and M.C.C.; investigation, C.J.M. and M.C.C.; data curation, C.J.M.; Visualization, C.J.M.; writing—original draft preparation, M.C.C.; writing—review and editing, M.C.C.; funding acquisition, M.C.C.
Funding
This research was funded by the University of Castilla-La Mancha and the European Union through the European Regional Development Fund to the Predictive Analysis Laboratory (PREDILAB) group (2019-GRIN-27187).
Conflicts of Interest
The authors declare no conflict of interest.
References
- WCED. Our Common Future; Brundtland Report; World Commission on Environment and Development: Oxford University Press: Oxford, UK, 1987. [Google Scholar]
- Nebel, B.J.; Wright, R.T.; Dávila, F.J. Ciencias Ambientales: Ecología y Desarrollo Sostenible; Prentice Hall: Mexico City, Mexico, 1999. [Google Scholar]
- Olawumi, T.O.; Chan, D.W.M. A scientometric review of global research on sustainability and sustainable development. J. Clean. Prod. 2018, 183, 231–250. [Google Scholar] [CrossRef]
- Sala, S.; Ciuffo, B.; Nijkamp, P. A systemic framework for sustainability assessment. Ecol. Econ. 2015, 119, 314–325. [Google Scholar] [CrossRef]
- Singh, R.K.; Murty, H.R.; Gupta, S.K.; Dikshit, A.K. An overview of sustainability assesment methodologies. Ecol. Indic. 2012, 15, 281–299. [Google Scholar] [CrossRef]
- Hacking, T.; Guthrie, P. A framework for clarifying the meaning of triple bottom-line, integrated and sustainability assessment. Environ. Impact Assess. Rev. 2008, 28, 73–89. [Google Scholar] [CrossRef]
- Huang, I.B.; Keisler, J.; Linkov, I. Multi-criteria decision analysis in environmental sciences: Ten years of applications and trends. Sci. Total Environ. 2011, 409, 3578–3594. [Google Scholar] [CrossRef] [PubMed]
- Wątróbski, J.; Ziemba, P.; Jankowski, J.; Zioło, M. Green Energy for a Green City—A Multi-Perspective Model Approach. Sustainability 2016, 8, 702. [Google Scholar] [CrossRef]
- Parvez, N.; Agrawal, A. Assessment of sustainable development in technical higher education institutes of India. J. Clean. Prod. 2019, 214, 975–994. [Google Scholar] [CrossRef]
- Yoon, B.; Shin, J.; Lee, S. Technology assessment model for sustainable development of LNG terminals. J. Clean. Prod. 2018, 172, 927–937. [Google Scholar] [CrossRef]
- Opon, J.; Henry, M. An indicator framework for quantifying the sustainability of concrete materials from the perspectives of global sustainable development. J. Clean. Prod. 2019, 218, 718–737. [Google Scholar] [CrossRef]
- Xu, X.; Wang, Y.; Tao, L. Comprehensive evaluation of sustainable development of regional construction industry in China. J. Clean. Prod. 2019, 211, 1078–1087. [Google Scholar] [CrossRef]
- Cardoso de Oliveira, G.; Ferreira, J.M.; Cesar, P.; Gaiola de Oliveira, A.; Cezar, W. Cleaner Production in the textile industry and its relationship to sustainable development goals. J. Clean. Prod. 2019, 228, 1514–1525. [Google Scholar] [CrossRef]
- Xu, X.; Gao, J.; Zhang, Z.; Fu, J. An assessment of Chinese Pathways to implement the UN sustainable development goal-11 (SDG-11)-A Case study of the Yangtze River Delta urban Agglomeration. Int. J. Environ. Res. Public Health 2019, 16, 2288. [Google Scholar] [CrossRef] [PubMed]
- United Nations. Global Sustainable Development Report 2016; Department of Economic and Social Affairs: New York, NY, USA, 2016. [Google Scholar]
- United Nations (UN). The Sustainable Development Goals Report 2018; United Nations: New York, NY, USA, 2018. [Google Scholar]
- Sustainable Development Solutions Network. Indicators and a Monitoring Framework for the Sustainable Development Goals; Sustainable Development Solutions Network: New York, NY, USA, 2015. [Google Scholar]
- Togtokh, C.; Gaffney, O. Human Sustainable Development Index; Web-Magazine of the United Nations University; United Nations University: Tokyo, Japan, 2010; Available online: https://ourworld.unu.edu/en/the-2010-human-sustainable-development-index (accessed on 21 August 2019).
- Chen, S.; Huang, Q.; Liu, Z.; Meng, S.; Yin, D.; Zhu, L.; He, C. Assessing the Regional Sustainability of the Beijing-Tianjin-Hebei Urban Agglomeration from 2000 to 2015 Using the Human Sustainable Development Index. Sustainability 2019, 11, 3160. [Google Scholar] [CrossRef]
- Lim, S.S.; Fullman, N.; Murray, C.J.L.; Kutz, M.J.; Goldberg, E.M.; Pigott, D.M.; Allen, K.; Bhutta, Z.A.; Dandona, L.; Forouzanfar, M.H.; et al. Measuring the health-related sustainable development goals in 188 countries: A baseline analysis from the global burden of disease study 2015. Lancet 2016, 388, 1813–1850. [Google Scholar] [CrossRef]
- Sachs, J.; Schmidt-Traub, G.; Kroll, C.; Durand-Delacre, D.; Teksoz, K. SDG Index and Dashboards—Global Report; Bertelsmann Stiftung and Sustainable Development Solutions Network: New York, NY, USA, 2016. [Google Scholar]
- Sachs, J.; Schmidt-Traub, G.; Kroll, C.; Durand-Delacre, D.; Teksoz, K. SDG Index and Dashboards Report 2017; Bertelsmann Stiftung and Sustainable Development Solutions Network (SDSN): New York, NY, USA, 2017. [Google Scholar]
- Sachs, J.; Schmidt-Traub, G.; Kroll, C.; Lafortune, G.; Fuller, G. SDG Index and Dashboards Report 2018; Bertelsmann Stiftung and Sustainable Development Solutions Network (SDSN): New York, NY, USA, 2018. [Google Scholar]
- Sachs, J.; Schmidt-Traub, G.; Kroll, C.; Lafortune, G.; Fuller, G. Sustainable Development Report 2019; Bertelsmann Stiftung and Sustainable Development Solutions Network (SDSN): New York, NY, USA, 2019. [Google Scholar]
- Clark, C.M.A.; Kavanagh, C. Sustainable Progress Index 2017; Social Justice Ireland: Dublin, Ireland, 2017. [Google Scholar]
- Clark, C.M.A.; Kavanagh, C. Sustainable Progress Index 2019; Social Justice Ireland: Dublin, Ireland, 2019. [Google Scholar]
- Fullman, N.; Barber, R.M.; Abajobir, A.A.; Abate, K.H.; Abbafati, C.; Abbas, K.M.; AbdAllah, F.; Abdulle, A.M.; Abera, K.M.; Aboyans, V.; et al. Measuring progress and projecting attainment on the basis of past trends of the health-related sustainable development goals in 188 countries: An analysis from the global burden of disease study 2016. Lancet 2017, 390, 1423–1459. [Google Scholar] [CrossRef]
- Campagnolo, L.; Eboli, F.; Farnia, L.; Carraro, C. Supporting the UN SDGs transition: Methodology for sustainability assessment and current worldwide ranking. Econ. Open-Access 2018, 12, 1–31. [Google Scholar] [CrossRef]
- Huan, Y.; Li, H.; Liang, T. A New Method for the Quantitative Assessment of Sustainable Development Goals (SDGs) and a Case Study on Central Asia. Sustainability 2019, 11, 3504. [Google Scholar] [CrossRef]
- European Commission Eurostat. EU SDG Indicator Set. Eurostat, 31 May 2017. Available online: https://ec.europa.eu/eurostat/documents/276524/7736915/EU-SDG-indicator-set-with-cover-note-170531.pdf (accessed on 22 August 2019).
- Eurostat. Eurostat: Your Key to European Statistics. 2017. Available online: http://ec.europa.eu/eurostat/en/data/database (accessed on 13 September 2017).
- Eurostat. Sustainable Development in the European Union: 2017 Monitoring Report on Progress towards the SDGs in an EU Context; Publications Office of the European Union: Luxembourg, 2017. [Google Scholar]
- RobecoSAM. Country Sustainability Ranking Update—November 2018. Available online: https://www.robecosam.com/en/key-strengths/country-sustainability-ranking.html (accessed on 20 August 2019).
- Sustainable Society Index—Your Compass to Sustainability. Available online: http://www.ssfindex.com (accessed on 21 August 2019).
- Sustainable Society Index. Ranking List 2016. Available online: http://www.ssfindex.com/results/ranking-all-countries/ (accessed on 20 August 2019).
- Environmental Performance Index. Available online: https://epi.envirocenter.yale.edu/epi-topline (accessed on 20 august 2019).
- Tsai, W.T. Energy sustainability from analysis of sustainable development indicators: A case study in Taiwan. Renew. Sustain. Energy Rev. 2010, 14, 2131–2138. [Google Scholar] [CrossRef]
- Widomski, M.K.; Glen, P.; Łagód, G.; Jaromin, K.M. Sustainable Development of One of the Poorest Province of the European Union: Lublin Voivodeship, Poland—Attempt of Assessment. Probl. Sustain. Dev. 2015, 10, 137–149. [Google Scholar]
- Kroll, C. Sustainable Development Goals: Are the Rich Countries Ready; Bertelsmann Stiftung: Gutersloh, Germany, 2015. [Google Scholar]
- Park, Y.S.; Egilmez, G.; Kucukvar, M. A novel life cycle-based principal component analysis framework for eco-Efficiency analysis: Case of the United States manufacturing and transportation nexus. J. Clean. Prod. 2015, 92, 327–342. [Google Scholar] [CrossRef]
- Sueyoshi, T.; Yuan, Y. China’s regional sustainability and diversified resource allocation: DEA environmental assessment on economic development and air pollution. Energy Econ. 2015, 49, 239–256. [Google Scholar] [CrossRef]
- Bilbao, A.; Arenas, M.; Cañal, V.; Antomil, J. Using TOPSIS for assessing the sustainability of government bond funds. Omega 2014, 49, 1–17. [Google Scholar] [CrossRef]
- Bilbao-Terol, A.; Arenas-Parra, M.; Cañal-Fernández, V. A fuzzy multi-objective approach for sustainable investments. Expert Syst. Appl. 2012, 39, 10904–10915. [Google Scholar] [CrossRef]
- Shi, Y.; Ge, X.; Yuan, X.; Wang, Q.; Kellett, J.; Li, F.; Ba, K. An Integrated Indicator System and Evaluation Model for Regional Sustainable Development. Sustainability 2019, 11, 2183. [Google Scholar] [CrossRef]
- Shen, L.; Muduli, K.; Barve, A. Developing a sustainable development framework in the context of mining industries: AHP approach. Resour. Policy 2015, 46, 15–26. [Google Scholar] [CrossRef]
- Frini, A.; Amor, S.B. MUPOM: A multi-criteria multi-period outranking method for decision-making in sustainable development context. Environ. Impact Assess. Rev. 2019, 76, 10–25. [Google Scholar] [CrossRef]
- Saaty, T.L. The Analytic Hierarchy Process; McGraw-Hill: New York, NY, USA, 1980. [Google Scholar]
- García, A.; Martínez, E.; Del Campo, C.; López, J.M. Técnicas Multicriterio De Ayuda a La Decisión; Pearson: Madrid, Spain, 2013. [Google Scholar]
- Toskano, G.; Hurtado, B. El Proceso De Análisis Jerárquico (AHP) Como Herramienta Para La Toma De Decisiones En La Selección De Proveedores: Aplicación En La Selección Del Proveedor Para La Empresa Gráfica Comercial MyE S.R.L. Universidad Nacional Mayor De San Marcos; Facultad de Ciencias Matemáticas: Lima, Peru, 2005. [Google Scholar]
- Forman, E.H.; Selly, M.A. Decision by Objectives: How to Convince Others That You Are Right; World Scientific Publishing: Singapore, 2001. [Google Scholar]
- Saaty, T.L.; Vargas, L.G. Models, Methods, Concepts and Applications of the Analytic Hierarchy Process; Kluwer Academic Publishers: Boston, MA, USA, 2000. [Google Scholar]
- Aguarón, J.; Moreno, J.M. The Geometric consistency index: Approximated thresholds. Eur. J. Oper. Res. 2003, 147, 137–145. [Google Scholar] [CrossRef]
- Romero, C. Teoría De La Decisión Multicriterio. Conceptos, Técnicas y Aplicaciones; Alianza Universidad Textos: Madrid, Spain, 1993. [Google Scholar]
Figure 1.
Eurostat database classification.

Figure 2.
Study by a group of subcriteria of the criterion Climate change and energy.

Figure 3.
Reduction to a single trend of the subcriterion Intensity of greenhouse gas emissions in electrical consumption CCE-GEC.
Figure 3.
Reduction to a single trend of the subcriterion Intensity of greenhouse gas emissions in electrical consumption CCE-GEC.

Figure 4.
Results of the first filter for the criterion Climate change and energy.

Figure 5.
Results of the second filter in the criterion Climate change and energy.

Figure 6.
Final results for the criterion Climate change and energy.

Figure 7.
Hierarchical structure.

Figure 8.
Stages in obtaining the valuation matrices.

Figure 9.
Estimate of data for the criterion PHE-UMN for the alternative Croatia.

Figure 10.
Differentiation of the alternatives by geographical region.

Figure 11.
Results: (a) Northern European area; (b) Western European area. (c) Eastern European area; (d) Southern European area.
Figure 11.
Results: (a) Northern European area; (b) Western European area. (c) Eastern European area; (d) Southern European area.


Figure 12.
Sustainability map: results of Analytic Hierarchy Process (AHP) using the moving weighted average.
Figure 12.
Sustainability map: results of Analytic Hierarchy Process (AHP) using the moving weighted average.

Figure 13.
Sensitivity analysis for Socio-economic development: (a) variation −10%; (b) +10%.

Figure 14.
Sensitivity analysis for Sustainable consumption and production: (a) variation −10%; (b) +10%.
Figure 14.
Sensitivity analysis for Sustainable consumption and production: (a) variation −10%; (b) +10%.

Figure 15.
Sensitivity analysis for Social inclusion. (a) variation −10%; (b) +10%.

Figure 16.
Sensitivity analysis for Demographic change: (a) variation −10%; (b) +10%.

Figure 17.
Sensitivity analysis for Public health: (a) variation −10%; (b) +10%.

Figure 18.
Sensitivity analysis for Climate change and energy: (a) variation −10%; (b) +10%.

Figure 19.
Sensitivity analysis for Sustainable transport: (a) variation −10%; (b) +10%.

Figure 20.
Sensitivity analysis for Global alliance for development: (a) variation −10%; (b) +10%.

Figure 21.
Sensitivity analysis for good policies: (a) variation −10%; (b) +10%.


Table 1.
Evolution of number of subcriteria by visual filtering.
| Criteria | Initial Subcriteria | Subcriteria Discarded by Visual Filtering | Reduction |
|---|---|---|---|
| Socio-economic development (SED) | 19 | 14 | 26.32 |
| Sustainable consumption and production (SCP) | 25 | 20 | 20.00 |
| Social inclusion (SIN) | 23 | 15 | 34.78 |
| Demographic change (DCH) | 14 | 10 | 28.57 |
| Public health (PHE) | 12 | 4 | 66.67 |
| Climate change and energy (CCE) | 10 | 10 | 0.00 |
| Sustainable transport (STR) | 22 | 20 | 9.09 |
| Natural resources (NRE) | 11 | 2 | 81.82 |
| Global alliance for development (GAD) | 18 | 3 | 83.33 |
| Good policies (GPO) | 7 | 2 | 71.43 |
| Total | 161 | 94 | 41.61 |
Table 2.
Types of correlation as a function of r.
| Intensity of Correlation | Range of Values |
|---|---|
| Null | |
| Weak | |
| Moderate | |
| Strong | |
| Perfect |
Table 3.
Summary of filtering of subcriteria.
| Criterion | Visual Filter | Pearson Filter | Final Filter | Reduction (%) |
|---|---|---|---|---|
| SED | 14 | 6 | 6 | 68.42 |
| SCP | 20 | 6 | 6 | 76.00 |
| SIN | 15 | 4 | 4 | 82.61 |
| DCH | 10 | 3 | 3 | 78.57 |
| PHE | 4 | 4 | 4 | 66.67 |
| CCE | 10 | 4 | 4 | 60.00 |
| STR | 20 | 7 | 7 | 68.18 |
| NRE | 2 | 2 | 0 | 100.00 |
| GAD | 3 | 3 | 3 | 83.33 |
| GPO | 2 | 2 | 2 | 71.43 |
| Total | 94 | 41 | 39 | 75.78 |
Table 4.
Description of the subcriteria.
| Subcriterion Code | Description | Scale Type |
|---|---|---|
| SED-IIS | Investment in institutional sectors: investment by institutional sectors, which includes homes, governments and financial and non-financial corporations. | Direct |
| SED-GDP | Gross domestic product (GDP): total of all income generated by homes, businesses and the government. It can be defined as the net national product minus indirect taxes. | Direct |
| SED-SRH | Savings rate in homes: defined as the increase in savings in homes divided by the increase in available gross rent, all adjusted for the change in pension rights. | Direct |
| SED-ERC | Effective rate of change: an indicator which describes the relative strength of the currency of a country with respect to that of other countries with which it has some form of commercial exchange. | Direct |
| SED-EIE | Energetic intensity of the economy: shows the energetic efficiency of the economy. Calculated from the quotient between the energy consumption of the country and its gross domestic product. | Direct |
| SED-ERE | Employment rate of citizens with at least secondary education: working rate as a function of whether the worker has at least secondary education. | Direct |
| SCP-PRE | Productivity of resources: represents gross domestic product of a country with respect to domestic consumption of materials (DMC). The acronym should be CIM instead of DMC | Direct |
| SCP-ESO | Emissions of SOx: total atmospheric emissions of oxides of sulphur. | Inverse |
| SCP-DEC | Domestic electricity consumption: amount of energy consumed in homes, including heating, water heating and electrical appliances. | Inverse |
| SCP-EMA | Number of companies that respect the Environment. Number of companies registered in the EU’s environmental management and auditing system (EMAS). As well as those companies who voluntarily respect the environment. | Direct |
| SCP-CFB | Consumption of food and non-alcoholic beverages in homes: domestic consumption of food and non-alcoholic beverages, taking into account individuals and group households. | Direct |
| SCP-CHH | Consumption by households in hotels and restaurants: consumption by households in restaurants and hotels, taking into account individuals and group households. | Direct |
| SIN-PRP | Population at risk of poverty, or social inclusion: number of citizens at risk of poverty, or who live in households with low employment; that is, people whose disposable income is below the threshold for poverty risk (60% of the median nation disposable income, after including social assistance). | Inverse |
| SIN-IPW | Index of population in work at risk of poverty: percentage of over-18’s in employment whose income is below the threshold for risk of poverty (60% of the median nation disposable income, after including social assistance). | Inverse |
| SIN-LUR | Long-term unemployment rate: percentage of people who have been unemployed for at least 12 months, with respect to the total of those in employment. | Inverse |
| SIN-PSE | Population with at least secondary education: percentage of people aged 25–64 who have successfully completed secondary education. | Direct |
| DCH-AFR | Annual fertility rate: average number of births according to the birth rate for each year. | Direct |
| DCH-ANM | Adjusted net migration: net migration of a country with respect to the average migration of the countries. This figure is calculated as the difference between the total migration of the country and the natural migration of the population. | Inverse |
| DCH-ALM | Average time in the labor market (per worker): number of years that a person will be active in the labor market, taking 15 years as the starting age. | Direct |
| PHE-LEX | Life expectancy (good health): healthy life expectancy from birth; that is, the years that the person will enjoy good health after their birth. | Direct |
| PHE-UMN | Unmet medical needs: percentage of over-16’s with unmet medical needs because they are too expensive (excluding dental care). | Inverse |
| PHE-PLI | Population with long-term illness: percentage of over-16’s who have long-term illness or health problems; that is, chronic illness. | Inverse |
| PHE-HNP | Households which experience noise pollution: percentage of the population which claims to be affected by noise, whether internal (neighbours, family, etc.) or external. | Inverse |
| CCE-GEC | Intensity of greenhouse gas emissions in energy consumption: annual emissions of greenhouse gases. The gases involved are carbon dioxide (CO2), methane (CH4), nitrous oxide (N2O), hydrofluorocarbons (HFCs), perfluorocarbons (PFCs) and sulphur hexafluoride (SF6). | Inverse |
| CCE-EDE | Energy dependence: energy dependence shows how much the economy of a country depends on importing to satisfy demand. This indicator is calculated as net imported energy divided by the gross consumption of the country. | Inverse |
| CCE-PRE | Percentage of renewable energy use: proportional use of renewable energy, and thus the degree to which they are replacing energy generation by traditional technologies (fossil and nuclear fuels). | Direct |
| CCE-GCT | Generation with cogeneration technology: percentage of energy produced by cogeneration technology. Cogeneration is a technology which increases the energy efficiency of the power plant, using a gas turbine with heat recovery. | Direct |
| STR-ECT | Energy consumption in transport with respect to gross domestic product: energy cost of transport in relation to gross domestic product, including the energy consumed by all kinds of transport except for maritime and pipeline transport. | Inverse |
| STR-PTU | Percentage of train use as a means of overland transport: proportional use of the train as a means of transport to total overland transport, where overland transport means trains, cars, buses and coaches. | Direct |
| STR-PCU | Percentage of car use as a means of overland transport: proportional use of the car as a means of transport to total overland transport, where overland transport means trains, cars, buses and coaches. | Inverse |
| STR-PTR | Percentage of transport by road: proportion of road transport to total internal transport (by road, rail or navigable inland waterway). | Inverse |
| STR-VPG | Volume of passengers with respect to gross domestic product: relationship between volume of passengers on internal transport (car, bus, coach or train) and gross domestic product. | Direct |
| STR-ECA | Energy consumption in international aviation: energy costs for transport by international air travel. | Inverse |
| STR-PFC | Mean annual price index applied to fuel for consumers: official inflation rate for fuels and lubricants for consumers in the Eurozone according to the Harmonized Index of Consumer Prices (HICP). | Inverse |
| GAD-ODA | Official development aid (with respect to gross domestic product): aid or loans provided with the goal of promoting economic development and well-being of the country with respect to gross domestic product. | Direct |
| GAD-EDF | EU development funding: subsidies and development aid, including net pay-outs by the EU, other official and private investments. | Direct |
| GAC-ODP | Official development assistance (aid to prices): aid to market price for the development of the country. This aid is set by the European Development Assistance Committee. | Direct |
| GPO-ELT | Environmental and labor taxes in relation to other taxes: proportion of environmental and labor taxes to the total income from taxes of all kind. | Direct |
| GPO-IET | Implicit energy tax: income from tax on energy as a proportion of final energy consumption. | Direct |
Table 5.
Missing data for all periods by alternatives.
| Alternative | Number of Subcriteria without Data |
|---|---|
| Greece | 1 |
| Croatia | 3 |
| Cyprus | 1 |
| Luxembourg | 1 |
| Malta | 3 |
| Romania | 1 |
| Iceland | 4 |
| Switzerland | 13 |
| Total | 27 |
Table 6.
Comparison matrix for the criteria.
| SED | SCP | SIN | DCH | PHE | CCE | STR | GAD | GPO | Weight (%) | RC | |
|---|---|---|---|---|---|---|---|---|---|---|---|
| SED | 1 | 1.41 | 1.46 | 1.86 | 0.76 | 1.15 | 2.06 | 3.83 | 4.68 | 16.10 | 0.01 |
| SCP | 1 | 1.07 | 2.71 | 0.68 | 1.42 | 1.41 | 3.72 | 3.60 | 14.20 | ||
| SIN | 1 | 2.45 | 0.91 | 1.11 | 1.78 | 3.72 | 5.01 | 14.70 | |||
| DCH | 1 | 0.50 | 0.61 | 0.81 | 2.91 | 3.08 | 7.90 | ||||
| PHE | 1 | 2.91 | 3.22 | 4.86 | 5.03 | 20.6 | |||||
| CCE | 1 | 1.32 | 3.08 | 3.22 | 11.10 | ||||||
| STR | 1 | 3.13 | 2.91 | 8.70 | |||||||
| GAD | 1 | 1.11 | 3.50 | ||||||||
| GPO | 1 | 3.30 |
Table 7.
Comparison matrix and weightings for Socio-economic development.
| SED-IIS | SED-GDP | SED-SRH | SED-ERC | SEC-EIE | SED-ERE | Weight (%) | RC | |
|---|---|---|---|---|---|---|---|---|
| SED-IIS | 1 | 1.19 | 2.45 | 2.63 | 3.72 | 1.65 | 28.30 | 0.00 |
| SED-GDP | 1 | 2.21 | 2.45 | 3.56 | 1.38 | 25.00 | ||
| SED-SRH | 1 | 1.14 | 1.73 | 0.67 | 11.80 | |||
| SED-ERC | 1 | 1 | 0.64 | 10.00 | ||||
| SEC-EIE | 1 | 0.43 | 7.70 | |||||
| SED-ERE | 1 | 17.20 |
Table 8.
Comparison matrix and weightings for Sustainable consumption and production.
| SCP-PRE | SCP-ESO | SCP-DEC | SCP-EMA | SCP-CFB | SCP-CHH | Weight (%) | RC | |
|---|---|---|---|---|---|---|---|---|
| SCP-PRE | 1 | 1.07 | 1.41 | 2.78 | 4.43 | 3.66 | 29.10 | 0.01 |
| SCP-ESO | 1 | 1.11 | 2.06 | 3.72 | 2.21 | 23.20 | ||
| SCP-DEC | 1 | 1.93 | 3.36 | 2.24 | 20.80 | |||
| SCP-EMA | 1 | 2.45 | 1.41 | 11.90 | ||||
| SCP-CFB | 1 | 1.07 | 6.50 | |||||
| SCP-CHH | 1 | 8.40 |
Table 9.
Comparison matrix and weightings for Social inclusion.
| SIN-PRP | SIN-IPW | SIN-LUR | SIN-PSE | Weight (%) | RC | |
|---|---|---|---|---|---|---|
| SIN-PRP | 1 | 1.07 | 0.9 | 1.00 | 24.70 | 0.02 |
| SIN-IPW | 1 | 1.57 | 1.32 | 29.40 | ||
| SIN-LUR | 1 | 1.32 | 24.40 | |||
| SIN-PSE | 1 | 21.50 |
Table 10.
Comparison matrix and weightings for Demographic change.
| DCH-AFR | DCH-ANM | DCH-ALM | Weight (%) | RC | |
|---|---|---|---|---|---|
| DCH-AFR | 1 | 3.13 | 2.33 | 57.40 | 0.02 |
| DCH-ANM | 1 | 1.11 | 20.90 | ||
| DCH-ALM | 1 | 21.60 |
Table 11.
Comparison matrix and weightings for Public health.
| PHE-LEX | PHE-UMN | PHE-PLI | PHE-HNP | Weight (%) | RC | |
|---|---|---|---|---|---|---|
| PHE-LEX | 1 | 2.00 | 2.00 | 5.10 | 43.70 | 0.02 |
| PHE-UMN | 1 | 1.19 | 4.16 | 25.60 | ||
| PHE-PLI | 1 | 4.68 | 24.30 | |||
| PHE-HNP | 1 | 6.50 |
Table 12.
Comparison matrix and weightings for Climate change and energy.
| CCE-GEC | CCE-EDE | CCE-PRE | CCE-GCT | Weight (%) | RC | |
|---|---|---|---|---|---|---|
| CCE-GEC | 1 | 1.32 | 1.07 | 0.87 | 26.10 | 0.01 |
| CCE-EDE | 1 | 0.64 | 1.00 | 20.80 | ||
| CCE-PRE | 1 | 0.95 | 27.00 | |||
| CCE-GCT | 1 | 26.20 |
Table 13.
Comparison matrix and weightings for Sustainable transport.
| STR-ECT | STR-PTU | STR-PCU | STR-PTR | STR-VPG | STR-ECA | STR-PFC | Weight (%) | RC | |
|---|---|---|---|---|---|---|---|---|---|
| STR-ECT | 1 | 3.94 | 3.08 | 3.41 | 1.97 | 2 | 3.66 | 31.30 | 0.03 |
| STR-PTU | 1 | 1.97 | 1.11 | 0.52 | 1 | 1.39 | 11.30 | ||
| STR-PCU | 1 | 1.41 | 0.56 | 1.32 | 2.24 | 11.10 | |||
| STR-PTR | 1 | 0.66 | 1.68 | 2.51 | 11.50 | ||||
| STR-VPG | 1 | 1.19 | 4.21 | 17.80 | |||||
| STR-ECA | 1 | 2.78 | 11.50 | ||||||
| STR-PFC | 1 | 5.50 |
Table 14.
Comparison matrix and weightings for Global alliance for development.
| GAD-ODA | GAD-EDF | GAD-ADP | Weight (%) | RC | |
|---|---|---|---|---|---|
| GAD-ODA | 1 | 1.19 | 1.41 | 39.30 | 0.00 |
| GAD-EDF | 1 | 1 | 31.20 | ||
| GAD-ADP | 1 | 29.50 |
Table 15.
Comparison matrix and weightings for Good policies.
| GPO-ELT | GPO-IET | Weight (%) | RC | |
|---|---|---|---|---|
| GPO-ELT | 1 | 0.78 | 43.90 | 0.00 |
| GPO-IET | 1 | 56.10 |
Table 16.
Weighting of each subcriterion.
| Subcriterion | Weighting (wi) | Subcriterion | Weighting (wi) |
|---|---|---|---|
| SED-IIS | 4.56 | PHE-UMN | 5.27 |
| SED-GDP | 4.03 | PHE-PLI | 5.01 |
| SED-SRH | 1.90 | PHE-HNP | 1.34 |
| SED-ERC | 1.61 | CCE-GEC | 2.87 |
| SED-EIE | 1.24 | CCE-EDE | 2.29 |
| SED-ERE | 2.77 | CCE-PRE | 2.97 |
| SCP-PRE | 4.13 | CCE-GCT | 2.88 |
| SCP-ESO | 3.29 | STR-ECT | 2.72 |
| SCP-DEC | 2.95 | STR-PTU | 0.98 |
| SCP-EMA | 1.69 | STR-PCU | 0.97 |
| SCP-CFB | 0.92 | STR-PTR | 1.00 |
| SCP-CHH | 1.19 | STR-VPG | 1.55 |
| SIN-PRP | 3.63 | STR-ECA | 1.00 |
| SIN-IPW | 4.32 | STR-PFC | 0.48 |
| SIN-LUR | 3.59 | GAD-ODA | 1.38 |
| SIN-PSE | 3.16 | GAD-EDF | 1.09 |
| DCH-AFR | 4.53 | GAD-ODP | 1.03 |
| DCH-ANM | 1.65 | GPO-ELT | 1.45 |
| DCH-ALM | 1.71 | GPO-IET | 1.85 |
| PHE-LEX | 9.00 | - | - |
Table 17.
Identification of negative measurements.
| Subcriterion | Number of Negative Data Points | Justification |
|---|---|---|
| SED-SRH | 33 | Makes sense. Negative savings rate shows that households have more expenses than income. |
| SCP-EMA | 8 | Does not make sense. The number of companies respectful of the environment cannot be negative. |
| DCH-ANM | 112 | Makes sense. As the migration rate is described, the negative values indicate more emigration than immigration, and the positive values more immigration than emigration. |
| PHE-UMN | 1 | Does not make sense. It is a parameter that indicates the percentage of people with unmet medical needs, and as such its value cannot less than zero. |
| CCE-EDE | 19 | Makes sense. Negative values of energy dependence suggest that the country imports energy to meet its needs. |
| GAD-ODA | 5 | Does not make sense. This parameter expresses the aid and loans given by the EU with respect to the gross domestic product of the country. |
| GAD-EDF | 13 | Makes sense. Negative values of funding suggest that the country receives less credit than it has to pay back in that period. |
Table 18.
Weightings of the smoothed exponential of n periods.
| Term (n) | 1 | 2 | 3 | … | n |
|---|---|---|---|---|---|
| Weighting (wi) | … |
Table 19.
Weightings for each of the periods of the moving weighted average.
| Period | Weighting |
|---|---|
| 2015 | 0.1822 |
| 2014 | 0.1490 |
| 2013 | 0.1219 |
| 2012 | 0.0997 |
| 2011 | 0.0848 |
| 2010 | 0.0745 |
| 2009 | 0.0670 |
| 2008 | 0.0614 |
| 2007 | 0.0568 |
| 2006 | 0.0530 |
| 2005 | 0.0497 |
© 2019 by the authors. Licensee MDPI, Basel, Switzerland. This article is an open access article distributed under the terms and conditions of the Creative Commons Attribution (CC BY) license (http://creativecommons.org/licenses/by/4.0/).
Share and Cite
MDPI and ACS Style
Martín, C.J.; Carnero, M.C. Evaluation of Sustainable Development in European Union Countries. Appl. Sci. 2019, 9, 4880. https://doi.org/10.3390/app9224880
AMA Style
Martín CJ, Carnero MC. Evaluation of Sustainable Development in European Union Countries. Applied Sciences. 2019; 9(22):4880. https://doi.org/10.3390/app9224880
Chicago/Turabian StyleMartín, Carlos Javier, and María Carmen Carnero. 2019. "Evaluation of Sustainable Development in European Union Countries" Applied Sciences 9, no. 22: 4880. https://doi.org/10.3390/app9224880
Note that from the first issue of 2016, this journal uses article numbers instead of page numbers. See further details here.