Current Techniques for Diabetes Prediction: Review and Case Study


1
Computer Science Department, College of Computer and Information Sciences, Prince Sultan University, Riyadh 11586, Saudi Arabia
2
Information Systems Department, College of Computer and Information Sciences, Prince Sultan University, Riyadh 11586, Saudi Arabia
*
Author to whom correspondence should be addressed.
Appl. Sci. 2019, 9(21), 4604; https://doi.org/10.3390/app9214604
Submission received: 14 September 2019
/
Revised: 11 October 2019
/
Accepted: 21 October 2019
/
Published: 29 October 2019
(This article belongs to the Section Computing and Artificial Intelligence)
Abstract
:Diabetes is one of the most common diseases worldwide. Many Machine Learning (ML) techniques have been utilized in predicting diabetes in the last couple of years. The increasing complexity of this problem has inspired researchers to explore the robust set of Deep Learning (DL) algorithms. The highest accuracy achieved so far was 95.1% by a combined model CNN-LSTM. Even though numerous ML algorithms were used in solving this problem, there are a set of classifiers that are rarely used or even not used at all in this problem, so it is of interest to determine the performance of these classifiers in predicting diabetes. Moreover, there is no recent survey that has reviewed and compared the performance of all the proposed ML and DL techniques in addition to combined models. This article surveyed all the ML and DL techniques-based diabetes predictions published in the last six years. In addition, one study was developed that aimed to implement those rarely and not used ML classifiers on the Pima Indian Dataset to analyze their performance. The classifiers obtained an accuracy of 68%–74%. The recommendation is to use these classifiers in diabetes prediction and enhance them by developing combined models.
1. Introduction
Diabetes is one of the frequent diseases that targets the elderly population worldwide. According to the International Diabetes Federation, 451 million people across the world were diabetic in 2017. The expectations are that this number will increase to affect 693 million people in the coming 26 years [1]. Diabetes is considered as a chronic disease associated with an abnormal state of the human body where the level of blood glucose is inconsistent due to some pancreas dysfunction that leads to the production of little or no insulin at all, causing diabetes of type 1 or cells to become resistant to insulin, causing diabetes of type 2 [2,3]. The main cause of diabetes remains unknown, yet scientists believe that both genetic factors and environmental lifestyle play a major role in diabetes. Even though it’s incurable, it can be managed by treatment and medication. Individuals with diabetes face a risk of developing some secondary health issues such as heart diseases and nerve damage. Thus, early detection and treatment of diabetes can prevent complications and assist in reducing the risk of severe health problems. Many researchers in the bioinformatics field have attempted to address this disease and tried to create systems and tools that will help in diabetes prediction. They either built prediction models using different types of machine learning algorithms such as classification or association algorithms. Decision Trees, Support Vector Machine (SVM), and Linear Regression were the most common algorithms [4,5,6].
Artificial Neural Network (ANN) is another type of machine learning technique. It is well-known for its high performance and accuracy. Furthermore, due to the increasing size and complexity of the data, Deep Learning (DL) has been introduced as an improvement to ANN. Recent studies that have used DL produced remarkable results [7,8].
The accuracy rate produced by these methods varied. This has encouraged researchers to attempt improving the accuracy by either building models with classifiers that haven’t been used or combine different classifiers [9,10,11]. The majority of the studies in the field of the dDiabetes prediction used the public Pima Indian Dataset obtained from the UCI repository.
Some surveys have been published, but they are different from this study. For example, Reference [12] discussed the well-known ML and DL techniques used in predicting diabetes. The authors described only the studies related to Decision Tree, Support Vector Machine, Artificial Neural Network, and some DL techniques. Reference [13] also surveyed the main well-known ML classification techniques to predict diabetes. Reference [14] investigated the ML techniques used in predicting different diseases, including diabetes, which is discussed by only five related works. Reference [15] also discussed the ML techniques used in predicting heart, breast cancer and diabetes diseases, where the authors discussed only two studies about diabetes prediction. In fact, all these surveys investigated the ML techniques used in predicting diabetes disease. However, only one survey [12] addressed the DL state-of-the art techniques that predicted diabetes disease. In addition, two reviews [12,13] focused only on the diabetes disease, unlike [14,15] which discussed several diseases including diabetes introduced by five studies in [14] and only two studies in [15].
This research paper discusses Machine and Deep Learning techniques in addition to combined models for the prediction of diabetes [16] published since 2013. Combined models are defined as a combination of two or more classifiers. For example, they can be a combination of two or more ML techniques, or ML with AI techniques. This paper provides a systematic review of the performances of different Machine and Deep Learning classifiers obtained from different papers collected in the last six years. To save space, only a sample of the studies have been reviewed in the related works section while Table A1, Table A2 and Table A3 summarize all the existing studies in the last six years (more than 40 studies in total, see the Appendix A). Moreover, the frequencies of using the ML classifiers are calculated. Upon that, the popular classifiers are identified, and then the rarely (or not) used classifiers are applied on the PID using the Weka tool. Up to our knowledge, none of the existing surveys discussed these classifiers. Based on the results we acquired, a comparative analysis is performed with other research studies that used the same dataset. Finally, this paper aims to create a unified repository the researchers can refer to when they want to predict diabetes.
This paper is organized as follows: Section 2 describes the related works that used ML and DL techniques in addition to combined models. Section 3 addresses a comprehensive discussion about the related studies showing the main diabetes datasets and their features (summarized in Table A4) in addition to an overview of several ML/DL algorithms along with their advantages and disadvantages (summarized in Table A5). Section 4 presents one case study to predict the diabetes in addition to the results and the discussion about the performance of the classifiers used. Finally, Section 5 states the final findings and the conclusions of the study.
2. Related Works
To perform this study, 27 Machine Learning related studies have been collected, as seen in Table A1 (see the Appendix A) [4,5,17,18,19,20,21,22,23,24,25,26,27,28,29,30,31,32,33,34,35,36,37,38,39,40,41]. However to save space, only 10 of the most recent studies have been discussed in details. In addition, seven studies related to Deep Learning techniques were found (see Table A2 in the Appendix A) and discussed in this section. Moreover, six papers presenting combined models were collected and presented in Table A3 (see the Appendix A) but they are not discussed. Table A1 and Table A2 provide the reference, the year of publication, the evaluation measure with its obtained value, and the dataset used for each study published in the last six years. Moreover, the main datasets used in the below discussed studies are summarized in Table A4 (see the Appendix A) indicating their size and the main features utilized.
2.1. Related Works Using Machine Learning
ML algorithms are very well-known in the medical field for predicting diseases. Many researchers have used ML techniques to predict diabetes in an effort to obtain the best and most accurate results [16].
Kandhasamy and Balamurali [4] used multiple classifiers SVM, J48, K-Nearest Neighbors (KNN), and Random Forest. The classification was performed on a dataset taken from the UCI repository (for more details see Table A4). The results of the classifiers were compared based on the values of the accuracy, sensitivity, and specificity. The classification was done in two cases, when the dataset is pre-processed and without preprocessing by using 5-fold cross validation. The authors didn’t explain the pre-processing step applied on the dataset, they just mentioned that the noise was removed from the data. They reported that the decision tree J48 classifier has the highest accuracy rate being 73.82% without pre-processing, while the classifiers KNN (k = 1) and Random Forest showed the highest accuracy rate of 100% after pre-processing the data.
Moreover, Yuvaraj and Sripreethaa [17] presented an application for diabetes prediction using three different ML algorithms including Random Forest, Decision Tree, and the Naïve Bayes. The Pima Indian Diabetes dataset (PID) was used after pre-processing it. The authors didn’t mention how the data was pre-processed, however they discussed the Information Gain method used for feature selection to extract the relevant features. They used only eight main attributes among 13 (see Table A4). In addition, they divided the dataset into 70% for training and 30% for testing. The results showed that the random forest algorithm had the highest accuracy rate of 94%.
Furthermore, Tafa et al. [18] proposed a new integrated improved model of SVM and Naïve Bayes for predicting the diabetes. The model was evaluated using a dataset collected from three different locations in Kosovo. The dataset contains eight attributes and 402 patients where 80 patients had type 2 diabetes. Some attributes utilized in this study (see Table A4) have not been investigated before, including the regular diet, physical activity, and family history of diabetes. The authors didn’t mention whether the data was pre-processed or not. For the validation test, they split the dataset into 50% for each of the training and testing sets. The proposed combined algorithms have improved the accuracy of the prediction to reach 97.6%. This value was compared with the performance of SVM and Naïve Bayes achieving 95.52% and 94.52%, respectively.
In addition, Deepti and Dilip [19] used Decision Tree, SVM, and Naive Bayes classifiers to detect diabetes. The aim was to identify the classifier with the highest accuracy. The Pima Indian dataset was used for this study. The partition of the dataset is done by means of 10-folds cross-validation. The authors didn’t discuss the data preprocessing. The performance was evaluated using the measures of the accuracy, the precision, recall, and the F-measure. The highest accuracy was obtained by the Naive Bayes, which reached 76.30%.
Mercaldo et al. [20] used six different classifiers. The classifiers are J48, Multilayer Perceptron, HoeffdingTree, JRip, BayesNet, and RandomForest. The Pima Indian dataset was also utilized for this study. The authors didn’t mention a preprocessing step, however, they employed two algorithms, GreedyStepwise and BestFirst, to determine the discriminatory attributes that help in increase the classification performance. Four attributes have been selected, namely body mass index, plasma glucose concentration, diabetes pedigree function, and age. A 10 fold-cross validation is applied to the dataset. The comparison between the classifiers was made based on the value of the precision, the recall, and the F-Measure. The result showed the precision value equals to 0.757, recall equals to 0.762, and F-measure equals to 0.759 using the Hoeffding Tree algorithm. This is the highest performance compared to the others.
In addition to the other studies, Negi and Jaiswal [21] aimed to apply the SVM to predict diabetes. The Pima Indians and Diabetes 130-US datasets were used as a combined dataset. The motivation of this study was to validate the reliability of the results as other researchers often used a single dataset. The dataset contains 102,538 samples and 49 attributes where 64,419 were positive samples and 38,115 were negative samples. The authors didn’t discuss the attributes used in this study. The dataset is pre-processed by replacing the missing values and out of range data by zero, the non-numerical values are changed to numerical values, and finally the data is normalized between 0 and 1. Different feature selection methods were used prior to the application of the SVM model. The Fselect script from LIBSVM package selected four attributes, while Wrapper and Ranker methods (from Weka Tool) selected nine and 20 attributes, respectively. For the validation process, the authors used 10-fold cross validation technique. By using a combined dataset, the diabetes prediction might be more reliable, with an accuracy of 72%.
Moreover, Olaniyi and Adnan [22] used a Multilayer Feed-Forward Neural Network. The back-propagation algorithm was used for training the algorithm. The aim was to improve the accuracy of diabetes prediction. The Pima Indian Diabetes database was used (see Table A4). The authors normalized the dataset before processing to the classification in order to obtain a numerical stability. It consisted of dividing each sample attributes by their corresponding amplitude to make all the dataset values between 0 and 1. After that, the dataset is divided into 500 samples for a training set and 268 for the testing set. The accuracy obtained was 82% which is considered as a high accuracy rate.
Soltani and Jafarian [23] used the Probabilistic Neural Network (PNN) to predict diabetes. The algorithm was applied to the Pima Indian dataset. The authors didn’t apply any pre-processing technique. The dataset is divided into 90% for the training set and 10% for the testing set. The proposed technique achieved accuracies of 89.56%, 81.49% for the training and testing data, respectively.
Rakshit et al. [24] used a Two-Class Neural Network to predict diabetes using the Pima Indian dataset. The authors pre-processed the dataset by normalizing all the sample attributes values using the mean and the standard deviation of each attribute in order to obtain a numerical stability. In addition, they extracted the relevant features using the correlation. However, the authors didn’t mention these discriminatory features. The dataset was split into a training set containing 314 samples and a testing set comprising 78 samples. The result of this model achieved the highest accuracy of 83.3% when compared to other accuracies obtained from the previous studies.
Mamuda and Sathasivam [25] applied three supervised learning algorithms including Levenberg Marquardt (LM), Bayesian Regulation (BR), Scaled Conjugate Gradient (SCG). This study used the Pima Indian dataset (with 768 samples and eight attributes, see Table A4) for evaluating the performance. For the validation study, the 10-fold cross validation was used to split the data into training and testing. The authors reported that Levenberg Marquardt (LM) obtained the best performance on the validation set based on the Mean Squared Errorr (MSE) equals to 0.00025091.
2.2. Related Works Using Deep Learning
Researchers have started to realize the capabilities of the DL techniques in processing large datasets. Therefore, diabetes prediction has also been performed using DL techniques. Seven studies were published during the six last years, as shown in Table A2 (see the Appendix A).
Also, Ashiquzzaman et al. [7] used a Deep Neural Network (DNN). The architecture of the DNN composed of Multilayer Perceptron (MLP), General Regression Neural Network (GRNN), and Radial Basis Function (RBF). The evaluation of the approach was based on the Pima Indian dataset. The authors didn’t pre-process the dataset intentionally as DNN can filter the data and acquire the biases. The dataset is split into 192 samples for the testing set and the rest for the training. The accuracy rate reported by the authors was of 88.41%.
Another study by Swapna et al. [8] used two DL techniques to improve the accuracy of diabetes prediction. A private dataset called Electrocardiograms was used to assess the performance of the CNN and CNN-LSTM. It consisted of 142,000 samples and eight attributes (see Table A4). Five-fold cross validation was used to split the dataset into training and testing sets. The authors did not pre-process data nor apply feature selection method because of the self-learning of DNN. The generated accuracy rates for the models were 90.9% and 95.1%, respectively.
Mohebbi et al. [42] used logistic regression as a baseline to multilayer perceptron neural network and conventional neural network (CNN). The aim was to detect diabetic patients based on a continuous glucose monitoring (CGM) signal dataset. The dataset is composed of nine patients and each patient had 10,800 days of CGM data, resulting in a total of 97,200 simulated CGM days. The attributes used in this study were not discussed. The dataset was split into training, validation, and testing sets based on leave-one-patient-out cross-validation technique. In fact, the authors selected six patients for training and validation, and three patients for testing. The CNN achieved the highest accuracy of 77.5%.
Moreover, Miotto et al. [43] proposed a framework of unsupervised Deep Neural Network called Deep Patient. The framework used a patients’ electronic health records database composed of 704,857 patients. The authors didn’t specify the features used in this dataset, they mentioned that the dataset can be used to predict different diseases. In the validation process, the authors split the data into 5000 (patients) for the validation, 76,217 (patients) for the testing and the rest for the training. The accuracy was measured based on the Area Under Curve (AUC) which achieved 0.91. The authors recommended to pre-process the dataset to well enhance the prediction performance. They suggested using PCA to extract relevant attributes before performing the DL.
Pham et al. [44] applied three different DL techniques on a manually collected dataset from a regional Australian hospital. The dataset is composed of 12,000 samples (patients) containing 55.5% males. Some pre-processing techniques (not mentioned in their article) have been applied to clean and reduce the samples to 7191 patients. For validation, the dataset was split to 2/3 for the training set, 1/6 for the validation and 1/6 for the testing. The methods were Long Short-Term Memory (LTSM), Markov, and Plain RNN. The precision value was used to compare the performance of the techniques. The best precision value of 59.6% was achieved by using the LTSM.
Furthermore, Ramesh et al. [45] used the Recurrent Neural Network (RNN) to predict the two types of diabetes. The authors utilized the Pima Indian dataset with 768 samples and eight attributes. The attributes are ordered according to their highest importance as indicated in their study “Glucose, BMI, Age, Pregnancies, Diabetes Pedigree Function, Blood Pressure, Skin Thickness and Insulin”. To validate the study, the dataset was split into 80% for the training and 20% for the testing. The accuracy of predicting Diabetes type 1 was 78% while it was 81% for type 2.
In addition to the other studies, Lekha and Suchetha [46] used one-dimensional modified CNN to predict diabetes based on breath signals. The authors collected a dataset for breath signals composed of 11 healthy patients, nine diabetic patients of type 2, and five diabetic patients of type 1. The attributes used in this dataset are displayed in Table A4. No pre-processing was performed on the dataset. For the validation process, the authors used Leave-One Out Cross Validation. The performance was evaluated based on the Receiver Operating Characteristics (ROC) curve which reached 0.96.
Researchers aimed during their quest to further improve the prediction mechanism, they built combined models in order to boost the accuracy. The models can be a combination of machine learning classifiers or a classifier with Artificial Intelligence optimizer. These models revealed a high accuracy as seen in Table A3 in the Appendix A [9,10,11,23,47,48].
3. Discussion
3.1. Datasets
Diabetes is a common disease but a small number of datasets have been collected and used in predicting this disease and only one or two are publically available. Taking into account the importance of datasets and their impact in the obtained results, it is crucial to discuss the main datasets mentioned in this study particularly the features they contain. Table A4 summarizes the main datasets discussed in the related works section including their size and their attributes.
The main datasets used in the related works are Electrocardiograms (ECG) [8], a private dataset collected from three different locations in Kosovo [18], Breath Dataset [46], a dataset from UCI [4], and the Pima dataset which used by more than 10 studies (discussed in this survey). These datasets have different number of samples (patients) but all contain more or less the same features namely “BMI, Diastolic blood pressure, Plasma glucose concentration, Triceps skin fold thickness, Diabetes pedigree function, Age, Family history of diabetes, Regular diet, and Physical activities”. Moreover, these features were detected by different feature selection methods when the number of features is large. In fact, in [17,20,21], the authors used PIMA dataset with 13, eight and 49 attributes, respectively. When the feature selection methods were applied, these numbers were reduced to eight, four and nine features, respectively. It is noticed that [20] achieved a lower precision of 0.757 which may be due to the low number of features used for the prediction. This shows that these attributes have a strong impact on the prediction of diabetes. According to many studies [4,8,18,20,21,45], these attributes were chosen because it was revealed that they are a significant factors for diabetes prediction. This is a key decision for researchers willing to collect new diabetes datasets.
3.2. Diabetes Prediction Based ML/DL Techniques
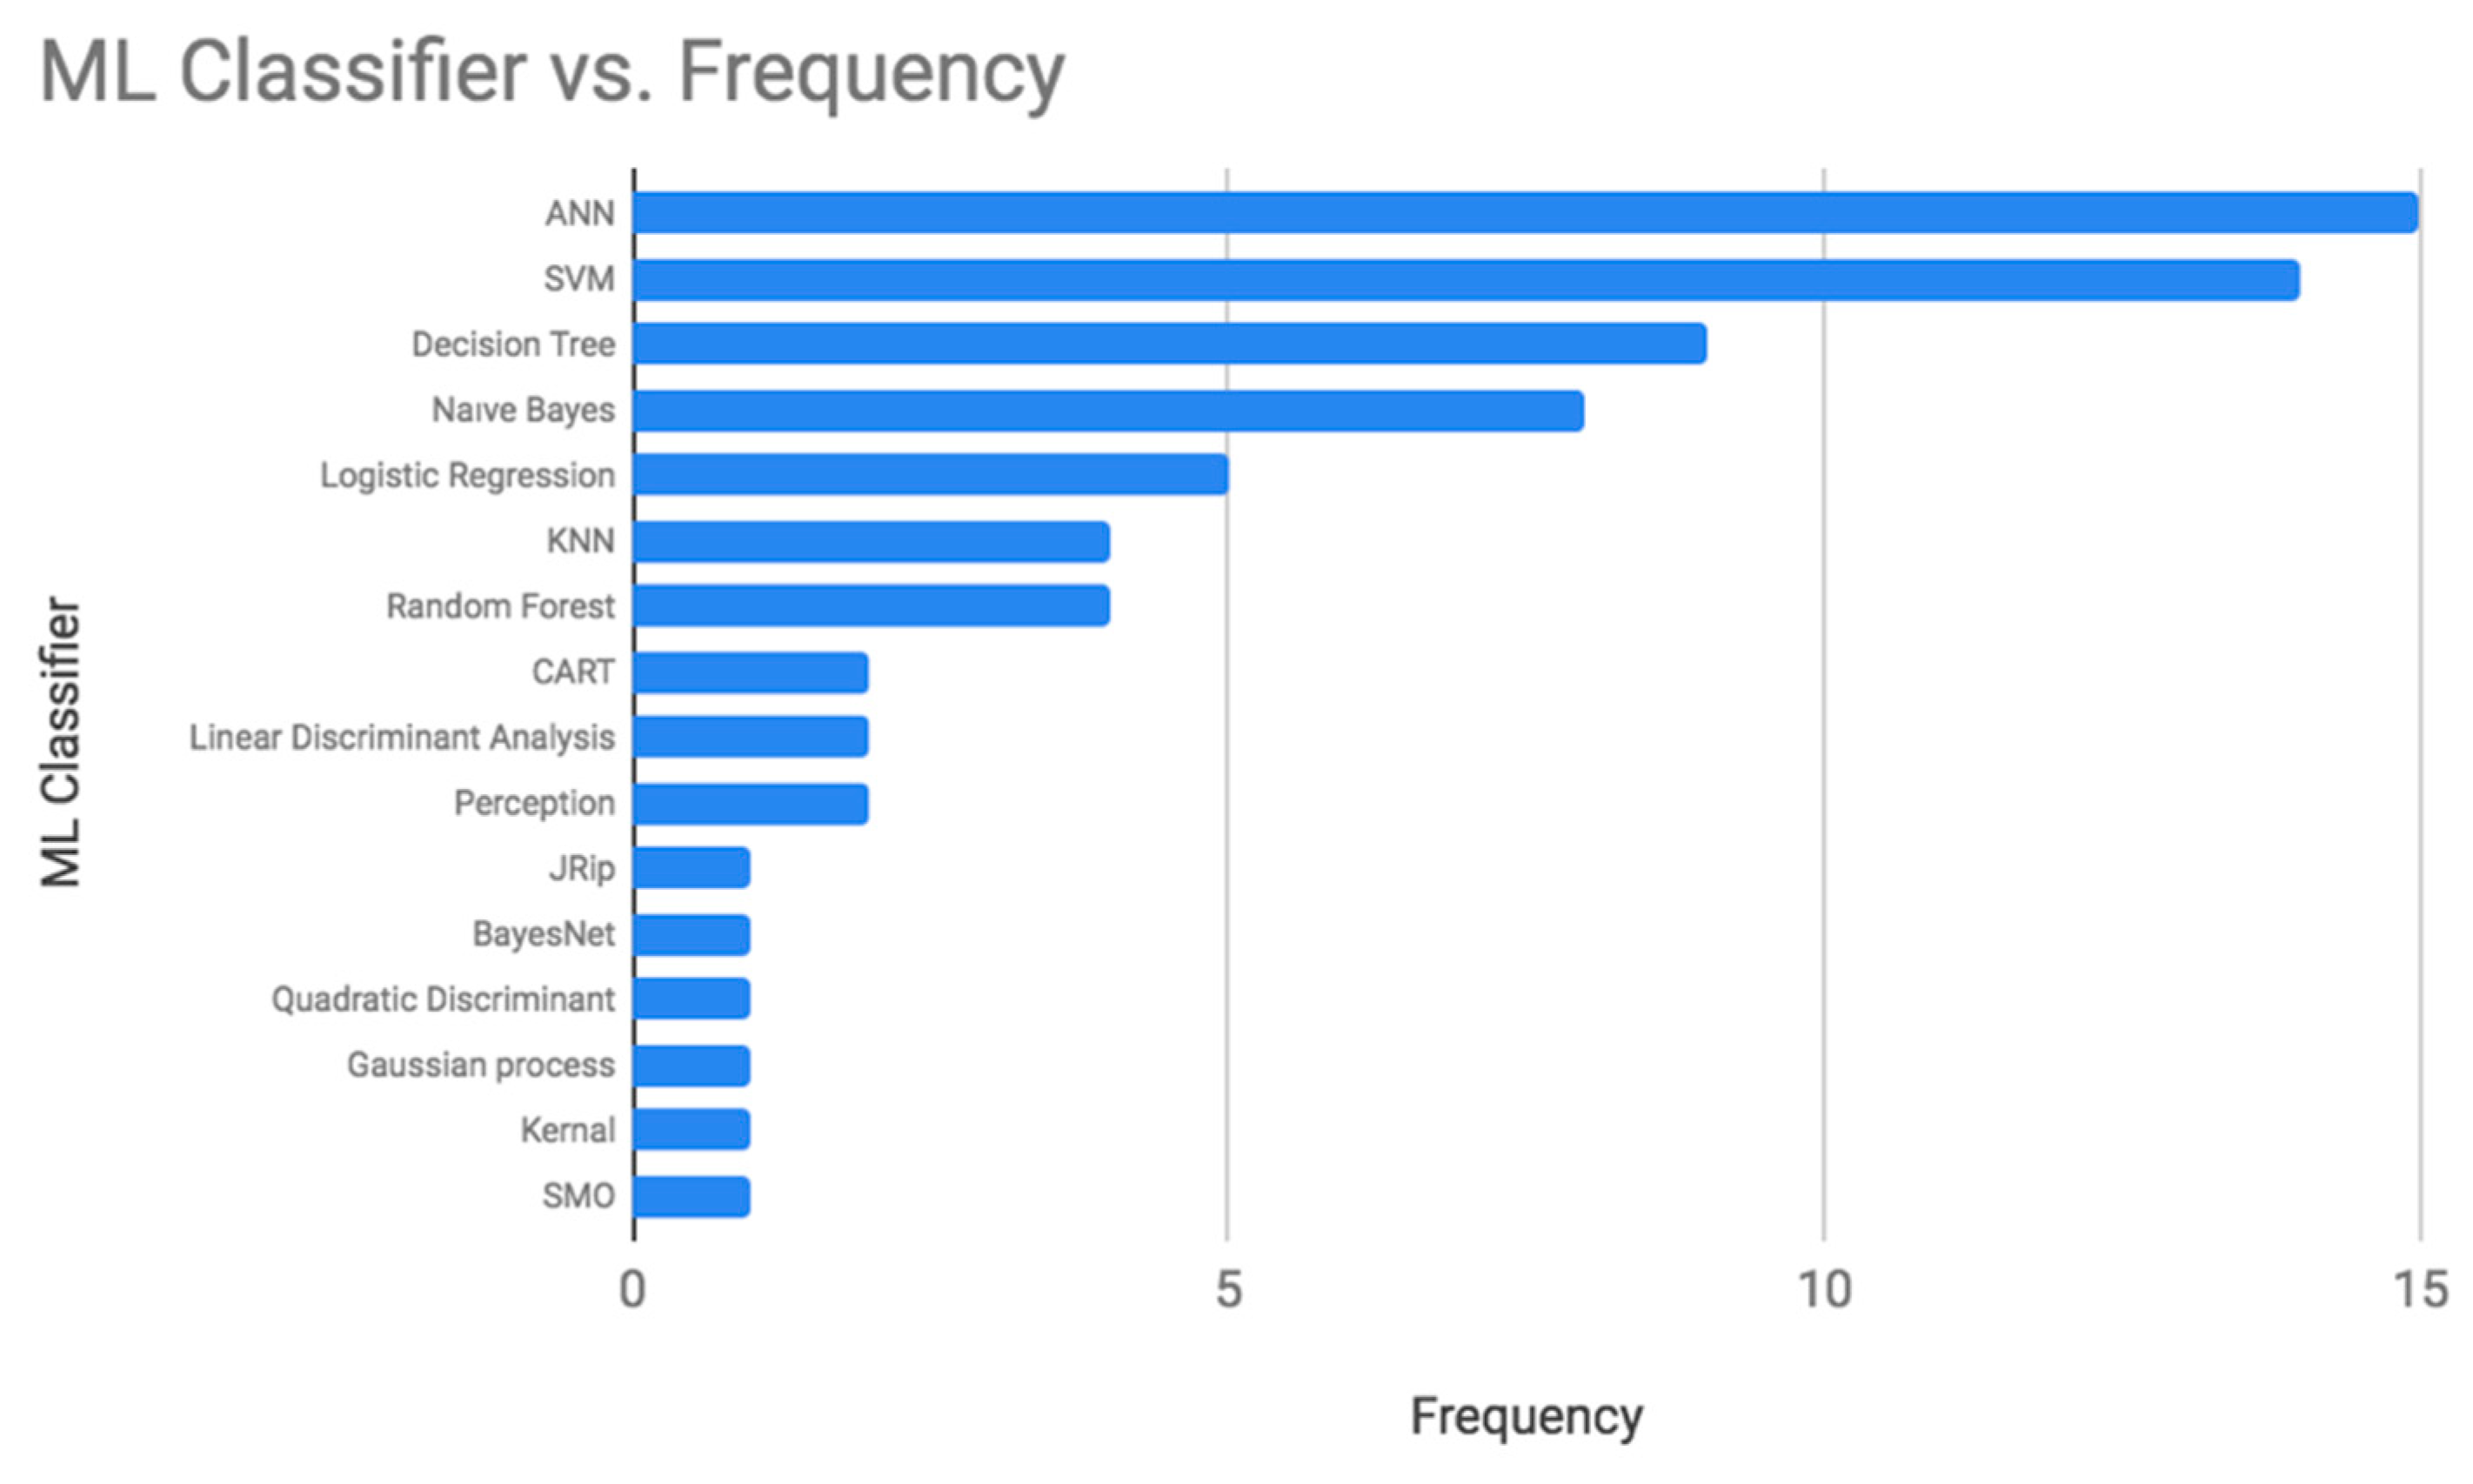
Based on the studies conducted to predict diabetes in the last six years (shown in Table A1), the frequency of using each machine learning classifier was calculated. Artificial Neural Network (ANN), Support Vector Machine (SVM), Decision Tree, and Naive Bayes were the most used classifiers for diabetes prediction as displayed in Figure 1. Table A5 summarizes the advantages and disadvantages of all these algorithms.
Artificial Neural Networks (ANN) are inspired by the human neurological system mechanism [49]. They can learn by experience and extract the essential attributes from inputs that contain unnecessary data, and deal with vague cases [50,51]. The basic architecture of an ANN consists of three layers; the input, the output, and the hidden layers. The hidden layer includes neurons that process the operations on data to improve the ability to learn. The number of hidden layers in the neural network affects its performance, too many hidden layers will result in an overfitting problem [52]. Multilayer Perceptron (MLP), Bayesian Neural Network (BNN), and Probabilistic Neural Network (PNN) are types of ANN models. Table A5 summarizes the advantages and disadvantages of this technique. ANN has been applied in many fields such as prediction and forecasting, classification, data correlation and association, robotics and data filtering [53,54,55]. Moreover, it has been used in predicting diabetes, and it attained an accuracy value ranging between 60% and 95%.
SVM is a statistical supervised ML classifier used in binary classification tasks. It is defined by a separated hyperplane between the two output classes [19]. SVM uses a set of mathematical functions called kernels to transform the input into the required form. Different types of kernel functions exist such as polynomial, linear, and nonlinear. SVM works well with unstructured and semi-structured datasets such as images and text by using the appropriate kernel function [18]. Although it is a powerful technique, it has some limitations (see Table A5). It is hard sometimes to select the right kernel function. Also, when it is used with large datasets, it requires long training time. Even though the weights of the variables are difficult to interpret in the final model, it can attain accurate and robust results [34]. SVM is a frequently used technique in medical applications. It was also applied in diabetes prediction in many research studies. The obtained range was 65%–96%.
Naive Bayes is a statistical classification technique based on Bayes’ theorem. It is about calculating the probability of the output based on the prior knowledge of the relationship between the attributes [19]. It operates with the concept that all the features are independent of each other. It works well with the data that has missing values or unbalancing issues, with categorical and continuous values. It is easy to implement and require a small amount of data to set its parameters [31]. All these properties made it a powerful classifier to be used in the medical diagnosis’s problems. Practically, the variables might have dependencies. The problem with this classifier is that the conditional independence might cause a drop in the accuracy. Table A5 summarizes the advantages and disadvantages of this technique. The accuracy obtained in predicting diabetes ranged between 76% and 96%.
Decision Tree is a supervised ML technique to solve prediction, classification, and feature selection problems. It aims to predict the target class based on the rules learned from the given dataset [19]. The decision tree is an excellent option for researchers due to its advantages. It is easy to understand and implement especially when using a graphical representation of the concept. It works well with numerical and categorical data [4]. Since it works with different data types, it does not require much data pre-processing work. However, there are some limitations (see Table A5): (a) It is not robust, a small change in the data can have a significant effect on the final predictions [36]. (b) It does not perform well with large datasets due to the increase complexity of the tree. Therefore, the preparation and the analysis become time consuming [17]. Still, many researchers in diabetes prediction use it, the accuracy ranges between 73% and 88%.
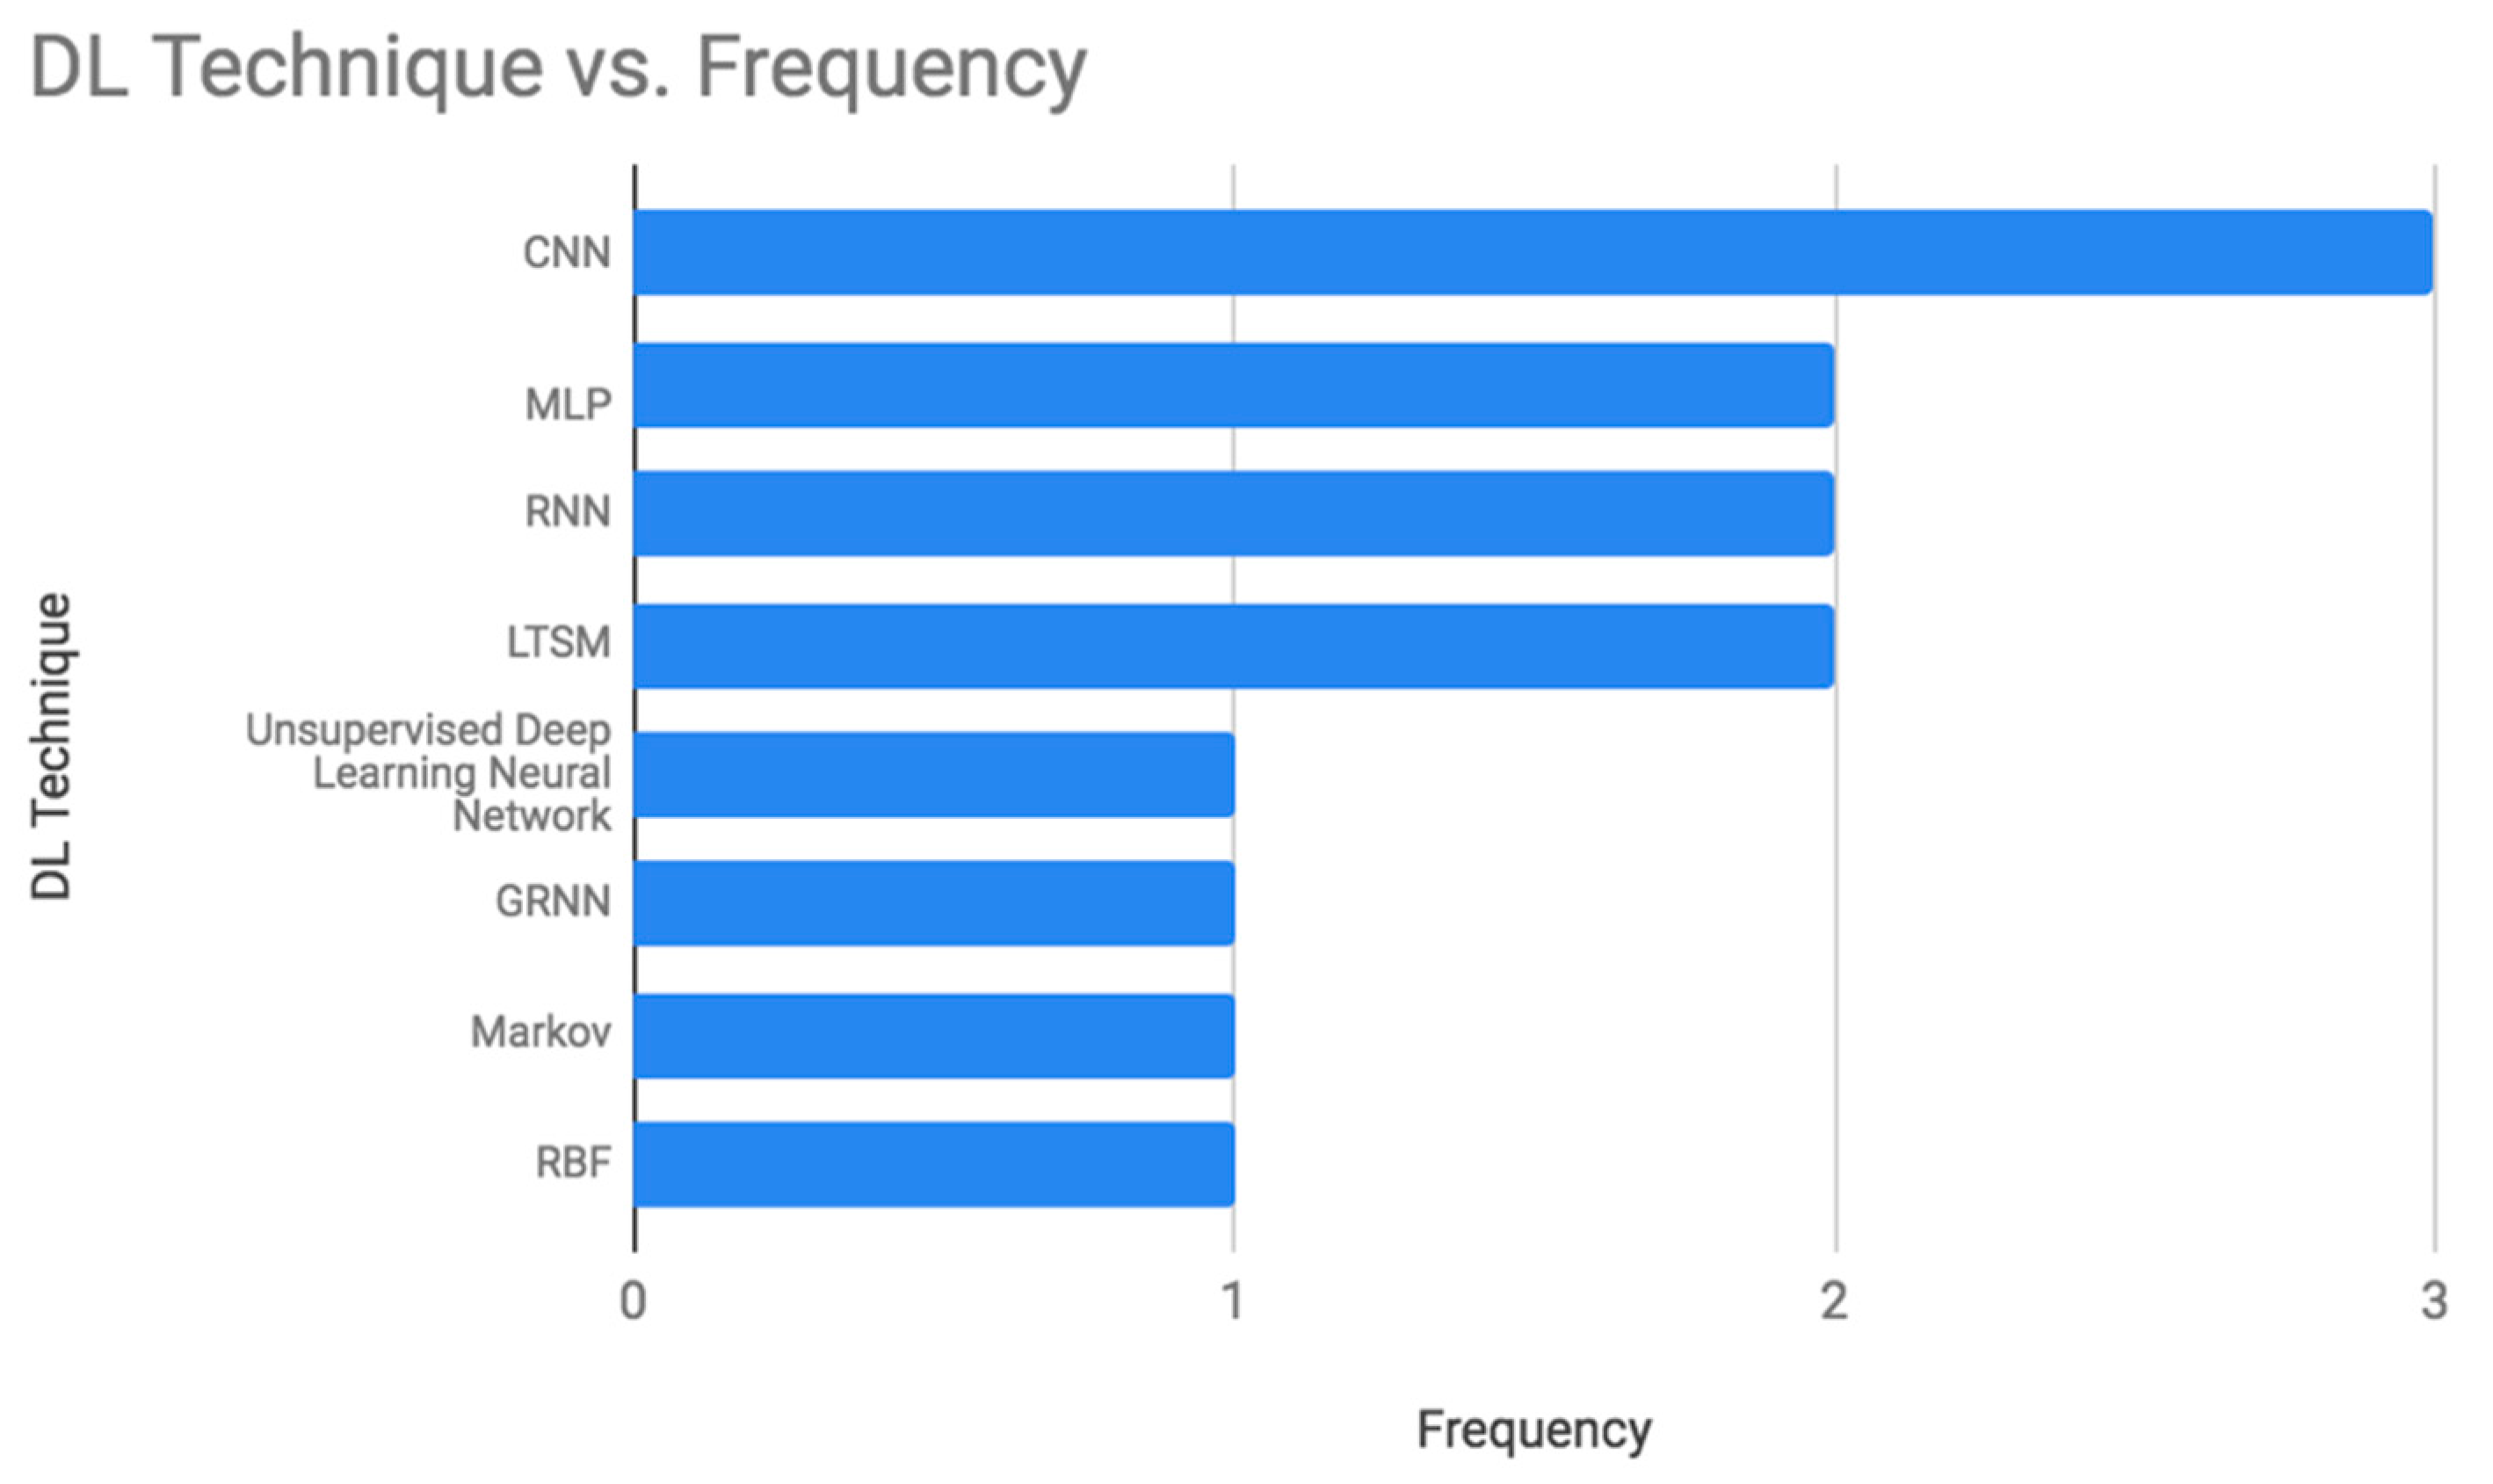
Furthermore, different machine learning techniques were used in diabetes prediction, and DL techniques were utilized as well. The frequency of using the DL techniques in the last six years as shown in Table A2 (see the Appendix A) was calculated and presented in Figure 2. The most common techniques are Convolutional Neural Network (CNN), Multilayer Perceptron (MLP), Recurrent Neural Network (RNN), and Long-Term Short Memory (LTSM). Table A5 summarizes the advantages and disadvantages of these techniques.
CNN is a special type of MLP, initially used in image processing. The underlying architecture of the CNN consists of three layers, a convolutional, a pooling, and a fully connected layer. The latter uses (ReLU) as the activation function [8]. CNN works well with a grid topology data type. The most significant advantage of CNN is that it performs automatic feature extraction. Also, it can show the correlation between the elements for the provided inputs [46]. CNN requires less time in classification and result in a high accuracy especially in image processing. However, the computational cost is high and it can’t perform well without a large amount of training data [56]. It has been used in Diabetes prediction with the accuracy between 78%–96%.
MLP is a supervised classifier, involving several layers and simple interconnected neurons that create a nonlinear mapping between the input and output vectors. During the training step, the weights are adjusted to reach the desired output. The difference between the target and the actual outputs is defined as an error signal. MLP can be applied to different data types such as texts and image. It is suitable for regression and prediction. MLP has many applications such as forecasting the level of ozone [57]. However, due to its fully interconnected neurons, the total number of parameters might be very large which increases the processing time. Consequently, it can be inadequate for modern advanced computer vision field. Table A5 summarizes the advantages and disadvantages of this technique. MLP has been used in Diabetes prediction twice with an accuracy of 72.5% and 88.41% respectively. The second use was combined with General Regression Neural Network and Radial Basis Function.
RNN is a powerful and robust type of ANN. It is different from the CNN as it takes sequential data inputs (natural language processing) instead of fixed-sized vectors (image). RNN processes the sequences of the inputs one at a time while saving the information about past neurons in the hidden neurons. Therefore, the outputs of different neurons at different time steps are inputs to the neurons of the next time step. RNN can perform flawlessly with complex problems such as Apple’s Siri, predicting the next word in the text, or translation of the words that form a sentence [56]. This is due to its memorization ability (see Table A5). Therefore, it can be more accurate in the prediction problems [45]. Its main limitation is the vanishing gradients problem. It happens when the data get corrupted as it is multiplied by small numbers that are less than zero. Therefore, it is difficult to calculate the weights and biases which drop the accuracy. RNN was used twice in the last six years in Diabetes prediction. The highest accuracy obtained was 81%.
LSTM is an improvement of RNN. It encompasses of multiple memory blocks that can overcome the vanishing gradient problem. Memory blocks are defined as complex processing units that consists of one or more memory cells to deal with long term dependencies. It’s mainly used in Natural Language Processing applications. It worked well and showed improvements in the fields of speech recognition, language modeling, and computer vision. One of its main limitations is the high computational time required to calculate the memory bandwidth for the processing units which makes it harder to train the data [57] (see Table A5). LSTM has been used twice in the prediction of Diabetes in the last six years. The first time was combined with the CNN and obtained accuracy of 95.1%. The second used only LSTM and achieved a precision of 59.6%.
4. Case Study
4.1. Data Collection
In this study, the Pima Indian Dataset (PID) was used. It is collected from the UCI Machine Learning Repository. This dataset was originally from the National Institute of Diabetes, Digestive, and Kidney Disease [58]. The PID dataset has eight attributes and one output class with a binary value to indicate if the person has diabetes or not. Moreover, it contains 768 instances, 500 instances are non-diabetics while the remaining 268 are diabetic. PIMA has been chosen in this study because it is a well-known and a common benchmark dataset to compare the performance of methods between studies.
4.2. Data Pre-Processing
Three data pre-processing techniques have been applied using the Weka software tool. Since the values of the attributes in the PID have different scales, the values were normalized to range between 0 and 1. Then, the data was standardized to have a mean value of 0 and a standard deviation of 1. This is needed to train the data with algorithms like Naive Bayes and Logistic Regression that are based on Gaussian distribution. After that, the missing values were replaced with the average value of the related attribute. By completing the pre-processing step, it becomes ready to be trained using different techniques. The dataset is split into the training and testing sets using 10 fold cross validation.
4.3. Implementation and Results
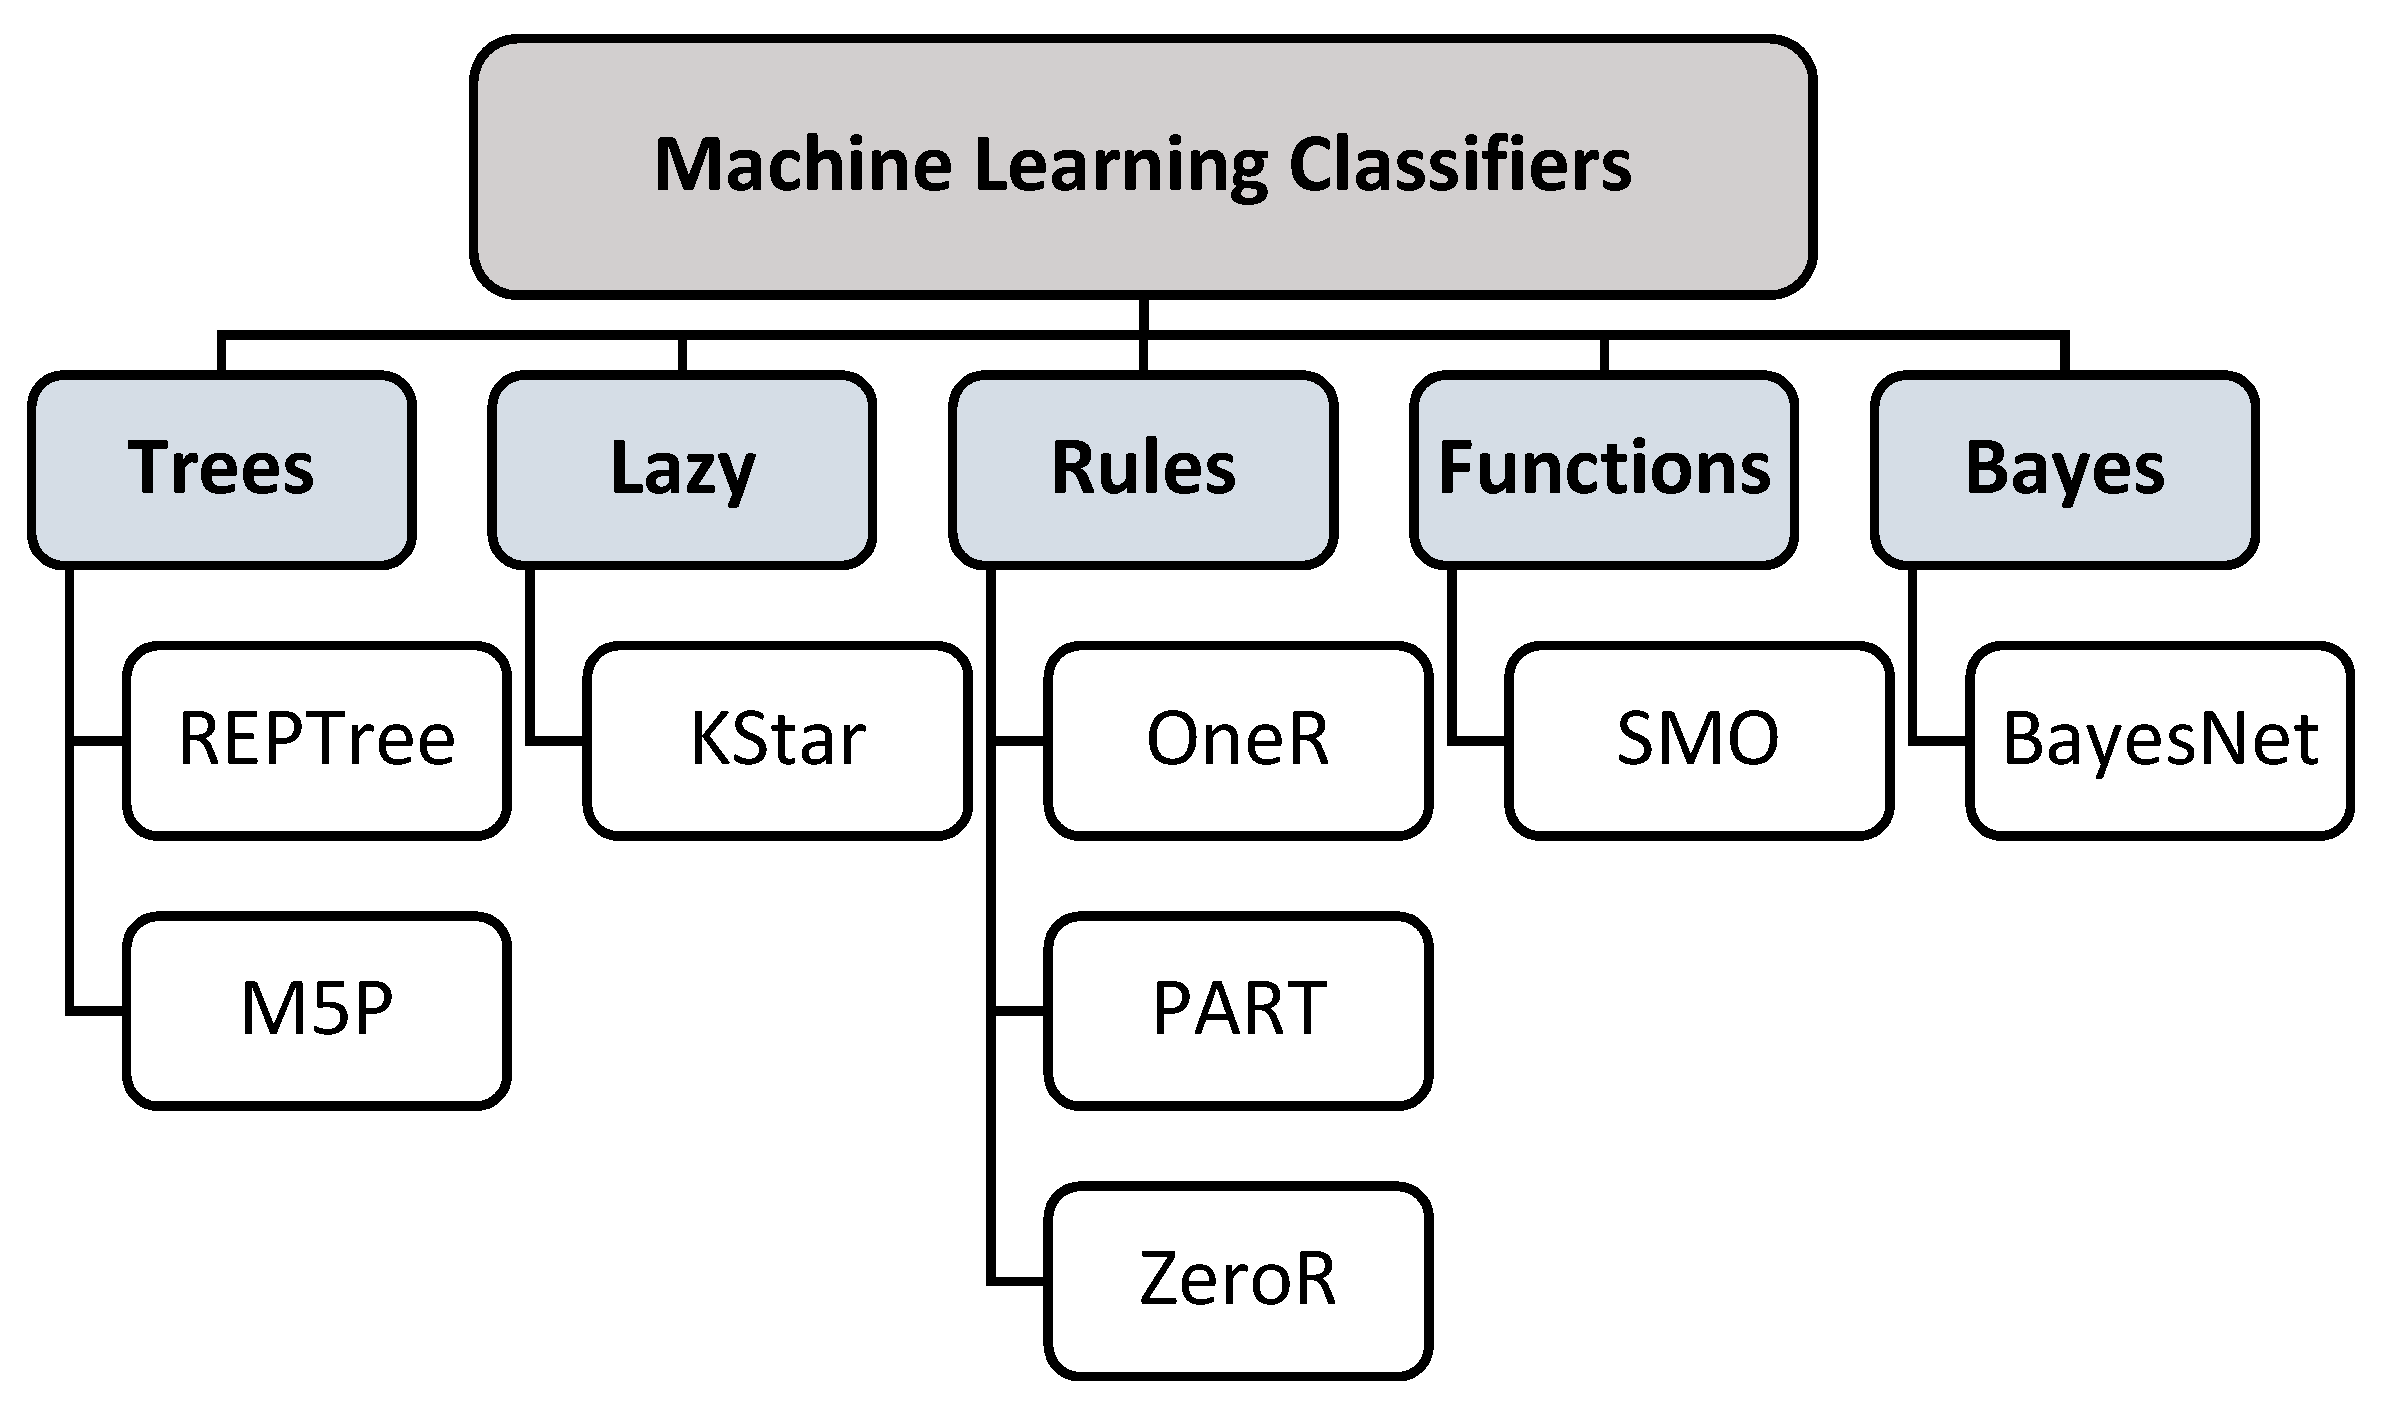
In this study, the unpopular ML classifiers in addition to the classifiers that have been used only once to predict diabetes in the last six years were examined. The Weka software tool was used to evaluate these classifiers on the Pima Indian dataset. The selection of the classifiers was based on their compatibility with the dataset. The selected classifiers were categorized according to their concepts as seen in Figure 3. The classifier types are Trees, Lazy, Rules, Functions, and Bayes. For each classifier, the accuracy, the precision, the recall, the F-measure, and the ROC Area were documented. In case of the unavailability of these measures, the root mean squared error (RMSE) is used, as shown in Table 1.
4.4. Discussion
The highest accuracy obtained by implementing the above classifiers was 74.48% attained by REPTree. REP stands for Reduces Error Pruning. It is a fast decision tree learner that generates multiple trees. Since it is a fast learner, its running time is short. It follows the principle of computing the information gain with entropy. Also, this principle is applied to minimize the error results between the actual and the desired output, which contributes in reaching a high accuracy [59]. Another high-performance model that belongs to the tree category is M5P. It stands for Multivariate Regression prediction model. It has been used in the prediction of student performance and revealed an accuracy of 97.17%. Also, when it is applied in this study, it performed very well with a Root Mean Squared Error reaching a value of 0.43. It quantifies the error at the nodes of the tree and therefore reducing its rate [60]. Moreover, this technique doesn’t require any parameter setting or previous knowledge about the domain. The classification steps are fast and simple. All these properties helped in generating a high accuracy. The only highlighted limitations of this technique is that it doesn’t perform well with non-numeric data. Also, the classification error rate increases with small training datasets [61].
Followed by the Rule-based classifiers where the results competed closely with the accuracy of REPTree. The Rule based classifiers that were examined are oneR, PART, and ZeroR. All of them performed well in predicting diabetes. They can classify new instances quickly and handle any missing values. Also, they are easy to generate and interpret [62].
Moreover, one of the classifiers under the function’s category has got a significant accuracy of 72.14%. It was attained by the SMO classifier. Sequential Minimal Optimization (SMO) is used in training the Support Vector Machines (SVM). This is due to the need for a solution to the quadratic programming (QP) optimization problem in order to train the SVM. SMO breaks the QP into small and manageable problems that can be solved in less time. Also, the amount of memory required to handle the small problems is minimized. This allows SMO to process very large datasets. Moreover, it has pre-processing abilities in which it replaces the missing values as well as transforming nominal values into binary ones. Furthermore, it performs normalization on the data by default. This helps in boosting the prediction accuracy [63].
For the Bayes category, the Bayes Nets gave remarkable results in many fields such as aircraft systems, scientific researches, and public safety [64]. Although, it performs well, it is not recommended to be used in prediction problems such as this study. This is due to the fact that this algorithm looks for the impact of the variables on the result. It outperforms regression functions when it comes to determine the effect of the variables.
The least accuracy was produced by the KStar classifier. It can handle noisy data and it requires less time to train the data. However, its performance becomes better with large datasets. Also, to use this technique, the value of the parameter k needs to be defined. The computation cost is very high as it needs to calculate the distance of the instances in the training sample [65].
As a summary, the decision tree algorithms obtained the highest accuracy and it is recommended to be used in the classification and prediction problems. The other algorithms have also a competitive accuracy. Hence, we recommend using these algorithms in the classification and prediction studies to take benefit from their strengths. Moreover, these algorithms can be used in a combined model with other Deep or Machine Learning techniques as well as Artificial Intelligence techniques to boost their accuracy.
5. Conclusions
Researchers are passionate to try different types of classifiers and build new models with an effort to enhance the accuracy of diabetes prediction. In this paper, the same vision was followed to reach high prediction accuracy. All the Machine Learning (ML) and Deep Learning (DL) classifiers that have been used in the last six years were reviewed regarding their frequency of use and accuracy. ML classifiers with one or zero frequency have been implemented on the PID dataset to set recommendations regarding their usage. The obtained accuracy by these ML techniques was 68%–74%. For the DL algorithms, the highest accuracy achieved by researchers was 95%. As a future work, the non-used classifiers can be applied to other datasets in a combined model to enhance further the accuracy of predicting the Diabetes disease.
Author Contributions
Conceptualization, S.L.-M.-S., L.A. and R.A., T.S.; methodology, L.A. and R.A.; software, L.A. and R.A.; validation, S.L.-M.-S., L.A. and R.A.; formal analysis L.A. and R.A.; investigation, S.L.-M.-S., L.A. and R.A.; resources, L.A. and R.A.; writing—original draft preparation L.A. and R.A.; writing—review and editing, S.L.-M.-S., T.S.; visualization, L.A. and R.A.; supervision, S.L.-M.-S.; project administration, T.S.; funding acquisition, T.S.
Funding
This research received no external funding.
Acknowledgments
This work was supported by the Artificial Intelligence and Data Analytics Lab (AIDA), Prince Sultan University, Riyadh, Saudi Arabia.
Conflicts of Interest
The authors declare no conflict of interest.
Appendix A

Table A1.
Summary of the Machine Learning Algorithm-related works.
| Ref | Year | Technique | Result | Dataset |
|---|---|---|---|---|
| [4] | 2015 | J48 | Accuracy: 73.82% | Pima Indians Diabetes Database |
| K-Nearest Neighbors (KNN) | Accuracy: K = 1, 70.18%, K = 3, 72.65%, K = 5, 73.17% | |||
| Random Forest | Accuracy: 71.74% | |||
| [5] | 2015 | J48 | Accuracy: 74.87% | Pima Indians Diabetes Database |
| Naïve Bayes | Accuracy: 76.96% | |||
| [17] | 2017 | Random Forest | Accuracy: 94% | Pima Indians Diabetes Database |
| Decision Tree- (ID3) | Accuracy: 88% | |||
| Naïve Bayes | Accuracy: 91% | |||
| [18] | 2015 | Support Vector Machine (SVM) | Accuracy: 95.52% | Private Dataset (Collected Manually) |
| Naïve Bayes | Accuracy: 94.52% | |||
| [19] | 2018 | Decision Tree | Accuracy: 73.82% | Pima Indians Diabetes Database |
| Support Vector Machine (SVM) | Accuracy: 65.10% | |||
| Naïve Bayes | Accuracy: 76.30% | |||
| [20] | 2017 | J48 | Precision:0.74, Recall: 0.74 F-Measure: 0.74 | Pima Indians Diabetes Database |
| Multilayer Perceptron Neural Network (MLP) | Precision: 0.75, Recall: 0.75, F-Measure: 0.75 | |||
| HoeffdingTree | Precision: 0.76, Recall: 0.76, F-Measure: 0.76 | |||
| JRip | Precision: 0.76, Recall: 0.76, F-Measure: 0.76 | |||
| BayesNet | Precision: 0.74, Recall: 0.74, F-Measure: 0.74 | |||
| Random Forest | Precision: 0.75, Recall: 0.76, F-Measure: 0.76 | |||
| [21] | 2016 | Support Vector Machine (SVM) | Accuracy: 72.93% | Global dataset Combined of All the Available Datasets |
| [22] | 2014 | Multilayer Feed Forward Neural Network - Back-Propagation Algorithm (ANN) | Accuracy: 82% | Pima Indians Diabetes Database |
| [23] | 2016 | Probabilistic Neural Network (PNN) | Training Accuracy: 89.56%, Testing Accuracy: 81.49% | Pima Indians Diabetes Database |
| [24] | 2017 | Two-Class Neural Network | Accuracy: 83.3% | Pima Indians Diabetes Database |
| [25] | 2017 | The Levenberg Marquardt Learning Algorithm | Mean squared error: 0.00025091 | Pima Indians Diabetes Database |
| The Bayesian Regulation Learning Algorithm | Mean squared error: 2.021e-05 | |||
| The Scaled Conjugate Gradient Learning Algorithm | Mean squared error: 8.3583 | |||
| [26] | 2013 | Support Vector Machine (SVM) | Accuracy: 78% | Pima Indians Diabetes Database |
| [27] | 2013 | Logistic Regression (LR), K-Nearest Neighbour (K-NN), and Support Vector Machines (SVM) | Accuracy: LR 79.4%, K-NN 77.6%, SVM 79.4% | Kuwait Health Network (KHN) that integrates data from primary health centers and hospitals in Kuwait. |
| [28] | 2013 | Artificial Neural Networks (ANN), Support Vector Machines (SVM), and Random Forests (RF) | Area Under Curve (AUC): ANN 75.1%, Radial Base Function (RBF)-SVM 97.9%, RF 76.3% | Iran Population Dataset |
| [29] | 2013 | Higher Order Neural Network (HONN) | Mean Square Error: Training: 7.5257e-04, Testing: 1.4219e-05 | Pima Indians Diabetes Database |
| [30] | 2014 | Artificial Neural Network (ANN) and Support Vector Machine (SVM) | Dataset for KNHANES 2010: Accuracy: ANN 69%, SVM 64.9% | Korean National Health and Nutrition Examination Survey (KNHANES) 2010 and 2011 Datasets |
| Dataset for KNHANES 2011: Accuracy: ANN 60.7%, SVM 66.1% | ||||
| [31] | 2014 | Naïve Bayes | Accuracy: 96% | Private Dataset (Collected Manually) |
| Artificial Neural Networks (ANN) | Accuracy: 95% | |||
| K- Nearest Neighbors (KNN) | Accuracy: 91% | |||
| [32] | 2015 | Back Propagation Neural Network and Levenberg–Marquardt Optimizer | Accuracy: 91% | Pima Indians Diabetes Database |
| [33] | 2015 | Classification and Regression Tree (CART) | Accuracy: 75% | Private Dataset (Collected Manually) |
| [34] | 2016 | Logistic Regression (LR), Support Vector Machine (SVM) and Artificial Neural Network (ANN) | Accuracy: LR 75.86%, Radial Base Function (RBF)-SVM 84.09%, NN 80.7% | Private Dataset (Collected Manually) |
| [35] | 2016 | Standalone J48, Adaboost Ensemble using J48, and Bagging Ensemble using J48 | Accuracy Based on Area under Receiver Operating Characteristic (AROC): Bagging Ensemble using J48 0.98% (The accuracies weren’t mentioned explicitly for Standalone J48 and Adaboost Ensemble using J48) | CPCSSN Database |
| [36] | 2016 | Back Propagation Neural Network (ANN) | Accuracy: 81% | Not Mentioned |
| [37] | 2015 | J48 | Sensitivity: 0.89, Specificity: 0.91 | Private Dataset (Collected Manually) |
| Naïve Bayes | Sensitivity: 0.77, Specificity: 0.86 | |||
| Support Vector Machine with Polykernel (SVM) | Sensitivity: 0.81, Specificity: 0.89 | |||
| Support Vector Machine (SVM) with Radial Basis Function Kernel (RBF) | Sensitivity: 0.83, Specificity: 0.83 | |||
| Multilayer Perceptron Neural Network (MLP) | Sensitivity: 0.83, Specificity: 0.89 | |||
| [38] | 2015 | Logistic Regression (LR), Linear Discriminant Analysis (LDA), Naïve Bayes (NB) and Support Vector Machine (SVM) | Accuracy using mRMR method: SVM 75%, LR: 75%, LDA: 75%, NB: 72% | Chinese Gut Microbiota Datasets |
| Accuracy using mRMR method: SVM: 71%, LR: 73%, LDA: 68%, NB: 69% | European Gut Microbiota Datasets | |||
| [39] | 2017 | Kernel Cross Validation 10: Linear Discriminant Analysis | Accuracy: 77.86% | Pima Indians Diabetes Database |
| Kernel Cross Validation 10: Quadratic Discriminant Analysis | Accuracy: 76.56% | |||
| Kernel Cross Validation 10: Naïve Bayes | Accuracy: 77.57% | |||
| Kernel Cross Validation 10: Gaussian Process | Accuracy: 81.97% | |||
| [40] | 2017 | Perception | Accuracy: 0.72 | 3 Datasets: NHANES0506, NHANES0708, and NHANES0910 |
| Ensemble Perception | Accuracy: 0.75 | |||
| [41] | 2017 | Kernel-Based Adaptive Filtering Algorithm | The CGM signals of a random subject are used to assess the prediction accuracy. | Private Dataset |
Table A2.
Summary of the Deep Learning technique-related works.
| Ref | Year | Technique | Result | Dataset |
|---|---|---|---|---|
| [43] | 2016 | Unsupervised Deep Learning Neural Network (Deep Patient) | Area Under the ROC Curve (AUC-ROC): 0.91 | Electronic Health Records |
| [42] | 2017 | Convolutional Neural Network (CNN) | Accuracy: 77.5% | Continuous Glucose Monitoring (CGM) signals. |
| Multilayer Perceptron Neural Network (MLP) | Accuracy: 72.5% | |||
| Logistic Regression | Accuracy: 65.2% | |||
| [7] | 2017 | Recurrent Deep Neural Network (RNN) | Accuracy: Type 1 Diabetes = 78% | Pima Indians Diabetes Dataset |
| Type 2 Diabetes = 81% | ||||
| [44] | 2017 | Deep Neural Network Long Short-Term Memory (LTSM) | Precision: 59.6% | large regional Australian hospital dataset |
| Markov Chain Neural Network | Precision: 34.1% | |||
| Plain Recurrent Deep Neural Network (RNN) | Precision: 58.0 | |||
| [46] | 2018 | Modified Convolution Neural Network (CNN) | Receiver Operating Characteristic (ROC): 0.96 | Breath Dataset Private |
| [8] | 2018 | Convolutional Neural Network (CNN) | Accuracy: 90.9% | Electrocardiograms (ECG) Private |
| Convolutional Neural Network (CNN) combined with Long Short-Term Memory (LSTM) | Accuracy: 95.1% | |||
| [7] | 2018 | Deep Learning Architecture (MLP/General regression neural network (GRNN)/Radial Basis Function (RBF) | Accuracy: 88.41% | Pima Indians Diabetes Dataset |
Table A3.
Summary of the Combined Models related works.
| Ref | Year | Technique | Result | Dataset |
|---|---|---|---|---|
| [47] | 2013 | Feedforward Neural Network and Bird Mating Optimizer | Training Set: Avg. 23.57. Std. 1.44, Testing Set: Avg. 22.55. Std. 1.89. | Pima Indians Diabetes Dataset |
| [11] | 2013 | Simple KNN | Accuracy: 73.17% | Pima Indians Diabetes Dataset |
| K-means and KNN | Accuracy: 97.0% | |||
| Amalgam and KNN | Accuracy: 97.4% | |||
| [9] | 2016 | Logistic Regression and Feedforward Neural Network | Error Rate: 0.0002. | Association of Diabetic’s City of Urmia Dataset |
| [10] | 2016 | Support Vector Machine (SVM) and Neural Network (NN) | Accuracy: 96.09% | Pima Indians Diabetes Dataset |
| [23] | 2017 | Classification and Regression Trees (CART) is used to generate the fuzzy rules that were used in predicting diabetes | Accuracy for Pima Indian Dataset: 92% | Pima Indian Dataset, Mesothelioma, WDBC, StatLog, Cleveland and Parkinson’s Telemonitoring datasets |
| [48] | 2018 | Sequential Minimal Optimization (SMO), Support Vector Machine (SVM) and Elephant Herding Optimizer | Accuracy for Pima Indian: 78.21% | 17 Medical Dataset Including Pima Indian Diabetes Dataset |
Table A4.
Summary of datasets used in diabetes prediction.
| Dataset | Reference | Number of Samples | Number of Features | Features | Link |
|---|---|---|---|---|---|
| University of California Irvine (UCI) machine learning data repository for diabetes mellitus | [4] | -- | 8 | Number of times pregnant, Plasma glucose concentration (glucose tolerance test), Diastolic blood pressure (mm Hg), Triceps skin fold thickness (mm), Hour serum insulin (mu U/mL), Body mass index (weight in kg/(height in m)^2), Diabetes pedigree function, Age (years) | http://mldata.org/repository/data/viewslug/datasets-uci-diabetes |
| Pima Indians Diabetes Dataset [17] | [17] | 75,664 | 13 | The main used: Plasma glucose concen-tration, Diastolic blood pressure, Triceps skin fold thickness, 2-hour serum insulin, Body mass index (BMI), Diabetes pedigree function, and Age. | https://www.kaggle.com/uciml/pima-indians-diabetes-database |
| [19] | 768 | 8 | |||
| [20] | 768 | 8 | |||
| [21] | 102,538 | 49 | |||
| [22] | 768 | 8 | |||
| [23] | 768 | 8 | |||
| [24] | 392 | 8 | |||
| [25] | 768 | 8 | |||
| [7] | 768 | 8 | |||
| [45] | 768 | 8 | |||
| Electrocardiograms (ECG) | [8] | 142,000 | 8 | The main attributes: glucose concentration in plasma, blood pressure, body mass index, age. | Private |
| Private dataset collected from three different locations in Kosovo | [18] | 402 | 8 | BMI, Pre meal glucose, Post meal glucose, Diastolic blood pressure, Systolic blood pressure, Family history of diabetes, Regular diet, and Physical activities. | Not available |
| Breath Dataset | [46] | 15 | 7 | Type (Healthy, Type 2, Type 1), Gender (Male/Female), Age, BMI, Range of HbA1c, Duration of Diabetes (years), Range of Acetone Values Obtained (ppm). | Not available |
Table A5.
Summary of the advantages and disadvantages of ML and DL algorithms.
| Advantages | Disadvantages | |
|---|---|---|
| ANN | (1) Extracts the essential attributes from inputs that contain irrelevant data. (2) Deals with vague cases. (3) Has been successfully applied in many fields such as disease prediction. | (1) Too many hidden layers will result in an overfitting problem. (2) The random initialization of the weight does not always lead to the best solution. (3) The structure can be determined only through trial and experience. (4) Works only with numerical data. |
| SVM | (1) Works well with unstructured and semi-structured datasets such as images and text. (2) Can attain accurate and robust results. (3) Is successfully used in medical applications. | (1) Requires long training time when it is used with large datasets. (2) Is hard sometimes to select the right kernel function. (3) The weights of the variables are difficult to interpret in the final model |
| Naive Bayes | (1) Works well with the data that has missing values or unbalancing issues. (2) Works with categorical and continuous values. (3) Requires a small amount of data to set its parameters. | (1) All the features must be independent to each other. (2) The conditional independence might cause a drop in the accuracy. |
| Decision Tree | (1) Easy to understand and implement especially when using a graphical representation. (2) Works well with numerical and categorical data. (3) Does not require much data pre-processing work. | (1) Small change in the data can have a significant effect on the final predictions. (2) Does not perform well with large datasets due to the increase complexity of the tree. |
| CNN | (1) Performs automatic feature extraction. (2) Can show the correlation between the elements for the provided inputs. (3) Requires less time in classification and result in a high accuracy especially in image processing. | (1) The computational cost is high. (2) Can’t perform well without a large amount of training data. |
| MLP | (1) Suitable for classification, regression, and prediction problems. (2) Can be employed to different types of data: image, text, etc. | (1) Inadequate for modern advanced computer vision field. (2) The total number of parameters can be very large. |
| RNN | (1) More accurate in predicting what will be next thanks to remembering capability. (2) Powerful in complex problems. (3) Deals with sequential data inputs instead of fixed-sized vectors. | (1) Vanishing gradients problem. (2) Difficult to calculate the weights and biases which drop the accuracy. |
| LTSM | (1) Encompasses of multiple memory blocks that can overcome the vanishing gradient problem. (2) Used in Natural Language Processing applications. | (1) High computational time required to calculate the memory bandwidth for the processing units which makes it harder to train the data. |
References
- Cho, N.; Shaw, J.; Karuranga, S.; Huang, Y.; Fernandes, J.D.R.; Ohlrogge, A.; Malanda, B. IDF Diabetes Atlas: Global estimates of diabetes prevalence for 2017 and projections for 2045. Diabetes Res. Clin. Pr. 2018, 138, 271–281. [Google Scholar] [CrossRef] [PubMed]
- Sanz, J.A.; Galar, M.; Jurio, A.; Brugos, A.; Pagola, M.; Bustince, H. Medical diagnosis of cardiovascular diseases using an interval-valued fuzzy rule-based classification system. Appl. Soft Comput. 2014, 20, 103–111. [Google Scholar] [CrossRef]
- Varma, K.V.; Rao, A.A.; Lakshmi, T.S.M.; Rao, P.N. A computational intelligence approach for a better diagnosis of diabetic patients. Comput. Electr. Eng. 2014, 40, 1758–1765. [Google Scholar] [CrossRef]
- Kandhasamy, J.P.; Balamurali, S. Performance Analysis of Classifier Models to Predict Diabetes Mellitus. Procedia Comput. Sci. 2015, 47, 45–51. [Google Scholar] [CrossRef] [Green Version]
- Iyer, A.; Jeyalatha, S.; Sumbaly, R. Diagnosis of Diabetes Using Classification Mining Techniques. Int. J. Data Min. Knowl. Manag. Process. 2015, 5, 1–14. [Google Scholar] [CrossRef]
- Razavian, N.; Blecker, S.; Schmidt, A.M.; Smith-McLallen, A.; Nigam, S.; Sontag, D. Population-Level Prediction of Type 2 Diabetes from Claims Data and Analysis of Risk Factors. Big Data 2015, 3, 277–287. [Google Scholar] [CrossRef]
- Ashiquzzaman, A.; Kawsar Tushar, A.; Rashedul Islam, M.D.; Shon, D.; Kichang, L.M.; Jeong-Ho, P.; Dong-Sun, L.; Jongmyon, K. Reduction of overfitting in diabetes prediction using deep learning neural network. In IT Convergence and Security; Lecture Notes in Electrical Engineering; Springer: Singapore, 2017; Volume 449. [Google Scholar]
- Swapna, G.; Soman, K.P.; Vinayakumar, R. Automated detection of diabetes using CNN and CNN-LSTM network and heart rate signals. Procedia Comput. Sci. 2018, 132, 1253–1262. [Google Scholar]
- Rahimloo, P.; Jafarian, A. Prediction of Diabetes by Using Artificial Neural Network, Logistic Regression Statistical Model and Combination of Them. Bull. Société R. Sci. Liège 2016, 85, 1148–1164. [Google Scholar]
- Gill, N.S.; Mittal, P. A computational hybrid model with two level classification using SVM and neural network for predicting the diabetes disease. J. Theor. Appl. Inf. Technol. 2016, 87, 1–10. [Google Scholar]
- NirmalaDevi, M.; Alias Balamurugan, S.A.; Swathi, U.V. An amalgam KNN to predict diabetes mellitus. In Proceedings of the 2013 IEEE International Conference ON Emerging Trends in Computing, Communication and Nanotechnology (ICECCN), Tirunelveli, India, 25–26 March 2013; pp. 691–695. [Google Scholar]
- Sun, Y.L.; Zhang, D.L. Machine Learning Techniques for Screening and Diagnosis of Diabetes: A Survey. Teh. Vjesn. 2019, 26, 872–880. [Google Scholar]
- Choudhury, A.; Gupta, D. A Survey on Medical Diagnosis of Diabetes Using Machine Learning Techniques. In Recent Developments in Machine Learning and Data Analytics; Springer: Singapore, 2019; pp. 67–68. [Google Scholar]
- Meherwar, F.; Maruf, P. Survey of Machine Learning Algorithms for Disease Diagnostic. J. Intell. Learn. Syst. Appl. 2017, 9, 1–16. [Google Scholar] [Green Version]
- Vijiyarani, S.; Sudha, S. Disease Prediction in Data Mining Technique—A Survey. Int. J. Comput. Appl. Inf. Technol. 2013, 2, 17–21. [Google Scholar]
- Deo, R.C. Machine Learning in Medicine. Circulation 2015, 132, 1920–1930. [Google Scholar] [CrossRef] [PubMed] [Green Version]
- Yuvaraj, N.; SriPreethaa, K.R. Diabetes prediction in healthcare systems using machine learning algorithms on Hadoop cluster. Clust. Comput. 2017, 22, 1–9. [Google Scholar] [CrossRef]
- Tafa, Z.; Pervetica, N.; Karahoda, B. An intelligent system for diabetes prediction. In Proceedings of the 2015 4th Mediterranean Conference on Embedded Computing (MECO), Budva, Montenegro, 14–18 June 2015; pp. 378–382. [Google Scholar]
- Sisodia, D.; Sisodia, D.S. Prediction of Diabetes using Classification Algorithms. Procedia Comput. Sci. 2018, 132, 1578–1585. [Google Scholar] [CrossRef]
- Mercaldo, F.; Nardone, V.; Santone, A. Diabetes Mellitus Affected Patients Classification and Diagnosis through Machine Learning Techniques. Procedia Comput. Sci. 2017, 112, 2519–2528. [Google Scholar] [CrossRef]
- Negi, A.; Jaiswal, V. A first attempt to develop a diabetes prediction method based on different global datasets. In Proceedings of the 2016 Fourth International Conference on Parallel, Distributed and Grid Computing (PDGC), Waknaghat, India, 22–24 December 2016; pp. 237–241. [Google Scholar]
- Olaniyi, E.O.; Adnan, K. Onset diabetes diagnosis using artificial neural network. Int. J. Sci. Eng. Res. 2014, 5, 754–759. [Google Scholar]
- Soltani, Z.; Jafarian, A. A New Artificial Neural Networks Approach for Diagnosing Diabetes Disease Type II. Int. J. Adv. Comput. Sci. Appl. 2016, 7, 89–94. [Google Scholar] [CrossRef]
- Somnath, R.; Suvojit, M.; Sanket, B.; Riyanka, K.; Priti, G.; Sayantan, M.; Subhas, B. Prediction of Diabetes Type-II Using a Two-Class Neural Network. In Proceedings of the 2017 International Conference on Computational Intelligence, Communications, and Business Analytics, Kolkata, India, 24–25 March 2017; pp. 65–71. [Google Scholar]
- Mamuda, M.; Sathasivam, S. Predicting the survival of diabetes using neural network. In Proceedings of the AIP Conference Proceedings, Bydgoszcz, Poland, 9–11 May 2017; Volume 1870, pp. 40–46. [Google Scholar]
- Kumari, V.A.; Chitra, R. Classification of diabetes disease using support vector machine. Int. J. Adv. Comput. Sci. Appl. 2013, 3, 1797–1801. [Google Scholar]
- Farran, B.; Channanath, A.M.; Behbehani, K.; Thanaraj, T.A. Predictive models to assess risk of type 2 diabetes, hypertension and comorbidity: Machine-learning algorithms and validation using national health data from Kuwait—A cohort study. BMJ Open 2013, 3, 24–57. [Google Scholar] [CrossRef]
- Tapak, L.; Mahjub, H.; Hamidi, O.; Poorolajal, J. Real-Data Comparison of Data Mining Methods in Prediction of Diabetes in Iran. Healthc. Inform. Res. 2013, 19, 177–185. [Google Scholar] [CrossRef] [PubMed] [Green Version]
- Anand, R.; Kirar, V.P.S.; Burse, K. K-fold cross validation and classification accuracy of pima Indian diabetes data set using higher order neural network and PCA. Int. J. Soft Comput. Eng. 2013, 2, 2231–2307. [Google Scholar]
- Choi, S.B.; Kim, W.J.; Yoo, T.K.; Park, J.S.; Chung, J.W.; Lee, Y.H.; Kang, E.S.; Kim, D.W. Screening for Prediabetes Using Machine Learning Models. Comput. Math. Methods Med. 2014, 2014, 1–8. [Google Scholar] [CrossRef] [PubMed] [Green Version]
- Sarwar, A.; Sharma, V. Comparative analysis of machine learning techniques in prognosis of type II diabetes. AI Soc. 2014, 29, 123–129. [Google Scholar] [CrossRef]
- Durairaj, M.; Kalaiselvi, G. Prediction of Diabetes using Back propagation Algorithm. Int. J. Innov. Technol. 2015, 1, 21–25. [Google Scholar]
- Anand, A.; Shakti, D. Prediction of diabetes based on personal lifestyle indicators. In Proceedings of the 2015 1st International Conference on Next Generation Computing Technologies (NGCT), Dehradun, India, 4–5 September 2015; pp. 673–676. [Google Scholar]
- Malik, S.; Khadgawat, R.; Anand, S.; Gupta, S. Non-invasive detection of fasting blood glucose level via electrochemical measurement of saliva. SpringerPlus 2016, 5, 701. [Google Scholar] [CrossRef] [PubMed]
- Perveen, S.; Shahbaz, M.; Guergachi, A.; Keshavjee, K. Performance Analysis of Data Mining Classification Techniques to Predict Diabetes. Procedia Comput. Sci. 2016, 82, 115–121. [Google Scholar] [CrossRef] [Green Version]
- Joshi, S.; Borse, M. Detection and Prediction of Diabetes Mellitus Using Back-Propagation Neural Network. In Proceedings of the 2016 International Conference on Micro-Electronics and Telecommunication Engineering (ICMETE), Uttarpradesh, India, 22–23 September 2016; pp. 110–113. [Google Scholar]
- Sowjanya, K.; Singhal, A.; Choudhary, C. MobDBTest: A machine learning based system for predicting diabetes risk using mobile devices. In Proceedings of the 2015 IEEE International Advance Computing Conference (IACC), Bangalore, India, 12–13 June 2015; pp. 397–402. [Google Scholar]
- Cai, L.; Wu, H.; Li, D.; Zhou, K.; Zou, F. Type 2 Diabetes Biomarkers of Human Gut Microbiota Selected via Iterative Sure Independent Screening Method. PLoS ONE 2015, 10, e0140827. [Google Scholar] [CrossRef] [PubMed]
- Maniruzzaman, M.; Kumar, N.; Menhazul Abedin, M.; Shaykhul Islam, M.; Suri, H.S.; El-Baz, A.S.; Suri, J.S. Comparative approaches for classification of diabetes mellitus data: Machine learning paradigm. Comput. Methods Programs Biomed. 2017, 152, 23–34. [Google Scholar] [CrossRef]
- Mirshahvalad, R.; Zanjani, N.A. Diabetes prediction using ensemble perceptron algorithm. In Proceedings of the 2017 9th International Conference on Computational Intelligence and Communication Networks (CICN), Girne, Cyprus, 16–17 September 2017; pp. 190–194. [Google Scholar]
- Sun, X.; Yu, X.; Liu, J.; Wang, H. Glucose prediction for type 1 diabetes using KLMS algorithm. In Proceedings of the 2017 36th Chinese Control Conference (CCC), Liaoning, China, 26–28 July 2017; pp. 1124–1128. [Google Scholar]
- Mohebbi, A.; Aradóttir, T.B.; Johansen, A.R.; Bengtsson, H.; Fraccaro, M.; Mørup, M. A deep learning approach to adherence detection for type 2 diabetics. In Proceedings of the 2017 39th Annual International Conference of the IEEE Engineering in Medicine and Biology Society (EMBC), Jeju, Korea, 11–15 July 2017; pp. 2896–2899. [Google Scholar]
- Miotto, R.; Li, L.; Kidd, B.A.; Dudley, J.T. Deep Patient: An Unsupervised Representation to Predict the Future of Patients from the Electronic Health Records. Sci. Rep. 2016, 6, 26094. [Google Scholar] [CrossRef]
- Pham, T.; Tran, T.; Phung, D.; Venkatesh, S. Predicting healthcare trajectories from medical records: A deep learning approach. J. Biomed. Inform. 2017, 69, 218–229. [Google Scholar] [CrossRef] [PubMed]
- Balaji, H.; Iyengar, N.; Caytiles, R.D. Optimal Predictive analytics of Pima Diabetics using Deep Learning. Int. J. Database Theory Appl. 2017, 10, 47–62. [Google Scholar] [CrossRef]
- Lekha, S.; Suchetha, M. Real-Time Non-Invasive Detection and Classification of Diabetes Using Modified Convolution Neural Network. IEEE J. Biomed. Health Inform. 2018, 22, 1630–1636. [Google Scholar] [CrossRef] [PubMed]
- Askarzadeh, A.; Rezazadeh, A. Artificial neural network training using a new efficient optimization algorithm. Appl. Soft Comput. 2013, 13, 1206–1213. [Google Scholar] [CrossRef]
- Rao, N.M.; Kannan, K.; Gao, X.Z.; Roy, D.S. Novel classifiers for intelligent disease diagnosis with multi-objective parameter evolution. Comput. Electr. Eng. 2018, 67, 483–496. [Google Scholar]
- Begg, R.; Kamruzzaman, J.; Sarkar, R. Neural Networks in Healthcare: Potential and Challenges; Idea Group Publishing: Hershey, PA, USA, 2006. [Google Scholar]
- Greeshma, U.; Annalakshmi, S. Artificial Neural Network (Research paper on basics of ANN). Int. J. Sci. Eng. Res. 2015, 110–115. [Google Scholar]
- Zhang, G.; Patuwo, B.E.; Hu, M.Y. Forecasting with artificial neural networks: The state of the art. Int. J. Forecast. 1998, 14, 35–62. [Google Scholar] [CrossRef]
- Srivastava, N.; Hinton, G.; Krizhevsky, A.; Sutskever, I.; Salakhutdinov, R. Dropout: A simple way to prevent neural networks from overfitting. J. Mach. Learn. Res. 2014, 15, 1929–1958. [Google Scholar]
- Vidyasagar, M. Learning and Generalisation: With Applications to Neural Networks; Springer Science & Business Media: London, UK, 2013. [Google Scholar]
- Maren, A.J.; Harston, C.T.; Pap, R.M. Handbook of Neural Computing Applications; Academic Press: Cambridge, MA, USA, 2014. [Google Scholar]
- Karayiannis, N.; Venetsanopoulos, A.N. Artificial Neural Networks: Learning Algorithms, Performance Evaluation and Applications; Springer Science & Business Media: London, UK, 2013; Volume 209. [Google Scholar]
- Goodfellow, I.; Bengio, Y.; Courville, A.; Bengio, Y. Deep Learning; MIT Press: Cambridge, MA, USA, 2016. [Google Scholar]
- Hassan, A. Deep Neural Language Model for Text Classification Based on Convolutional and Recurrent Neural Networks. Ph.D. Thesis, University of Bridgeport, Bridgeport, CT, USA, 2018. [Google Scholar]
- Kar, A.K. Bio inspired computing—A review of algorithms and scope of applications. Expert Syst. Appl. 2016, 59, 20–32. [Google Scholar] [CrossRef]
- Naji, H.; Ashour, W. Text Classification for Arabic Words Using Rep-Tree. Int. J. Comput. Sci. Inf. Technol. 2016, 8, 101–108. [Google Scholar] [CrossRef]
- Kumar, S.C.; Chowdary, E.D.; Venkatramaphanikumar, S.; Kishore, K.V.K. M5P model tree in predicting student performance: A case study. In Proceedings of the IEEE International Conference on Recent Trends in Electronics, Information & Communication Technology (RTEICT), Bangalore, India, 20–21 May 2016; pp. 1103–1107. [Google Scholar]
- Sharma, R.; Kumar, S.; Maheshwari, R. Comparative Analysis of Classification Techniques in Data Mining Using Different Datasets. Int. J. Comput. Sci. Mobile Comput. 2015, 44, 125–134. [Google Scholar]
- Fernández-Delgado, M.; Cernadas, E.; Barro, S.; Amorim, D. Do we need hundreds of classifiers to solve real world classification problems. J. Mach. Learn. Res. 2014, 15, 3133–3181. [Google Scholar]
- Platt, J. Fast Training of Support Vector Machines Using Sequential Minimal Optimization. In Advances in Kernel Methods: Support Vector Learning, Advances in Kernel Methods—Support Vector Learning, Advances; MIT Press: Cambridge, MA, USA, 1998; pp. 185–208. ISBN 0-262-19416-3. [Google Scholar]
- Su, J.; Zhang, H. Full Bayesian network classifiers. In Proceedings of the 23rd International Conference on Machine Learning, Pittsburgh, PA, USA, 25–29 June 2006; pp. 897–904. [Google Scholar]
- Mahmood, D.Y.; Hussein, M.A. Intrusion detection system based on K-star classifier and feature set reduction. IOSR J. Comput. Eng. 2013, 15, 107–112. [Google Scholar]
Figure 1.
Frequencies of Machine Learning Classifiers.

Figure 2.
Frequencies of Deep Learning Techniques.

Figure 3.
Rarely and non-used Machine Learning Classifiers in diabetes prediction in the last six years.
Figure 3.
Rarely and non-used Machine Learning Classifiers in diabetes prediction in the last six years.

Table 1.
Accuracy results of rarely and non-used Machine Learning Classifiers for diabetes prediction.
Table 1.
Accuracy results of rarely and non-used Machine Learning Classifiers for diabetes prediction.
| Classifiers | Evaluation Metrics | ||||
|---|---|---|---|---|---|
| Accuracy | Precision | Recall | F-Measure | ROC Area | |
| REPTree | 74.48% | 0.67 | 0.53 | 0.59 | 0.76 |
| M5P | Root Mean Squared Error = 0.43 | ||||
| KStar | 68.23% | 0.58 | 0.33 | 0.42 | 0.68 |
| oneR | 70.83% | 0.61 | 0.46 | 0.52 | 0.65 |
| PART | 74.35% | 0.70 | 0.47 | 0.56 | 0.77 |
| ZeroR | Root Mean Squared Error = 0.4771 | ||||
| SMO | 72.14% | 0.78 | 0.28 | 0.41 | 0.62 |
| BayesNet | 73.83% | 0.64 | 0.57 | 0.60 | 0.81 |
© 2019 by the authors. Licensee MDPI, Basel, Switzerland. This article is an open access article distributed under the terms and conditions of the Creative Commons Attribution (CC BY) license (http://creativecommons.org/licenses/by/4.0/).
Share and Cite
MDPI and ACS Style
Larabi-Marie-Sainte, S.; Aburahmah, L.; Almohaini, R.; Saba, T. Current Techniques for Diabetes Prediction: Review and Case Study. Appl. Sci. 2019, 9, 4604. https://doi.org/10.3390/app9214604
AMA Style
Larabi-Marie-Sainte S, Aburahmah L, Almohaini R, Saba T. Current Techniques for Diabetes Prediction: Review and Case Study. Applied Sciences. 2019; 9(21):4604. https://doi.org/10.3390/app9214604
Chicago/Turabian StyleLarabi-Marie-Sainte, Souad, Linah Aburahmah, Rana Almohaini, and Tanzila Saba. 2019. "Current Techniques for Diabetes Prediction: Review and Case Study" Applied Sciences 9, no. 21: 4604. https://doi.org/10.3390/app9214604
Note that from the first issue of 2016, this journal uses article numbers instead of page numbers. See further details here.