Experimental Study of the Mechanical Behavior of the Steel–Concrete Joints in a Composite Truss Bridge
by
 , and
, and
Yingliang Tan
1 ,
,
Bing Zhu
1,
Tingyi Yan
1,
Biao Huang
1,
Xuewei Wang
2,
Wenwei Yang
3 and
Bo Huang
1,* 1
School of Civil Engineering, Southwest Jiaotong University, Chengdu 610031, China
2
College of Civil Engineering, Sichuan Agricultural University, Dujiangyan 611830, China
3
College of Civil and Hydraulic Engineering, Ningxia University, Yinchuan 750021, China
*
Author to whom correspondence should be addressed.
Appl. Sci. 2019, 9(5), 854; https://doi.org/10.3390/app9050854
Submission received: 4 January 2019
/
Revised: 14 February 2019
/
Accepted: 21 February 2019
/
Published: 27 February 2019
(This article belongs to the Special Issue Emerging Construction Materials and Sustainable Infrastructure)
Abstract
:The mechanical behavior of the steel–concrete joints in a composite bridge was investigated. Pull-out tests on eight specimens were carried out to evaluate the connection performance of Perfobond rib shear connectors (PBL shear connectors). In addition, static load tests were conducted on three composite joint specimens with a scale of 1/2 in a composite truss bridge. The crack load, load–displacement curves, strain distribution, and the joint stiffness were obtained from the composite joint to analyze the mechanical behavior of steel–concrete joints. The experimental results show that the embedded depth plays an important role in the ultimate bearing capacity and the deformation of PBL shear connectors and could even change the failure mode. Based on the test results of composite joints, the displacement increased almost linearly with the horizontal load on the concrete chord. There was no evident failure, and large deformation occurred in composite joints. In addition, the ultimate loads obtained from three composite joint specimens were greater than 2.93 times the design load (2050 kN). These investigated composite joints had excellent bearing capacity (above 6000 kN). This study will provide an experimental reference for the design of steel–concrete joints for composite truss bridges.
1. Introduction
To take full advantage of materials in civil infrastructure, many steel–concrete composite structures have been proposed and investigated, such as concrete-encased composite structures [1,2,3], concrete-filled steel tubular (CFST) structures [4,5,6,7,8], steel–concrete composite truss structures [9,10,11,12], and so on. In particular, steel–concrete composite truss structures have been widely used in bridge construction because they combine the advantages of steel truss structures [13,14,15,16,17] and reinforced concrete structures [18,19,20], including structural simplicity, low maintenance, high stiffness, and high bearing capacity. Many engineering examples of such bridge structures have been constructed all over the world. The Arbois Bridge in France was the first composite truss bridge in the world [9]; subsequently, many composite truss bridges (e.g., the Boulonnais Viaduct [21,22], the Lully Viaduct [23], Sarutagawa Bridge, Tomoegawa Bridge [24], Shitsumi Ohashi Bridge [25], and the Kinokawa Viaduct [26]) have been constructed. However, in China, research and applications of such bridges are quite a recent development. In 2005, concrete web members were replaced by steel truss webs with circular hollow sections on the Beijing–Zhenzhou highway/railway bridge. It was the first time such structures were applied to bridge constructions in China. At present, the applications of such structures are still in the early stages in China.
The composite joint has been regarded as one of the most important parts for steel–concrete composite bridges, and the connection performance of the composite joint plays a vital role in the safety and serviceability of such bridges [27,28]. Therefore, a few studies have reported on similar structures. Udomworarat et al. [29,30] presented model tests on composite tubular K-joints to investigate their fatigue performance and ultimate strength. Furthermore, they compared the results obtained from concrete-filled joints and unfilled tubular joints. Huang et al. [31] investigated the failure modes of CFST K-joints in bridges. They found that punching shear failure could typically occur in CFST K-joints. Furthermore, loading tests on CFST truss girders were carried out by Huang et al. [32] to investigate the joint resistance and failure modes of such structures, and a scientific formula was recommended to evaluate the resistance of CFST joints. Furuichi et al. [33] fabricated a sort of composite joint by inserting diagonal tubular steel into a steel box, and static destructive tests were conducted to identify the force propagation conditions and the ultimate strength of such joints. In addition, these joints were put into use in the earliest composite truss bridge (Kinokawa Viaduct) in Japan. Based on previous research results, Furuichi et al. [34] presented various junction structures, explained their features, and conducted an experimental study to develop a design method for joint structures. Jung et al. [35] conducted static loading tests on five prestressed concrete hybrid girders with steel web members. Moreover, they found that the serviceability could be enhanced by optimizing the steel web members as well as the connection joints of concrete slabs and tendons. Then, to fully evaluate the structural safety of four newly proposed connection systems, static loading tests were carried out by Jung et al. [36]. The safety and serviceability of the composite truss joint were experimentally and numerically examined by Xue et al. [37]. The results of the test and numerical analysis provided a reference for the first composite truss cable-stayed bridge (Minpu Bridge) in China. He et al. [27] carried out an experimental test of the composite joint to study the safety and reliability of the proposed connection. To figure out the performance of three different composite joints, fatigue tests were conducted by Liu et al. [38]. Zhou et al. [39] introduced a type of composite joint subsequently used in a steel–concrete composite truss bridge in China. They concluded that cracks appeared on the concrete chord first, then the steel web members yielded, leading to joint yield. Yin et al. [12] proposed three forms of composite connections with different gusset plates and found that all types of connection showed excellent mechanical behavior by model test and finite element analysis.
However, the connection performance of composite joints in a steel–concrete composite continuous truss (SCCCT) bridge remains unconfirmed. Moreover, the important question is whether the embedded depth of the connecting system in concrete could affect the mechanical characteristics of Perfobond rib shear connectors (PBL shear connectors) and composite joints. Hence, it is necessary to conduct experimental research to study the application of the composite joint in SCCCT bridges.
This paper aimed to prove the high efficiency of the steel–concrete composite joint. Moreover, this study sought to investigate the following specific research directions: (1) the mechanical behavior of pull-out specimens and composite joints, and (2) the influence of the connection’s embedded depth on the stiffness and bearing capacity of PBL connectors as well as composite joints. Hence, pull-out tests of eight specimens were conducted to investigate the connection performance of PBL connectors, and three composite joints were tested to study the mechanical characteristics (i.e., strain distribution and deformation) under a horizontal static load. This study on pull-out specimens and composite joints may provide a useful reference for the design and construction of steel–concrete connections in such joints and bridges.
2. Pull-Out Test Setup
2.1. Pull-Out Specimens
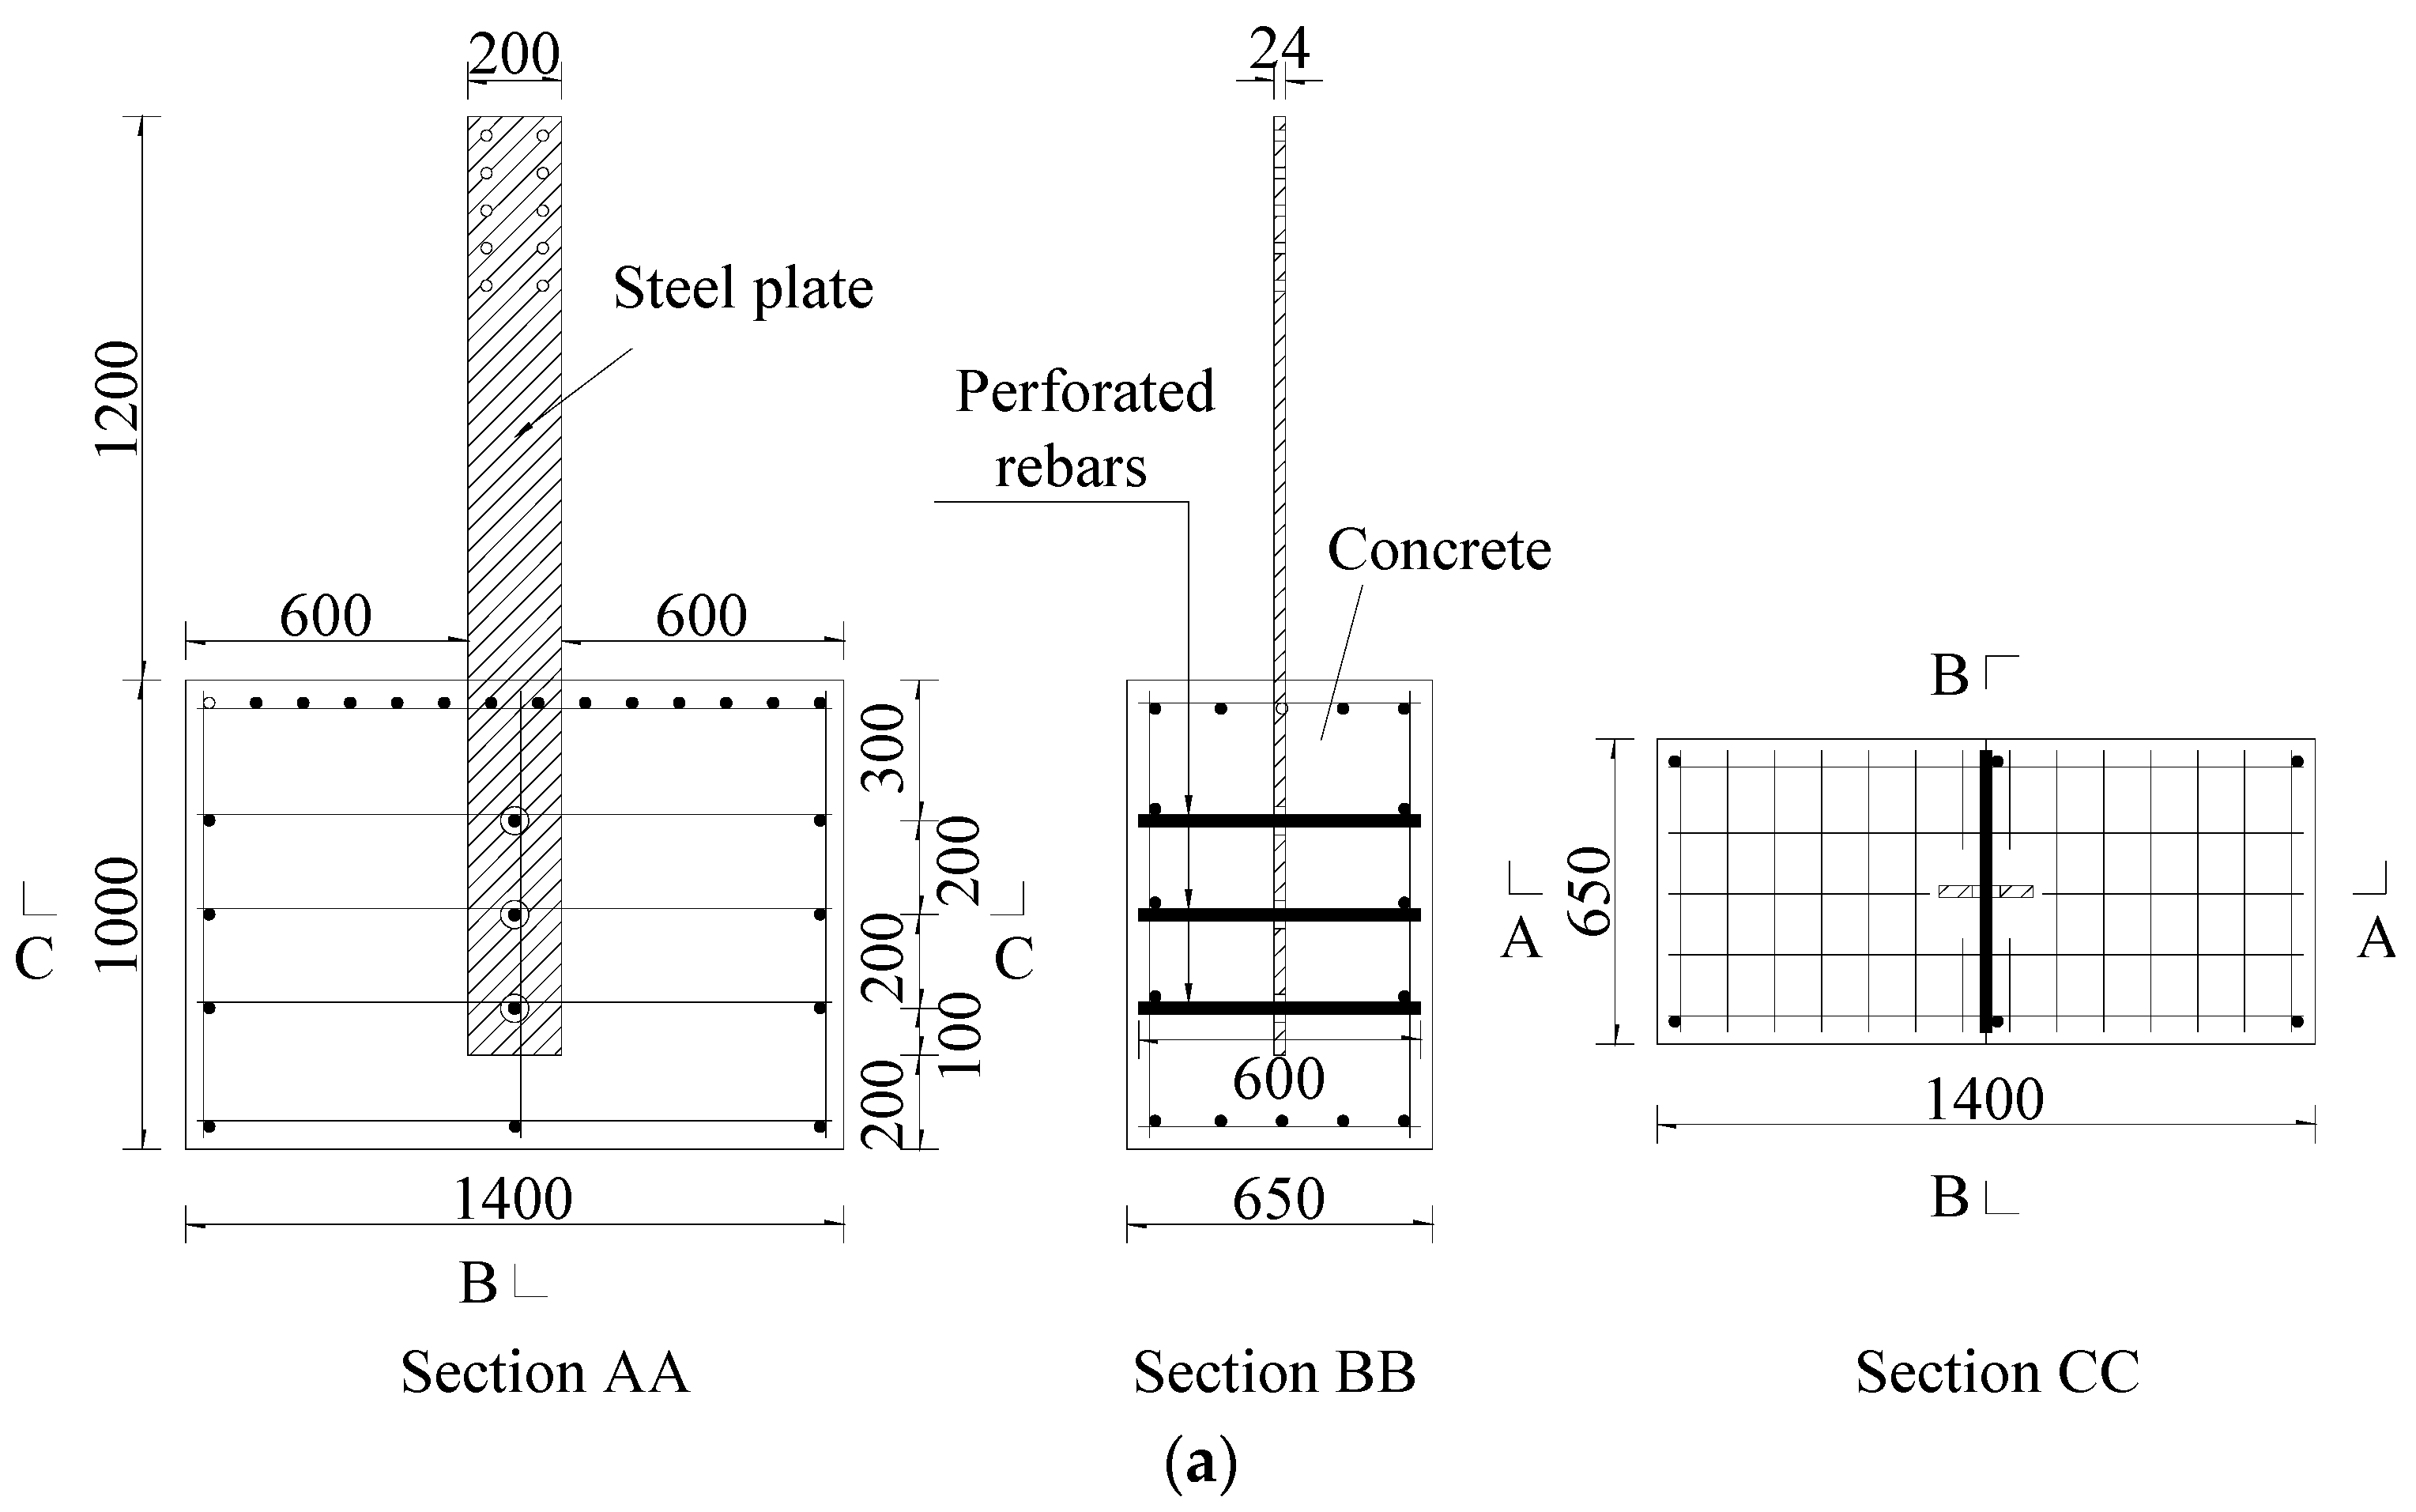
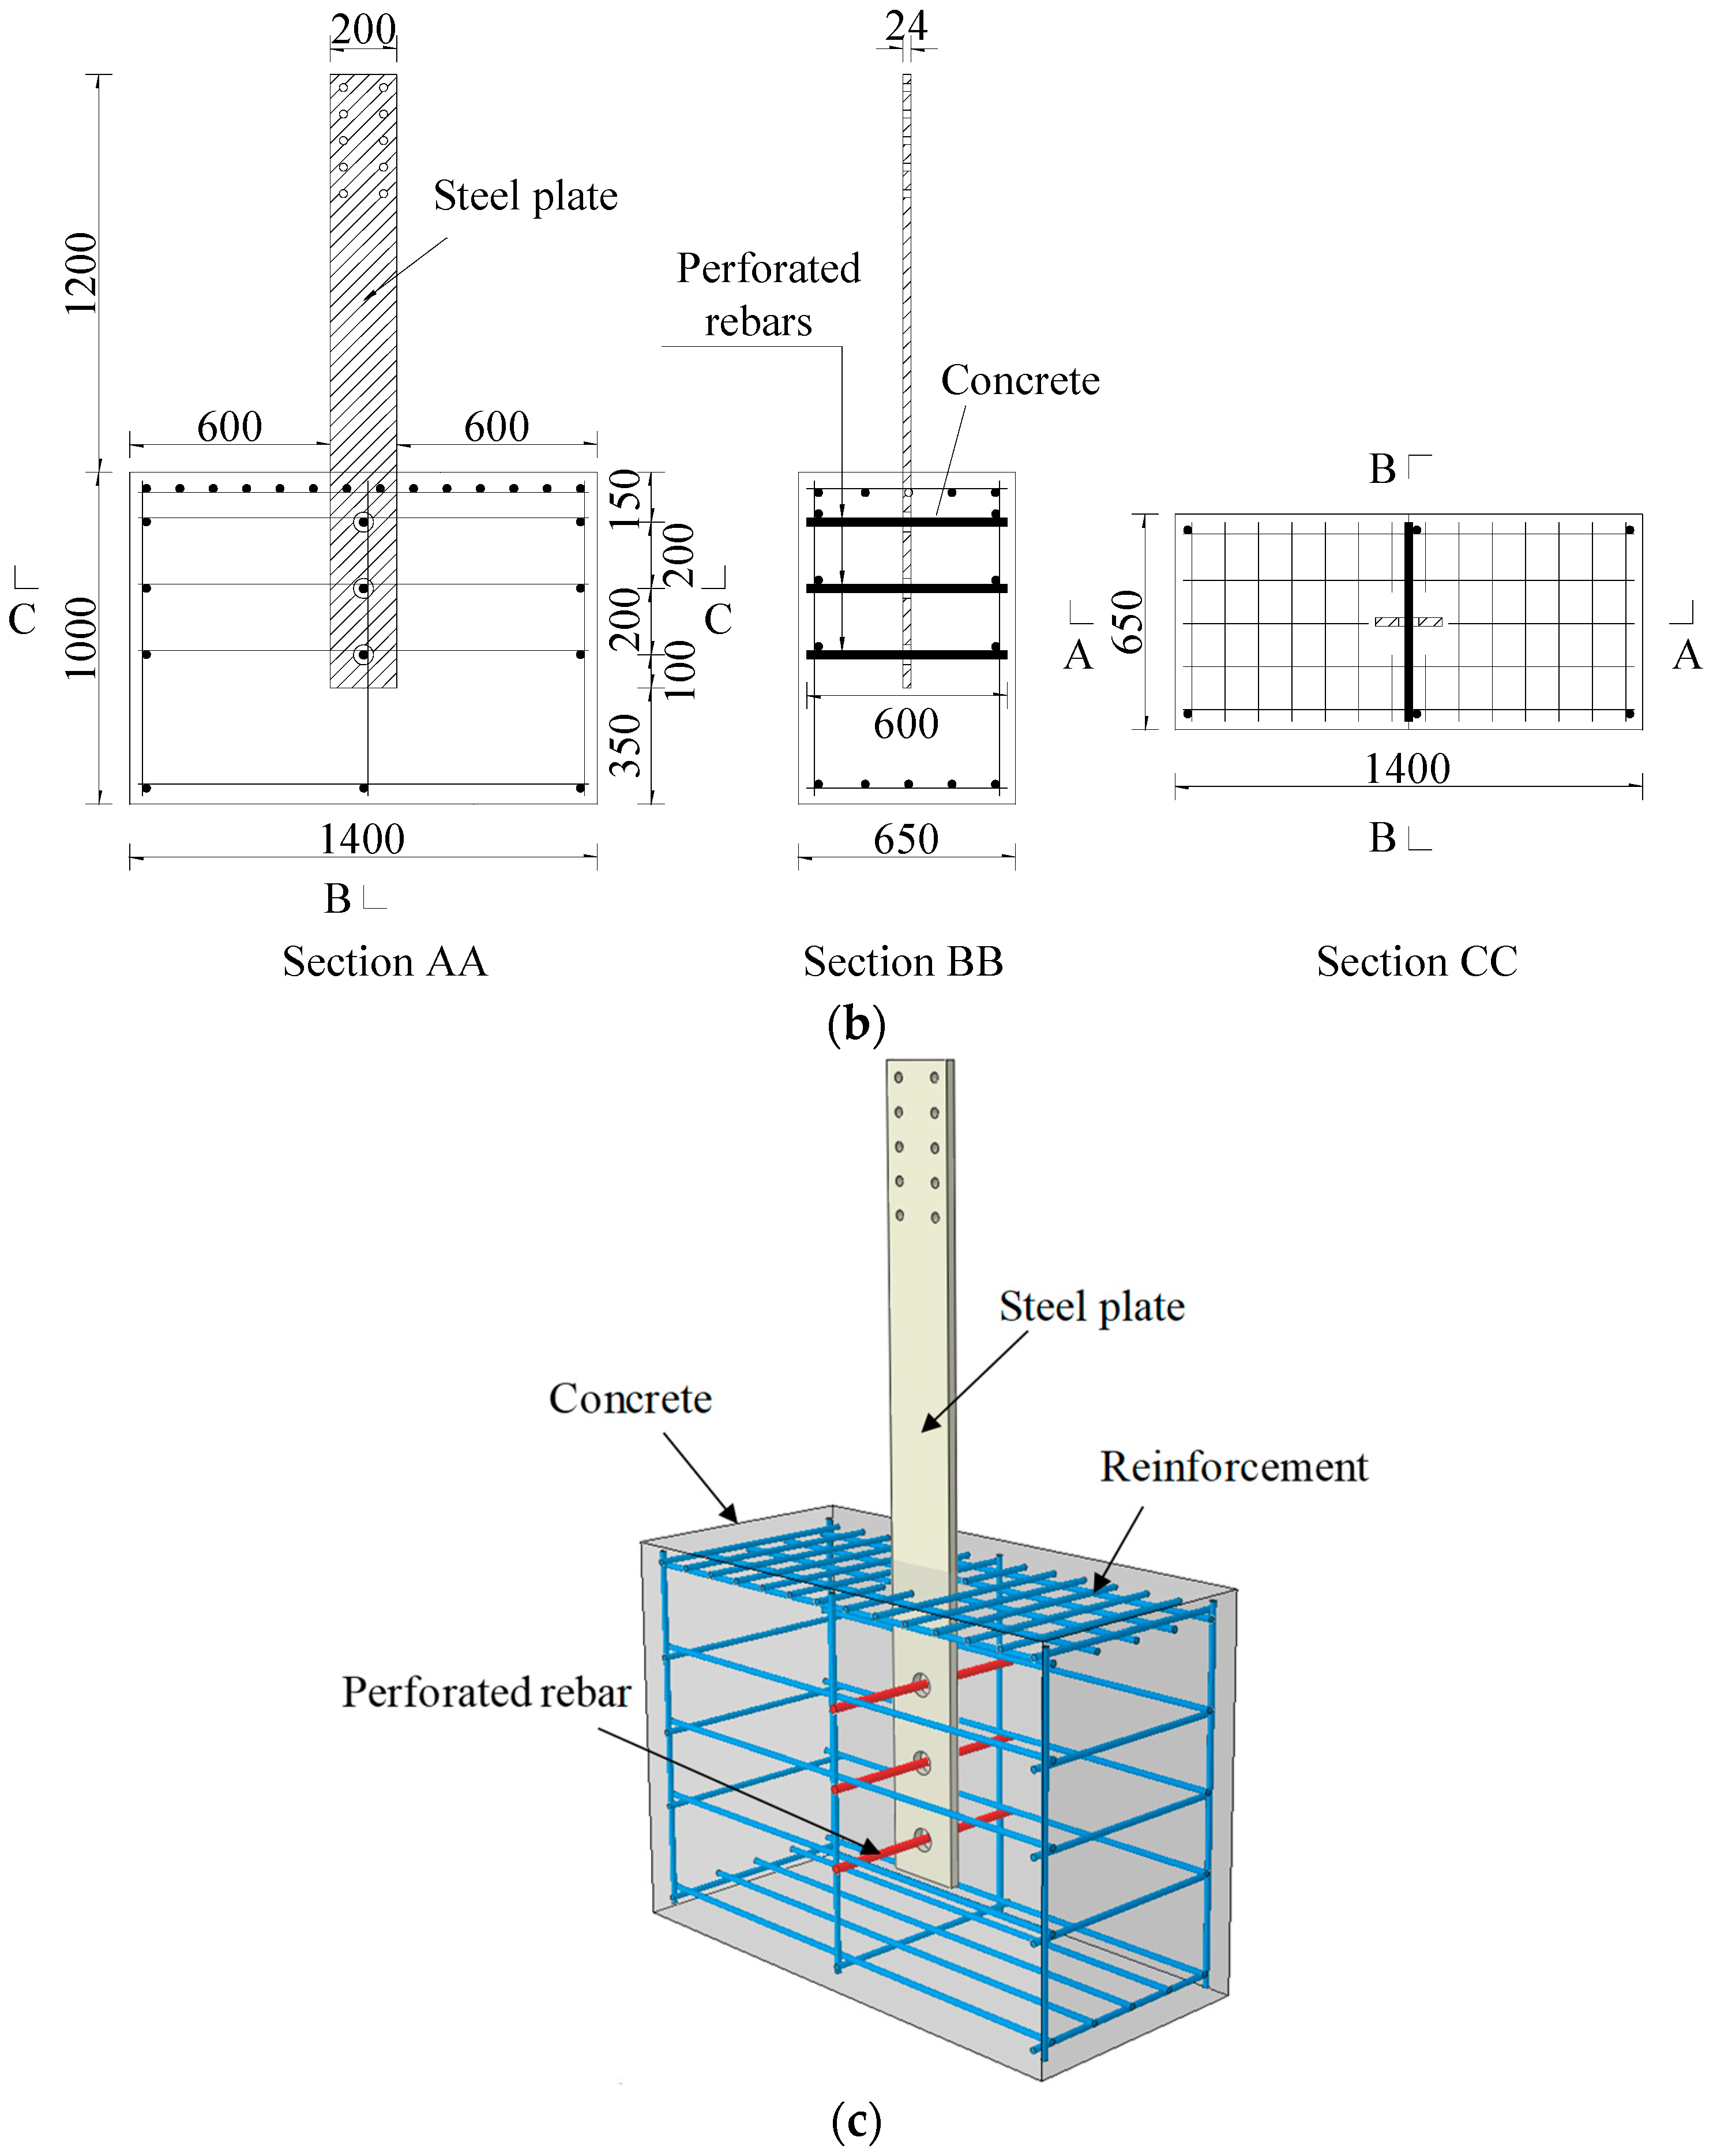
Three kinds of pull-out test specimens were proposed to investigate the mechanical performance of PBL connectors with different embedded depths. The embedded depth indicated the distance between the nearest perforated rebar and the concrete surface in the pull-out direction. For the first type of specimen (PA1, PA2, and PA3), the embedded depth was 300 mm, as shown in Figure 1a, while an embedded depth of 150 mm was employed in the second type (PB1, PB2, PB3), as shown in Figure 1b. The third type of specimen (PC1, PC2, PC3) was similar to the first type but without perforated rebars. Specimen PC3 was not considered due to a manufacturing error. The three-dimensional view of a pull-out specimen is shown in Figure 1c. The PA and PC specimens consisted of the concrete member (1000 × 650 × 1000 mm), steel plate (2000 or 1850 × 200 × 24 mm), perforated rebars (22 mm in diameter), and reinforcing bars (16 mm in diameter). Preformed holes 65 mm in diameter were drilled through the steel plate, except in PC specimens. In addition, no perforated rebar was installed in PC specimens. The material strength tests were carried out according to TB 10002.3-2005 [40]. The mechanical properties of the concrete C50 were obtained from standard cube samples (150 × 150 × 150 mm). The average compressive strength and Young’s modulus of the standard cubes after 28 days of curing were 59.2 MPa and 34.5 GPa, respectively. In addition, tensile tests were performed for the structural steel and reinforcing bars. The mechanical properties of the materials are listed in Table 1. C50 concrete was adopted in the concrete member. Q345qE low-alloy high-strength bridge structural steel was used for all steel plates. The perforated rebars and reinforcing bars were made of HRB335 steel.
2.2. Loading Scheme of Pull-Out Test
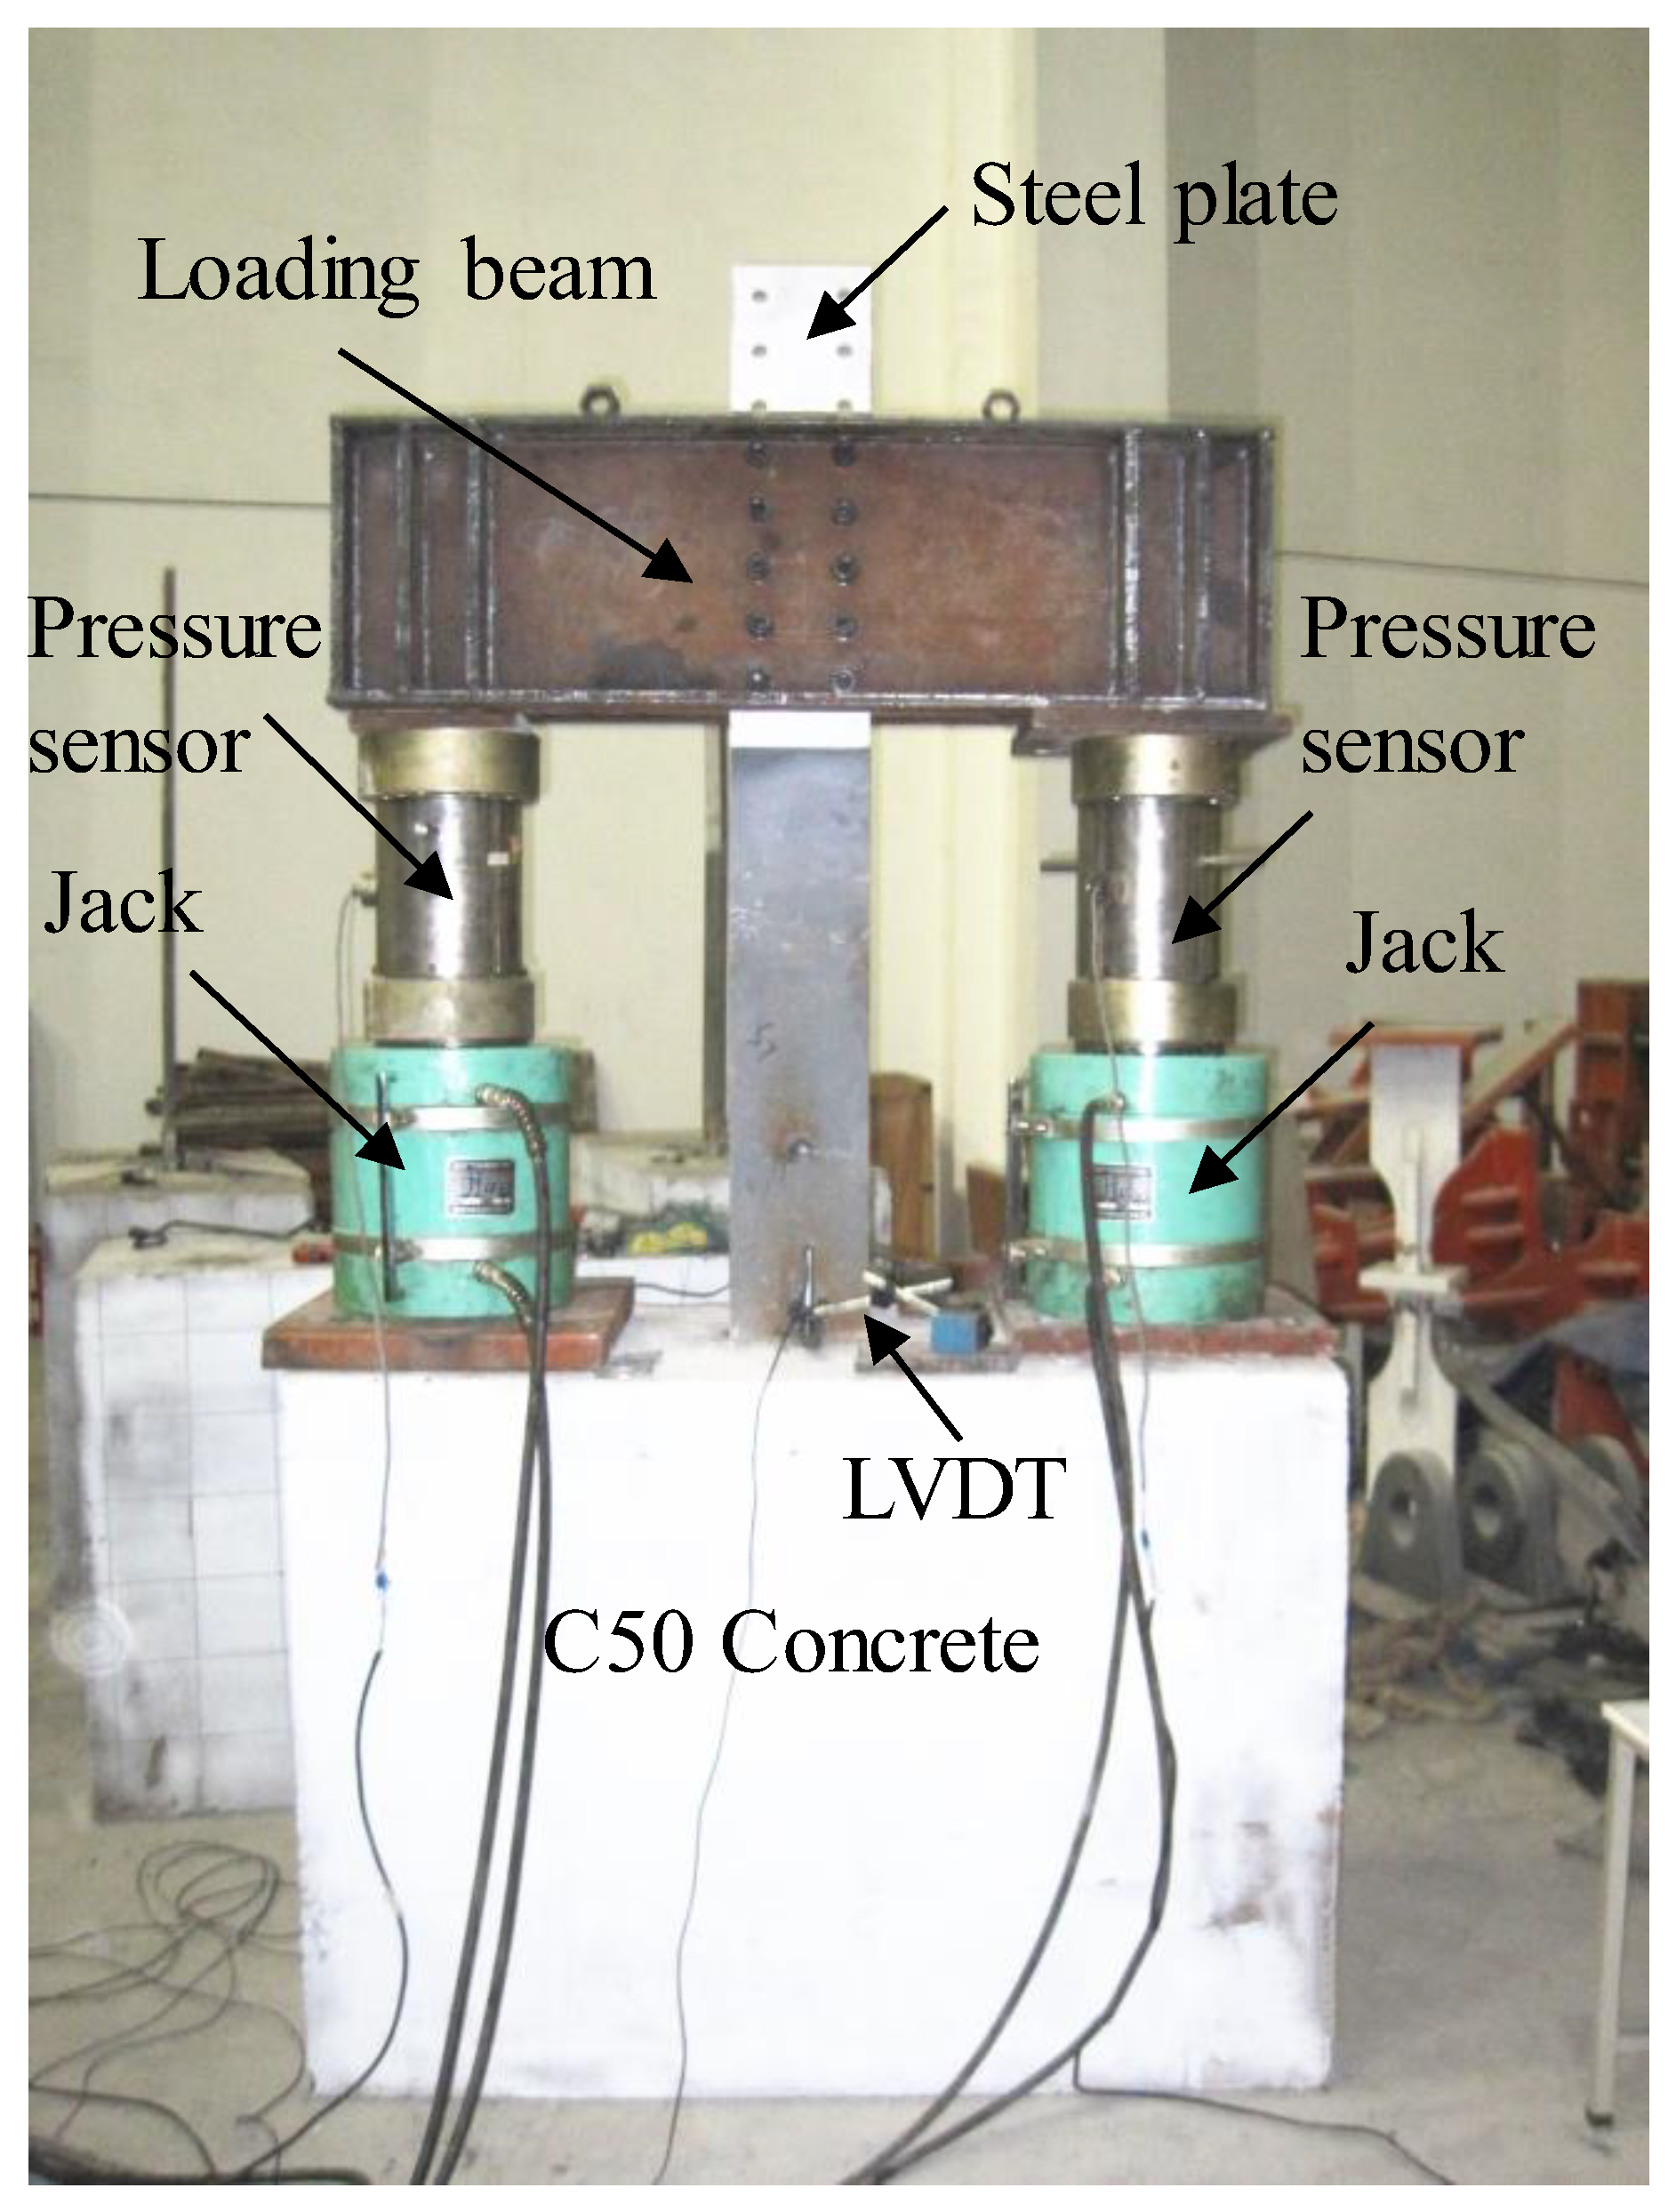
The setup of the pull-out test is illustrated in Figure 2. Two 2500 kN jacks were used to apply a vertical force to the steel plate. To control the loading process accurately, two pressure sensors were installed there. The slip distribution in multiple holes of a PBL shear connector was inconsistent throughout the depth. However, the experimental data from a relevant study also showed slight differences throughout depth [41]. Hence, it is acceptable to ignore the slight differences. The slip here was represented by the displacement of the whole steel plate. The relative slips between the steel plate and concrete were measured by two linear variable displacement transducers (LVDTs).
Before the static test, preloading was carried out to eliminate assembly gaps between devices and to make sure all instruments functioned well. Then, the pull-out test was performed by multistage loading. For PA and PB specimens, the loading step was 100 kN when the resultant force applied by the two jacks was less than 400 kN. Then, the loading step was reduced to 50 kN. However, for PC specimens, the loading step was 20 kN until failure of the composite joints occurred. After 5–10 min, with the load unchanged, the value of the load and deformation was recorded for each step. The unloading and reloading mode was employed in PA2, PA3, and PB3.
3. Pull-Out Test Results
3.1. Failure Modes of Pull-Out Specimens
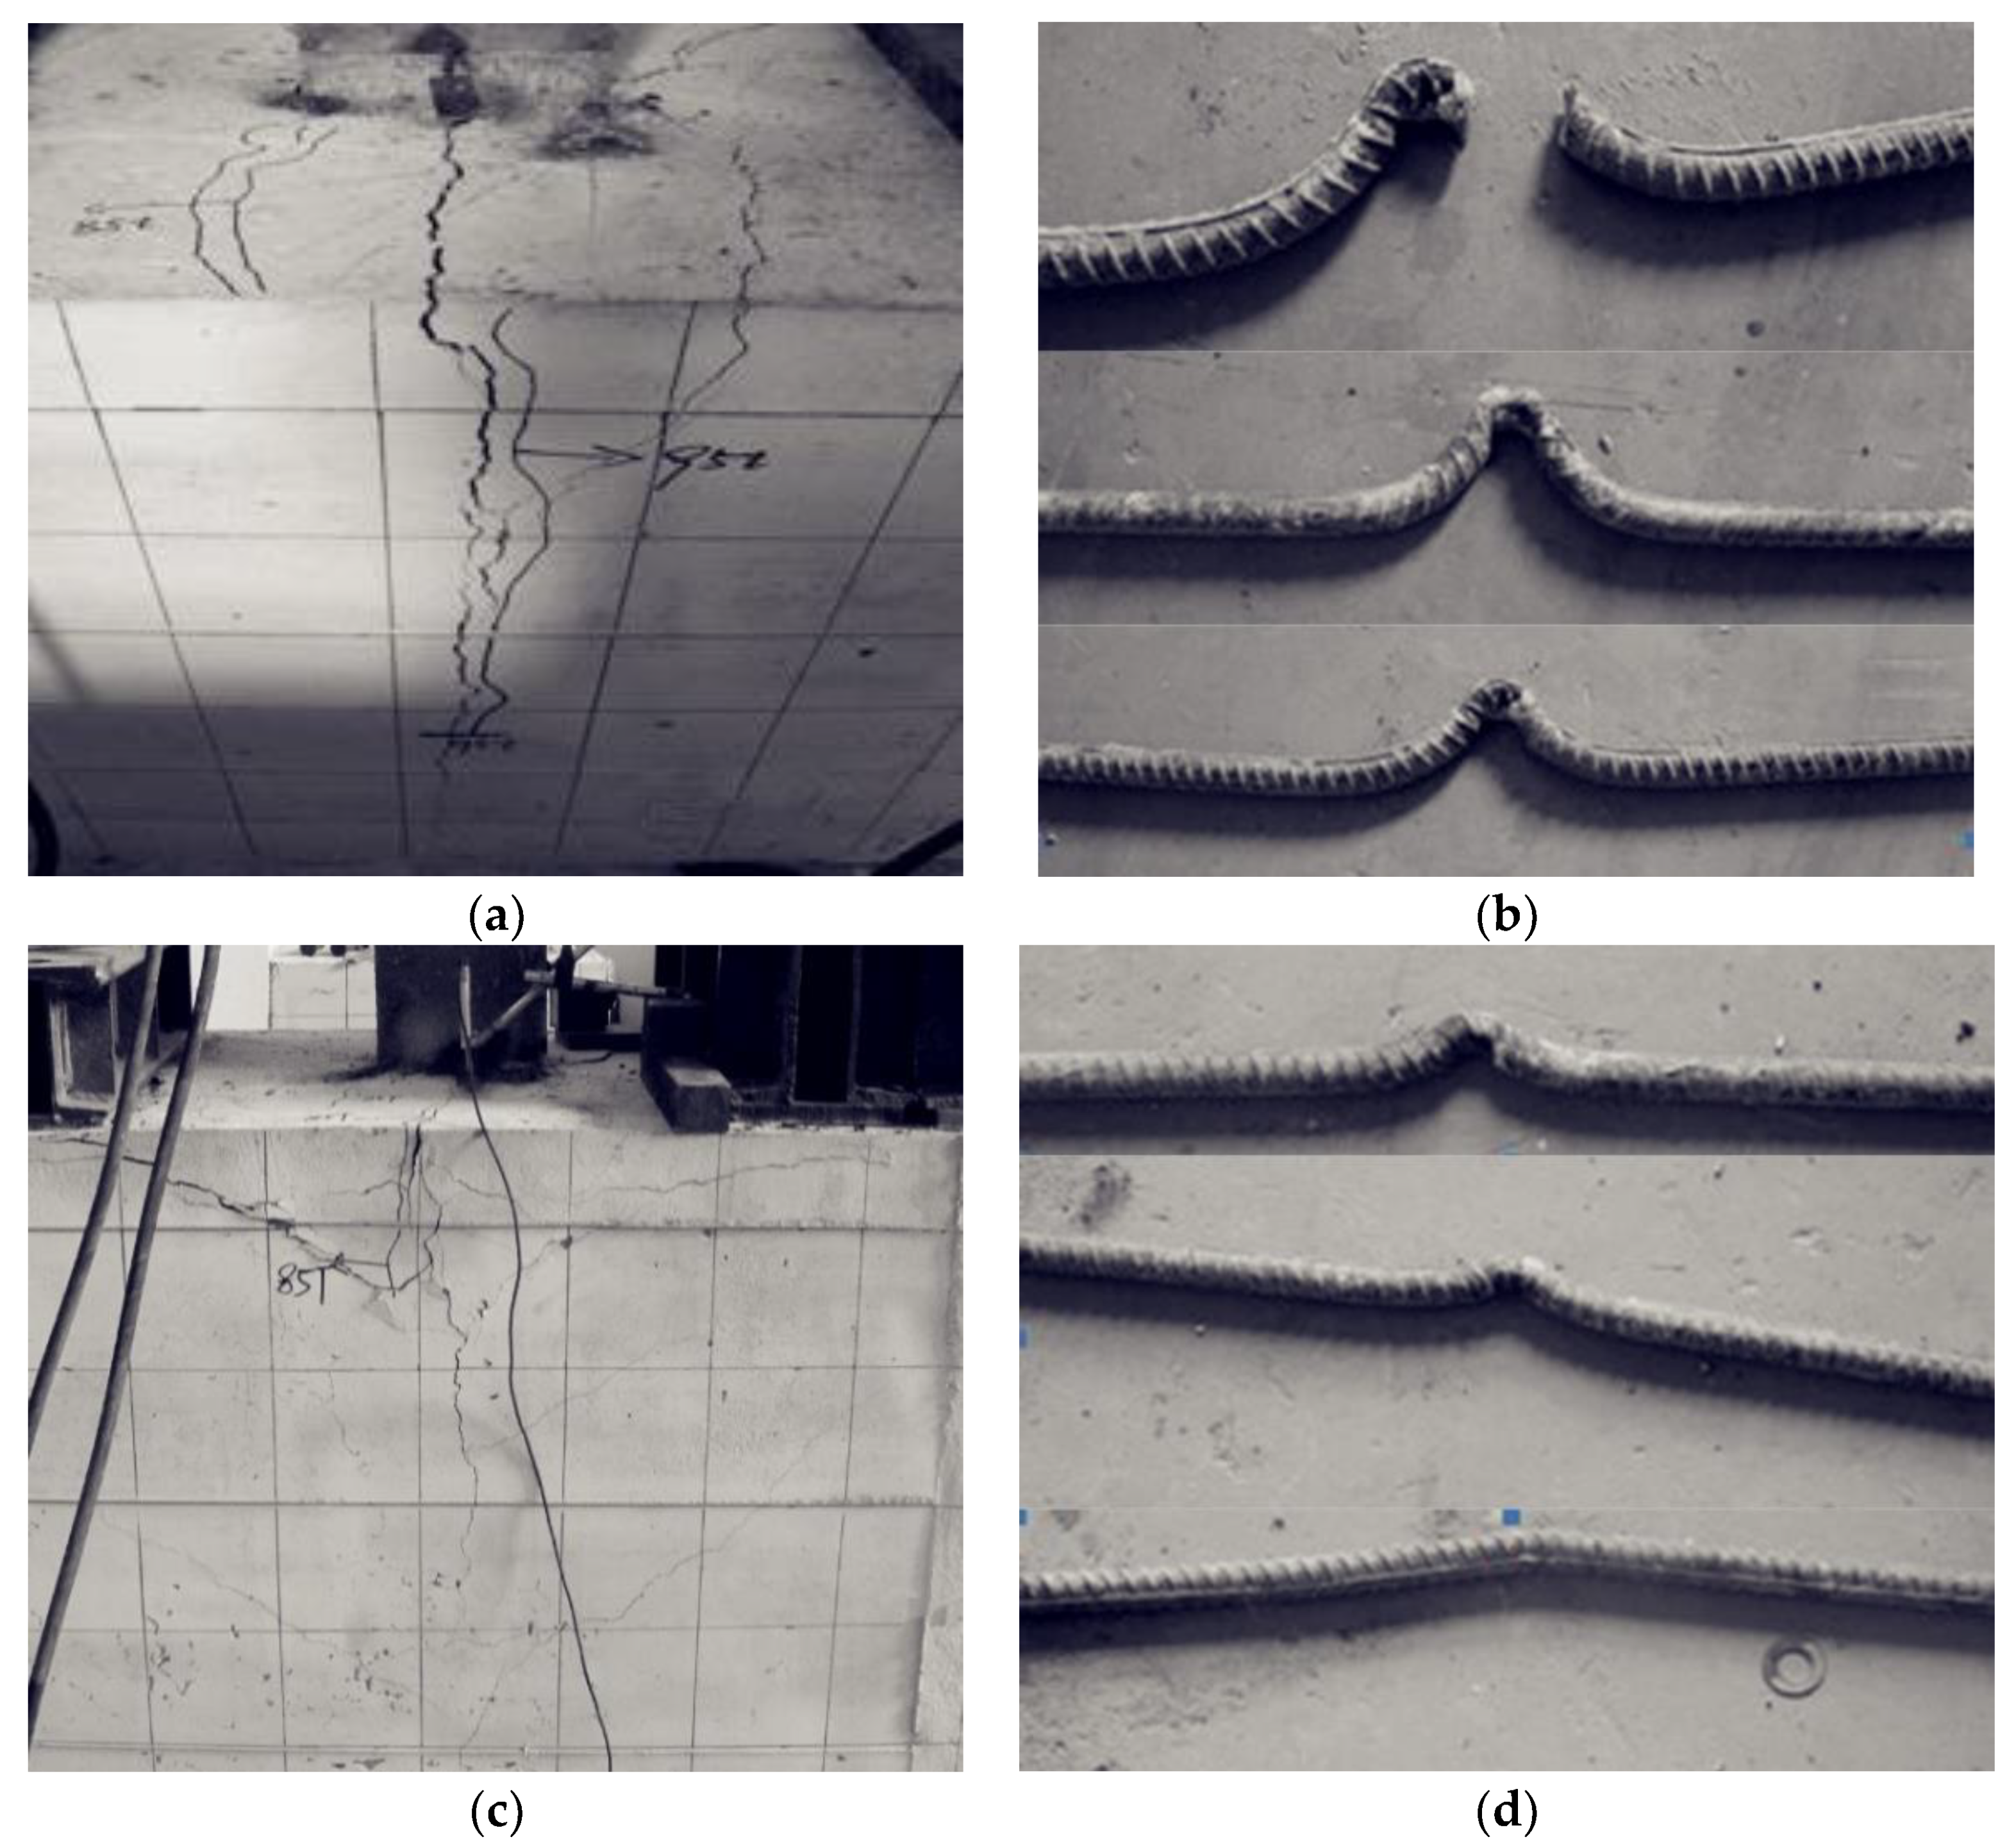
To investigate the connection behavior of PBL shear connectors, many experimental studies have previously been conducted by Xiao et al. [42], Liu et al. [43], Wang et al. [44], Zhang et al. [45], and Zhao et al. [46]. In this study, experimental tests were performed to measure the connection performance of PBL shear connectors with different embedded depths. The failure mode of the PA specimens is shown in Figure 3a,b. Initial cracks appeared in the PA1, PA2, and PA3 specimens when the load increased to 750 kN, 850 kN, and 850 kN, respectively. As the load level continued to increase, some cracks occurred at the concrete surface corresponding to the first row of the PBL connector, and the angle was 60 degrees from the horizontal axis. Furthermore, the sound of the perforated rebar breaking was heard when the load reached 1100 kN. After that, the deformation increased quickly and the steel plate was pulled out; as a result, the specimen could not sustain the load anymore. These results suggest that PA specimens with PBL shear connections had a good bearing capacity.
Compared with PA specimens, the displacements of the steel plate in the PB specimens were smaller. It is possible, therefore, that they underwent brittle failure. Figure 3c,d show the cracks in the concrete and the failure mode of the perforated rebars. The incipient cracks of PB1, PB2, and PB3 emerged when the load reached 800 kN, 750 kN, and 800 kN, respectively. Furthermore, long cracks appeared in all extended regions of the perforated rebars at the end of loading, and the angle between the crack and the horizontal axis was 30 degrees. In contrast to PA specimens, no sound of the perforated rebar fracture was heard. Comparing the failure modes of perforated rebars in the PA and PB specimens, it can be observed from Figure 3b,d that the deformation of the perforated rebar at a greater depth was larger. Furthermore, the top perforated rebar was fractured, but the deformation of the rebar away from the loading end was slight. On the basis of these findings, we can infer that the embedded depth can affect the failure mode of perforated rebars and the specimen.
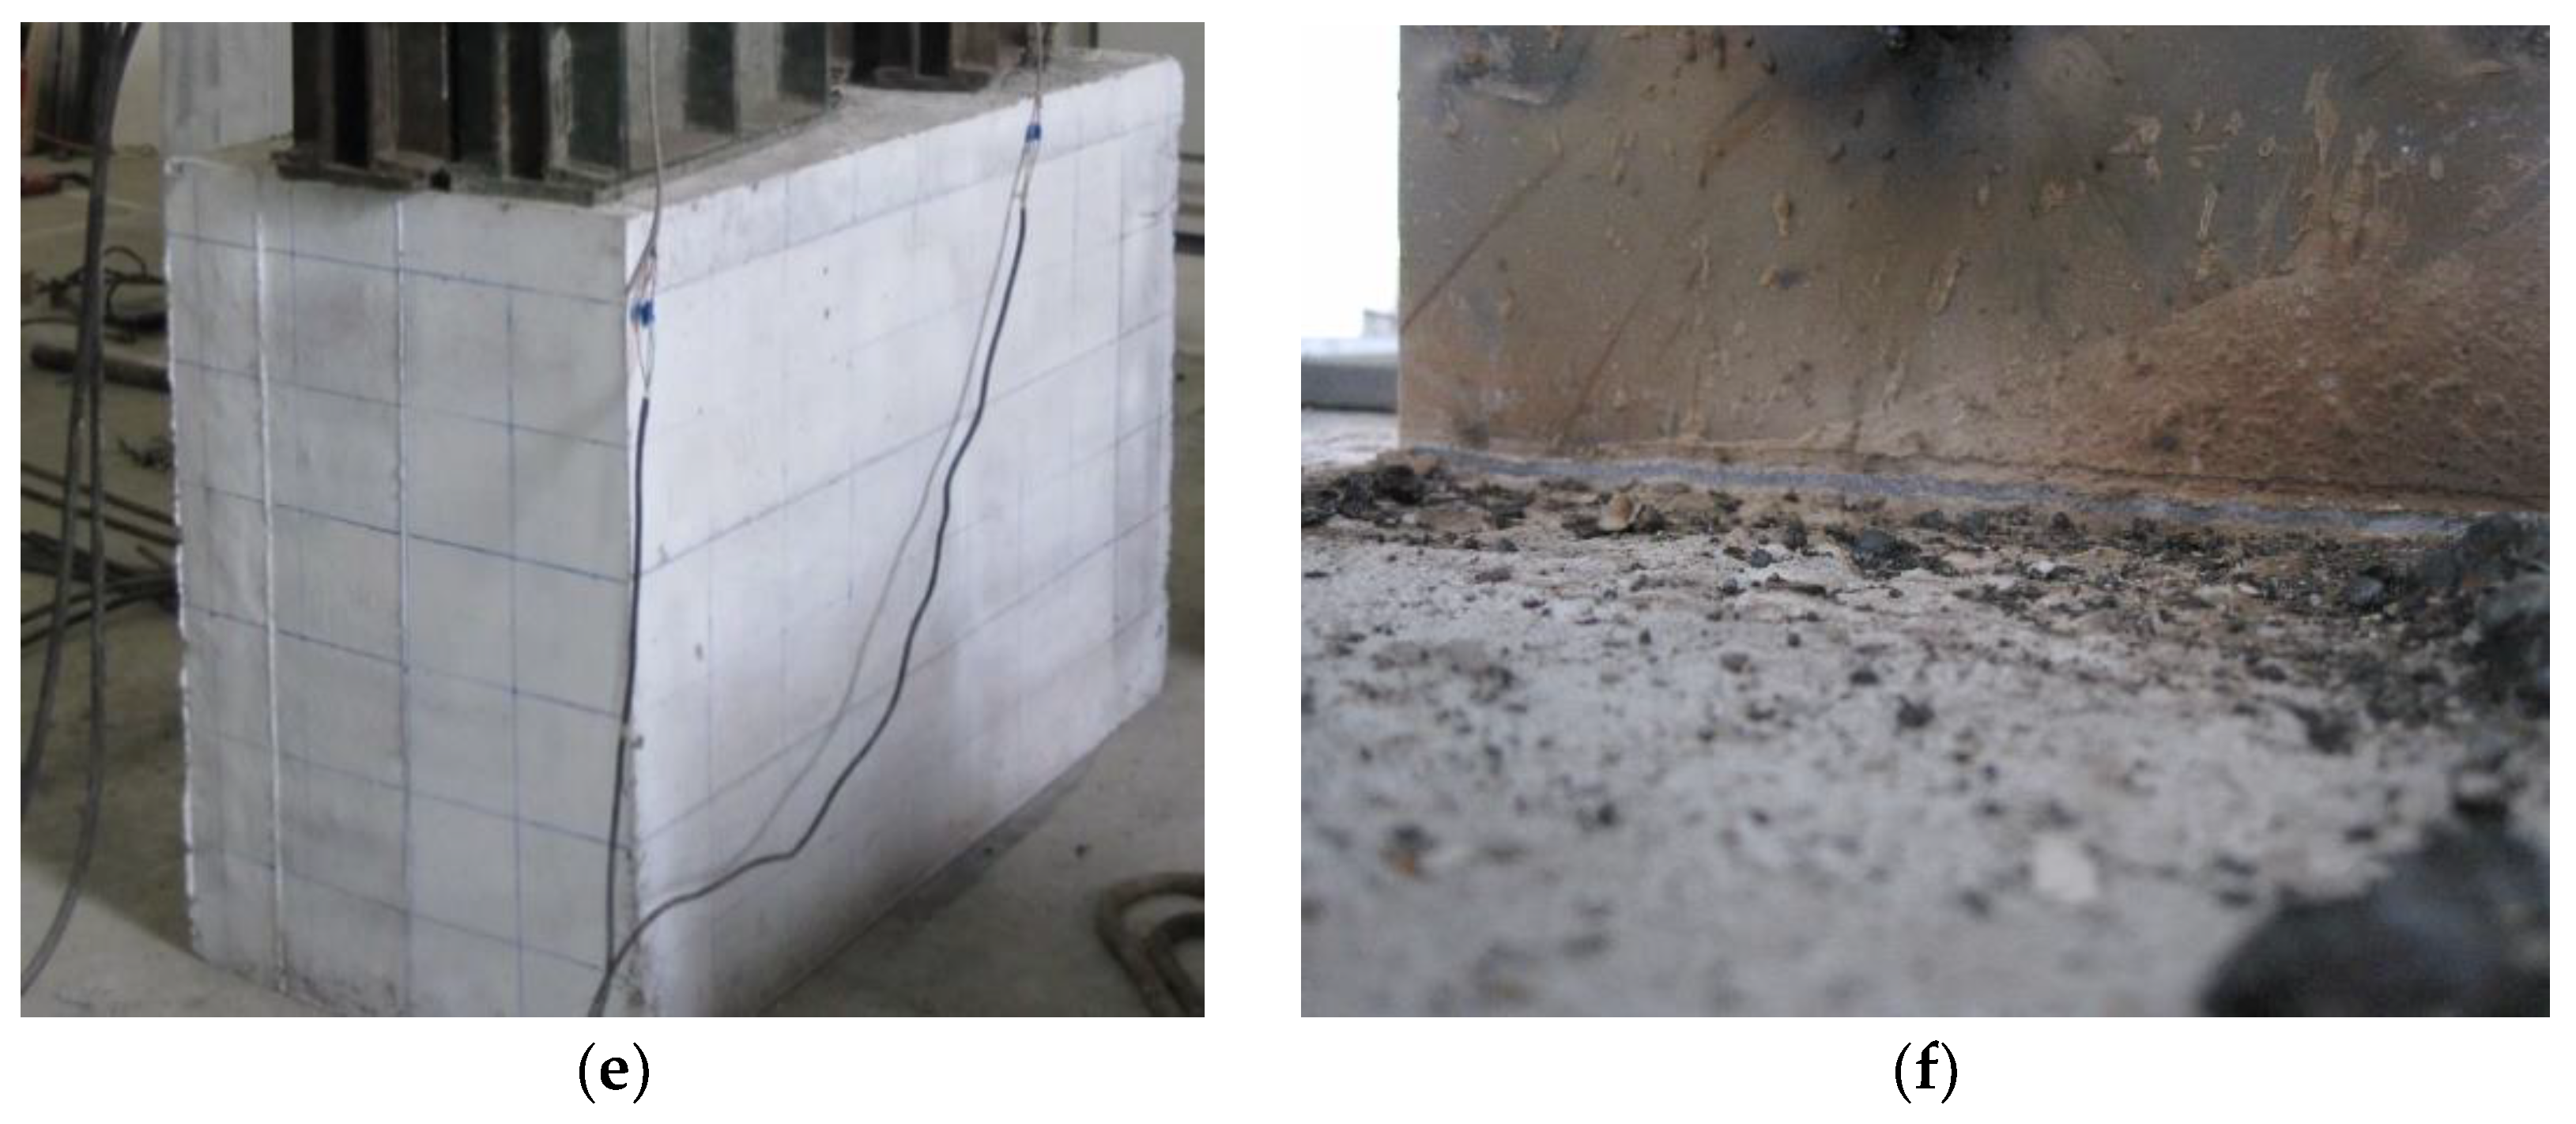
As shown in Figure 3e,f, the deformation of PC specimens with no perforated rebar was tiny when the steel plate was pulled out. In addition, no crack appeared on the side of the concrete. The steel plate was not pulled out until the load reached 540 kN. Hence, the failure mode of the PC specimens can also be called brittle failure.
3.2. Load–Slip Characteristic of Pull-Out Specimens
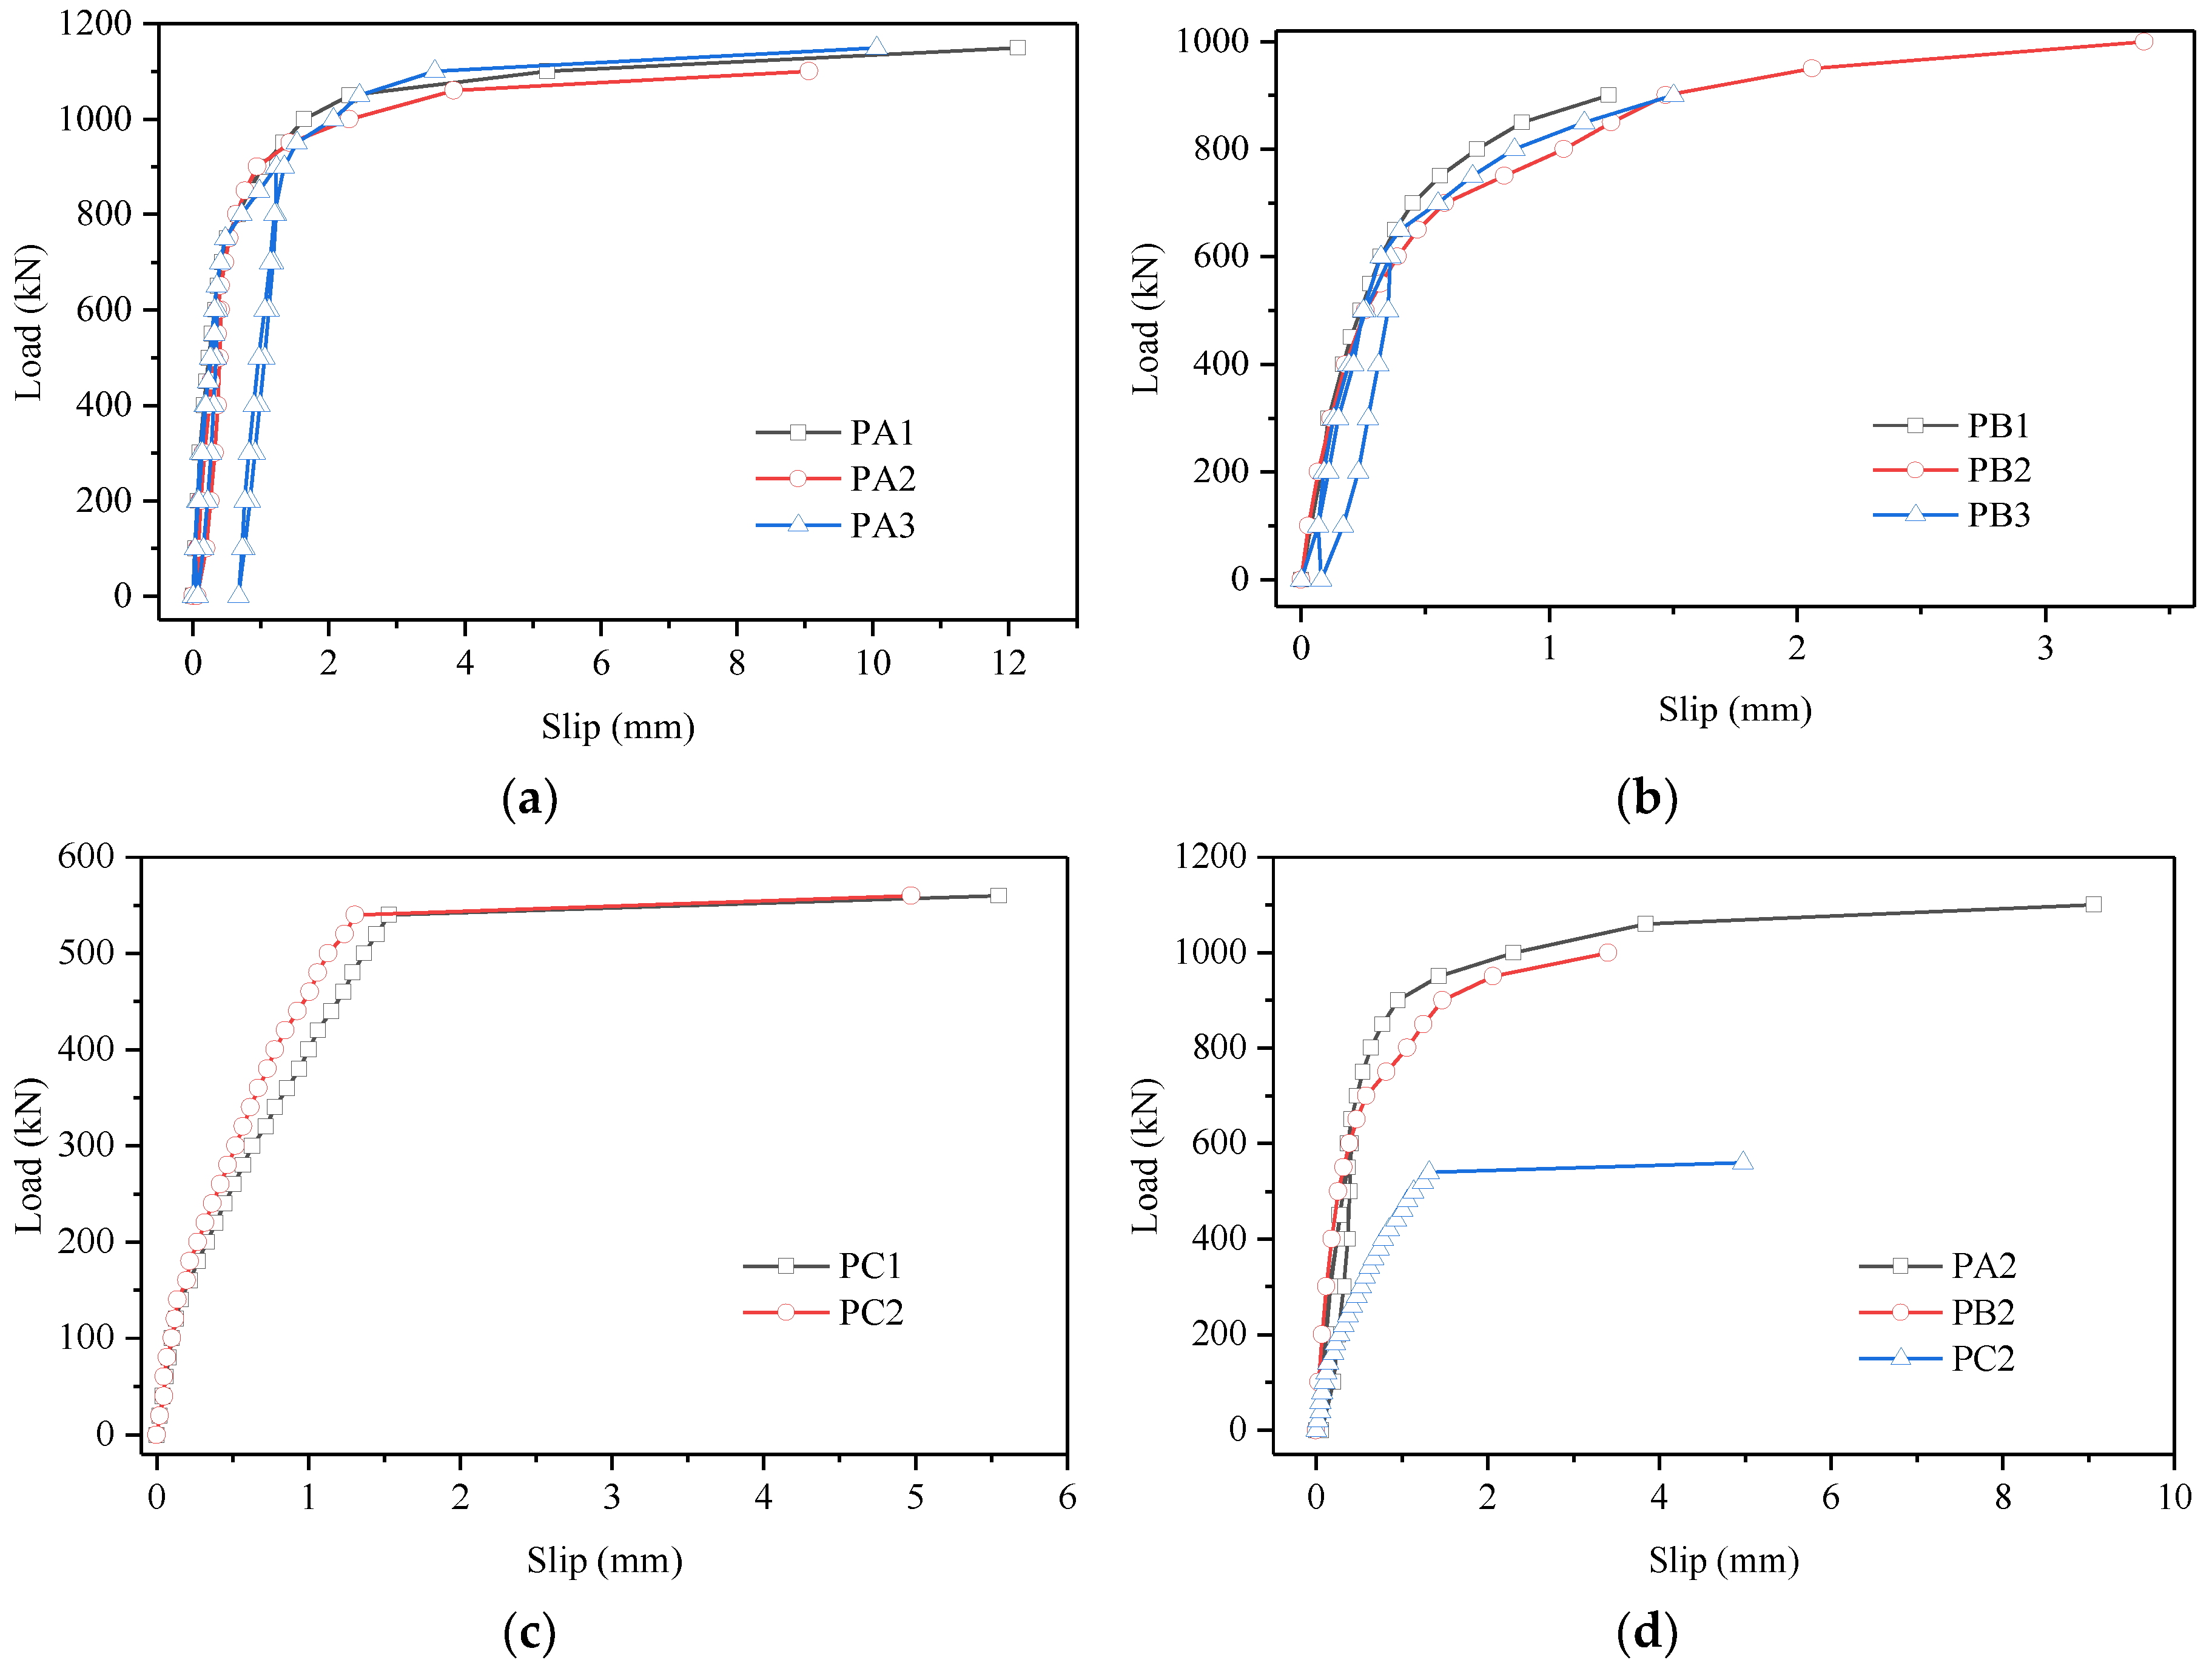
Given the different embedded depths and the existence (or lack) of perforated rebars, the pull-out specimens with different constructional details showed diverse mechanical characteristics in the form of load–slip curves. For PA specimens, as shown in Figure 4a, the load–slip curve consisted of the pseudo-elastic stage, the elastic-plastic stage, and the yield strengthening stage [47]. The three specimens had similar load–displacement relationships. Furthermore, the three specimens started to yield at approximately 750 kN, and the ultimate capacities of PA1, PA2, and PA3 were about 1150 kN, 1100 kN, and 1150 kN, respectively. Figure 4b provides the load–slip curves of the PB specimens. From this graph, we can see that the displacement was small (about 2 mm) at the end of loading. As shown in Figure 4c, the load–slip relationship in this figure can be compared with the relationship in Figure 4a,b, which shows that the slip increased almost linearly with the load for PC specimens. The steel plate was pulled out quickly when the load was above 540 kN. Consequently, the ultimate capacity for PC specimens was about 540 kN, and the corresponding slip was about 1.5 mm.
Figure 4d and Table 2 compare the load–slip curves and major experimental characteristics of the pull-out specimens. There was a significant difference between the three series. Making a comparison of PA and PB specimens, we can see that the yield and ultimate load were increased by 10% and 21% on average, respectively, with the greater embedded depth. Further, the average slip corresponding to the ultimate load was increased from 2.05 mm to 10.41 mm (increased by 408%). Hence, a greater embedded depth enhanced the bearing capacity and deformability. Turning now to the experimental evidence in a comparison of PA and PC specimens, the average ultimate load was reduced from 1133.33 kN to 540 kN without the perforated rebars, and the slip was reduced by 86.4%. Therefore, these results indicate that the presence of perforated rebars had a great influence on bearing capacity and deformation.
4. Steel–Concrete Composite Joint Test Setup
4.1. Description of Composite Joints
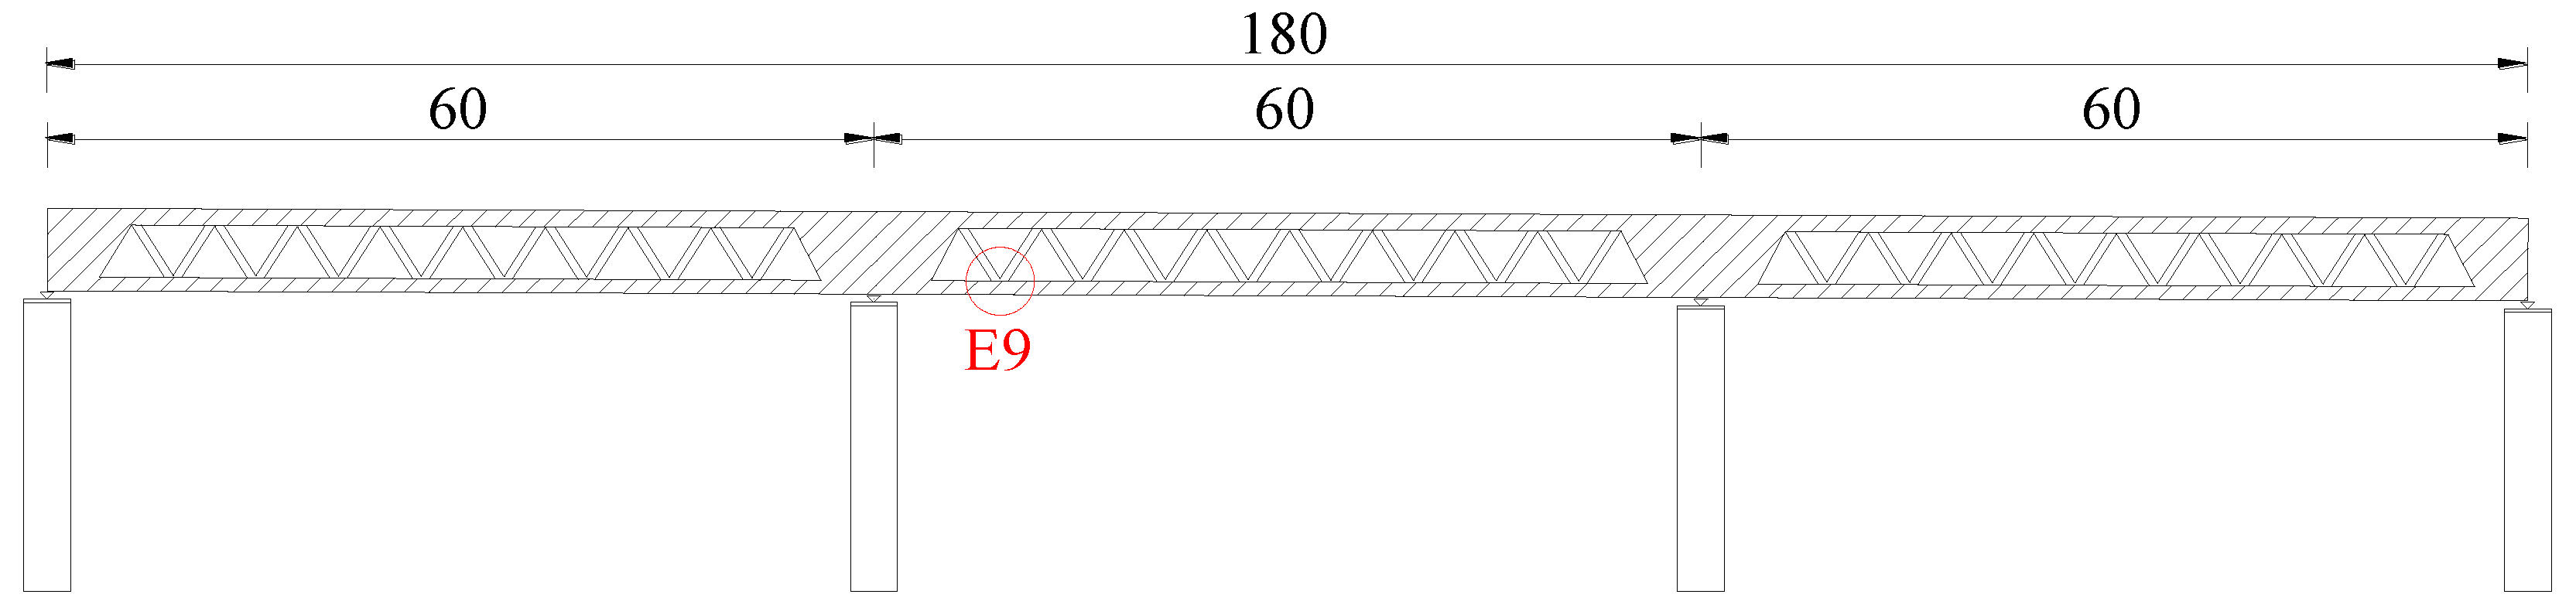
A steel–concrete composite continuous truss bridge (3 × 60 m) was built with the intention of bearing a China Railway standard live loading [48]. This bridge of 12.2 m width consisted of an upper concrete slab, steel truss webs, and a bottom concrete slab, as shown in Figure 5. The maximum axial force (8200 kN) of the composite bridge appeared at E9. Hence, E9 was selected as a typical composite joint to be tested. Considering the limits of the reaction floor and testing devices, a geometric similarity ratio of 1:2 between the specimen and prototype joint was adopted in this test. In addition, the load similarity ratio was 1:4. Therefore, the design load of the composite joint with a scale of 1:2 was 2050 kN. These composite joint specimens were meticulously designed based on the prototype design, which was proposed by the China Railway First Survey and Design Institute Group.
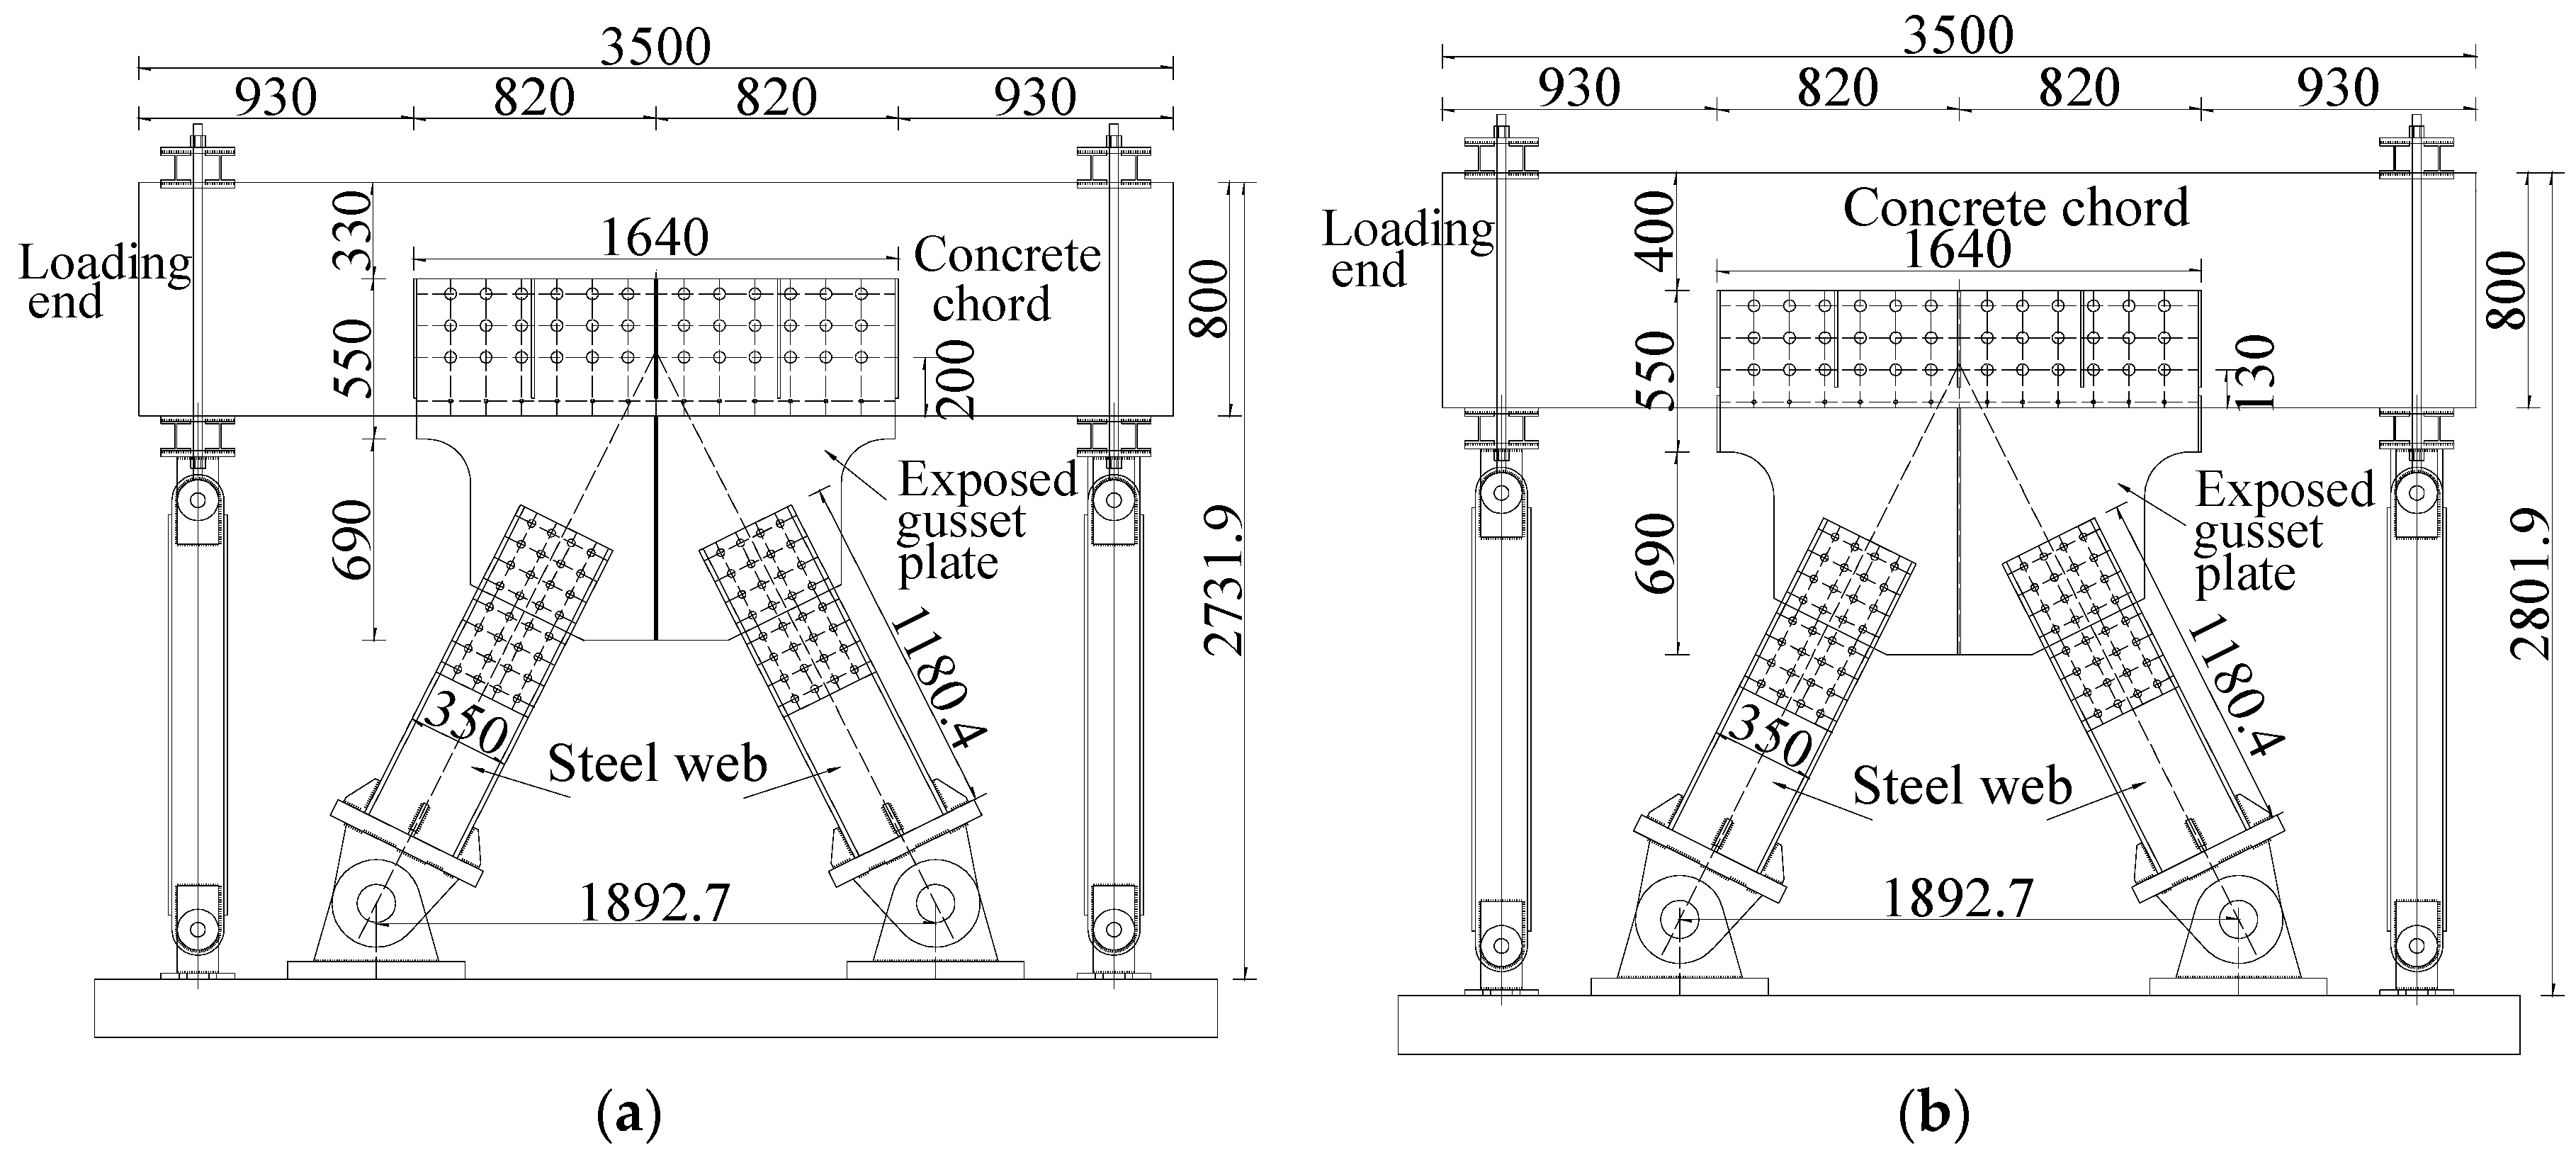
To understand the mechanical behavior of composite joints with different embedded depths, three composite joints with a scale of 1:2 were tested. In contrast to the welded joints in the previous study, high-strength bolted connections were installed between the gusset plate and steel web member in all composite joint specimens (denoted CJA, CJB1, and CJB2). The embedded depths of CJA and CJB were 200 mm and 130 mm, respectively, as shown in Figure 6. The composite joint consisted of the concrete chord (3500 × 600 × 800 mm), gusset plates (1640 × 1240 × 24 mm), and steel web members (350 × 375 × 1180.4 × 16 mm). The gusset plates were perforated with 36 openings of 40 mm diameter. In addition, perforated rebars of 12 mm in diameter traversed the openings to transfer force between the concrete chord and steel gusset plate. The mechanical properties of the materials are listed in Table 1.
4.2. Loading Scheme of Composite Joint Test
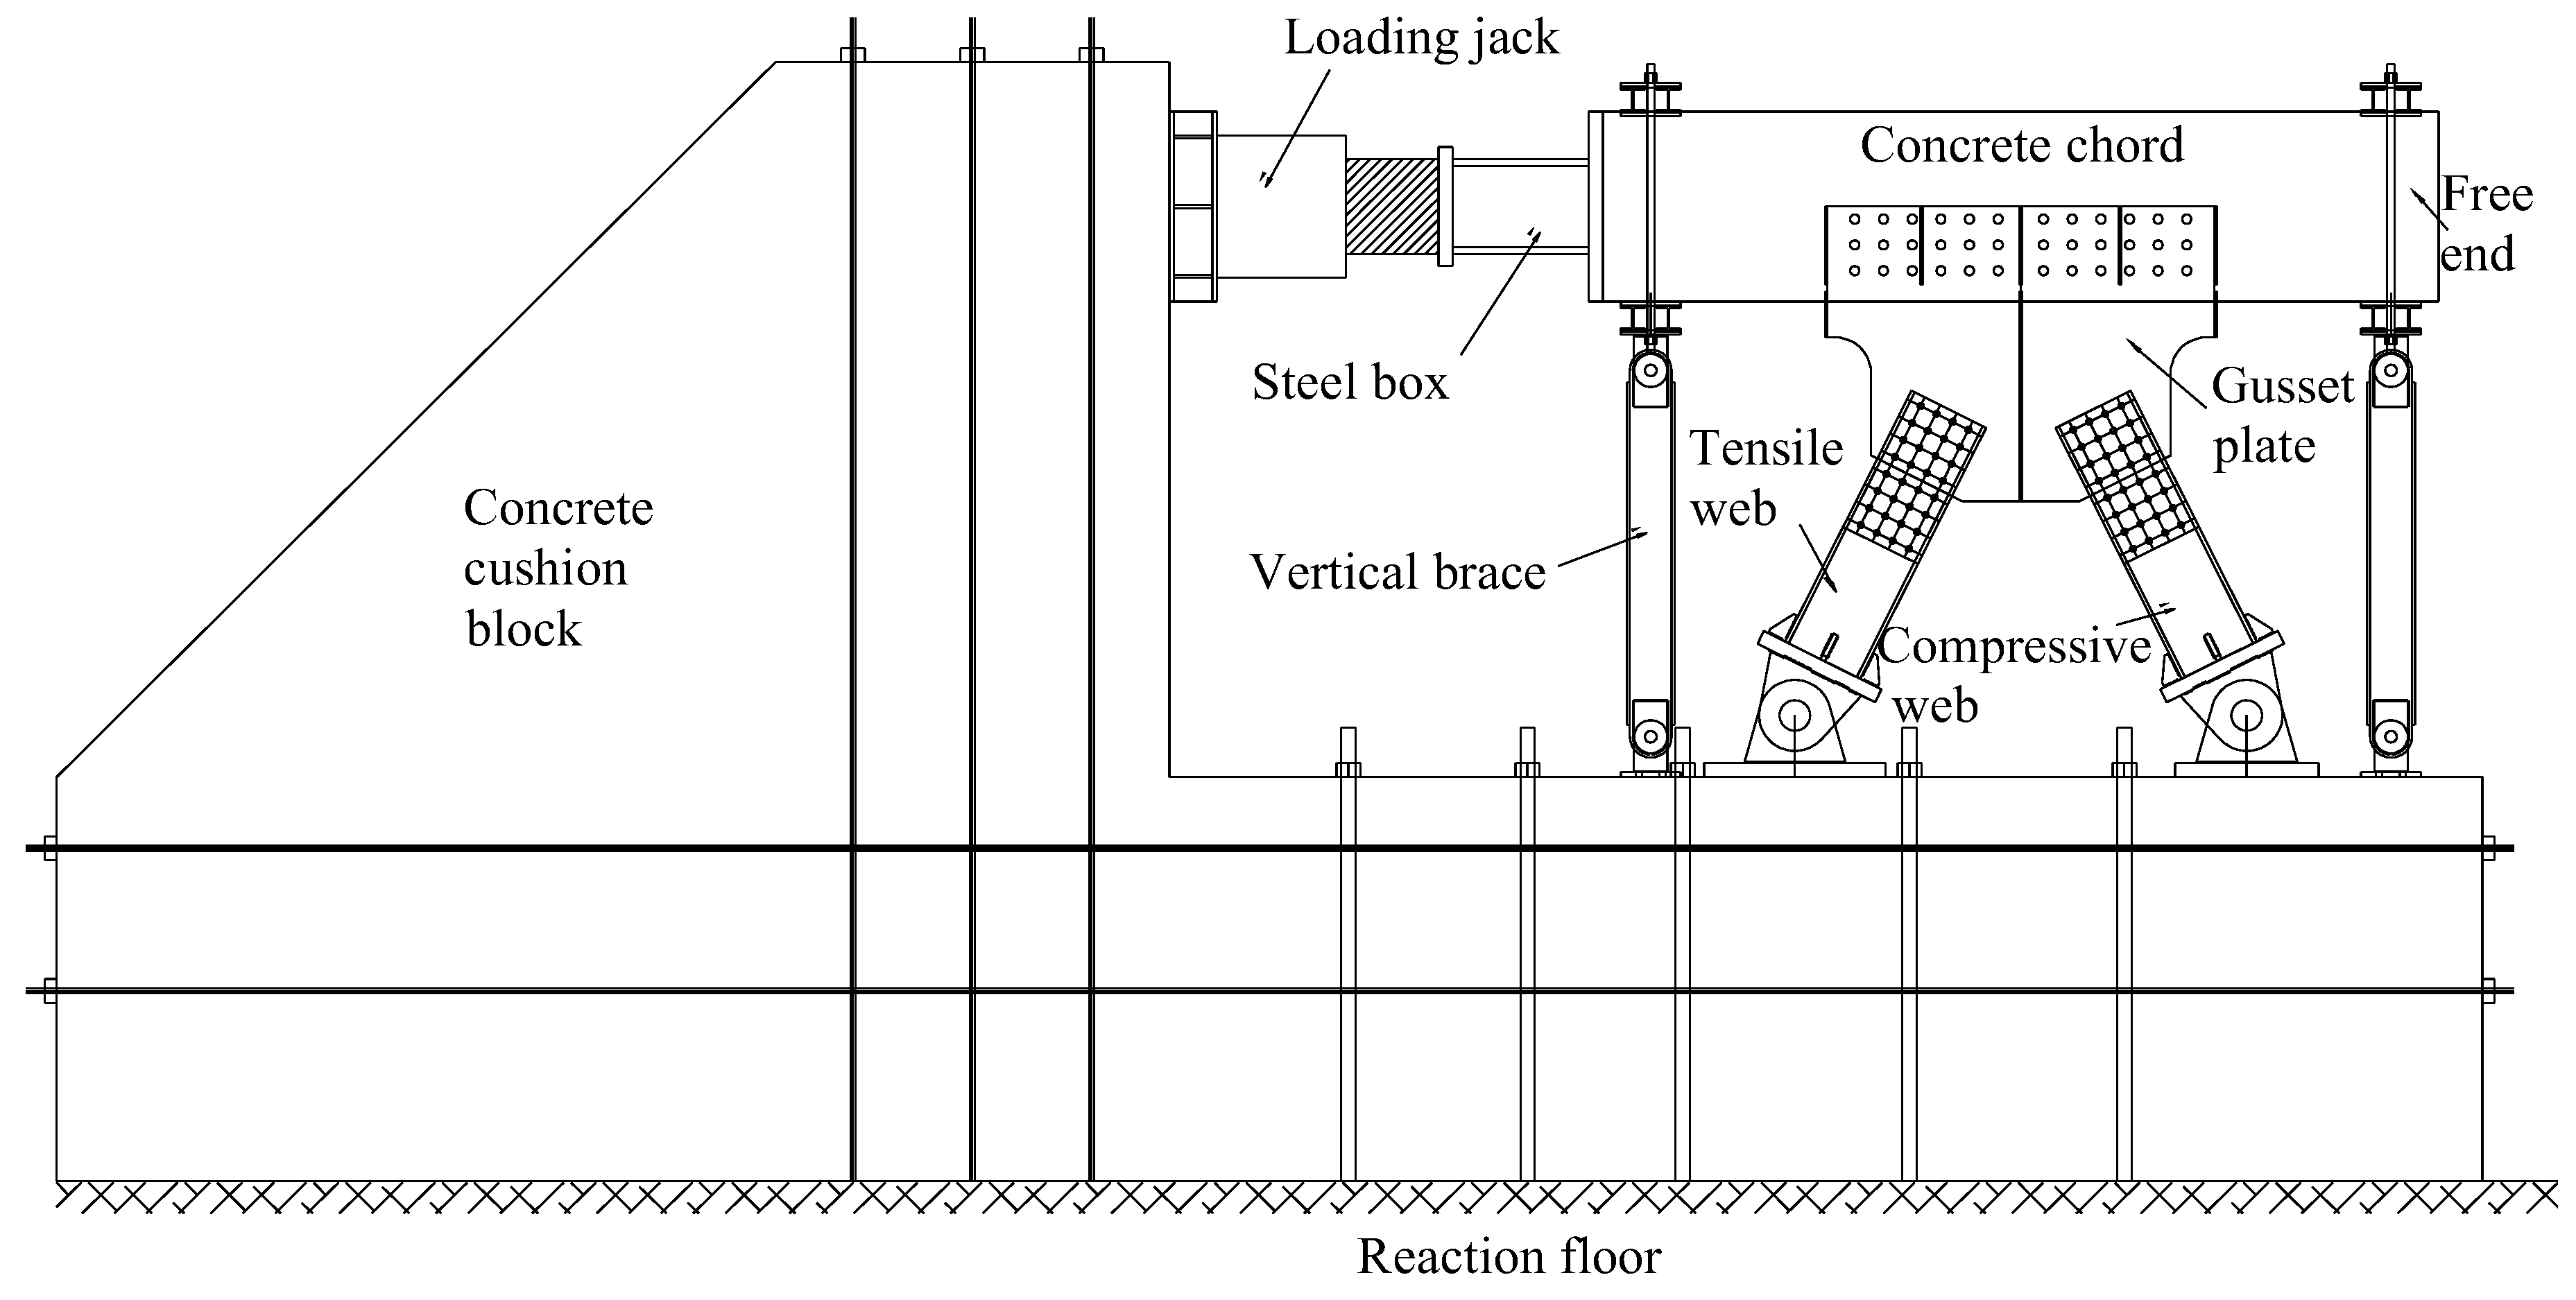
The experimental setup is shown in Figure 7. A monotonic loading mode was adopted. The axial load was applied by a hydraulic jack with a capacity of 6000 kN to the steel–concrete composite joint specimen. A prestressed concrete base was poured to constitute a self-balancing system and to resist the large force. The vertical brace was assembled to avoid unnecessary deflection along directions other than the loading direction. Otherwise, a welded steel box was utilized to transfer force from the jack to the concrete chord and to avert large local stress. The loading end of the concrete chord sustained a horizontal force applied by the loading jack. Then, the gusset plate transferred the force to the steel truss web.
Preloading was adopted to make sure all equipment functioned well. Then, the monotonic loading was carried out by a multistage loading scheme. The loading step was 400 kN when the load was less than 2000 kN. After that, the loading step was decreased to 200 kN. The values of strain and displacement related to each loading step were recorded after invariable load for 5 min in each step.
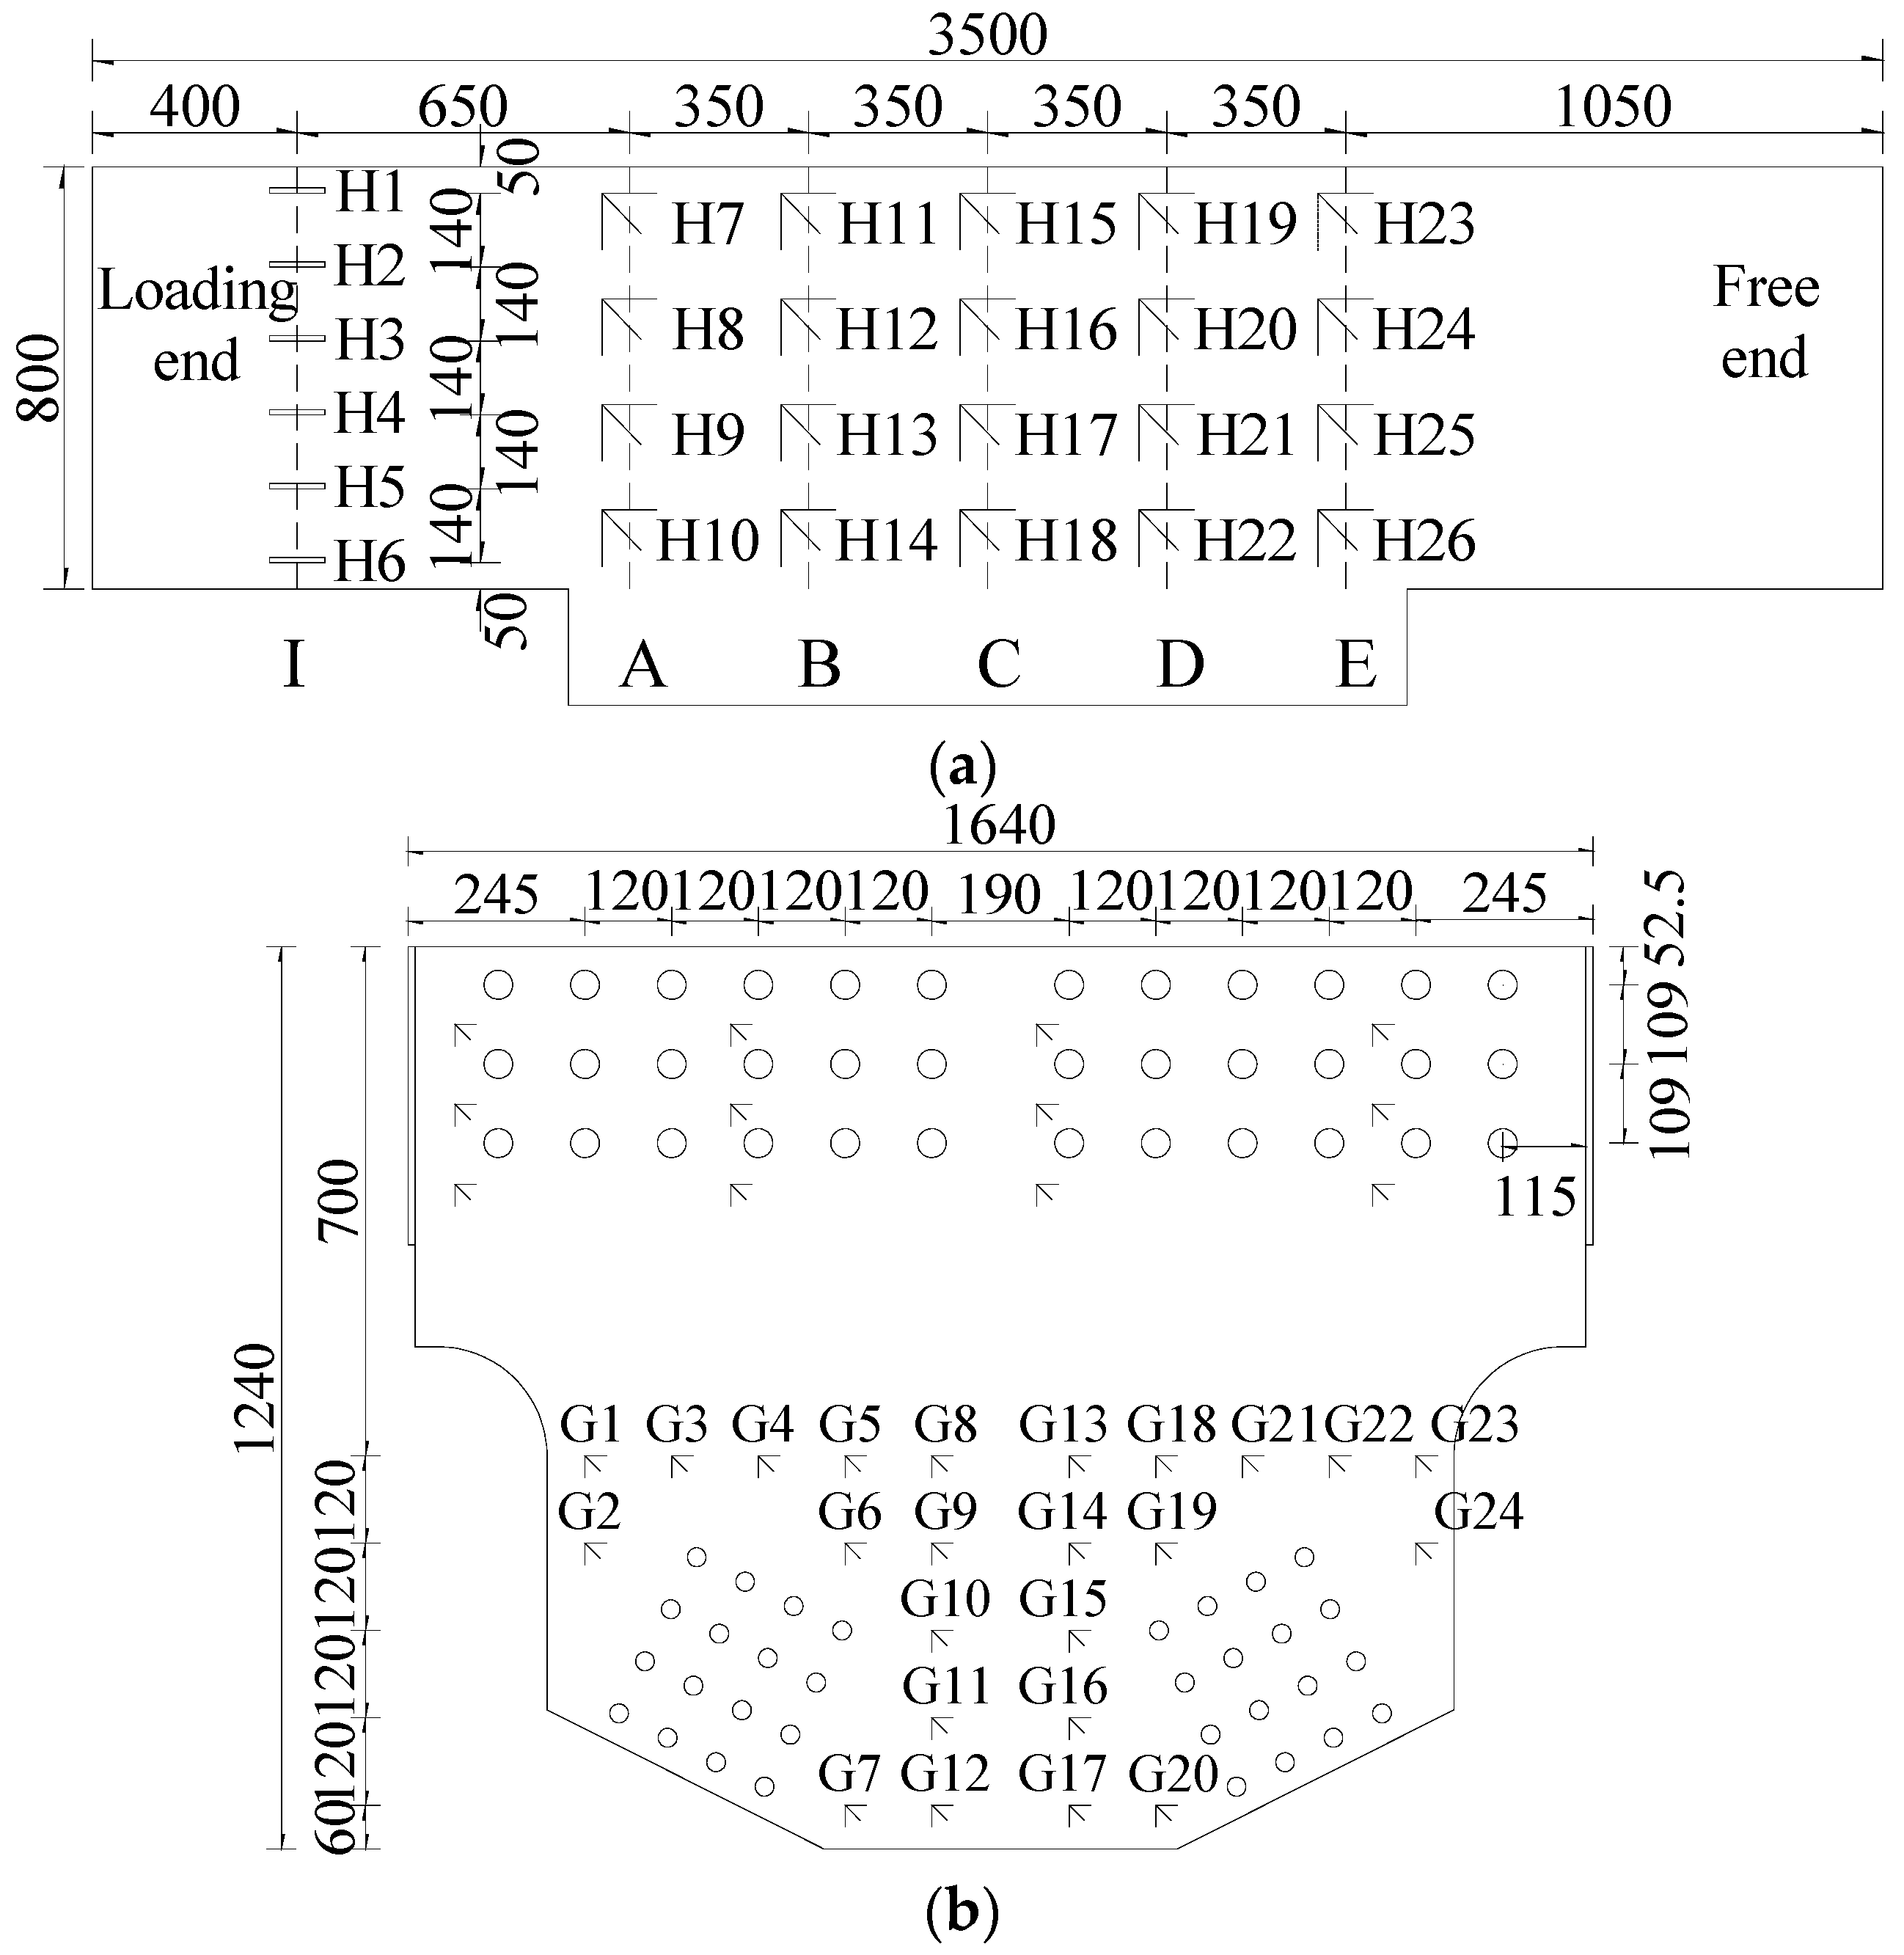
Strain gauges and rosettes were arranged on the concrete chord, gusset plates, and steel web members, as shown in Figure 8. Two LVDTs were set on the end-face of the concrete chord to measure axial displacement.
5. Analysis of Composite Joint Test Results
5.1. Experimental Phenomena
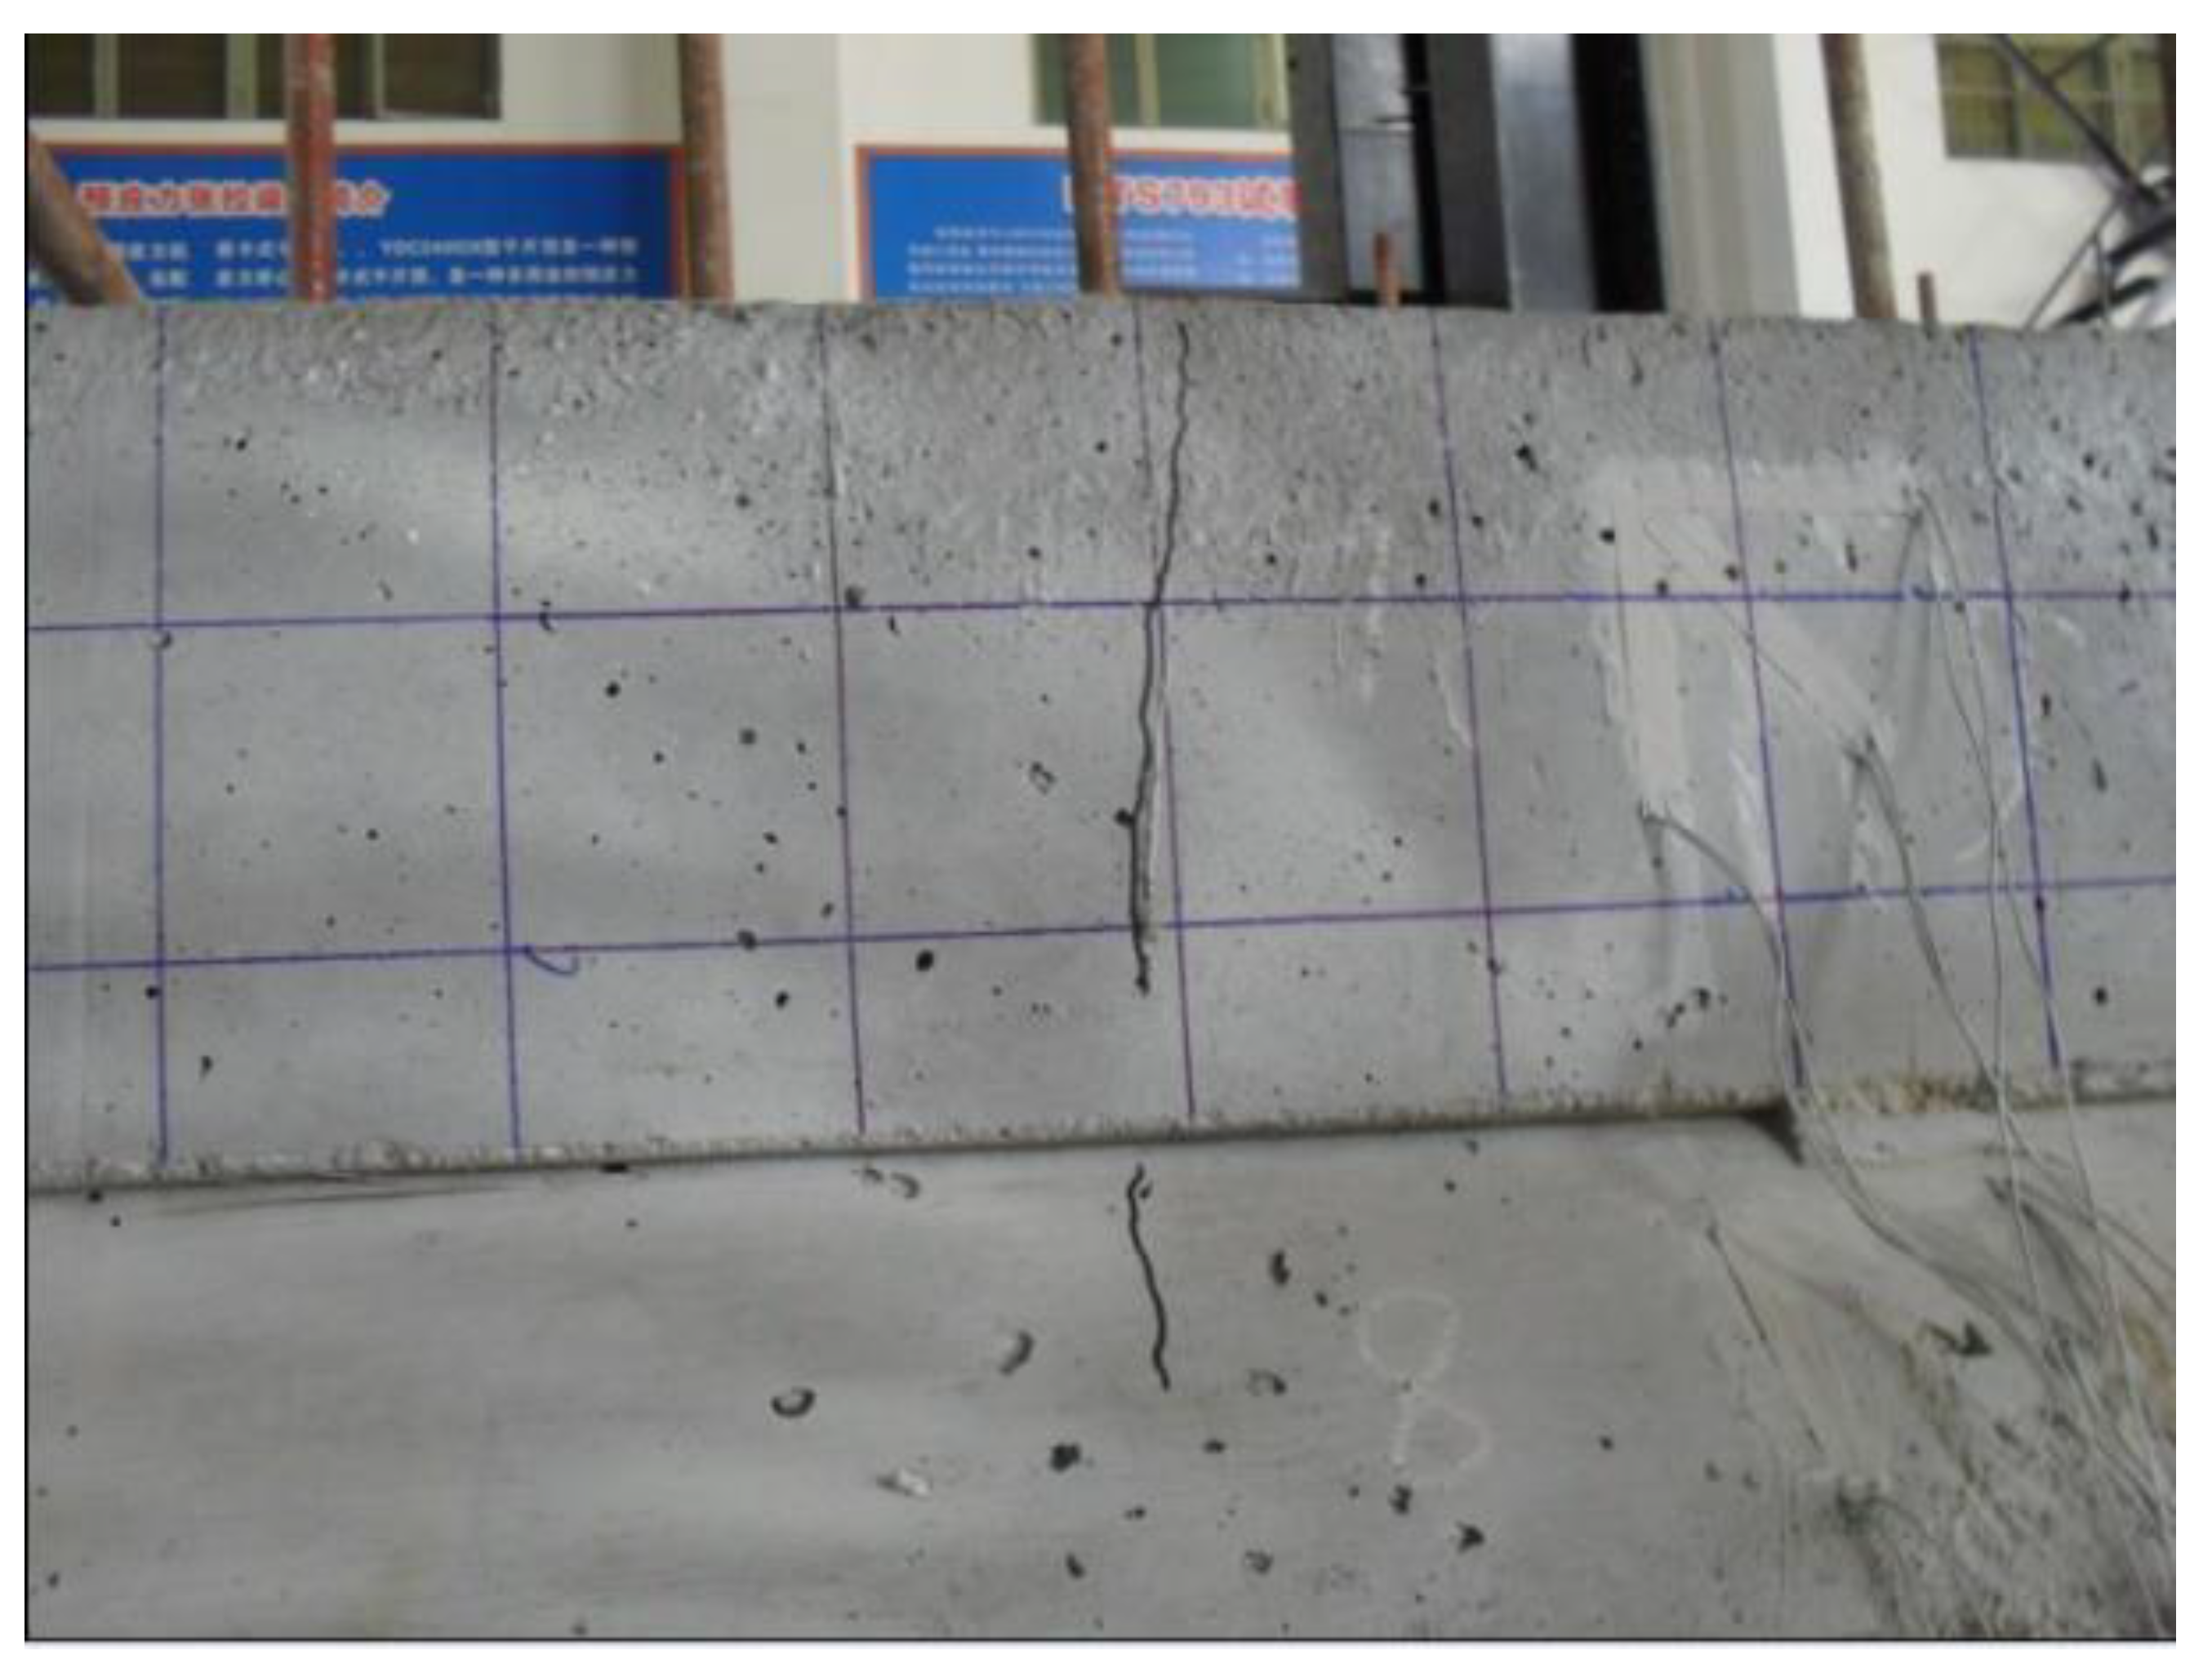
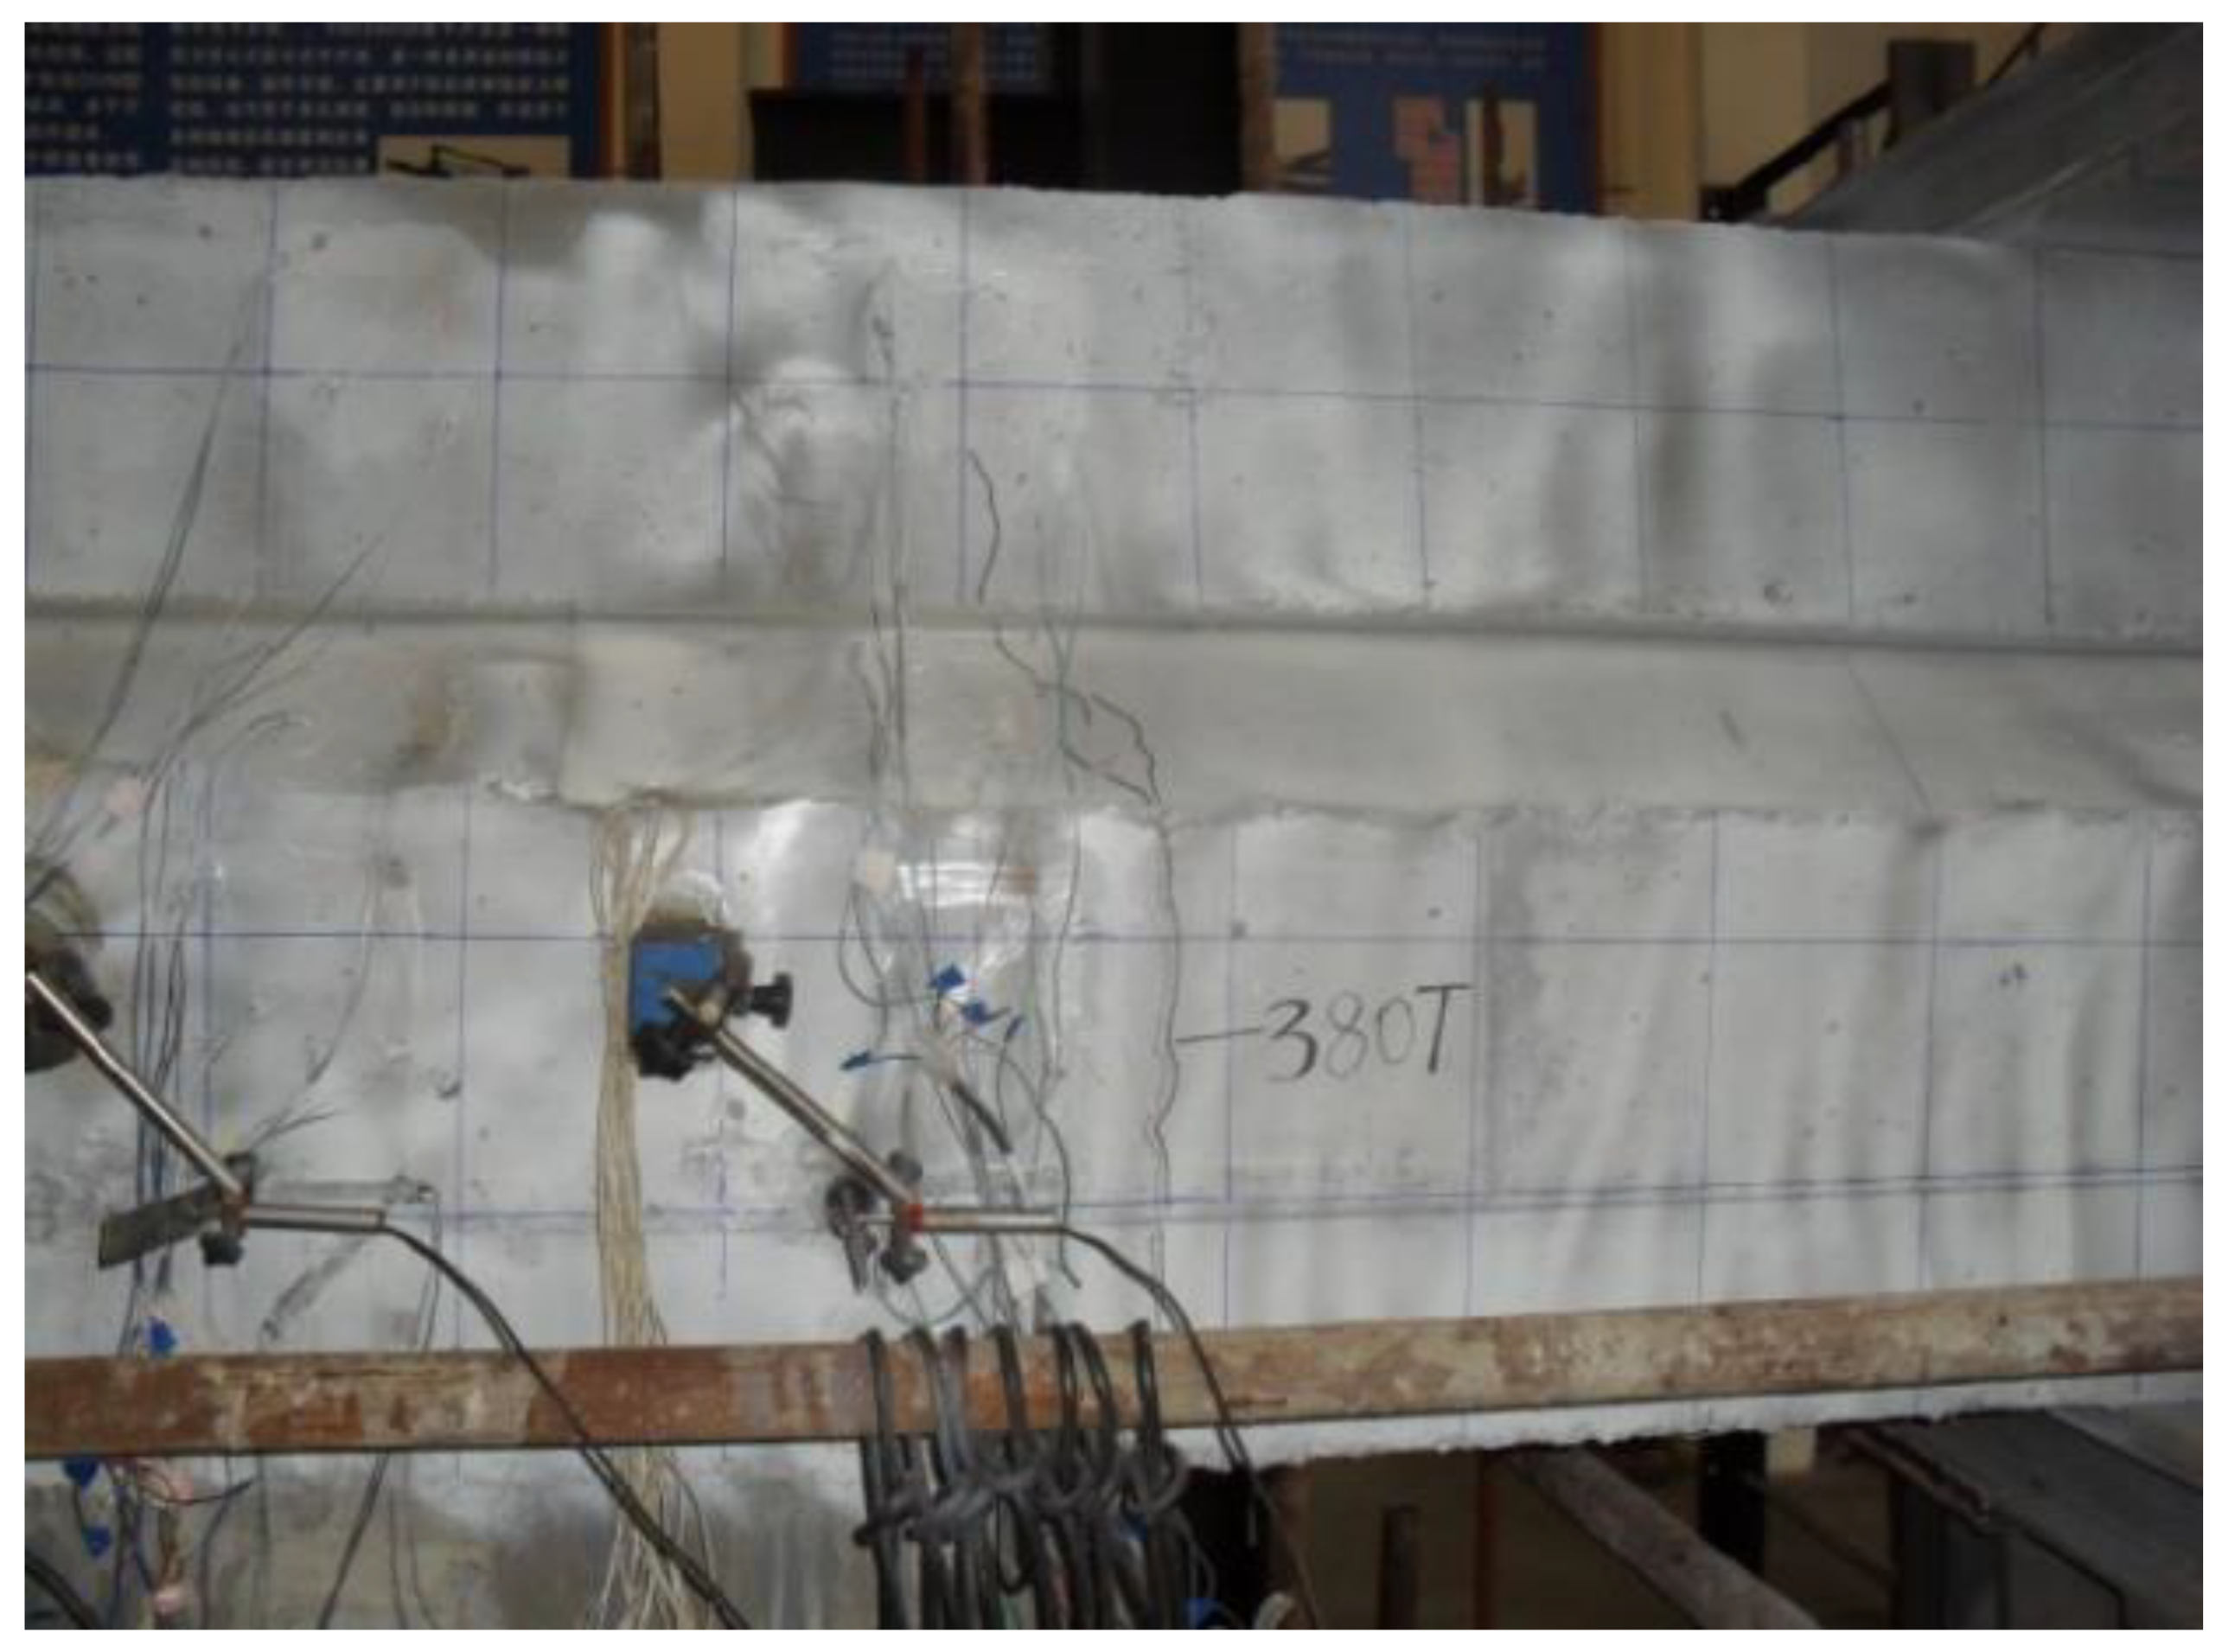
The experimental observations indicated that all three specimens had satisfactory bearing capacity and deformability. For the CJA specimen, the first crack appeared at the top of the core concrete near the loading end when the load reached 4000 kN. Moreover, the crack propagated downward along with the increase in load, as shown in Figure 9. No obvious failure occurred, but some cracks appeared before the loading program was complete. The behavior of CJB1 and CJB2 were similar to that of the CJA specimen. When the imposed load reached 3800 kN and 4200 kN, respectively, the first crack was found on the concrete chord. The initial crack of CJB1 is illustrated in Figure 10. In general, no severe damage was observed in any specimen throughout the whole loading procedure, and the crack was closed after unloading.
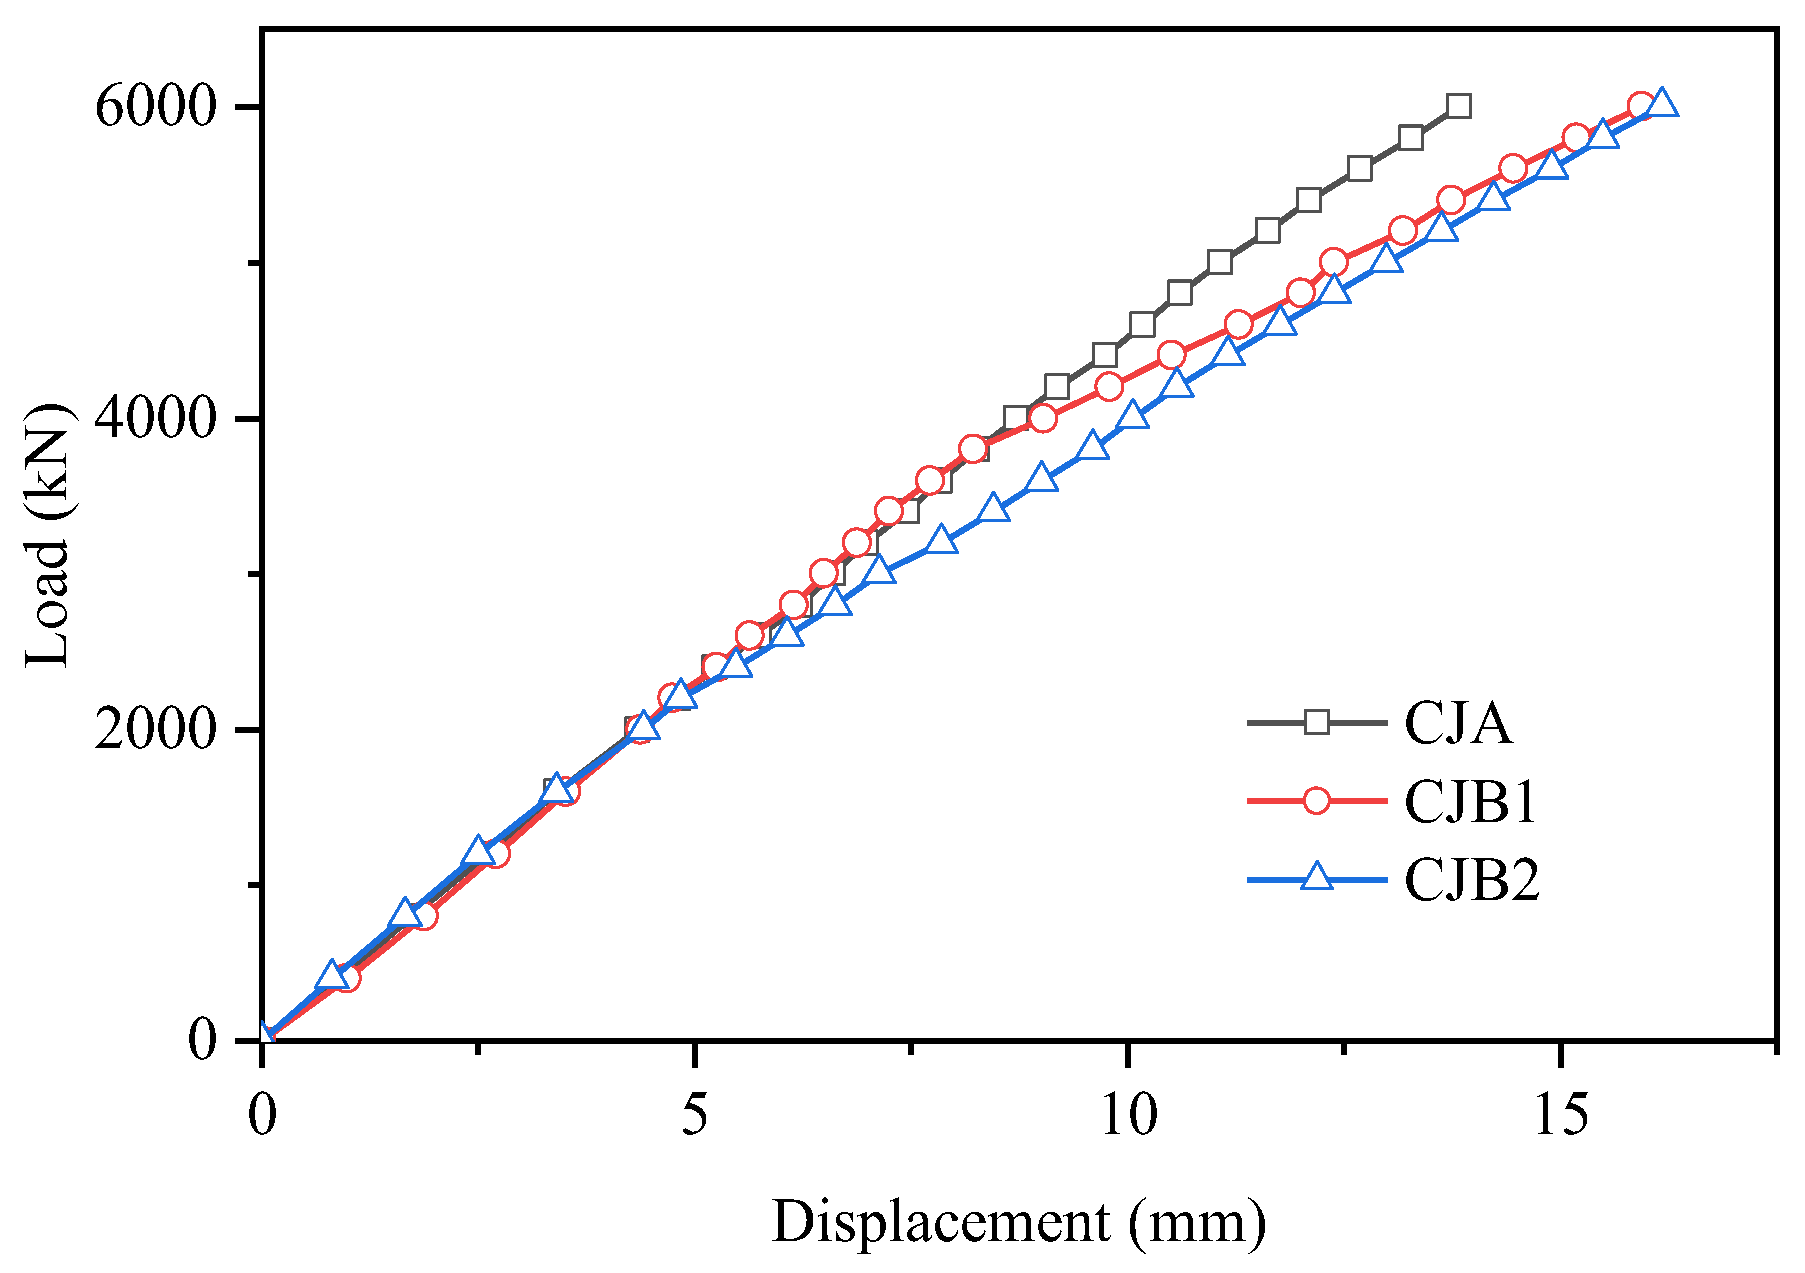
5.2. Load–Displacement Curves
Figure 11 shows that the displacement was augmented linearly with the increase in load. The trends of the curves show that the load-to-displacement ratio of CJA was larger than that of CJB. No obvious turning point appeared in CJA and CJB2. Hence, the load–displacement curves of CJA and CJB2 were in the linear elastic stage. The slope of the curve decreased after 3800 kN in CJB1 on account of the initial crack observed at 3800 kN. The displacement values of the concrete chord were 13.83 mm, 15.94 mm, and 16.17 mm in CJA, CJB1, and CJB2, respectively, when the load procedure was finished. Obviously, the bearing capacities of CJA, CJB1, and CJB2 were higher than 6000 kN. Furthermore, the bearing capacity was at least 2.93 times the design load. Overall, almost all members were in the elastic stage and had not only good deformability but also great potential to carry a greater load.
The joint stiffness was defined as the ratio of the yielding load to the corresponding displacement [12]. In view of the fact that the three composite joints were almost in the elastic stage, in this study the joint stiffness was defined as the ultimate load over the corresponding displacement. The joint stiffness values of CJA, CJB1, and CJB2 were 43.38 × 10⁴ kN/m, 37.61 × 10⁴ kN/m, and 37.11 × 10⁴ kN/m, respectively. Obviously, these results suggest that there was an association between the enhancement of the joint stiffness and the increase in the embedded depth of the PBL shear connectors.
5.3. The Strain Distribution on the Concrete Chord and Steel Web
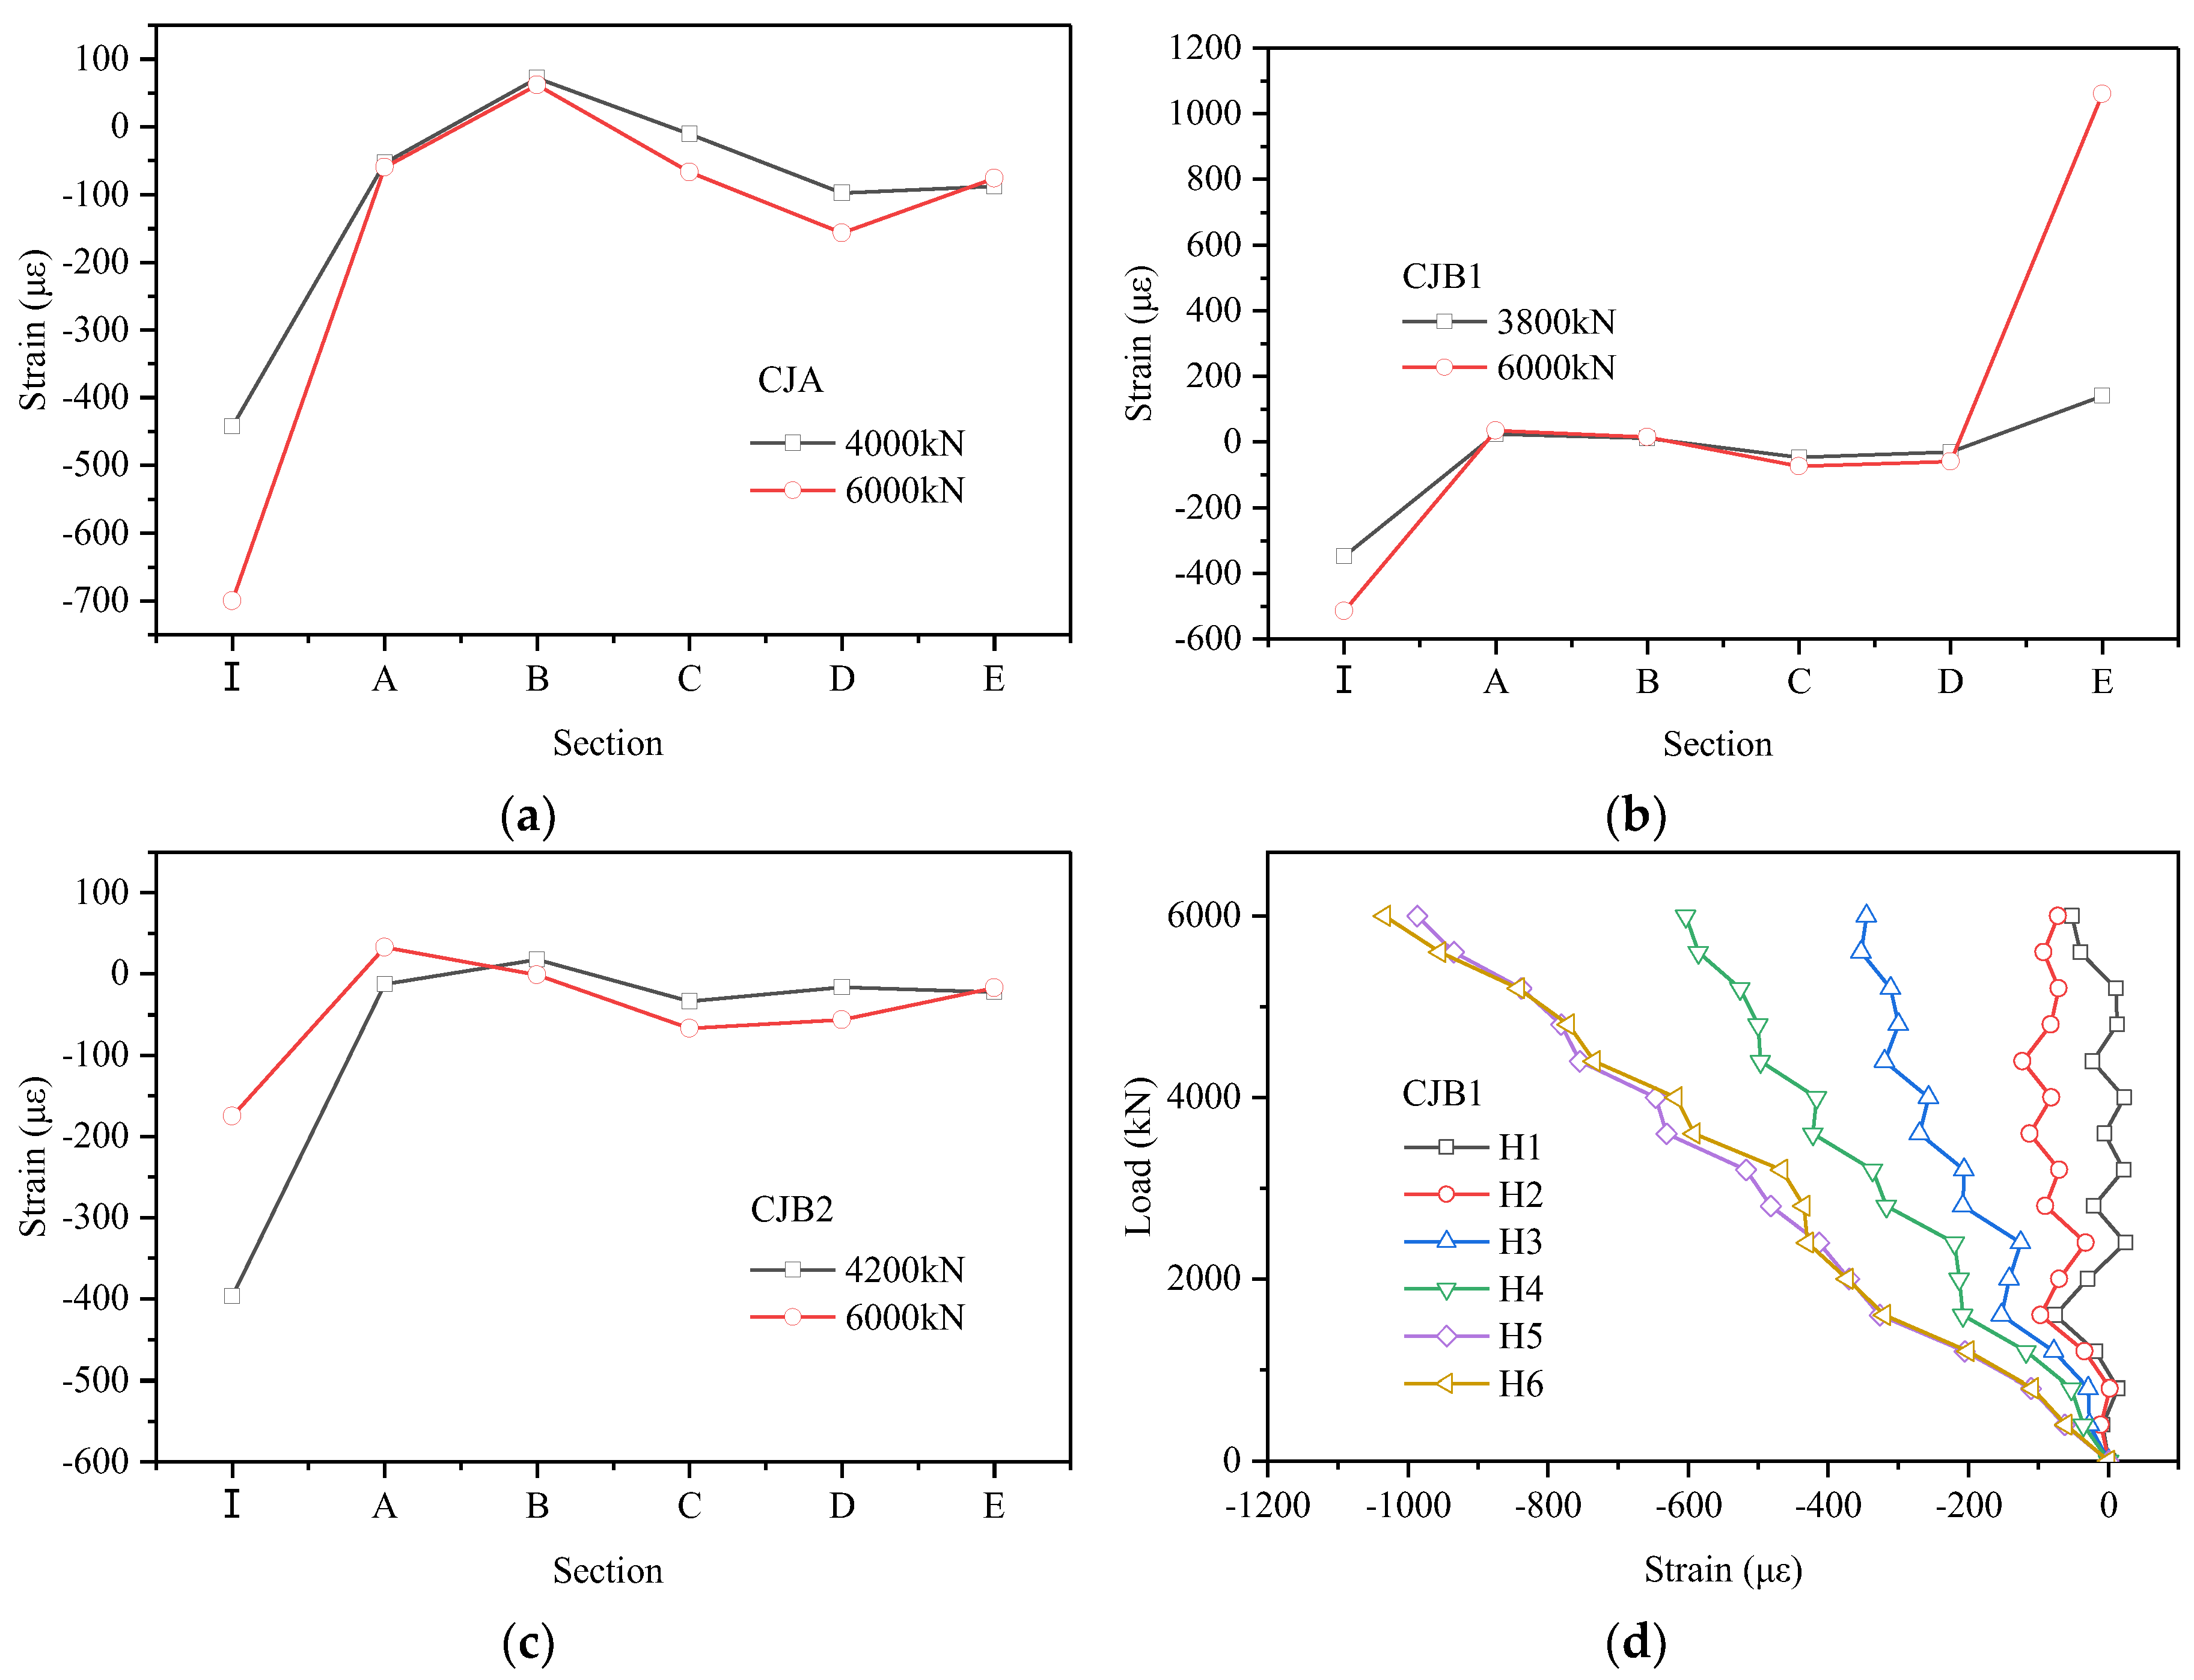
The strain distribution on the concrete chord along the loading direction of the crack load and maximum load is presented in Figure 12. In addition, the average strains of six sections were chosen for analysis. The strain of the core concrete was obviously smaller than that in the section near the loading end, as shown in Figure 12a–c. Section I was pressed by the horizontal load, and the strain value of Section I, ranging from –175 to –700 µε, was bigger than that of other sections, except for Section E of CJB1. The sudden increase in strain value on Section E was likely related to the development of concrete cracks. According to these data, we can infer that the PBL shear connectors transfer the force effectively between the concrete chord and the steel webs. Figure 12d presents the strain distribution of Section I of CJB1. Interestingly, there was a significant increase in the compressive strain of the concrete chord from H1 to H6. In other words, the concrete chord was under uneven stress and the bigger value appeared near the steel webs in the vertical direction. Furthermore, the trend found in CBJ1 was in agreement with those in CJA and CJB2.
Figure 13 presents the strains of the compressive and tensile steel webs in CJB1. The strains of the compressive and tensile steel webs were smaller than the yield strain. Consequently, the steel webs were not yielding. Similarly, the load–strain curves were still in the elastic stage.
5.4. The Strain Distribution on the Exposed Gusset Plate
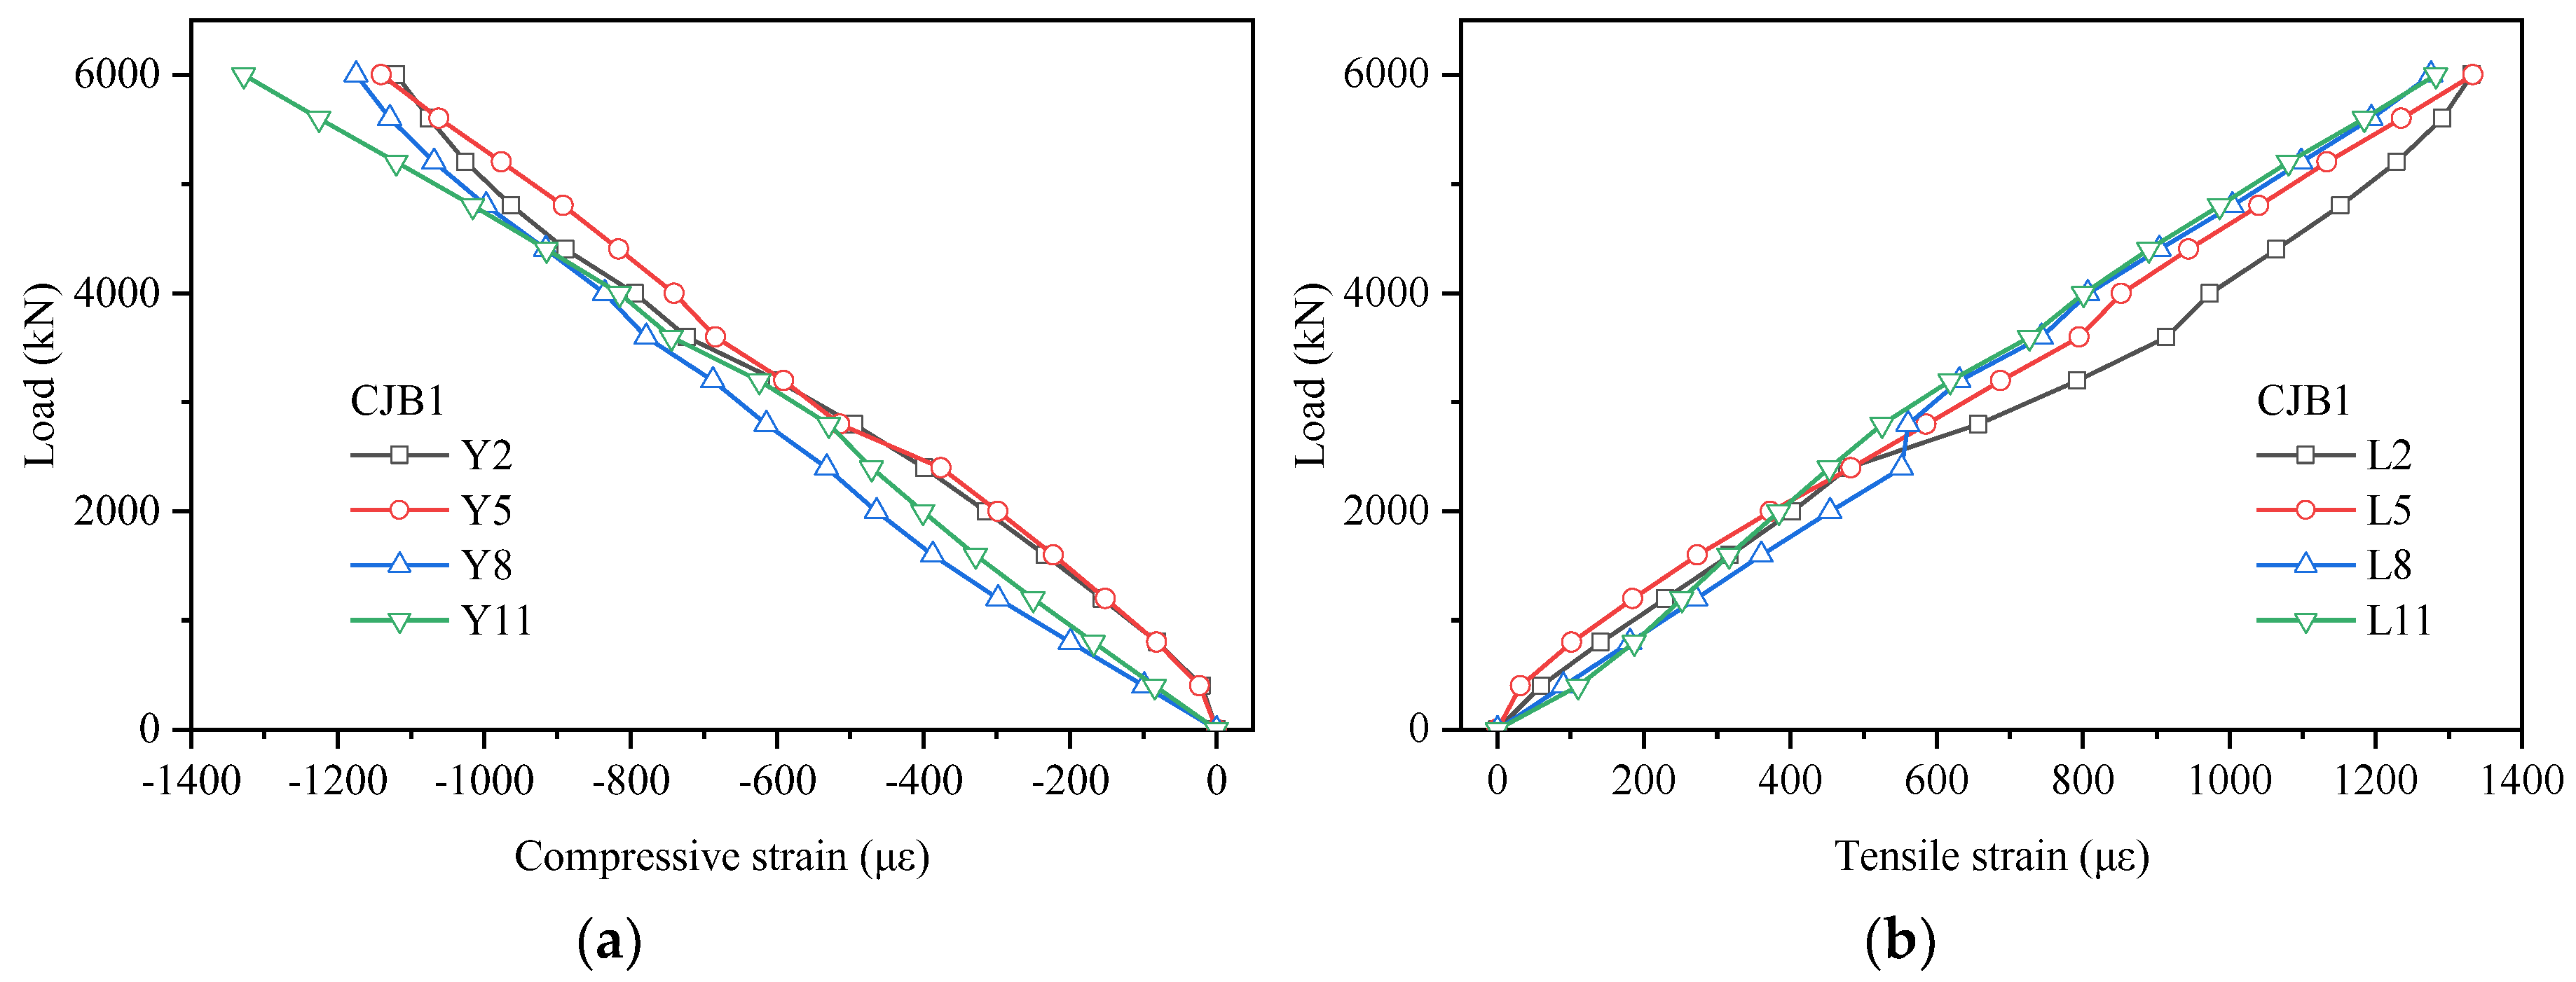
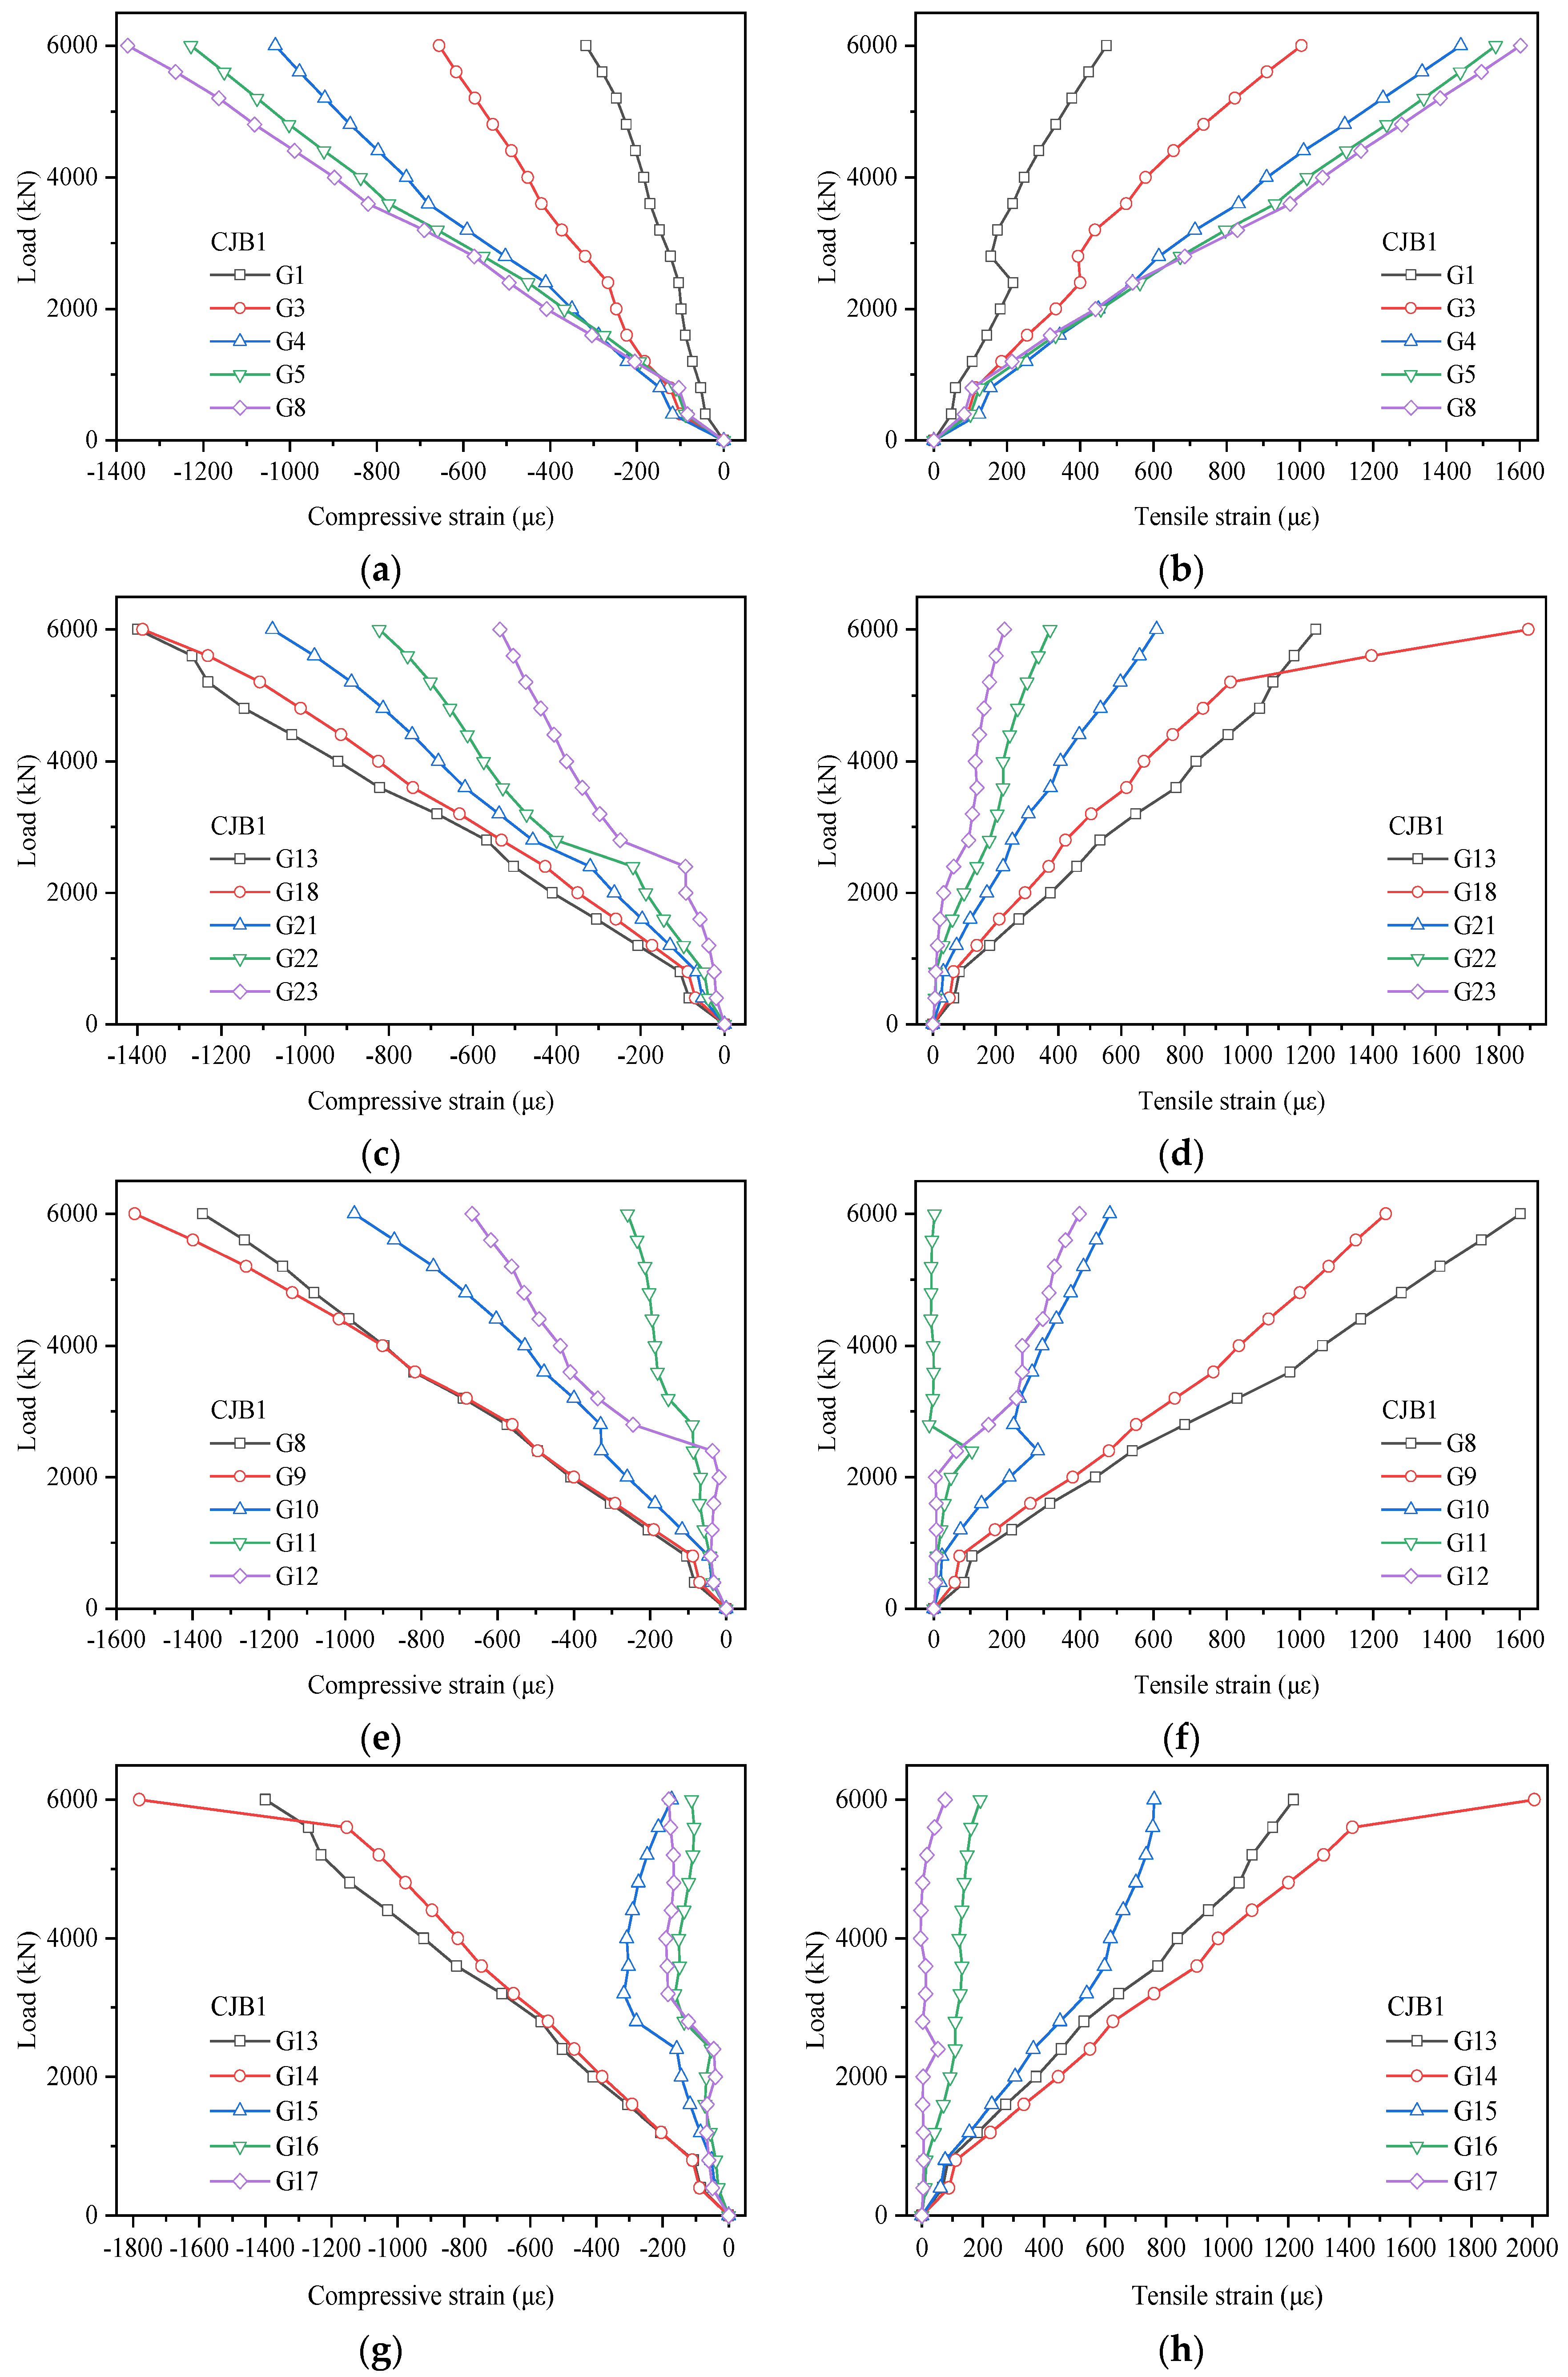
The strain distribution curves of the exposed gusset plate can be seen in Figure 14 (taking CJB1 as an example). In particular, the compressive strains of G5, G4, G3, and G1 were 89%, 75%, 48%, and 23% of that of G8, respectively, when the load reached 6000 kN. It can be seen from the curves in Figure 14a,b that the compressive and tensile strain value of G8 was significantly more than that of the other gauging points. Particularly, what stands out in those two figures is the decrease in the strain value from G8 to G1. The same trend from G23 to G13 can be observed in Figure 14c,d. In other words, the strain of the exposed gusset plate tended to decrease gradually from the middle to both sides. In the vertical direction, in Figure 14e–h, there was a clear decreasing trend from G9 to G12 in the same column, as well as from G14 to G17. The most interesting aspect in Figure 14e–h is the rapid decrease in the strain on the gusset plate from top to bottom in the vertical direction. Hence, large strain was most likely to appear in the area near G8, G9, G13, and G14 because of the intersection of the axes of the compressive and tensile steel web. These findings suggest that this area was the key area of the exposed gusset plate.
6. Conclusions
The mechanical behavior of a steel–concrete connection in a composite truss bridge was experimentally investigated. Pull-out tests of eight specimens were carried out to assess the bearing capacity of PBL shear connectors at different embedded depths. The connection performance in the composite truss bridge was evaluated through a model test on three composite joint specimens. Based on the experimental results, the following conclusions can be drawn:
- The experimental results of the pull-out and composite joint test indicated that the pull-out specimens (except PC) and the steel–concrete composite joints showed excellent resistance to an external load. The ultimate load capacities of the PA and PB specimens were about 1133 kN and 933 kN, respectively. The ultimate bearing capacities of all composite joints in this study were higher than 6000 kN and over 2.93 times the design load. Hence, these results show that PBL shear connectors exhibit excellent connection performance in resisting and transferring shear force.
- The load–slip relations and the experimental phenomena of pull-out specimens showed that the embedded depth and the existence of perforated rebars played an important role in the ultimate bearing capacity, deformability, and even the failure mode of PBL shear connectors. Resulting from increased embedded depth, the ultimate load and the corresponding slip of PA specimens were on average 21% and 408% bigger, respectively, in comparison with those of PB specimens. Furthermore, compared with PB specimens, PA specimens underwent ductile failure rather than brittle failure. Similarly, the average ultimate bearing capacity and the corresponding slip of PA specimens were increased by 110% and 633%, respectively, in comparison with those of PC specimens, because of the existence of perforated rebars in the PA specimens.
- Increased embedded depth can enhance the stiffness of composite joints in a composite truss bridge. For instance, the joint stiffness increased from 37.61 × 10⁴ kN/m in CJB1 to 43.38 × 10⁴ kN/m in CJA because the embedded depth was increased from 130 mm to 200 mm.
- The experimental data of composite joints revealed that there was an interesting distribution of strain on the exposed gusset plate and the concrete chord. The strain decreased from G8 to G1 in the same row and from G13 to G23. Similarly, the diminution of strain occurred in the same column from G9 to G12 as well as from G14 to G17. Consequently, the area enclosed by G8, G9, G14, and G13 was the key area of the exposed gusset plate. In addition, the compressive strain in the first column of gauging points was bigger than that on the concrete chord, and the strain on the concrete chord increased from top to bottom in the vertical direction.
Author Contributions
Writing—original draft manuscript, Y.T.; Conceptualization, B.Z.; Investigation, T.Y., B.H. (Biao Huang) and X.W.; Visualization, Y.T.; Writing—review and editing, Y.T., W.Y. and B.H. (Bo Huang).
Funding
The research described in this paper was supported by the National Natural Science Foundation of China (No. 51178397), the Major Applied Basic Research Frontier Projects of Sichuan Province (No. 2017JY0003), the Railway Scientific Research and Development Project of the Ministry of Railways of China (No. 2010G019-E), and the Scientific Research and Development Project of the China Railway First Survey and Design Institute Group Co. Ltd. (No. 16-18).
Conflicts of Interest
The authors declare no conflict of interest.
References
- Chen, C.; Lin, N. Analytical model for predicting axial capacity and behavior of concrete encased steel composite stub columns. J. Constr. Steel Res. 2006, 62, 424–433. [Google Scholar] [CrossRef]
- Liang, Y.; Li, D.; Parvasi, S.M.; Kong, Q.; Lim, I.; Song, G. Bond-slip detection of concrete-encased composite structure using electro-mechanical impedance technique. Smart Mater. Struct. 2016, 25, 095003. [Google Scholar] [CrossRef]
- Zeng, L.; Parvasi, S.M.; Kong, Q.; Huo, L.; Lim, I.; Li, M.; Song, G. Bond slip detection of concrete-encased composite structure using shear wave based active sensing approach. Smart Mater. Struct. 2015, 24, 125026. [Google Scholar] [CrossRef]
- Xu, B.; Zhang, T.; Song, G.; Gu, H. Active interface debonding detection of a concrete-filled steel tube with piezoelectric technologies using wavelet packet analysis. Mech. Syst. Signal Process. 2013, 36, 7–17. [Google Scholar] [CrossRef]
- Zhang, J.; Li, Y.; Du, G.; Song, G. Damage Detection of L-Shaped Concrete Filled Steel Tube (L-CFST) Columns under Cyclic Loading Using Embedded Piezoceramic Transducers. Sensors 2018, 18, 2171. [Google Scholar] [CrossRef] [PubMed]
- Xu, B.; Li, B.; Song, G. Active Debonding Detection for Large Rectangular CFSTs Based on Wavelet Packet Energy Spectrum with Piezoceramics. J. Struct. Eng. 2013, 139, 1435–1443. [Google Scholar] [CrossRef]
- Ding, F.-X.; Luo, L.; Wang, L.; Cheng, S.; Yu, Z.-W. Pseudo-static tests of terminal stirrup-confined concrete-filled rectangular steel tubular columns. J. Constr. Steel Res. 2018, 144, 135–152. [Google Scholar] [CrossRef]
- Zhang, J.; Li, Y.; Zheng, Y.; Wang, Z. Seismic Damage Investigation of Spatial Frames with Steel Beams Connected to L-Shaped Concrete-Filled Steel Tubular (CFST) Columns. Appl. Sci. 2018, 8. [Google Scholar] [CrossRef]
- Jung, K.H.; Lee, S.H.; Yi, J.W.; Kim, J.H.J.; Ha, J.H. Fatigue capacity of a new connection system for a prestressed concrete hybrid truss web girder. Mag. Concr. Res. 2012, 64, 665–672. [Google Scholar] [CrossRef]
- Machacek, J.; Cudejko, M. Longitudinal shear in composite steel and concrete trusses. Eng. Struct. 2009, 31, 1313–1320. [Google Scholar] [CrossRef]
- Choi, J.-H.; Jung, K.-H.; Kim, T.-K.; Kim, J.-H.J. Analytical and Experimental Studies on Torsional Behavior of Hybrid Truss Bridge Girders with Various Connection Joints. J. Adv. Concr. Technol. 2014, 12, 478–495. [Google Scholar] [CrossRef] [Green Version]
- Yin, G.; Ding, F.; Wang, H.; Bai, Y.; Liu, X. Connection Performance in Steel–Concrete Composite Truss Bridge Structures. J. Bridge Eng. 2016, 22, 04016126. [Google Scholar] [CrossRef]
- Huo, L.; Song, G.; Nagarajaiah, S.; Li, H. Semi-active vibration suppression of a space truss structure using a fault tolerant controller. J. Vib. Control 2011, 18, 1436–1453. [Google Scholar] [CrossRef]
- Suo, Y.; Yang, W.; Chen, P. Study on Hysteresis Model of Welding Material in Unstiffened Welded Joints of Steel Tubular Truss Structure. Appl. Sci. 2018, 8, 1701. [Google Scholar] [CrossRef]
- Yang, W.; Lin, J.; Gao, N.-N.; Yan, R. Experimental Study on the Static Behavior of Reinforced Warren Circular Hollow Section (CHS) Tubular Trusses. Appl. Sci. 2018, 8, 2237. [Google Scholar] [CrossRef]
- Jiang, T.; Wu, Q.; Wang, L.; Huo, L.; Song, G. Monitoring of Bolt Looseness-Induced Damage in Steel Truss Arch Structure Using Piezoceramic Transducers. IEEE Sens. J. 2018, 18, 6677–6685. [Google Scholar] [CrossRef]
- Song, G.; Vlattas, J.; Johnson, S.E.; Agrawal, B.N. Active vibration control of a space truss using a lead zirconate titanate stack actuator. Proc. Inst. Mech. Eng. Part G J. Aerosp. Eng. 2001, 215, 355–361. [Google Scholar] [CrossRef]
- Chang, S.-Y. Experimental Studies of Reinforced Concrete Bridge Columns under Axial Load Plus Biaxial Bending. J. Struct. Eng. 2010, 136, 12–25. [Google Scholar] [CrossRef]
- Kowalsky, M.J. Deformation Limit States for Circular Reinforced Concrete Bridge Columns. J. Struct. Eng. 2000, 126, 869–878. [Google Scholar] [CrossRef]
- Song, G.; Mo, Y.L.; Otero, K.; Gu, H. Health monitoring and rehabilitation of a concrete structure using intelligent materials. Smart Mater. Struct. 2006, 15, 309–314. [Google Scholar] [CrossRef]
- Chen, K. Introduction of Boulonnais Viaduct in France. Foreign Bridges 1999, 1, 15–17. [Google Scholar]
- Pham, X.T. A new generation of composite bridges, The Boulonnais Viaducts in France. Proc. FIP Symp. Lisbon Portugal 1997, 2, 909–916. [Google Scholar]
- Dauner, H.; Oribasi, A.; Wery, D. The Lully Viaduct, a composite bridge with steel tube truss. J. Constr. Steel Res. 1998, 46, 67–68. [Google Scholar] [CrossRef]
- Aoki, K.; Takatoku, Y.; Notoya, H.; Uehira, Y.; Kato, T.; Yamaguchi, T. Design and construction of Sarutagawa bridge and Tomoegawa bridge. Bridge Found. 2005, 39, 2–11. [Google Scholar]
- Fujiwara, H.; Kabaki, Y.; Shoji, A.; Noro, T. Design and Construction of Shitsumiohashi. Concr. J. 2005, 43, 47–52. [Google Scholar] [CrossRef]
- Minami, H.; Yamamura, M.; Taira, Y.; Furuichi, K. Design of the Kinokawa viaduct composite truss bridge. In Proceedings of the 1st JSCE Congress, Composite Structures, Osaka, Japan, 13–19 October 2002; pp. 371–380. [Google Scholar]
- He, J.; Liu, Y.; Pei, B. Experimental Study of the Steel-Concrete Connection in Hybrid Cable-Stayed Bridges. J. Perform. Constr. Facil. 2014, 28, 559–570. [Google Scholar] [CrossRef]
- Sato, Y.; Hino, S.I.; Sonoda, Y.; Yamaguchi, K.; Cheon, S.B. Study on load transfer mechanism of the joint in hybrid truss bridge. J. Struct. Eng. A 2008, 54, 778–785. [Google Scholar] [CrossRef]
- Udomworarat, P.; Miki, C.; Ichikawa, A.; Komechi, M.; Mitsuki, K.; Hosaka, T. Fatigue performance of composite tubular K-joints for truss type bridge. J. Struct. Eng. 2002, 19, 65–79. [Google Scholar] [CrossRef]
- Udomworarat, P.; Miki, C.; Ichikawa, A.; Sasaki, E.; Sakamoto, T.; Mitsuki, K.; Hasaka, T. Fatigue and ultimate strengths of concrete filled tubular k-joints on truss girder. J. Struct. Eng. 2000, 46, 1627–1635. [Google Scholar]
- Huang, W.; Fenu, L.; Chen, B.; Briseghella, B. Experimental study on K-joints of concrete-filled steel tubular truss structures. J. Constr. Steel Res. 2015, 107, 182–193. [Google Scholar] [CrossRef]
- Huang, W.; Fenu, L.; Chen, B.; Briseghella, B. Experimental study on joint resistance and failure modes of concrete filled steel tubular (CFST) truss girders. J. Constr. Steel Res. 2018, 141, 241–250. [Google Scholar] [CrossRef]
- Furuichi, K.; Yamamura, M.; Nagumo, H.; Yoshida, K.; Eligehausen, R. Experimental study on a new joint for prestressed concrete composite bridge with steel truss web. In Proceedings of the International Symposium on Connections between Steel and Concrete, Bagneux, France; 2001; pp. 1250–1259. [Google Scholar]
- Furuichi, K.; Hishiki, Y.; Yoshida, K.; Honda, T.; Yamamura, M.; Minami, H. The proposal of a design method of the joint structure for the steel/concrete truss bridge. Proc. Jpn. Soc. Civ. Eng. 2006, 62, 349–366. [Google Scholar] [CrossRef]
- Jung, K.H.; Yi, J.W.; Kim, J.H.J. Structural safety and serviceability evaluations of prestressed concrete hybrid bridge girders with corrugated or steel truss web members. Eng. Struct. 2010, 32, 3866–3878. [Google Scholar] [CrossRef]
- Jung, K.H.; Kim, J.H.J.; Yi, J.W.; Lee, S.H. Development and Evaluation of New Connection Systems for Hybrid Truss Bridges. J. Adv. Concr. Technol. 2013, 11, 61–79. [Google Scholar] [CrossRef] [Green Version]
- Xue, D.; Liu, Y.; He, J.; Ma, B. Experimental study and numerical analysis of a composite truss joint. J. Constr. Steel Res. 2011, 67, 957–964. [Google Scholar] [CrossRef]
- Liu, Y.; Xin, H.; He, J.; Xue, D.; Ma, B. Experimental and analytical study on fatigue behavior of composite truss joints. J. Constr. Steel Res. 2013, 83, 21–36. [Google Scholar] [CrossRef]
- Zhou, L.; He, G. Experimental research on end joint of steel-concrete composite truss. Balt. J. Road Bridge E 2012, 7, 305–313. [Google Scholar] [CrossRef]
- MRPRC (Ministry of Railways of the People’s Republic of China). Code for Design in Reinforced and Prestressed Concrete Structure of Railway Bridge and Culvert; TB 10002.3-2005; China Railway Press: Beijing, China, 2005.
- Li, Z.; Zhao, C.; Deng, K.; Wang, W. Load Sharing and Slip Distribution in Multiple Holes of a Perfobond Rib Shear Connector. J. Struct. Eng. 2018, 144, 04018147. [Google Scholar] [CrossRef]
- Xiao, L.; Li, X.; John Ma, Z. Behavior of Perforated Shear Connectors in Steel–Concrete Composite Joints of Hybrid Bridges. J. Bridge Eng. 2017, 22, 04016135. [Google Scholar] [CrossRef]
- Liu, Y.; Xin, H.; Liu, Y. Load transfer mechanism and fatigue performance evaluation of suspender-girder composite anchorage joints at serviceability stage. J. Constr. Steel Res. 2018, 145, 82–96. [Google Scholar] [CrossRef]
- Wang, X.; Zhu, B.; Cui, S.; Lui, E.M. Experimental Research on PBL Connectors Considering the Effects of Concrete Stress State and Other Connection Parameters. J. Bridge Eng. 2018, 23, 04017125. [Google Scholar] [CrossRef]
- Zhang, Q.; Jia, D.; Bao, Y.; Cheng, Z.; Xiao, L.; Bu, Y. Internal force transfer effect-based fatigue damage evaluation for PBL shear connector groups. J. Constr. Steel Res. 2018, 148, 469–478. [Google Scholar] [CrossRef]
- Zhao, C.; Li, Z.; Deng, K.; Wang, W. Experimental investigation on the bearing mechanism of Perfobond rib shear connectors. Eng. Struct. 2018, 159, 172–184. [Google Scholar] [CrossRef]
- Wang, W.; Zhao, C.; Li, Q.; Zhuang, W. Study on Load-Slip Characteristic Curves of Perfobond Shear Connectors in Hybrid Structures. J. Adv. Concr. Technol. 2014, 12, 413–424. [Google Scholar] [CrossRef] [Green Version]
- MRPRC (Ministry of Railways of the People’s Republic of China). Fundamental Code for Design on Railway Bridge and Culvert; TB 10002.1-2005; China Railway Press: Beijing, China, 2005.
Figure 1.
Details of the pull-out specimens. (a) configuration and geometry of specimen PA; (b) configuration and geometry of specimen PB; (c) 3D diagram of the pull-out specimen.
Figure 1.
Details of the pull-out specimens. (a) configuration and geometry of specimen PA; (b) configuration and geometry of specimen PB; (c) 3D diagram of the pull-out specimen.


Figure 2.
Pull-out test setup. LVDT: linear variable displacement transducer.

Figure 3.
Failure modes of pull-out specimens. (a) the crack development of PA specimens; (b) the failure mode of the perforated rebars in PA specimens; (c) the crack development of PB specimens; (d) the failure mode of the perforated rebars in PB specimens; (e) the crack development of PB specimens; (f) the junction between the steel plate and top of the concrete in PC specimens.


Figure 4.
Load–slip curves of specimens. (a) PA specimens; (b) PB specimens; (c) PC specimens; (d) the comparison of PA2, PB2, and PC2.
Figure 4.
Load–slip curves of specimens. (a) PA specimens; (b) PB specimens; (c) PC specimens; (d) the comparison of PA2, PB2, and PC2.

Figure 5.
Layout of a steel–concrete composite continuous truss bridge (unit: m).

Figure 6.
Details of composite joint specimens (a) CJA and (b) CJB.

Figure 7.
Schema of the test setup.

Figure 8.
Arrangement of strain gauges and rosettes (unit: mm). (a) the concrete chord. (b) the gusset plate.
Figure 8.
Arrangement of strain gauges and rosettes (unit: mm). (a) the concrete chord. (b) the gusset plate.

Figure 9.
The concrete crack in CJA.

Figure 10.
The concrete crack in CJB.

Figure 11.
Load–displacement curves of composite joints.

Figure 12.
Load–strain curves of the concrete chord. (a) CJA; (b) CJB1; (c) CJB2; (d) the strain values of the first column strain gauge in CJB1.
Figure 12.
Load–strain curves of the concrete chord. (a) CJA; (b) CJB1; (c) CJB2; (d) the strain values of the first column strain gauge in CJB1.

Figure 13.
Load–strain curves of the steel web. (a) the compressive steel web of CJB1; (b) the tensile steel web of CJB1.
Figure 13.
Load–strain curves of the steel web. (a) the compressive steel web of CJB1; (b) the tensile steel web of CJB1.

Figure 14.
Load–strain curves of CJB1′s gusset plate. (a) compressive strain from G1 to G8; (b) tensile strain from G1 to G8; (c) compressive strain from G13 to G23; (d) tensile strain from G13 to G23; (e) compressive strain from G8 to G12; (f) tensile strain from G8 to G12; (g) compressive strain from G13 to G17; (h) tensile strain from G13 to G17.


Table 1.
Mechanical properties of materials.
| Member | Material | fy or fcu (MPa) | Es or Ec (GPa) |
|---|---|---|---|
| Concrete | C50 | 59.2 | 34.5 |
| Steel plate | Q345qE | 410 | 206 |
| Gusset plate | Q345qE | 410 | 206 |
| Steel web | Q345qE | 410 | 206 |
| Perforated rebar | HRB335 | 393 | 200 |
| Reinforcement | HRB335 | 393 | 200 |
Table 2.
Major experimental characteristics of pull-out specimens.
| Specimen | Ny (kN) | Nu (kN) | Nu/Ny | Sy (mm) | Su (mm) | Su/Sy |
|---|---|---|---|---|---|---|
| PA1 | 750 | 1150 | 1.53 | 0.5 | 12.13 | 24.26 |
| PA2 | 750 | 1100 | 1.47 | 0.54 | 9.06 | 16.78 |
| PA3 | 750 | 1150 | 1.53 | 0.47 | 10.05 | 21.38 |
| Average | 750 | 1133.33 | 1.51 | 0.5 | 10.41 | 20.81 |
| PB1 | 700 | 900 | 1.29 | 0.45 | 1.24 | 2.76 |
| PB2 | 700 | 1000 | 1.43 | 0.58 | 3.4 | 5.86 |
| PB3 | 650 | 900 | 1.38 | 0.4 | 1.5 | 3.75 |
| Average | 683.33 | 933.33 | 1.37 | 0.48 | 2.05 | 4.12 |
| PC1 | - | 540 | - | - | 1.53 | - |
| PC2 | - | 540 | - | - | 1.31 | - |
| Average | - | 540 | - | - | 1.42 | - |
Ny: the yield load; Nu: the ultimate load; Sy and Su: the slip corresponding to yield and ultimate load, respectively.
© 2019 by the authors. Licensee MDPI, Basel, Switzerland. This article is an open access article distributed under the terms and conditions of the Creative Commons Attribution (CC BY) license (http://creativecommons.org/licenses/by/4.0/).
Share and Cite
MDPI and ACS Style
Tan, Y.; Zhu, B.; Yan, T.; Huang, B.; Wang, X.; Yang, W.; Huang, B. Experimental Study of the Mechanical Behavior of the Steel–Concrete Joints in a Composite Truss Bridge. Appl. Sci. 2019, 9, 854. https://doi.org/10.3390/app9050854
AMA Style
Tan Y, Zhu B, Yan T, Huang B, Wang X, Yang W, Huang B. Experimental Study of the Mechanical Behavior of the Steel–Concrete Joints in a Composite Truss Bridge. Applied Sciences. 2019; 9(5):854. https://doi.org/10.3390/app9050854
Chicago/Turabian StyleTan, Yingliang, Bing Zhu, Tingyi Yan, Biao Huang, Xuewei Wang, Wenwei Yang, and Bo Huang. 2019. "Experimental Study of the Mechanical Behavior of the Steel–Concrete Joints in a Composite Truss Bridge" Applied Sciences 9, no. 5: 854. https://doi.org/10.3390/app9050854
Note that from the first issue of 2016, this journal uses article numbers instead of page numbers. See further details here.