Advanced Design Applied to an Original Multi-Purpose Ventilator Achievable by Additive Manufacturing


Department of Industrial Engineering, Alma Mater Studiorum University of Bologna, Viale Risorgimento, 2, I-40136 Bologna, Italy
*
Author to whom correspondence should be addressed.
Appl. Sci. 2018, 8(12), 2635; https://doi.org/10.3390/app8122635
Submission received: 31 October 2018
/
Revised: 5 December 2018
/
Accepted: 11 December 2018
/
Published: 15 December 2018
(This article belongs to the Section Mechanical Engineering)
Abstract
:Featured Application
After this work, we were able to check—with our own hands—the quality of the finished parts and the tensile strength, fall, and manipulation offered by the fusion of the material through MJF: we can therefore say that this type of process is very interesting in all those cases where it is necessary to prototypes characteristic of definitive and functional pieces and at the same time obtain a production with high numbers. This work aims to demonstrate how the high precision and operational speed of this production system make it suitable for the mass production of functional and finished objects and this can happen in motorcycling, automotive, nautical, aerospace, precision mechanics, etc.
Abstract
Considering the progressively expansive trade world, “time to market” of productions and goods has turned into a key element for business accomplishment. There are diverse practices that antedate design faults and unveil products on the market in minus time. Among the most used methods in the design and explanation of the necessities, quality function deployment (QFD) and design for Six Sigma (DFSS) can be used. In the prototyping stage, it is probable to address the emergent technology of additive manufacturing. Today, 3D printing is employed as a quick prototyping technique. Nevertheless, the tangible task which industry is fronting is the adoption of these machines for large-scale production of components, which is now possible with new HP multi fusion. The goal of this paper is to illustrate the entire product development process taking advantage of the most modern models and technologies for the final realization of a case study that involves the design and prototyping of an innovative multifunctional fan (lamp, aroma diffuser, and fan) through the multi jet fusion of HP. To begin with, issues related to the DFSS, the QFD and their application to identify the fan requirements are explored. Once the requirements have been defined, the modern CAD design systems and the CAE systems for the validation of the case study will be analyzed and applied. Finally, HP’s multi jet fusion methodology and design rules for additive manufacturing will be analyzed in detail, trying to exploit all the positive aspects it offers.
1. Introduction
New product development means new products for the market that have never appeared before. In some cases, these already exist on the market but they are new to the company. A process of product development can also take place in terms of improving products made by the company and on the market, seeking to reduce costs. Generally speaking, innovation can be defined as market-pull innovation (starting from customer needs), technology-push innovation (made by scientific breakthrough) and design driven innovation.
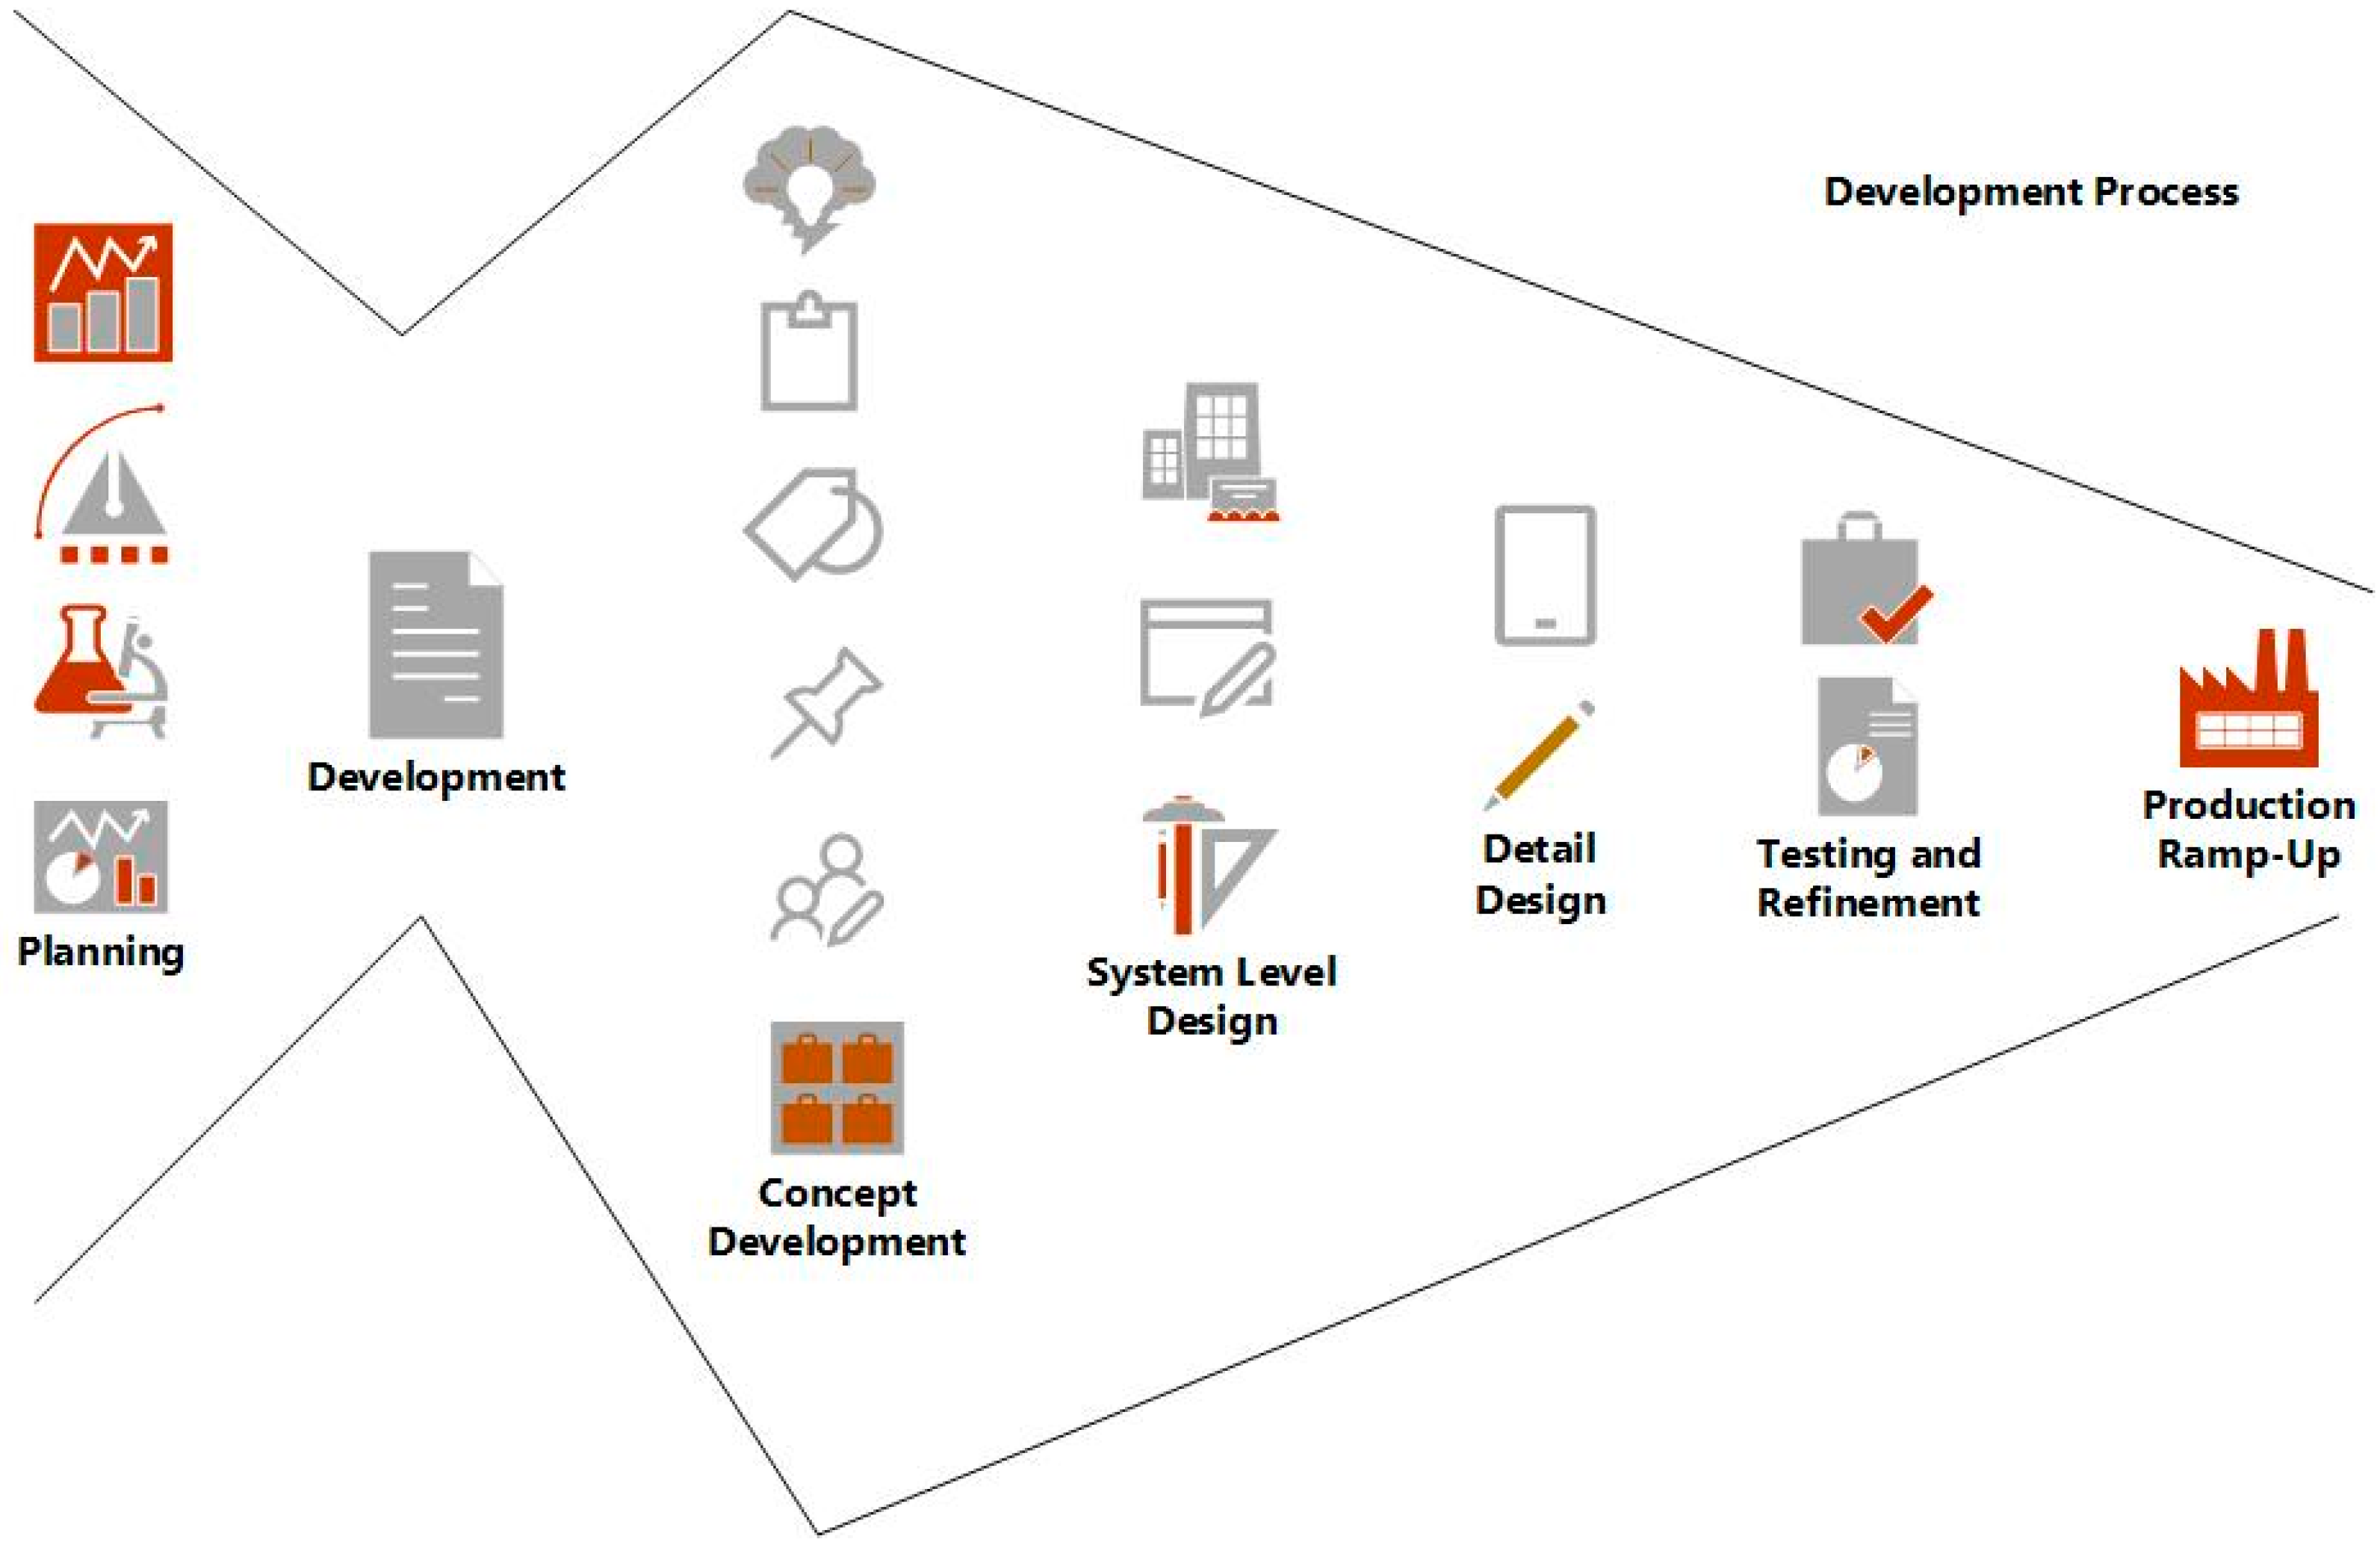
The development and launch of new products in the market is one of the most frequent activities in the business environment and it is always a very risky action to take up. In many sectors, the ability to develop new products quickly and efficiently has become a fundamental and indispensable element for the success of the company. Therefore, the positive outcome of businesses depends on their ability to identify the needs of consumers, to design and manufacture products that meet these targets quickly and at low cost. Reaching these objectives is not just a commercial or design problem: it is closely linked to innovation and product development that involves all the company functions. For these reasons, it is necessary to build and adopt modern models, processes, and technologies to minimize risk and costs. In addition, nowadays businesses are marked by (Figure 1):
- -
- strong product customization
- -
- high production mix
- -
- variability
- -
- high quality
- -
- low time-to-market
- -
- prices
In order to fulfill these goals, businesses implemented different types of resources. For instance:
- -
- flexible manufacturing systems
- -
- product development techniques
- -
- high product modularity
- -
- flexible Automation
- -
- integrated production systems and new technologies
For decades, economists and researchers have been focusing on the entire process of product development. A generic process involves different stages as shown above. The whole process can be compared to a funnel (funnel model) that starts with a variety of ideas and a huge amount of information and ends with one idea in production. The process consists of different stages:
- -
- Planning: Includes assessment of technological developments and market objectives. The result of the planning activity is the declaration of intent (mission statement) of the project. Beta tests, surveys, and crowdsourcing are usually accomplished during this phase.
- -
- Concept Development: A concept is the description of the form, function, and characteristics of a product. It is often accompanied by a set of specifications, an analysis of competitive products and a preliminary economic justification of the project. Techniques such as conjoint analysis, QFD, and design failure mode and effects analysis (DFMEA) are usually used.
- -
- System-Level Design: The layout of the product is the typical output of this stage.
- -
- Detail Design: The result of this phase is the technical documentation with drawings and files that describe the components of the product and its specifications. Powerful tools such as CAD-CAM systems and CAE techniques are involved at this stage.
- -
- Testing and Refinement: The initial prototypes are made by different processes, such as the technology of additive manufacturing, that will be discussed in the article.
- -
- Production and Ramp-Up: the final stage is where costs rise up. It also contains the take-off phase and the timing of the product launch, essential for the final success. In the ramp-up phase, the product is built using the planned production system. This last phase is indispensable to reduce the barriers that hinder or delay the adoption of innovation. Empirical evidence highlights a first phase of ramp-up of slow growth and finally a take-off phase with an increase in sales.
However, the main focus of this article is to discuss and present all modern techniques and technologies that support product development. As a matter of fact, in today’s global market, competition for products and services has never been so intense. Consumers have more choices for many similar products. Many manufacturing companies are continually striving for completely new products or entering new markets. Sometimes, the products meet the needs and expectations of consumers and sometimes not. Multiple redesign of a product is expensive. It would be much more beneficial if the product met the expectations of customers with a higher level of quality. It is necessary to understand what is really of value for the market and for this reason the article will focus on several techniques that anticipate design mistakes and reduced total costs of development. Many techniques and models—such as design for Six Sigma, CAD-CAM software, and additive manufacturing techniques—will be applied to a case study of a multifunctional fan, discussing all the advantages and disadvantages. To begin with, a series of techniques to support the design and development of new products will be introduced, starting from the DFSS which contains within it the most well-known techniques such as the QFD, CAD-CAM systems [1].
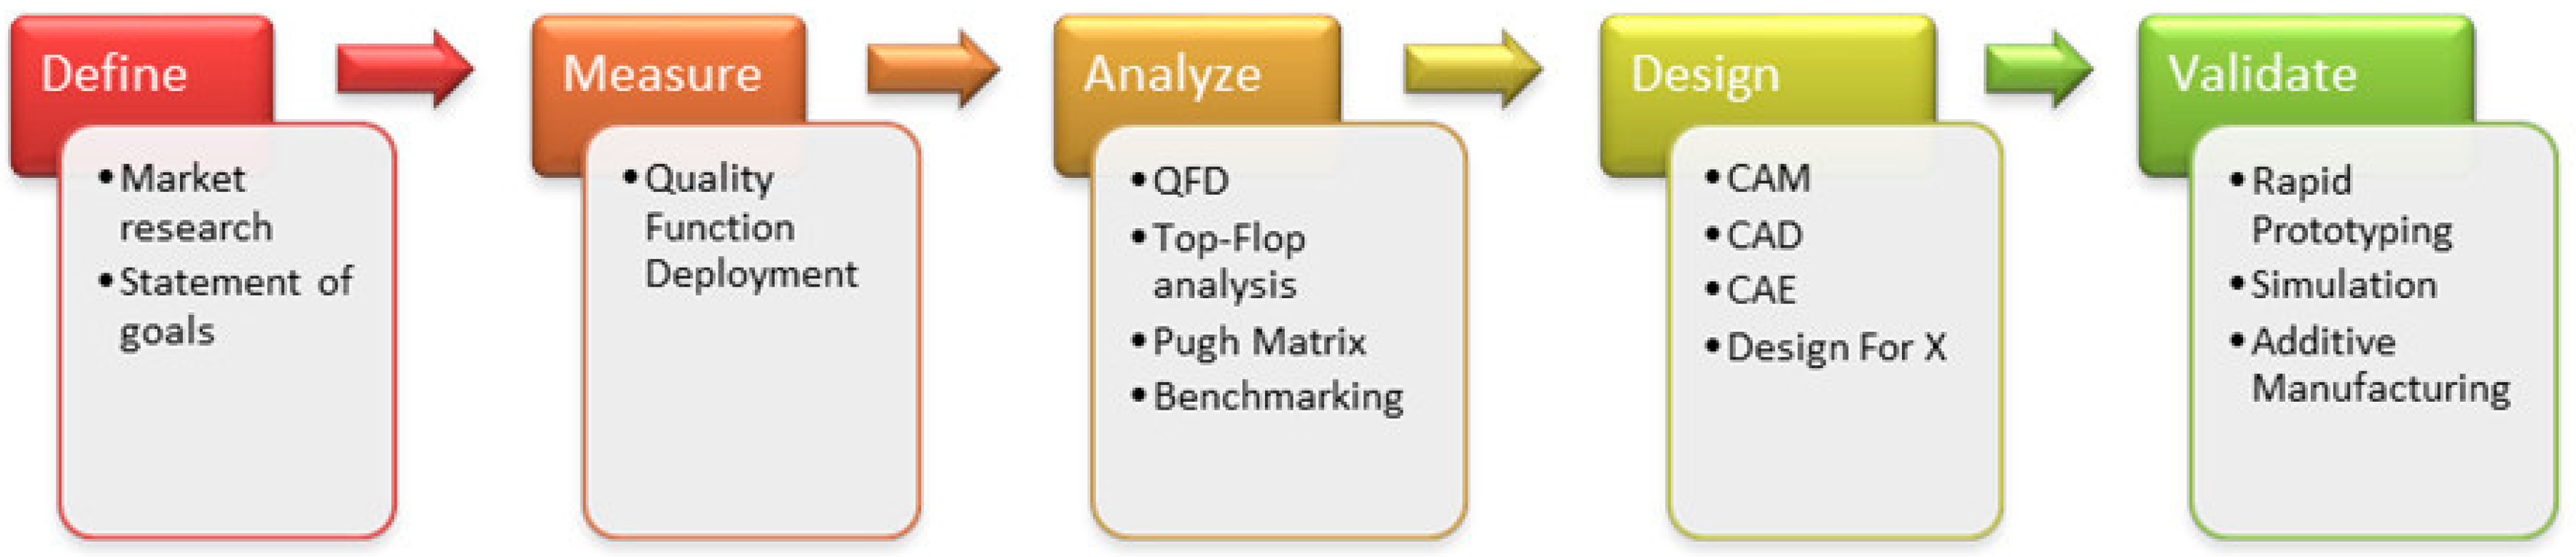
2. Design for Six Sigma (DFSS)
Design for Six Sigma (DFSS) is an alternative approach to developing new products or processes as it incorporates multiple methodologies that can be used. Design for Six Sigma aims to better meet customer demands and expectations by minimizing defects and contradictions found in products on the market and by focusing on the full understanding of customer needs, so as to obtain a new one that is more satisfying and innovative.
Considering the application of the procedure it is possible to distinguish between different approaches (Figure 2):
- -
- DMADV; Define, measure, analyze, design, and validate.
- -
- CDDOV; Concept, define, design, optimization, and verification phases.
- -
- CDOV; Concept, design, optimize, and verify.
With DFSS, the goal is to design products and processes by minimizing defects and root changes. It involves practices such as Triz, Design for X, QFD, Taguci, computer-aided design. The basic activities that are carried out in a design for Six Sigma approach are the following: definition and investigation of customer requests and needs, analysis and classification of such requests, transformation of customer requests into engineering information, development of a design, validation of performances, and implementation of processes strongly linked to the objective that needs to be achieved. The DFSS team must be cross-functional to ensure that all aspects of the product are taken into account, from the market research to the design phase, process implementation, and product launch. The following paragraphs will discuss in detail the DMADV phases and techniques and technologies like QFD and additive manufacturing applied to the case study.
3. Define, Measure, Analyze: Statement of Goals, Market Research, and QFD
During these phases, we collect information on what are the requests and needs of the customer and a detailed assessment is required. It is compulsory to understand what the customer really needs and what are its expectation. Moreover, it is essential to define the product and its functions. For this purpose, it is now required the development of the quality function deployment (QFD) [2]. The latter consists of [3]:
- -
- Documentation of the environment by six questions: Who, What, Where, When, How, Why.
- -
- Organization of a summary of customer needs.
- -
- Assessment of need’s importance.
- -
- Technical response to customer’s needs.
Basically, the QFD, conceived in Japan between 1960 and 1970, is a methodology based on the definition of the client requirement that may be implicit or explicitly stated. The customer’s voice can be acquired through discussions, surveys, and market studies. A market survey had been carried out for the case study. Generally speaking, QFD is considered a tool for product development that systematically translates VOC (voice of customer) into guidelines for the design and production process. The QFD consists in the compilation of a series of matrices that translate customers’ needs into design requirement. The customer is the first priority of the company, so one needs to understand exactly what he wants. In the next subsection, QFD will be applied practically and numerically to the case study.
3.1. Environment Documentation by Six Questions
For QFD, the following six questions are asked in the design process (Table 1).
- -
- What?—The Innovation consists in compressing different functionalities into a single object. As a matter of fact, the fan provides air recirculation in closed environments, it will have the function of a lamp to allow the visibility of a keyboard or to read a book. Furthermore, it will contain thermal resistances to allow heating. Finally, it could also contain a nebulizer or an aroma diffuser.
- -
- Who?—The Innovative fan will be mainly for people who work in the office, students or simply for people who need a multifunctional object. The market research itself will target a segment of the market that includes these categories and it is mainly addressed to an age group of less than 50 years.
- -
- Where?—The fan can be used in the office, on desks, in rooms, in the living room (as a furnishing object), and in all closed spaces.
- -
- When?—Thanks to the thermal resistance, the fan can be used during the whole calendar year. Furthermore, it can also be used exclusively as a lamp or as an aroma diffuser.
- -
- Why?—It will be used to refresh, illuminate, warm up, and perfume interiors.
- -
- How?—The fan will use a DC motor powered by a transformer. The lighting will be guaranteed by a led strip and the heating function by thermal resistances.
3.2. Organization of a Summary of Customer Needs
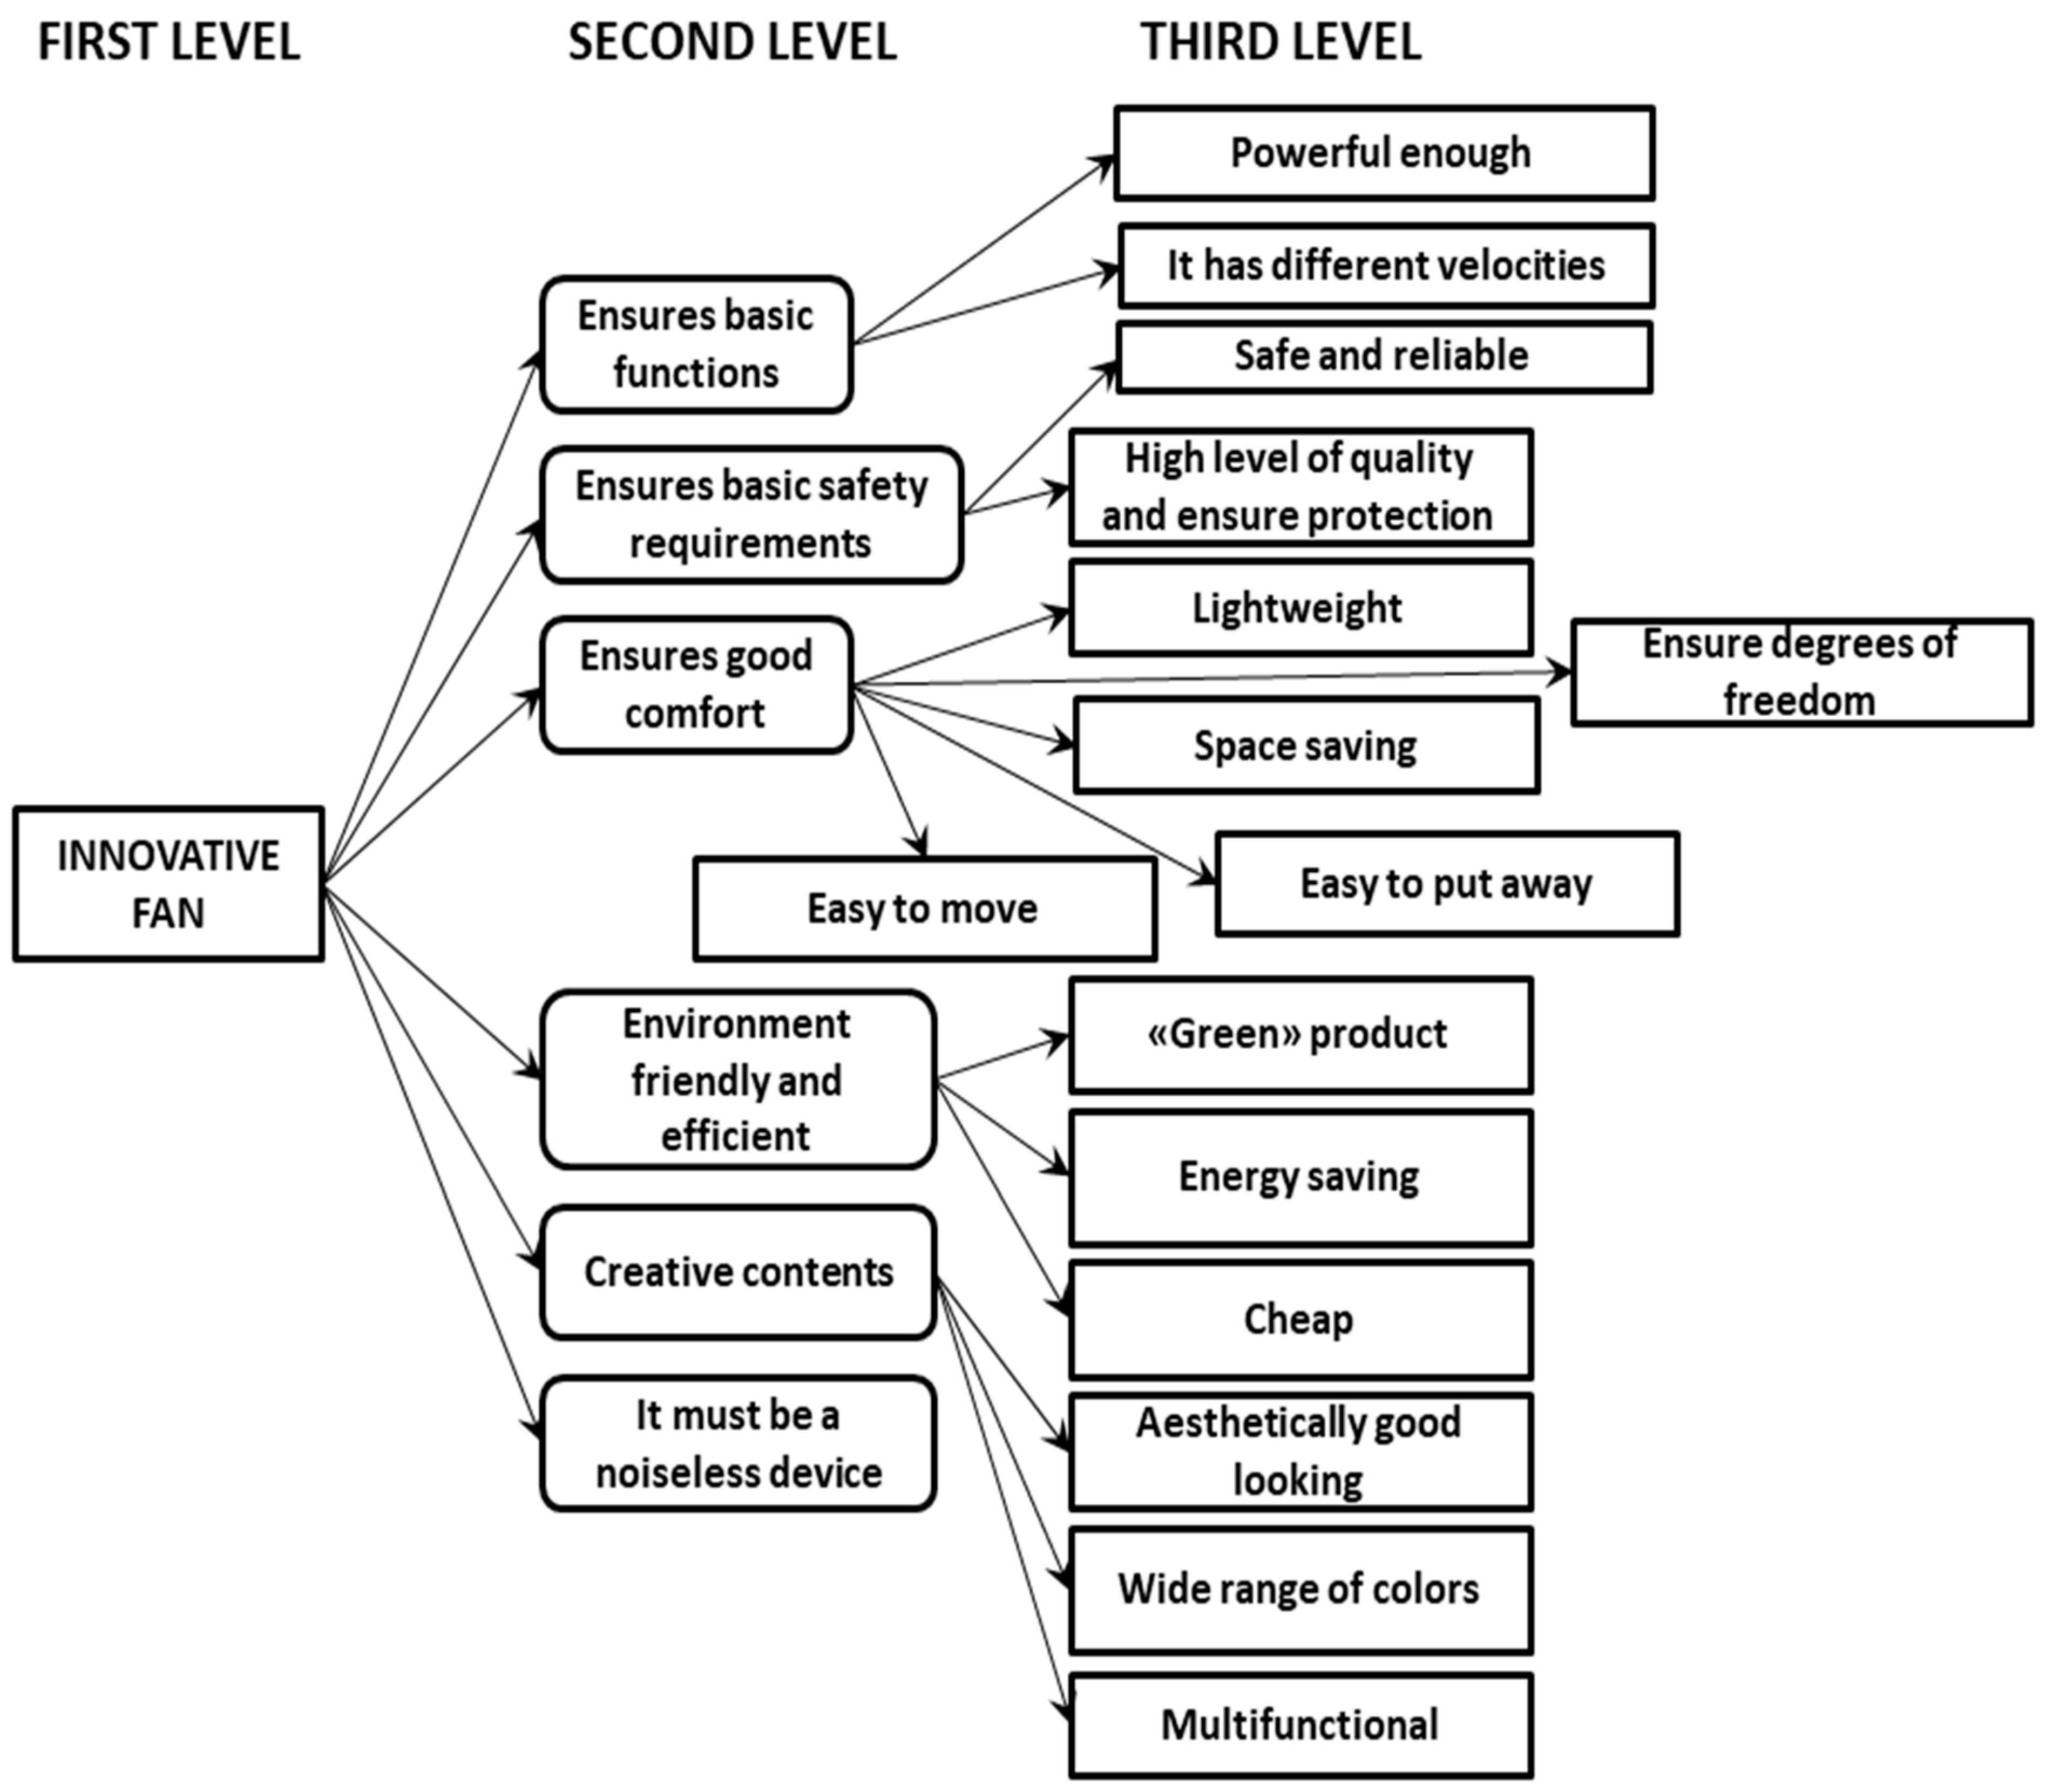
In order to identify customer needs, a tree diagram can be used which is a hierarchical structure of ideas. Tree diagrams are top-down methods. It is simply based on an intuitive decomposition of the various needs or technical requirements. Normally, it is identified by:
- -
- Primary levels (the most abstract that measure the level of completeness and total correctness).
- -
- Secondary levels.
- -
- Tertiary levels.
Overall, the highest levels are used to explain the lower levels. The working group chooses a starting level to carry out its own analyzes. Figure 3 shows the tree diagram of the innovative fan.
3.3. Assessment of Customer Needs Importance: Statistical Analysis
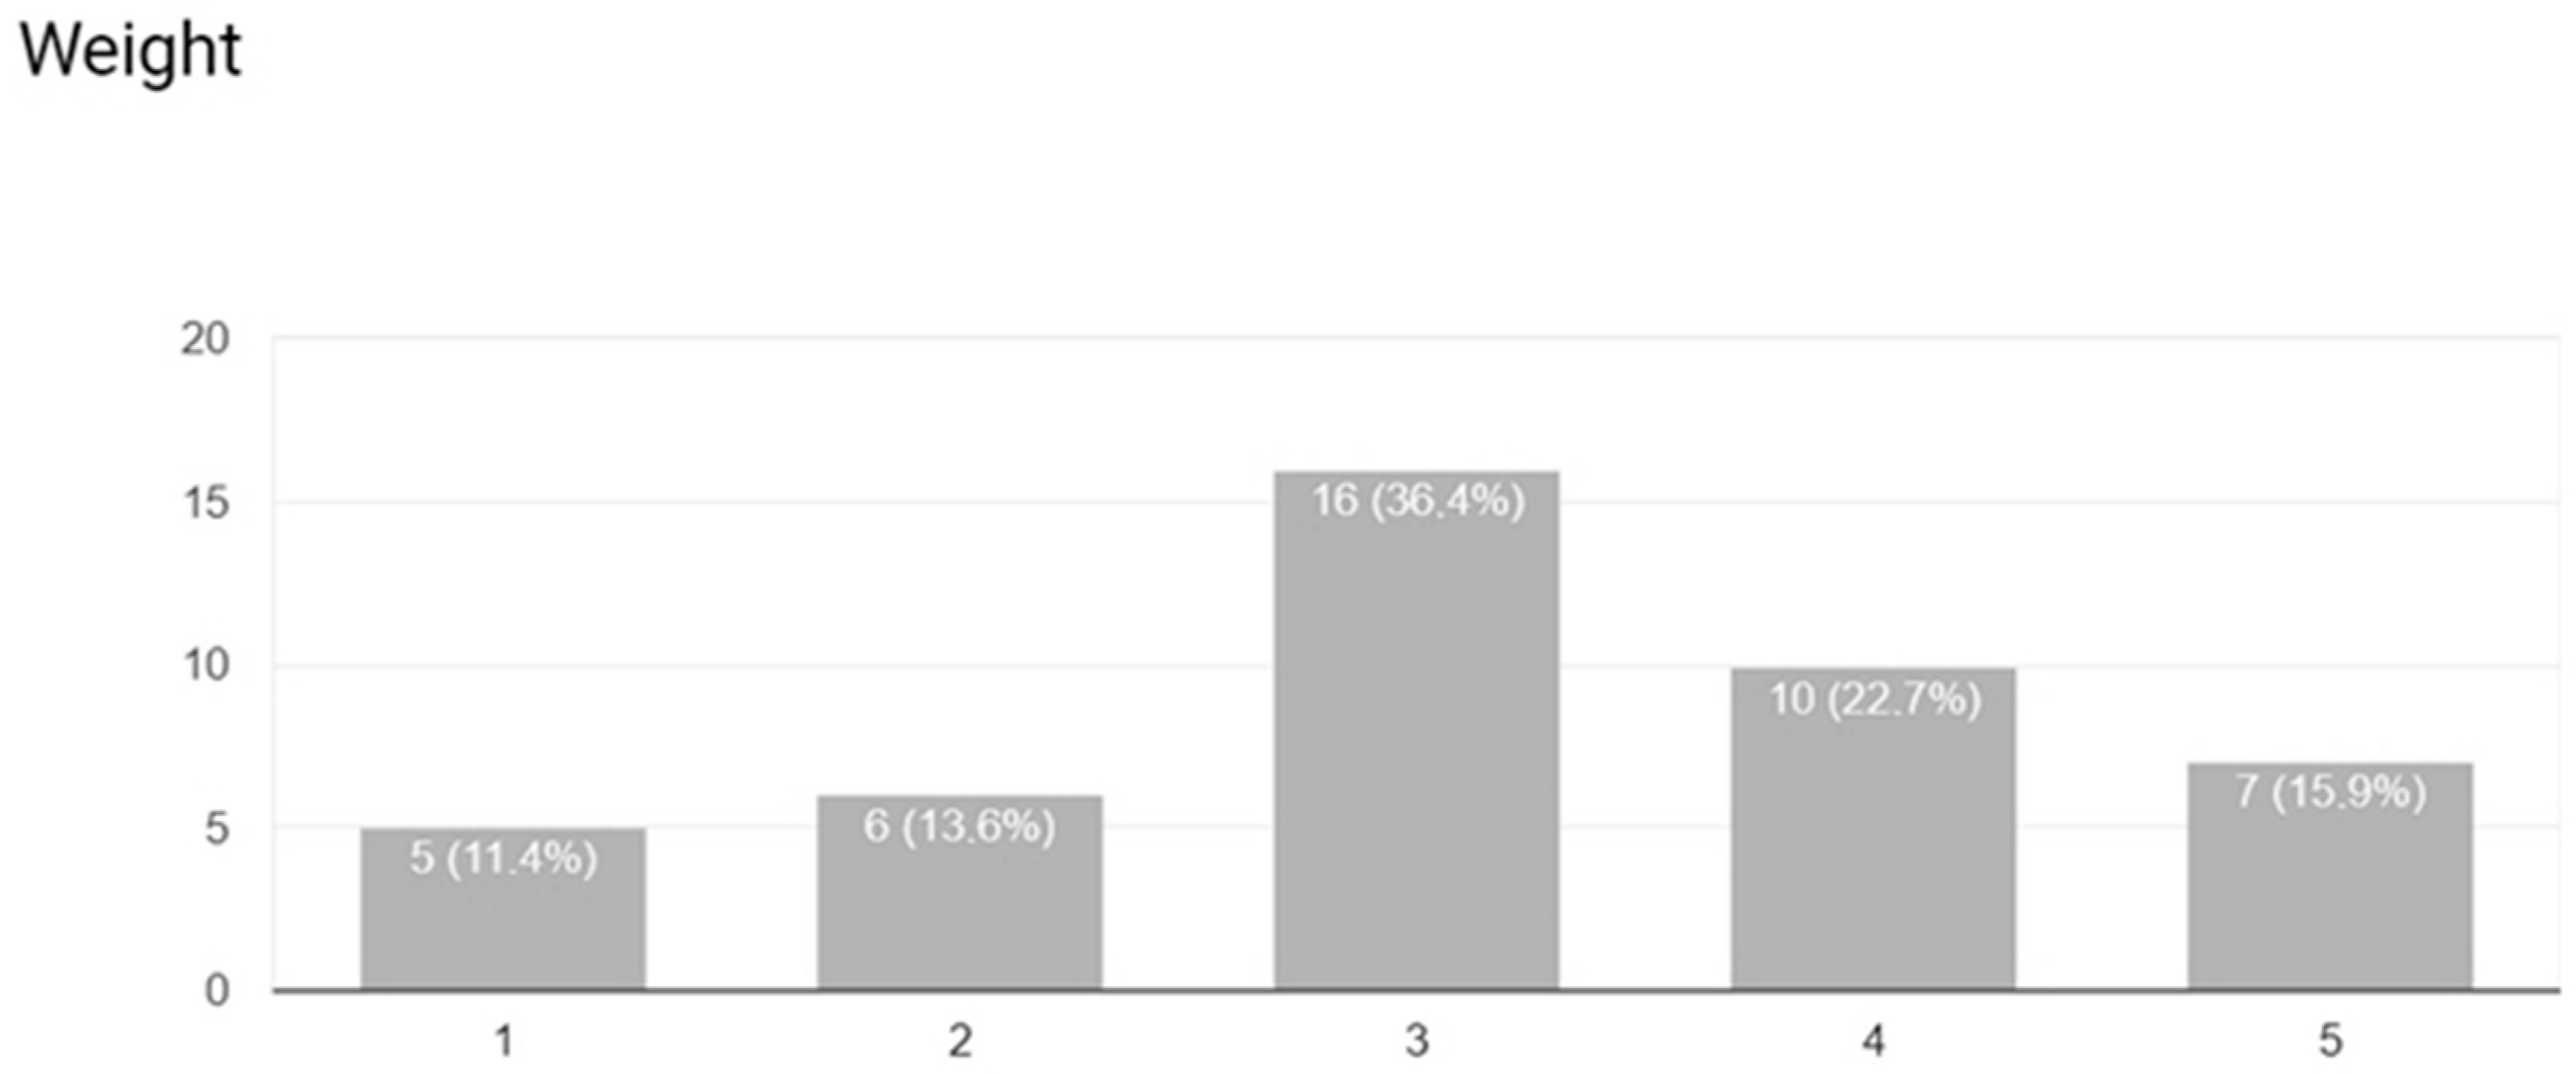
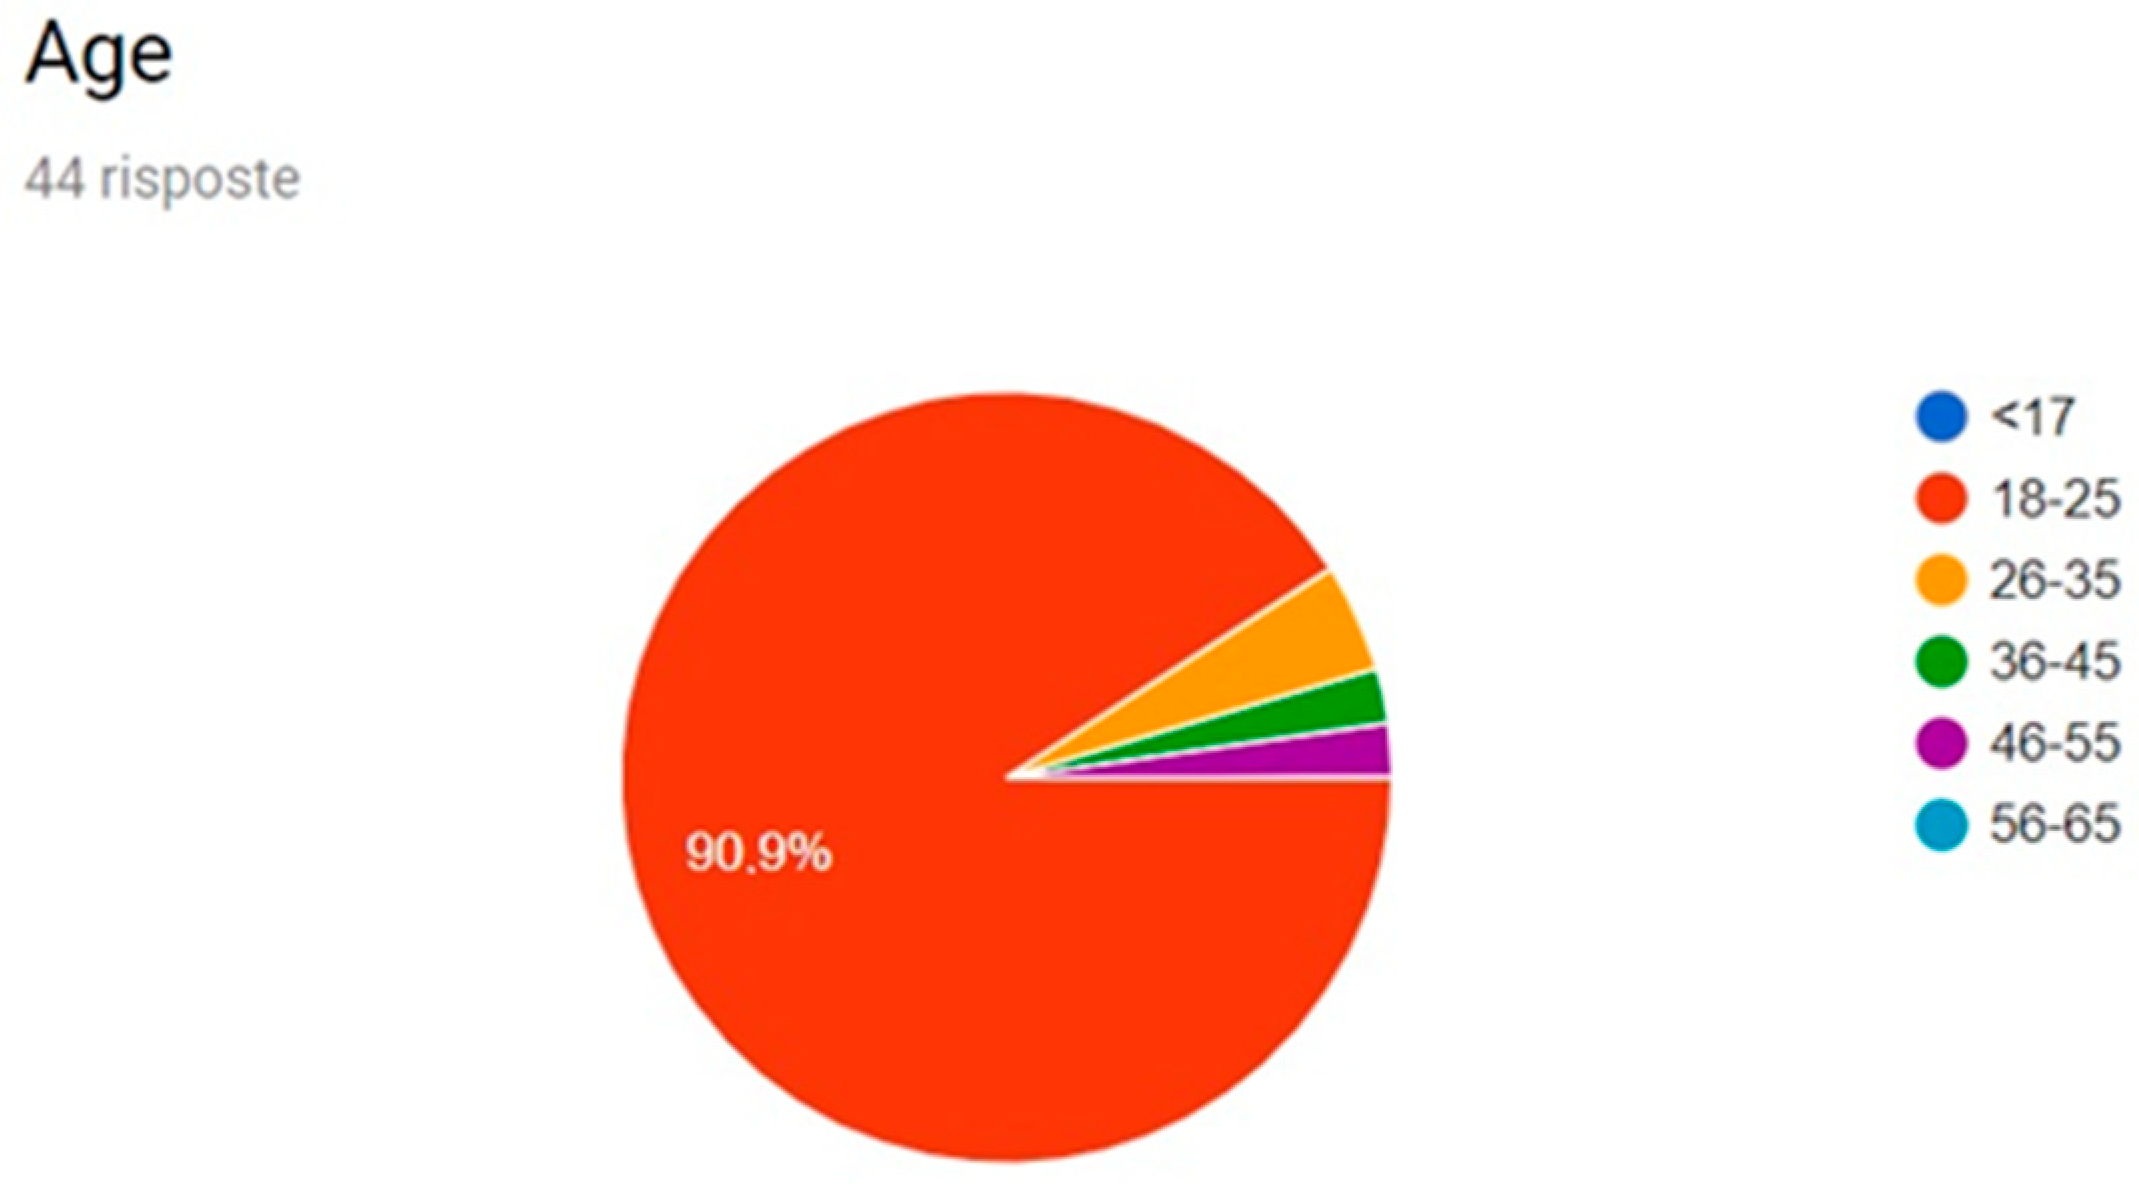
Starting from the last level of the tree diagram, it is necessary to understand how these features are important. In order to discover customer needs and how much they are important, a market research has been carried out: an online questionnaire was given to a sample of 44 people, 22 woman, and 22 men.
Specifically, the ‘Google Drive’ platform was used to provide pre-filled survey forms. In the questionnaire, the planned product was introduced to the customer and general questions were submitted. Finally, some questions concerning both the interest in the purchase and the importance of some product features were asked. The questionnaire is based on the Likert scale [1,2,3,4,5] where:
- -
- 1 = not important
- -
- 5 = very important
The customer was asked to express his preference to characteristics regarding the innovative fan, for example weight, cost, reliability, quality, number of colors available. Data had been collected in a excel worksheet and then analyzed. Figure 4 illustrates the distribution of preferences for the weight collected from the survey.
In addition, data regarding the customer had been collected to understand who the buyer is. Surely, market segmentation and the knowledge of the customer are extremely useful to design properly the product and to develop specific features dedicated to the market segment. Figure 5 shows an example of data collected regarding the possible future client age of the innovative fan. It is easy to understand that students between 18 and 25 years old are chosen. Therefore, the product has to be cheap and compact to meet student needs.
Once data are collected through the survey, it is essential to organize and structure them according to their importance. Therefore, data are organized into tables and frequencies, expected value and variance are calculated. Table 2 shows the preferences expressed by the sample of 44 people. Beginning from these, relative frequencies are calculated as a percentage. The calculation of the relative frequencies is based on the formula
In addition to the relative frequency, the average value is also calculated for each design variable to establish the order of importance. The formulas for the calculation of the mean and variance are
where Fr = relative frequency, xi = values of the Likert scale [1,2,3,4,5], j = design variable (Table 2).
Once data have been analyzed, it is now required to understand how this requirements affect eachother and how important they are. For this reason, the interrelation matrix is used. One possible use of the interrelation matrix is the evaluation of the relative importance between the variables. Also, in this case, we insert the needs in a matrix [N × N, N = variable] and assign the following values (Table 3):
- 0 = if the row element has less importance than the column element
- 1 = if the row element has the same importance as the column element
- 2 = if the row element is of greater importance than the column element
Needs can be easily highlighted such as:
- -
- lack of noise
- -
- quality
- -
- cost
- -
- design
- -
- multi-functionality
- -
- energy efficiency
These aspects were found to be the most important as they are the most appreciated by the sample interviewed. This means that in the design phase, these variables must be considered in larger parts. This last table is the official matrix that will be included in the QFD in the section dedicated to the needs (VOC) and the relative importations are normalized on a 1–10 scale.
3.4. Technical Response to Customers’ Needs
At this stage, the project group meets, translates and deploys every customer need in one or more technical performance measures or functions performed by the product. For each need, one or more technical performances are identified. Needs are established starting from the tree diagram previously built. To be well defined, each performance measurement should be characterized in the following ways:
- -
- The unit of measure (the metric) must be defined
- -
- The direction of goodness must be defined (more the better, less the better, target is best)
- -
- Avoid excessive details
- -
- For each feature find target value
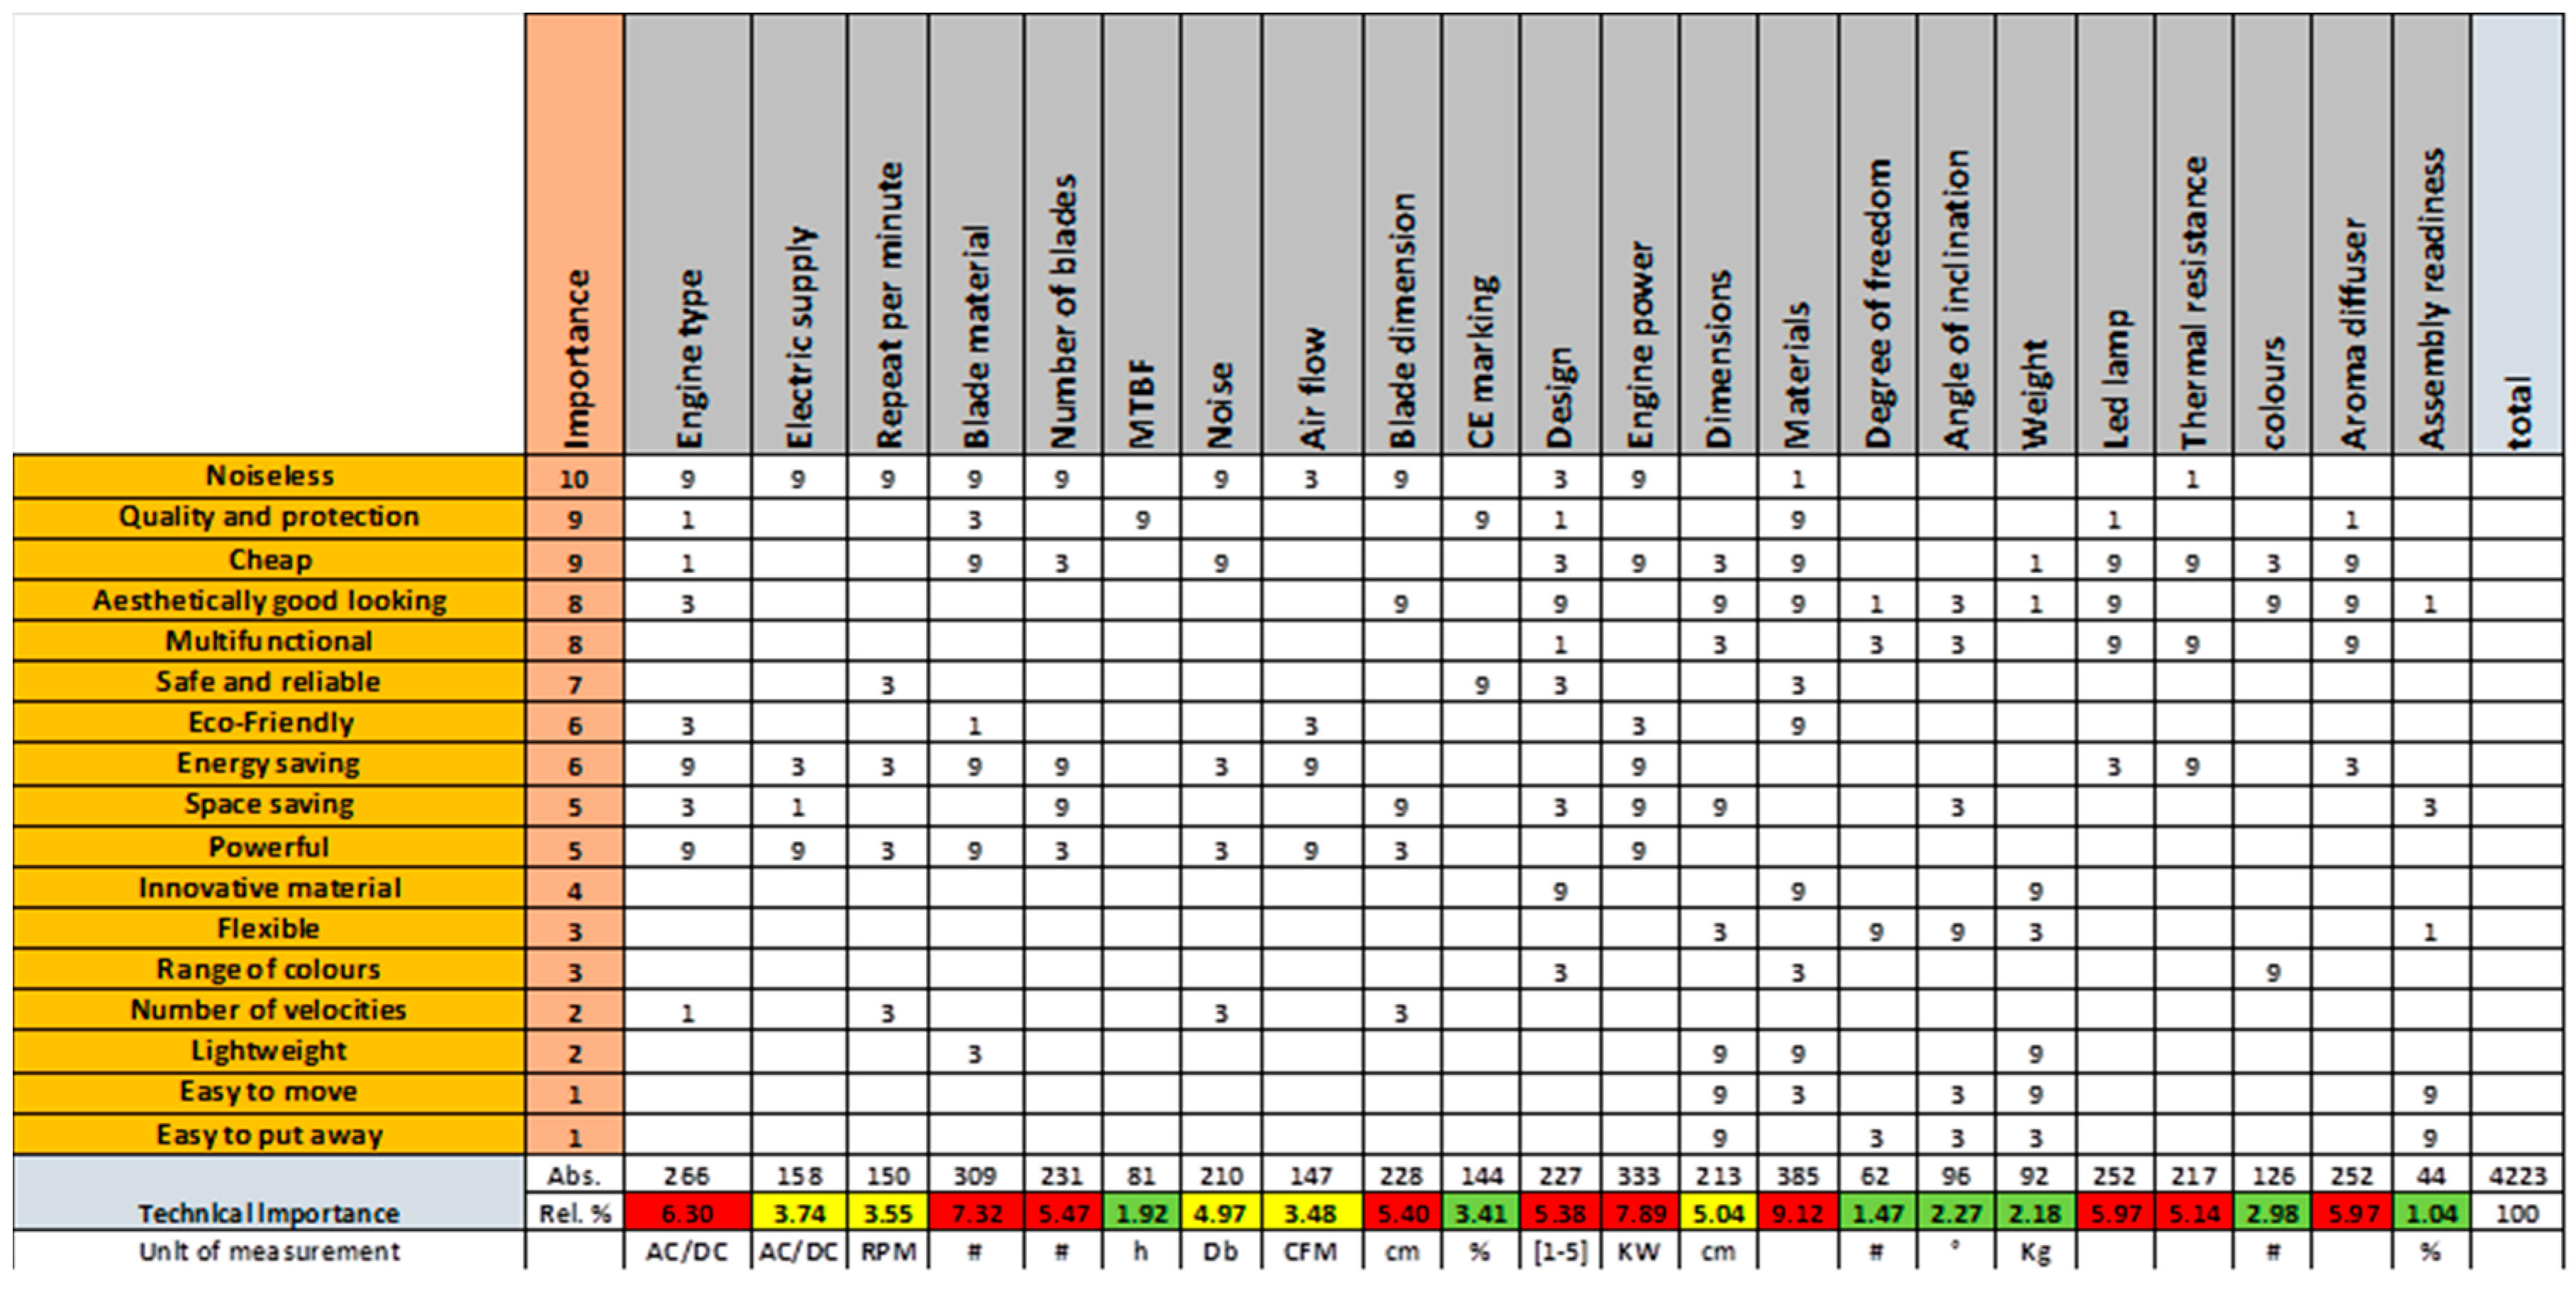
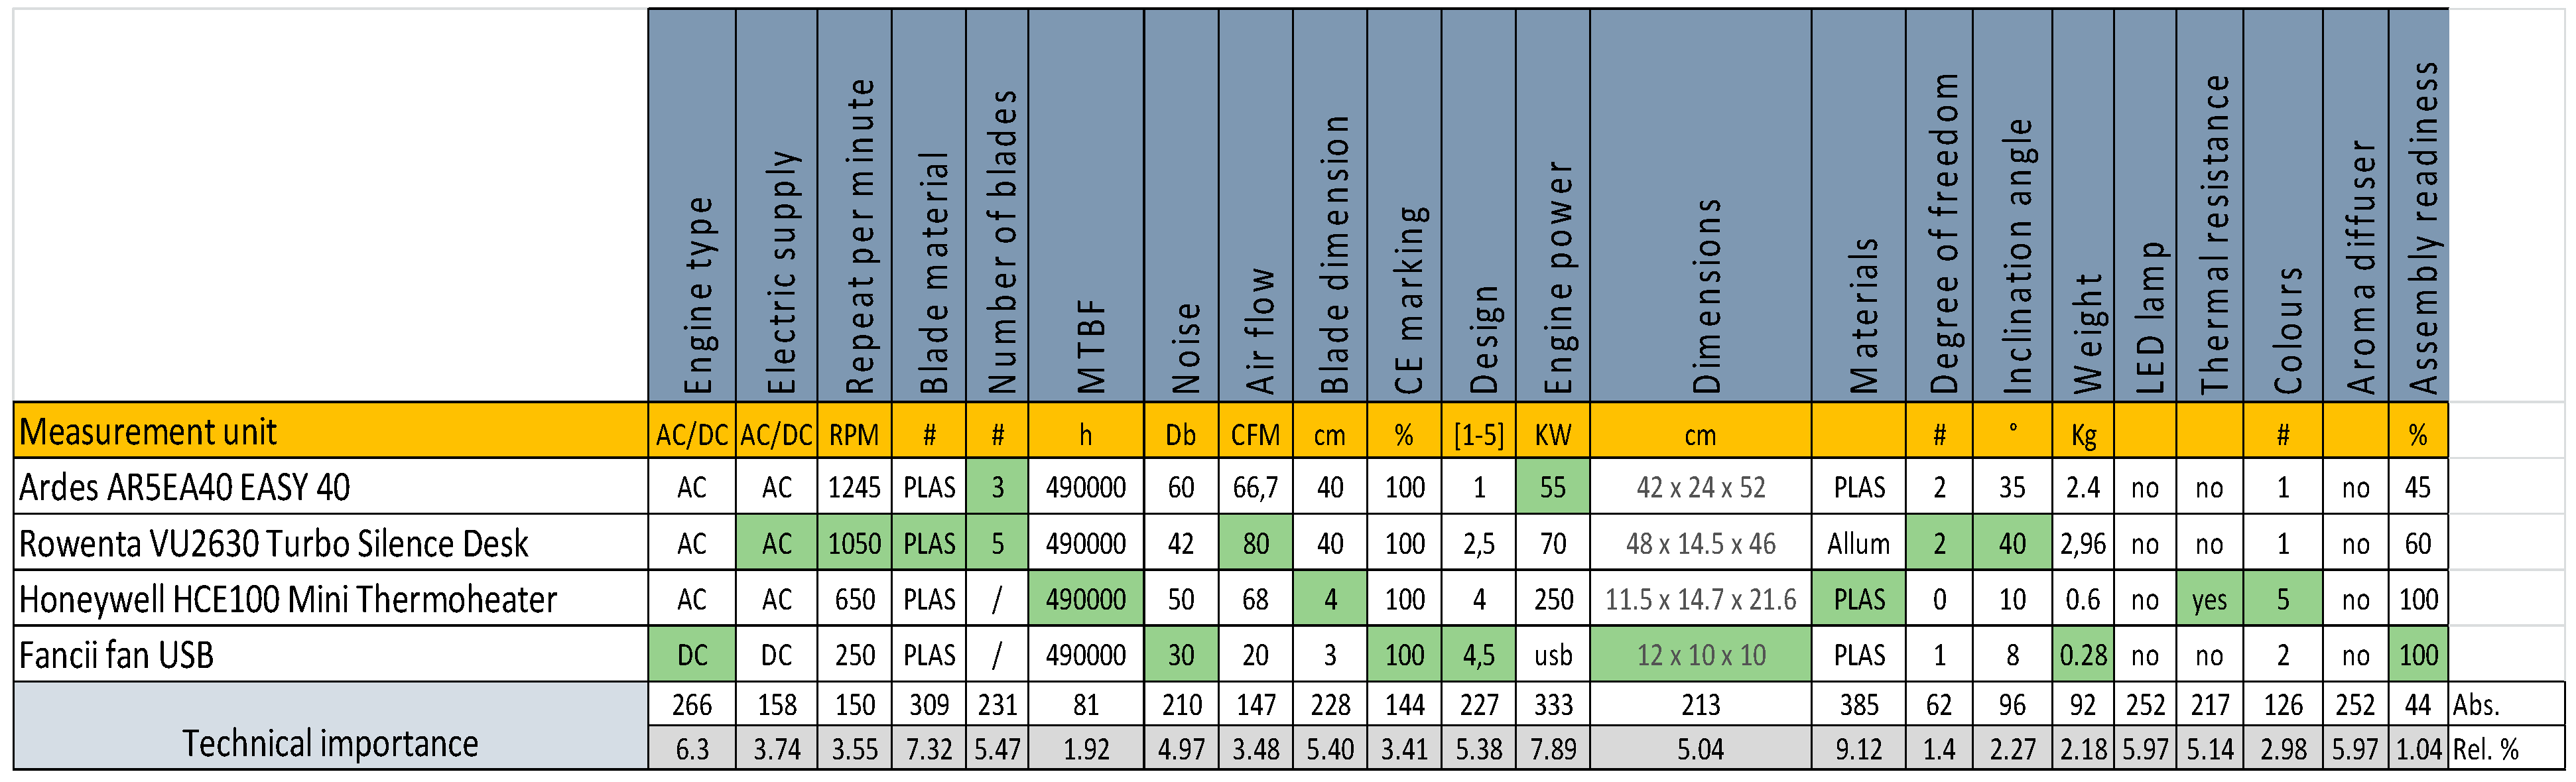
Table 4 depicts a series of technical parameters that deploys customer needs of the case study.
3.5. Relationship Matrix
It is necessary at this point to relate the technical answers to the needs of the client through the ‘relationship matrix’. ‘Voice of designer’ is placed on the columns while ‘voice of customer’ is identified on the rows. The procedure for its drafting is as follows:
- -
- the matrix is prepared by listing the VODs on the columns and the VOCs on the rows
- -
- Numerical report evaluations are assigned to:
- No relationship = empty box, meaning that every change of the VOD does not lead to an appreciable change in customer satisfaction.
- Weak relationship = value 1, A broad change in the VOD leads to a slight change in satisfaction.
- Medium relationship = value 3, a large change in the VOD leads to an appreciable change in customer satisfaction.
- Strong relationship = value 9, even a small change in the VOD leads to a wide change in customer satisfaction. These numeric values indicate how technical requirements help meet line requirements.
- -
- The weighted sums by columns/rows of the assigned values are made, assuming the importance parameter as weight.
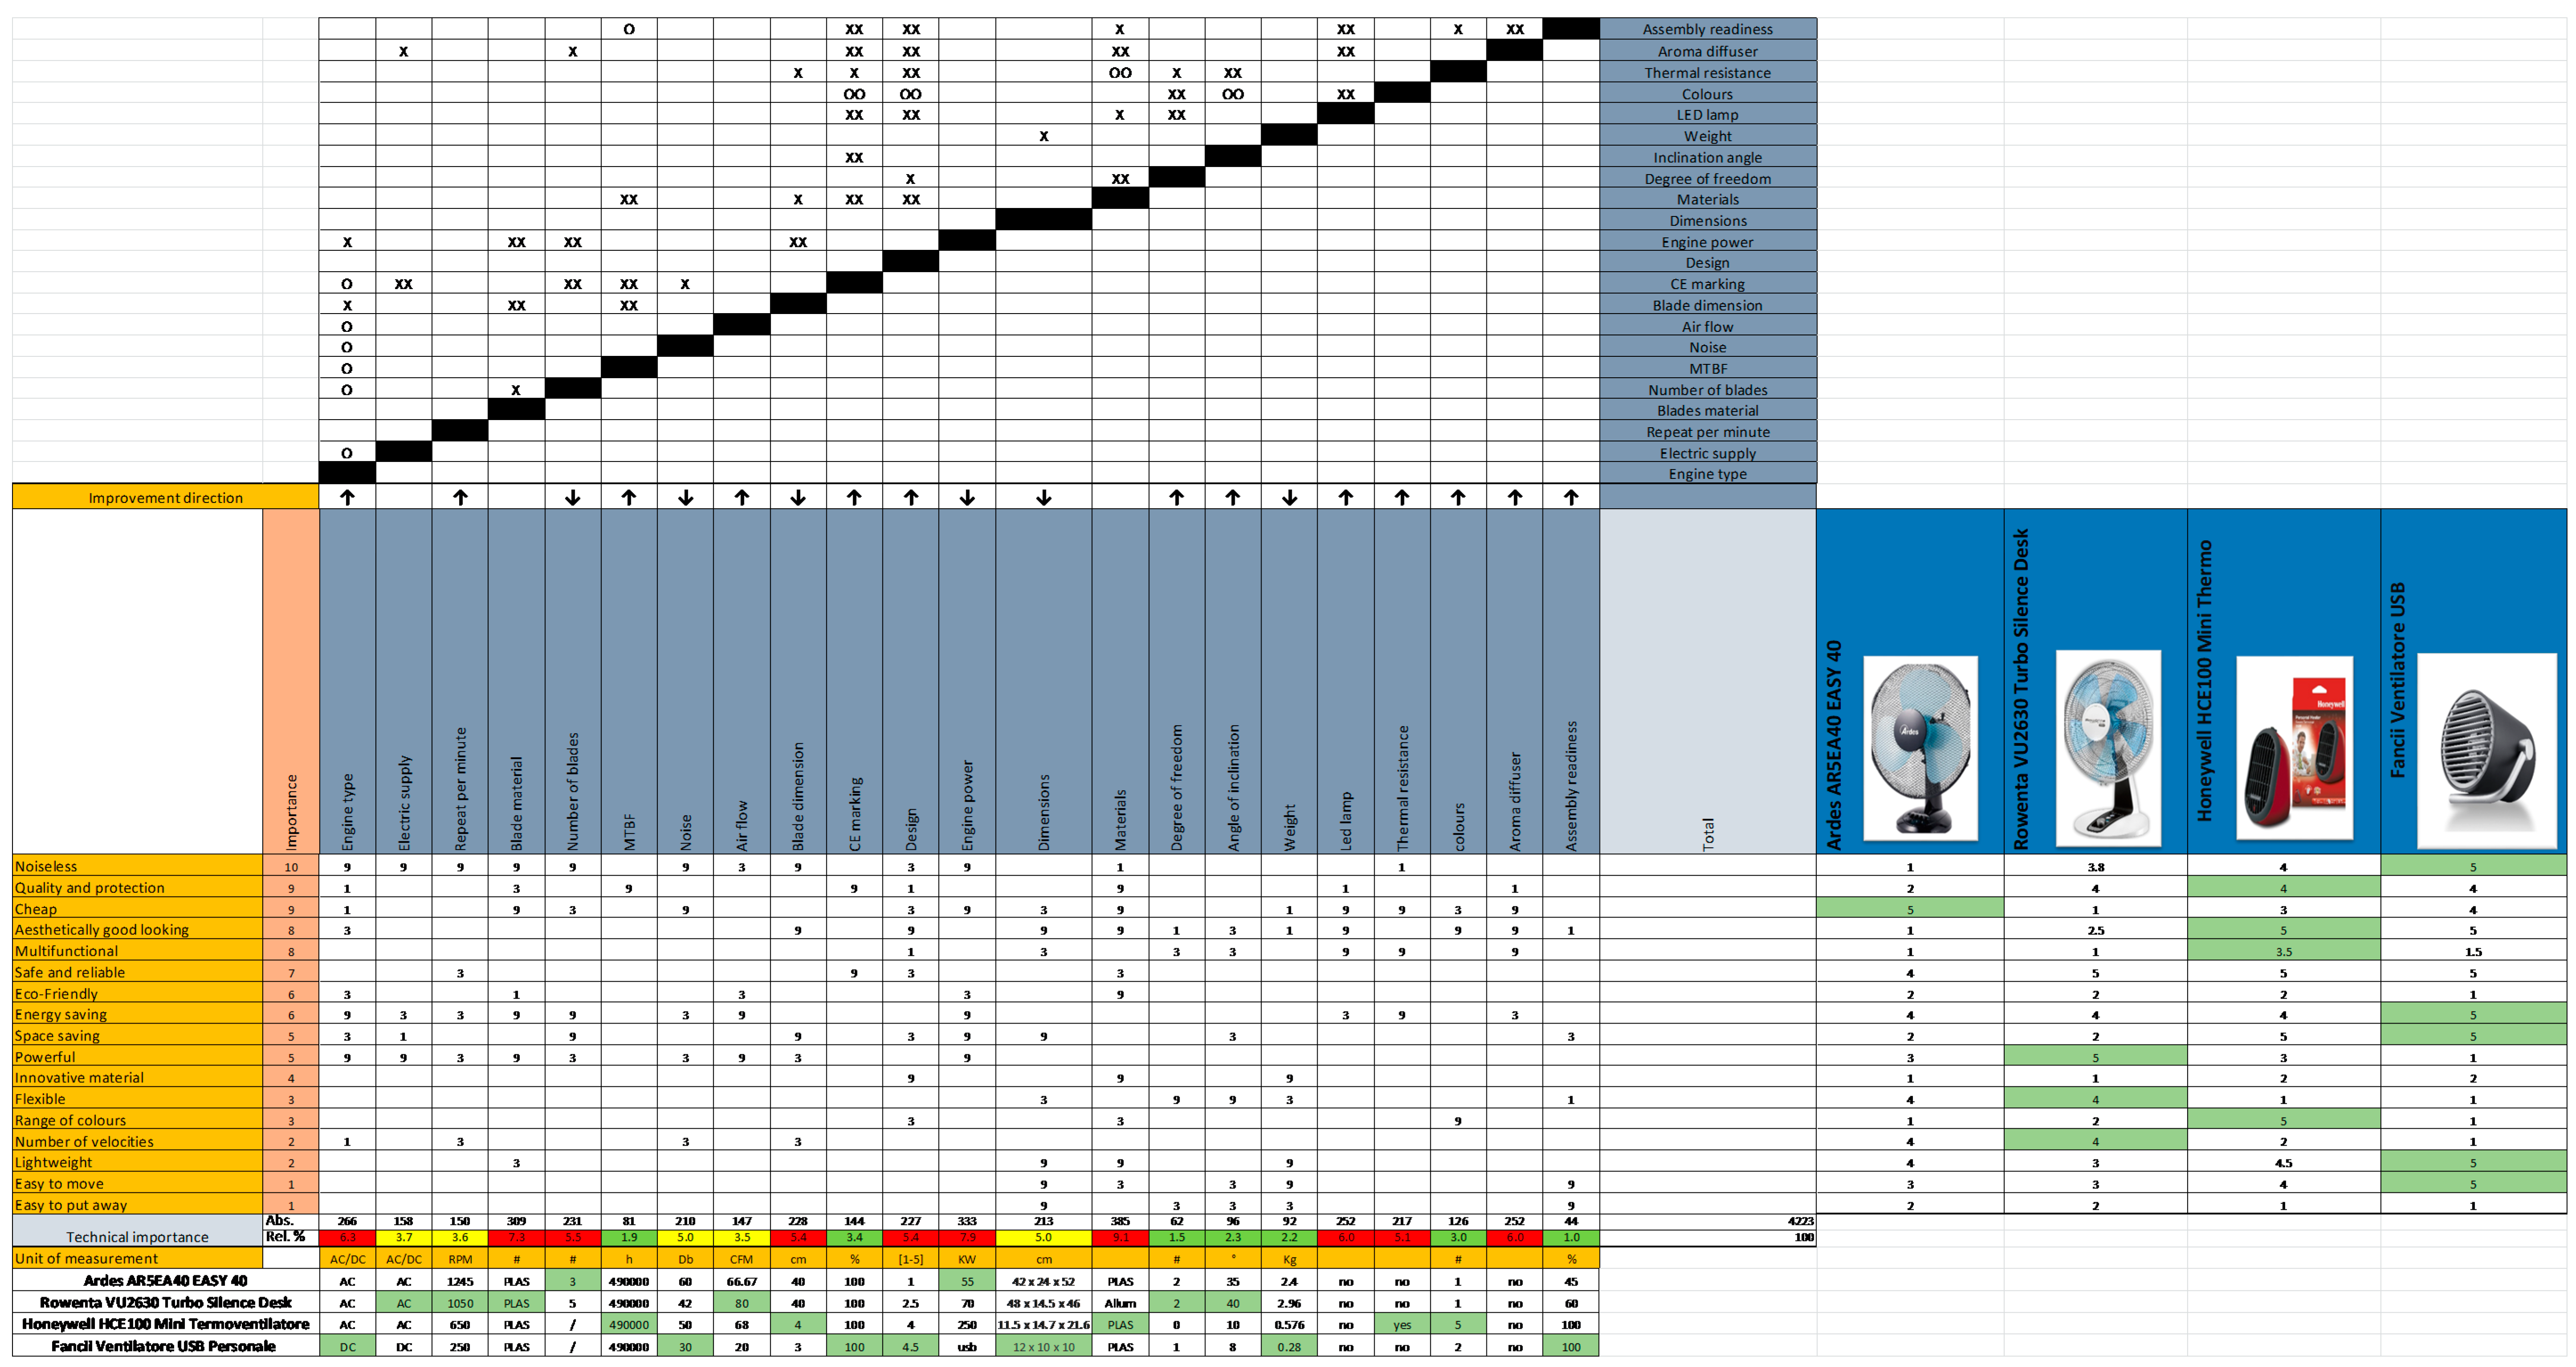
Precisely, in this passage lies one of the most peculiar characteristics of the QFD: it highlights the multiple impacts. Through a production that sums the individual products in each column (absolute weight needs × impact), we will obtain the ranking of importance of the individual characteristics. Next table shows the relationship matrix of the fan (Figure 6).
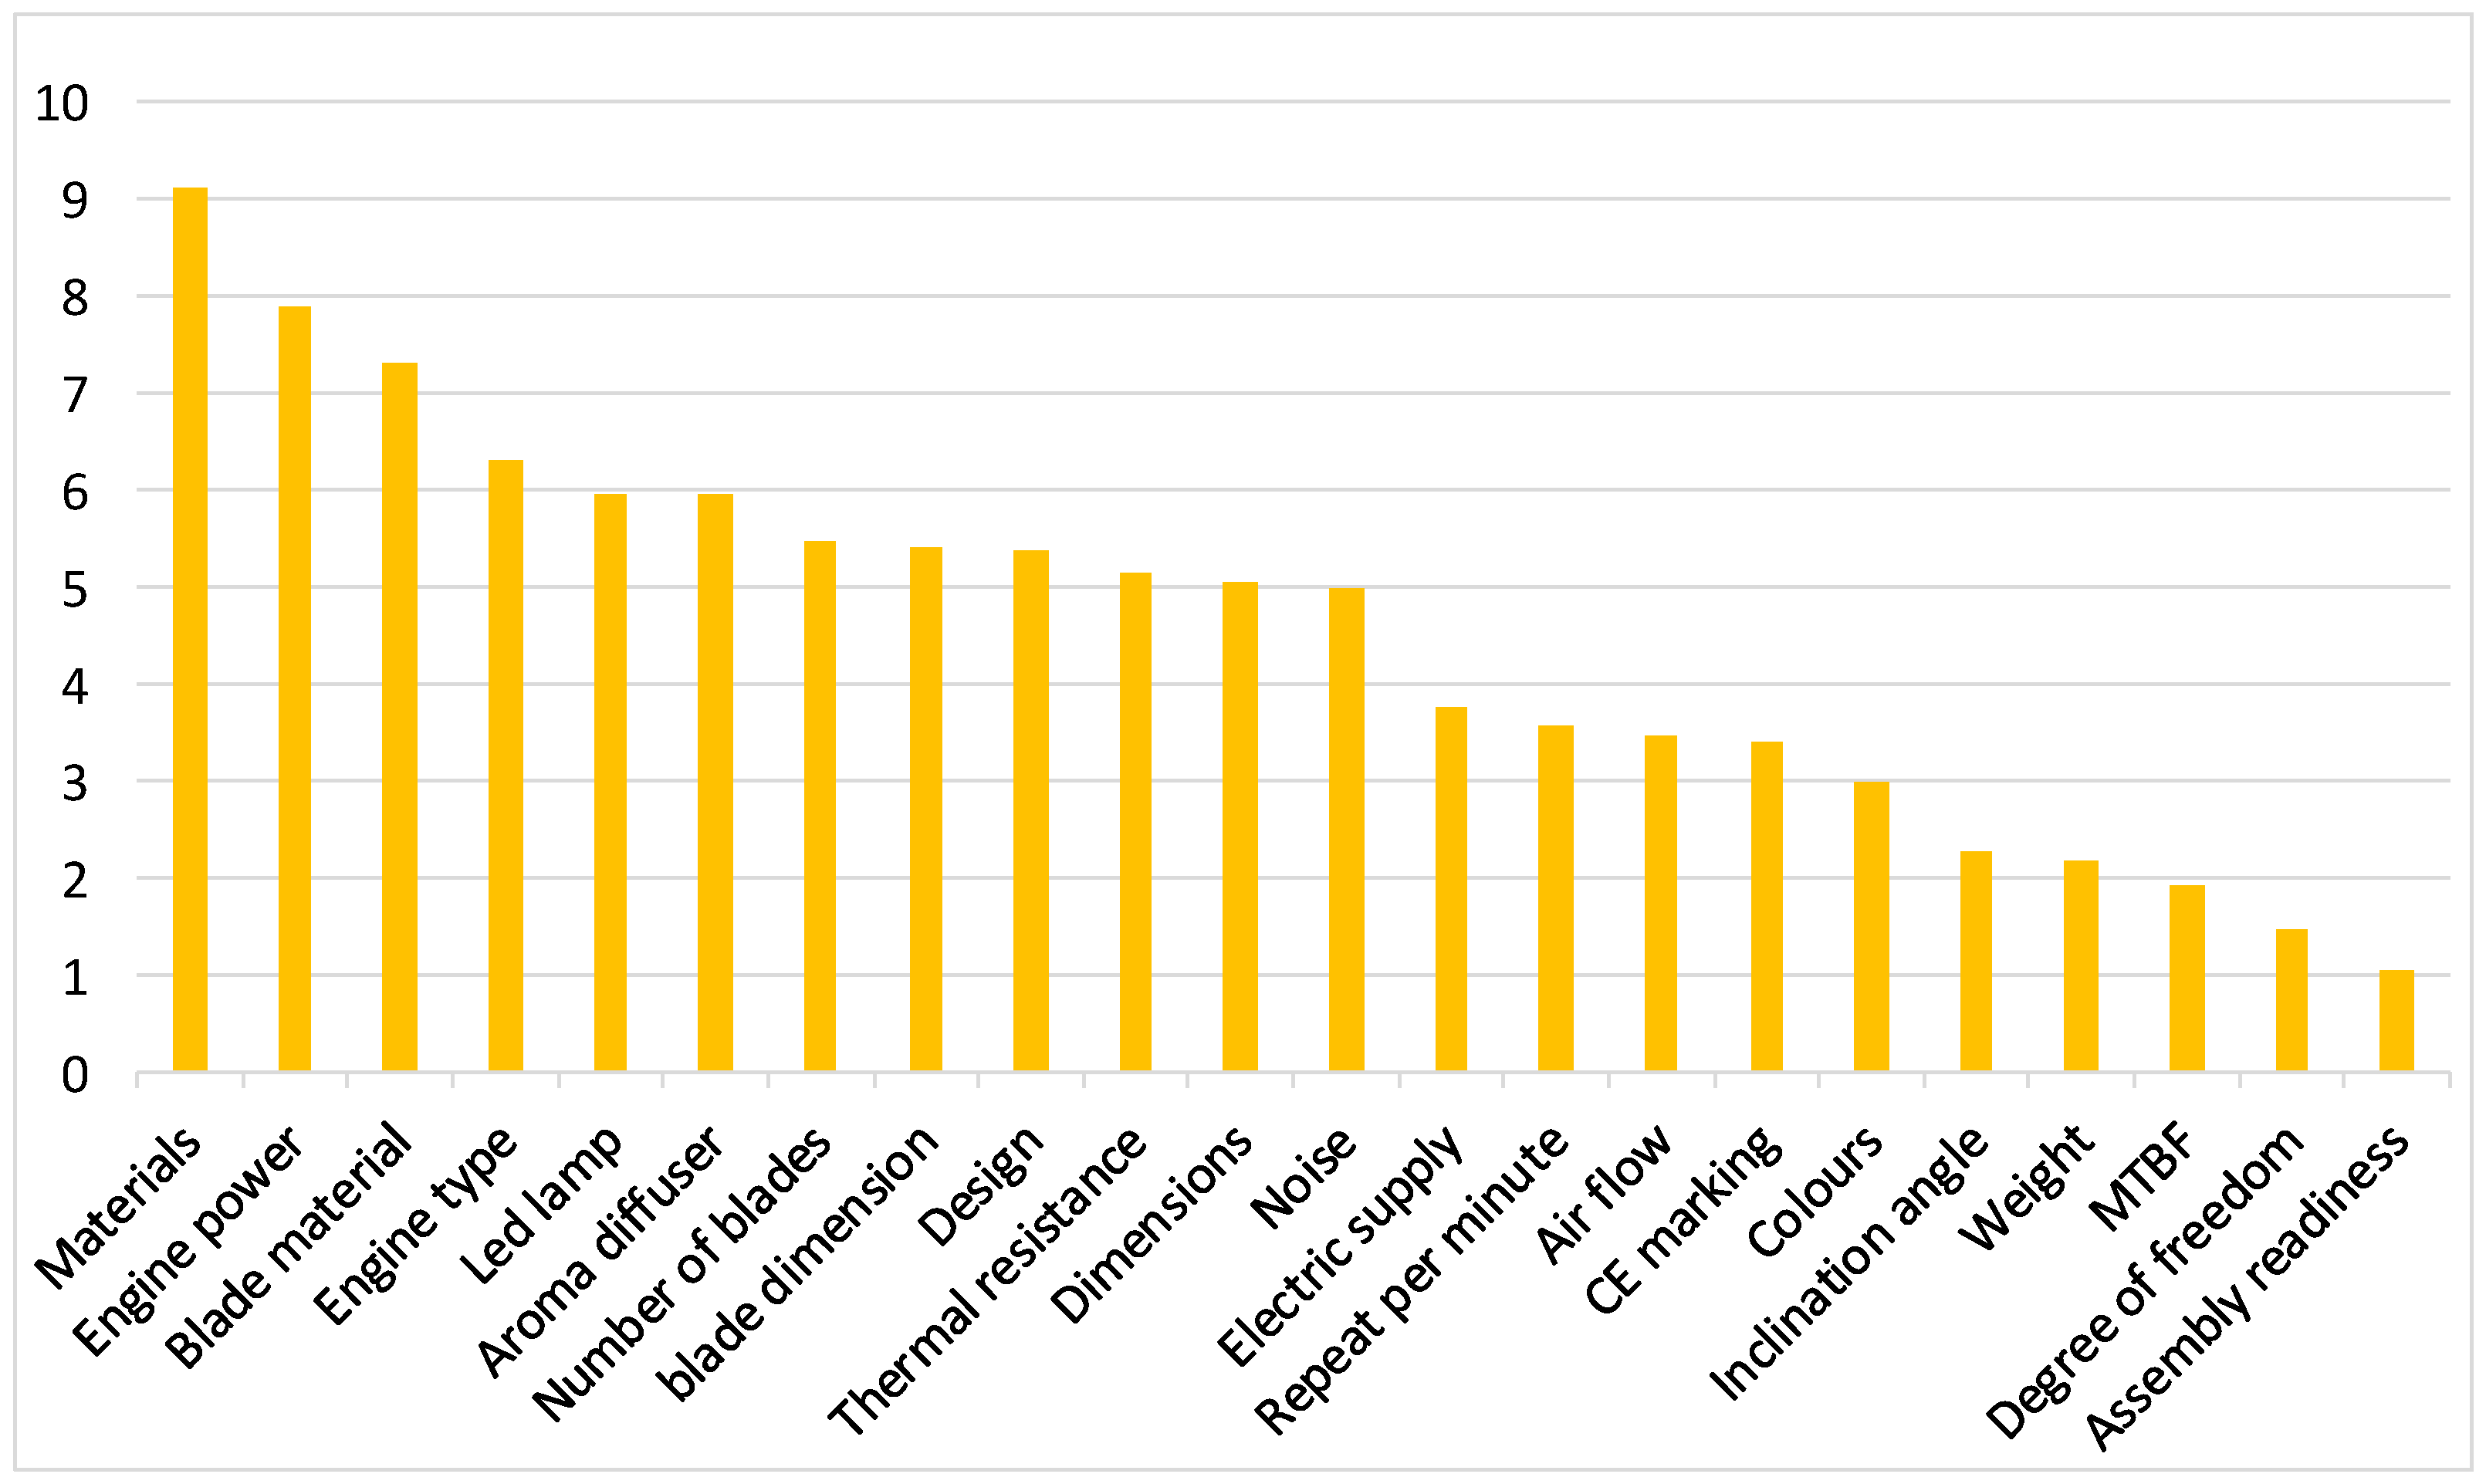
The absolute importance for each column is: ∑ (importance × relationship coefficient [0,3,9]). The fan relationship matrix shows us the absolute and relative importance of the design variables. From the graph (Figure 7) it is possible to identify:
- -
- Red: rather critical variables to which more attention must be paid.
- -
- Yellow: important but not particularly critical variables.
- -
- Green: non-critical variables that do not require particular improvements.
The following bar chart illustrates criticality of the technical variables.
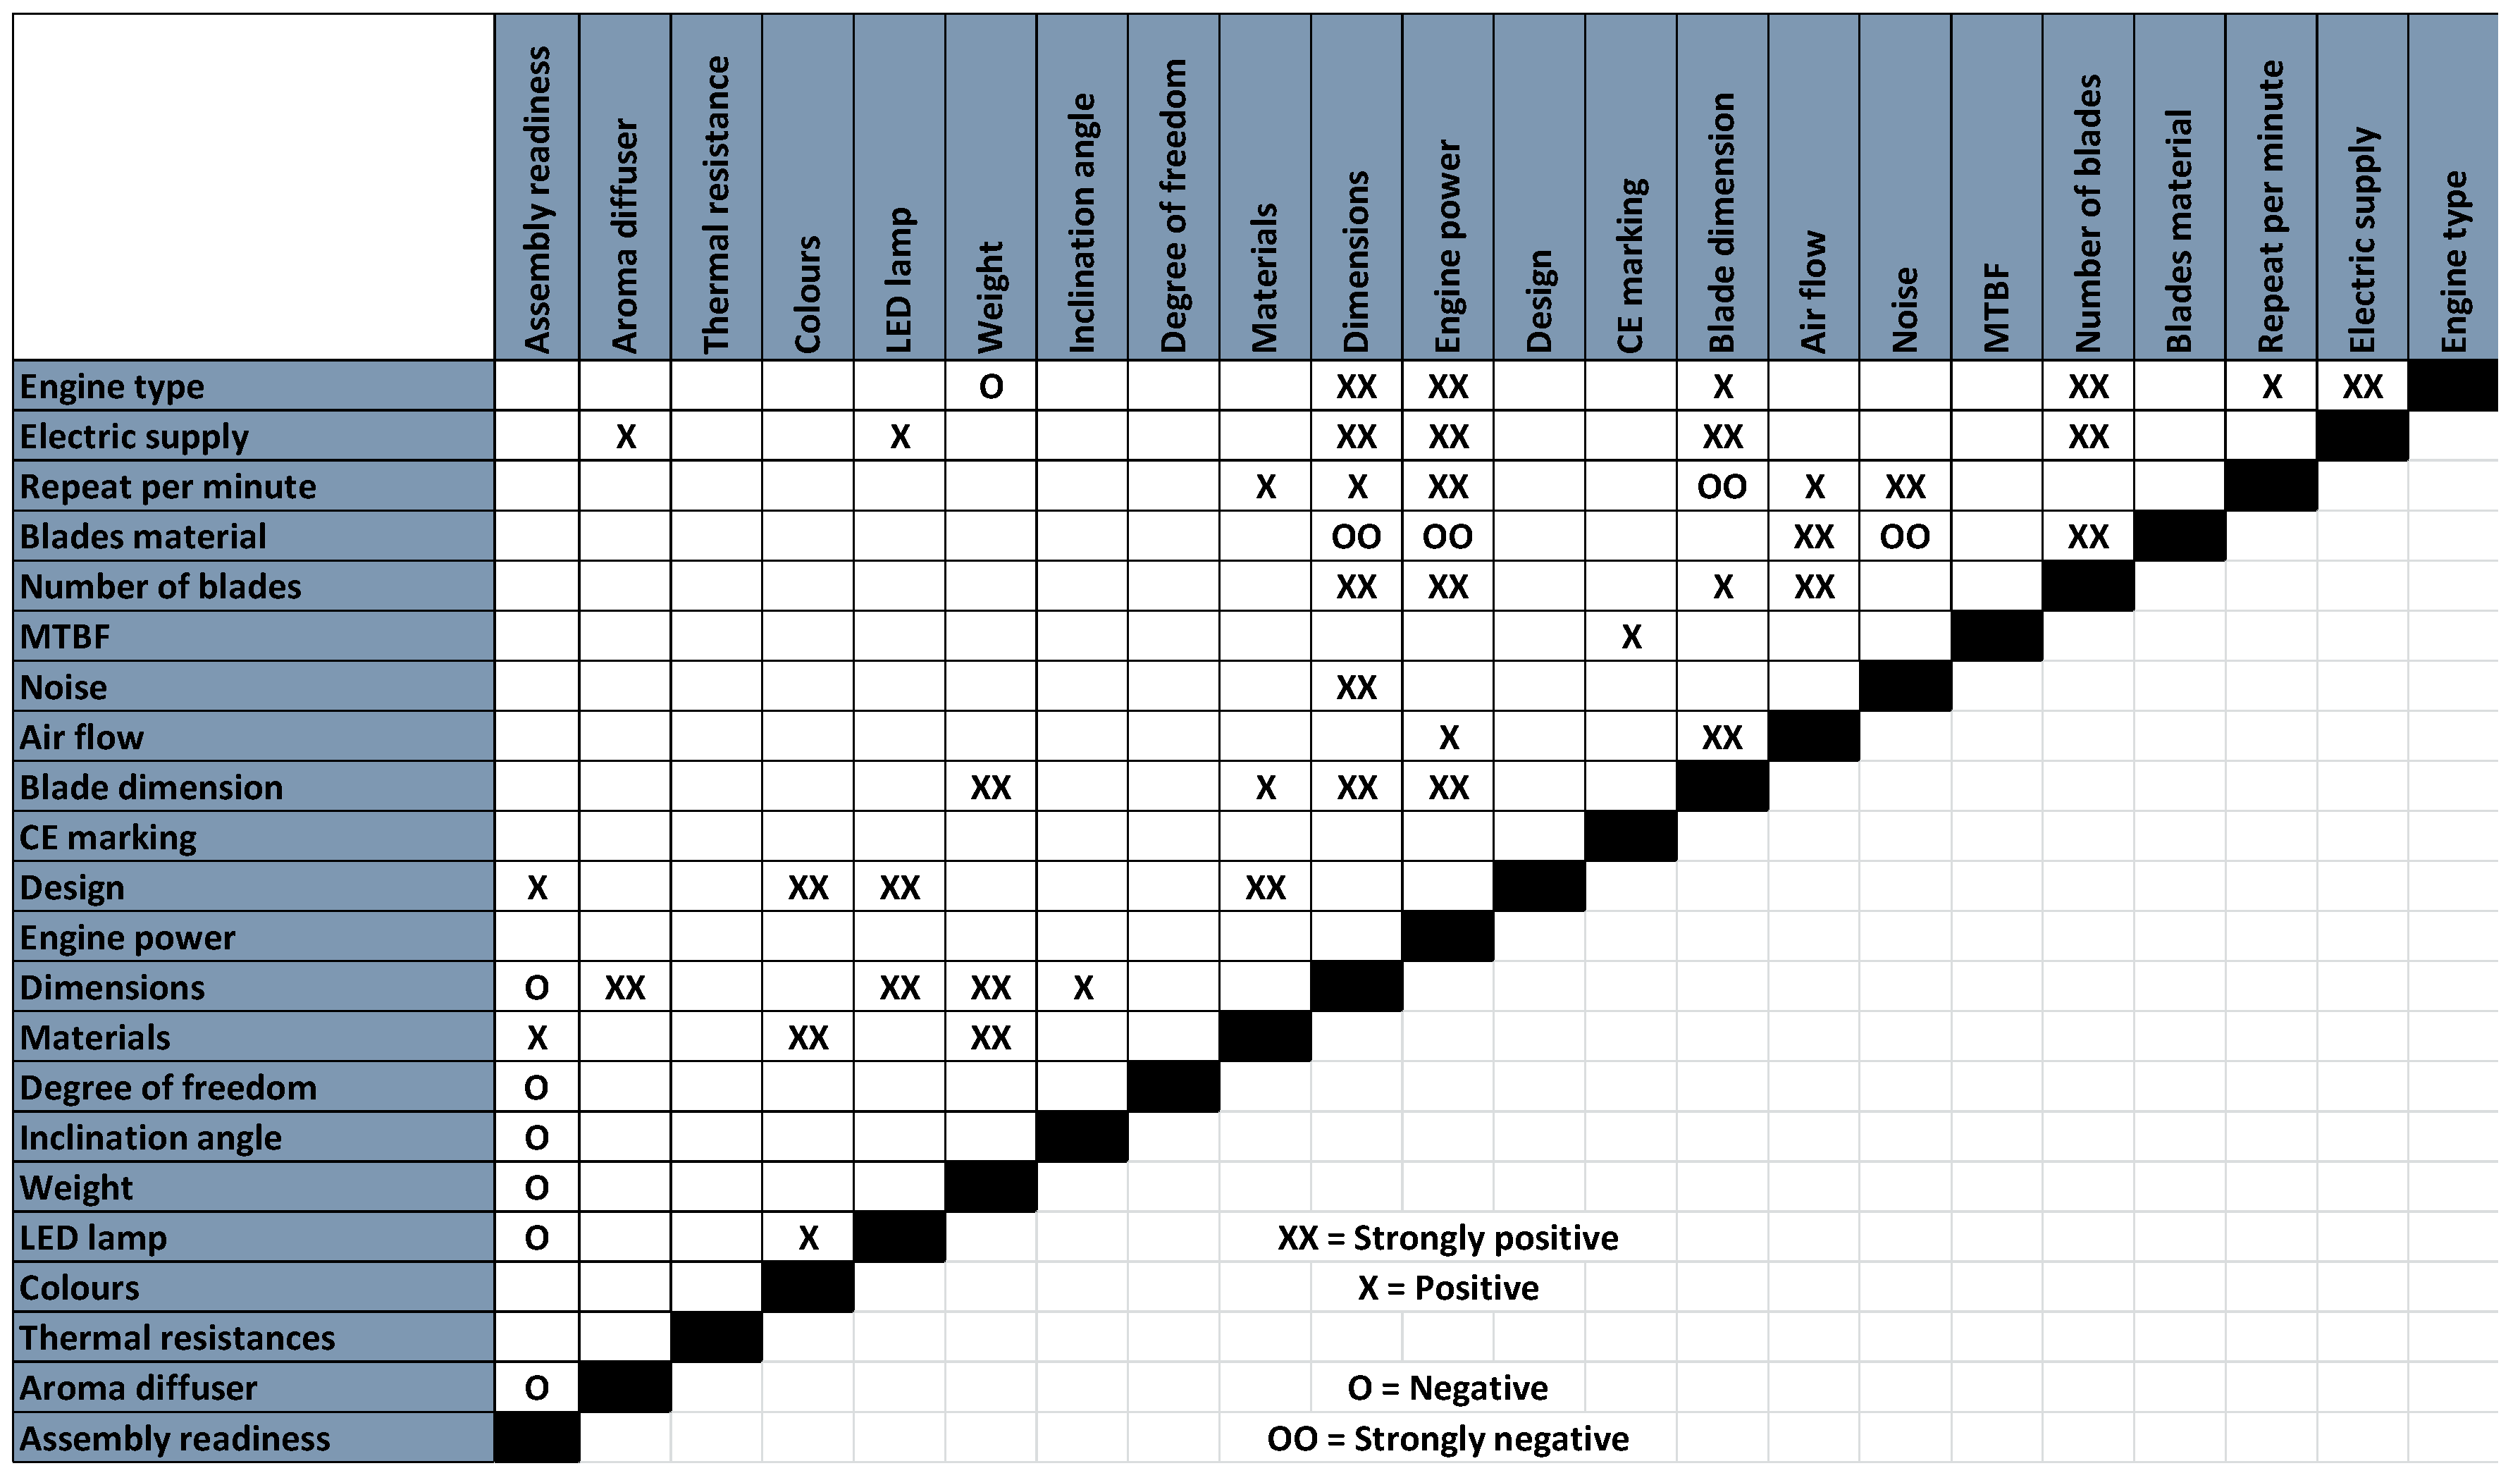
3.6. Interrelationship Matrix
In this matrix, which constitutes the roof of the house of quality, the technical characteristics are compared to each other. The roof highlights the relationships between each pair of technical answers. This helps to analyze the effects of changing a product feature, allowing the designer to determine the trade-offs between the characteristics and to recognise any problems. Very often, the VOD influence each other. The following matrix illustrates the relation between all technical parameters previously defined (Figure 8).
3.7. Benchmarking
Benchmarking is a continuous process of measuring products, services, and processes through comparison with the best competitors or leading companies. It indicates the comparison between the company’s performances and those of the ’excellent’ competitors. The Figure 9 illustrates a technical benchmark between existing products in order to understand which one is better and to better improve actual parameters to satisfy the customer. Moreover, also a non-technical benchmark has been carried out to understand which of the existing product better satisfies the customer needs.
To conclude, we must establish those characteristics that have a strong relationship with the needs of the customers, or that have a low technical performance or that are strong sales factors. In particular, the green boxes show the technical variable that need to be improved for the innovative deskfan. For this reason, the innovative fan will:
- -
- Use a DC motor to avoid noise.
- -
- Meet CE marking prerequisites.
- -
- Have four blades as an optimum trade-off between noise and air flow.
- -
- Use innovative plastic material to be lightweight.
Overall, once all matrixes are built and filled, it is possible to build the house of quality which translates customer needs into general guidelines for the design process which will be developed in the next chapter. The final house of quality is shown of Figure 10 (Frizziero et al., 2018) (Donnici et al., 2018).
4. Design: CAD & CAE
In the design phase, it is necessary to develop the technical project and a virtual model of the fan. In this regard, techniques adopted by companies will be analyzed, such as the integrated systems computer-aided-design, computer-aided-engineering, and computer-aided-manufacturing (CAD-CAE-CAM).
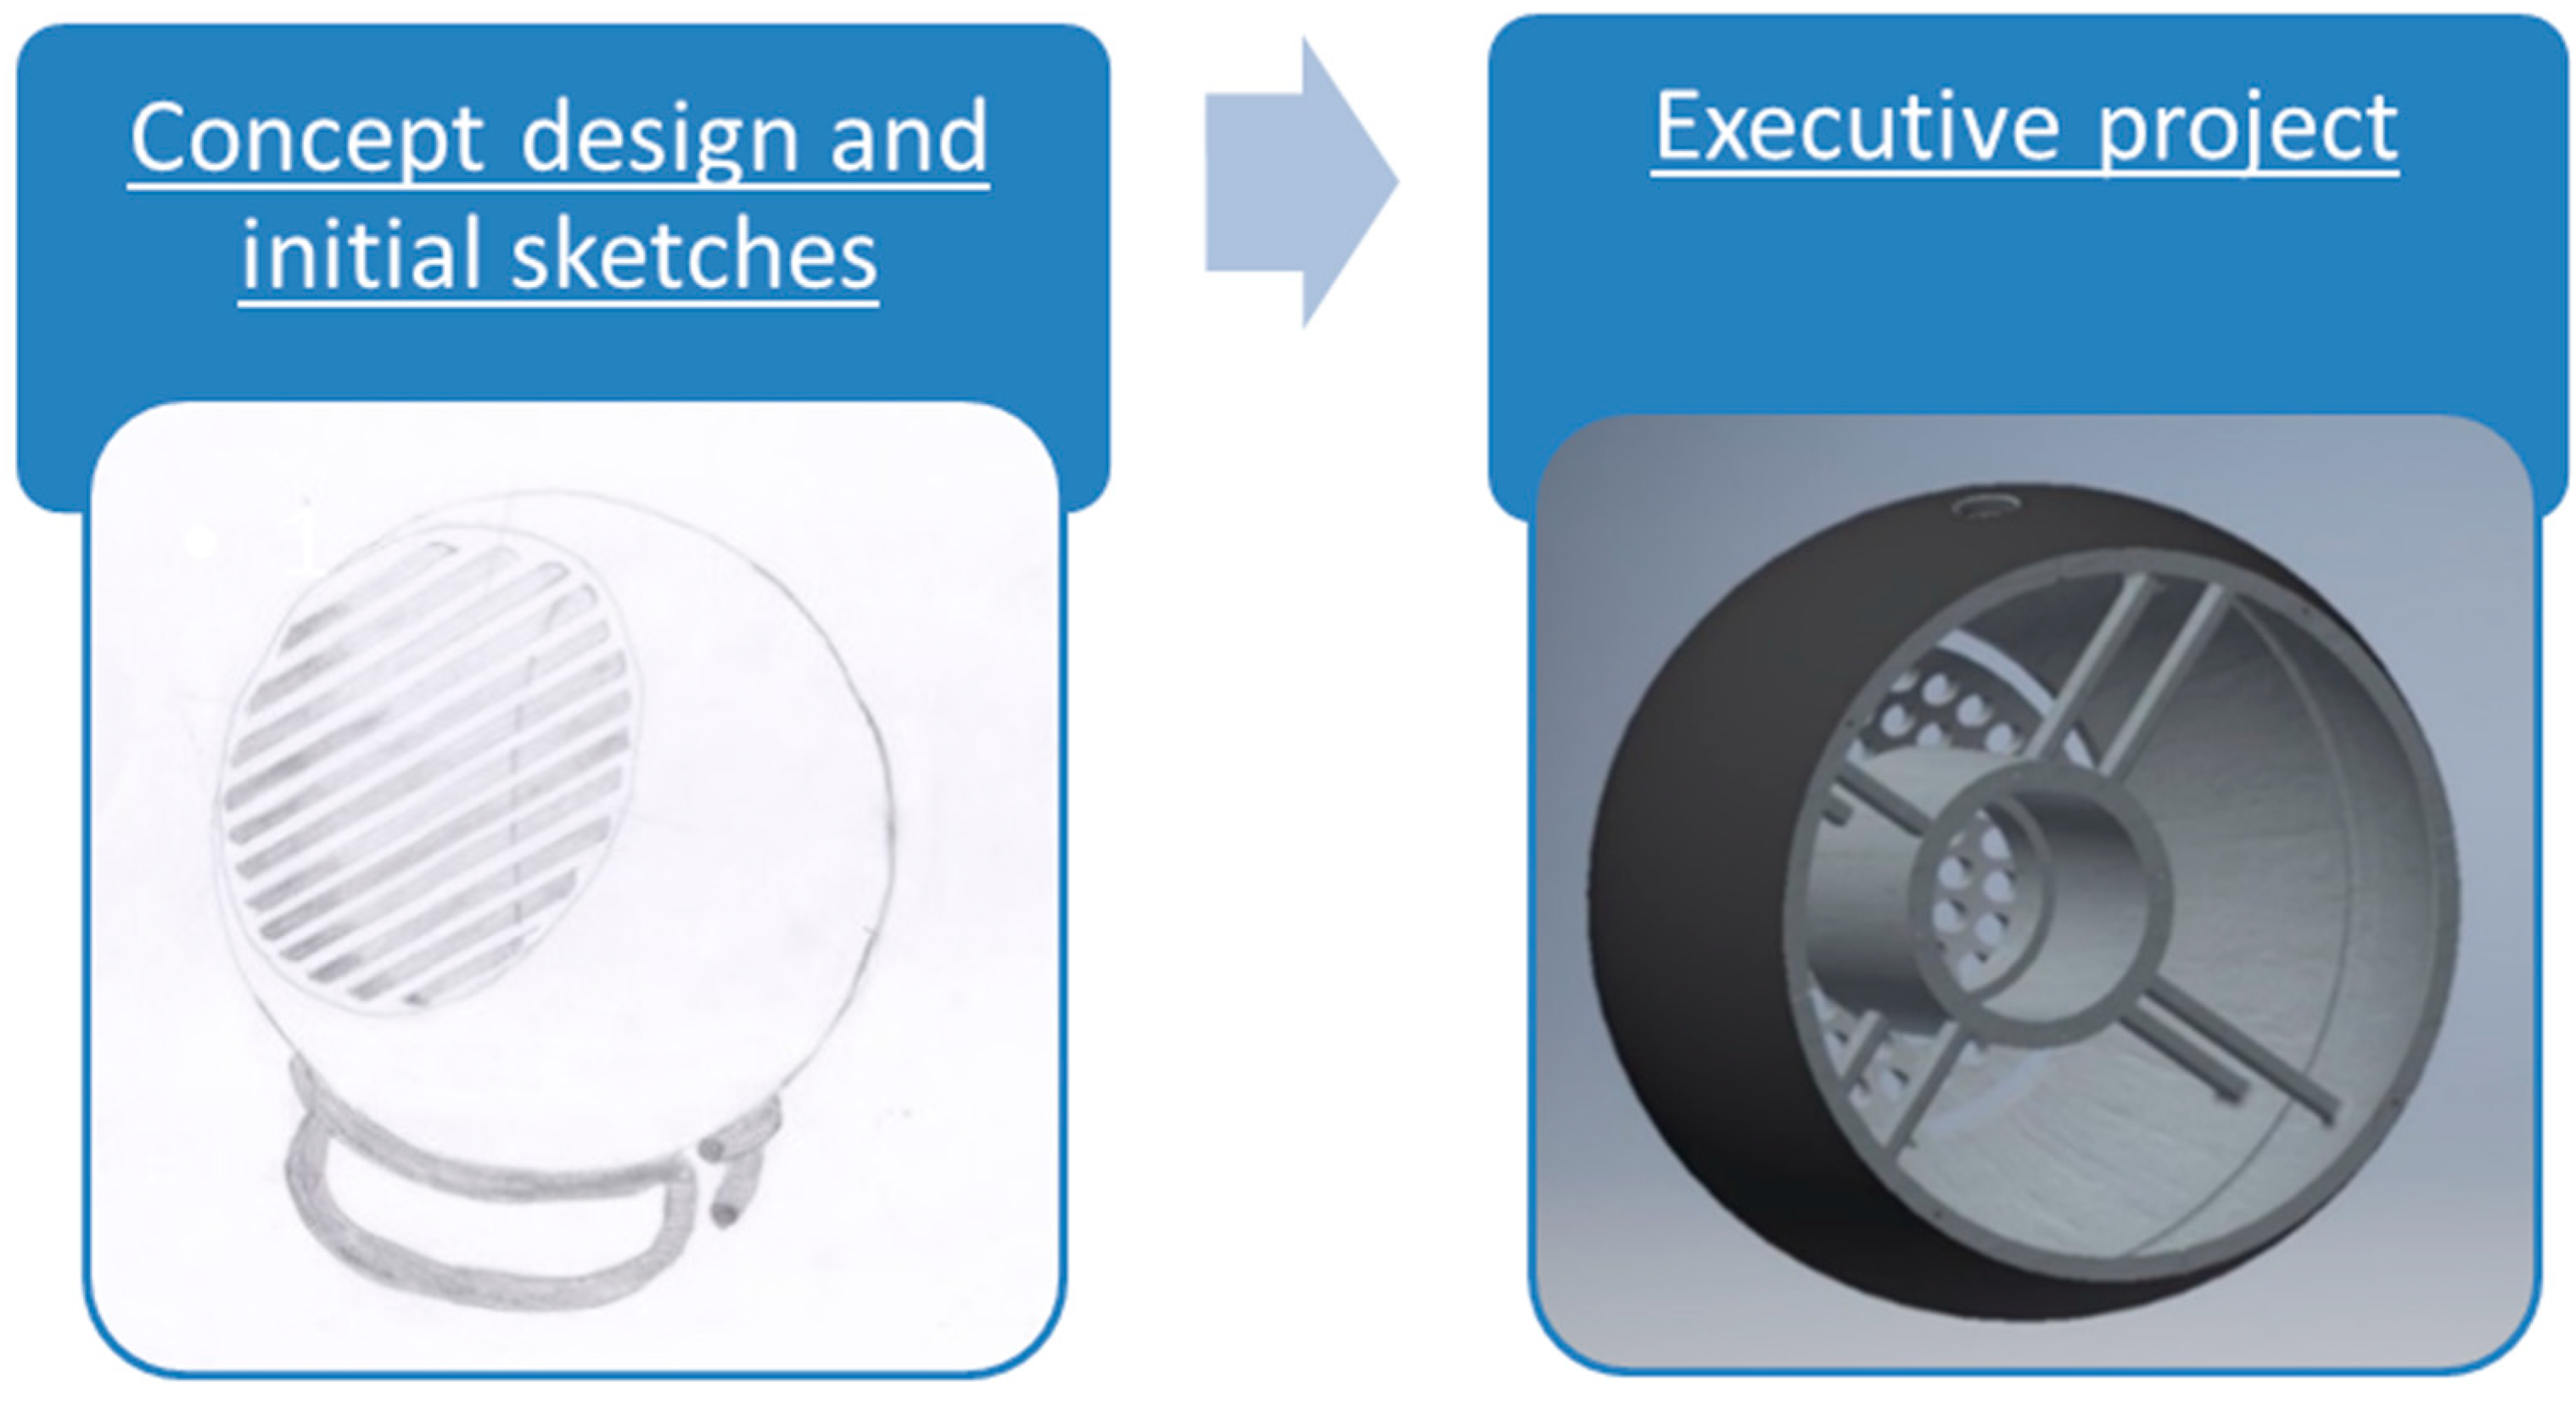
4.1. Concept Design and Initial Sketches
The initial idea is performed freehand, analyzed and improved to be transformed into a preliminary project in which the conceptual solution identified is developed in detail. Many times the starting point is a sketch on white paper. Figure 11 shows initial ideas of the project and executive project.
4.2. Executive Project
This phase involves the use of CAD systems and the first project drawings are drafted. Assembly drawings that contain very general information and only maximum dimensions are represented. Sub-assemblies are analyzed and CAE simulation systems are used to simulate the structural, kinematic, thermal, and dynamic behavior of mechanical components. In particular, the finite element analysis (FEA) determines the static and dynamic responses of the components at different load conditions.
4.3. CAE Analysis
Once all components are modelled on a CAD software, it is possible to develop on a CAE software (as Autodesk Inventor) a finite element analysis to evaluate the parts subject to greater mechanical stress. The finite element analysis is a mathematical technique designed to analyze and simulate the behavior of organs subjected to efforts, which was born in the 60s. The term ‘efforts’ refers to mechanical, electrical, or thermal stresses. This type of analysis breaks the structure under examination into smaller substructures, called finite elements. The finite elements and their interactions are converted into an equation and solved mathematically. Among the advantages in the adoption of numerical simulation systems it is possible to find: behavior prediction, raw material reduction, early validation, ‘what-if’ scenario analysis.
Let us now analyze some components. The FEA analysis was developed in the Autodesk Inventor environment. The material used for all components is the Nylon PA 12, introduced by HP, whose yield strength Rp is 48 MPa and it has a density of 1.01 g/cm3.
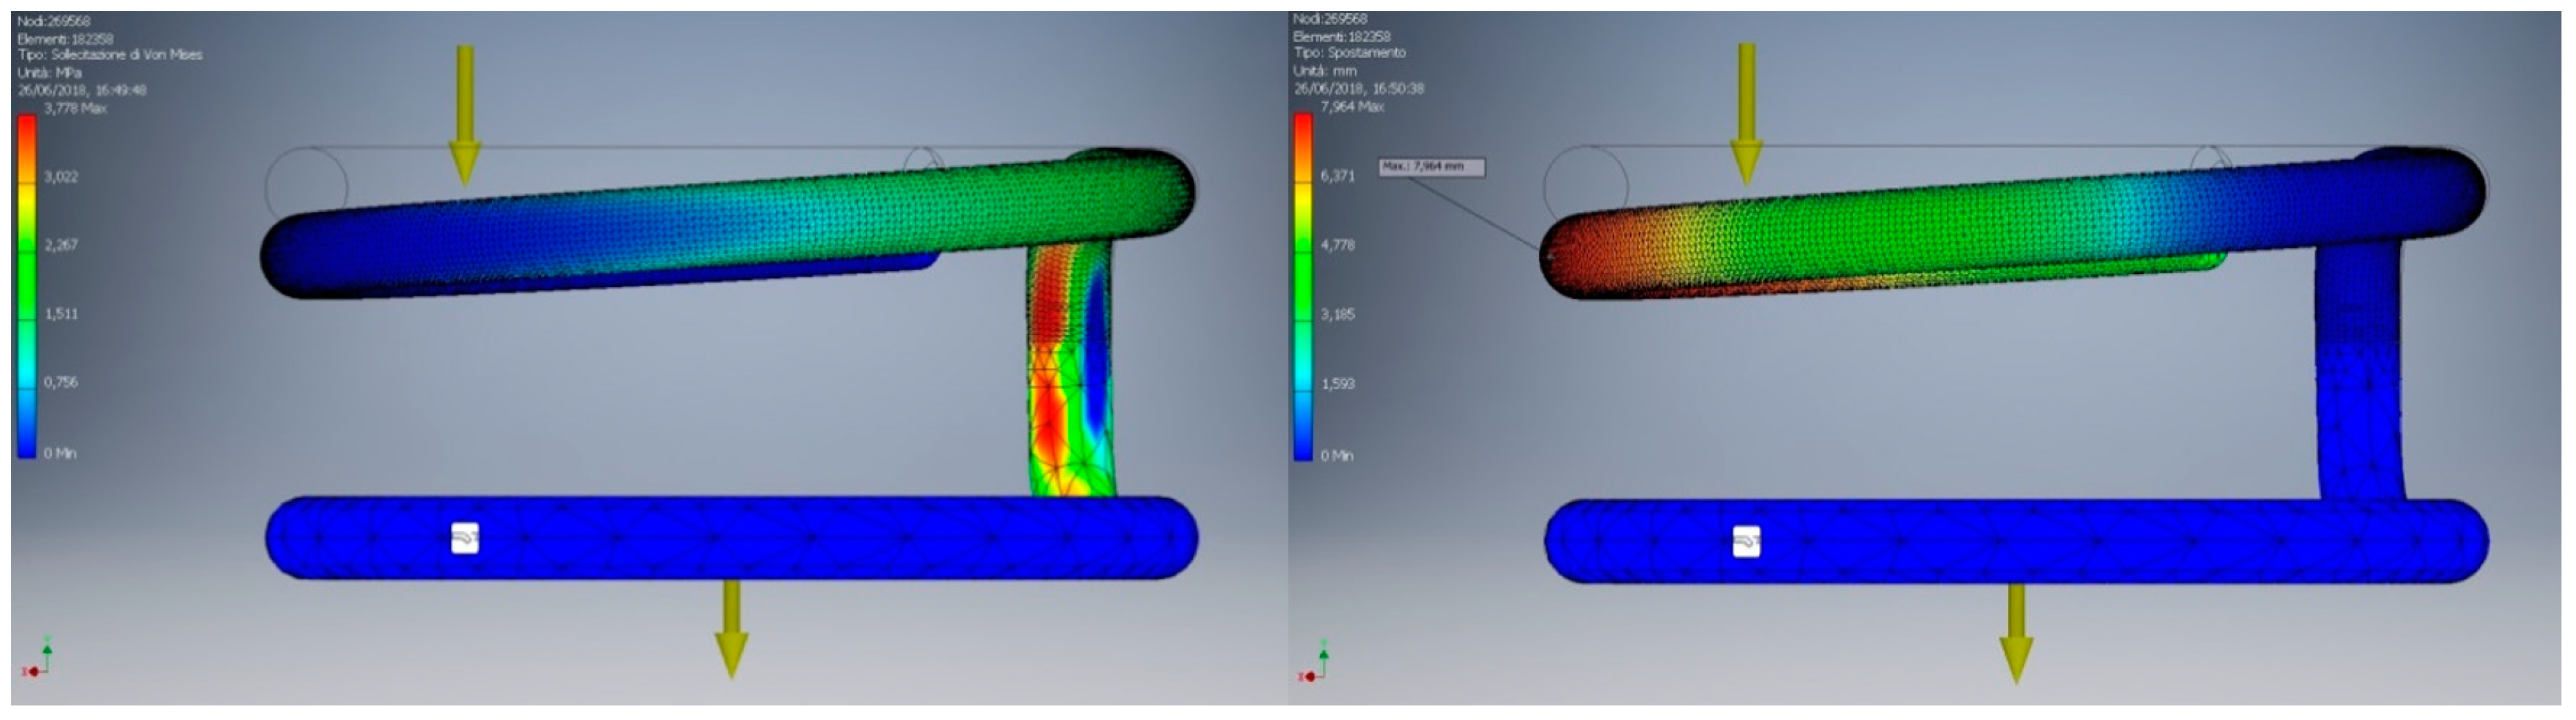
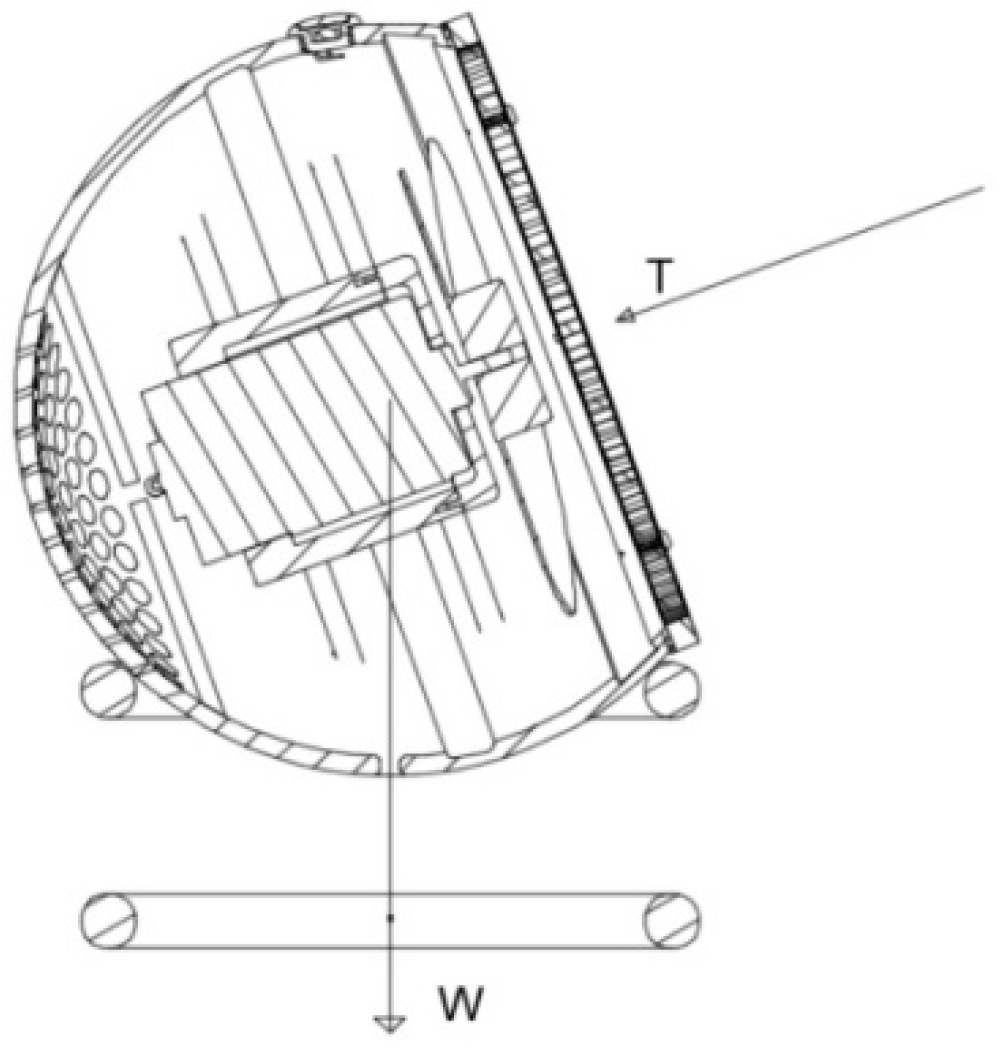
Support: The support is the most stressed component. In fact, it is required to consider the weight of all the components and apply a force on this support and analyze the deformations. Now we evaluate the weights of the pieces given by CAE software:
- ○
- Body: 0.196 Kg
- ○
- Engine (from catalog): 0.303 Kg
- ○
- Fan: 0.014 Kg
- ○
- Grill: 0.041 Kg
- ○
- Cap: 0.010 Kg
The total weight on that lies on the support will be given by the sum of these.
Weight = 0.564 kg. The weight force is obtained as W = 0.564 × 9.8 m/s2 = 5.53 N. Now we apply this force on the surface of interest. The following results are obtained (Figure 12):
By applying the gravitational force and the load, and after fixing the constraints of the support, it is possible to notice that the area subjected to the greatest effort is the part highlighted in red. However, the maximum effort recorded is 3.778 MPa, while the yield strength of PA12 is 48 MPa. Therefore, we are still in the elastic field, far from the breaking load. In addition to the Von Mises factor, displacement must also be considered. Since both the structure and the material are very elastic, an important displacement can be noticed in the area furthest from the vertical support. A displacement of 8 mm has been registered, allowing a spring effect.
Body: The body is the most fragile and difficult part to analyze. The ‘spider’ supports of the motor housing are thin and risk breaking if subjected to high mechanical stress. In the FEA analysis of this component, both the thrust force of the fan and the motor weight force were calculated. The engine’s torque is neglected (Figure 13).
- ○
- Motor weight: 0.303 kg, which becomes W = 2.97 N
- ○
- Pushing force: the ‘actuator disk theory’ of the fluid dynamics introduced by Rankine was exploited. This theory, considering null all aerodynamic and mechanical frictions, calculates the power P to generate a thrust T with the following: P = √, where P = × ρAv3 and T = × ρ (Cs2-Cu2)
- -
- ρ = air density (1.22 kg/m3 at ISO conditions)
- -
- A = disk area
- -
- Cu = 5 m/s Cs = unperturbed air = 0.12 m/s
Once the forces are calculated, they are applied to the surface of the motor housing and pressure generated had been calculated: 0.00065 MPa. This value is approximated in the FEA environment of Autodesk to a minimum cautionary value of 0.001 MPa. Let us now analyze the results obtained. It can be shown that the maximum stress obtained is 0.1972 MPa with a material yield strength Rp of 48 MPa. In this case, unlike the support, the displacements along the horizontal axis are of the order of microns and considering the application of the component (domestic use), they can be neglected [4].
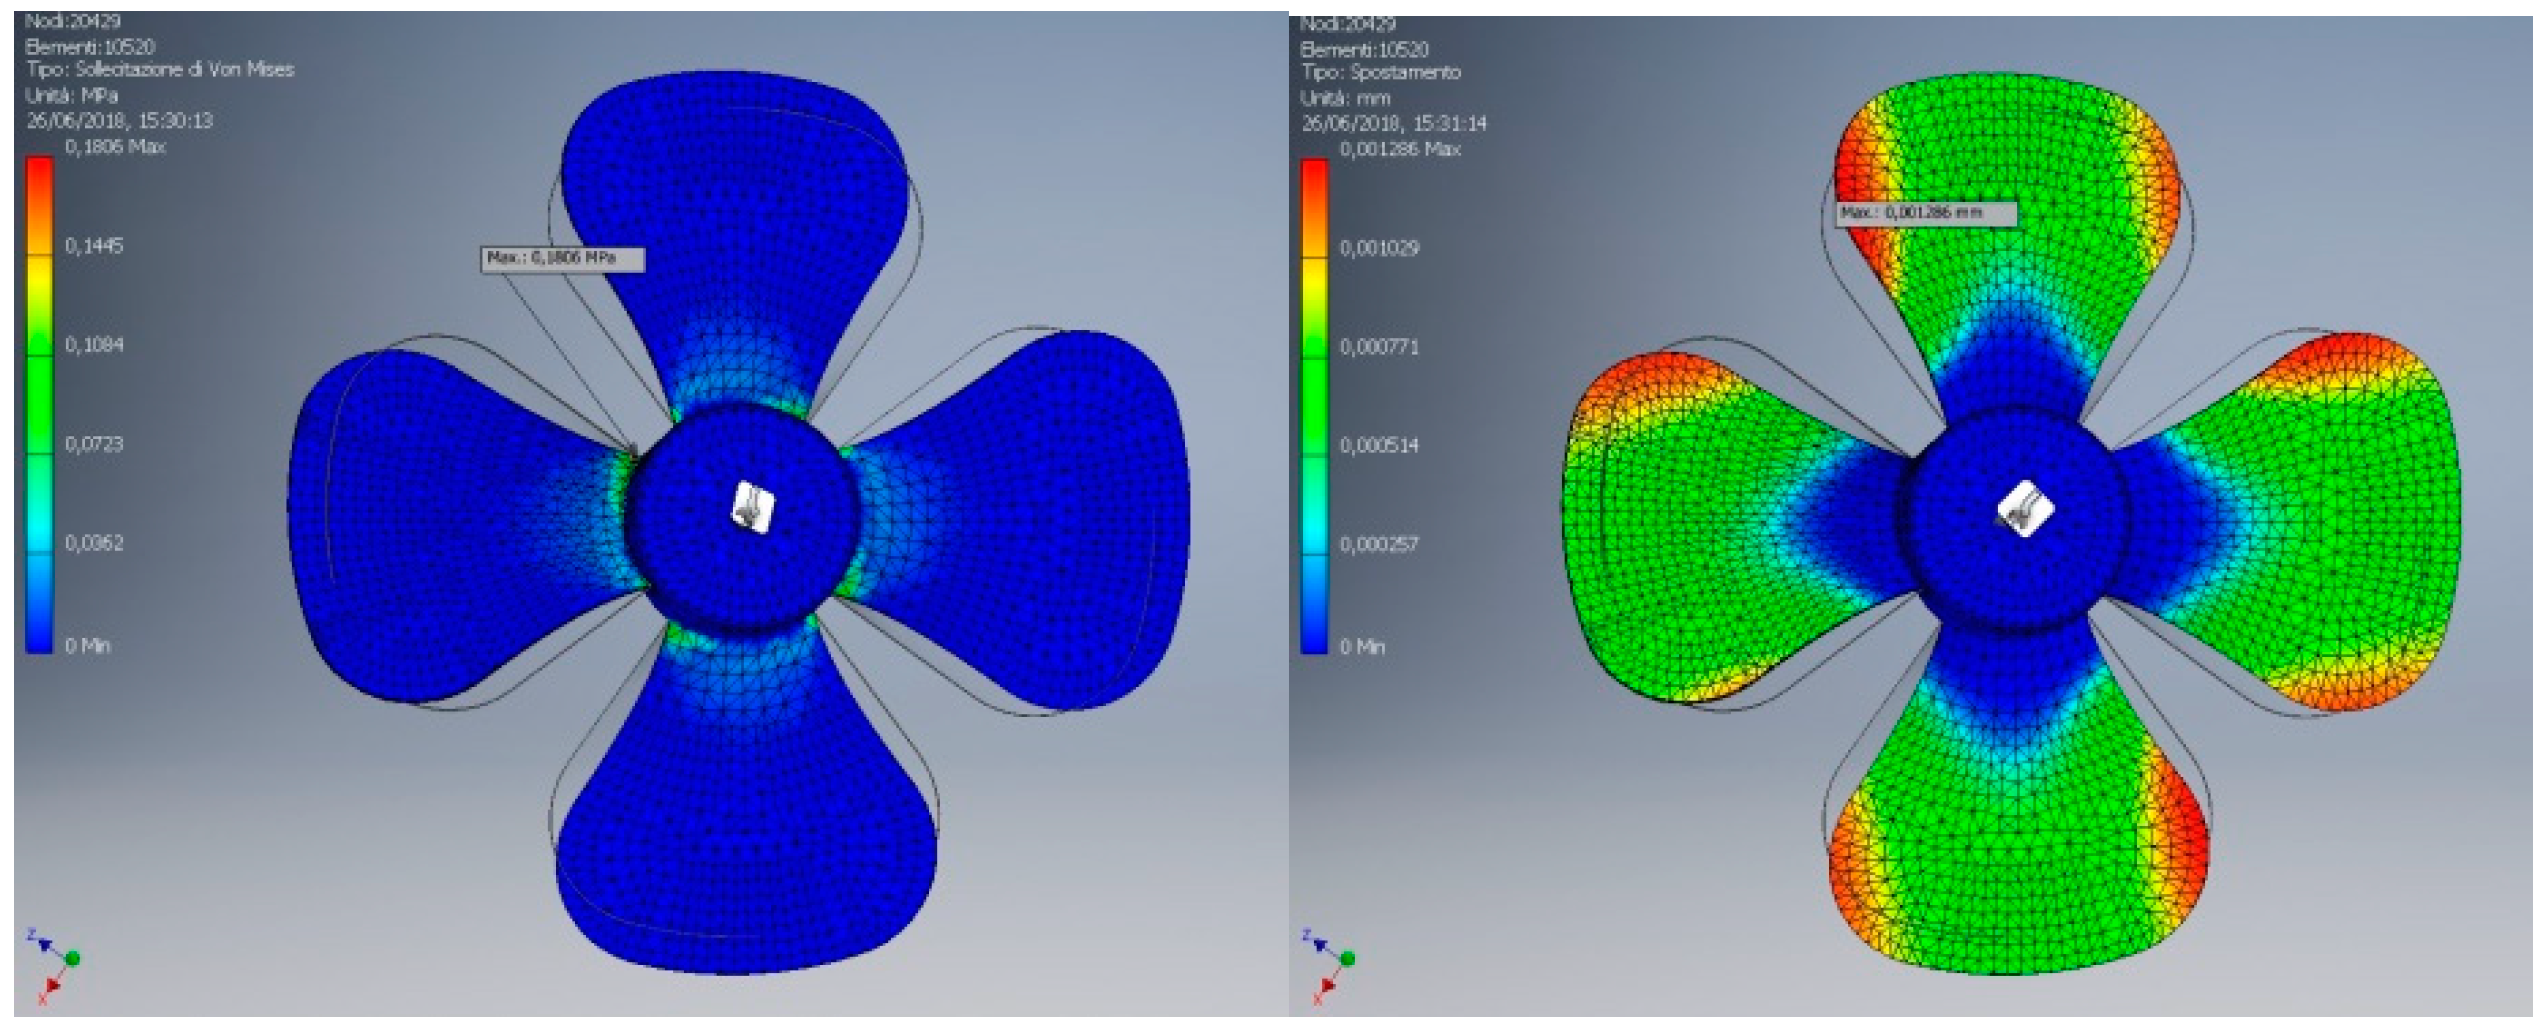
Fan: A FEA analysis was also performed for the fan. In conditions of absence of friction and lack of resistance of the fluid, the component is put in rotation at 1500 RPM to evaluate its consequences. Displacements in the order of microns and stress of 0.19 MPa are highlighted (Figure 14).
4.4. Final Assembly
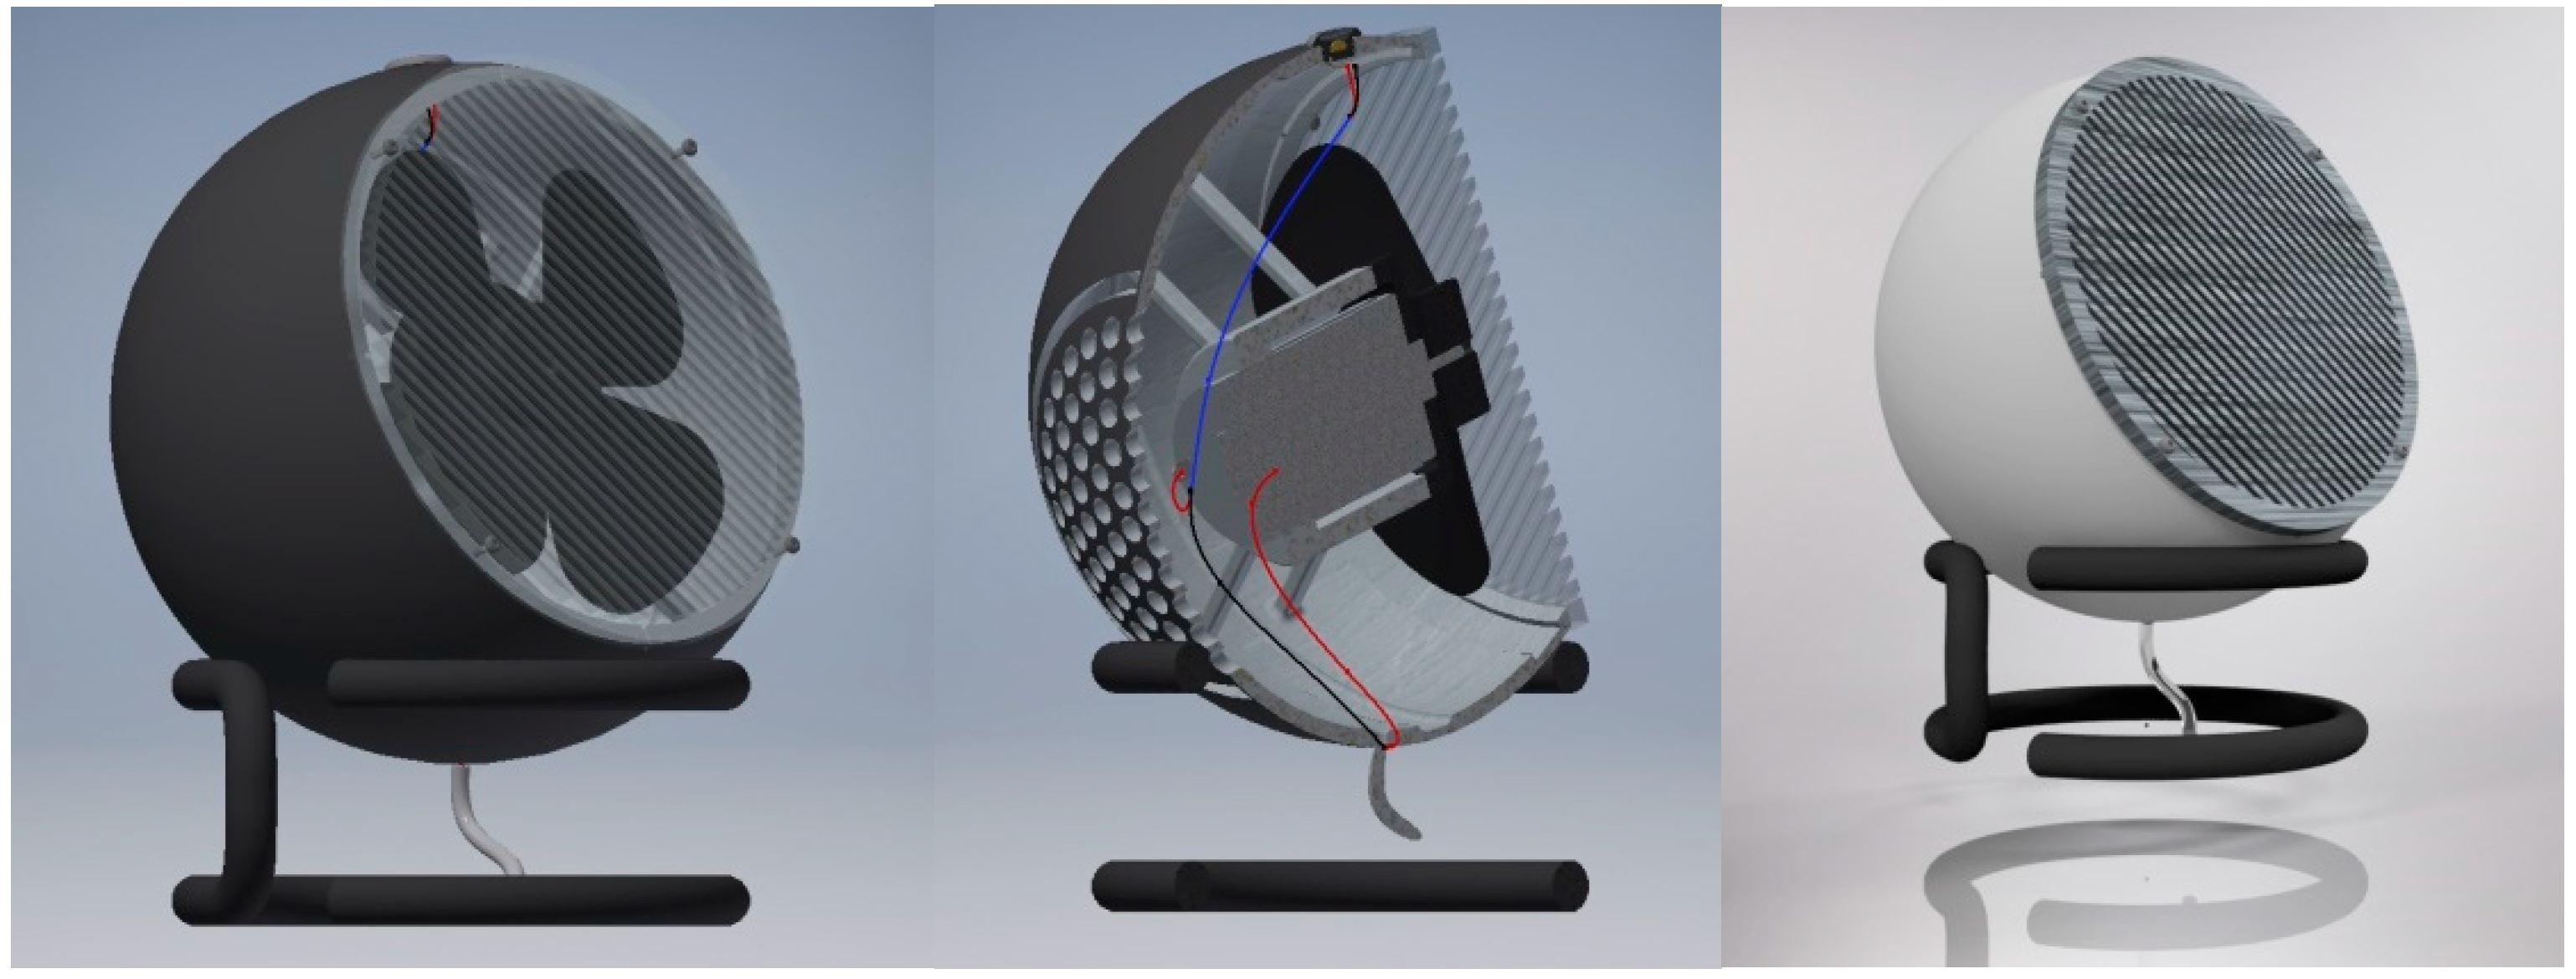
To conclude the technical feasibility, all components are assembled and catalogues for the LED, thermal resistances, wires, and manufacturer are considered. The following image (Figure 15) shows the final assembly as a virtual model.
5. Validation: Design for Additive Manufacturing and Multi Jet Fusion
In this last phase, it is stated with certainty that the finished product confirms the expected results. It is possible to produce prototypes to ensure that the product is in line with the required characteristics. Moreover, an FMEA analysis is developed to identify the weaknesses of the project very quickly. In this last section, validation and prototyping techniques will be treated by additive manufacturing technology [5].
Considered one of the enabling technologies of the industry 4.0, Additive manufacturing is the creation of three-dimensional objects, starting from a virtual 3D model. The digital model is produced with dedicated software and subsequently elaborated to be then realized layer by layer, through a 3D printer. It is an easy concept to automate. The main areas of application of AM technologies are:
- -
- Rapid prototyping
- -
- Indirect production of molds and tools
- -
- Direct production (Rapid Manufacturing)
- -
- Spare parts
In order to reduce production costs and prototyping times, additive manufacturing technologies replace the traditional techniques of mechanical processing since the latter work by removing material step by step, generating a lot of waste and sometimes requiring complex code generation (G-code for CNC machine). RP techniques operate on an inverse conceptual basis, i.e., by adding material with the possibility of obtaining complex shapes.
5.1. Multi Jet Fusion Voxel-Jet
Multi jet fusion is one of the latest additive manufacturing technologies introduced by HP in 2016. It offers a faster and cheaper process for 3D printed parts. The finished parts achieve better quality surface finishes, high resolution detail and more reliable mechanical properties than other 3D printing technologies, such as FDM (Fusion deposition modeling).
It all comes down to four main elements that characterize MJF:
- -
- Greater speed thanks to the processing of an entire layer.
- -
- Higher quality of the parts thanks to the detail agents; V Voxel-Level multi material and multi-color capability.
- -
- Materials that are economically accessible and have lower environmental impact.
- -
- Competitiveness with mass production. Unlike slow processes of some technologies (dot-to-dot like FDM).
5.2. Nylon PA 12
Nylon PA 12 is a material introduced by HP to be used in multi jet fusion. It is a powder polymer such as PA 11. They both have good mechanical properties and have less impact on the environment. Moreover, it has a good chemical resistance and good behavior at low temperatures. The table (Table 5) below resumes its characteristics. Nylon PA 12 has been selected for the innovative fan.
5.3. Design for Additive Manufacturing
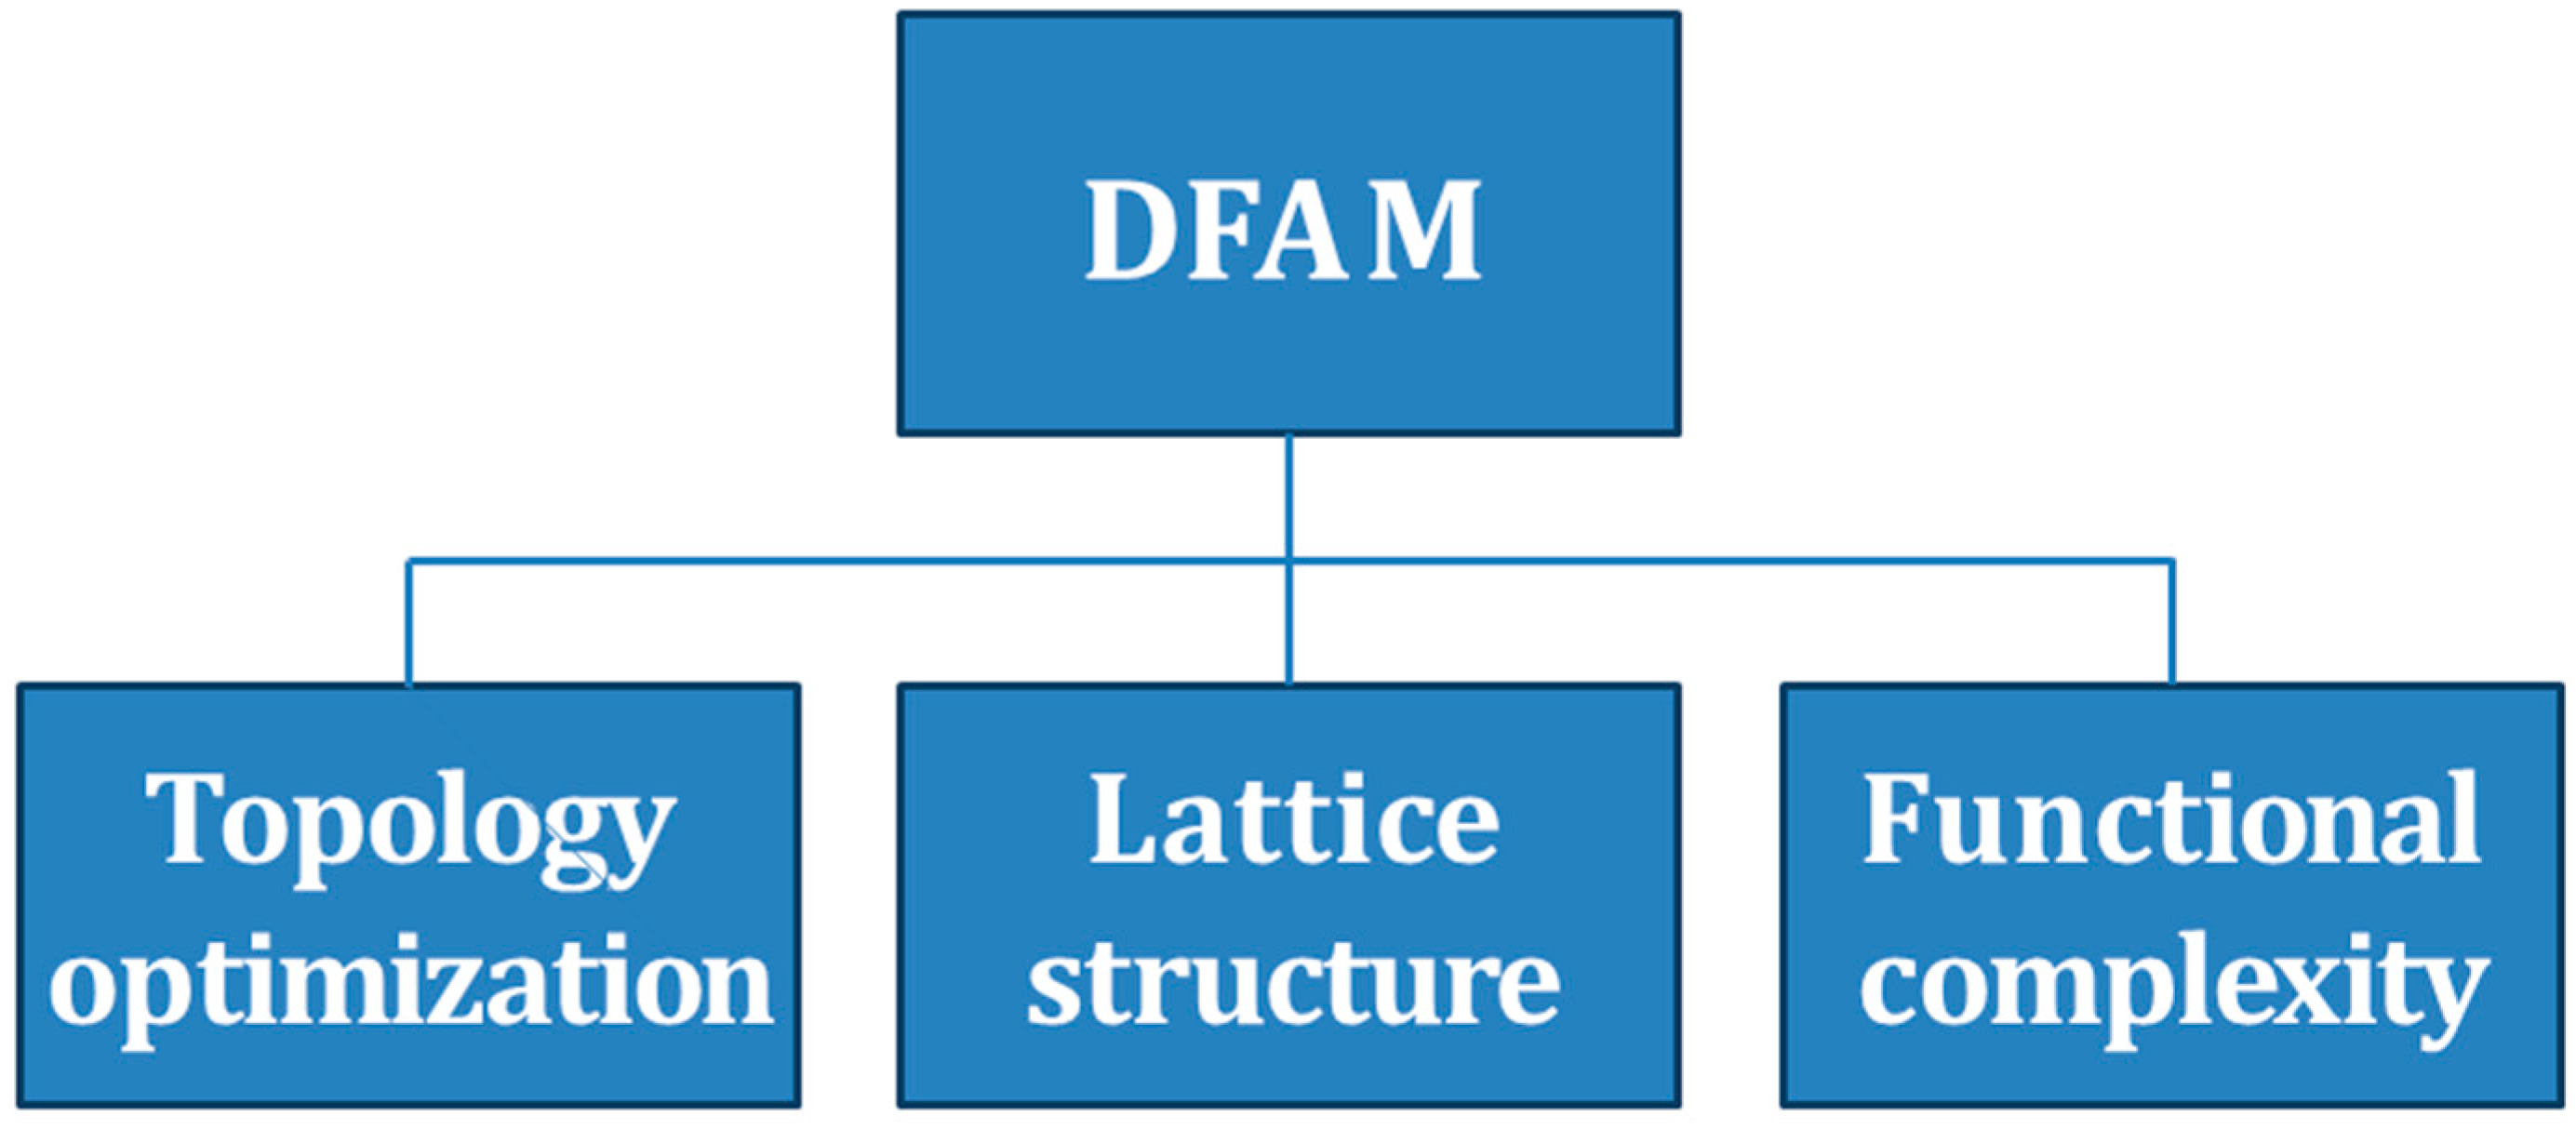
Design for additive manufacturing (DFAM) is a type of design for X applied to this new technology, full of opportunities in terms of design. It is a tool that optimizes functional performance and other product lifecycle considerations, such as manufacturability, reliability, and cost. This process emerges thanks to the enormous design freedom provided by additive technologies. Typical DFAM methods or tools include topology optimization, multi material design, mass customization, and lattice structures. As stated, the DFAM should “maximize product performance through the synthesis of forms, dimensions, hierarchical structures and material compositions, subject to the capabilities of AM technologies”.
The DFAM can be seen as a version of the design for manufacturing and assembly pushed to the limit. In the DFMA, which was introduced in the 90s to improve the production of components, the most common solutions are:
- -
- Minimize the number of components
- -
- Remove the connections
However, it is easy to understand that by decreasing the number of components, the cost of assembly decreases but the cost for geometric complexity increases exponentially. For this reason, the DFM presents this technological limit. The DFAM, instead, goes further thanks to the freedom of design offered by additive manufacturing. This philosophy focuses mainly on three issues (Figure 16):
- (1)
- Topology optimization: The layer-by-layer process allows to have complex sections up to the maximum allowed resolution. Moreover, it is possible to define the shape re-design, meaning that it is possible to optimize the shape of the product solely based on the functions it meets. Topology can be optimized in terms of stress and functionality and not in terms of technological limits. As for the fan, we have already seen that the central body cannot be produced by conventional technologies a part from additive manufacturing.
- (2)
- Lattice structure: It is possible to have a control of the different levels of structure. It generates much lighter and less expensive structures. Although the compact structures are stronger, the specific strength of the samples of latex structures is higher. They provide a higher force per kilogram of material. The reticular structures provide sufficient strength with reduced mass. During the project, both full and lattice structures were designed.
- (3)
- Functional complexity: It is possible to print assembled parts in one operation, avoiding assembly costs.
As for machining, HP suggests some general rules to apply during the design process to avoid printing defects. The most important are:
- -
- Wall thickness: Printing resolution is strongly anisotropic. However, HP suggests wall thickness of 0.3 mm for XY planes and 0.5 mm for Z planes.
- -
- Lattice structure: Since HP uses powder selective technology, the not melted powder need some allowance to be removed. For closed components, it is necessary to leave holes of 2 mm diameter to let powder go out during cleaning.
- -
- Functional complexity: When printing assemblies, it is compulsory to allow at least 0.5 mm clearance between components.
- -
- Part orientation: As we already said, the process is strongly anisotropic and cooling strongly affects the shape of components, It is important the orientation of surfaces to reduce cooling defects.
5.4. Additive Manufacturing Process: Printing an Innovative Fan
Additive manufacturing is based on eight steps that are independent from the technology used. Let us apply the following phases to the fan:
CAD: All processes, even non-additive ones, start with the definition of a mathematical model on a CAD software. This has the function of describing the object geometrically. We already have the 3D model of the fan, previously designed.
STL (standard triangulation language) convert: This file is a simple way to describe an object geometrically. The STL extension discretizes the solid model into a series of triangles as it happens for the meshes (elements in the FEA analysis). Moreover, sometimes it is required to repair STL file because triangulation is not accurate. Using Autodesk Netfabb, it is possible to manipulate STL files.
- (1)
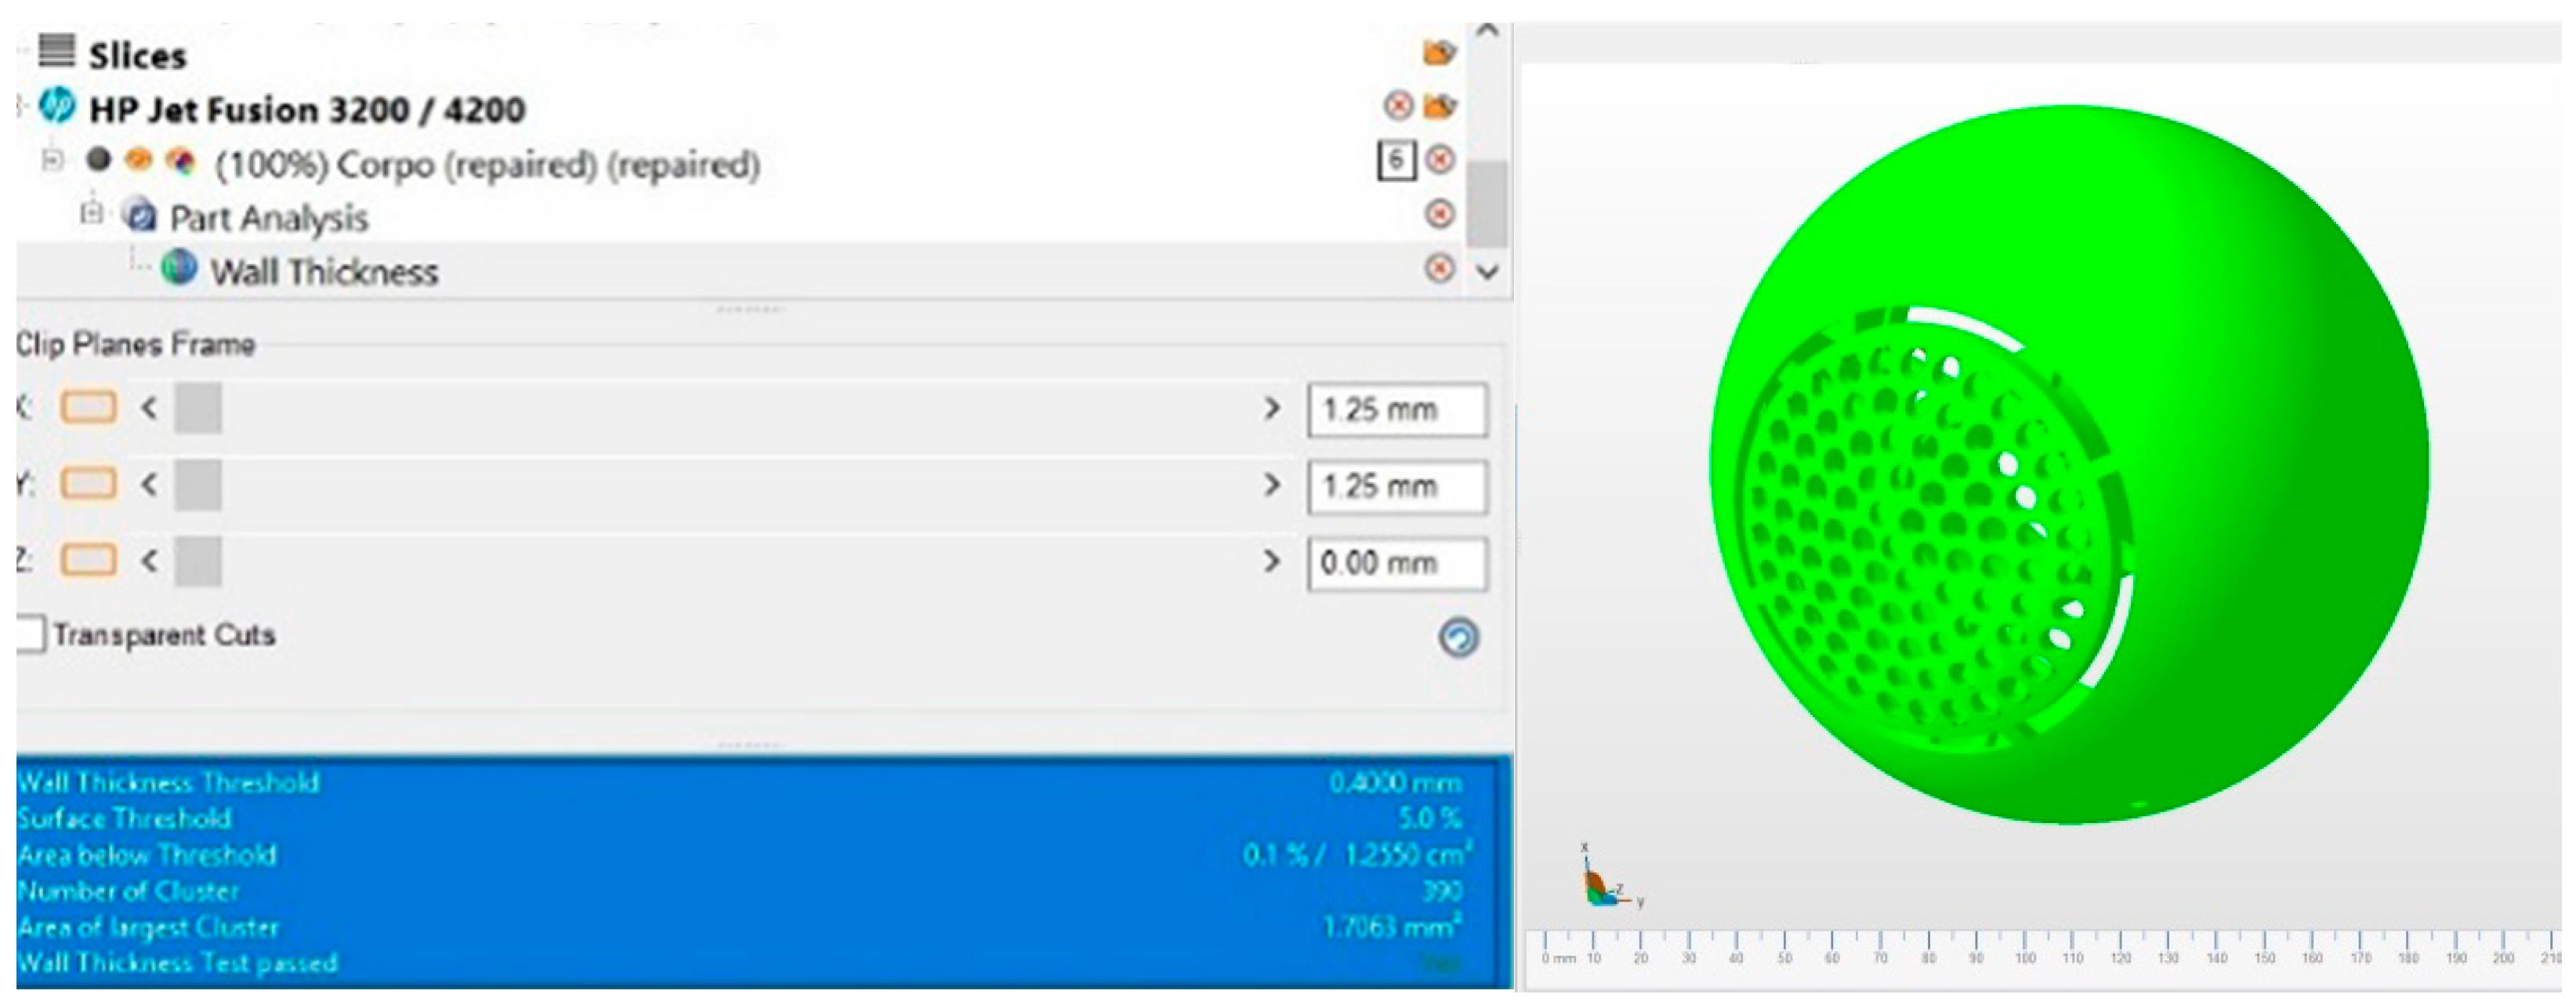
- File transfer to machine: Once the STL file has been created, it can be directly sent to the AM. It is the machine itself that translates the STL file into G-Code. At this point, it is possible to analyze the fan by CAM software and to optimise the process. The following picture (Figure 17) shows a wall thickness test that depicts which surface can be damaged during printing. The green surface means that the walls are thick enough. Finally, on the CAM software, it is possible to simulate the whole process and understand which are the critical phases.
- (2)
- Machine set-up: Once all tests are passed, it is possible to set up the machine. In this case, the picture shows how many layers were generated and the total height of the print. Moreover, the machine display shows also the layout of components during machining. It is possible to print objects one inside the other without compromising the final result (space optimization). Before analyzing the printing process, it is important to understand the difference between lattice structure and full structure of the innovative fan. During the case study, both structures were printed.
Before applying the lattice structure, the total volume of material was 67.08 cm3. Then, by introducing the lattice structure, the weight changed to 39.06 cm3, saving almost 30 cm3 of material used.
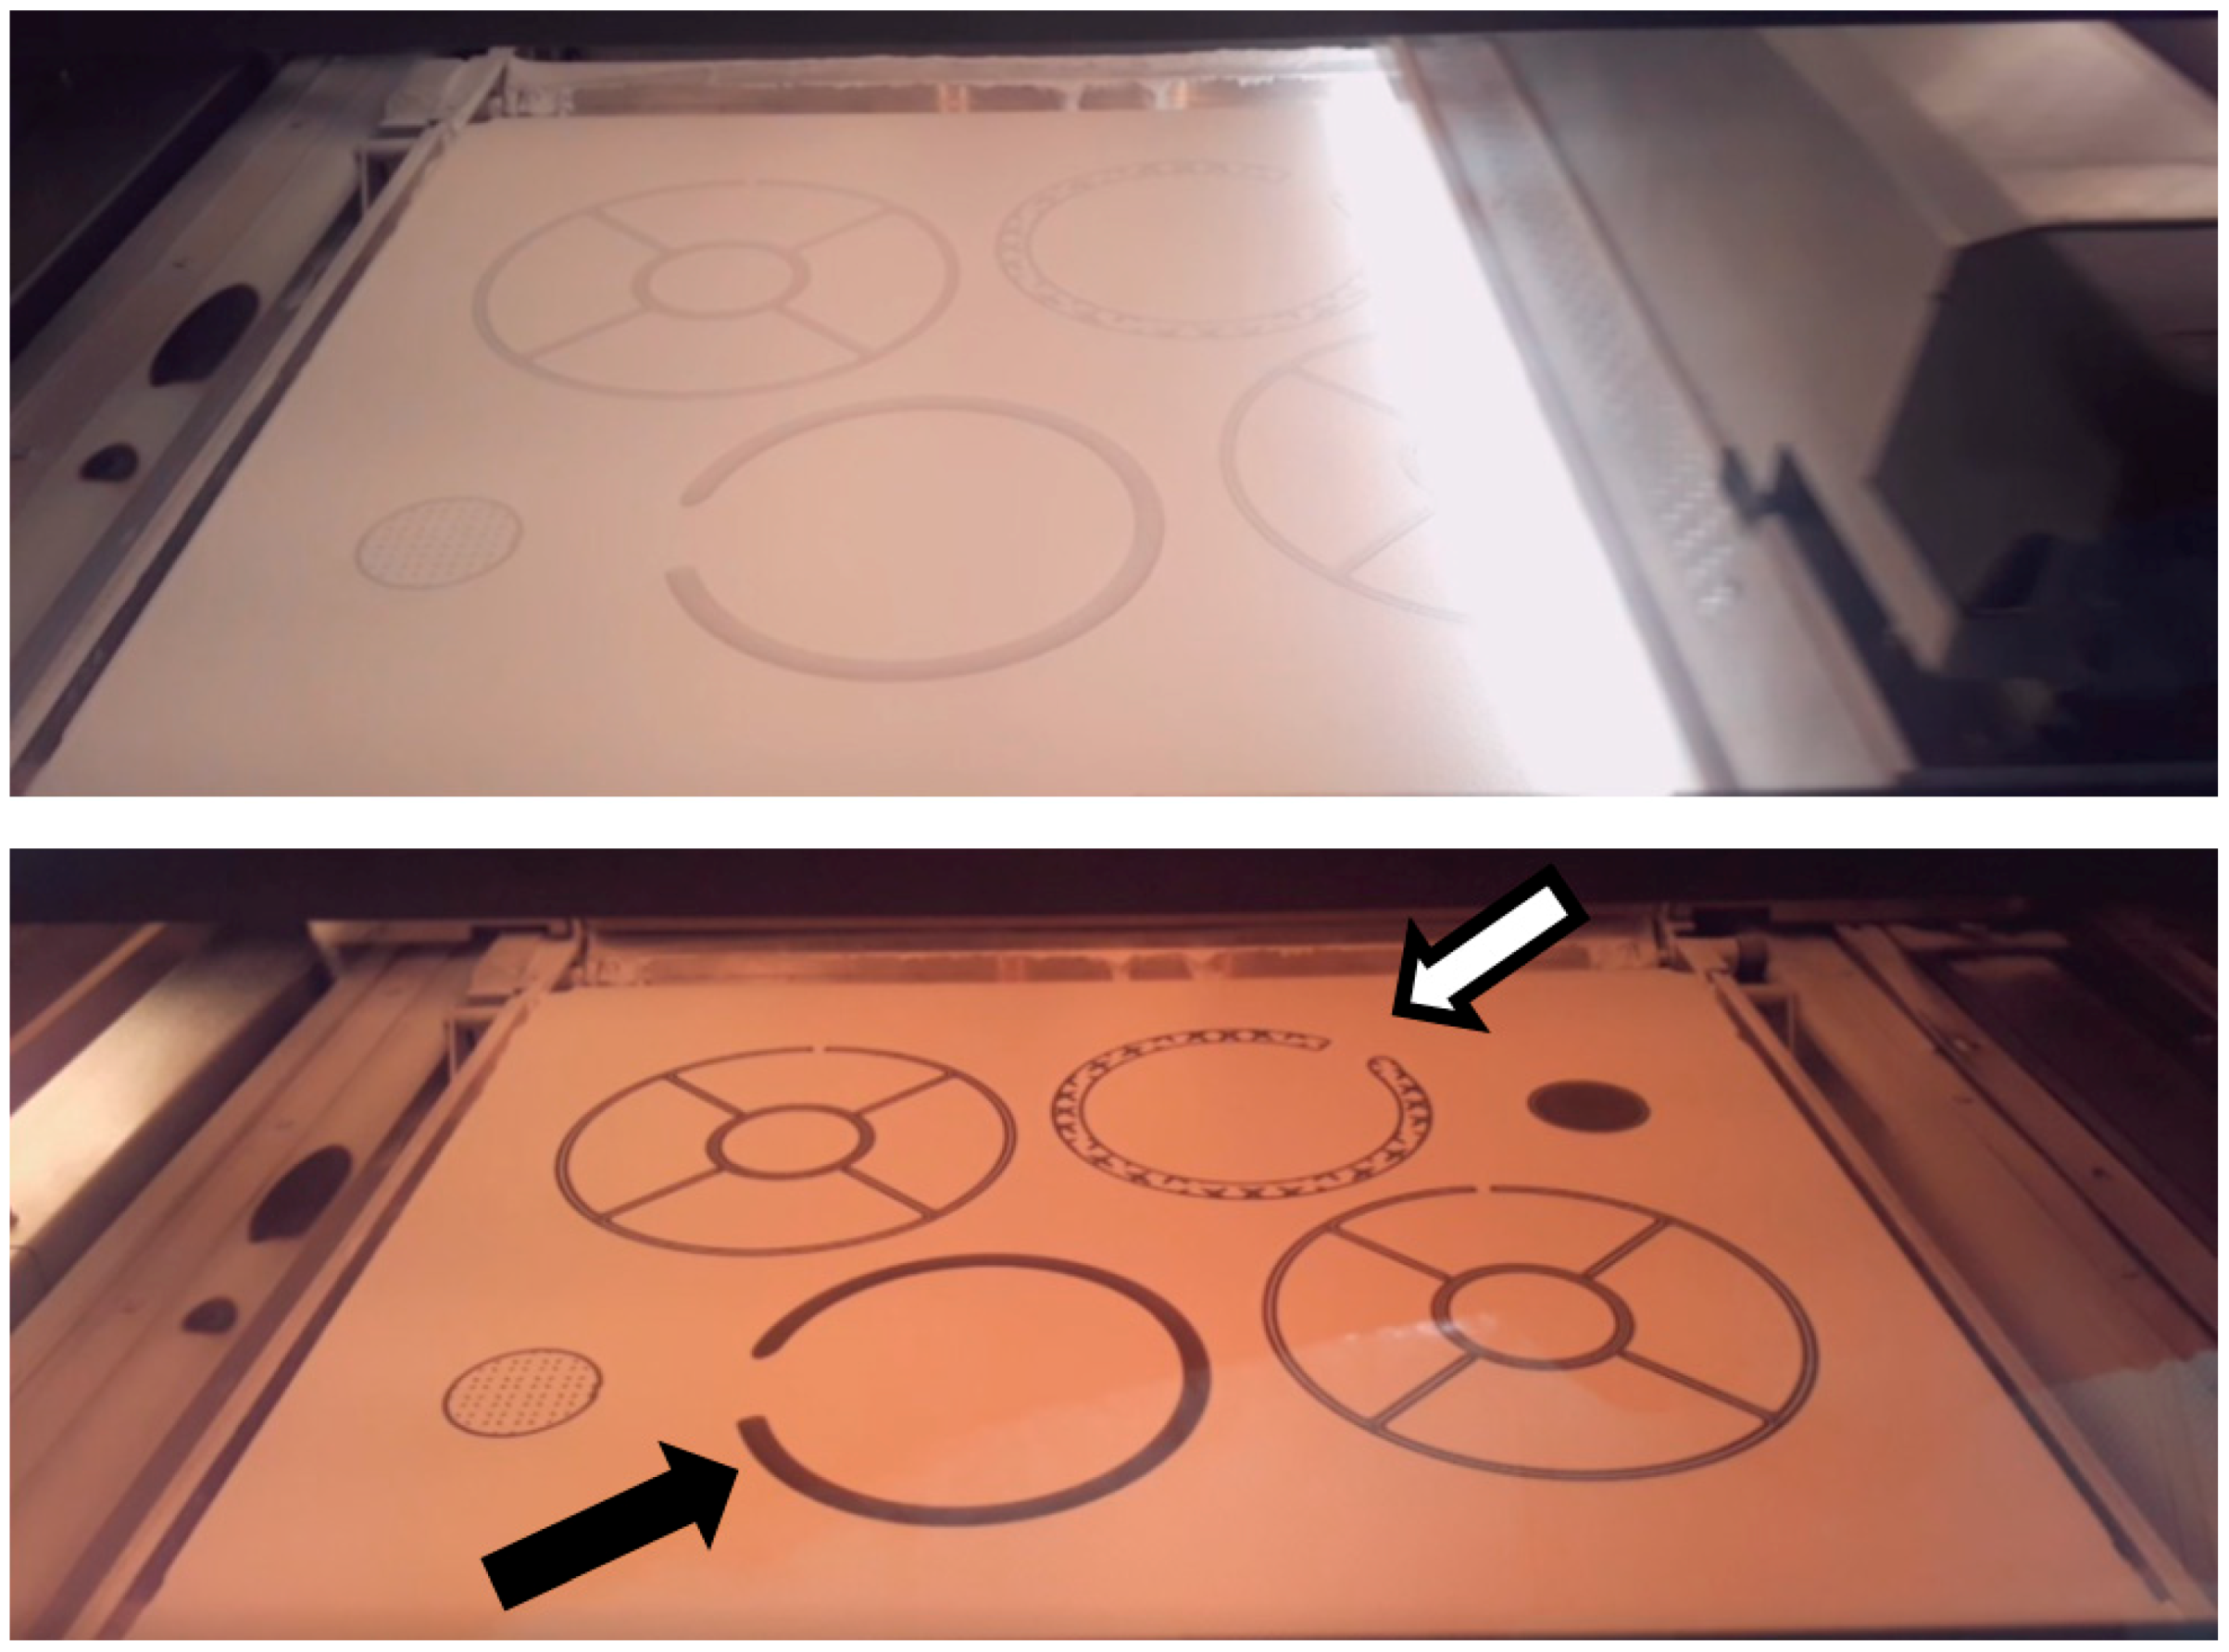
- (3)
- Build: The images on the right (Figure 18) show a thin layer of powder placed on the working area and the image below shows the application of transforming agents and energy to merge powder particles together. It is clear from the image the difference between the lattice structure (white arrow) and full structure (black arrow).
- (4)
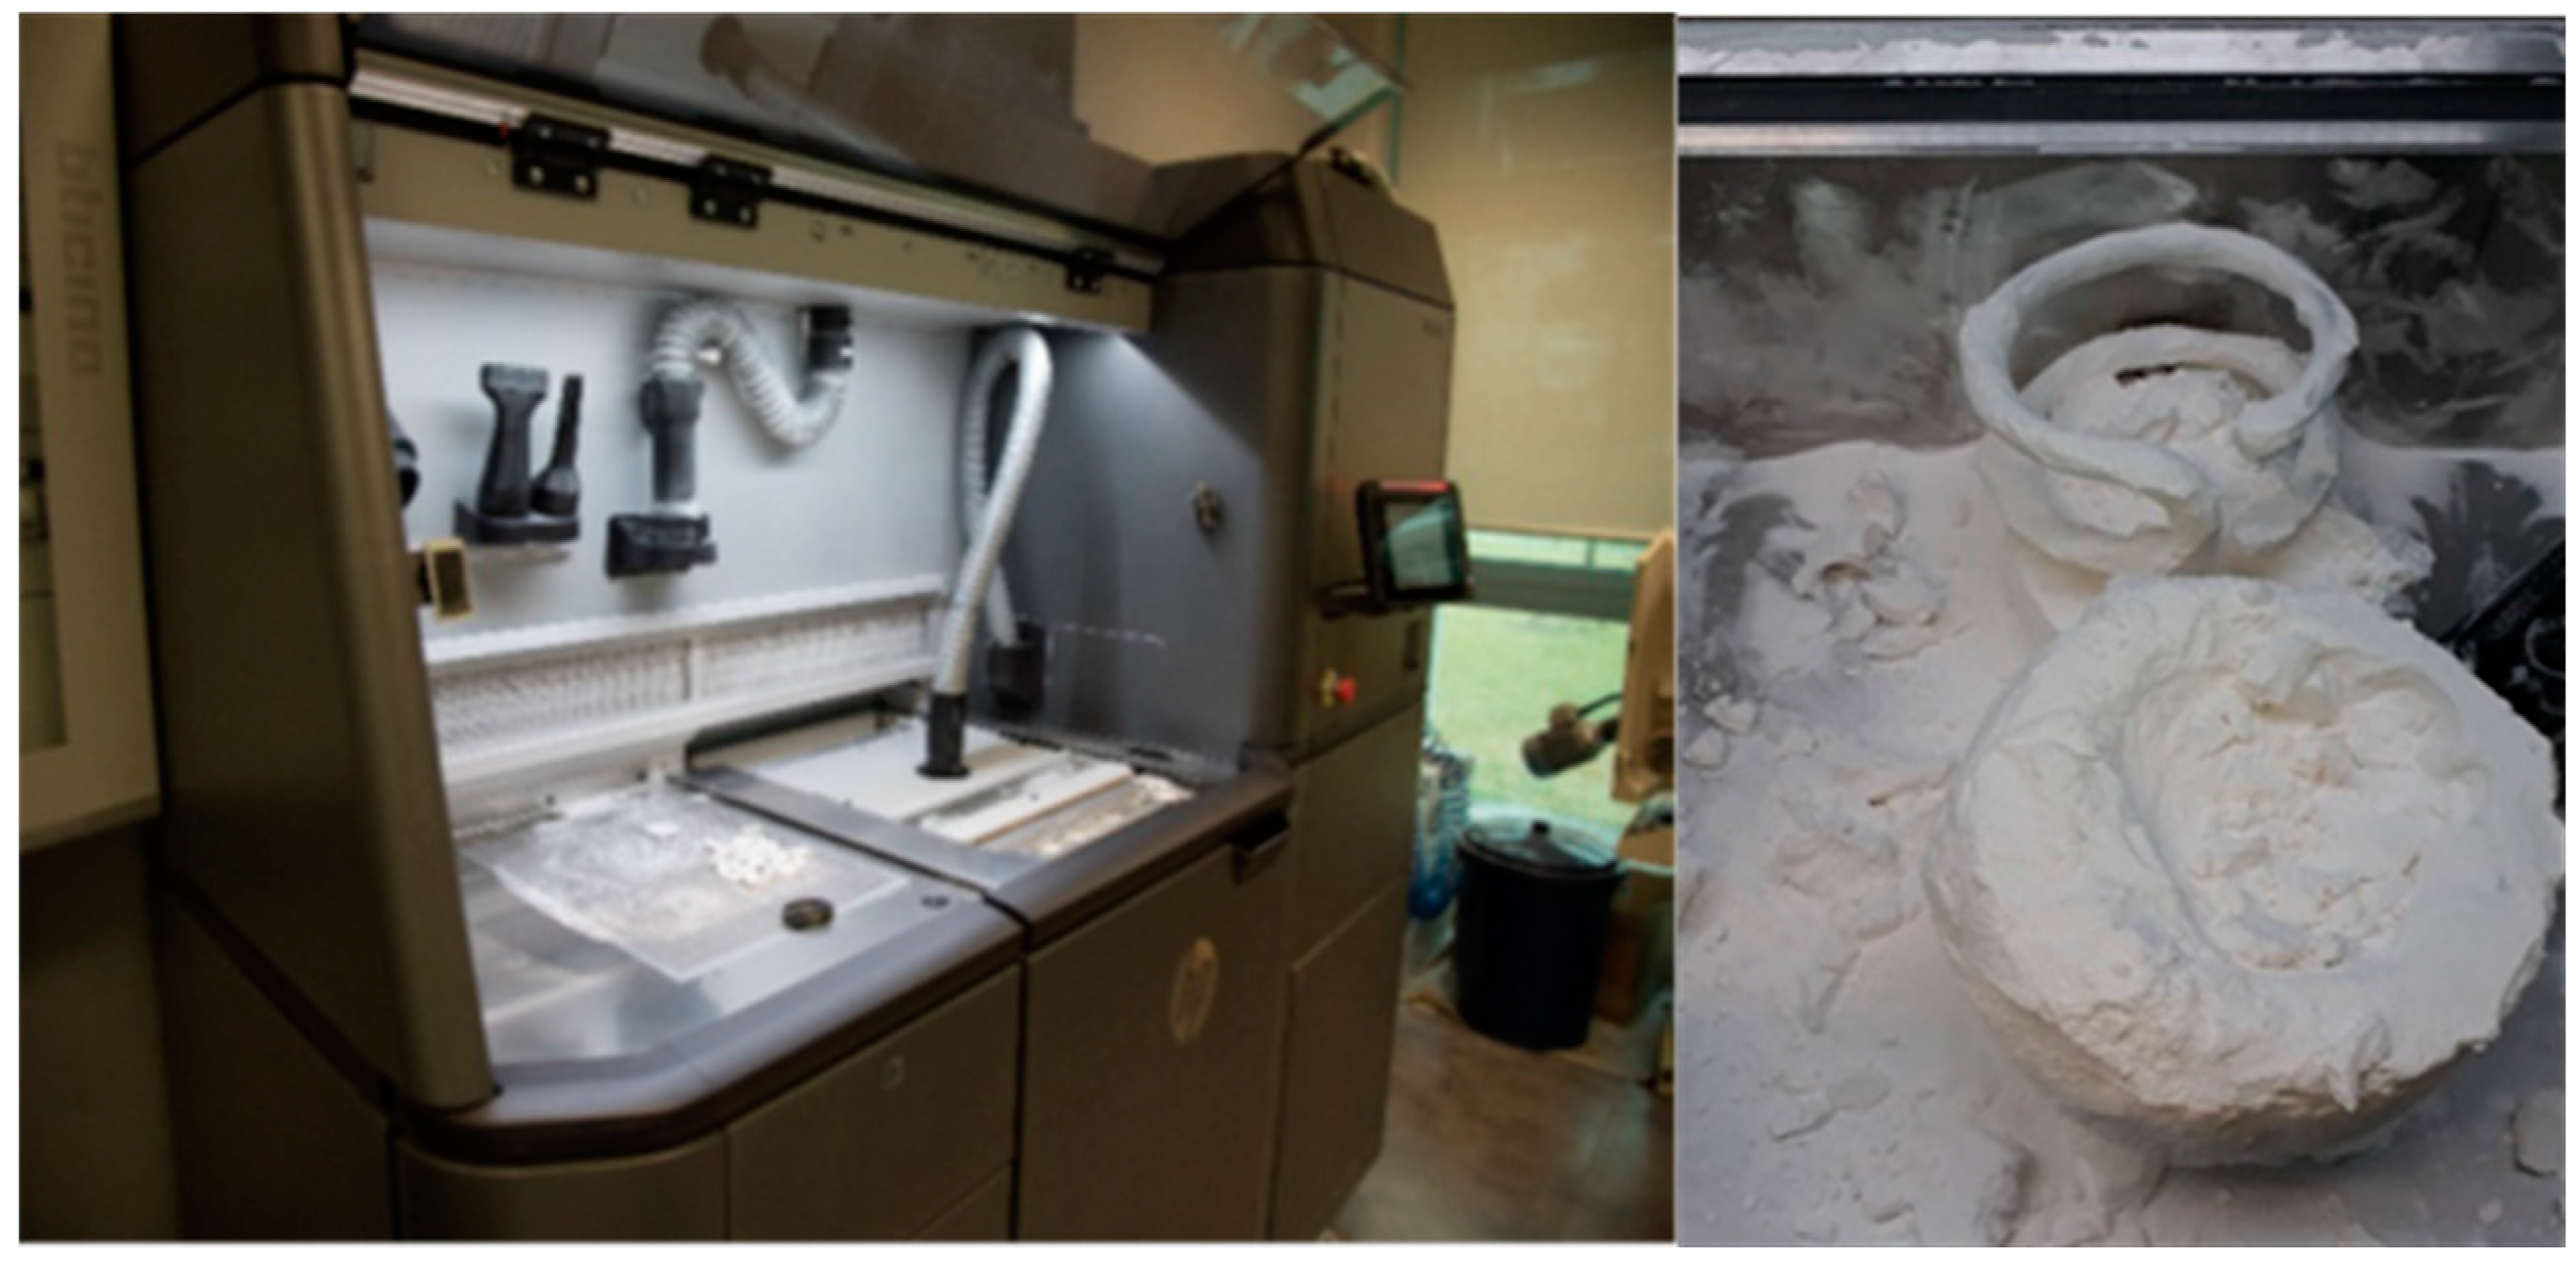
- Remove: After the printing process, which lasted 6 h and 21 min, the build unit is transferred to the processing station for the cooling and cleaning of the components (Figure 19). The components are initially totally immersed in the powder that needs to be recovered. The recovered material ends up in a cardboard container, ready to be reused in the subsequent processing.
- (5)
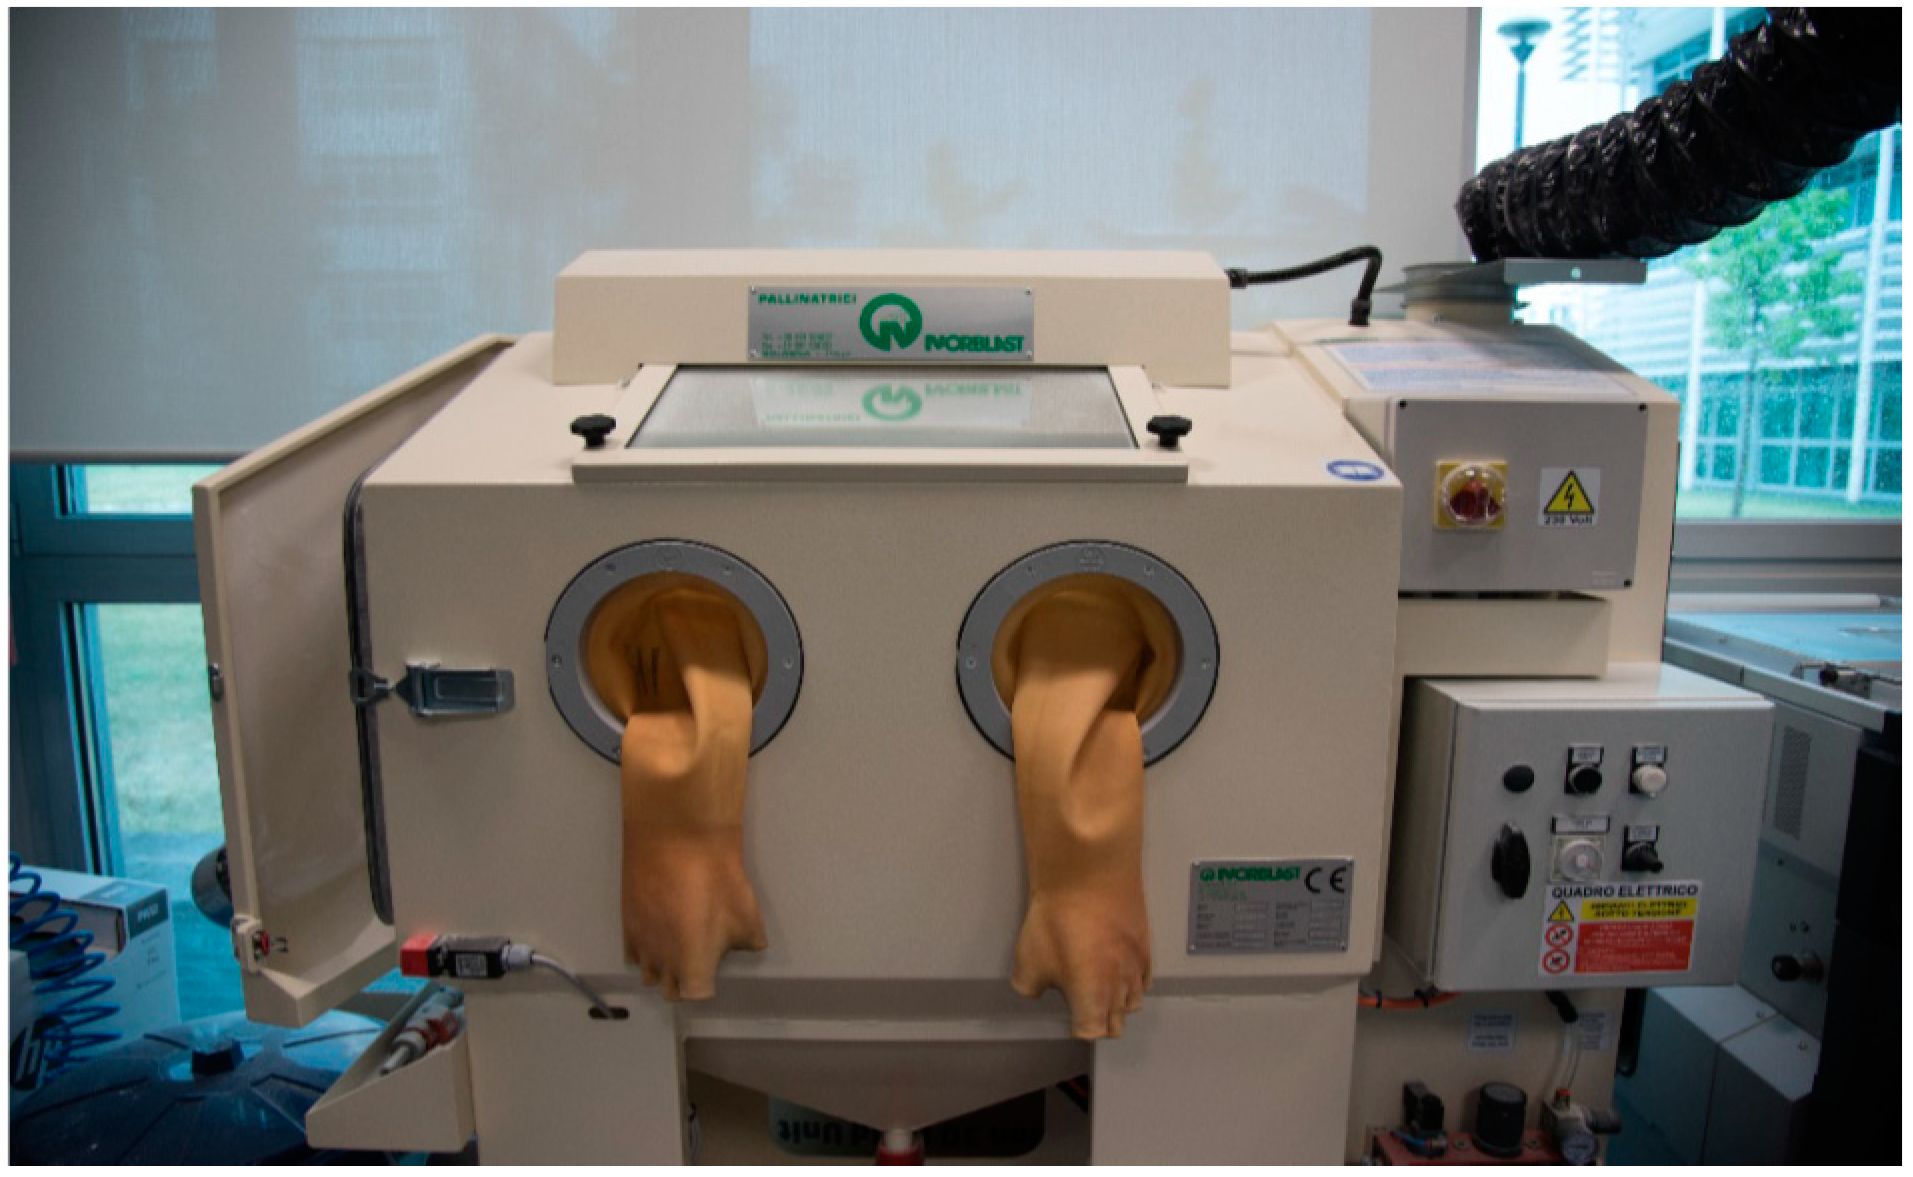
- Post-process: Finally, there were several post-processing available, but to limit costs, only sandblasting was performed. This machine allows inserting the pieces from the left side and handling the compressed air and sand nozzles for complete cleaning (Figure 20).
- (6)
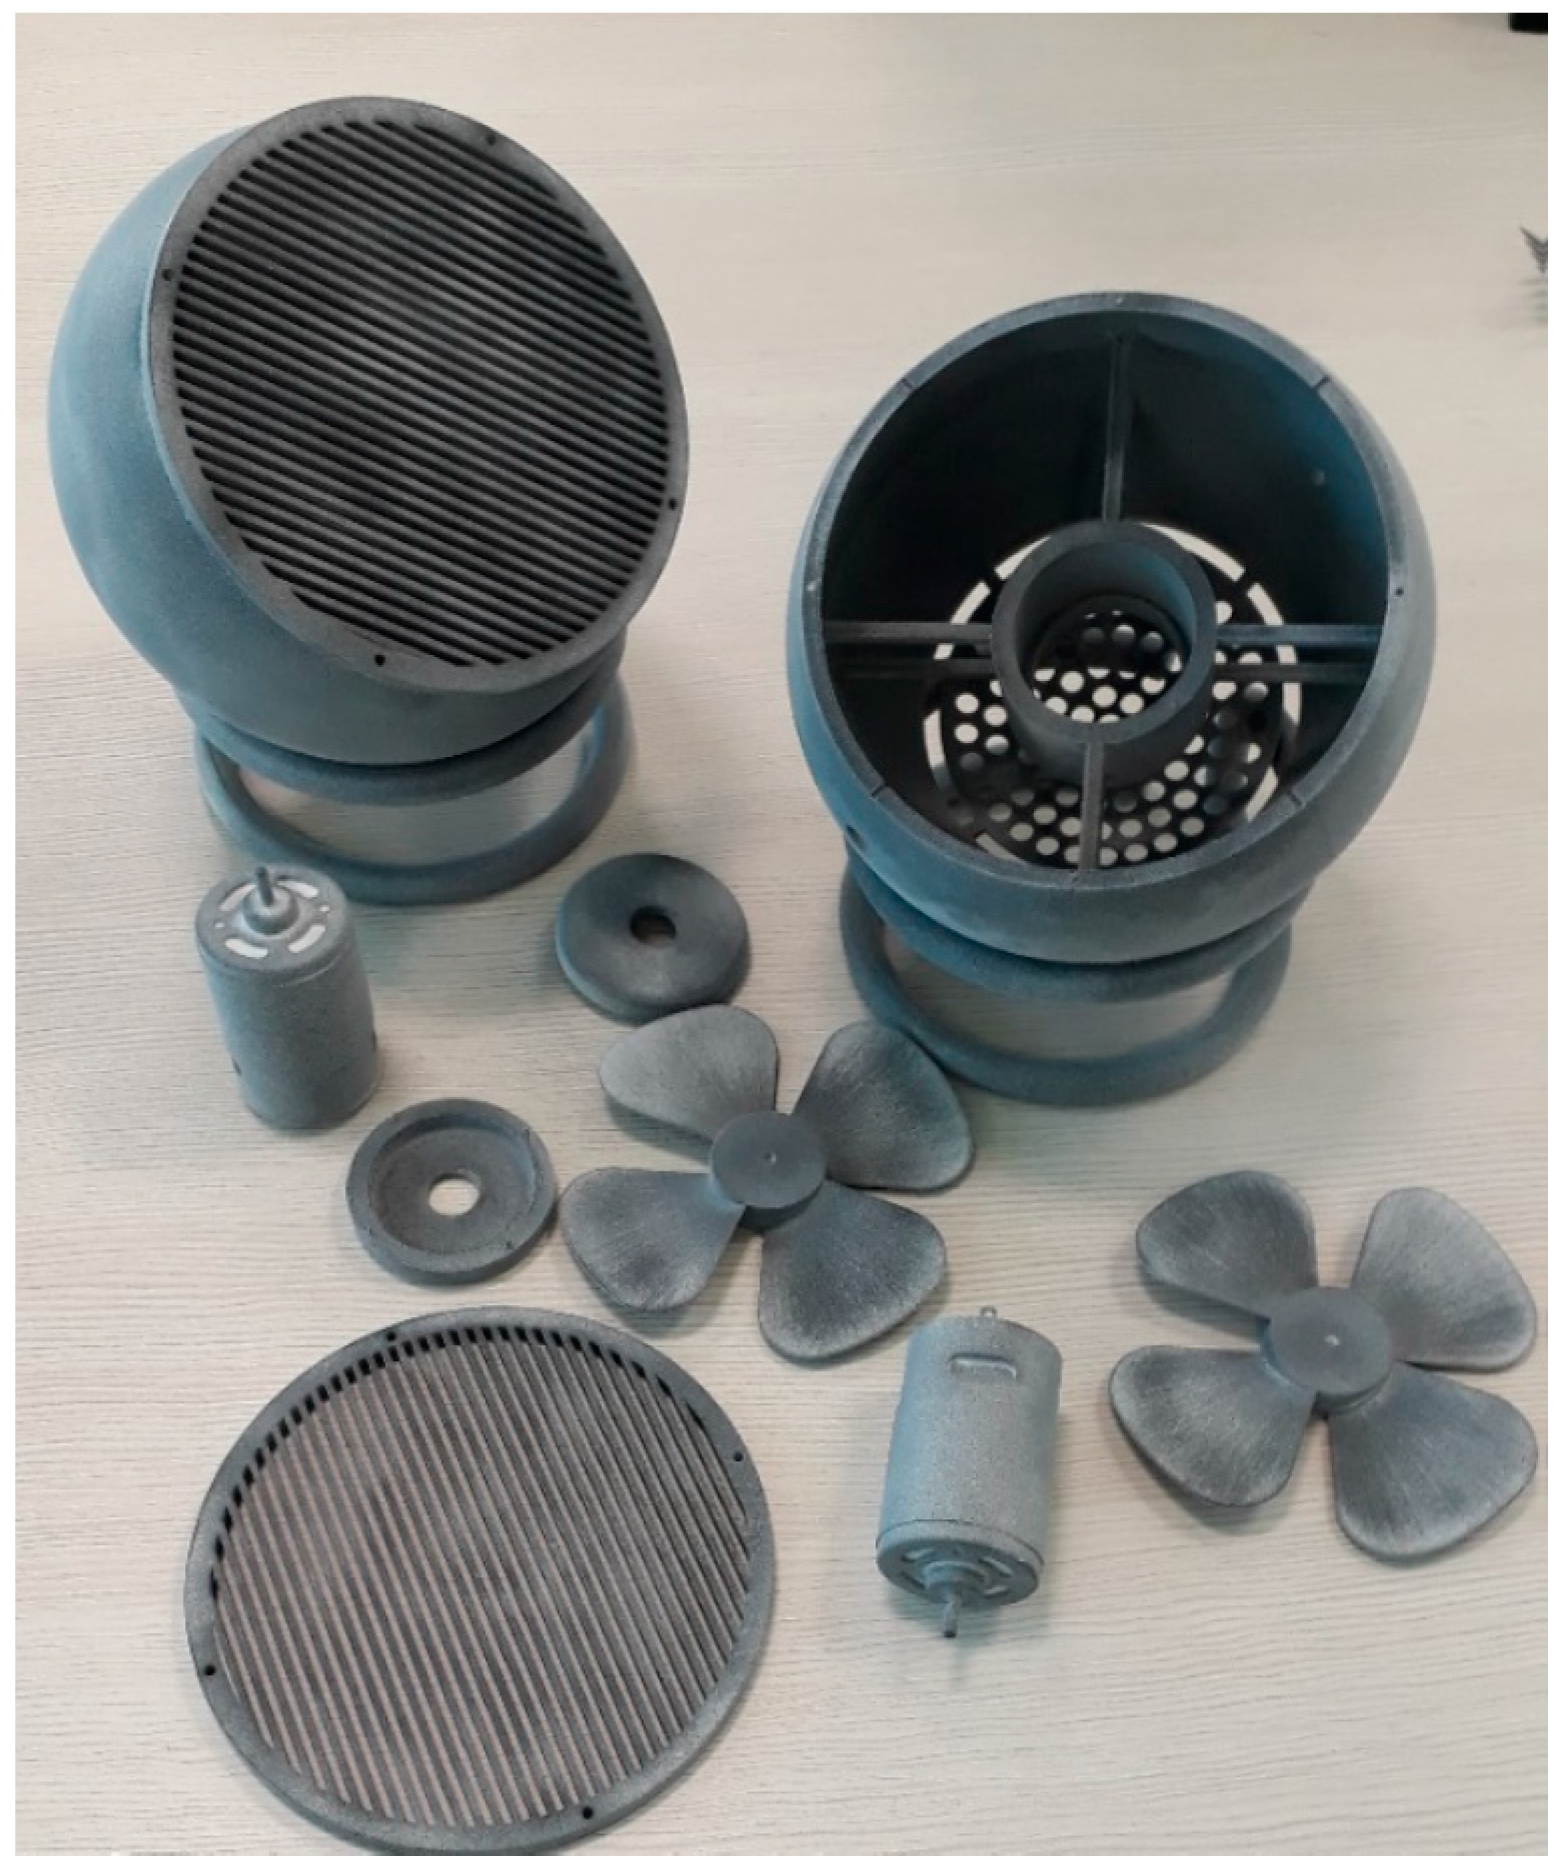
- Final product: Finally, the two variants were produced. Externally they look the same (Figure 21). However, the left one is printed using a full structure, whereas the right one is printed using a lattice structure.
6. Conclusions and Final Results (Cost Analysis)
The innovations of this work are:
- (1)
- Freedom of design and function-driven design
- (2)
- Speed of production of the product (just six hours for complete printing)
- (3)
- Better quality than other additive technologies thanks to the use of detailed agents
- (4)
- Possibility to reduce costs by optimizing design
In this last paragraph, an economic feasibility will be performed in order to consider the costs of the components and the workings. The processing costs are (Table 6):
- -
- 0.08 €/g for variable costs (material).
- -
- 0.20 €/g for service cost or cost allocated by amortization.
The components have the following costs:
- -
- DC motor from supplier: 8 €/pcs, without considering the discounts for larger lots.
- -
- Led: 2 €/m from supplier catalogue. On the inner circumference of the sphere = € 0.45
- -
- Electrical components: a cost of 2 €/fan is estimate.
Neglecting labor costs and electricity costs, it can be noted that, simply by adopting the lattice structure, it is possible to reduce production costs by several tens of euros. The most significant component is that linked to the company’s service cost (0.20 €/g). However, companies who have purchased this technology are able to allocate fixed costs to higher production volume, thus lowering costs. Nevertheless, production costs remain very high and the real challenge in the next few years is to reduce them considerably to allow for real mass production.
The main advantage of this technology is the ability to reduce costs simply by reducing the amount of printed material. In fact, starting from the basic 3D model, better solutions could be adopted (topology optimization), such as reducing the thickness of the walls or creating pockets in the housings. This, in addition to the lattice structure, would have allowed to further reduce the amount of material required and, therefore, to reduce costs. However, in this article, no further structures or design variants have been developed. In the validation phase, the emerging multi jet fusion technology presented several advantages including:
- -
- Processing speed (six hours).
- -
- Accessible costs for the machines (300.000 €).
- -
- Better quality due to the detail agents.
- -
- Freedom of design, in fact the fan body would have been particularly difficult to achieve with conventional techniques.
- -
- Possibility to reduce costs simply by printing less material. The better the design, the lower the cost
However, it is essential to discuss also the main drawbacks we came across in this case study: to begin with, costs are relatively high if we consider service cost. Moreover, some components were deformed by the cooling process: the fan hole (2 mm) does not fit the motor shaft. Therefore, tolerances are not precise. Furthermore, only few materials were allowed in Multi Jet Fusion, such as PA 12 or PA11.
To resume, only two solutions were developed: a full structure as per design and a lattice structure. By adopting the latter, we managed to reduce the costs by a few tens of euros. Unfortunately, in this article, it was not possible to design a better solution that would optimize costs (by topology optimization). For this reason, it would be interesting to push the design for additive to the limit in a future case study, perhaps creating pockets, reducing the thicknesses to a minimum or generating different topologies thanks to the generative design software and algorithms. Moreover, as a continuation of this project, it would also be interesting to produce another series of parts with a complex design or to produce other design variants to minimize costs and to check their geometry and tolerances with the help of automatic coordinate machines (reverse engineering). It would also be appropriate to consider in the cost analysis:
- -
- energy consumed
- -
- operator costs
- -
- dimensional tolerances and machining tolerances
Comparing their results with existing estimates can be very useful in understanding the real possibilities of these technologies to replace them with traditional processes already existing.
Author Contributions
Conceptualization, L.F.; Data curation, K.D.; Formal analysis, K.D.; Investigation, G.D.; Methodology, L.F. and A.L.; Software, G.D.; Supervision, G.C.
Funding
This research received no external funding.
Conflicts of Interest
The authors declare no conflict of interest.
References
- Freddi, A. Imparare a Progettare, Principi E Metodi Del Progetto Concettuale per Lo Sviluppo Della Creatività Industriale; Pitagora: Bologna, Italy, 2005; ISBN 88-371-1512-1. [Google Scholar]
- Gibson, I.; Rosen, D.W.; Stucker, B. Additive Manufacturing Technologies: Rapid Prototyping to Direct Digital Manufacturing; Springer: New York, NY, USA, 2010; p. 459. [Google Scholar]
- Schilling, M.A. Strategic Management of Technological Innovation; McGraw-Hill Education: New York, NY, USA, 2016; p. 629. [Google Scholar]
- Grandi, A. Gestione Dei Progetti D’innovazione; McGraw-Hill Education: Bologna, Italy, 2017. [Google Scholar]
- Filippini, R.; Ulrich, K.T.; Eppinger, S.D. Progettazione E Sviluppo Prodotto; McGraw-Hill Education: Milan, Italy, 2007. [Google Scholar]
- De Cesari, C. Metodologie del Six Sigma e DFSS. Graduation Degree Thesis, Alma Mater Studiorum University of Bologna, Bologna, Italy, 2018. [Google Scholar]
- Vaneker, T.H.J. The Role of Design for Additive Manufacturing in the Successful Economical Introduction of AM; University of Twente: Enschede, The Netherlands, 2017. [Google Scholar]
- Baril, C.; Yacout, S.; Clément, B. Design for Six Sigma through Collaborative Multi Objective Optimization; Department of Industrial Engineering, Université du Québec à Trois-Rivières, 3351 Boulevard des Forges: Trois-Rivières, QC, Canada, 2011. [Google Scholar]
- Wenjin, T.; Ming, C.L. Design of lattice structure for additive manufacturing. In Proceedings of the 2016 International Symposium on Flexible Automation (ISFA), Cleveland, OH, USA, 1–3 August 2016. [Google Scholar]
- Chirone, E.; Tornincasa, S. Disegno Tecnico Industriale 1; Il capitello: Torino, Italy, 2011. [Google Scholar]
- Ogawa, S.; Piller, F. Reducing the risks of new product development. MIT Sloan Manag. Rev. 2006, 47, 65. [Google Scholar]
- De Frutos, G.M. Product Development Process for Additive Manufacturing. Master’s Thesis, Universidad tecnica de Lisbona, Lisbon, Portugal, 2015. [Google Scholar]
- Manuale di Stampa HP4200. Available online: http://www8.hp.com/h20195/v2/GetPDF.aspx/4AA6-4894ITE.pdf (accessed on 15 December 2018).
- Hp Website, 3D Printing. Available online: http://www8.hp.com/it/it/printers/3d-printers.html (accessed on 15 December 2018).
- PA 12. Available online: http://www8.hp.com/h20195/v2/GetPDF.aspx/4AA7-0715EEP.pdf (accessed on 15 December 2018).
- Ghezzo, F.; Giannini, G.; Cesari, F.; Caligiana, G. Numerical and experimental analysis of the interaction between two notches in carbon fibre laminates. Compos. Sci. Technol. 2008, 68, 1057–1072. [Google Scholar] [CrossRef]
- Caligiana, G.; Liverani, A.; Francia, D.; Frizziero, L.; Donnici, G. Integrating QFD and TRIZ for innovative design. J. Adv. Mech. Des. Syst. Manuf. 2017, 11. [Google Scholar] [CrossRef] [Green Version]
- Francia, D.; Caligiana, G.; Liverani, A.; Frizziero, L.; Donnici, G. PrinterCAD: A QFD and TRIZ integrated design solution for large size open moulding manufacturing. Int. J. Interact. Des. Manuf. 2018, 12, 81–94. [Google Scholar] [CrossRef]
- De Amicis, R.; Ceruti, A.; Francia, D.; Frizziero, L.; Simoes, B. Augmented Reality for virtual user manual. Int. J. Interact. Des. Manuf. 2018, 12, 689–697. [Google Scholar] [CrossRef]
- Frizziero, L.; Francia, D.; Donnici, G.; Liverani, A.; Caligiana, G. Sustainable design of open molds with QFD and TRIZ combination. J. Ind. Prod. Eng. 2018, 35, 21–31. [Google Scholar] [CrossRef]
- Donnici, G.; Frizziero, L.; Francia, D.; Liverani, A.; Caligiana, G. Increasing innovation of a new transportation means using TRIZ methodology. JP J. Heat Mass Transf. 2018, 15, 341–370. [Google Scholar] [CrossRef]
- Donnici, G.; Frizziero, L.; Francia, D.; Liverani, A.; Caligiana, G. Project of inventive ideas through a TRIZ study applied to the analysis of an innovative urban transport means. Int. J. Manuf. Mater. Mech. Eng. 2018, 8, 1–24. [Google Scholar]
- Donnici, G.; Frizziero, L.; Francia, D.; Liverani, A.; Caligiana, G. TRIZ method for innovation applied to an hoverboard. Cogent. Eng. 2018, 5, 1–24. [Google Scholar] [CrossRef]
Figure 1.
A generic product development process.

Figure 2.
DFSS process.

Figure 3.
Fan tree diagram.

Figure 4.
Example of data analysis.

Figure 5.
Customer age.

Figure 6.
Relationship matrix.

Figure 7.
Technical critical variables.

Figure 8.
Interrelationship matrix.

Figure 9.
Technical benchmarking.

Figure 10.
Final QFD matrix.

Figure 11.
Concept design and initial sketches to executive project.

Figure 12.
Von Mises stress and displacement analysis of the support.

Figure 13.
Forces acting on the central body and stress analysis.

Figure 14.
Stress and displacement analysis of the fan.

Figure 15.
Final assembly and rendering.

Figure 16.
Design for additive manufacturing.

Figure 17.
Wall thickness test.

Figure 18.
Comparison between lattice and full structure during printing.

Figure 19.
Processing station and material recovery.

Figure 20.
Sandblasting machine used to clean the fan.

Figure 21.
Final result achieved.


Table 1.
Environment documentation.
| What | Fan, lamp, heater, and aroma diffuser |
| Who | Whoever works in an office or on a desk |
| Where | Office, desk, living room |
| When | During winter and summer |
| Why | Illuminates, refreshes, and perfumes |
| How | Fan, thermal resistances, and diffuser |
Table 2.
Data collected from the survey.
| Questions | N of Answers | 1 | 2 | 3 | 4 | 5 | µ | |
|---|---|---|---|---|---|---|---|---|
| Aesthetically good looking | 44 | 0.0% | 0.0% | 15.9% | 43.2% | 40.9% | 4.3 | 0.5 |
| Cheap | 44 | 0.0% | 0.0% | 18.2% | 31.8% | 50.0% | 4.3 | 0.6 |
| Space saving | 44 | 2.3% | 6.8% | 27.3% | 29.5% | 34.1% | 3.9 | 1.1 |
| Easy to move | 44 | 6.8% | 29.5% | 25.0% | 25.0% | 13.6% | 3.1 | 1.4 |
| Noiseless | 44 | 0.0% | 4.5% | 9.1% | 13.6% | 72.7% | 4.5 | 0.7 |
| Easy to put away | 44 | 18.2% | 22.7% | 38.6% | 15.9% | 4.5% | 2.7 | 1.2 |
| Number of velocities | 44 | 2.3% | 13.6% | 56.8% | 20.5% | 6.8% | 3.2 | 0.7 |
| Multifunctional | 44 | 0.0% | 4.5% | 15.9% | 45.5% | 34.1% | 4.1 | 0.7 |
| Energy saving | 43 | 4.7% | 2.3% | 14.0% | 44.2% | 34.9% | 4.0 | 1.0 |
| Range of colors | 44 | 9.1% | 15.9% | 40.9% | 20.5% | 13.6% | 3.1 | 1.3 |
| Flexible | 44 | 2.3% | 20.5% | 31.8% | 34.1% | 11.4% | 3.3 | 1.0 |
| Powerful | 44 | 2.3% | 4.5% | 34.1% | 45.5% | 13.6% | 3.6 | 0.7 |
| Innovative material | 44 | 6.8% | 9.1% | 22.7% | 40.9% | 20.5% | 3.6 | 1.2 |
| Safe and reliable | 44 | 9.1% | 0.0% | 11.4% | 34.1% | 45.5% | 4.1 | 1.4 |
| Lightweight | 44 | 11.4% | 13.6% | 36.4% | 22.7% | 15.9% | 3.2 | 1.4 |
| Quality and protection | 44 | 0.0% | 0.0% | 11.4% | 38.6% | 50.0% | 4.4 | 0.5 |
| Eco-friendly | 44 | 2.3% | 6.8% | 15.9% | 31.8% | 43.2% | 4.1 | 1.1 |
Table 3.
Importance of customer needs.
| Questions | N of Answers | 1 | 2 | 3 | 4 | 5 | µ | |
|---|---|---|---|---|---|---|---|---|
| Noiseless | 44 | 0.0% | 4.5% | 9.1% | 13.6% | 72.7% | 4.5 | 0.7 |
| Quality and protection | 44 | 0.0% | 0.0% | 11.4% | 38.6% | 50.0% | 4.4 | 0.5 |
| Cheap | 44 | 0.0% | 0.0% | 18.2% | 31.8% | 50.0% | 4.3 | 0.6 |
| Aesthetically good looking | 44 | 0.0% | 0.0% | 15.9% | 43.2% | 40.9% | 4.3 | 0.5 |
| Multifunctional | 44 | 0.0% | 4.5% | 15.9% | 45.5% | 34.1% | 4.1 | 0.7 |
| Safe and reliable | 44 | 9.1% | 0.0% | 11.4% | 34.1% | 45.5% | 4.1 | 1.4 |
| Eco-Friendly | 44 | 2.3% | 6.8% | 15.9% | 31.8% | 43.2% | 4.1 | 1.1 |
| Energy saving | 43 | 4.7% | 2.3% | 14.0% | 44.2% | 34.9% | 4.0 | 1.0 |
| Space saving | 44 | 2.3% | 6.8% | 27.3% | 29.5% | 34.1% | 3.9 | 1.1 |
| Powerful | 44 | 2.3% | 4.5% | 34.1% | 45.5% | 13.6% | 3.6 | 0.7 |
| Innovative material | 44 | 6.8% | 9.1% | 22.7% | 40.9% | 20.5% | 3.6 | 1.2 |
| Flexible | 44 | 2.3% | 20.5% | 31.8% | 34.1% | 11.4% | 3.3 | 1.0 |
| Lightweight | 44 | 11.4% | 13.6% | 36.4% | 22.7% | 15.9% | 3.2 | 1.4 |
| Number of velocities | 44 | 2.3% | 13.6% | 56.8% | 20.5% | 6.8% | 3.2 | 0.7 |
| Range of colors | 44 | 9.1% | 15.9% | 40.9% | 20.5% | 13.6% | 3.1 | 1.3 |
| Easy to move | 44 | 6.8% | 29.5% | 25.0% | 25.0% | 13.6% | 3.1 | 1.4 |
| Easy to put away | 44 | 18.2% | 22.7% | 38.6% | 15.9% | 4.5% | 2.7 | 1.2 |
Table 4.
Example of technical requirements of the innovative fan.
| Requirements from the Third Level | Technical Requirements | Measure Unit |
|---|---|---|
| Powerful | - Electric Engine Type - Power supply - Repeat per minute - Number of Blade - Blade dimension - Engine power - Blade material - Air flow | - AC; DC - AC; DC - RPM - number - cm |
| Number of velocities | - Number of buttons - Engine type - Engine power | - # |
| Safe and Reliable | - Failure rate - MTTF - CE marking | - FIT [failures/10 × h] - h - # |
| Quality and protection | - Quality marking - Compliance with design project - Technical assistance | |
| Lightweight | - Material - Dimension - Weight - Engine type | - cm - kg - DC/AC |
| Space saving | - Dimensions - Easy to assembly - Multifunctionality | - cm - number - pre-assemblying |
| Easy to put away | - Easy to assembly - Dimensions | |
| Easy to move | - Weight - Dimensions - Easy to handle - Material | - kg - cm |
| Eco-friendly | - Energy saving - Engine power | - kwh - W |
| Energy saving | - Energy saved - Engine type - Advanced materials - Engine power - Blade material | - kWh |
Table 5.
Mechanical properties of PA 12.
| Power Melting Point | 187 °C |
| Particle Size | 60 μm |
| Density | 1.01 g/cm3 |
| XY Tensile Strength | 48 MPa |
| Z Tensile Strength | 48 MPa |
| Elongation at Break XY | 20% |
| Elongation at Break Z | 15% |
| Short Hardness D | 80 |
Table 6.
Cost analysis.
| Lattice Structure | Full Structure | |
|---|---|---|
| Total Weight [g/pz] | 253 | 320 |
| DC Engine [€/pz] | 6 | 6 |
| LED [€/pz] | 0.45 | 0.45 |
| Electrical Components [€/pz] | 2 | 2 |
| Service Cost [€/pz] | 50.6 | 64 |
| Power Cost [€/pz] | 20.24 | 25.6 |
| Total Cost [€/pz] | 79.29 | 98.05 |
© 2018 by the authors. Licensee MDPI, Basel, Switzerland. This article is an open access article distributed under the terms and conditions of the Creative Commons Attribution (CC BY) license (http://creativecommons.org/licenses/by/4.0/).
Share and Cite
MDPI and ACS Style
Frizziero, L.; Donnici, G.; Dhaimini, K.; Liverani, A.; Caligiana, G. Advanced Design Applied to an Original Multi-Purpose Ventilator Achievable by Additive Manufacturing. Appl. Sci. 2018, 8, 2635. https://doi.org/10.3390/app8122635
AMA Style
Frizziero L, Donnici G, Dhaimini K, Liverani A, Caligiana G. Advanced Design Applied to an Original Multi-Purpose Ventilator Achievable by Additive Manufacturing. Applied Sciences. 2018; 8(12):2635. https://doi.org/10.3390/app8122635
Chicago/Turabian StyleFrizziero, Leonardo, Giampiero Donnici, Karim Dhaimini, Alfredo Liverani, and Gianni Caligiana. 2018. "Advanced Design Applied to an Original Multi-Purpose Ventilator Achievable by Additive Manufacturing" Applied Sciences 8, no. 12: 2635. https://doi.org/10.3390/app8122635
Note that from the first issue of 2016, this journal uses article numbers instead of page numbers. See further details here.