Stacked Sparse Autoencoders for EMG-Based Classification of Hand Motions: A Comparative Multi Day Analyses between Surface and Intramuscular EMG

 ,
,  ,
,
Abstract
:1. Introduction
2. Materials and Methods
2.1. Subjects
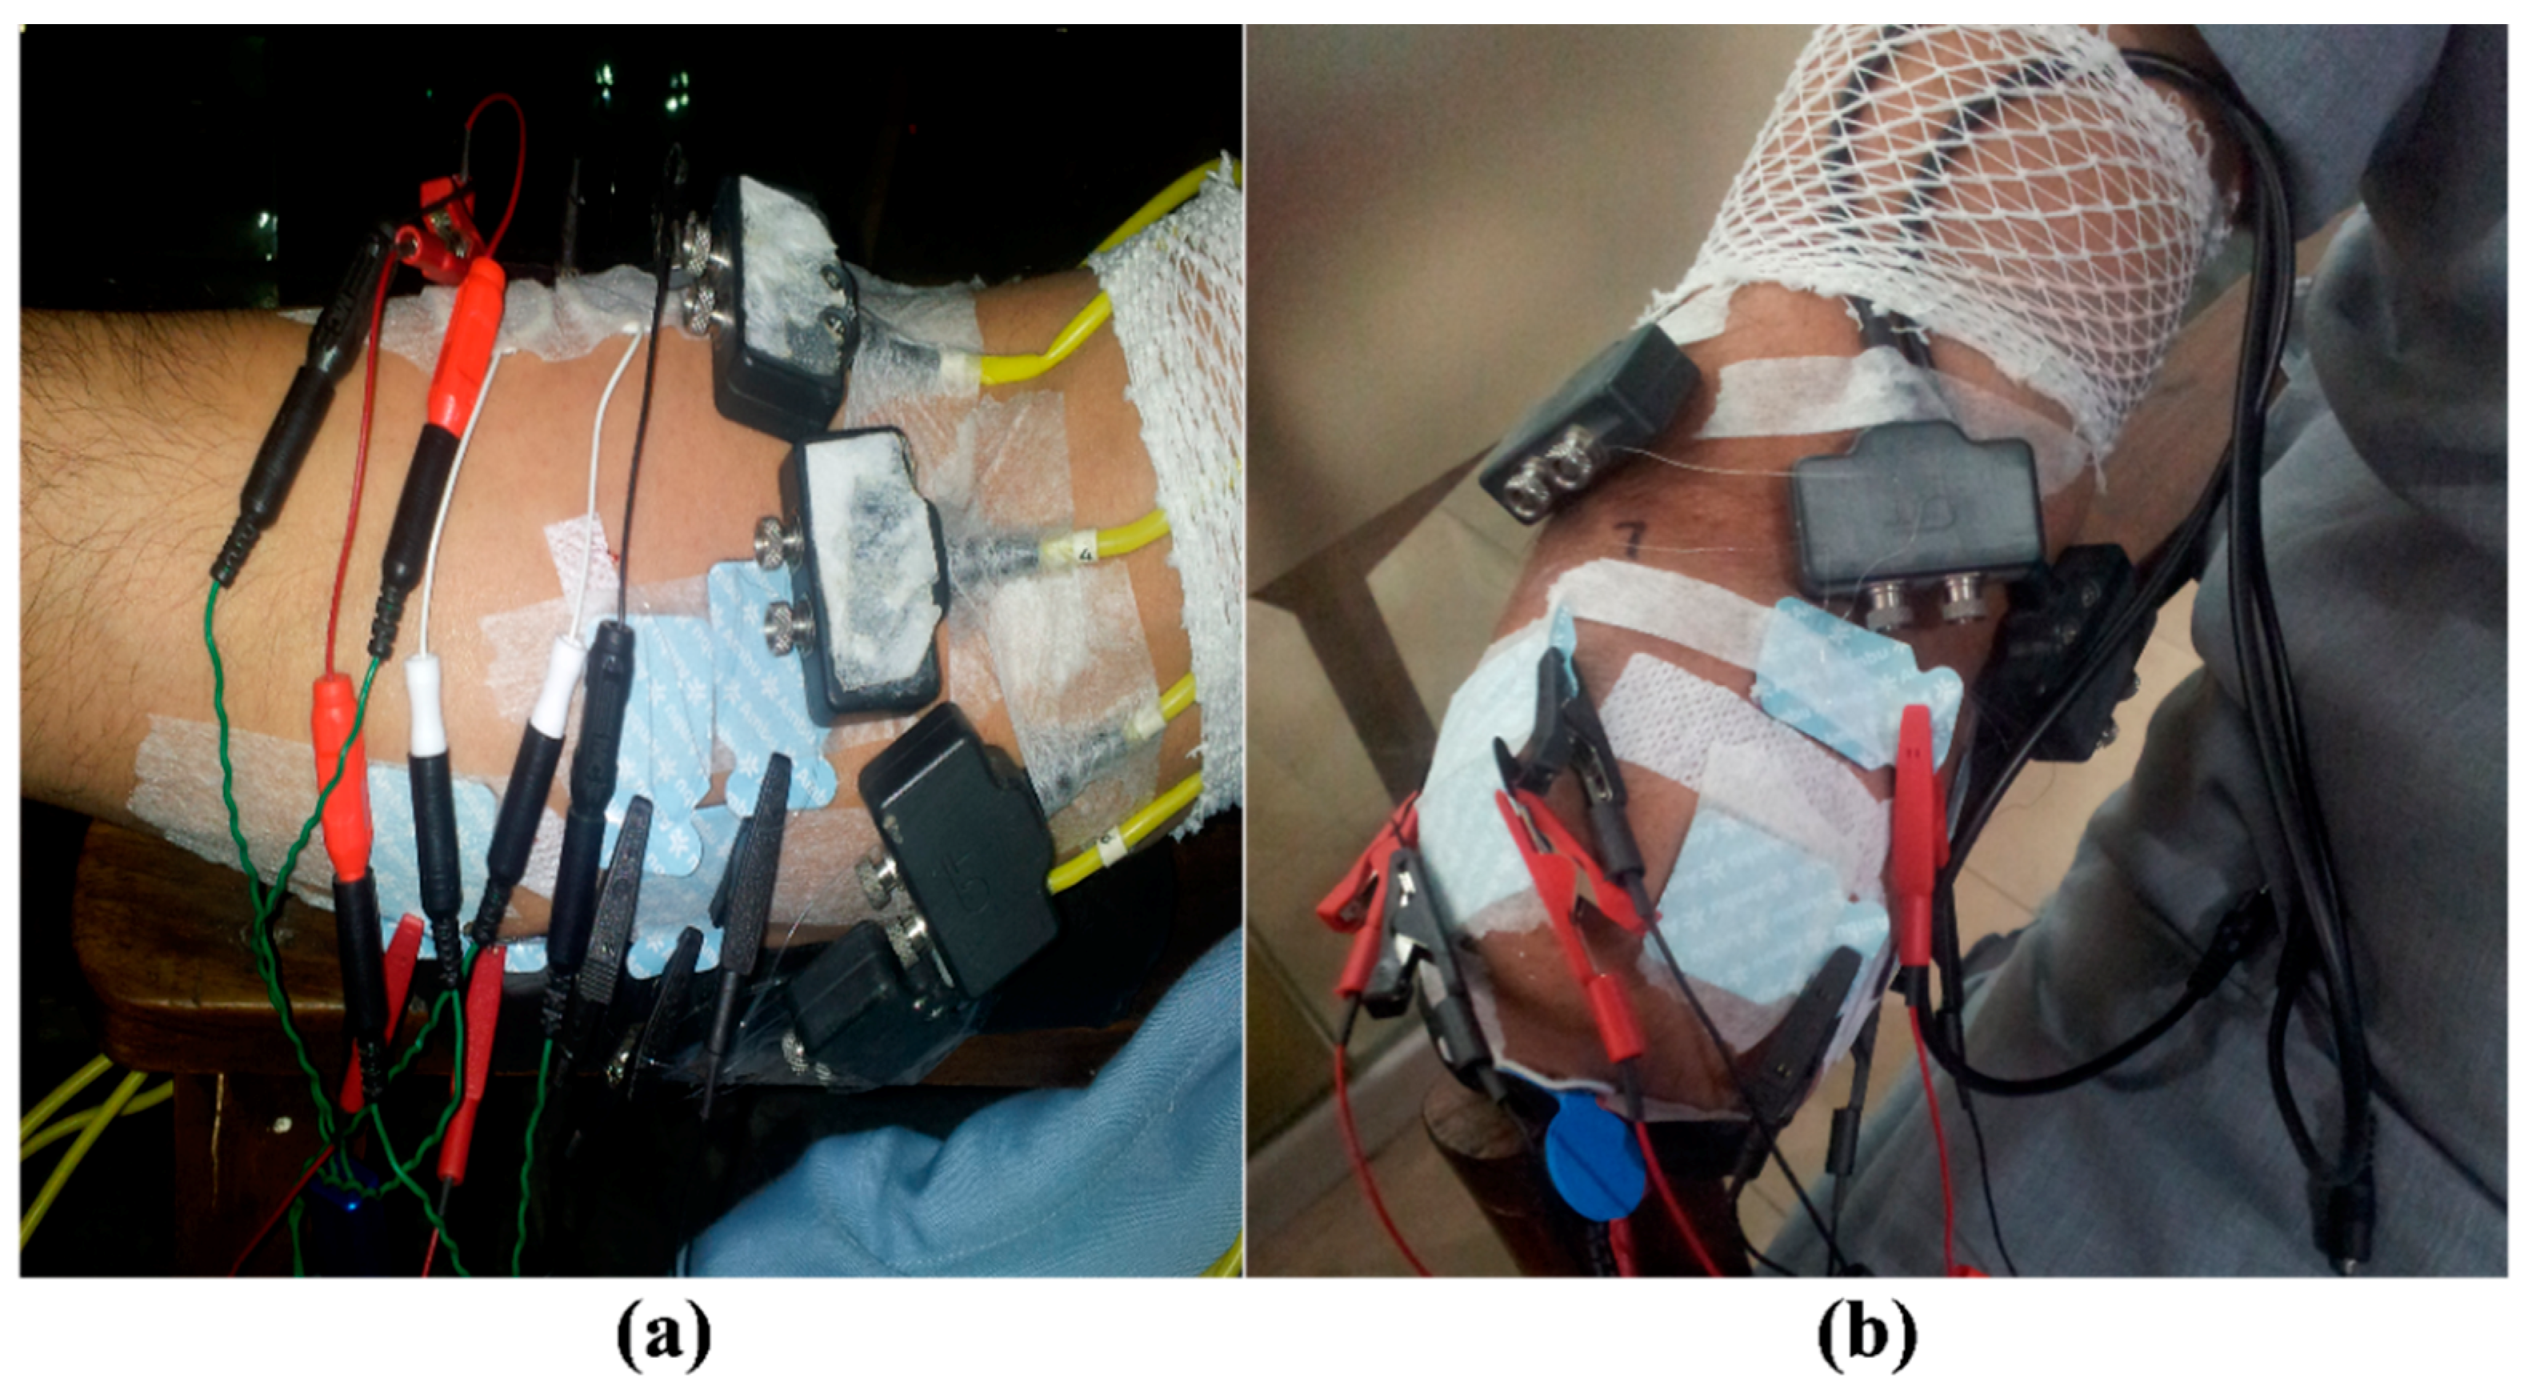
2.2. Experimental Procedures
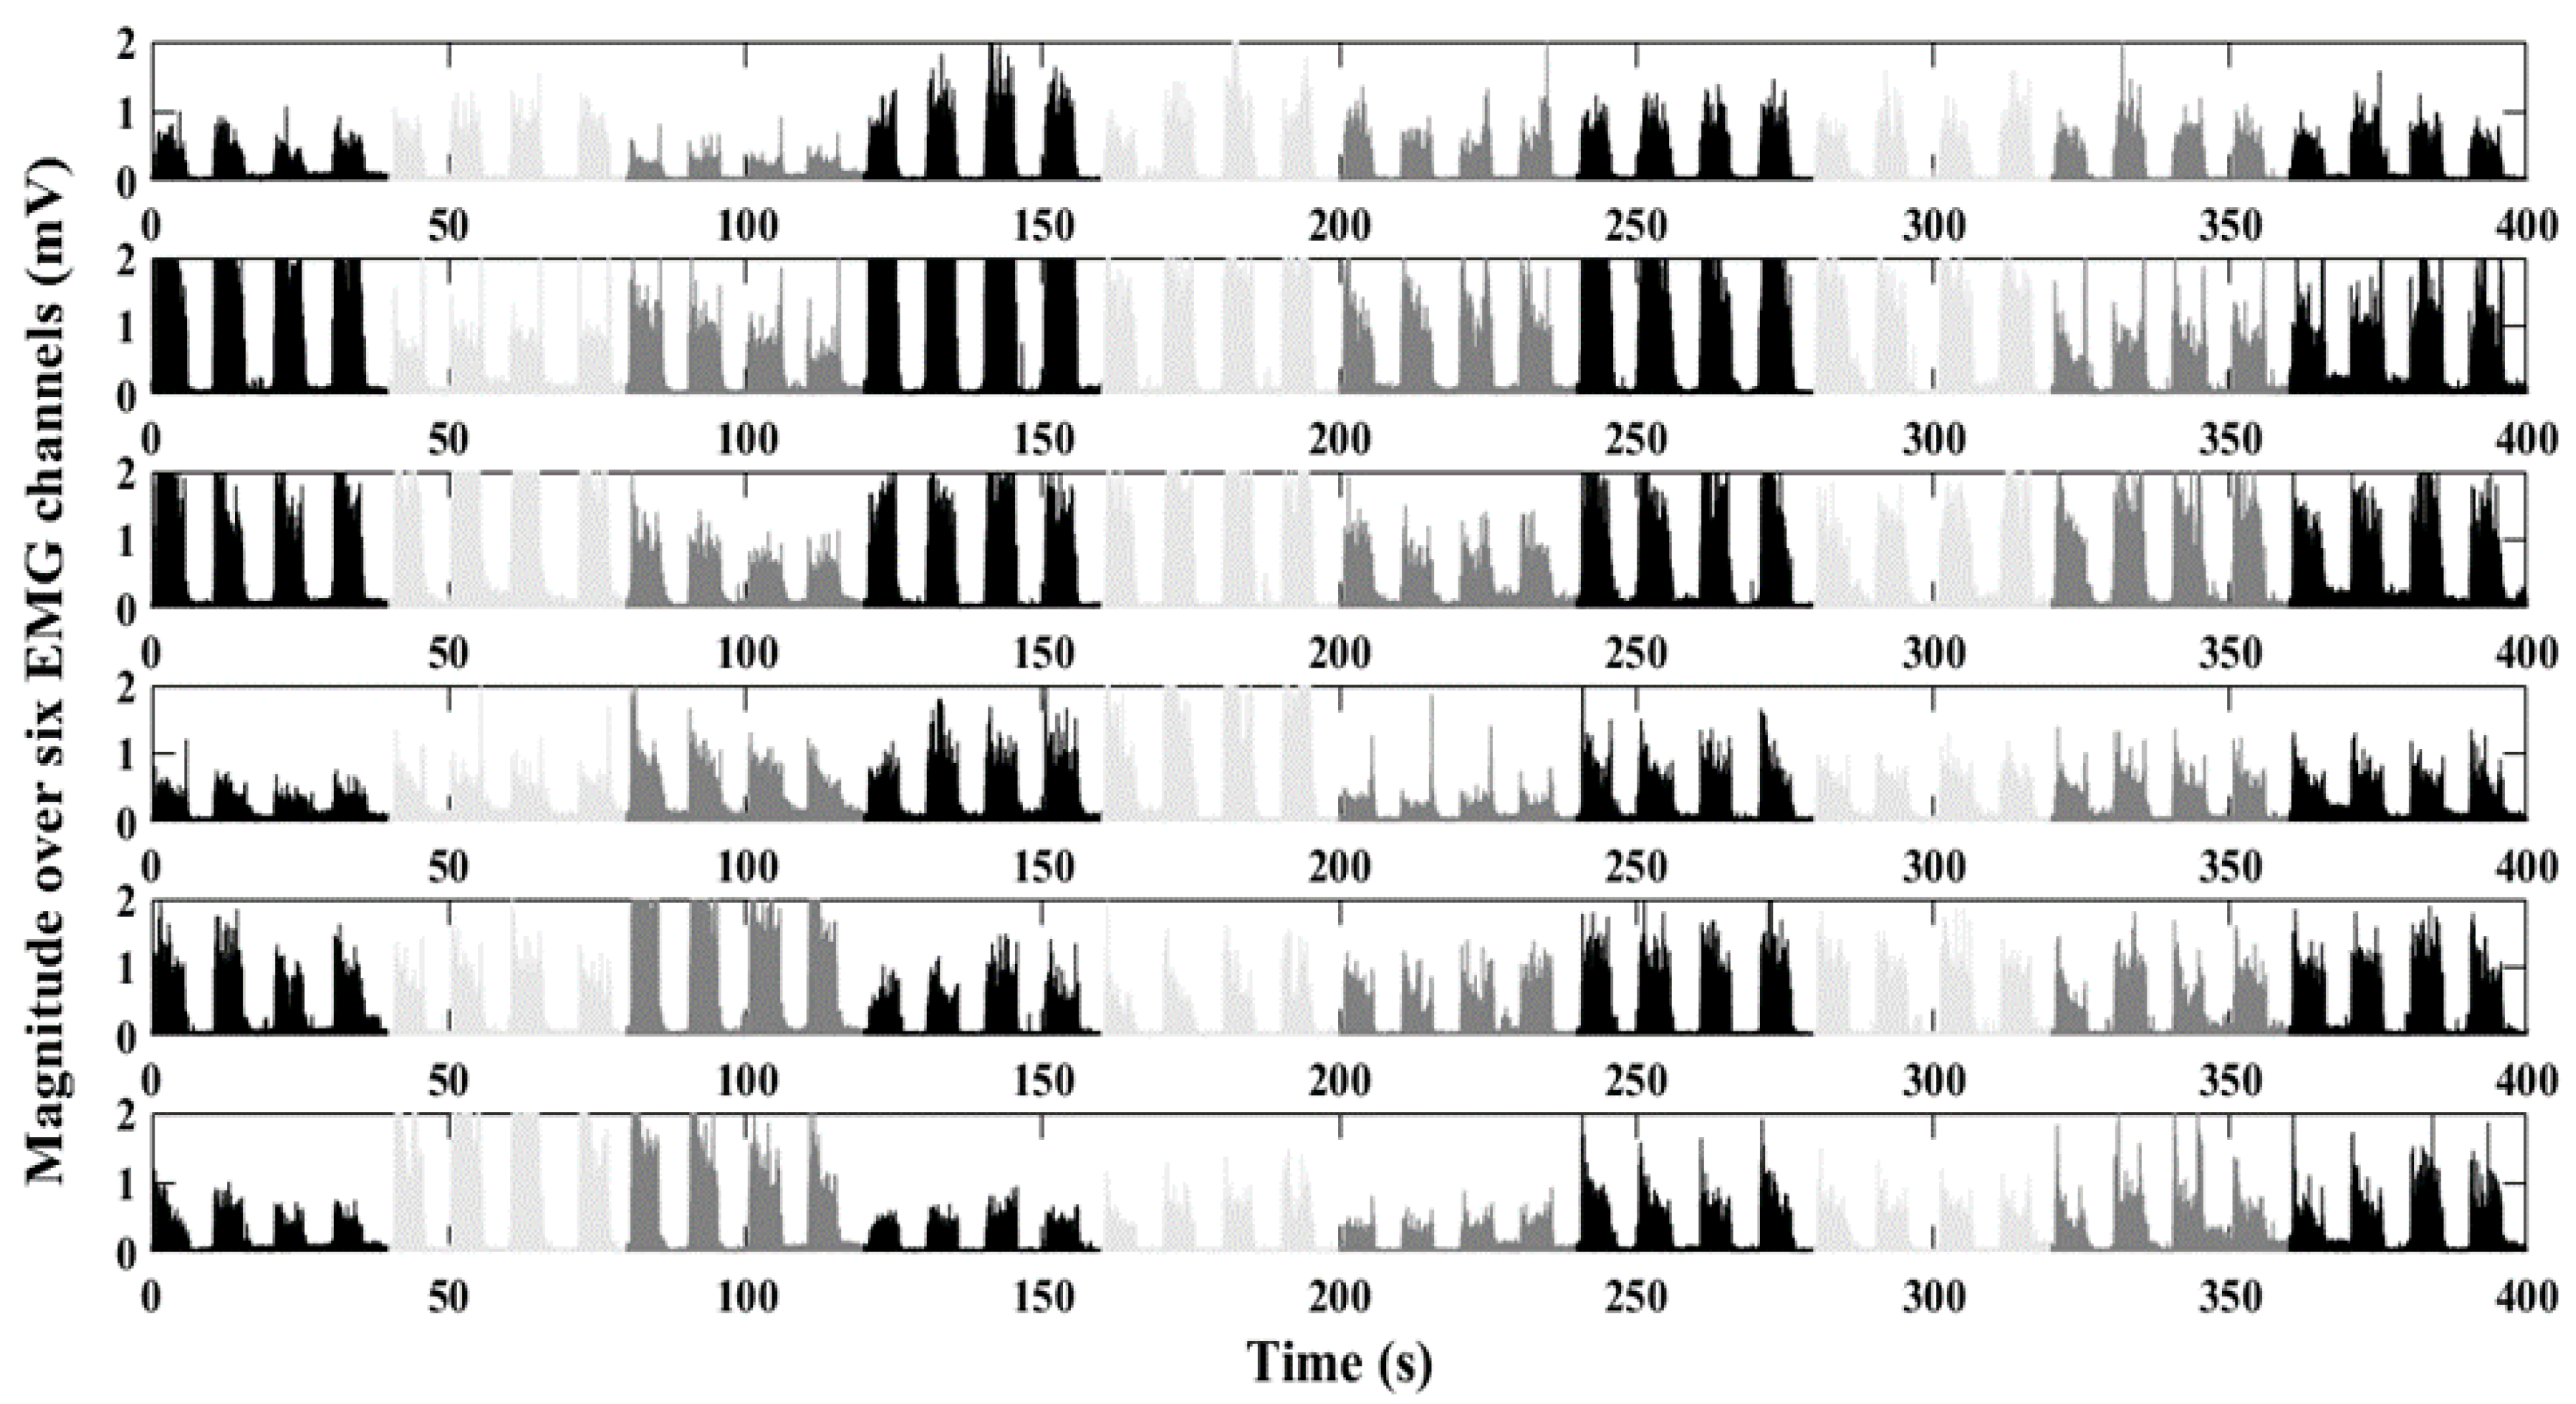
2.3. Signal Processing
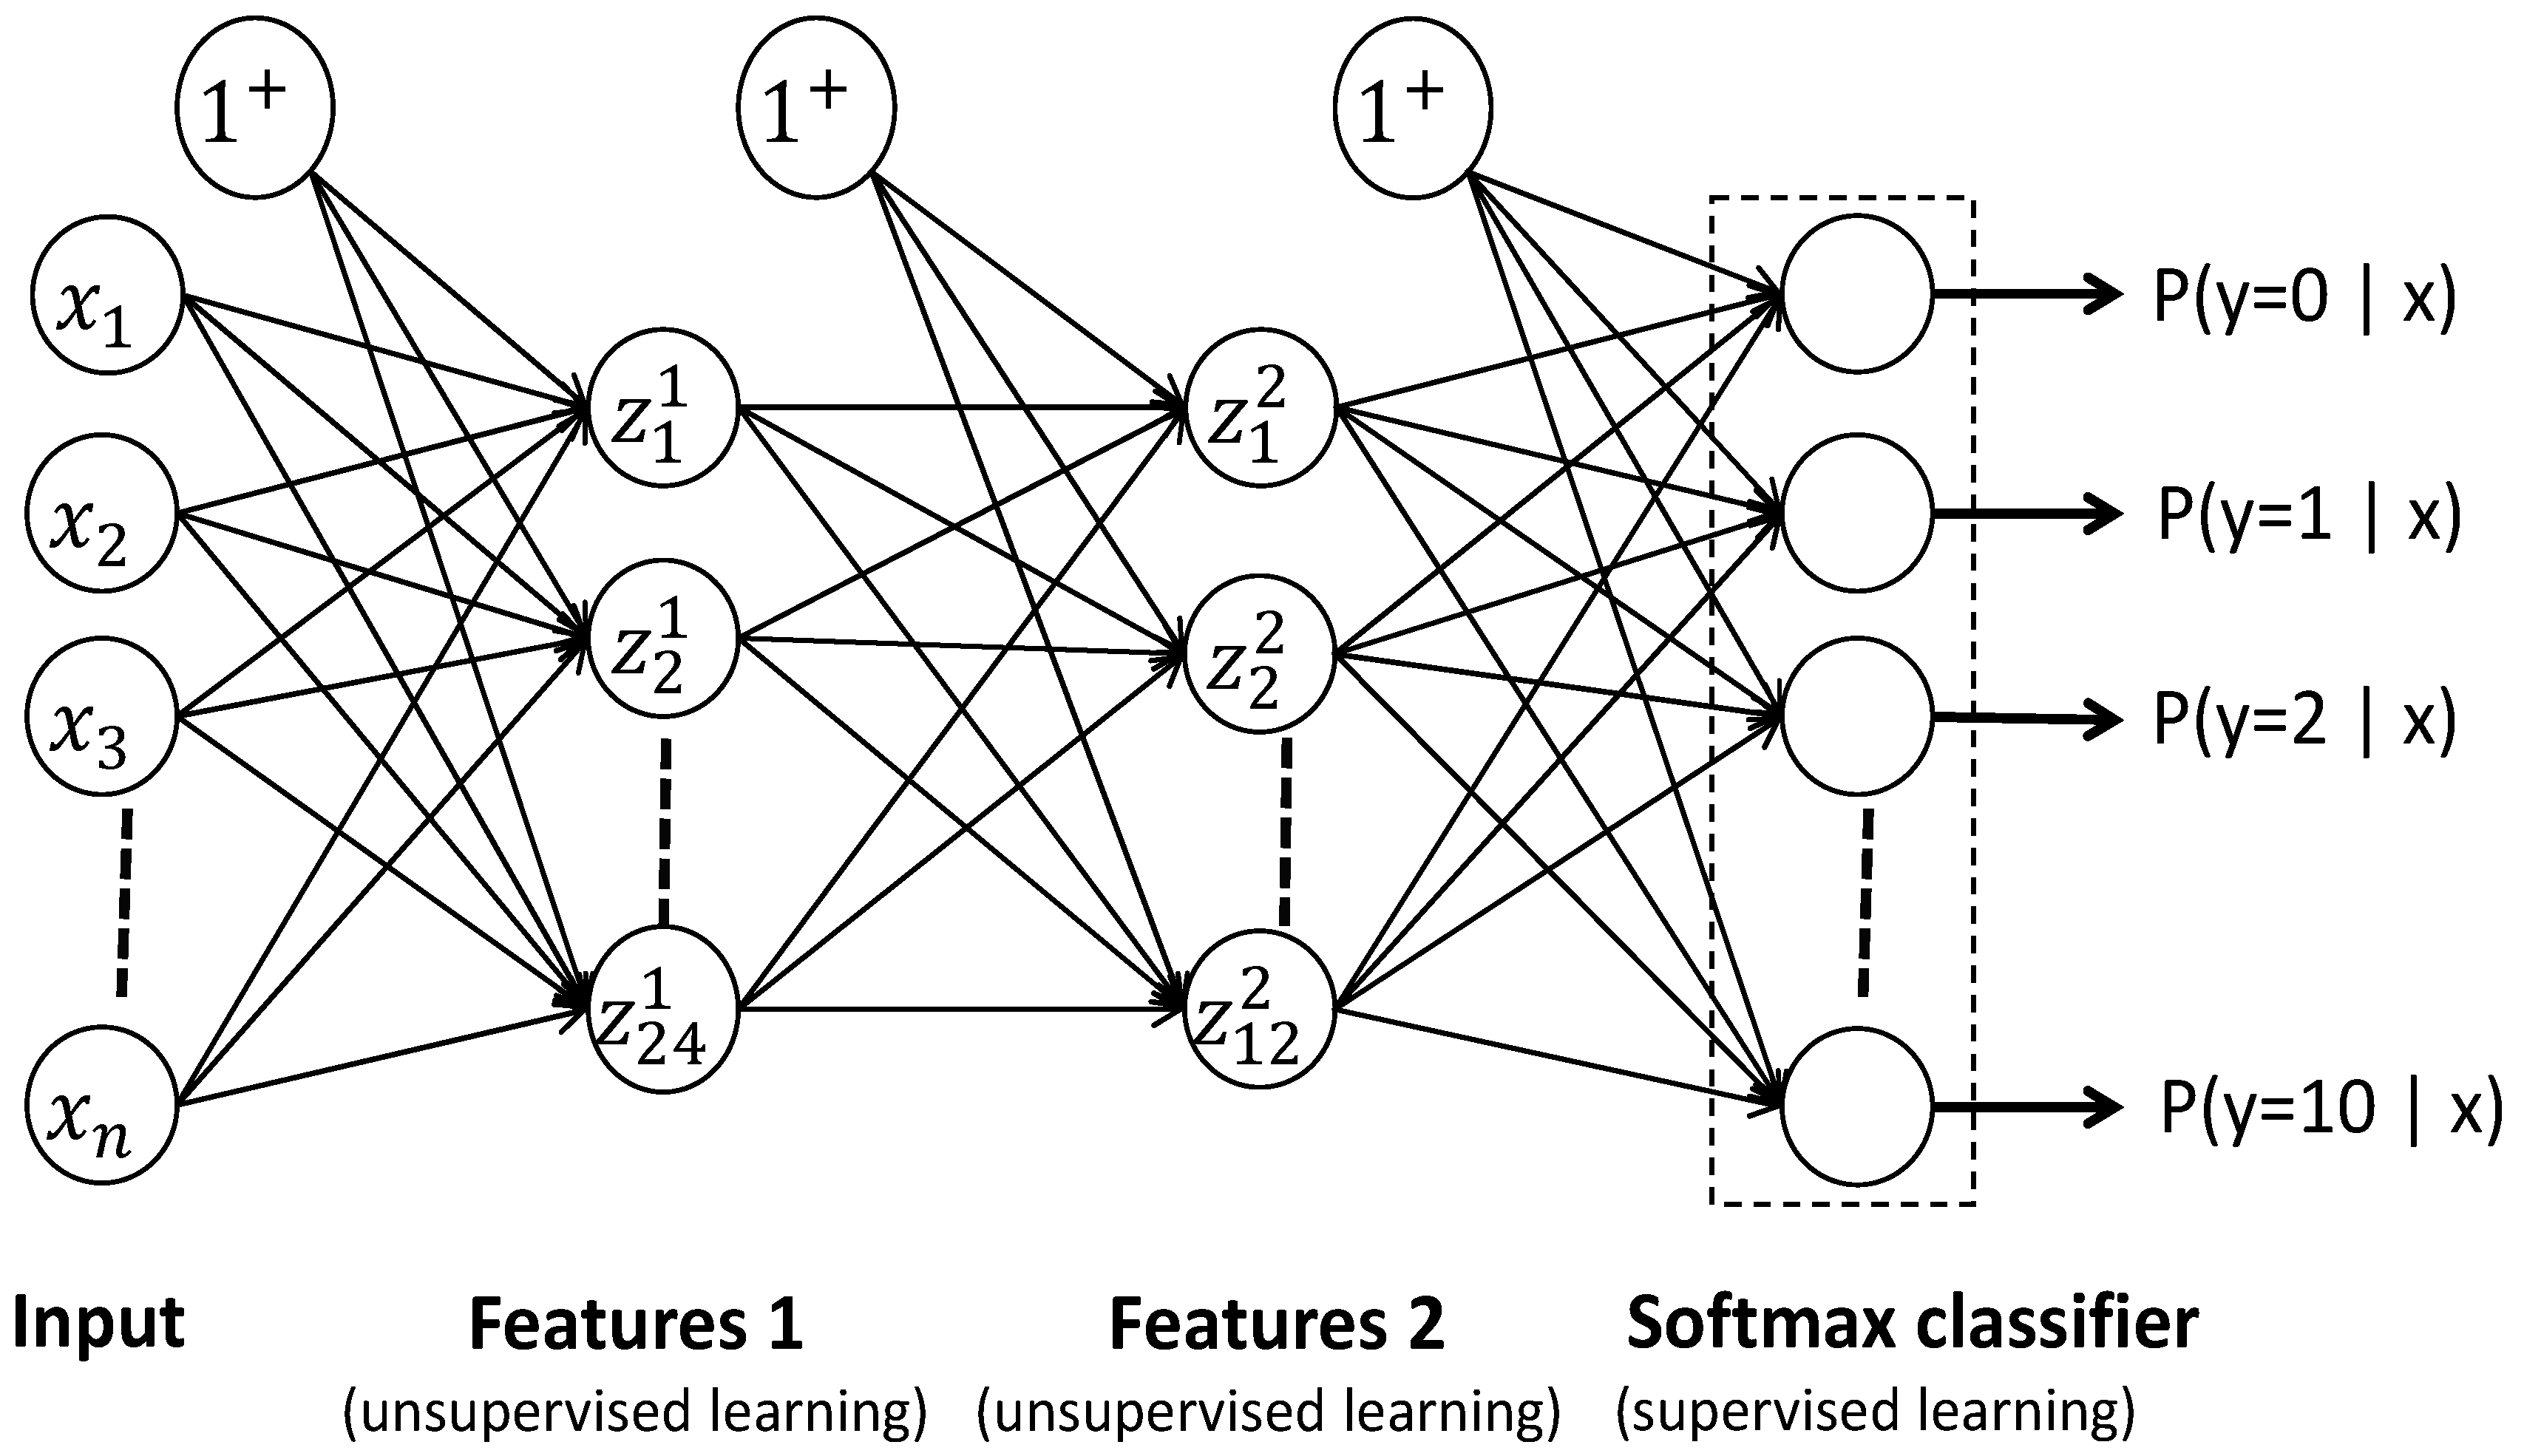
2.4. Stacked Sparse Autoencoders
2.5. Statistical Tests
3. Results
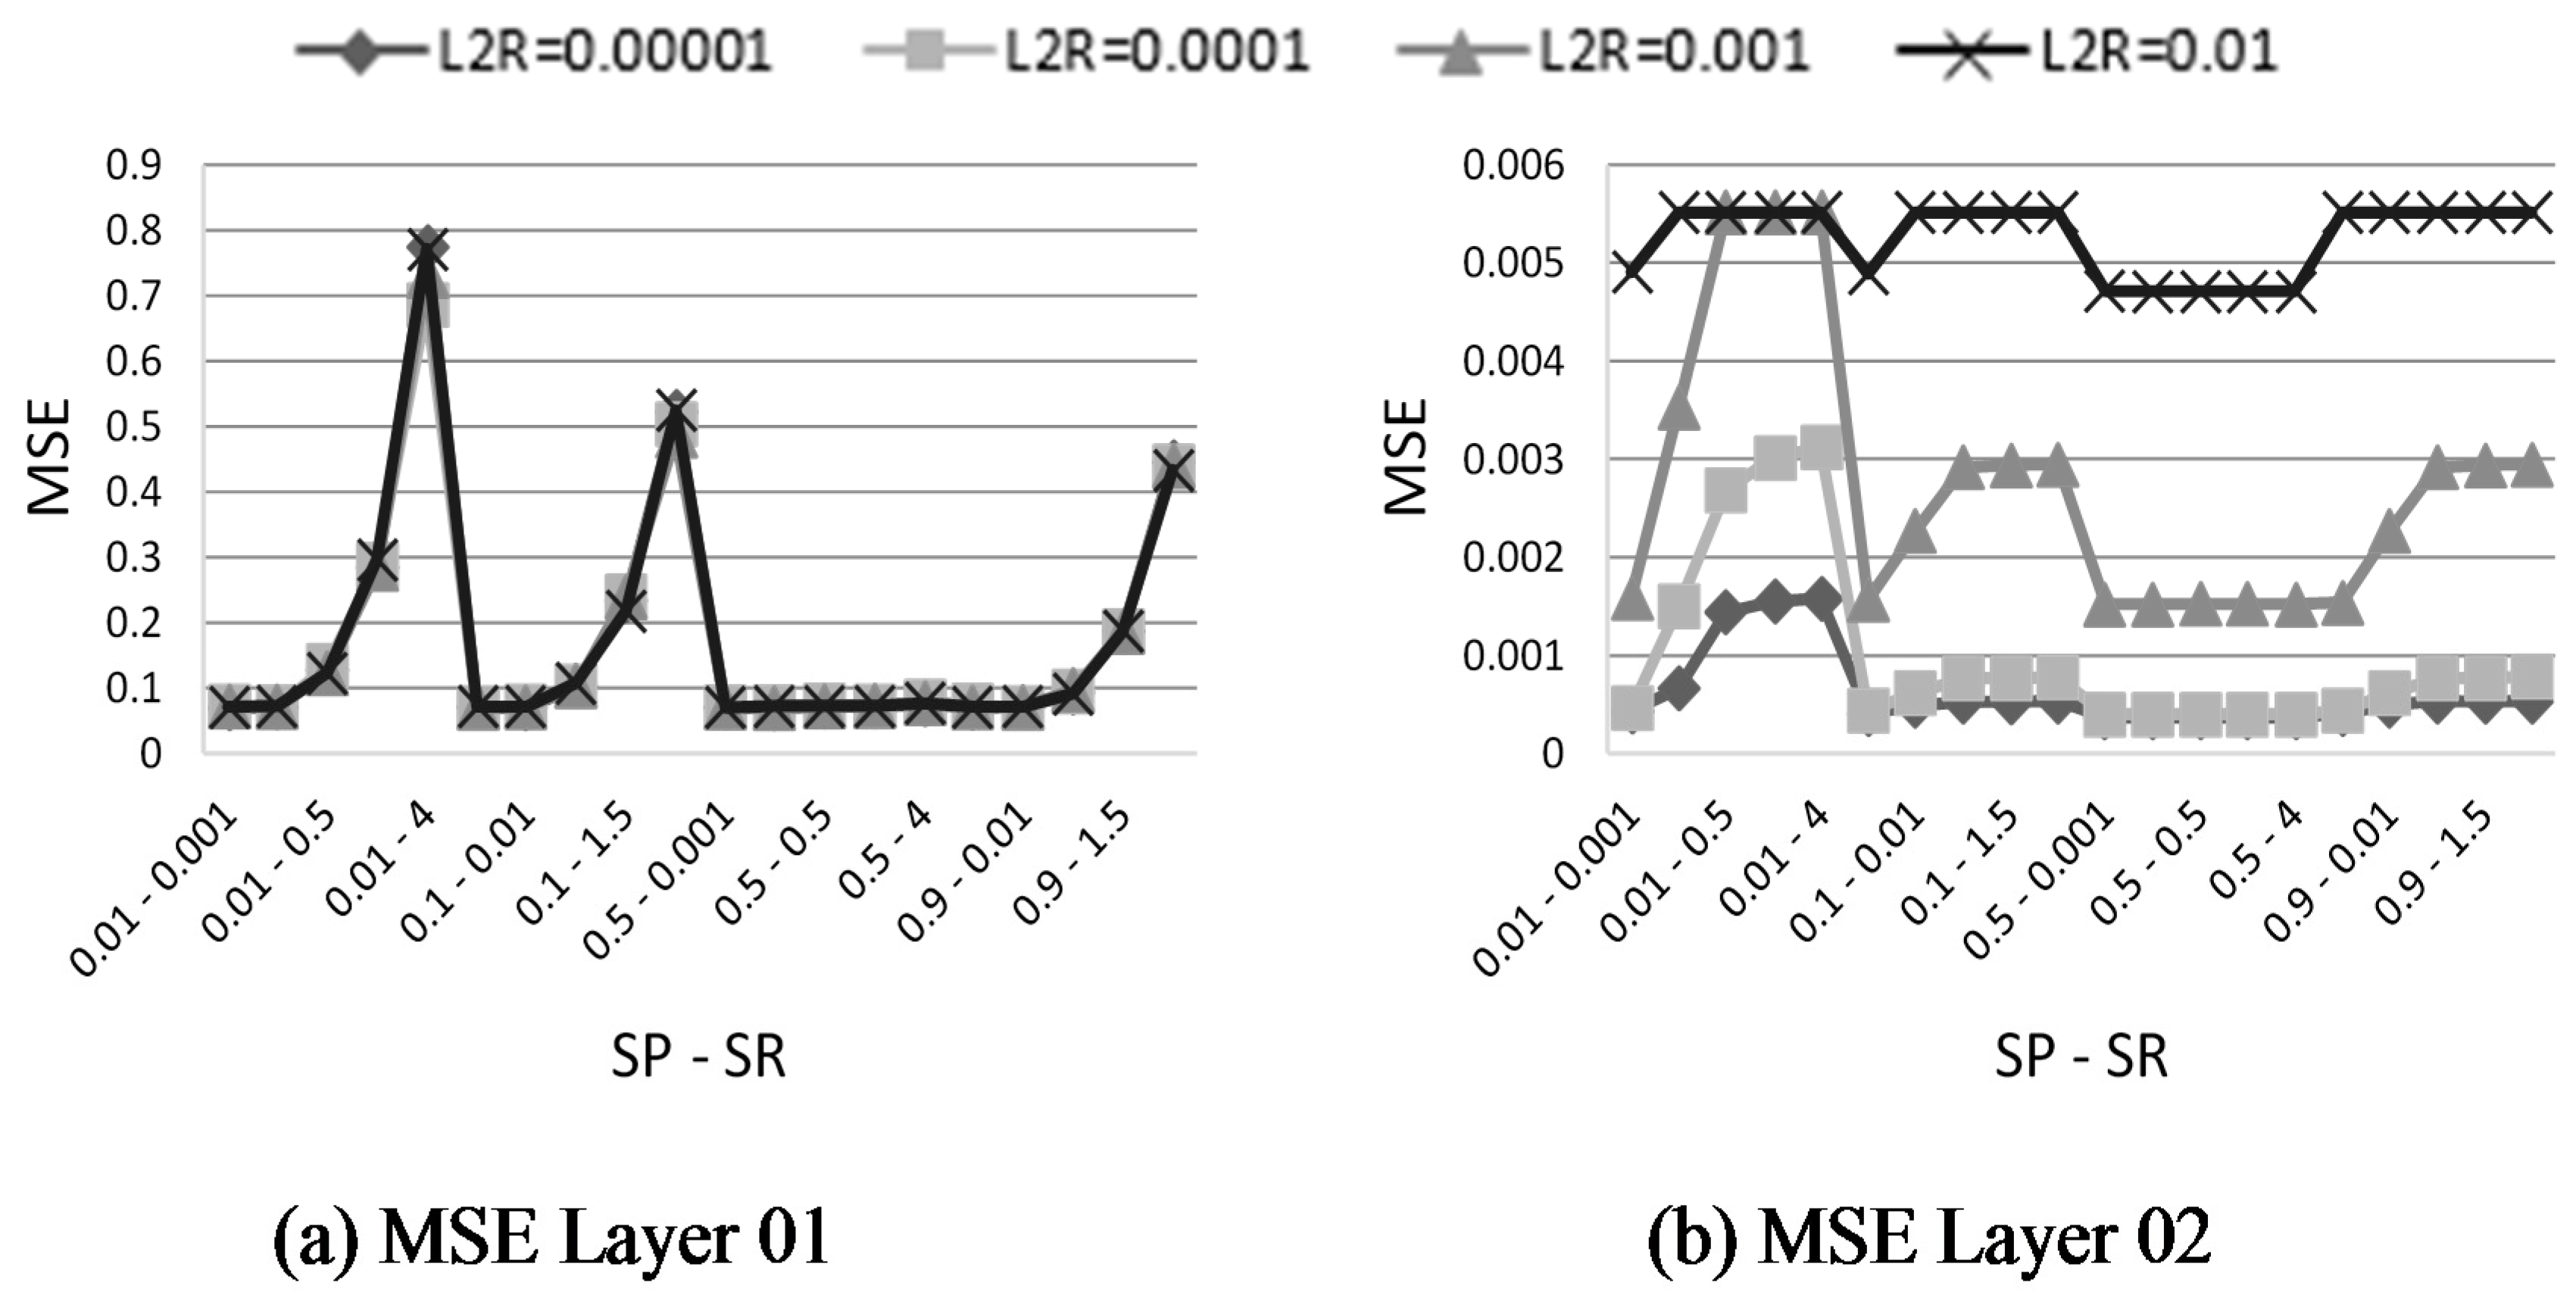
3.1. Parameter Optimization
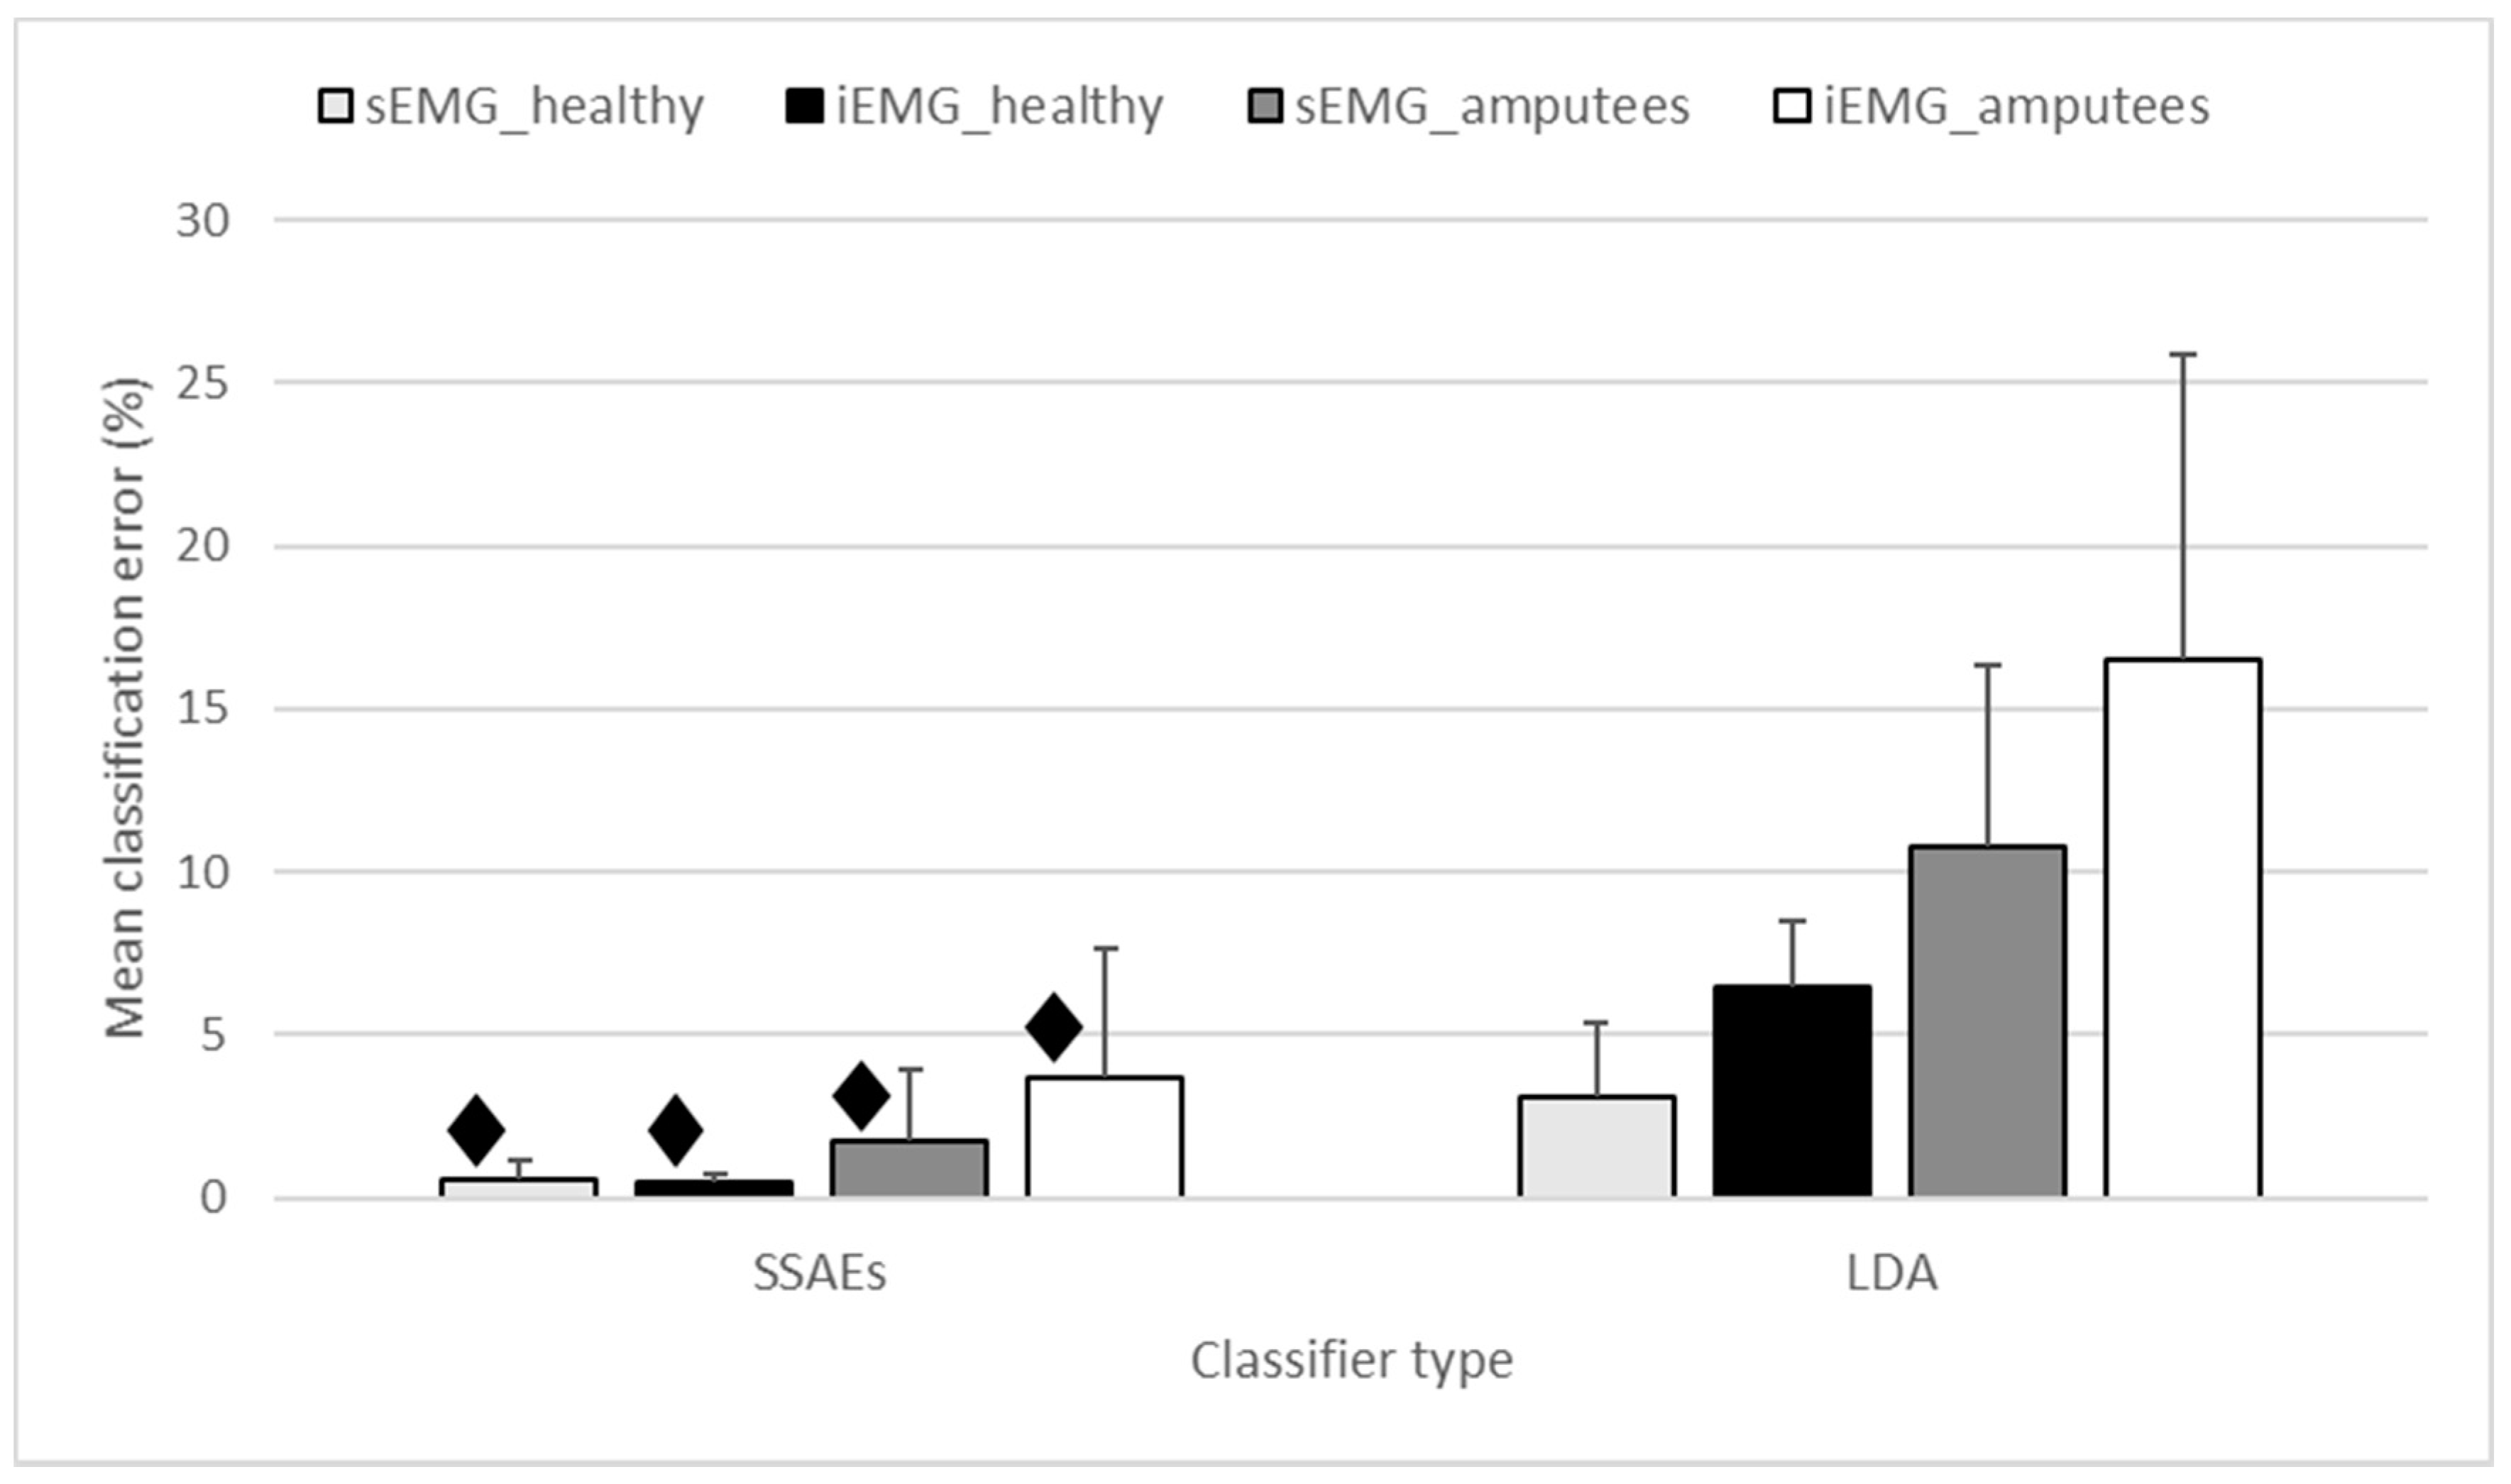
3.2. SSAE vs. LDA
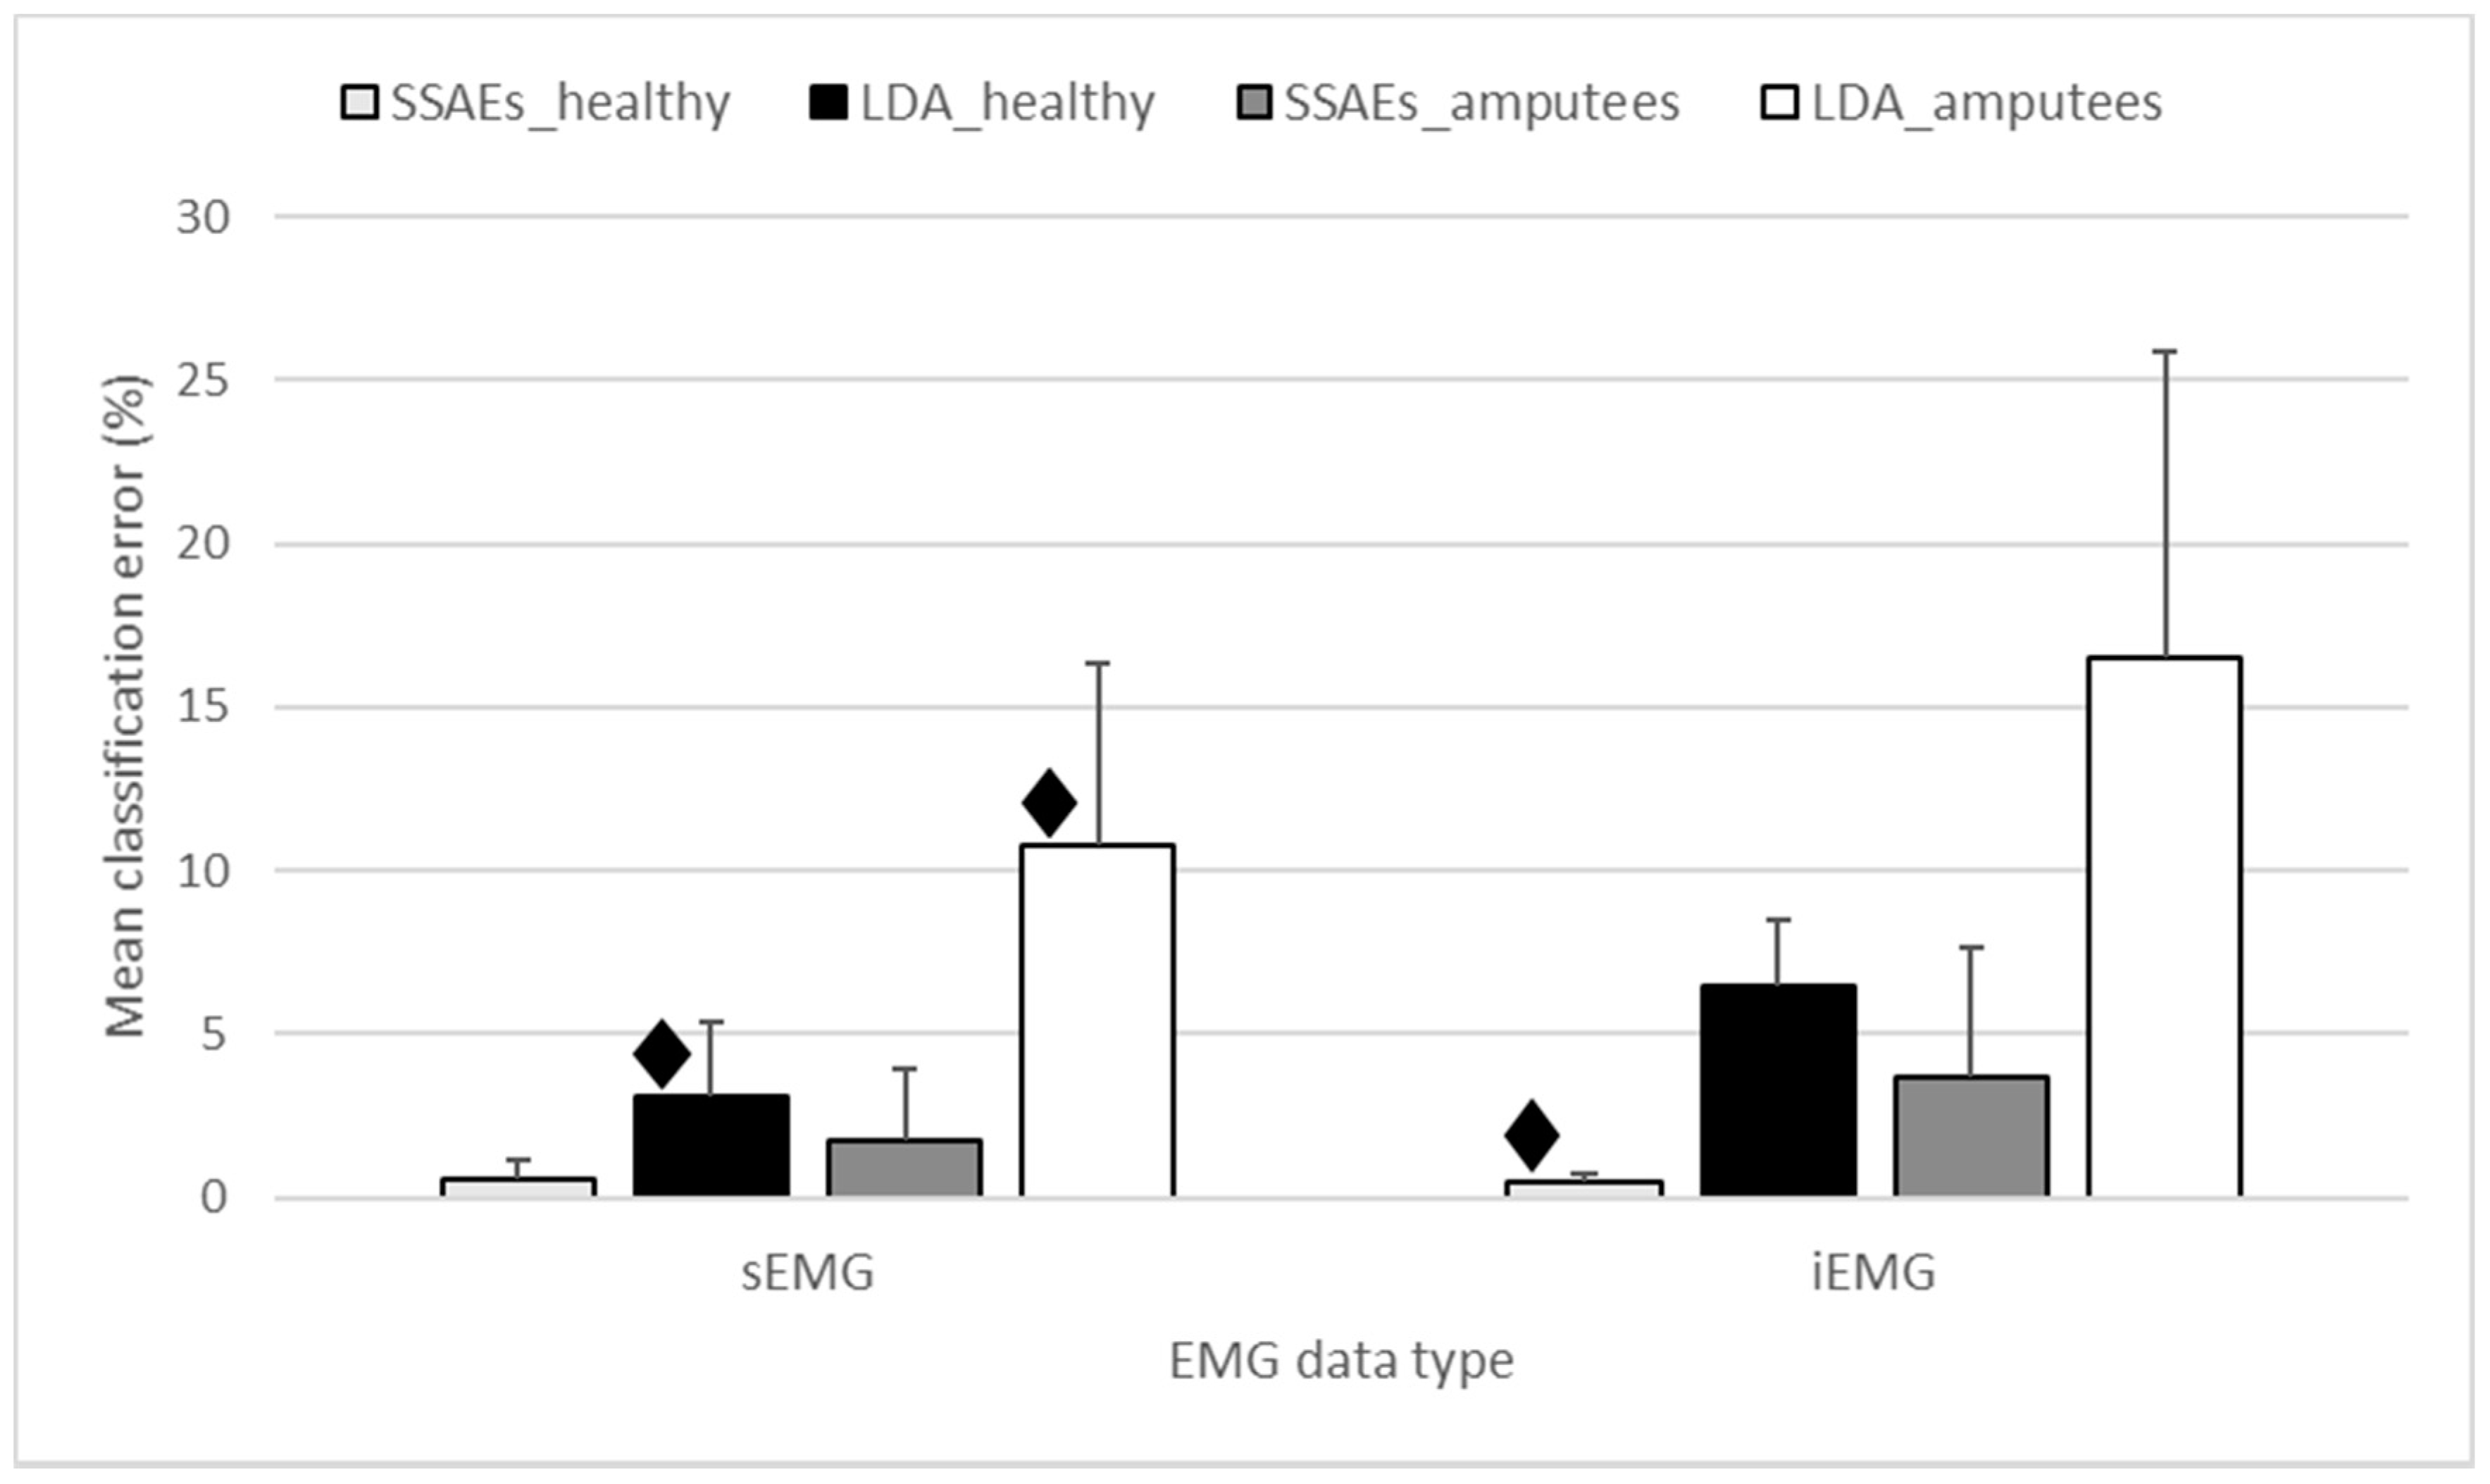
3.3. sEMG vs. iEMG
3.4. Analysis between Pairs of Days
3.5. Between-Days Analysis
4. Discussion
5. Conclusions
Author Contributions
Funding
Acknowledgments
Conflicts of Interest
References
- Geethanjali, P. Myoelectric control of prosthetic hands: State-of-the-art review. Med. Devices 2016, 9, 247. [Google Scholar] [CrossRef] [PubMed]
- Ison, M.; Artemiadis, P. Proportional myoelectric control of robots: Muscle synergy development drives performance enhancement, retainment, and generalization. IEEE Trans. Robot. 2015, 31, 259–268. [Google Scholar] [CrossRef]
- Kamavuako, E.N.; Scheme, E.J.; Englehart, K.B. Combined surface and intramuscular emg for improved real-time myoelectric control performance. Biomed. Signal Process. Control 2014, 10, 102–107. [Google Scholar] [CrossRef]
- Hudgins, B.; Parker, P.; Scott, R.N. A new strategy for multifunction myoelectric control. IEEE Trans. Biomed. Eng. 1993, 40, 82–94. [Google Scholar] [CrossRef] [PubMed]
- Herberts, P.; Almström, C.; Kadefors, R.; Lawrence, P.D. Hand prosthesis control via myoelectric patterns. Acta Orthop. Scand. 1973, 44, 389–409. [Google Scholar] [CrossRef] [PubMed]
- Graupe, D.; Cline, W.K. Functional separation of emg signals via arma identification methods for prosthesis control purposes. IEEE Trans. Syst. Man Cybern. 1975, SMC-5, 252–259. [Google Scholar] [CrossRef]
- Putnam, W.; Knapp, R.B. Real-time computer control using pattern recognition of the electromyogram. Engineering in Medicine and Biology Society. In Proceedings of the 15th Annual International Conference of the IEEE Engineering in Medicine and Biology Societ, San Diego, CA, USA, 31 October 1993; pp. 1236–1237. [Google Scholar]
- Tsenov, G.; Zeghbib, A.; Palis, F.; Shoylev, N.; Mladenov, V. Neural networks for online classification of hand and finger movements using surface emg signals. In Proceedings of the 8th Seminar on Neural Network Applications in Electrical Engineering, Belgrade, Serbia & Montenegro, Serbia, 25–27 September 2006; pp. 167–171. [Google Scholar]
- Rosenberg, R. The biofeedback pointer: Emg control of a two dimensional pointer. In Proceedings of the Second International Symposium on Wearable Computers, Digest of Papers, Pittsburgh, PA, USA, 19–20 October 1998; pp. 162–163. [Google Scholar]
- Jung, K.K.; Kim, J.W.; Lee, H.K.; Chung, S.B.; Eom, K.H. Emg pattern classification using spectral estimation and neural network. In Proceedings of the SICE Annual Conference, Takamatsu, Japan, 17–20 September 2007; pp. 1108–1111. [Google Scholar]
- El-Daydamony, E.M.; El-Gayar, M.; Abou-Chadi, F. A computerized system for semg signals analysis and classifieation. In Proceedings of the Radio Science Conference, Tanta, Egypt, 18–20 March 2008; pp. 1–7. [Google Scholar]
- Fukuda, O.; Tsuji, T.; Kaneko, M. An emg controlled pointing device using a neural network. In Proceedings of the IEEE SMC’99 Conference on Systems, Man, and Cybernetics, Tokyo, Japan, 12–15 October 1999; pp. 63–68. [Google Scholar]
- Tsuji, T.; Fukuda, O.; Murakami, M.; Kaneko, M. An emg controlled pointing device using a neural network. Trans. Soc. Instrum. Control Eng. 2001, 37, 425–431. [Google Scholar] [CrossRef]
- Fukuda, O.; Arita, J.; Tsuji, T. An emg-controlled omnidirectional pointing device using a hmm-based neural network. In Proceedings of the International Joint Conference on Neural Networks, Portland, OR, USA, 20–24 July 2003; pp. 3195–3200. [Google Scholar]
- Bu, N.; Hamamoto, T.; Tsuji, T.; Fukuda, O. Fpga implementation of a probabilistic neural network for a bioelectric human interface. In Proceedings of the 47th Midwest Symposium on Circuits and Systems (MWSCAS’04), Hiroshima, Japan, 25–28 July 2004. [Google Scholar]
- Kim, J.; Mastnik, S.; André, E. Emg-based hand gesture recognition for realtime biosignal interfacing. In Proceedings of the 13th International Conference on Intelligent User Interfaces, Gran Canaria, Spain, 13–16 January 2008; pp. 30–39. [Google Scholar]
- Mobasser, F.; Hashtrudi-Zaad, K. A method for online estimation of human arm dynamics. In Proceedings of the 28th Annual International Conference on Engineering in Medicine and Biology Society, New York City, NY, USA, 31 August–3 September 2006; pp. 2412–2416. [Google Scholar]
- Chen, X.; Zhang, X.; Zhao, Z.-Y.; Yang, J.-H.; Lantz, V.; Wang, K.-Q. Hand gesture recognition research based on surface emg sensors and 2d-accelerometers. In Proceedings of the 11th IEEE International Symposium on Wearable Computers, Boston, MA, USA, 11–13 October 2007; pp. 11–14. [Google Scholar]
- Jochumsen, M.; Waris, A.; Kamavuako, E.N. The effect of arm position on classification of hand gestures with intramuscular emg. Biomed. Signal Process. Control 2018, 43, 1–8. [Google Scholar] [CrossRef]
- Selami, K. Classification of emg signals using decision tree methods. In Proceedings of the 3rd International Symposium on Sustainable Development, Sarajevo, Bosnia and Herzegovina, 31 May–1 June 2012. [Google Scholar]
- Geethanjali, P.; Ray, K. Identification of motion from multi-channel emg signals for control of prosthetic hand. Australas. Phys. Eng. Sci. Med. 2011, 34, 419–427. [Google Scholar] [CrossRef] [PubMed]
- Waris, A.; Kamavuako, E.N. Effect of threshold values on the combination of emg time domain features: Surface versus intramuscular emg. Biomed. Signal Process. Control 2018, 45, 267–273. [Google Scholar] [CrossRef]
- Alkan, A.; Günay, M. Identification of emg signals using discriminant analysis and svm classifier. Expert Syst. Appl. 2012, 39, 44–47. [Google Scholar] [CrossRef]
- Chan, A.D.; Green, G.C. Myoelectric control development toolbox. In Proceedings of the 30th Conference of the Canadian Medical & Biological Engineering Society, Lyon, France, 23–26 August 2007; pp. M0100–M0101. [Google Scholar]
- Waris, A.; Niazi, I.K.; Jamil, M.; Gilani, O.; Englehart, K.; Jensen, W.; Shafique, M.; Kamavuako, E.N. The effect of time on emg classification of hand motions in able-bodied and transradial amputees. J. Electromyogr. Kinesiol. 2018, 40, 72–80. [Google Scholar] [CrossRef] [PubMed]
- Phinyomark, A.; Phukpattaranont, P.; Limsakul, C. Feature reduction and selection for emg signal classification. Expert Syst. Appl. 2012, 39, 7420–7431. [Google Scholar] [CrossRef]
- Koch, P.; Phan, H.; Maass, M.; Katzberg, F.; Mertins, A. Early prediction of future hand movements using semg data. In Proceedings of the 39th Annual International Conference of on Engineering in Medicine and Biology Society (EMBC), Seogwipo, South Korea, 11–15 July 2017; pp. 54–57. [Google Scholar]
- Atzori, M.; Cognolato, M.; Müller, H. Deep learning with convolutional neural networks: A resource for the control of robotic prosthetic hands via electromyography. Front. Neurorobot. 2016, 10, 9. [Google Scholar] [CrossRef] [PubMed]
- Liu, N.; Han, J.; Zhang, D.; Wen, S.; Liu, T. Predicting eye fixations using convolutional neural networks. In Proceedings of the IEEE Conference on Computer Vision and Pattern Recognition, Boston, MA, USA, 7–12 June 2015; pp. 362–370. [Google Scholar]
- Chorowski, J.K.; Bahdanau, D.; Serdyuk, D.; Cho, K.; Bengio, Y. Attention-based models for speech recognition. In Advances in Neural Information Processing Systems; Neural Information Processing Systems Foundation, Inc.: San Diego, CA, USA, 2015; pp. 577–585. [Google Scholar]
- Min, S.; Lee, B.; Yoon, S. Deep learning in bioinformatics. Brief. Bioinform. 2017, 18, 851–869. [Google Scholar] [CrossRef] [PubMed]
- Lin, Q.; Ye, S.-Q.; Huang, X.-M.; Li, S.-Y.; Zhang, M.-Z.; Xue, Y.; Chen, W.-S. Classification of epileptic eeg signals with stacked sparse autoencoder based on deep learning. In Proceedings of the International Conference on Intelligent Computing, Lanzhou, China, 2–5 August 2016; Springer: Berlin, Germany, 2016; pp. 802–810. [Google Scholar]
- Tsinalis, O.; Matthews, P.M.; Guo, Y. Automatic sleep stage scoring using time-frequency analysis and stacked sparse autoencoders. Ann. Biomed. Eng. 2016, 44, 1587–1597. [Google Scholar] [CrossRef] [PubMed]
- Najdi, S.; Gharbali, A.A.; Fonseca, J.M. Feature transformation based on stacked sparse autoencoders for sleep stage classification. In Proceedings of the Doctoral Conference on Computing, Electrical and Industrial Systems, Costa de Caparica, Portugal, 3–5 May 2017; Springer: Berlin, Germany, 2017; pp. 191–200. [Google Scholar]
- Zhang, X.; Dou, H.; Ju, T.; Xu, J.; Zhang, S. Fusing heterogeneous features from stacked sparse autoencoder for histopathological image analysis. IEEE J. Biomed. Health Inf. 2016, 20, 1377–1383. [Google Scholar] [CrossRef] [PubMed]
- Yang, J.; Bai, Y.; Lin, F.; Liu, M.; Hou, Z.; Liu, X. A novel electrocardiogram arrhythmia classification method based on stacked sparse auto-encoders and softmax regression. Int. J. Mach. Learn. Cybern. 2017, 9, 1–8. [Google Scholar] [CrossRef]
- Yuan, C.; Yan, Y.; Zhou, L.; Bai, J.; Wang, L. Automated atrial fibrillation detection based on deep learning network. In Proceedings of the IEEE International Conference on Information and Automation (ICIA), Ningbo, China, 1–3 August 2016; pp. 1159–1164. [Google Scholar]
- Zhou, L.; Yan, Y.; Qin, X.; Yuan, C.; Que, D.; Wang, L. Deep learning-based classification of massive electrocardiography data. In Proceedings of the IEEE Electronic and Automation Control Conference (IMCEC) on Advanced Information Management, Communicates, Xi’an, China, 3–5 October 2016; pp. 780–785. [Google Scholar]
- Said, A.B.; Mohamed, A.; Elfouly, T.; Harras, K.; Wang, Z.J. Multimodal deep learning approach for joint eeg-emg data compression and classification. arXiv 2017, preprint. arXiv:1703.08970. [Google Scholar]
- Spüler, M.; Irastorza-Landa, N.; Sarasola-Sanz, A.; Ramos-Murguialday, A. Extracting muscle synergy patterns from emg data using autoencoders. In Proceedings of the International Conference on Artificial Neural Networks, Barcelona, Spain, 6–9 September 2016; Springer: Berlin, Germany, 2016; pp. 47–54. [Google Scholar]
- Rehman, M.Z.U.; Gilani, S.O.; Waris, A.; Niazi, I.K.; Kamavuako, E.N. A novel approach for classification of hand movements using surface emg signals. In Proceedings of the IEEE International Symposium on Signal Processing and Information Technology (ISSPIT), Bilbao, Spain, 18–20 December 2017; pp. 265–269. [Google Scholar]
- Vujaklija, I.; Shalchyan, V.; Kamavuako, E.N.; Jiang, N.; Marateb, H.R.; Farina, D. Online mapping of emg signals into kinematics by autoencoding. J. Neuroeng. Rehabil. 2018, 15, 21. [Google Scholar] [CrossRef] [PubMed]
- Park, K.-H.; Lee, S.-W. Movement intention decoding based on deep learning for multiuser myoelectric interfaces. In Proceedings of the 4th International Winter Conference on Brain-Computer Interface (BCI), Gangwon Province, South Korea, 22–24 February 2016; pp. 1–2. [Google Scholar]
- Atzori, M.; Müller, H. The ninapro database: A resource for semg naturally controlled robotic hand prosthetics. In Proceedings of the 37th Annual International Conference of the IEEE Engineering in Medicine and Biology Society (EMBC), Milan, Italy, 25–29 August 2015; pp. 7151–7154. [Google Scholar]
- Wei, W.; Wong, Y.; Du, Y.; Hu, Y.; Kankanhalli, M.; Geng, W. A multi-stream convolutional neural network for semg-based gesture recognition in muscle-computer interface. Pattern Recognit. Lett. 2017. [Google Scholar] [CrossRef]
- Xia, P.; Hu, J.; Peng, Y. Emg-based estimation of limb movement using deep learning with recurrent convolutional neural networks. Artif. Organs 2018, 42, E67–E77. [Google Scholar] [CrossRef] [PubMed]
- Geng, W.; Du, Y.; Jin, W.; Wei, W.; Hu, Y.; Li, J. Gesture recognition by instantaneous surface emg images. Sci. Rep. 2016, 6, 36571. [Google Scholar] [CrossRef] [PubMed]
- Du, Y.; Jin, W.; Wei, W.; Hu, Y.; Geng, W. Surface emg-based inter-session gesture recognition enhanced by deep domain adaptation. Sensors 2017, 17, 458. [Google Scholar] [CrossRef] [PubMed]
- Du, Y.; Wong, Y.; Jin, W.; Wei, W.; Hu, Y.; Kankanhalli, M.; Geng, W. Semi-supervised learning for surface emg-based gesture recognition. In Proceedings of the 26th International Joint Conference on Artificial Intelligence, Melbourne, Australia, 19–25 August 2017; pp. 1624–1630. [Google Scholar]
- Kamavuako, E.N.; Farina, D.; Yoshida, K.; Jensen, W. Relationship between grasping force and features of single-channel intramuscular emg signals. J. Neurosci. Methods 2009, 185, 143–150. [Google Scholar] [CrossRef] [PubMed]
- Farrell, T.R. A comparison of the effects of electrode implantation and targeting on pattern classification accuracy for prosthesis control. IEEE Trans. Biomed. Eng. 2008, 55, 2198–2211. [Google Scholar] [CrossRef] [PubMed]
- Hargrove, L.J.; Englehart, K.; Hudgins, B. A comparison of surface and intramuscular myoelectric signal classification. IEEE Trans. Biomed. Eng. 2007, 54, 847–853. [Google Scholar] [CrossRef] [PubMed]
- Smith, L.H.; Hargrove, L.J. Comparison of surface and intramuscular emg pattern recognition for simultaneous wrist/hand motion classification. In Proceedings of the 35th Annual International Conference of the IEEE Engineering in Medicine and Biology Society (EMBC), Osaka, Japan, 3–7 July 2013; pp. 4223–4226. [Google Scholar]
- Kamavuako, E.N.; Rosenvang, J.C.; Horup, R.; Jensen, W.; Farina, D.; Englehart, K.B. Surface versus untargeted intramuscular emg based classification of simultaneous and dynamically changing movements. IEEE Trans. Neural Syst. Rehabil. Eng. 2013, 21, 992–998. [Google Scholar] [CrossRef] [PubMed]
- Kamavuako, E.N.; Scheme, E.J.; Englehart, K.B. Wrist torque estimation during simultaneous and continuously changing movements: Surface vs. Untargeted intramuscular emg. J. Neurophysiol. 2013, 109, 2658–2665. [Google Scholar] [CrossRef] [PubMed]
- Beale, M.H.; Hagan, M.T.; Demuth, H.B. Neural Network Toolbox™ Reference; MATLAB R2015b; The MathWorks: Natick, MA, USA, 1992. [Google Scholar]
- Bengio, Y. Learning deep architectures for ai. Found. Trends® Mach. Learn. 2009, 2, 1–127. [Google Scholar] [CrossRef]
- Simon, A.M.; Hargrove, L.J.; Lock, B.A.; Kuiken, T.A. The target achievement control test: Evaluating real-time myoelectric pattern recognition control of a multifunctional upper-limb prosthesis. J. Rehabil. Res. Dev. 2011, 48, 619. [Google Scholar] [CrossRef] [PubMed]
- Young, A.J.; Smith, L.H.; Rouse, E.J.; Hargrove, L.J. A comparison of the real-time controllability of pattern recognition to conventional myoelectric control for discrete and simultaneous movements. J. Neuroeng. Rehabil. 2014, 11, 5. [Google Scholar] [CrossRef] [PubMed] [Green Version]
- Bellingegni, A.D.; Gruppioni, E.; Colazzo, G.; Davalli, A.; Sacchetti, R.; Guglielmelli, E.; Zollo, L. Nlr, mlp, svm, and lda: A comparative analysis on emg data from people with trans-radial amputation. J. Neuroeng. Rehabil. 2017, 14, 82. [Google Scholar] [CrossRef] [PubMed]
- Le, Q.V. A Tutorial on Deep Learning Part 2: Autoencoders, Convolutional Neural Networks and Recurrent Neural Networks; Google Inc.: Menlo Park, CA, USA, 2015. [Google Scholar]
- Zhuang, F.; Cheng, X.; Pan, S.J.; Yu, W.; He, Q.; Shi, Z. Transfer learning with multiple sources via consensus regularized autoencoders. In Proceedings of the Joint European Conference on Machine Learning and Knowledge Discovery in Databases, Nancy, France, 15–19 September 2014; Springer: Berlin, Germany, 2014; pp. 417–431. [Google Scholar]
- Olshausen, B.A.; Field, D.J. Sparse coding with an overcomplete basis set: A strategy employed by v1? Vis. Res. 1997, 37, 3311–3325. [Google Scholar] [CrossRef]
- Kullback, S. Information Theory and Statistics; Courier Corporation: Chelmsford, MA, USA, 1997. [Google Scholar]
- Ng, A. Deep Learning Tutorial. 2015. Available online: http://ufldl.stanford.edu/tutorial/unsupervised/Autoencoders (accessed on 1 June 2017).
- Ngiam, J.; Coates, A.; Lahiri, A.; Prochnow, B.; Le, Q.V.; Ng, A.Y. On optimization methods for deep learning. In Proceedings of the 28th International Conference on Machine Learning (ICML-11), Bellevue, WA, USA, 28 June–2 July 2011; pp. 265–272. [Google Scholar]
- Møller, M.F. A scaled conjugate gradient algorithm for fast supervised learning. Neural Netw. 1993, 6, 525–533. [Google Scholar] [CrossRef]
- Bengio, Y.; Lamblin, P.; Popovici, D.; Larochelle, H. Greedy layer-wise training of deep networks. Adv. Neural Inf. Process. Syst. 2007, 19, 153. [Google Scholar]


| Healthy sEMG Data | |||||||
| Day | D1 | D2 | D3 | D4 | D5 | D6 | D7 |
| D1 | - | 2.29 | 3.06 | 2.23 | 3.09 | 2.74 | 3.88 |
| D2 | 10.28 | - | 3.8 | 3.15 | 3.23 | 2.95 | 3.65 |
| D3 | 10.4 | 9.96 | - | 3.74 | 4.08 | 3.57 | 4.31 |
| D4 | 11.22 | 11.37 | 11.02 | - | 3.02 | 2.61 | 3.45 |
| D5 | 13.16 | 12.78 | 12.68 | 11.43 | - | 2.53 | 3.46 |
| D6 | 12.74 | 12.94 | 12.66 | 12 | 11.11 | - | 2.69 |
| D7 | 13.54 | 13.56 | 13 | 11.62 | 11.31 | 9.95 | - |
| Healthy iEMG Data | |||||||
| Day | D1 | D2 | D3 | D4 | D5 | D6 | D7 |
| D1 | - | 5.68 | 6.63 | 6.03 | 5.7 | 5.15 | 6.25 |
| D2 | 21.69 | - | 5.36 | 4.75 | 4.79 | 3.93 | 4.54 |
| D3 | 23.42 | 17.93 | - | 5.19 | 5.03 | 4.78 | 5.24 |
| D4 | 21.96 | 19.5 | 18.16 | - | 5.16 | 5.2 | 5.33 |
| D5 | 24.68 | 21.03 | 20.52 | 18.98 | - | 3.05 | 3.58 |
| D6 | 23.59 | 20.19 | 20.96 | 18.73 | 17.66 | - | 3.12 |
| D7 | 23.85 | 20.53 | 19.03 | 19.65 | 16.55 | 15.9 | - |
| Amputee sEMG Data | |||||||
| Day | D1 | D2 | D3 | D4 | D5 | D6 | D7 |
| D1 | - | 14.56 | 16.23 | 14.4 | 15.47 | 13.21 | 12.18 |
| D2 | 34.75 | - | 14.32 | 13.51 | 12.96 | 11.54 | 11.48 |
| D3 | 38.19 | 34.03 | - | 16.4 | 15.84 | 12.73 | 13.31 |
| D4 | 32.27 | 31.77 | 34.36 | - | 13.49 | 11.83 | 12.11 |
| D5 | 36.1 | 33.21 | 34.79 | 30.56 | - | 10.34 | 10.78 |
| D6 | 31.45 | 30.42 | 30.76 | 27.42 | 24.18 | - | 8.57 |
| D7 | 34.12 | 31.01 | 32.27 | 27.92 | 25.38 | 20.91 | - |
| Amputee iEMG Data | |||||||
| Days | D1 | D2 | D3 | D4 | D5 | D6 | D7 |
| D1 | - | 15.84 | 17.41 | 18.64 | 16 | 16.46 | 15.32 |
| D2 | 36.15 | - | 14.96 | 16.99 | 13.39 | 13.76 | 13.53 |
| D3 | 39.66 | 34.25 | - | 16.54 | 13.76 | 13.83 | 13.74 |
| D4 | 38.16 | 33.58 | 33.91 | - | 15.11 | 15.2 | 14.43 |
| D5 | 38 | 34.23 | 35.01 | 32.42 | - | 11.79 | 12.78 |
| D6 | 36.07 | 33.56 | 34.9 | 32.55 | 29.47 | - | 13.16 |
| D7 | 36.75 | 31.99 | 34.11 | 31.18 | 28.97 | 27.72 | - |
© 2018 by the authors. Licensee MDPI, Basel, Switzerland. This article is an open access article distributed under the terms and conditions of the Creative Commons Attribution (CC BY) license (http://creativecommons.org/licenses/by/4.0/).
Share and Cite
Zia ur Rehman, M.; Gilani, S.O.; Waris, A.; Niazi, I.K.; Slabaugh, G.; Farina, D.; Kamavuako, E.N. Stacked Sparse Autoencoders for EMG-Based Classification of Hand Motions: A Comparative Multi Day Analyses between Surface and Intramuscular EMG. Appl. Sci. 2018, 8, 1126. https://doi.org/10.3390/app8071126
Zia ur Rehman M, Gilani SO, Waris A, Niazi IK, Slabaugh G, Farina D, Kamavuako EN. Stacked Sparse Autoencoders for EMG-Based Classification of Hand Motions: A Comparative Multi Day Analyses between Surface and Intramuscular EMG. Applied Sciences. 2018; 8(7):1126. https://doi.org/10.3390/app8071126
Chicago/Turabian StyleZia ur Rehman, Muhammad, Syed Omer Gilani, Asim Waris, Imran Khan Niazi, Gregory Slabaugh, Dario Farina, and Ernest Nlandu Kamavuako. 2018. "Stacked Sparse Autoencoders for EMG-Based Classification of Hand Motions: A Comparative Multi Day Analyses between Surface and Intramuscular EMG" Applied Sciences 8, no. 7: 1126. https://doi.org/10.3390/app8071126