Research on the Hygroscopicity of a Composite Hygroscopic Material and its Influence on Indoor Thermal and Humidity Environment

1
College of Civil Engineering, Hunan University, Changsha 410006, China
2
College of Engineering, Hunan Agriculture University, Changsha 410128, China
*
Author to whom correspondence should be addressed.
Appl. Sci. 2018, 8(3), 430; https://doi.org/10.3390/app8030430
Submission received: 12 February 2018
/
Revised: 28 February 2018
/
Accepted: 10 March 2018
/
Published: 13 March 2018
(This article belongs to the Section Materials Science and Engineering)
Abstract
:Indoor air humidity is closely related to daily life and productivity. It is necessary to develop new materials which can maintain the indoor humidity environment steady within an acceptable range of 40–70%. In this paper a new composite hygroscopic material composed of wood fibre and sepiolite with expanded perlite (CHM-WSE) is used in a building envelope to evaluate its moisture buffering performance. A series of experiments assessing the microstructure, hygroscopicity, mechanical and thermodynamic properties of the new composite hygroscropic material have been executed. Furthermore, a numerical model for predicting the influence of humidity environment and energy consumption on composite hygroscopic mortar in different climatic regions has been established. The experiments show that the indoor moisture buffering performance in late spring is better than that in winter, when the practical moisture buffering performance can reach at 0.89 g/(m2%RH)@8/16h; and the non-uniformity coefficient of indoor relative humidity is about 0.006. The simulation results show that a room with CHM-WSE is more comfortable than a common mortar (CM) room, and it has better energy-saving performance in the hot summer and cold winter (HSCW) region in China. The experiments and simulations show that the developed hygroscopic material could be feasible for application in buildings.
1. Introduction
Relative air humidity is one of the important environmental parameters closely related to daily life and productivity [1]. Many evidences have indicated that high or low indoor humidity environments are closely related to many health problems [2,3,4], energy consumption [5] and the durability of the building envelope [6,7]. Therefore, it is essential to maintain the indoor humidity environment steady within an acceptable range of 40–70% [8].
It is well known that porous materials have excellent adsorption properties. For example, hygroscopic building materials can absorb moisture in a high humidity environment and desorb it in a low humidity environment, and thus they can adjust the indoor relative humidity without energy consumption. These materials have drawn increasing interest of researchers.
The humidity level in a building depends on a combination of factors, such as moisture sources, ventilation and air movement, sources and sinks, heating, insulation, external conditions, as well as building materials and occupant behaviour. Among these, the moisture buffering performance of the materials used in a building is an important factor. Researchers have carried out extensive studie on the microstructure, the adsorption/desorption isotherm, and moisture absorption performance of composite hygroscopic materials.
Kaufhold et al. [9] investigated specific surface area of different bentonites considering them strictly relating to microporosity. Several studies have investigated the hygrothermal properties of unfired clays and shown their potential for passive buffering of relative humidity fluctuations in building physics applications [10,11,12,13,14]. Standard evaluation methods for the assessment of the moisture buffering performance of building materials have been issued in Japan, America and China. The moisture buffering characteristics of hygroscopic materials used for interior finishing or furnishing materials in buildings can improve thermal comfort and save energy by reducing the operating hours and/or the size of HVAC systems [15,16,17,18,19].
Mitchell et al. [20] investigated the hygroscopic adsorption/desorption and thermal properties of expanded vitrified small hollow ball (EVSB) and normal expanded perlite particle (NEPP) mortars. Osanyintola et al. [21,22] used the moisture buffer value (MBV) testing method to investigate the factors influencing the buffering capacity of plywood in two different facilities. Wu et al. [23] moulded a series of wood fibre, sepiolite and expanded perlite (WSE)-based mortars, and tested the hygroscopic performance, thermal and mechanical properties of these mortars. They pointed out that WSE-based mortars have good moisture adsorption and desorption properties.
Moisture buffering is the dynamic process of the interaction between the hygroscopic materials and the indoor humid air, and it is related to the building structure characteristics. In previous research, priority was given to analysis and evaluation the moisture absorption ability of the specimen of hygroscopic building materials. The NORDTEST Project [24], Japanese Industrial Standard (JIS) A1470-1 [25], and ISO/DIS 24353 [26] have proposed experimental methods to evaluate the moisture buffering performance. However, all these methods assume a well-mixed room air and only tested a material sample in a small climatic oven without ventilation. These evaluation methods are limited to the material level.
The moisture buffering performance is often disregarded by building designers and engineers. The moisture buffer capacity of the wall covering materials, as well as furniture and textiles inside the buildings, define the hygroscopic inertia level of a room, which can play an important role in the reduction of RH peaks. There are few studies about the application of hygroscopic materials for building envelopes and its impact on the indoor environment. At the same time few large-scale experimental investigations have been carried out on the hygroscopic material buffering performance at the room level. In this paper, a variety of energy-saving and environment-friendly hygroscopic materials are studied. A composite hygroscopic mortar is made using different mixing proportions, and those with better performance are selected and applied to a building envelope. Comparative temperature and humidity distribution experiments on the indoor air of a room with CHM-WSE and CM are performed. Based on these results the effect of hygroscopic materials on the distribution of the relative humidity in the large scale space in different seasons, temperatures and humidity conditions of central China are tested. Central China has some typical climate characteristics such as wet and cold weather in winter and wet and hot weather in late spring. The heating and cooling energy consumption and humidity distribution of the test room in different climatic regions are simulated to study the hygroscopictiy and energy-saving performance of the materials.
2. Materials and Method
2.1. Testing the Composite Hygroscopic Material
2.1.1. Specimens
The hygroscopic aggregate is composed of wood fibre, sepiolite, expanded perlite, and abbreviated as WSE. The pore structure and bulk density parameters are shown in Table 1. Xie [27] and Wu [28] concluded that the WSE-based mortar has good adsorption properties.
Polypropylene fibres of 6 mm average fibre length, were obtained from company (Tian Xie Chemical Co., Ltd., Nanjing, China). Redispersible powder (RP) can improve the workability of the cement paste and increase the adhesive strength and enhance the application performance of the mortar. The main component of diatom ooze is diatomite. It has large specific surface area and good adsorbability.
Taking WSE as a reference, and adding in different ratios of diatom ooze, polypropylene fiber, redispersible powder, Portland cement (P.O 42.5) we prepared composite hygroscopic mortar specimens with different mixing proportions. The ratios are shown in Table 2. In group A, cement is replaced by diatom ooze (by mass ratio), and the polypropylene fiber mortar incorporated in group A is 10%, 30%, 70% of that in group C, respectively. In Group B, 50% sepiolite is replaced by diatom ooze (by mass ratio), and wood fiber, sepiolite, and expanded perlite are mixed in volume proportions of 1:1:4. Group C-1 composed of wood fiber, sepiolite and expanded perlite in a volume proportion of 1:2:4 functions as the reference material. Group C-2 does not contain added polypropylene fiber.
In order to ensure the aggregate, reinforcing fiber, modified component and gelling components are well mixed and at the same time that the aggregate is not damaged, a multi-stage mixing method is adopted in mixing the raw materials. Before mechanical stirring, an artificial premix is adopted to ensure the raw materials are well mixed, and then the cement is added with a blender, mixing for 1 min, then a moderate amount of water is added with stirring for 3 min.
The composite hygroscopic mortars are cured in an environment of 23°C and 98% RH for 7 days and then the RH is adjusted to 45%~75% for 21 days. The surface is covered with polyethylene film.
2.1.2. Microstructure Characterization
The porous structure, pore size distribution, pore volume and specific surface area of the material determine the rate of moisture absorption and desorption and the rate of moisture absorption and desorption. In this study, an environmental scanning electron microscope (SEM) (QUANTA 200, FEI, Hillsboro, TX, USA) is used to observe and study the micromorphology of the composite hygroscopic materials. According to ISO15901 [29], a Brunauer-Emmett-Teller (BET) surface area analyzer and the Barret-Joyner-Halenda (BJH) (Tri-star 3020, Micromeritics, Norcross, GA, USA) method are used to describe the pore features of the specimens.
2.1.3. Mechanical Strength
Composite hygroscopic materials used as the coating mortar in a building envelope, should meet the mechanical requirements of building materials. Compressive strength and flexural strength are tested to meet the plastering requirement of mortar. According to the Chinese standard GB/T 5486.2 [30], 40 mm × 40 mm × 160 mm cube specimens are moulded for test, taking the average of 10 groups of measurement.
2.1.4. Adsorption/Desorption Isotherm
The adsorption/desorption isotherm is the basis of any dynamic analysis of moisture transfer and represents an important means of assessing the hygroscopic properties of materials. The isothermal adsorption curve is based on the moisture content of the test material according to ISO 12571 [31]. The experimental climate chamber is equipped with an oven. The temperature of the oven is controlled by an electric heater wire and the relative humidity is controlled by different saturated salt solutions. The specimen size is 100 mm × 100 mm × 20 mm. The specimens were dried at 105 °C to constant weight after being cured under standard conditions. Before each test, the cured specimens are placed in the climatic chamber for a test interval of not less than 24 h until the mass change of two consecutive measurements is less than 0.1%.
After drying, the specimens are wrapped in plastic, cooled to room temperature and weighed. The specimens are then placed in the air above saturated salt solutions in 1-L glass jars until equilibrium is reached. The mass is weighed, and the specimens are placed in a jar with a different salt and the process is repeated with increments of about 10% RH up to 97% RH for the adsorption process. In the experiments, the temperature of isothermal adsorption is set as 20 °C, 25 °C and 40 °C, respectively. The hygroscopic properties of specimens are tested respectively in six kinds of humidity conditions. The equilibrium moisture content (u) at a given relative humidity is calculated as:
where m is the final mass of a specimen after equilibrium is attained between the specimen and the air in the jar at a particular relative humidity, in g; m0 is the mass of the dry specimen, in g.
2.1.5. Density and Effective Thermal Conductivity
After the application of the mortar, the wall components usually contain moisture, and this moisture content changes with the surrounding environment, as does the thermal performance of the material. The thermal conductivities of specimens for different equilibrium moisture contents are tested in this paper according to the ASTM standard C518-04 [32].
Composite hygroscopic mortar was poured into 300 mm × 300 mm × 30 mm steel moulds with glass bottom plates, and the specimens were covered with polyethylene mulch after being moulded. The specimens were dried at 105 °C to constant weight after being cured under standard conditions for testing their dry density and thermal conductivity, taking the average of three measurements.
After testing the thermal conductivity of the dried state, each specimen is moved into the climatic chamber, where the temperature is set to 23 °C, and the relative humidity is set to 5%, 15%, 30%, 50%, respectively. After reaching a constant weight (a weight change of less than 0.1% within three days), the specimen was moved into the thermal conductivity apparatus for testing. A thermal conduction coefficient measurement apparatus DRCD-3030 (Hexing, Shenyang, Liaoning, China) was applied in the tests.
2.1.6. Water Vapor Permeability
Materials which are able to take in or let out moisture either need to be porous or selectively permeable. The water vapor permeability is one of the parameters of the simulation. The transport properties of cement-based materials significantly affect their durability and hygroscopicity. The research of Zhang [33] shows that the water vapor permeability coefficient of expanded perlite under different relative humidity conditions is different (Table 3).
The fitting formula of water vapor permeability coefficient of expanded perlite is as follows [33]:
where φ is relative humidity, in %.
Referring to the multi-component physical parameter and weighted average molecular weight method, the water vapor permeability of a composite hygroscopic material is determined by the density of the water-absorbing material mixture:
where δ is the water vapor permeability, in kg/(m∙Pa∙s); ρ is the density of material, in kg/m3; and i is the material category.
2.2. Moisture Buffer Performance of Room
The moisture buffer performance of a room is the ability of the materials within the room to moderate variations in the relative humidity. These variations can be seasonal or diurnal. The determination of a practical moisture buffer value (MBVpractical) should involve a run time which corresponds to that of typical exposure in practice—typically a daily variation.
2.2.1. Building Descriptions
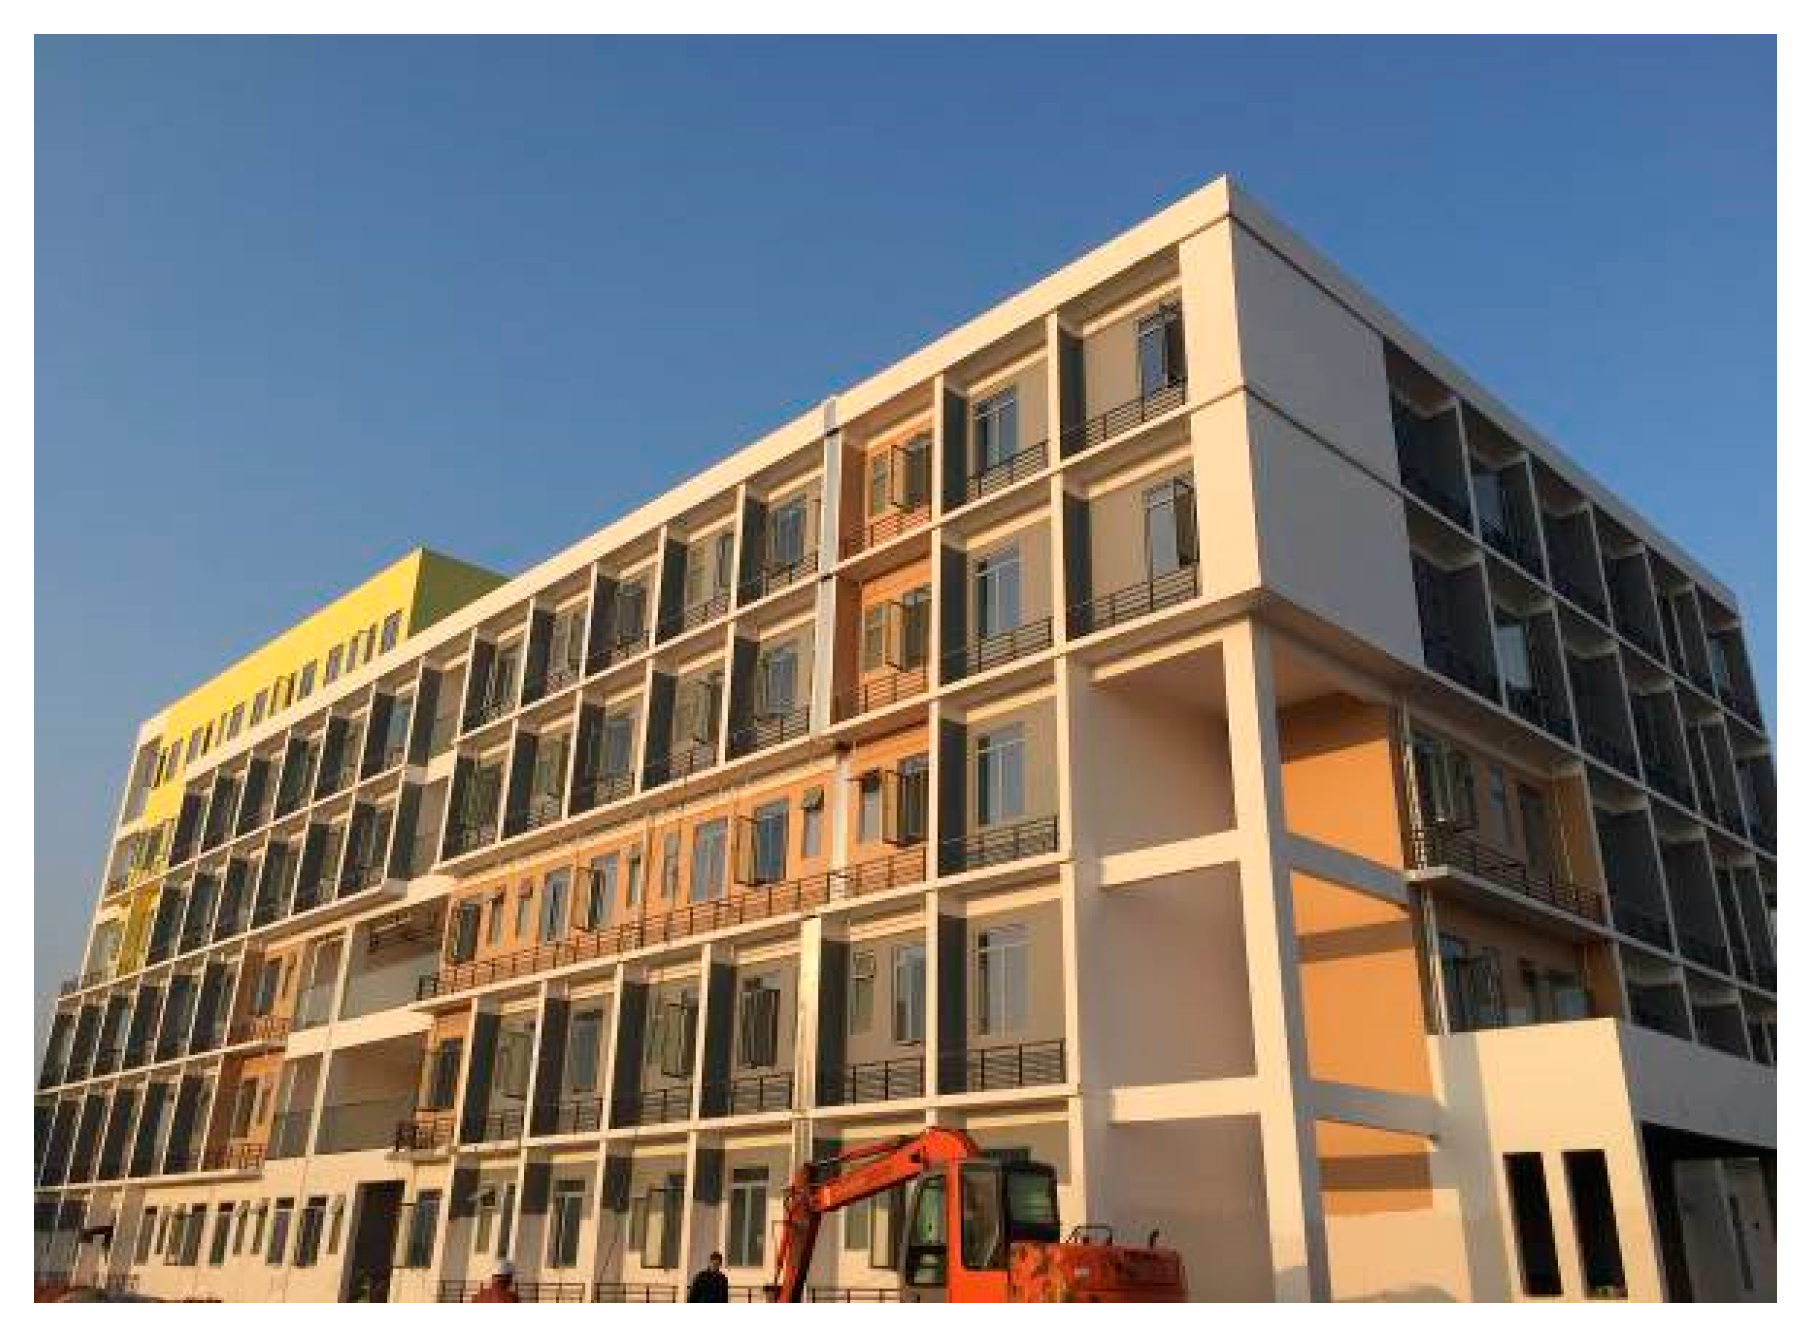
The test room is located in Changsha City, Ningxiang County, Hunan Province. Hunan is located in central China, with a highly humid climate. This test was conducted in January and April. In January, the outdoor temperature is low and relative humidity is high (for most of the time it is more than 95%), but the temperature and humidity changes between day and night are not obvious. April belongs to the late spring season, with typical climate characteristics of high temperature and high humidity, and the changes between day and night are large. Two identical rooms in a building are selected as the test rooms, which are the basic chamber (room I) and hygroscopic chamber (room II), with the same room area and layout. The two rooms are both located on the fifth floor and facing north (Figure 1). The envelope of the test rooms was a typical China residential RC frame structure. The size of each room is 3.0 m × 3.8 m × 3.2 m (length × width × height, Figure 2). There is a washroom in the test room. The washroom door is closed during the testing time, so the influence of the washroom on the tests is ignored. The structure of the building envelope is shown in Table 4. Room I has common cement mortar (CM) plastered on its inner surface. Room II has composite hygroscopic mortar (CHM-WSE) plastered on the inner surface with an area of 39.76 m2. When CHM-WSE is used as interior wall insulation mortar, should be handled gently so as to protect its pore structure.
2.2.2. Experimental Setting
In the performance test of specimens, a small blender is used for preparing the test materials. However, there is a need for a large amount of composite hygroscopic mortar for the room test, so medium-sized equipment is used (Figure 3).
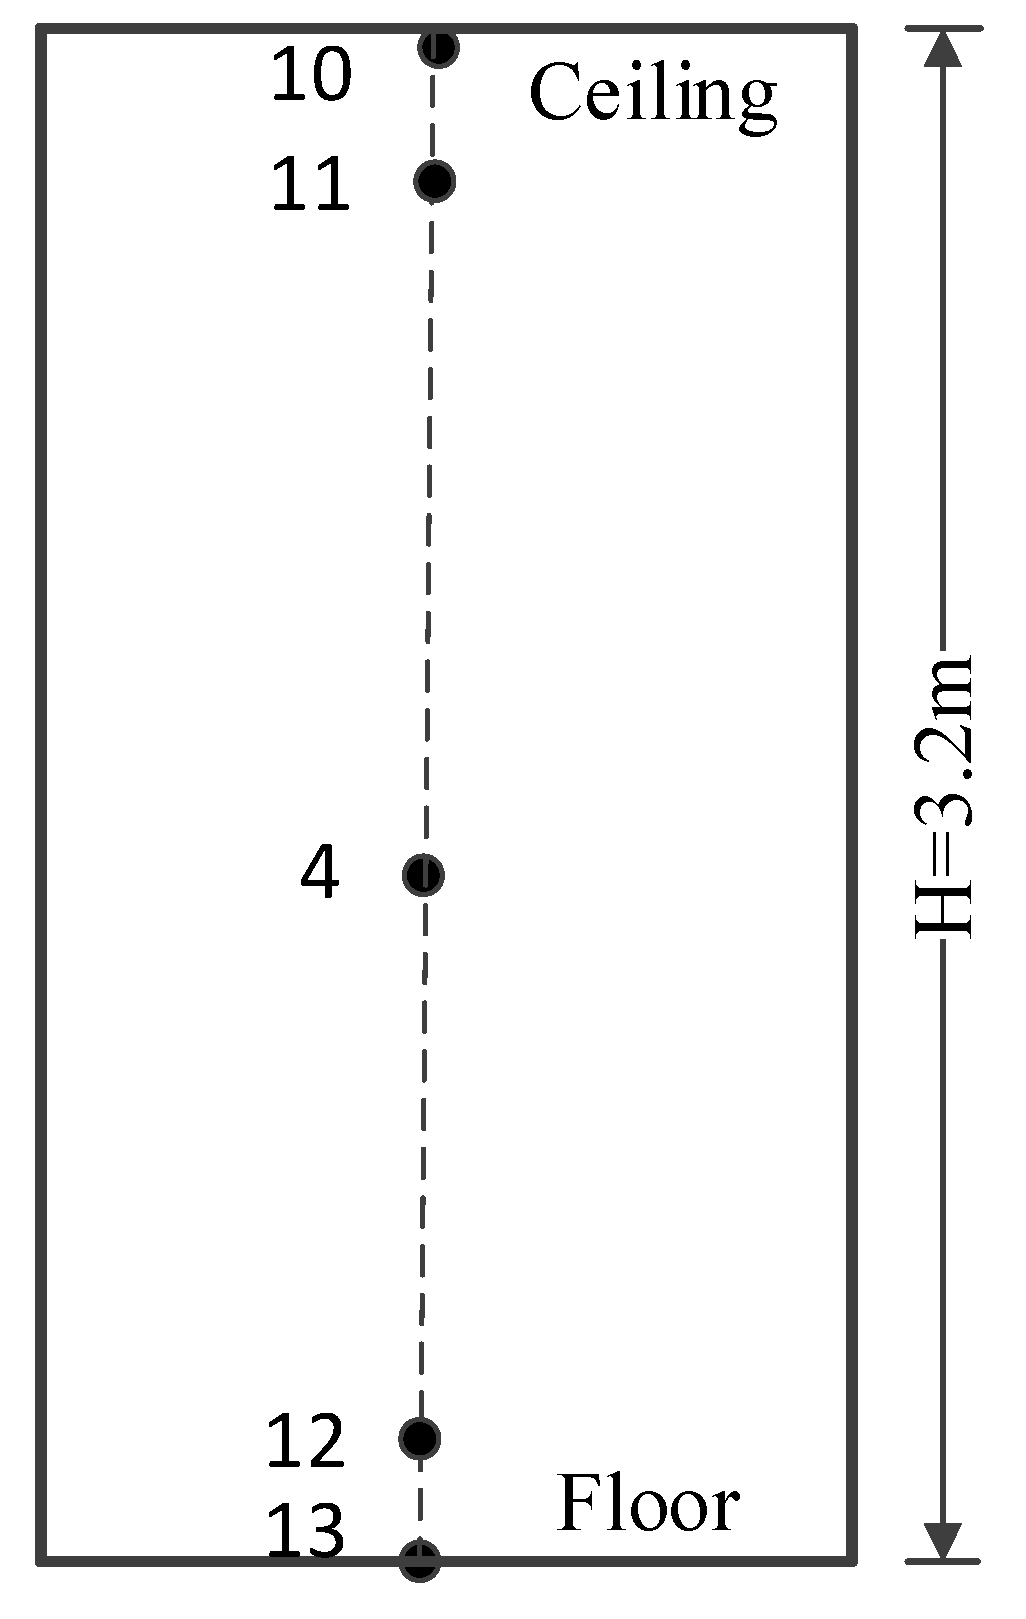
In order to ensure the performance of the porous material was not damaged, a multi-stage mixing method is also adopted in mixing the raw materials for the room test. Before mechanical stirring, manual pre-mixing is conducted to ensure the good mixing of the raw materials. The CHM-WSE was evenly plastered on the inner surface of the wall, except for the ceiling and floor. After 15 days of good ventilation, the primer and finish were plastered in sequence. After the construction was finished, test room was cross ventilated to dry the initial moisture to the mortar application. Tests are carried out independently in each room. Temperature sensors are fixed on the wall, ceiling and floor. The layout of the test room is shown in Figure 4 and Figure 5. Temperature sensors are protected by silver paper from direct radiation. Data is recorded and stored by a 48-channel paperless recorder and a temperature and humidity automatic recorder. The outdoor temperature and humidity meter is arranged in an open space. The sealing performance of doors and windows which are closed during the test to reduce the influence of outdoor parameters on indoor humidity is good. Temperature and humidity are recorded every 0.5 h.
The features of the measuring instruments used in this test are listed in Table 5.
The test compares the indoor temperature and humidity change between the room with CHM-WSE and CM, and takes 24 h as the test duration. In the January test of air conditioning mode, during a 24 h air conditioned heating, humidification is divided into two time periods, daytime 8:30~16:30, with a total of 8 h humidification, and 16:30~8:30 the next day, for a total of 16 h without humidification. In April, tests of no air conditioning and humidifying mode is conducted.
In the practical moisture buffering performance experiment, the moisture load consists of three parts:
where Gb(t) is the moisture load in the room, in kg/m2; ΔG0(t) is the hourly humidity load caused by the difference of indoor and outdoor relative humidity, in kg/m2; ΔGw(t) is the moisture transfer of the internal wall, in kg/m2. The practical moisture buffering can be expressed as:
where As is the used area of hygroscopic material, in m2; tp is the period; ϕ is the relative humidity, in %.
2.3. Hygroscopicity and Energy-Saving Performance of the Composite Hygroscopic Material
In order to further investigate the influence of composite hygroscopic material on the indoor thermal environment and energy consumption of buildings in different climatic region, the simulation model of Combined Heat and Moisture Finite Element (CHMFE) of EnergyPlus is applied.
To fully evaluate the performance of the composite hygroscopic materials, the EnergyPlus software (8.4, GARD Analytics, Inc., Arlington Heights, IL, USA) is used for further analysis and calculation. Taking the measured room as the research object, typical cities in each climatic zone are selected as the representative to analyze the indoor temperature, humidity and energy consumption characteristics of the composite hygroscopic mortar and common mortar room.
Weather data, which includes solar radiation, ambient air dry bulb temperature, ambient air relative humidity, atmospheric pressure, wind speed, wind direction, and so on were provided by the Chinese Standard Weather Data (CSWD). The indoor temperature is set as 18 °C and 26 °C in winter and summer, respectively [34], winter interior design temperature is 18 °C, summer interior design temperature is 26 °C. Outdoor air temperature, relative humidity and solar radiation and other outdoor weather parameters are the typical annual meteorological parameters. The room schedule is shown in Table 5. Taking into account the sealing performance and orientation of on-site doors and windows, the room ventilation is set to an air exchange rate of 0.5 times/h.
3. Results and Discussion
3.1. Specimen Experiment
3.1.1. Appearance Property
Based on the Chinese standard GB/T 20473 [35] and GB/T 9779 [36], optimizing selection of the appearance quality and initial cracking resistance are made. Six test sample groups with better appearance property are selected for further analysis. The results are shown in Table 6. In the molding test, the water consumption of A-3 and B-3 is about 10% more than that of the other samples.
3.1.2. Micromorphology Property
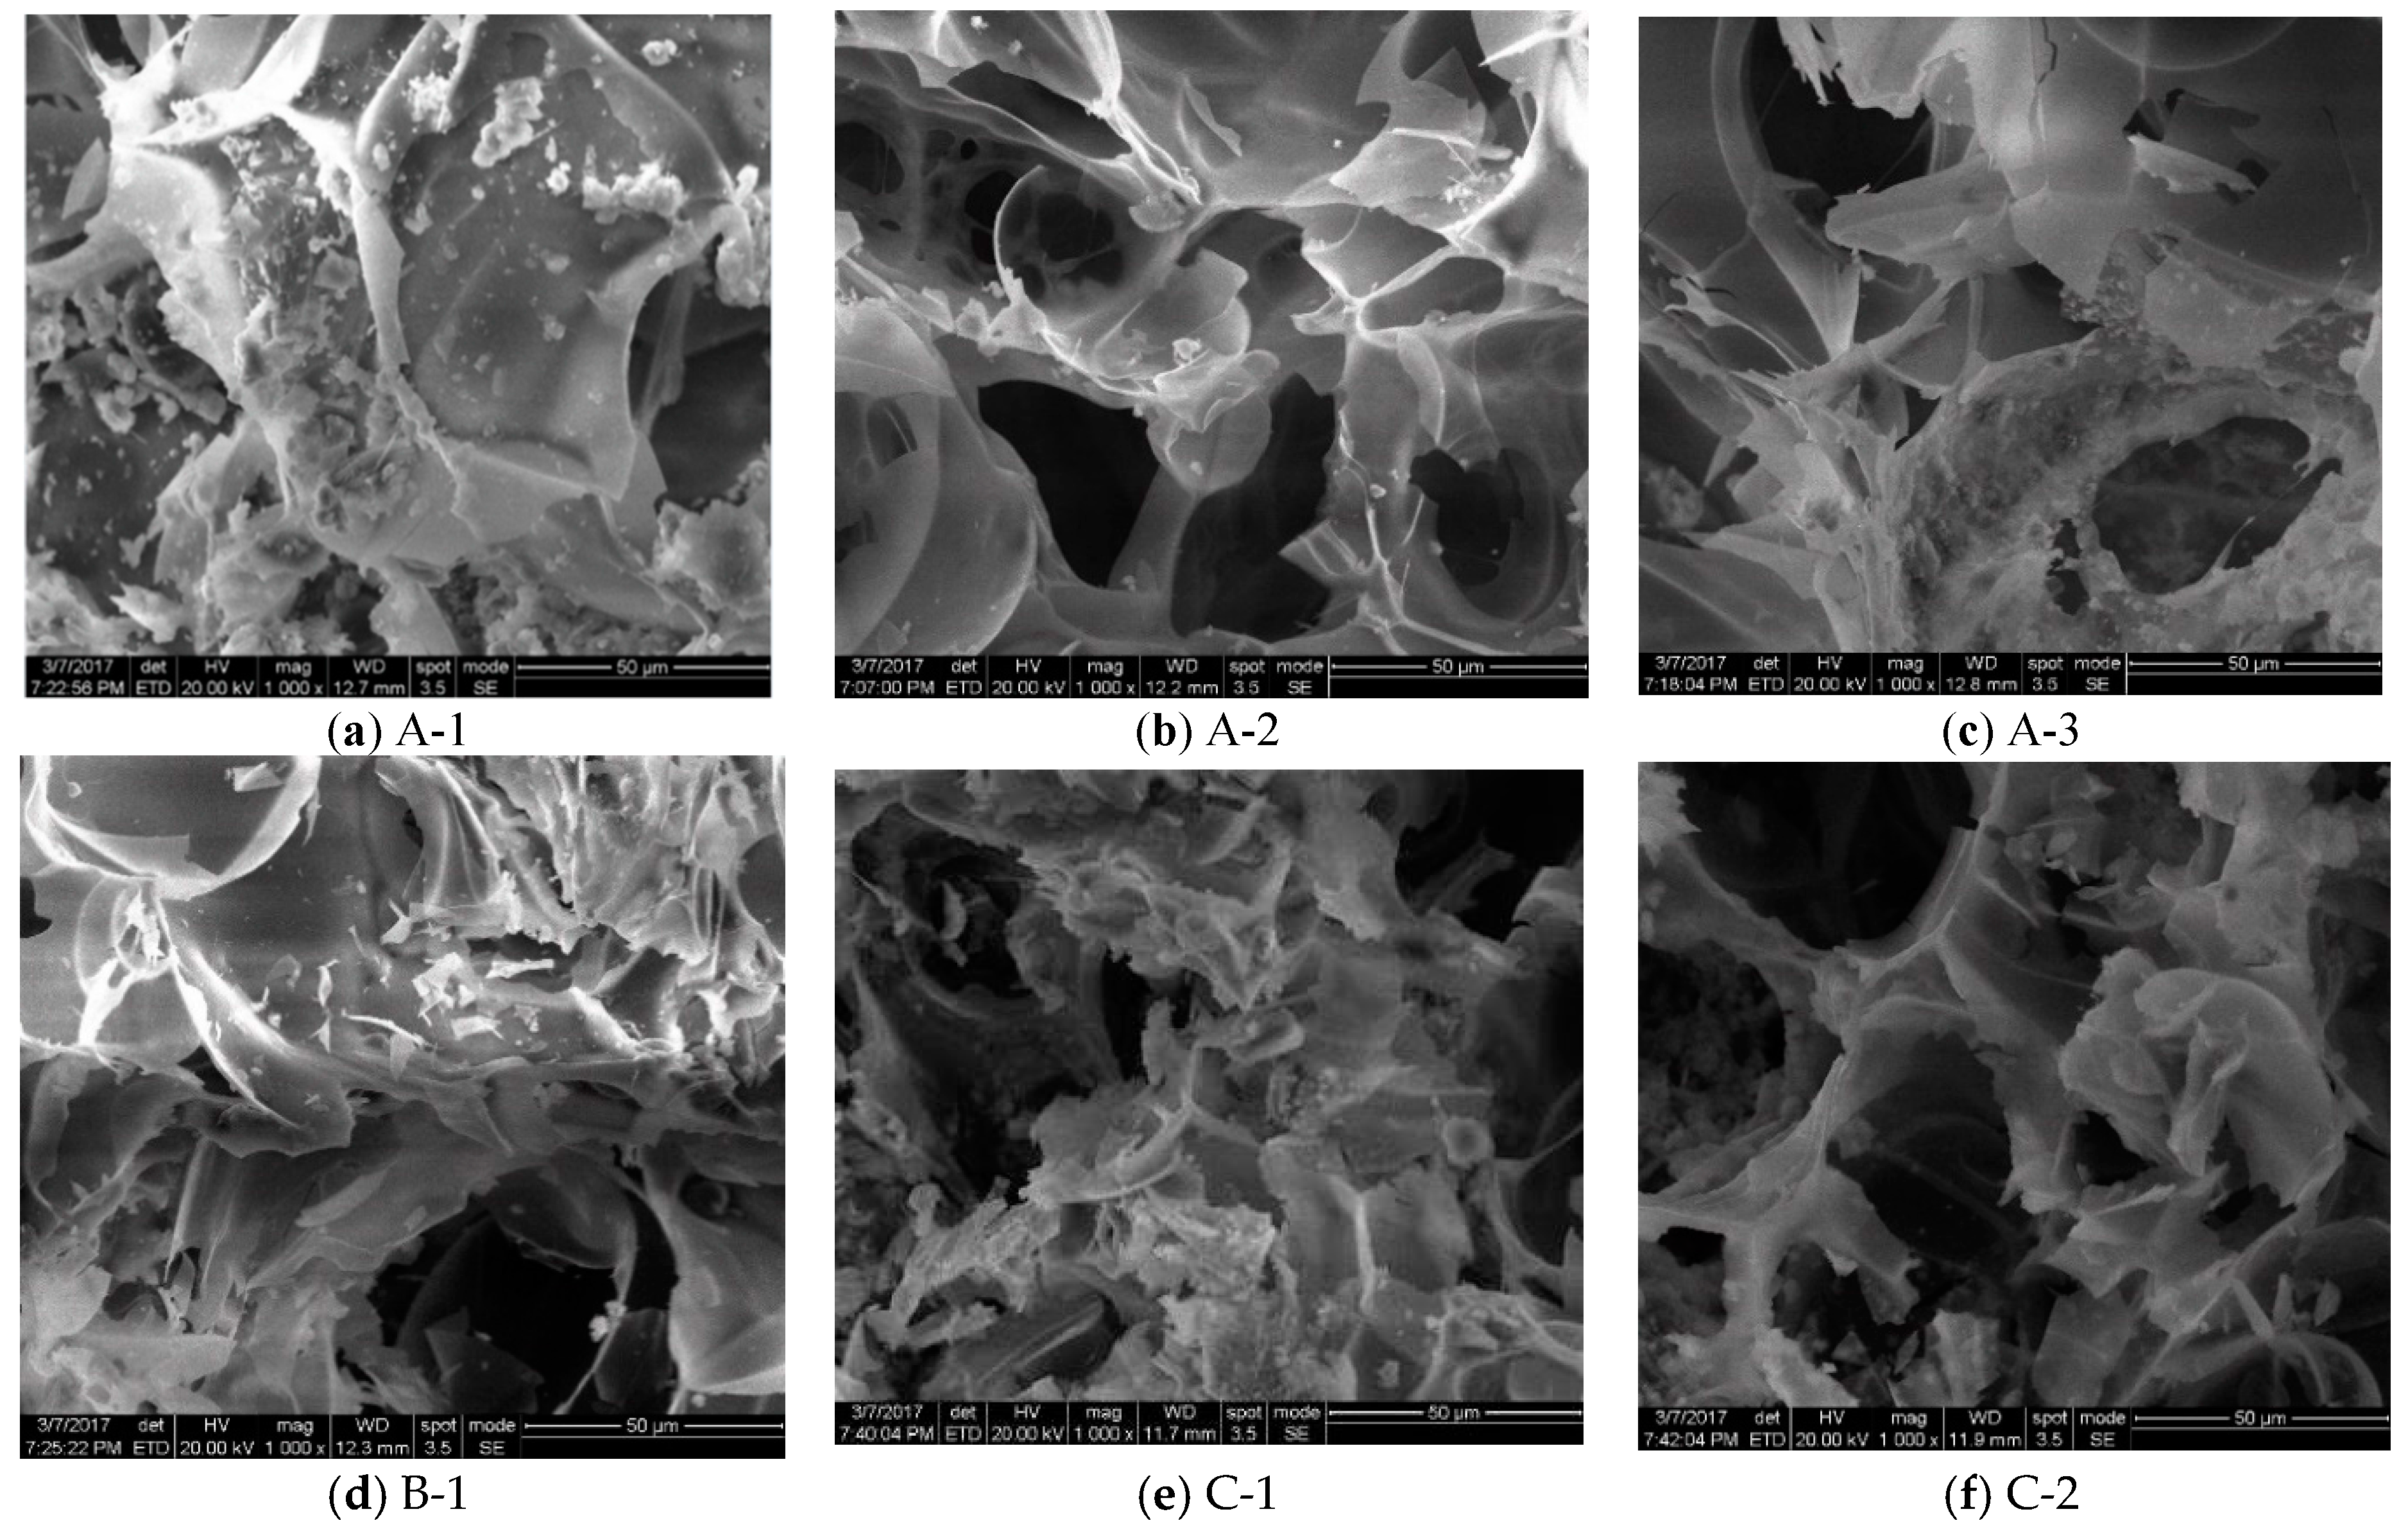
The SEM experiment requires that the sample surface not be broken, massive and with a size of less than 1 cm2. As it is seen in Figure 6, after being magnified 1000 times, the plush wood fiber, fibrous sepiolite and honeycomb-like expanded perlite are clearly observed in the test sample. According to the SEM pictures, there is few macropore in samples A-1 and B-1. The micropore is dominant in these samples. There are many macropores in specimens A-2 and C-2, while in A-3 and C-1 there are mainly micropore and mesopore.
Polypropylene fibers are interlaced in the mortar to form a network structure, and the sepiolite, wood fiber and diatom ooze are enclosed therein to increase the mechanical properties of the composite materials.
3.1.3. Microstructure Properties
Samples A-3, B-1 and C-1 were selected for the specific pore structure tests based on the SEM analysis. The pore structure results are shown in Table 7. The specific surface area of sample C-1 is the largest, which is three times larger than that of sample A-3 and twice as large as that of sample B-1. The pore structure characteristics of CHM-WSE specimens are shown in Table 8. In the pore size distribution of sample C-1, the number of pores in the 10–50 nm range is the largest, the specific surface area and the average pore size are the largest, showing a good pore structure distribution. Most pores of sample A-3 are micropores. Most pores are less than 10 nm, giving the smallest specific surface area and pore volume. Sample B-1 has mostly micropores and macropores, and larger specific surface area. According to the Kelvin capillary condensation theory, relative pressure of adsorbate during capillary condensation is related to pore diameter. The larger pore size, the greater the relative pressure required for the occurrence of capillary condensation. At the same time, the pore volume decreases along with the pore size. Above all, the sample C-1 sample has more adsorption sites and space to accommodate the adsorbent.
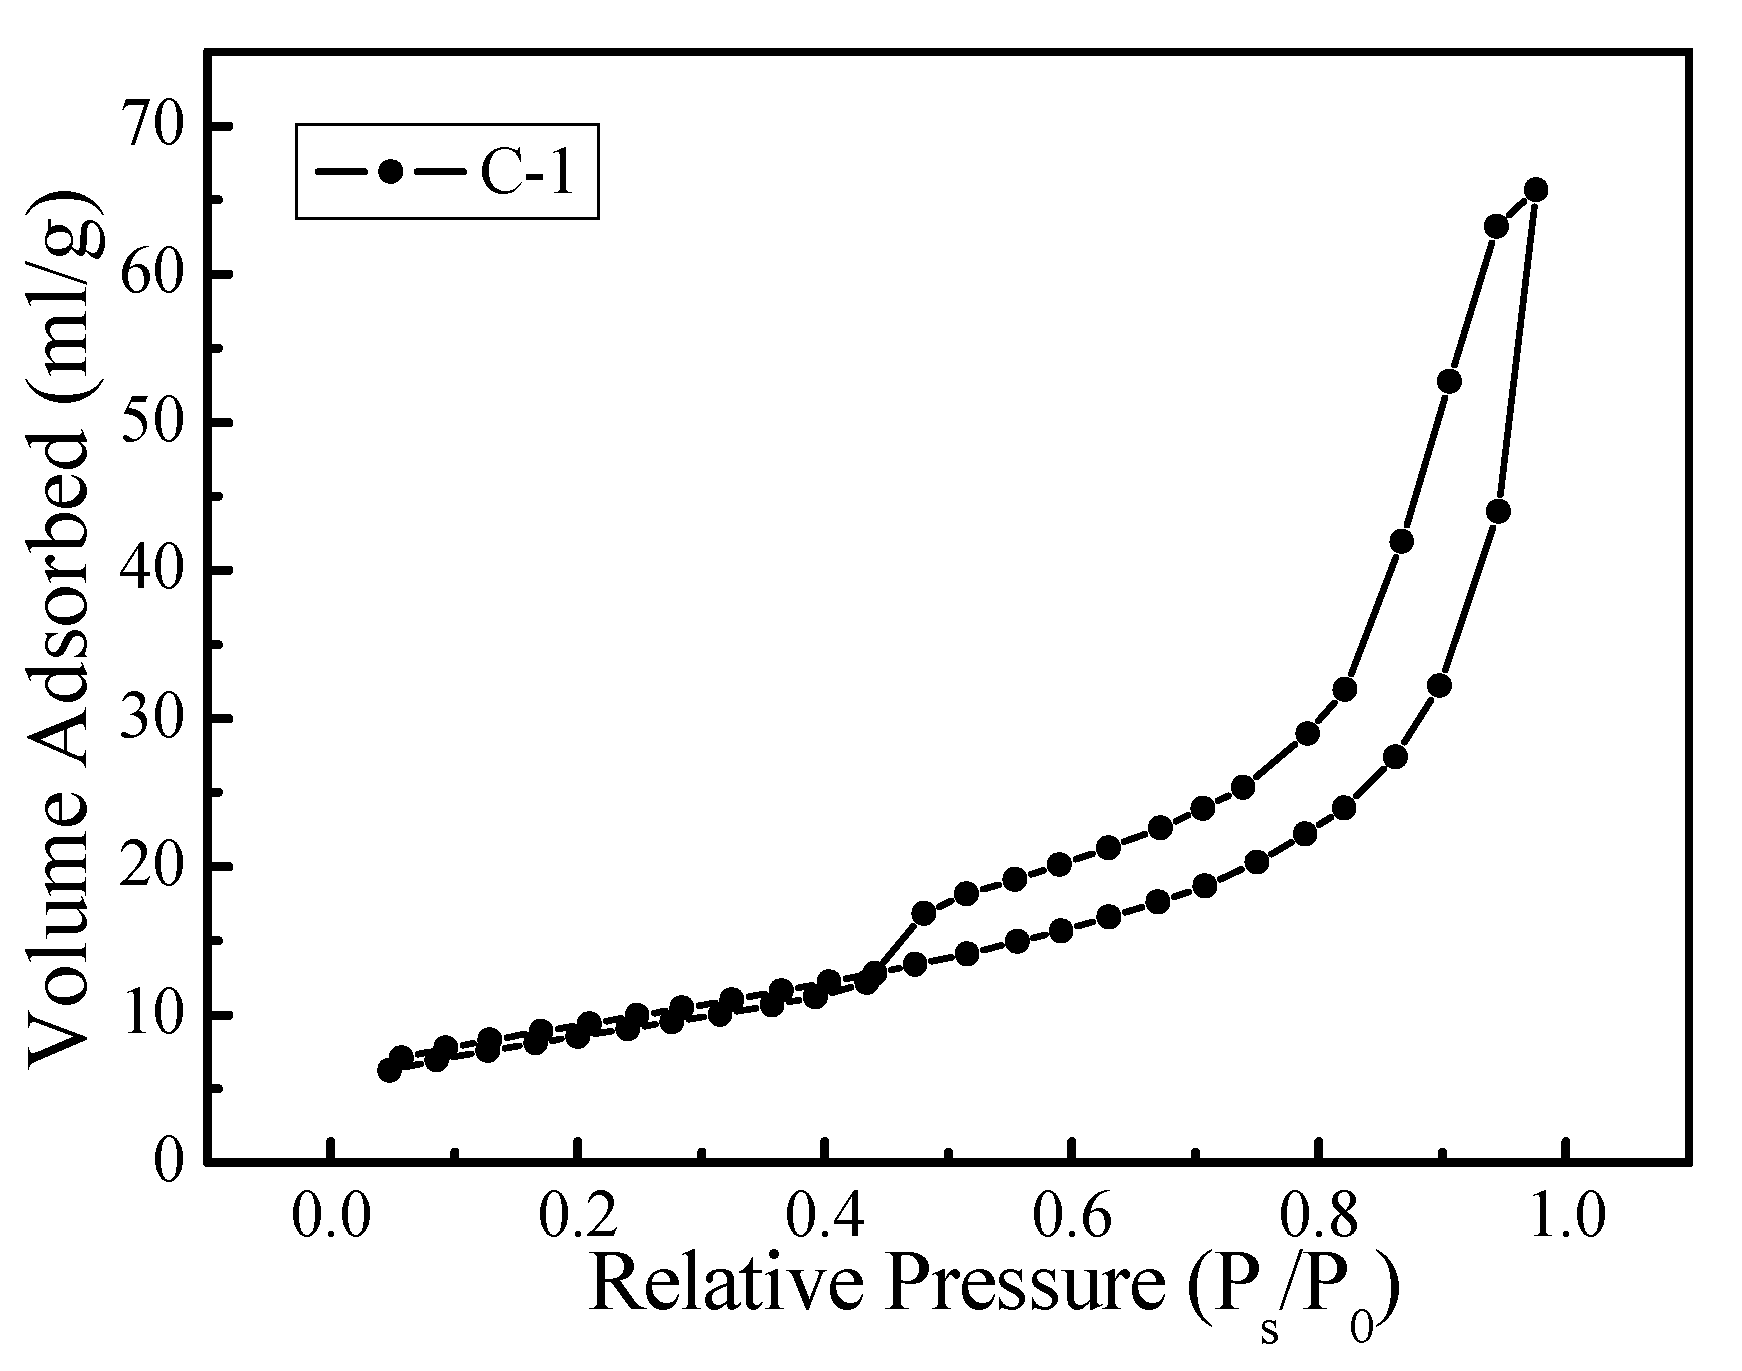
The results of nitrogen adsorption/desorption tests (Figure 7) indicate that all the three kinds of sample show a hysteresis loop during the adsorption and desorption processes. The nitrogen adsorption isotherms are all Type IV. Sample A-3 and sample B-1 have a smaller adsorption capacity. Sample A-3 has a maximum hysteresis loop and a poor regulation performance. The adsorption capacity of sample C-1 is five times larger than that of the previous two, which has a smaller hysteresis loop, and a better regulation performance.
3.1.4. Mechanical Property
Mechanical properties test results are shown in Table 9. The flexural strength and compressive strength of sample C-1 are the best, and the ratio of compressive strength to flexural strength is 3.73.
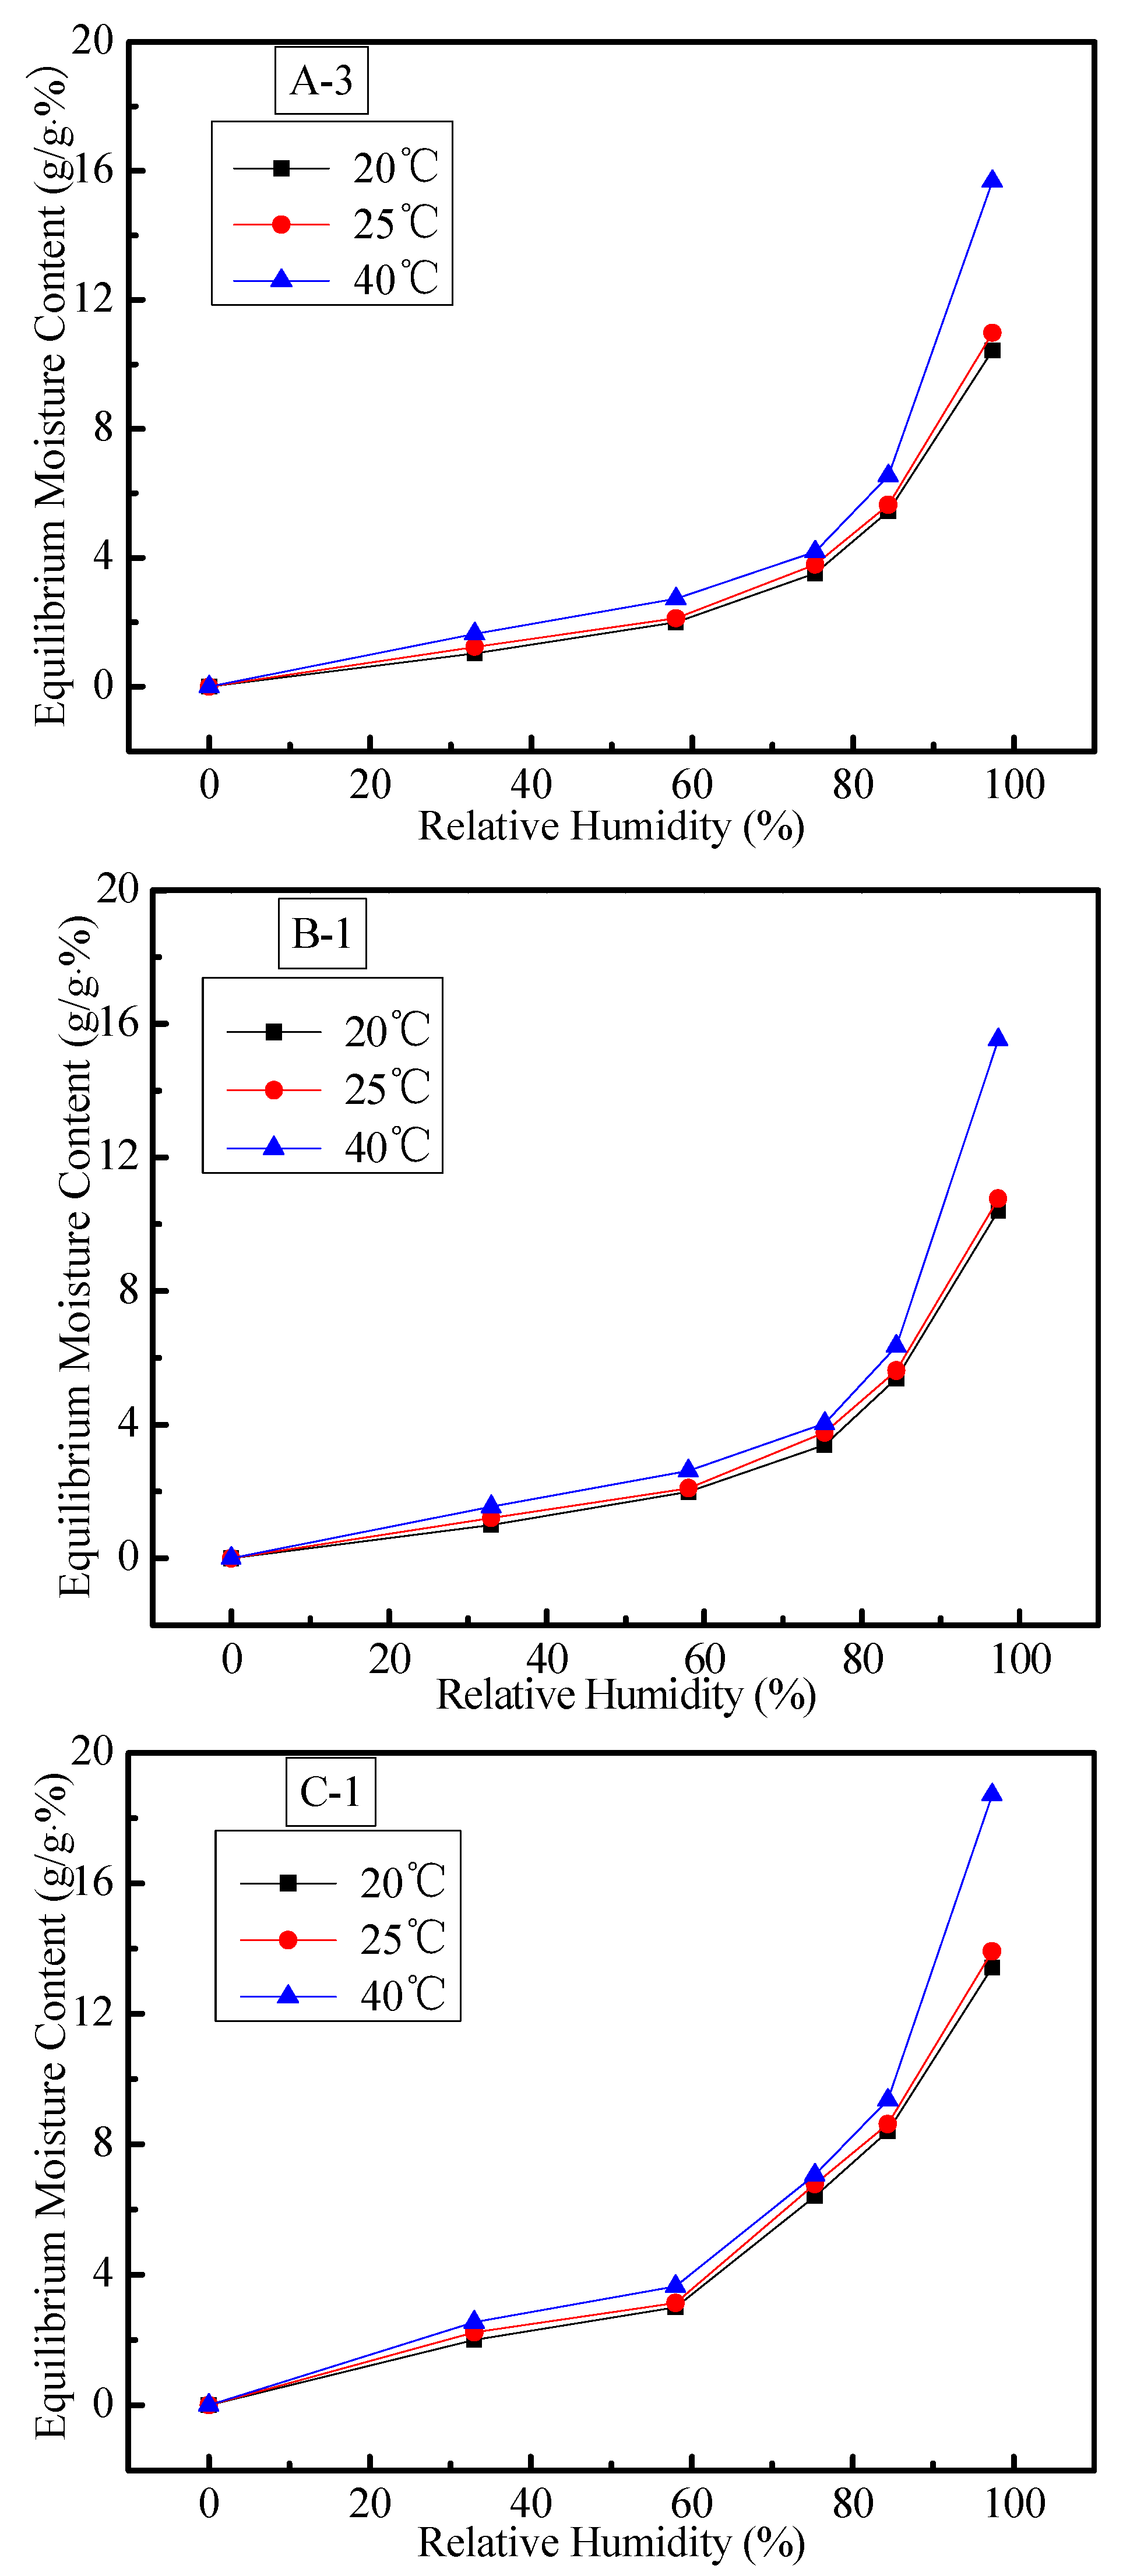
3.1.5. Equilibrium Moisture Content
As it can be seen from the isothermal equilibrium moisture content test results in Figure 8, as the temperature increases, the adsorption capacity of the CHM-WSE increases; as the relative humidity increases, the adsorption capacity of the CHM-WSE also increases. The adsorption increases significantly when the relative humidity is around 80%. The experimental results show that the fitted curve of adsorption content is related to temperature, relative humidity and the specific surface area of the composite hygroscopic mortar. The isothermal adsorption curve of composite hygroscopic mortar is written as follows [31]:
where u is equilibrium moisture content per unit area (in kg/m2); T is environment temperature (in K); is the relative humidity (in %); s is specific surface area (in m2/g).
According to the equilibrium moisture content equation, the adsorption/desorption moisture content of hygroscopic material is related to the distribution of material aperture. When the specific surface area rises, the pore volume increases and the adsorption/desorption capacity grows accordingly.
3.1.6. Thermodynamic Performance
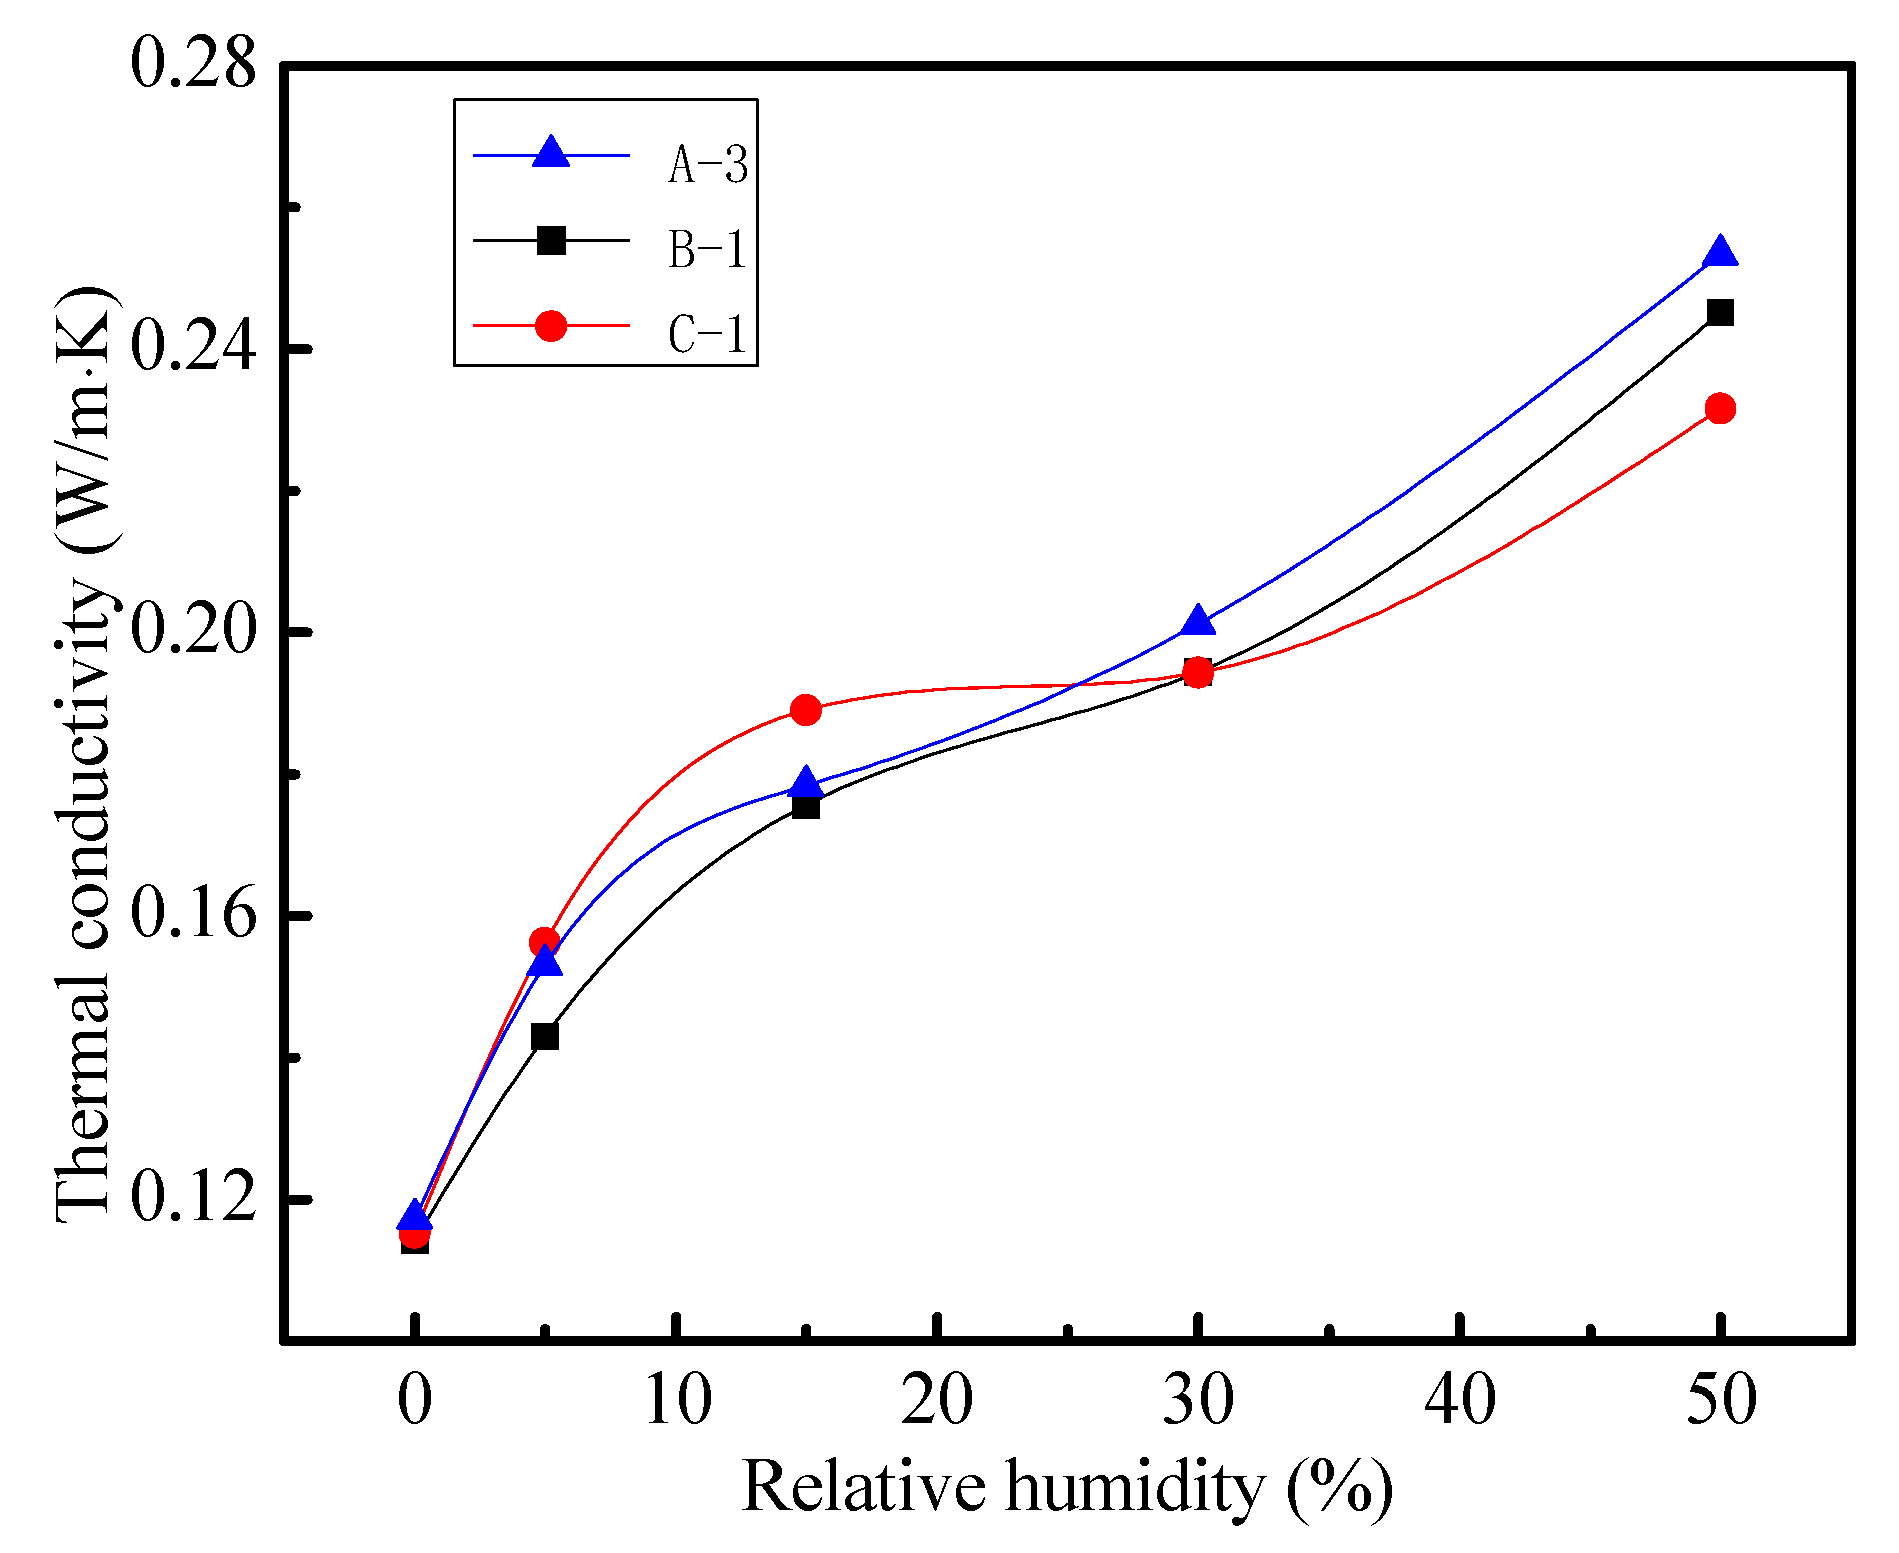
After testing, the thermal conductivity of sample A-3, B-1 and sample C-1 under dry conditions are about 0.114 W/(m∙K), 0.117 W/(m∙K) and 0.115 W/(m∙K), respectively. The results show that the thermal conductivity of the two groups all meet the requirements of a thermal insulation material [37].
After completing the thermal conductivity test under dry condition, the thermal conductivity of the test specimens after reaching the moisture absorption equilibrium is tested under the relative humidity of 5%, 15%, 30% and 50%. The results are shown in Figure 9.
It can be seen from the test results that the thermal conductivity increases with the increase of the relative humidity of the environment. The relative humidity of the environment has a great influence on the thermal conductivity of the mortar. The maximum effective thermal conductivity over the tested range is 0.2533 W/(m∙K), which is two times higher than the dry value of 0.1173 W/(m∙K). The experimental data are curved fitted with a continuous relationship that is represented by a polynomial given below:
where a = 0.1167, b = 0.0076, c = −3 × 10⁻⁴, d = 3 × 10⁻⁶, R2 = 0.9823.
3.2. Test and Evaluation of Hygroscopicity and Practical Moisture Buffering Performance
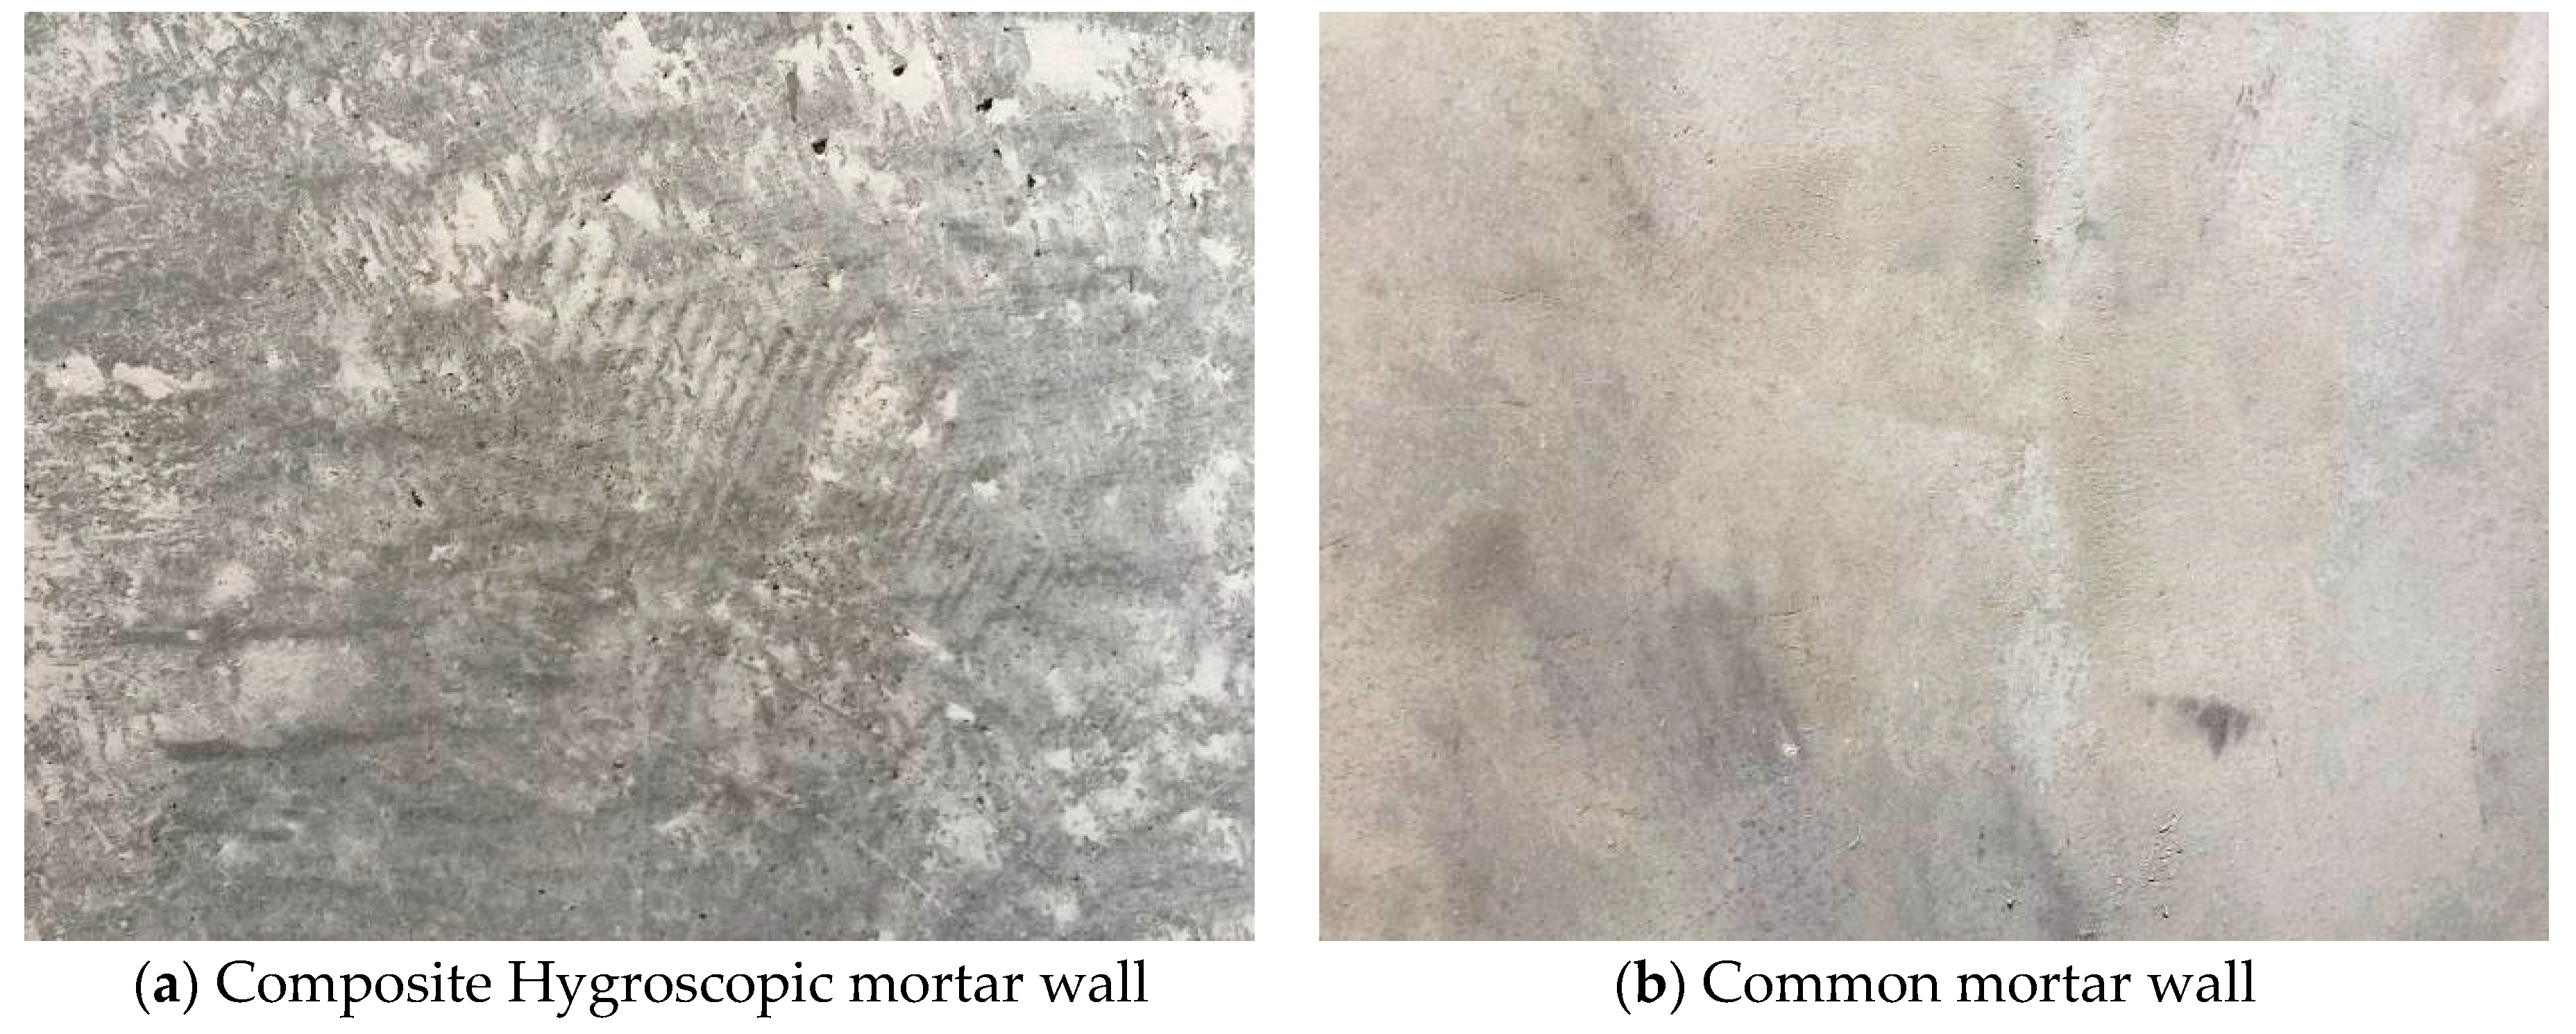
According to the comprehensive comparison of the test results by microscopic performance, adsorption performance, mechanical properties and thermodynamic performance, a new type of composite hygroscopic mortar is prepared using the ratio of the C-1 group and applied to a large scale space test. Three days after the construction and maintenance, the mortars are photographed and are shown in Figure 10. It can be seen that the surface of the composite mortar has tiny pores, and the surface of ordinary mortar has no obvious pores.
3.2.1. Hygroscopicity Test in Winter
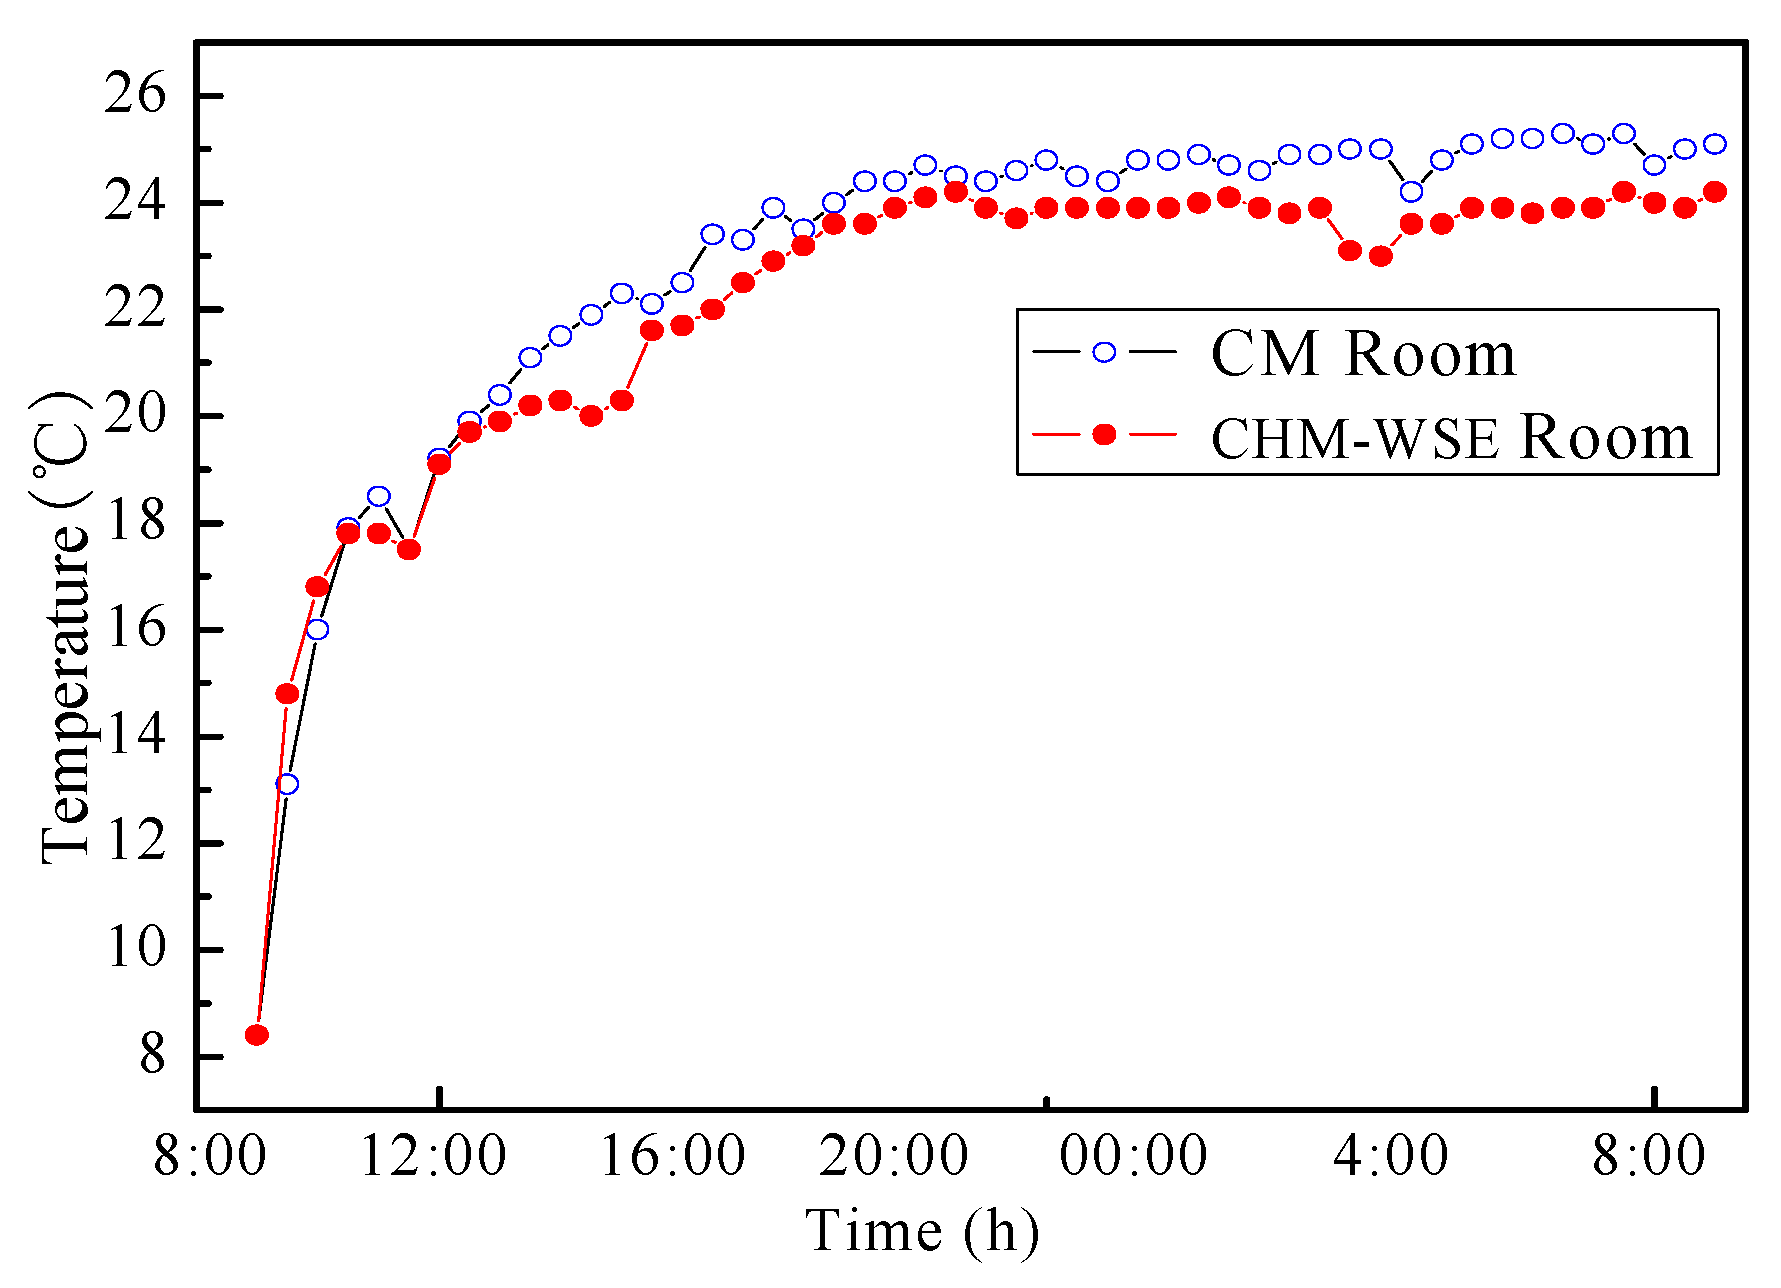
The measured indoor temperature and humidity of the two tested rooms for January is shown in Figure 11. Both rooms have been heated and humidified by the air conditioner and humidifier, respectively. The indoor temperature is set as 24 °C. The outdoor temperature was measured at the range of 4 °C–6 °C, relative humidity is between 95% and 99%, which is a typical wet and cold climate condition.
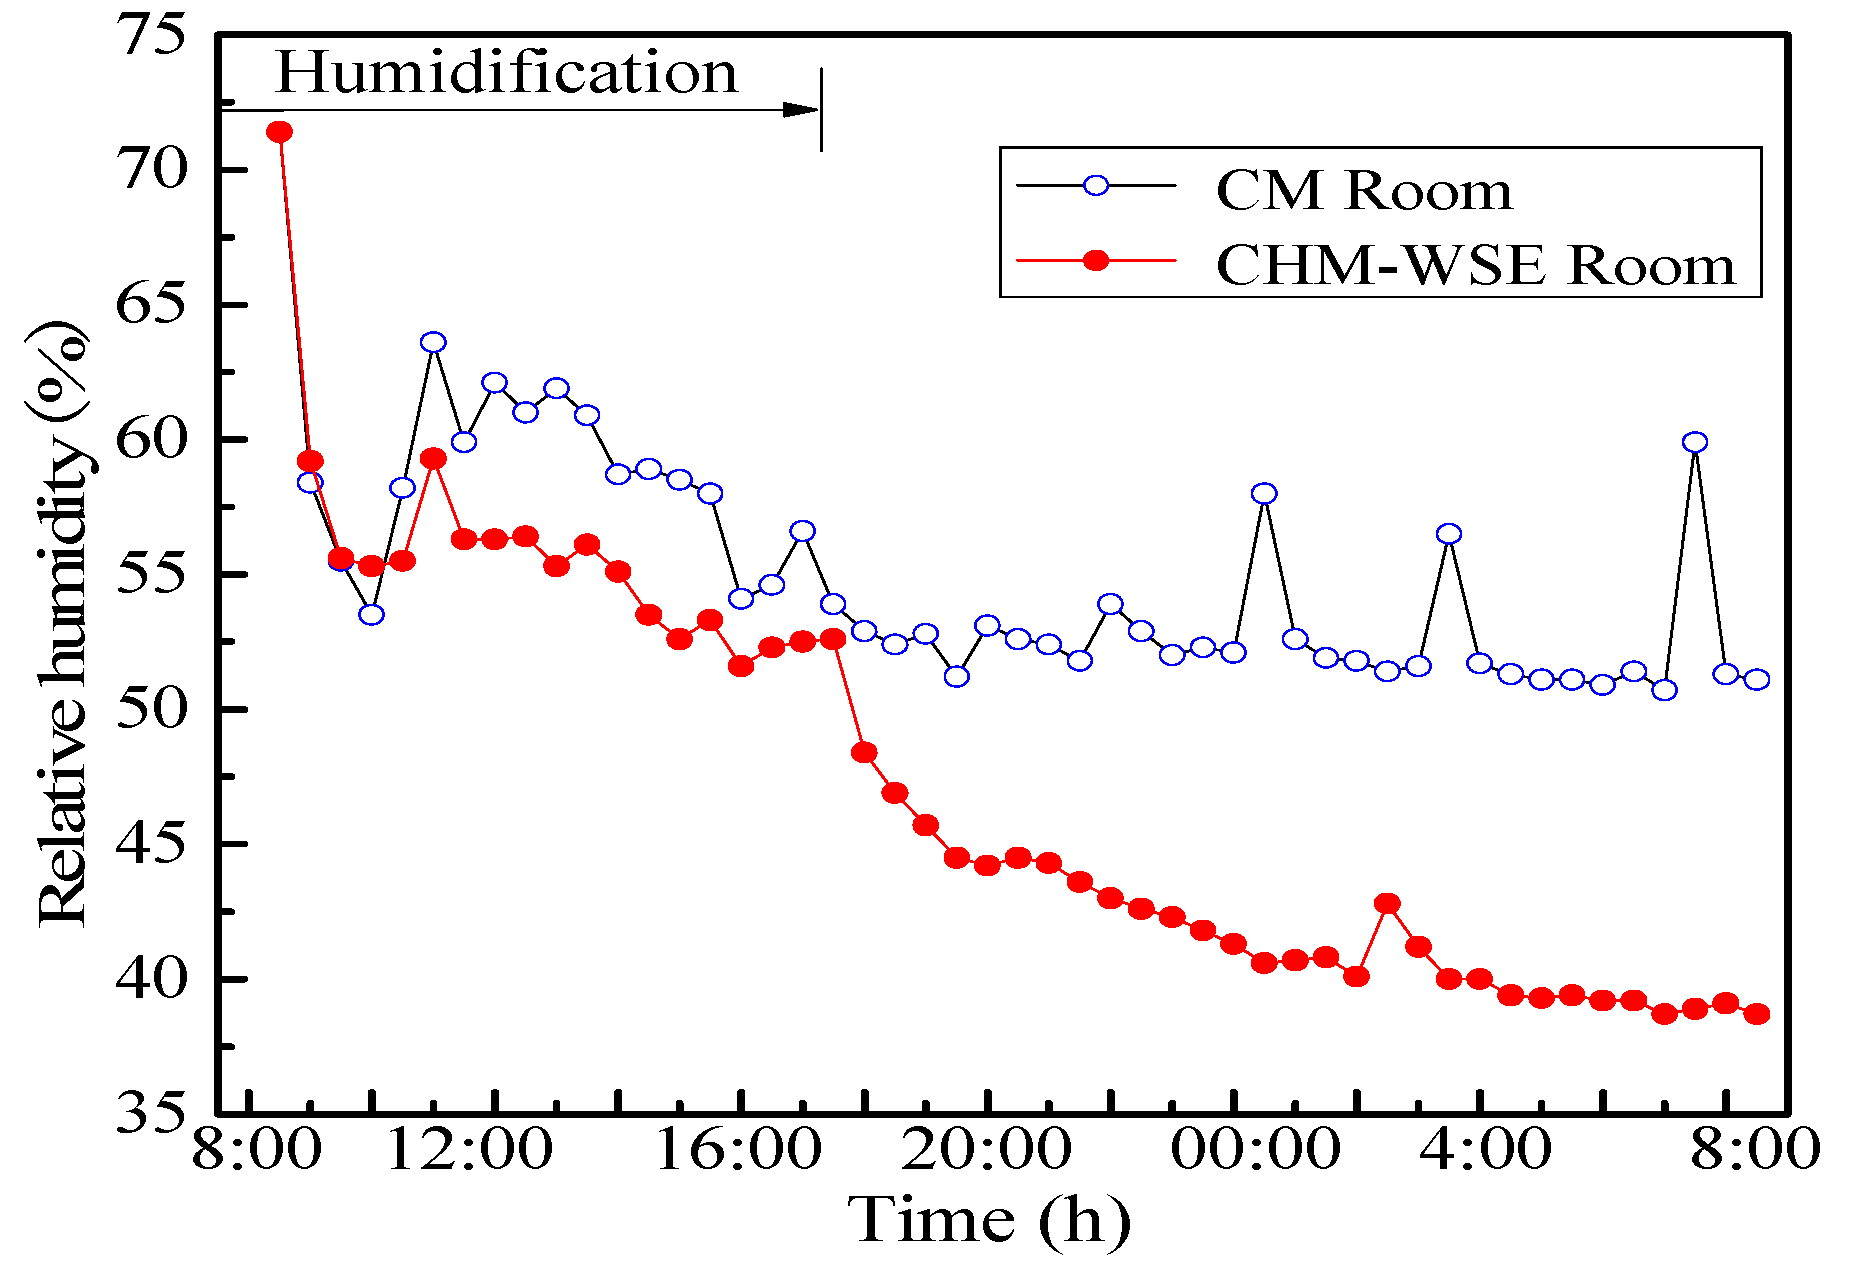
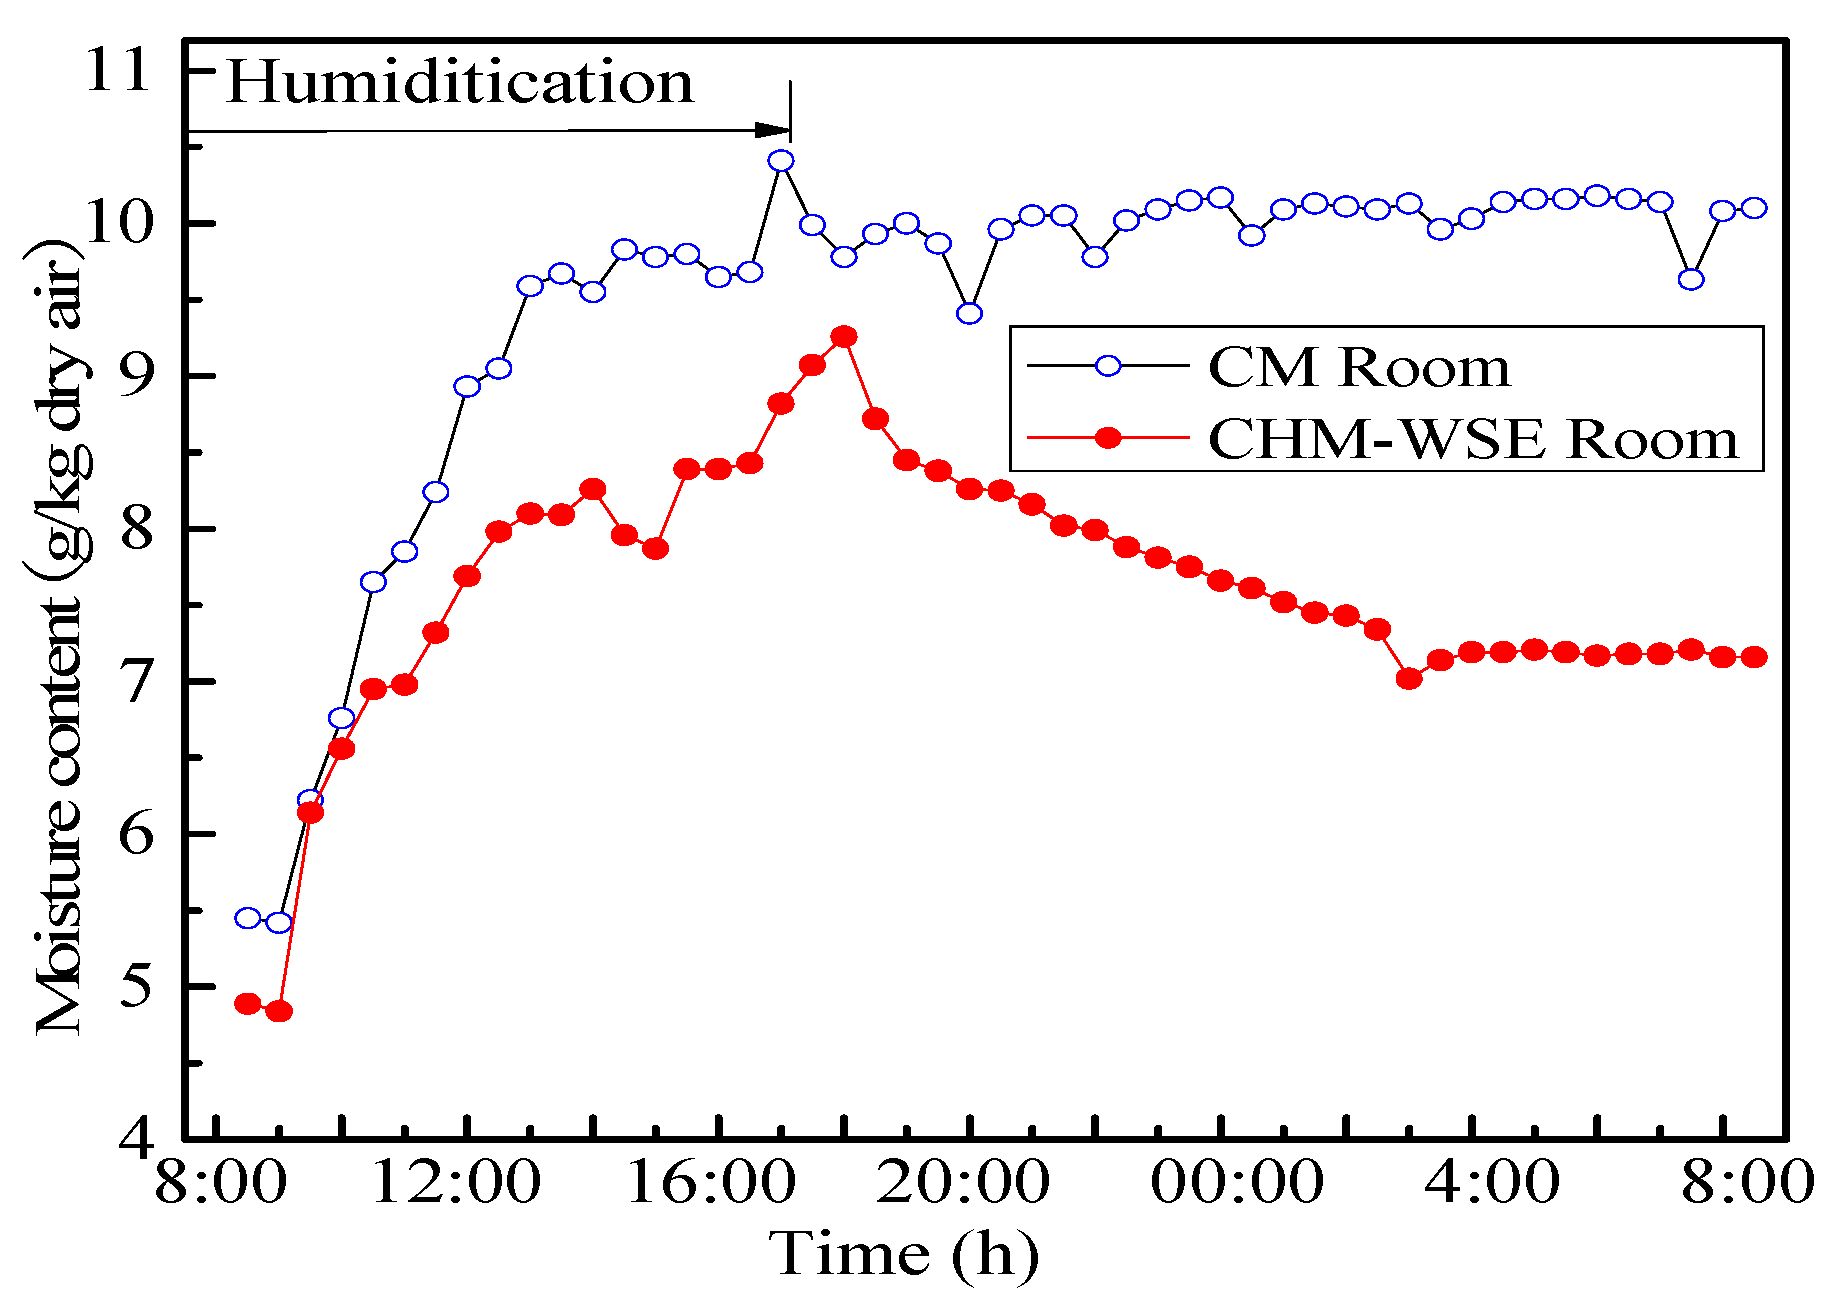
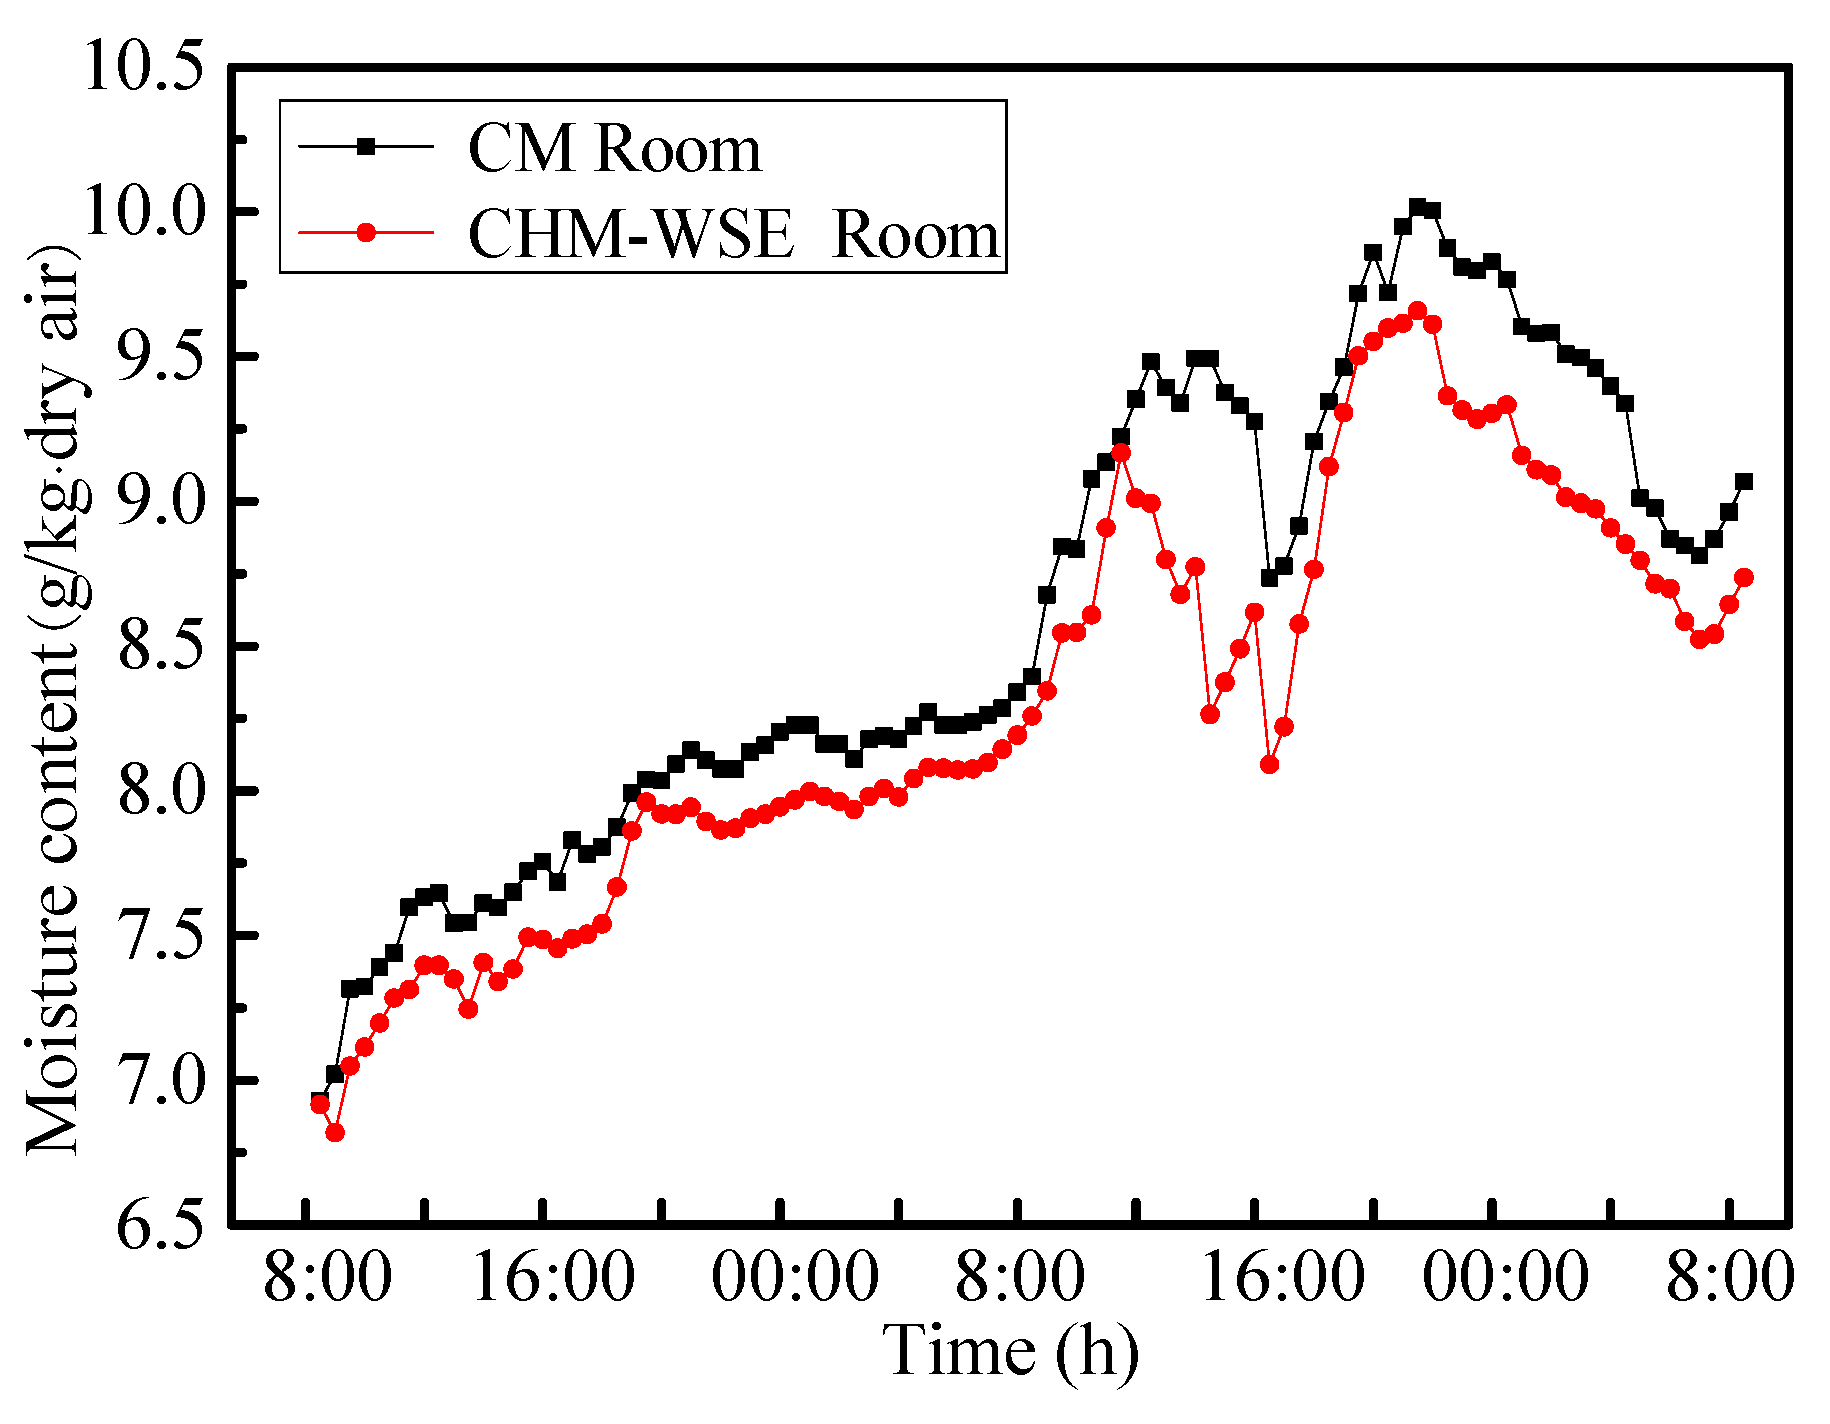
It can be seen in Figure 12 that the indoor temperature is basically stable at 14:00, and the temperature continues to be around 24 °C, with little difference between the two rooms. The indoor relative humidity and moisture content of the two tested rooms are compared and the results are shown in Figure 13 and Figure 14, where it is indicated that the indoor air moisture content increases after humidification. After the humidification finishes, the relative humidity and moisture content of the room with CM do not change, but the fluctuation is obvious, while the relative humidity and moisture content of the room with CHM-WSE decreases gradually, the relative humidity is 14.3% lower than that of the room with CM, and the air moisture content is reduced by 3.1 g/kg∙dry air.
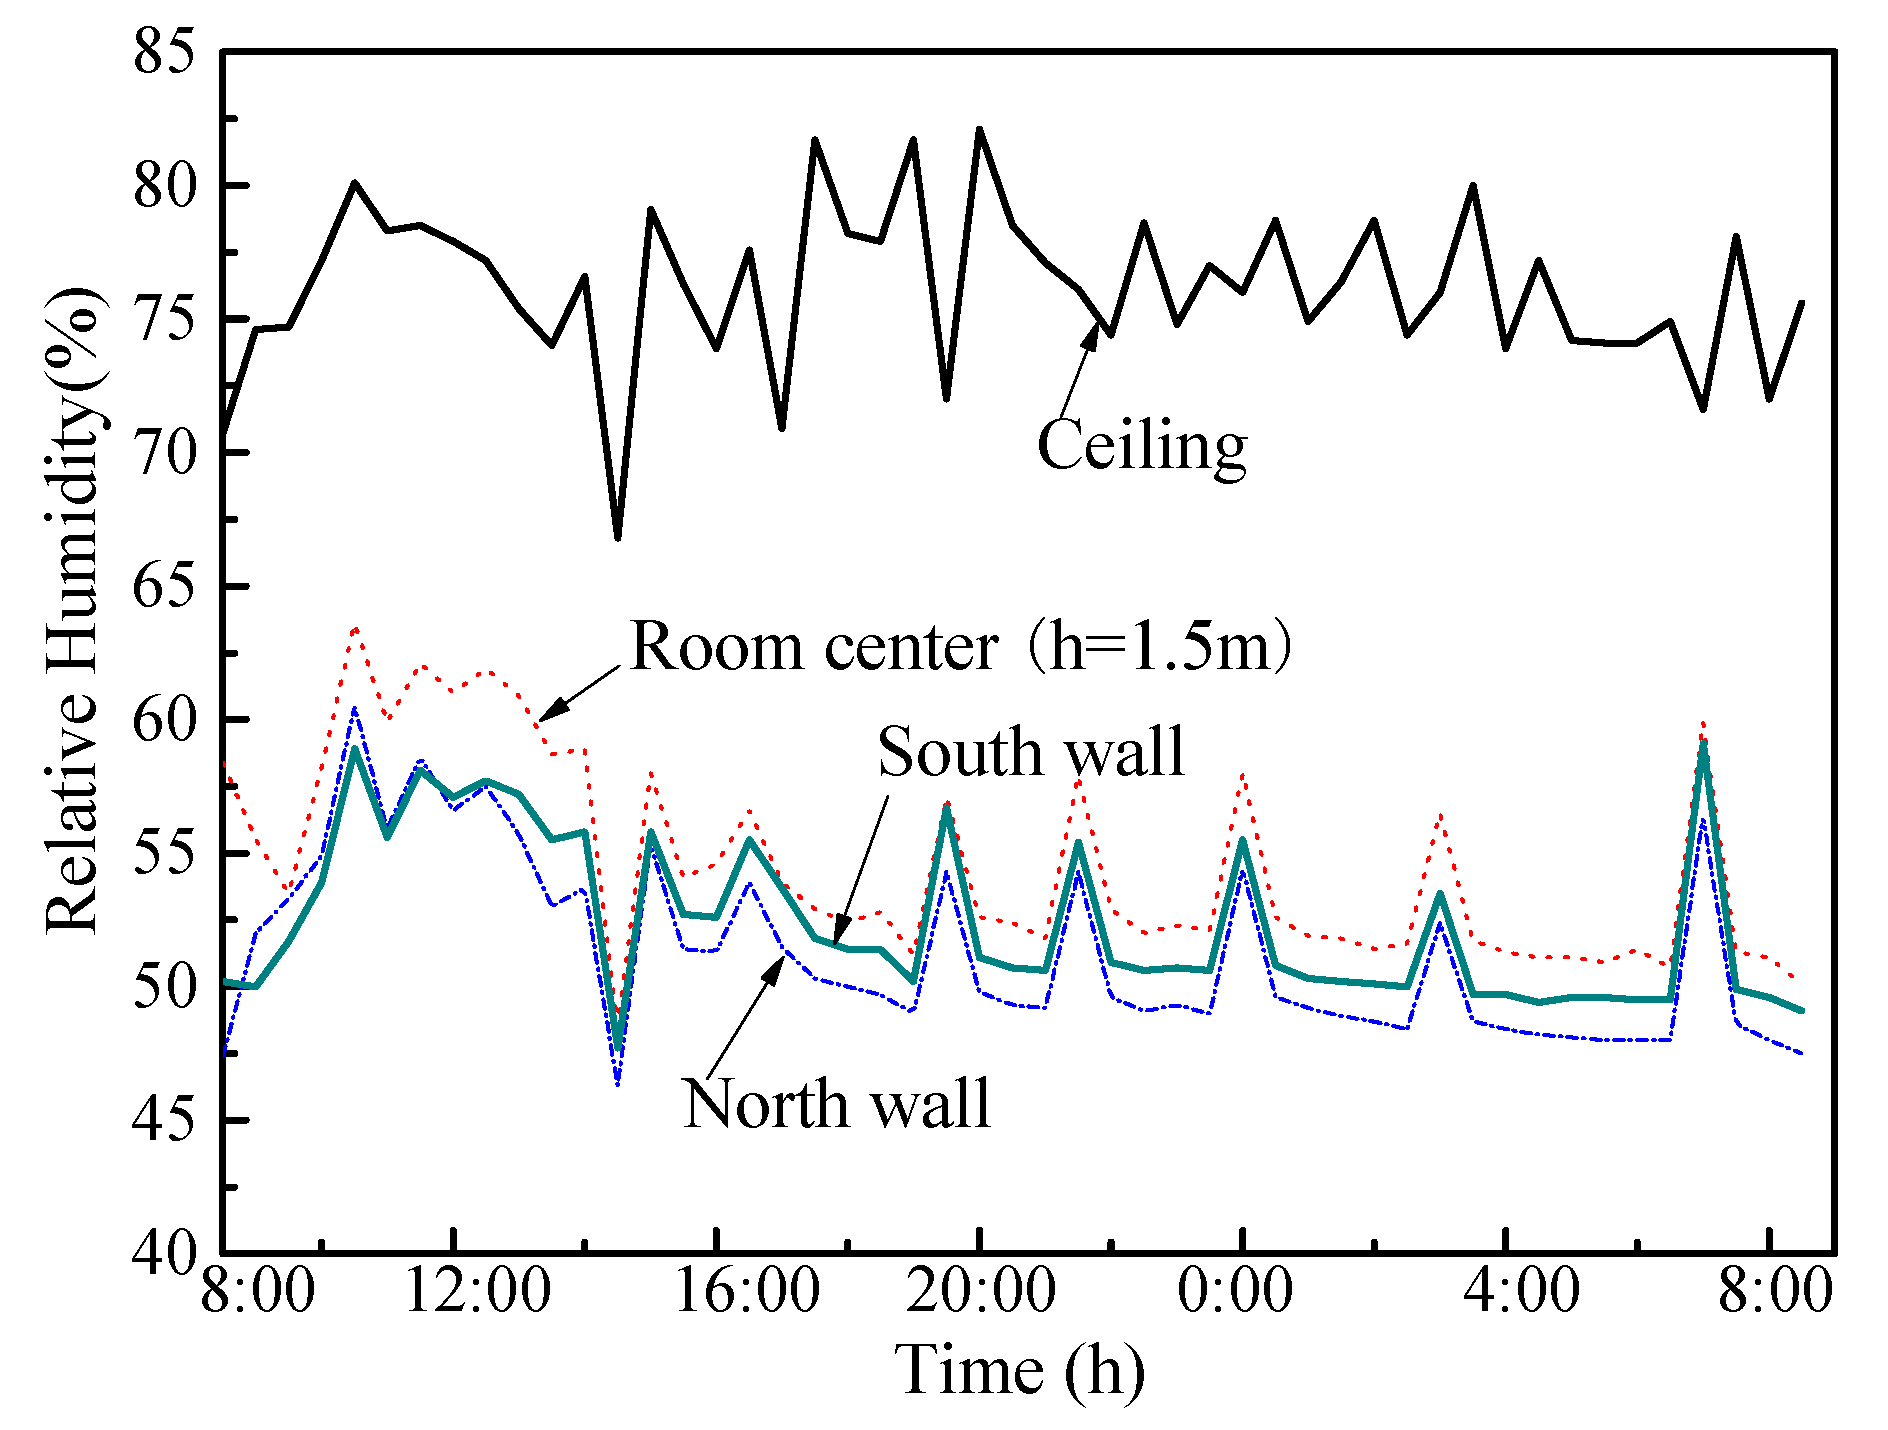
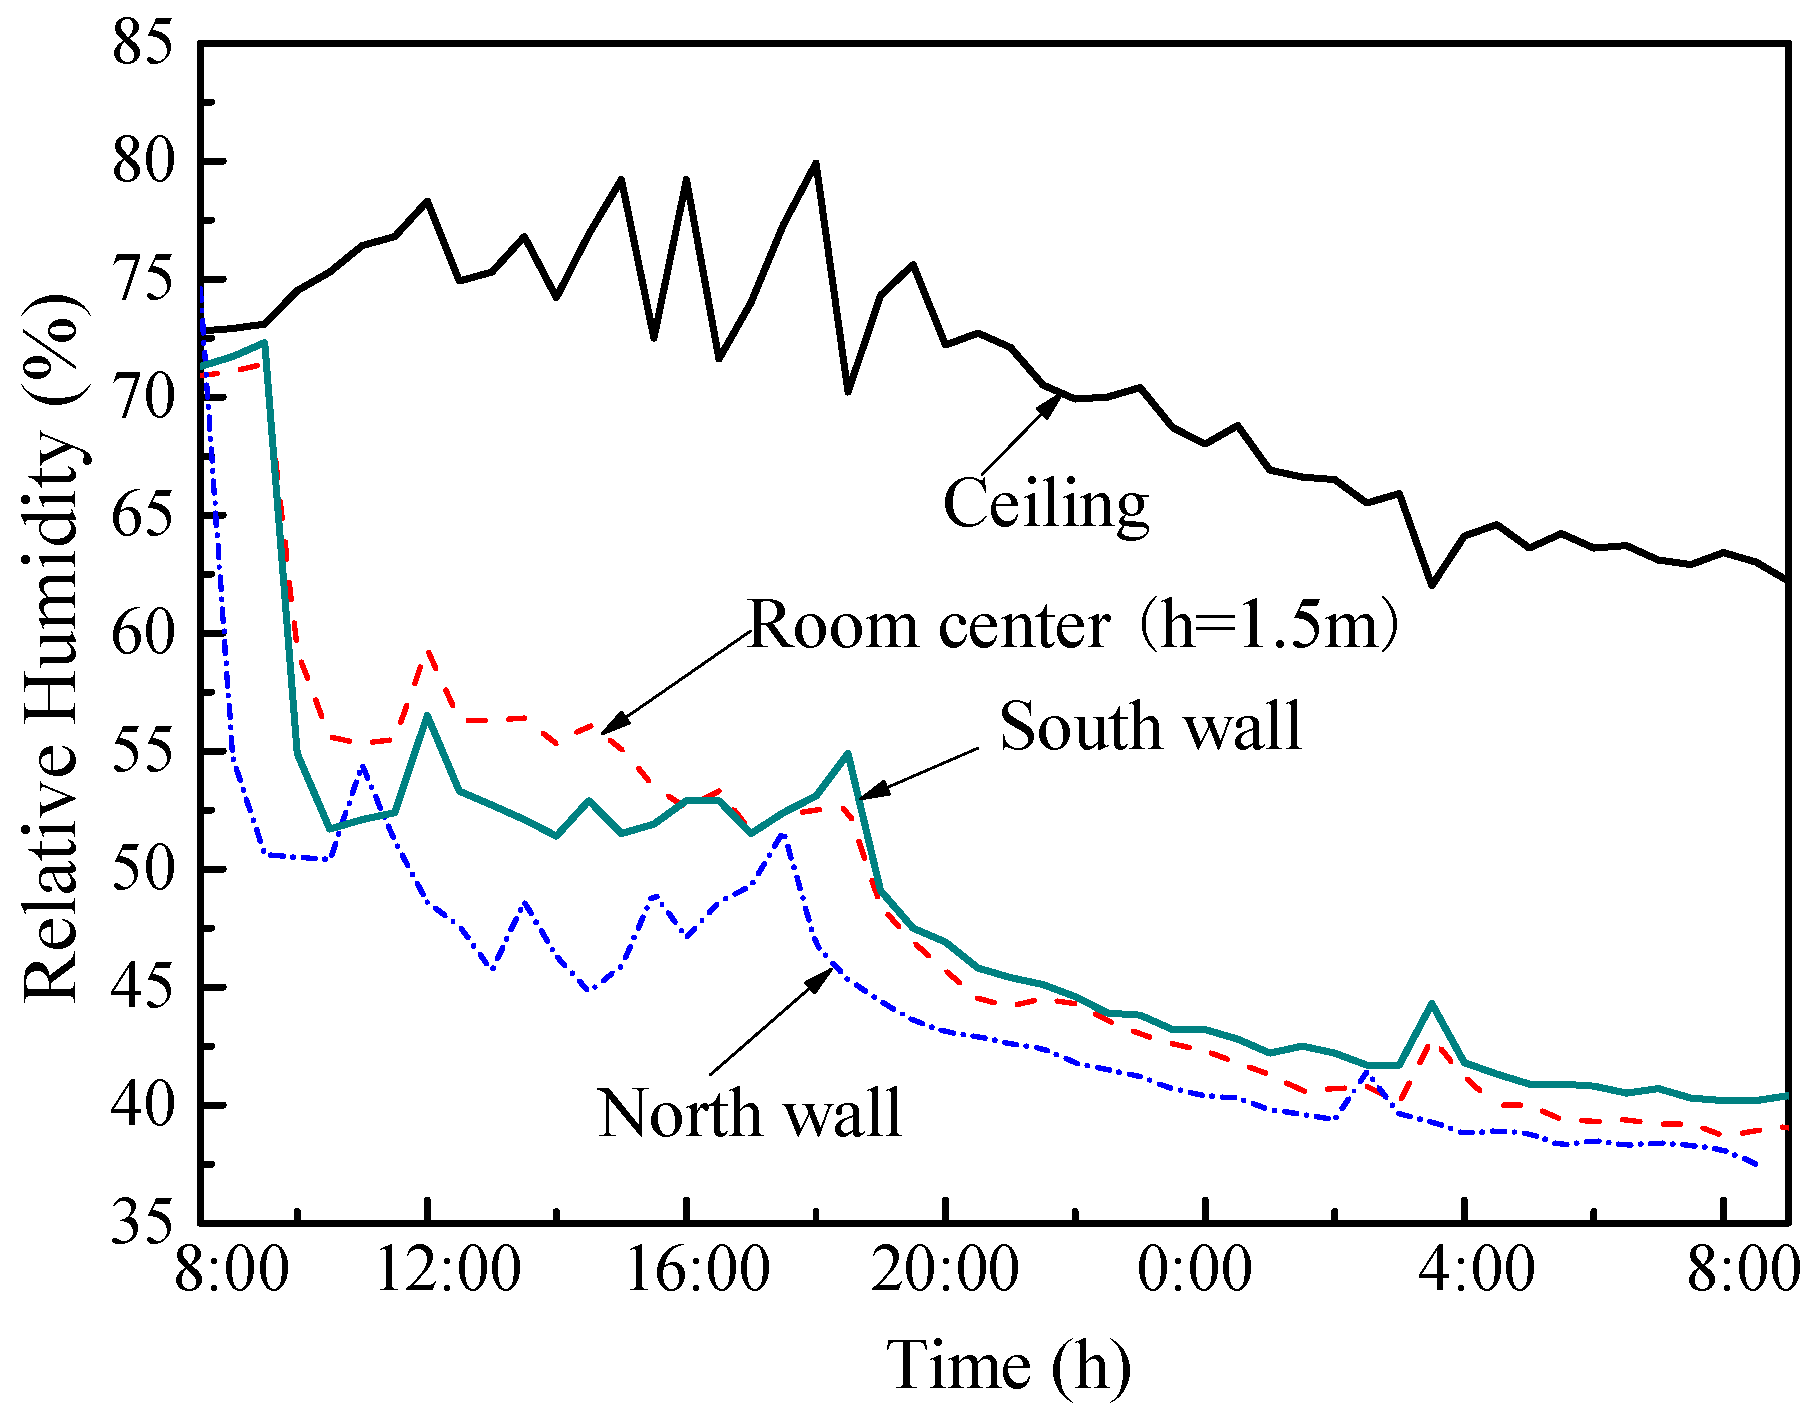
Figure 15 shows that the relative humidity of monitoring points in room with CM fluctuates more frequently. According to the relative humidity distribution curve of the room with CHM-WSE (Room II) (Figure 16), the relative humidity curve is relatively smooth and has a downward trend except for ceilings, which has an obvious fluctuation, and this is because the ceiling is not covered with CHM-WSE. The test room volume is 36.48 m3, the usable area of CHM-WSE is 40.8 m2, and the moisture absorption capacity per unit area of the CHM-WSE is 2.77 g/m2.
In the testing area, n points are selected and the temperature and relative humidity of each point are measured respectively. The arithmetic mean value is as follows:
The root-mean-square deviation is calculated as:
The non-uniformity coefficient is calculated as:
where t is the temperature, in °C; is the relative humidity, in %; is the root-mean-square deviation; is the non-uniformity coefficient.
3.2.2. Hygroscopicity Test in Late Spring
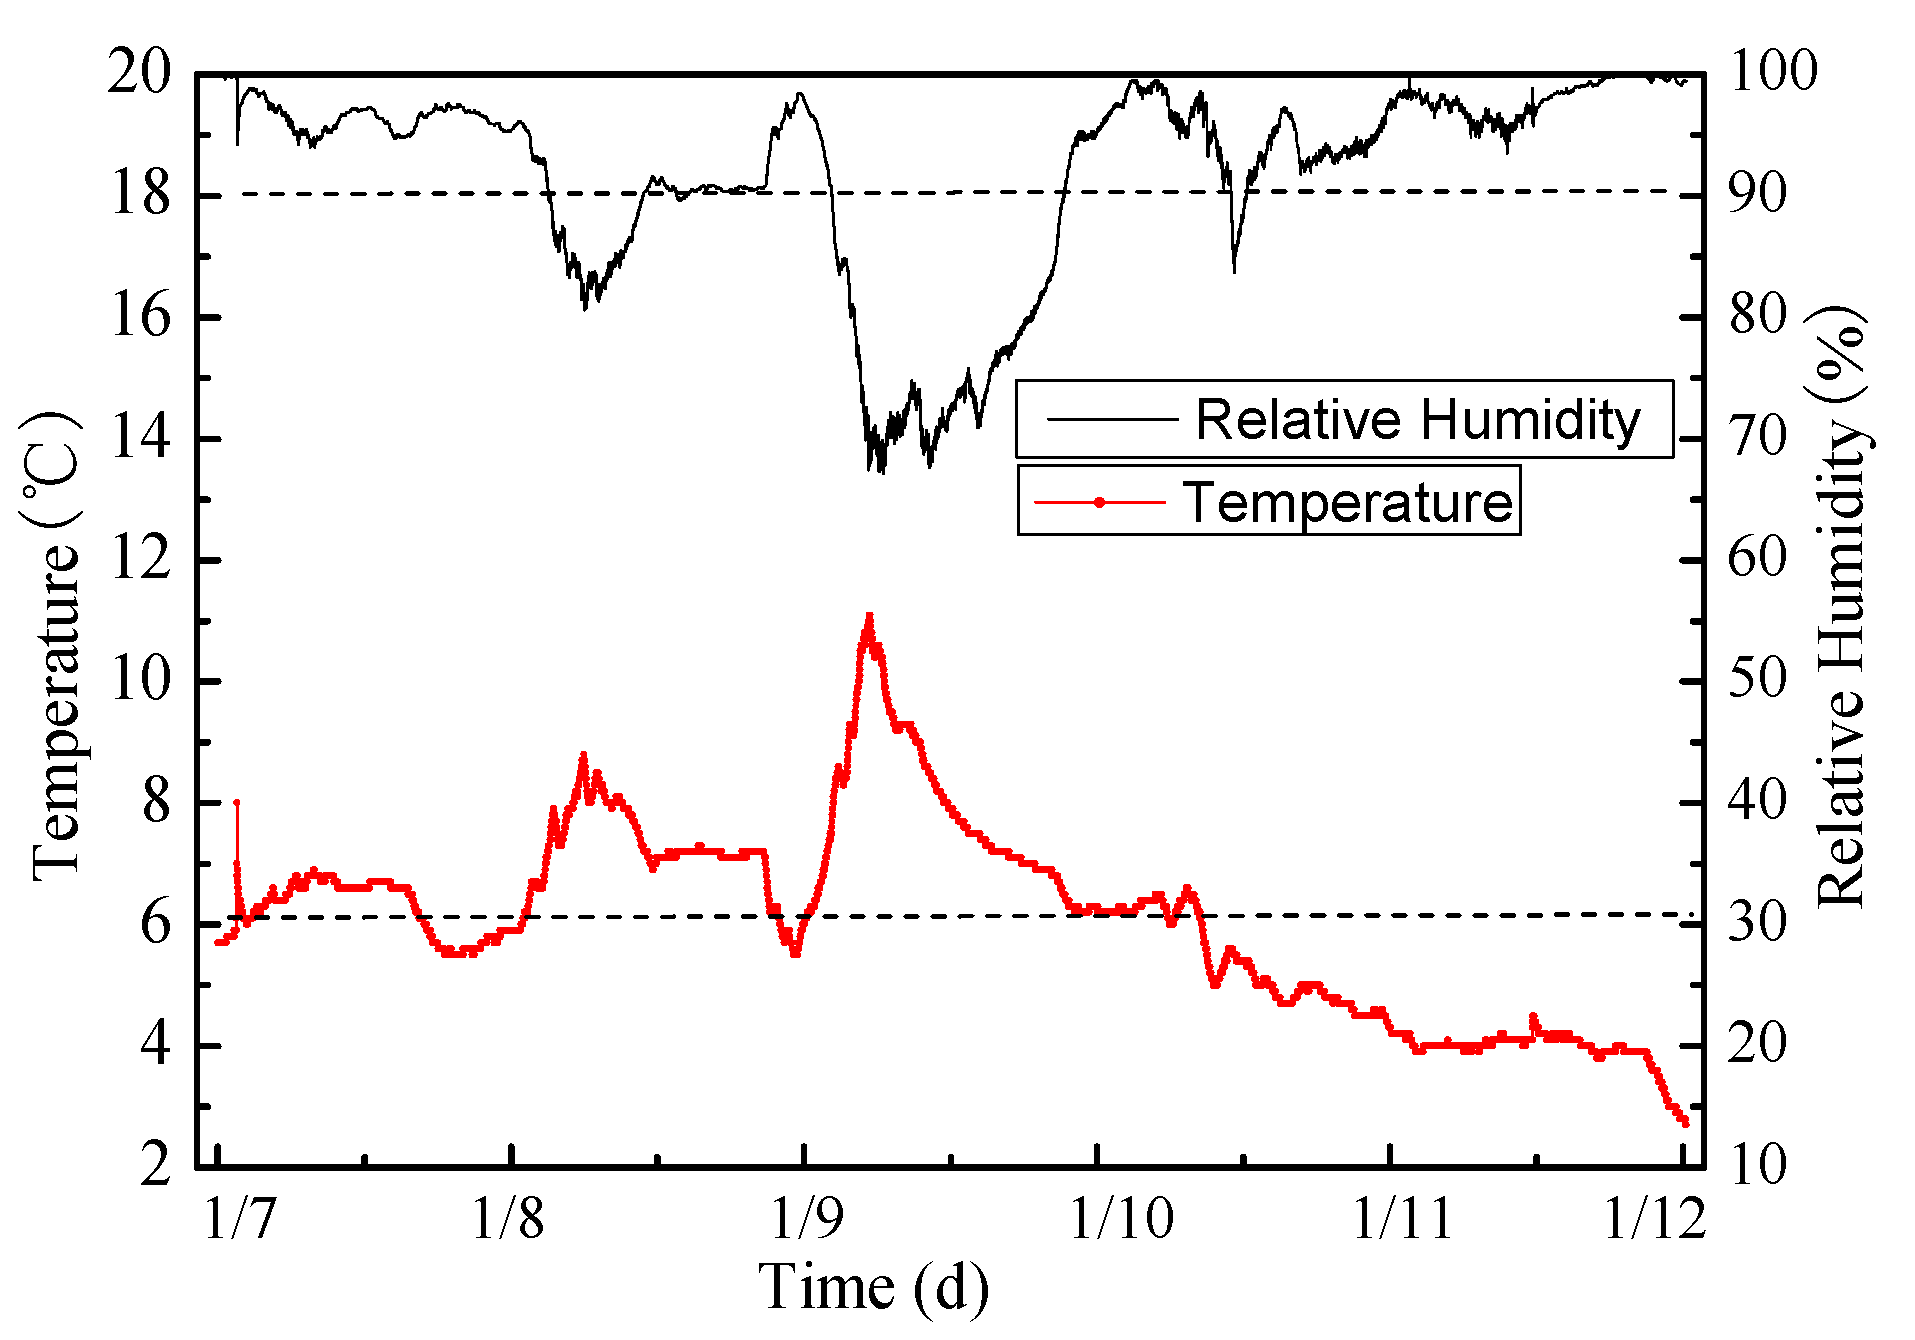
The measured outdoor temperature and humidity in April is shown in Figure 18. It is shows that the outdoor temperature is in the range of 10 °C–22 °C and relative humidity is between 60% and 99%.
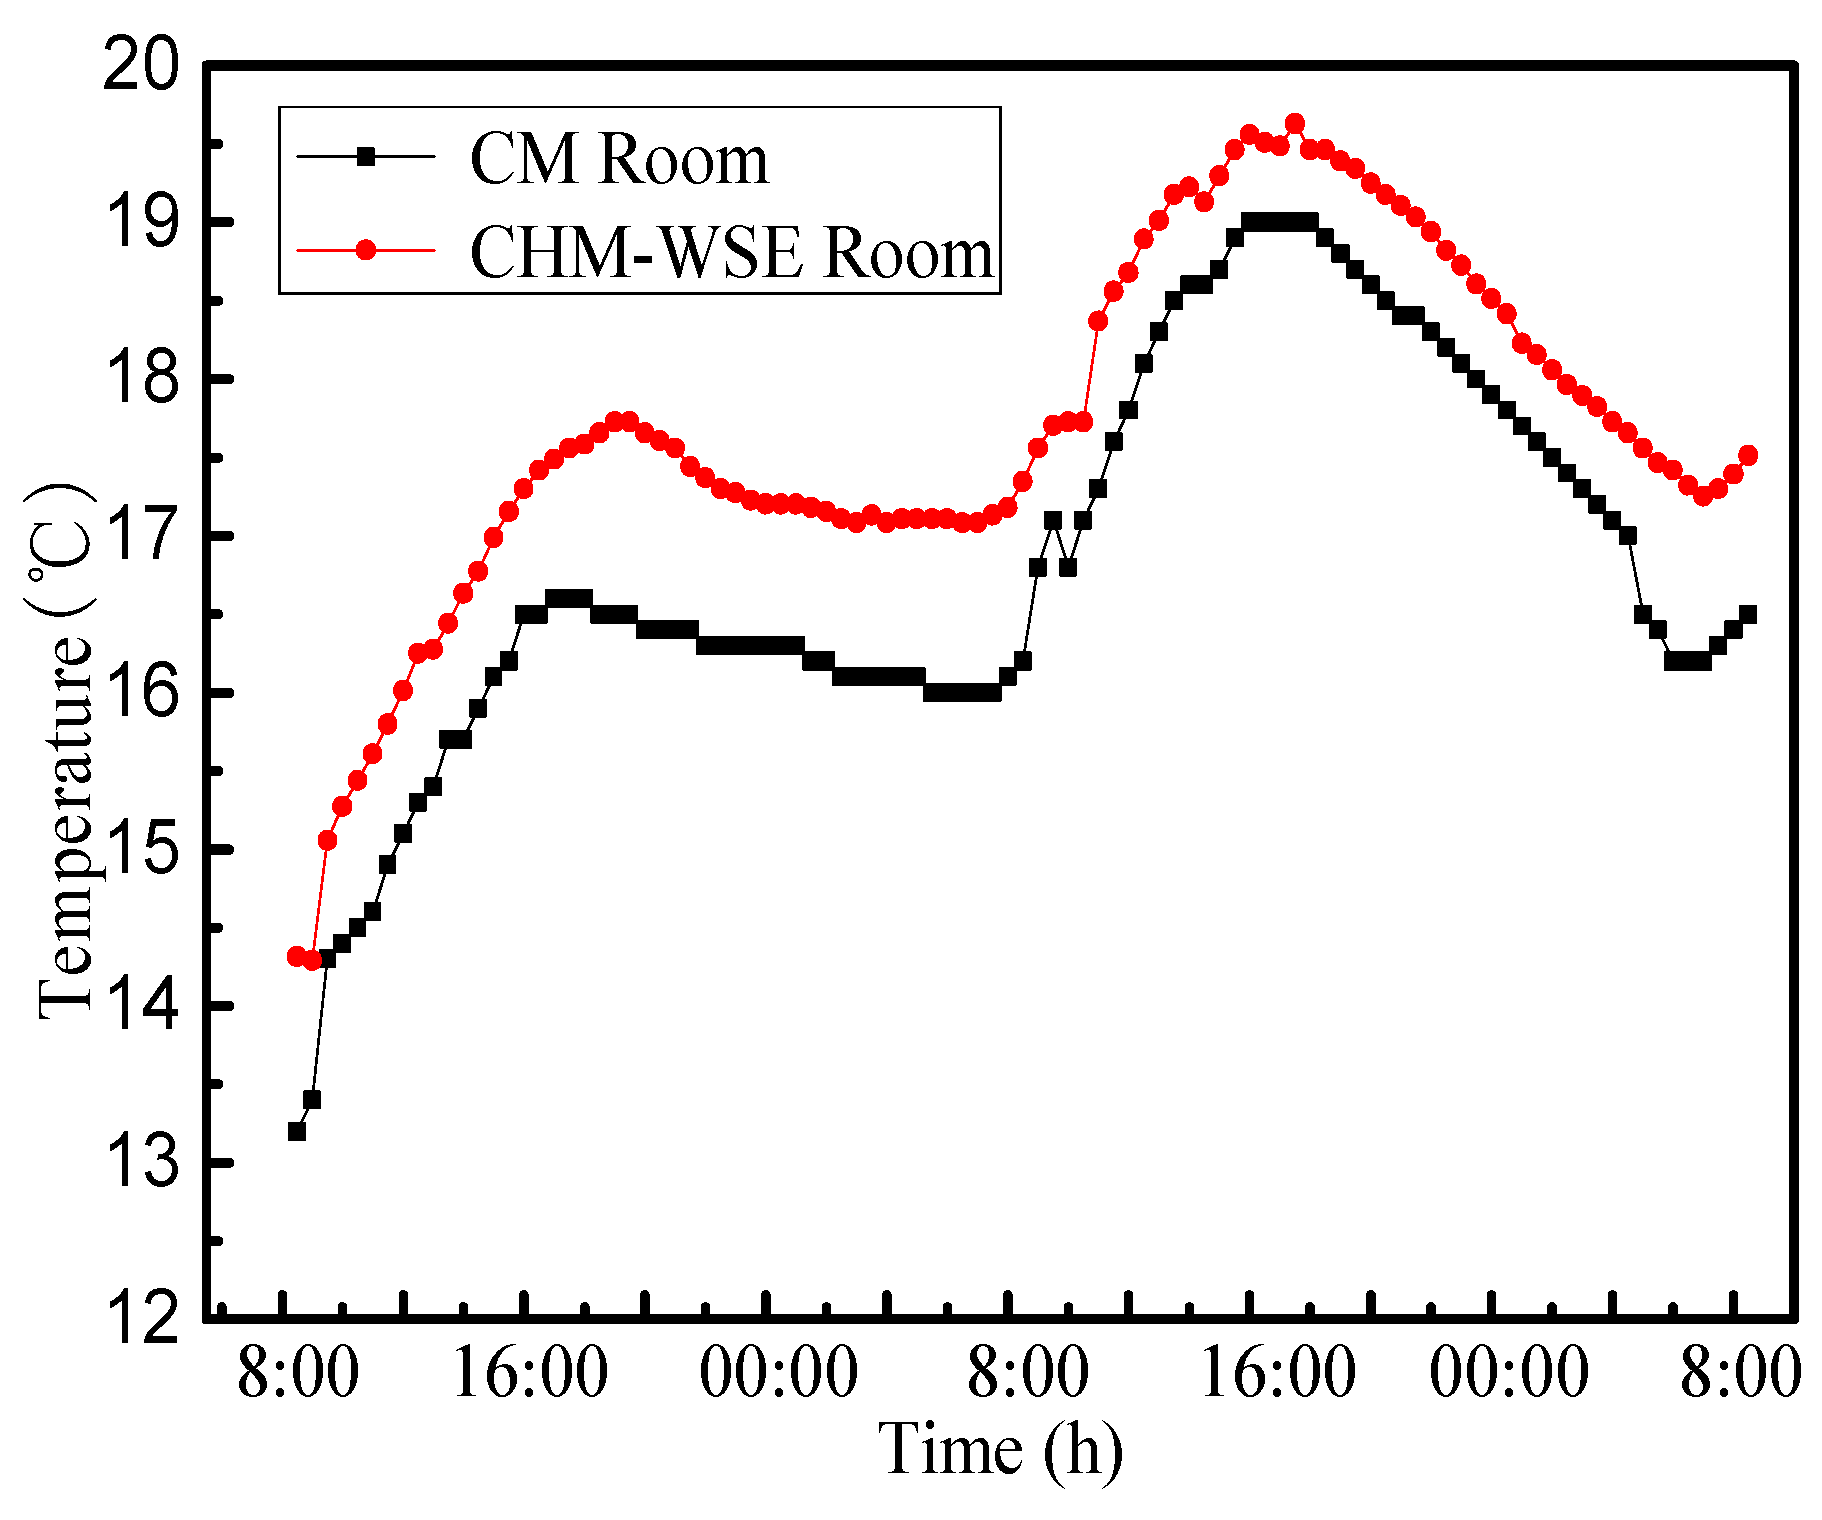
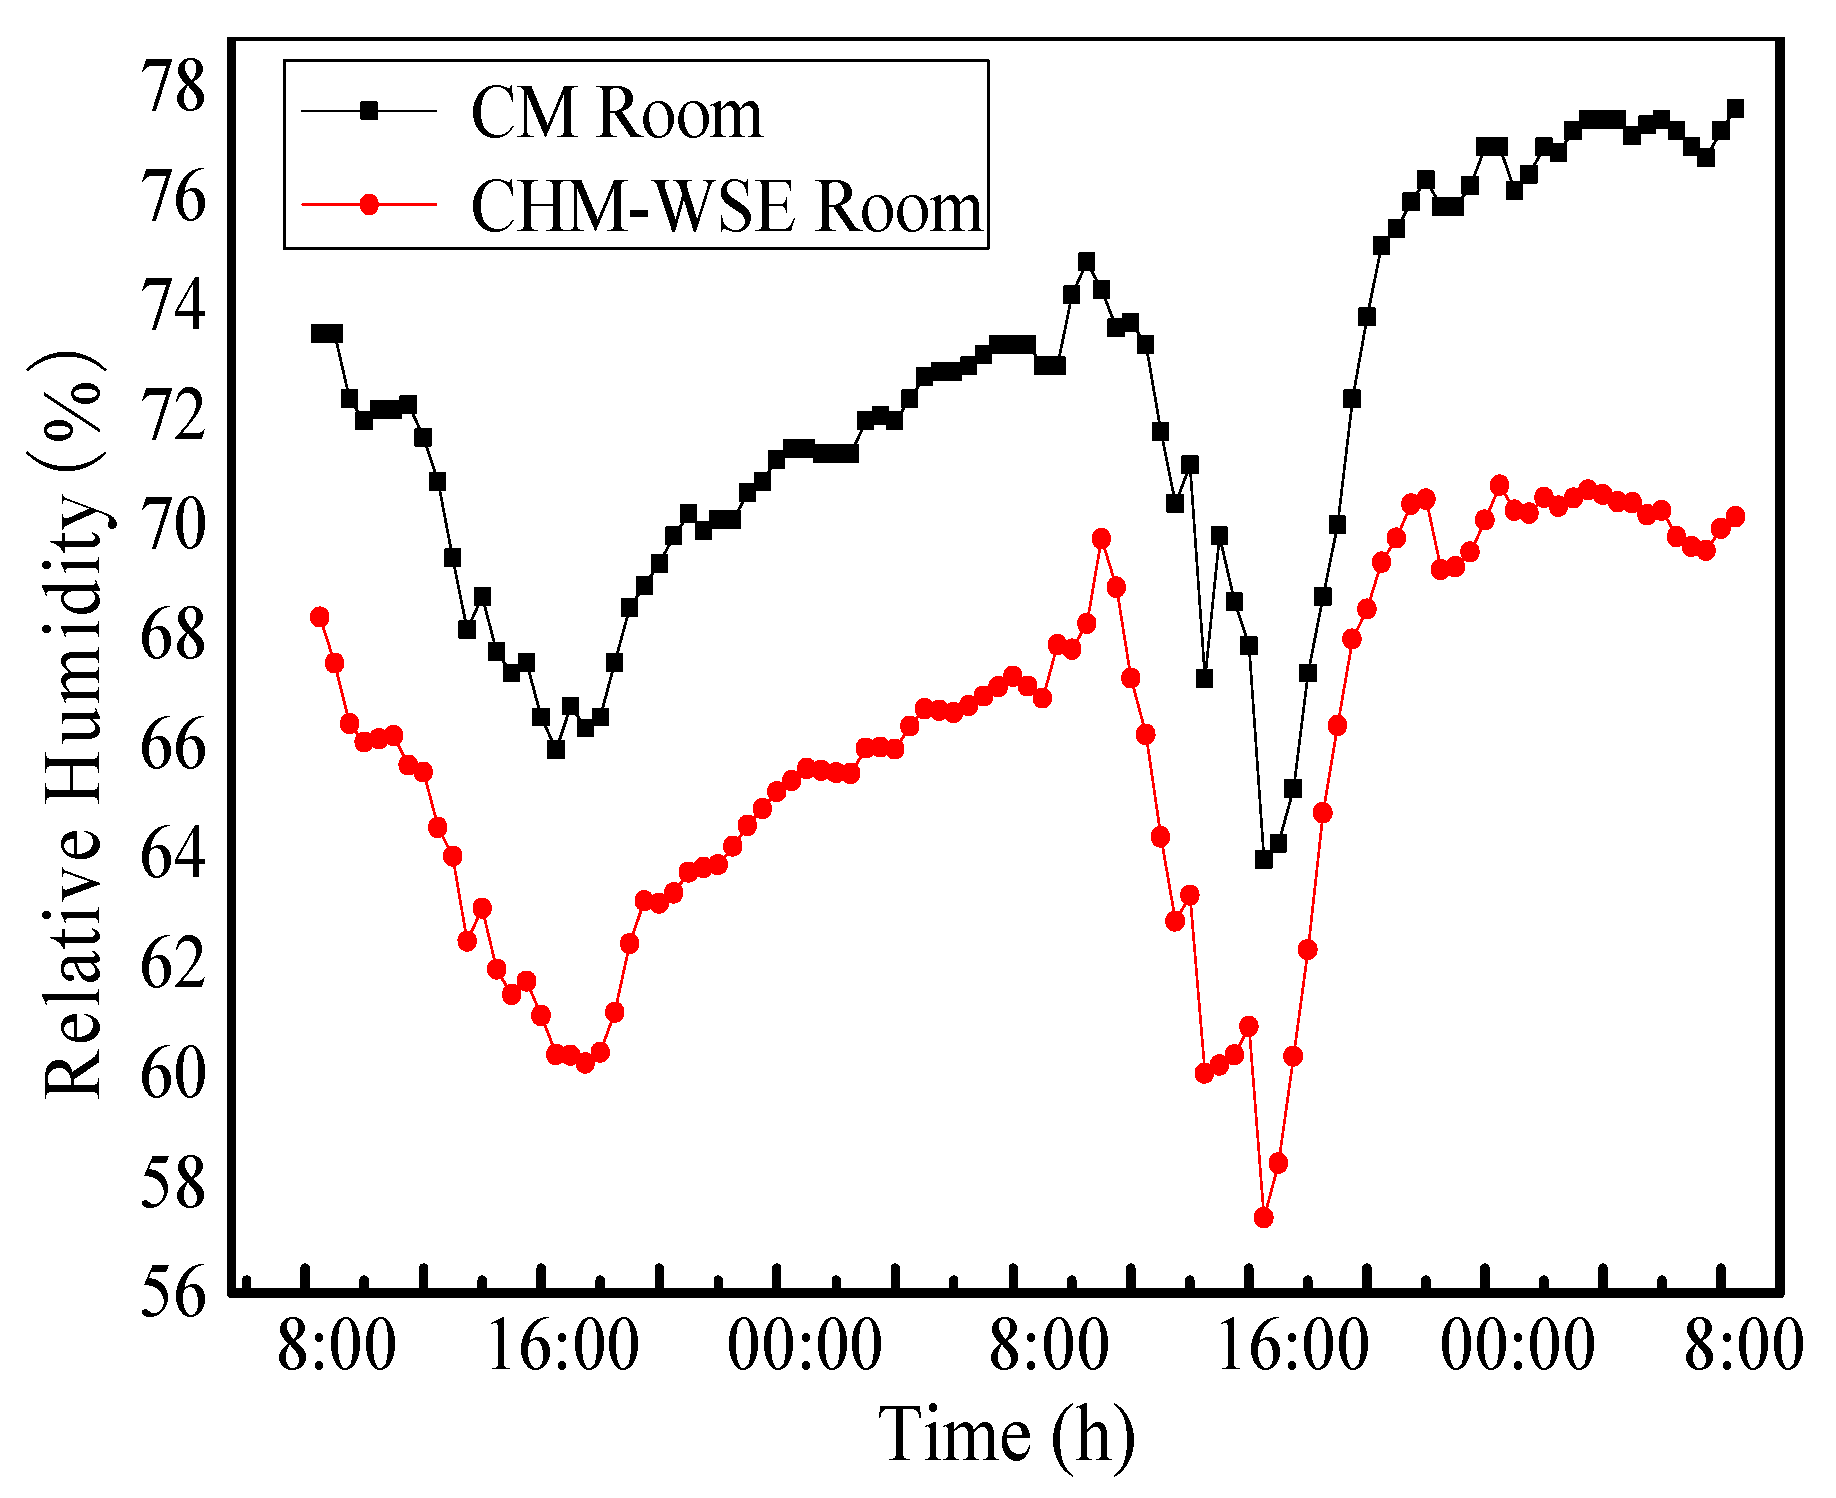
Figure 19, Figure 20 and Figure 21 show the indoor temperature and humidity in the room with CM and the room with CHM-WSE without air conditioning condition. It is indicated that the relative humidity of the room with CHM-WSE is controlled at a range of 55–70%, which is lower than that of the room with CM by 6–10% (Figure 20), and the air moisture content is also lower by 0.3 g/kg∙dry air −0.5 g/kg∙dry air (Figure 21).
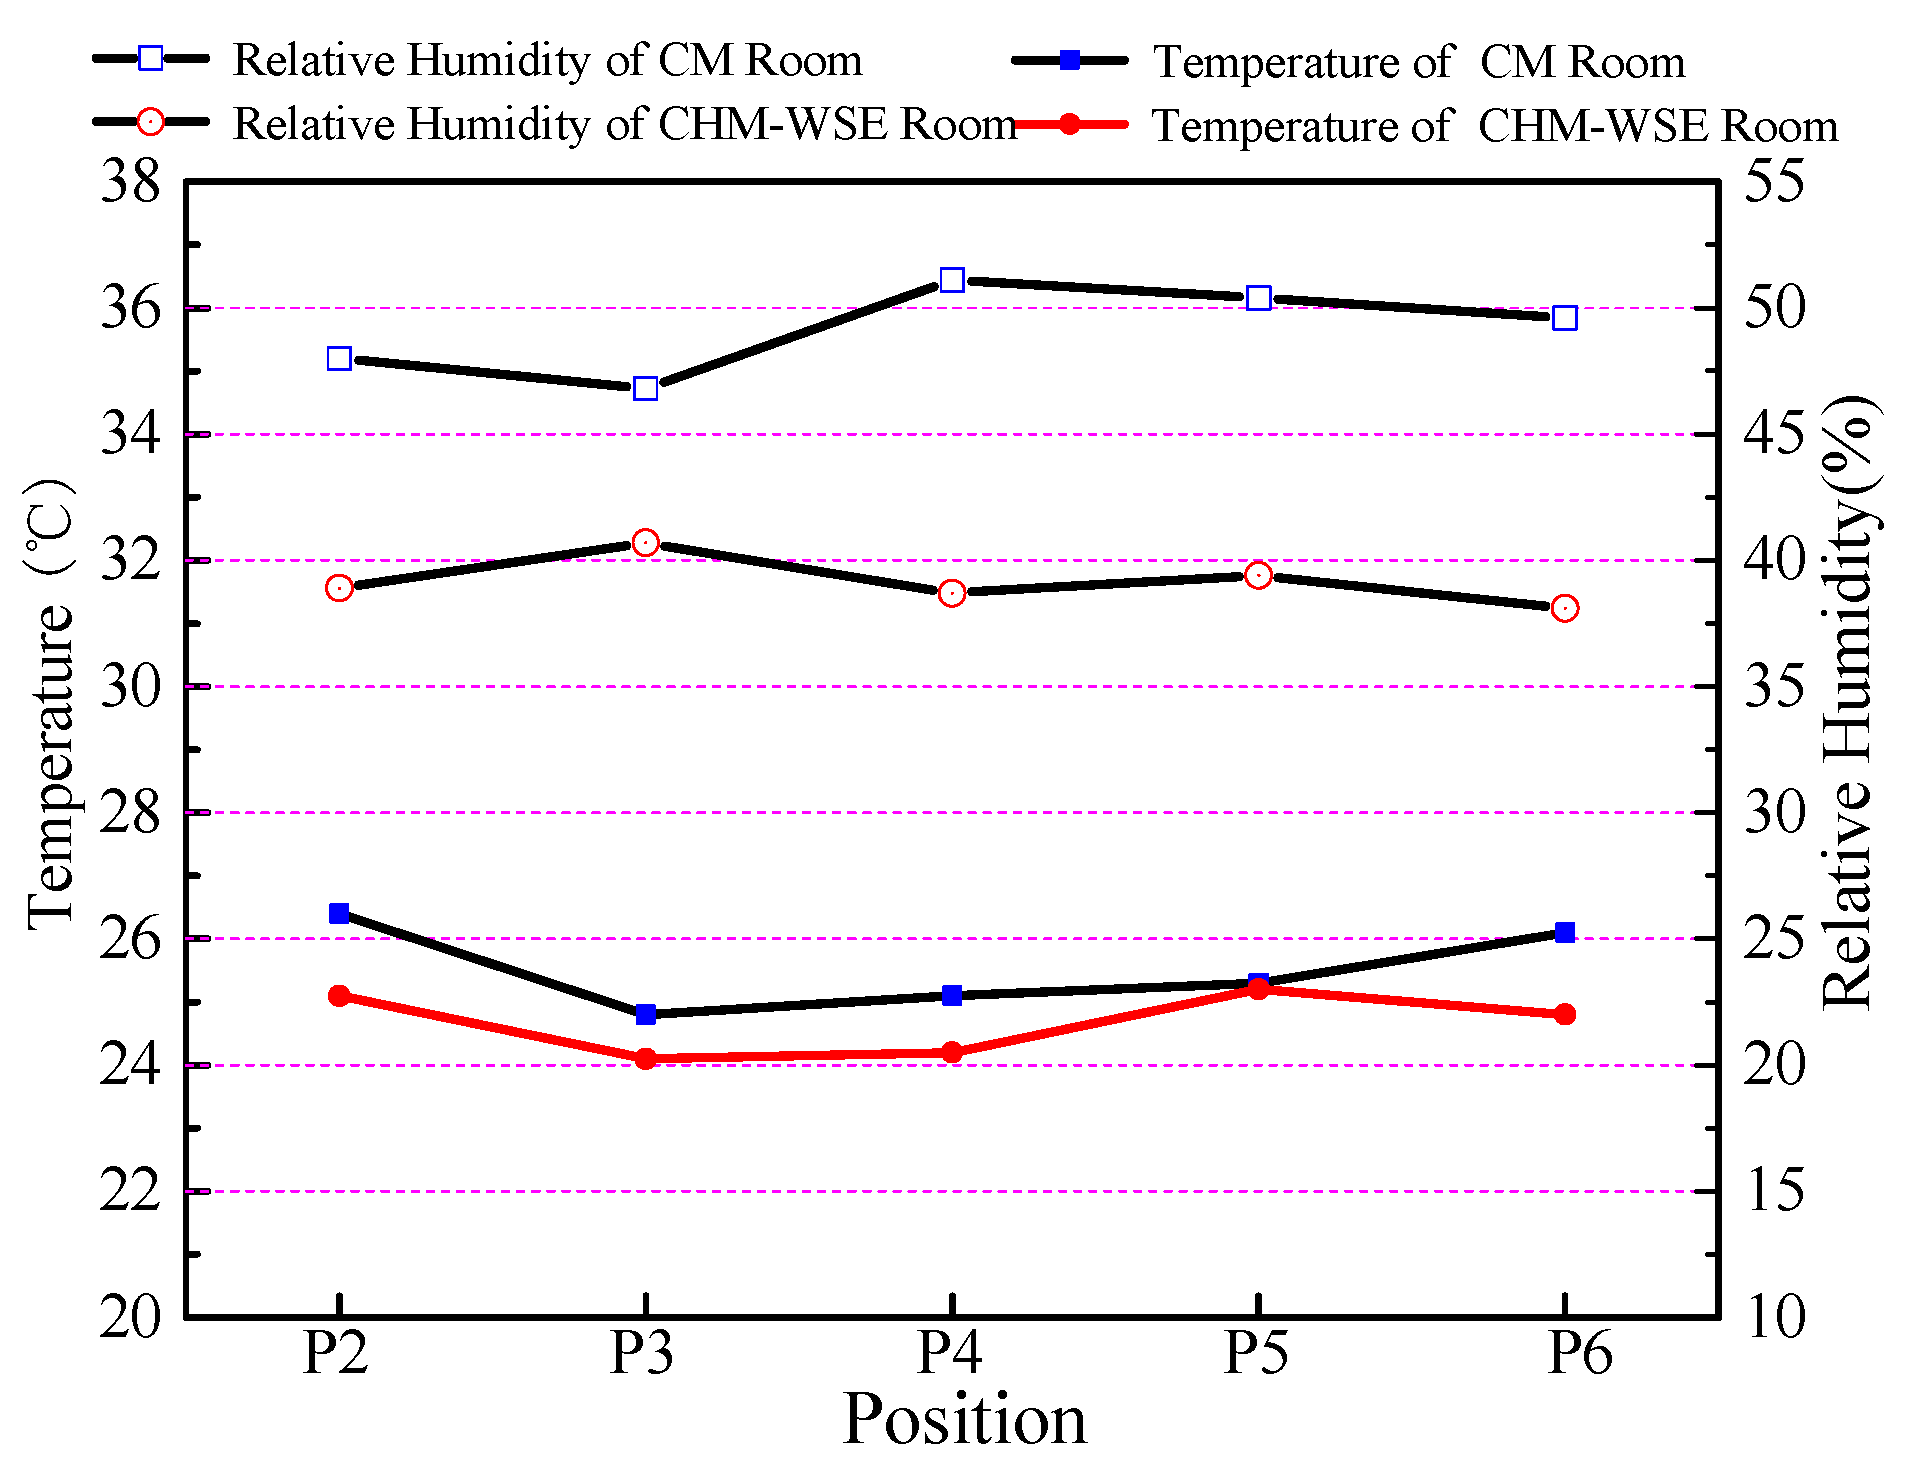
Compared with the room with CM, Figure 22 shows that the temperature and humidity distribution in the room with CHM-WSE is relatively uniform. From the temperature and humidity non-uniformity coefficient (Table 11), the temperature and humidity uniformity in the room with CHM-WSE are better than that in the room with CM at 1.5 m from the floor.
3.2.3. Practical Moisture Buffering of Room
By testing the change of air temperature and relative humidity in the room, the moisture buffering value of the building envelope material is further analyzed. As the test is conducted three months after the test room construction was completed, it is assumed that the impact of the moisture balance between different wall materials on the humidity distribution within the room can be ignored.
According to NORDTEST Project, the practical Moisture Buffer Value is presented using dimensions g/(m2 % RH)@8/16h which indicates the change of the mass of moisture in the material per free surface area and the step change of relative humidity during 8/16 h wetting/drying cycle. But it does not take into account other parameters that might influence the buffer performance, like moisture production and ventilation rates. According to the calculation results of moisture buffering performance (Table 12), it can be found that the CHM-WSE has good hygroscopic performance, while the CM has a relatively poor one. Meanwhile, the effect of moisture buffering in late spring is slightly better than that in winter.
3.3. Application of the Composite Hygroscopic Material in Different Climate Regions
The computational modeling of hygroscopic material is validated by combining the benchmark test with the benchmarks of the CHMFE model which was initiated to develop a platform to assess the heat, moisture and air transport mechanism in building physics. The basic properties of the composite hygroscopic mortar are based on the above experiments. The properties of composite hygroscopic material are obtained from experiments. The properties of the wall components are shown in Table 13.
Taking typical cities as examples, the indoor relative humidity distribution and thermal performance of residential buildings with CHM-WSE and CM as the surface material are analyzed. In order to compare the impact on indoor thermal environment of hygroscopic material and common mortar, the building size and envelop structure of different climatic region keep the same, which may be different from practical situation. The room schedule of residential building air conditioning is shown in Table 14. The sealing performance and orientation of on-site doors and windows are taken into account, and the air exchange rate of 0.5 times/h.
(1) Hot summer and cold winter region
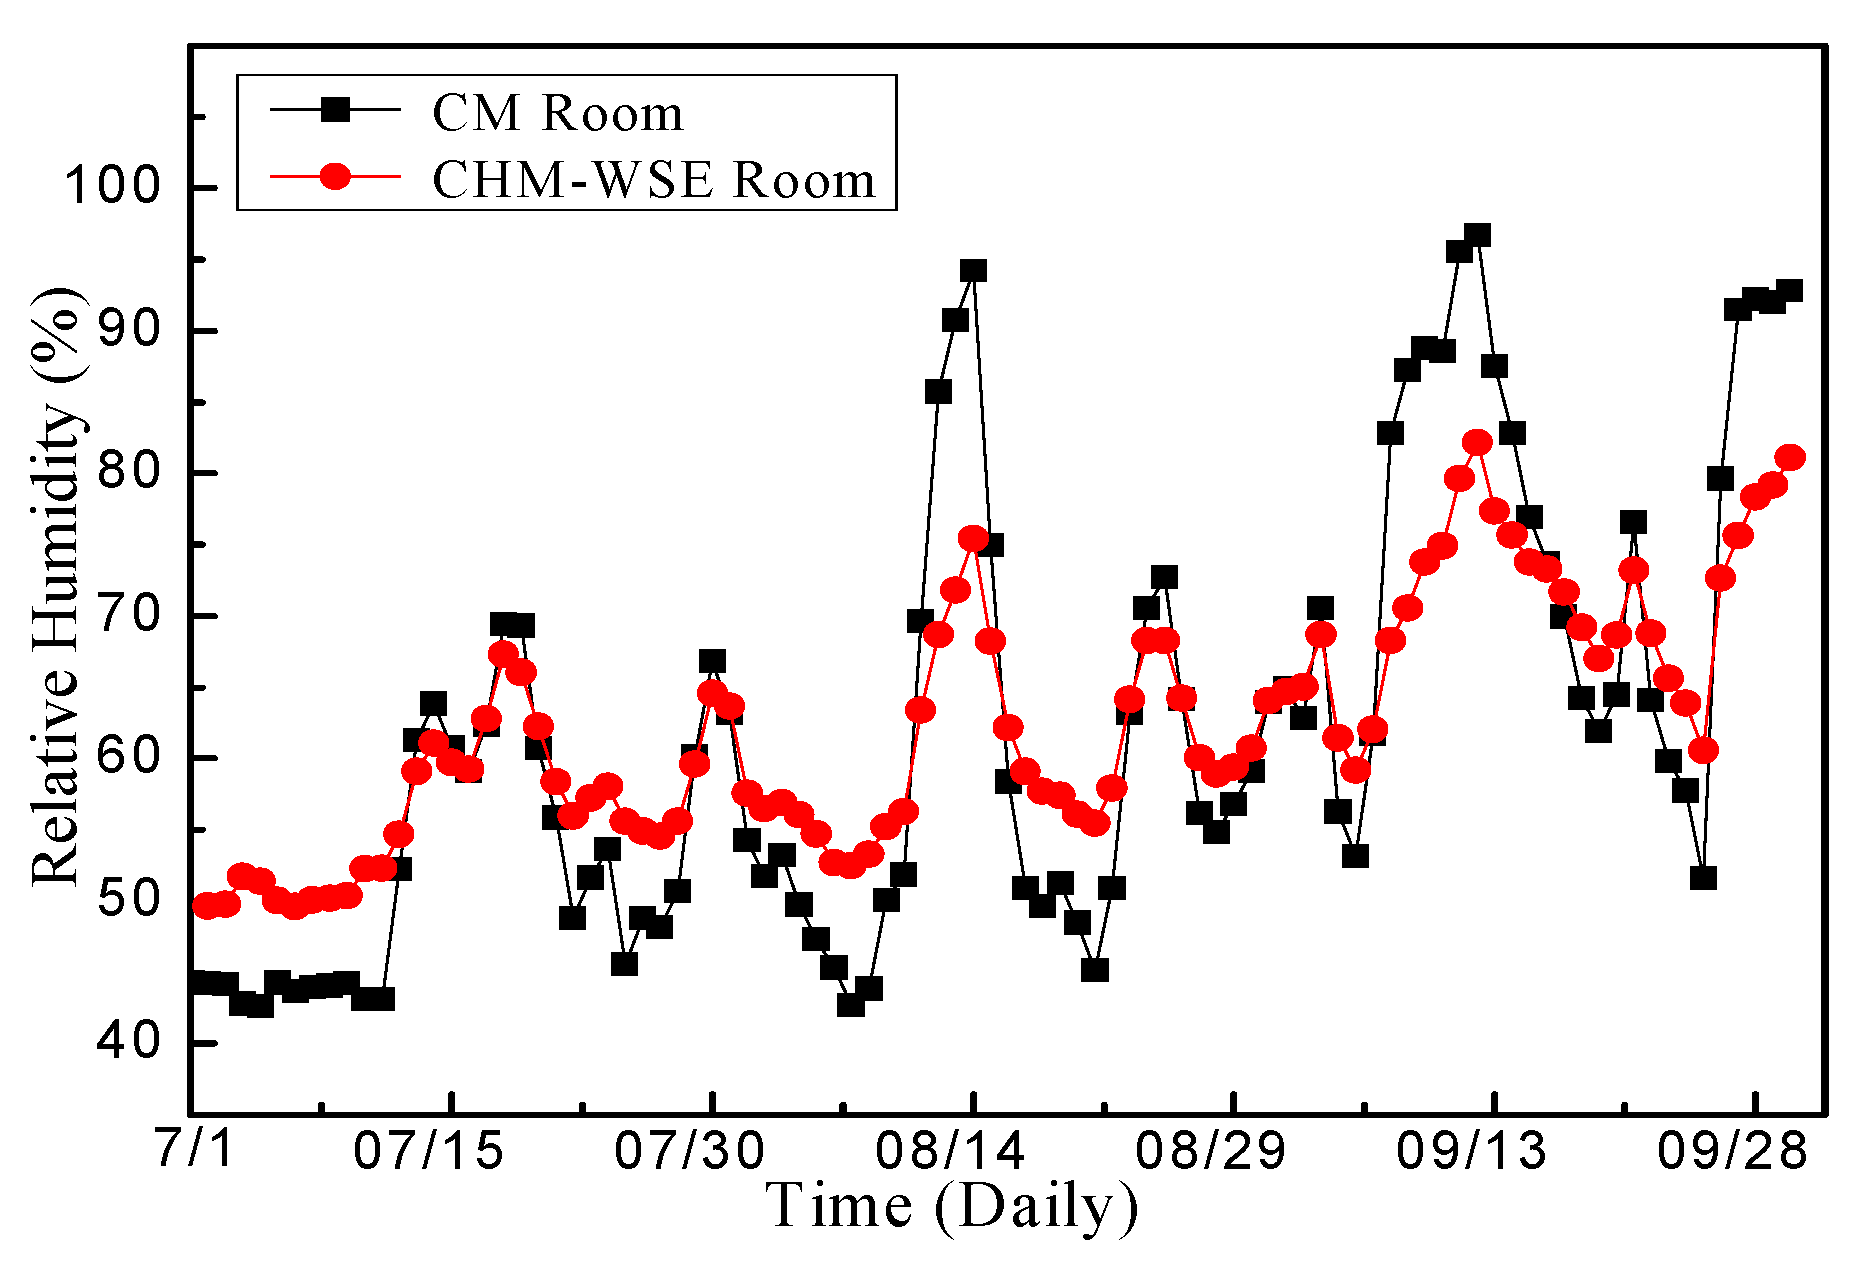
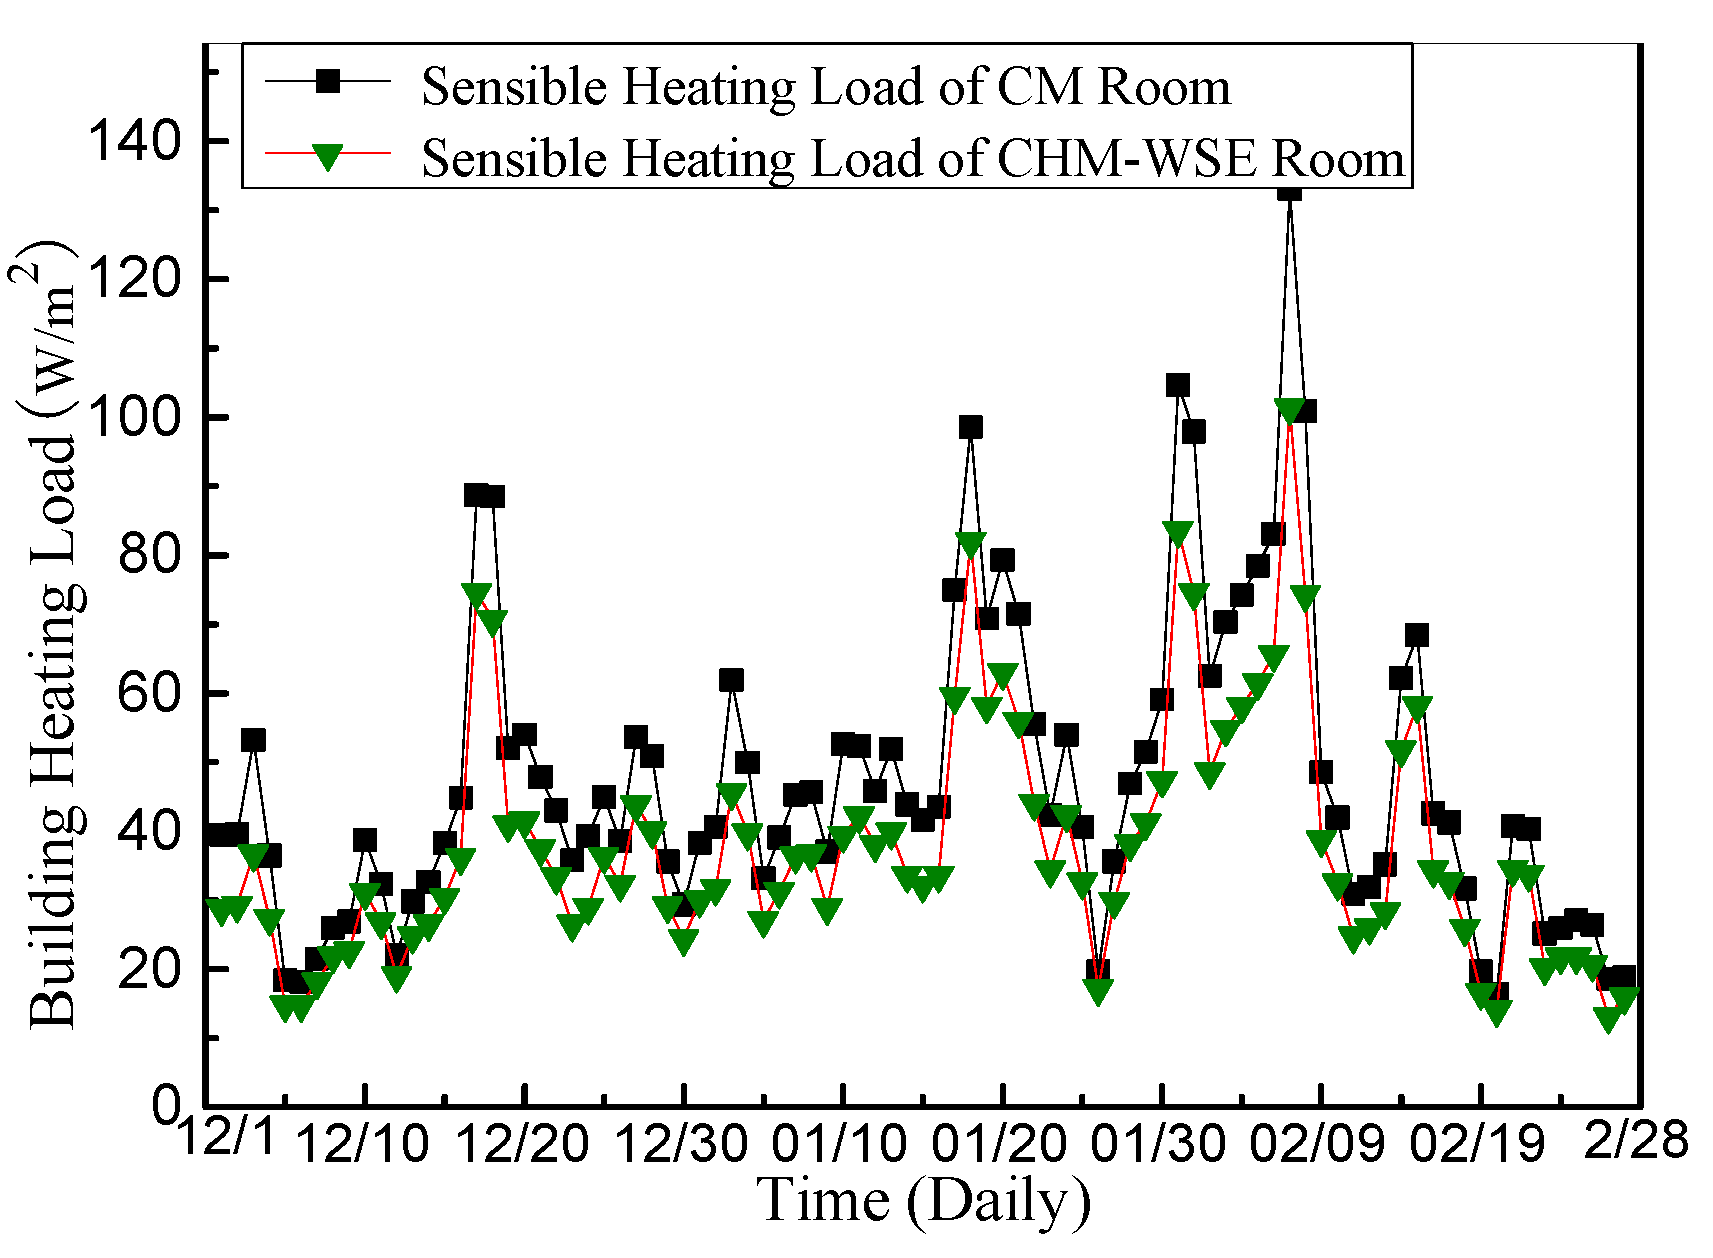
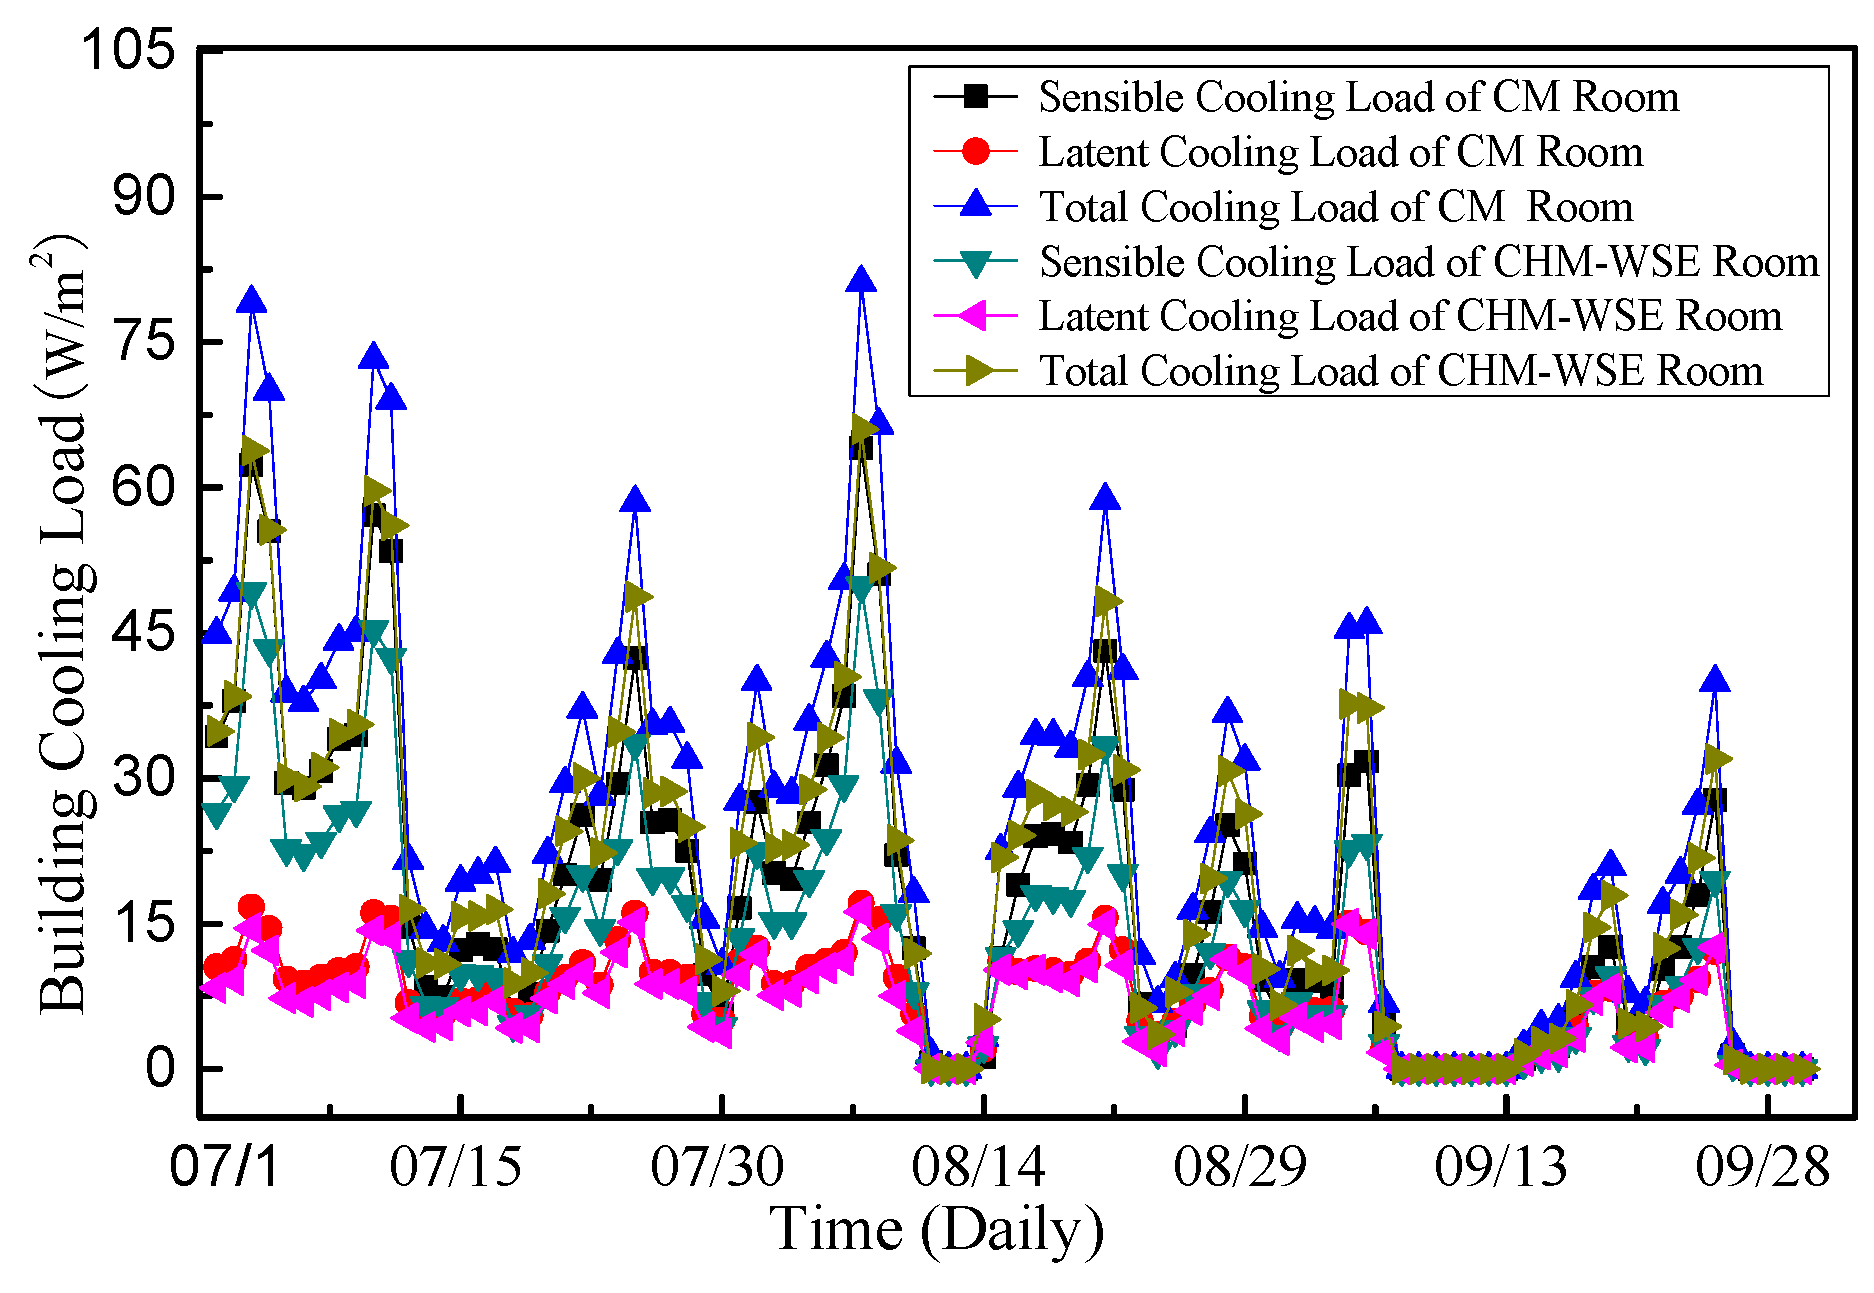
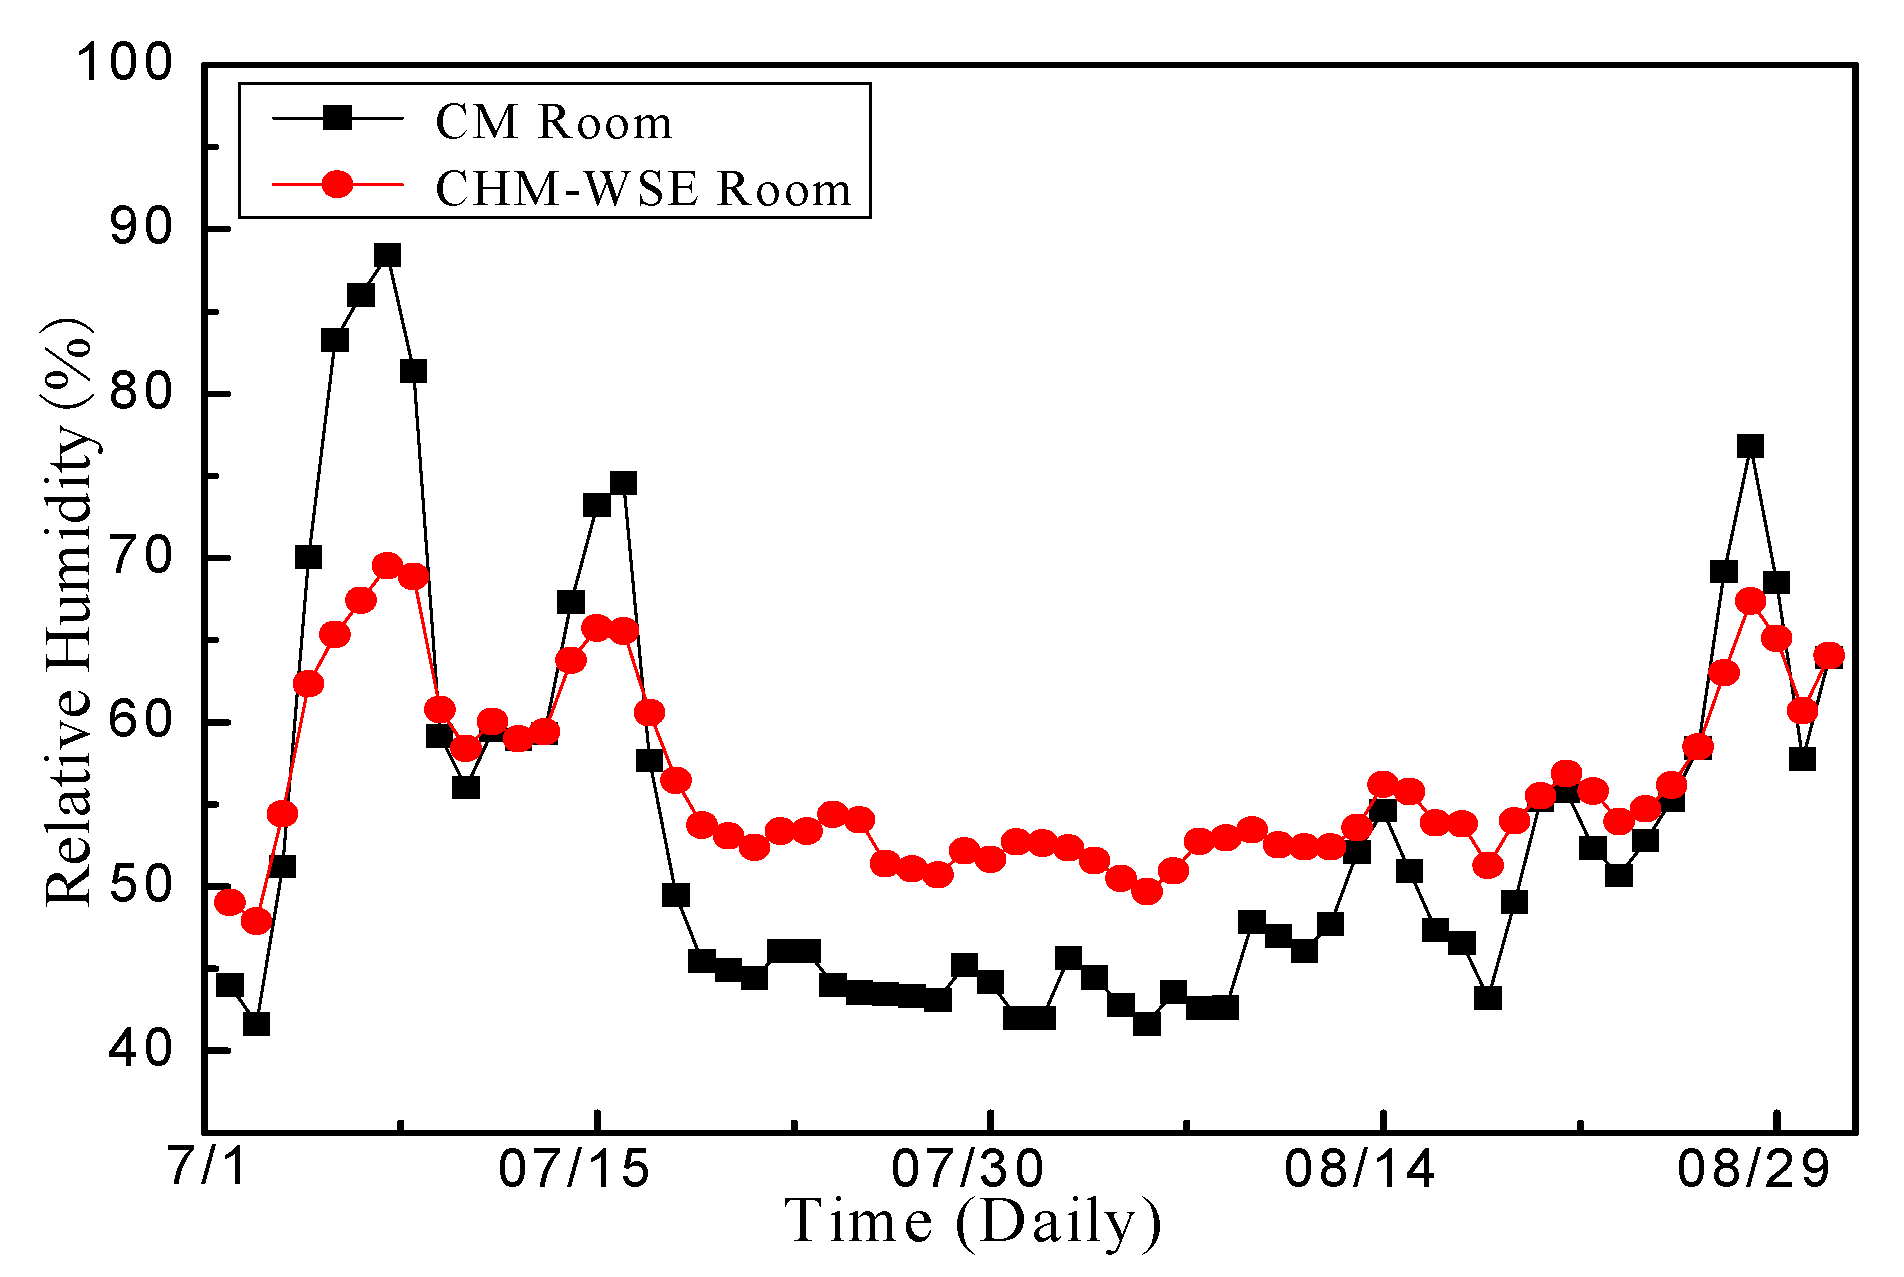
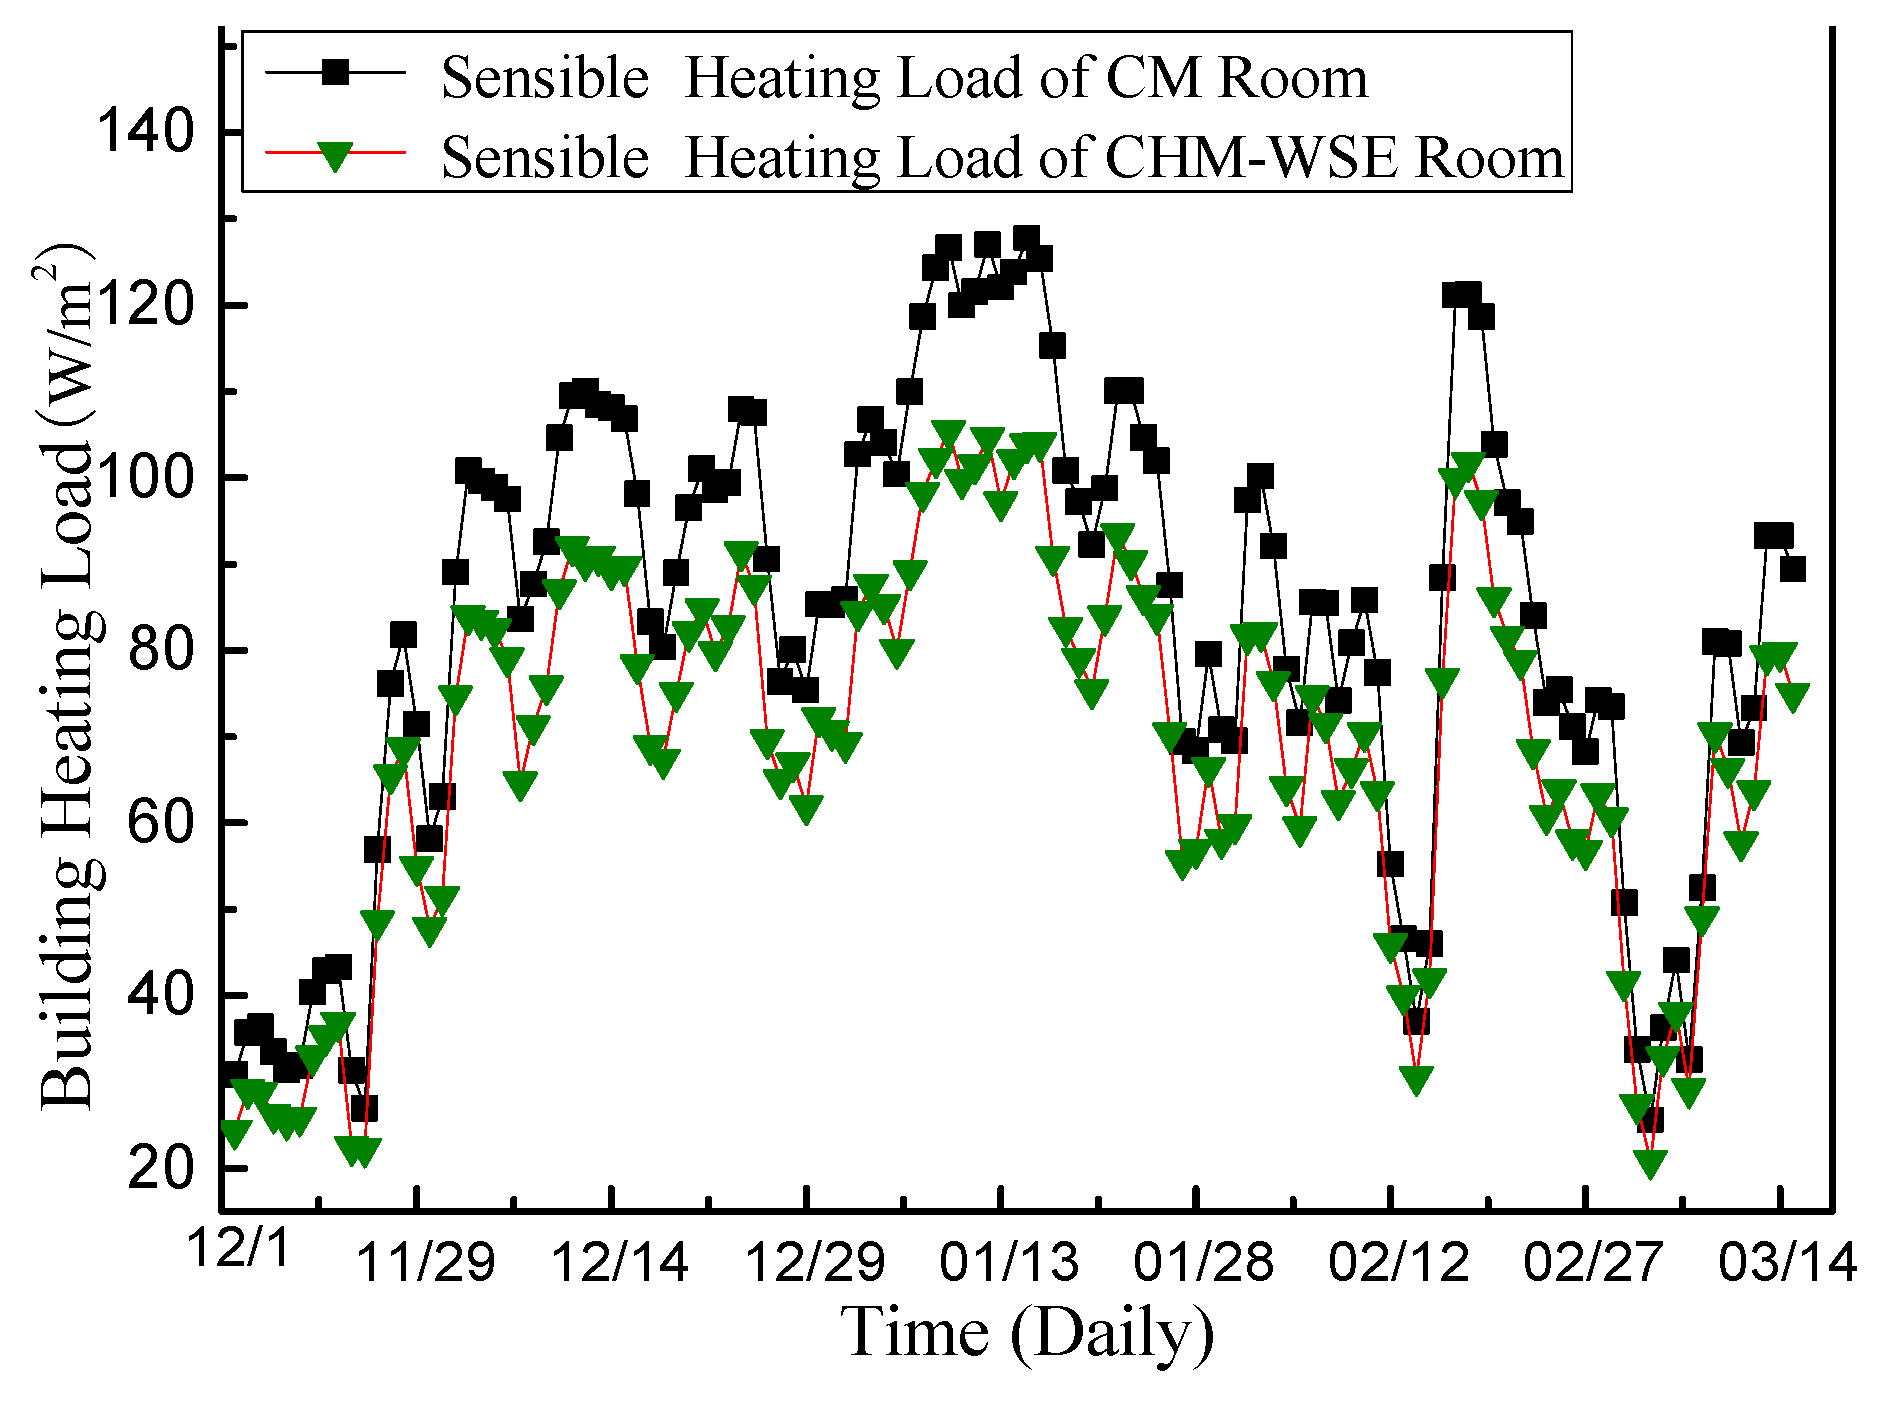
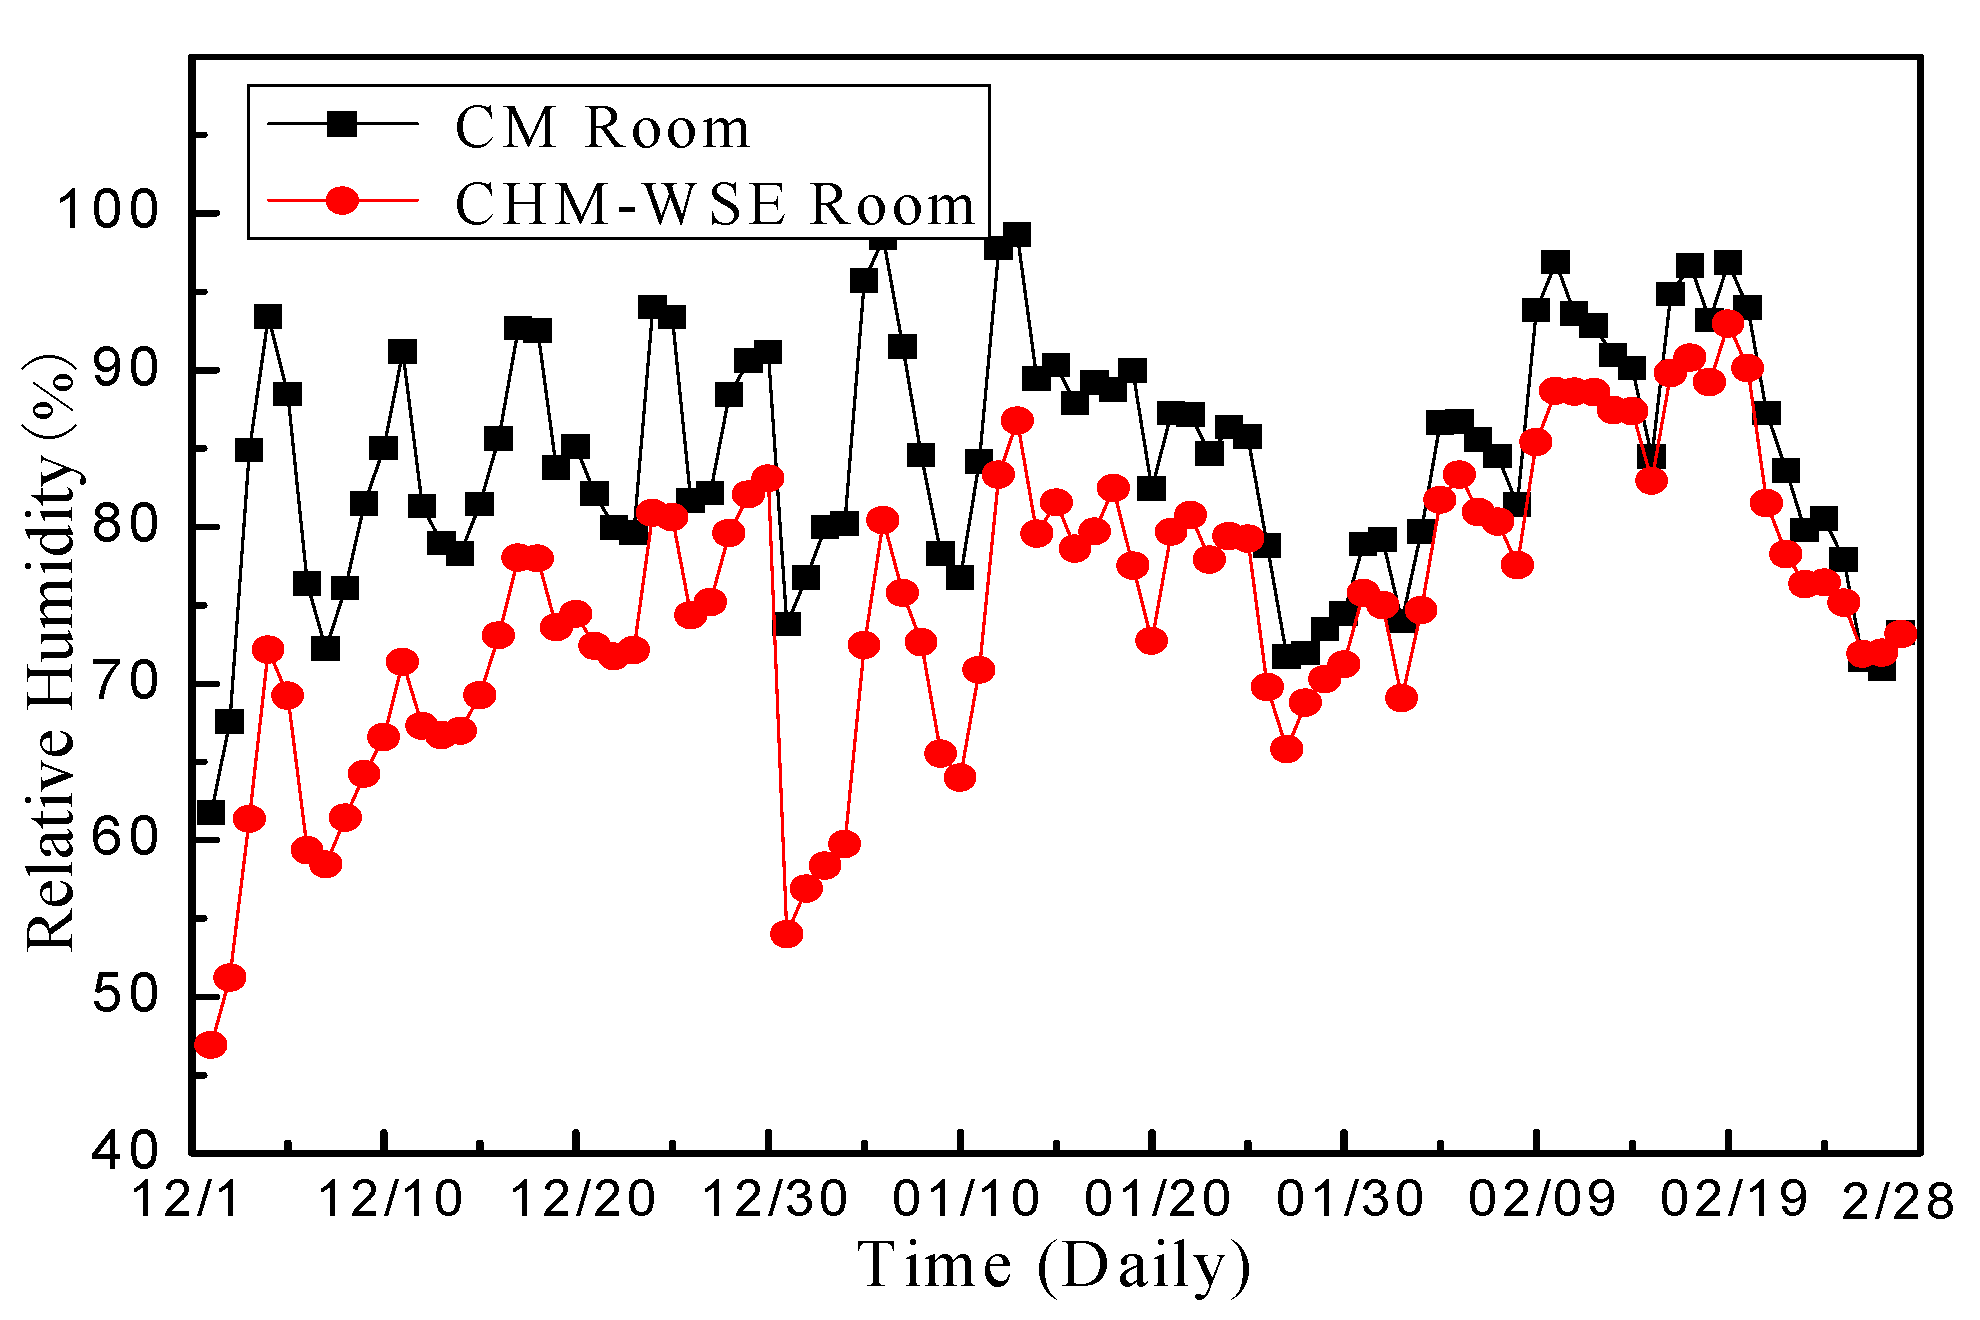
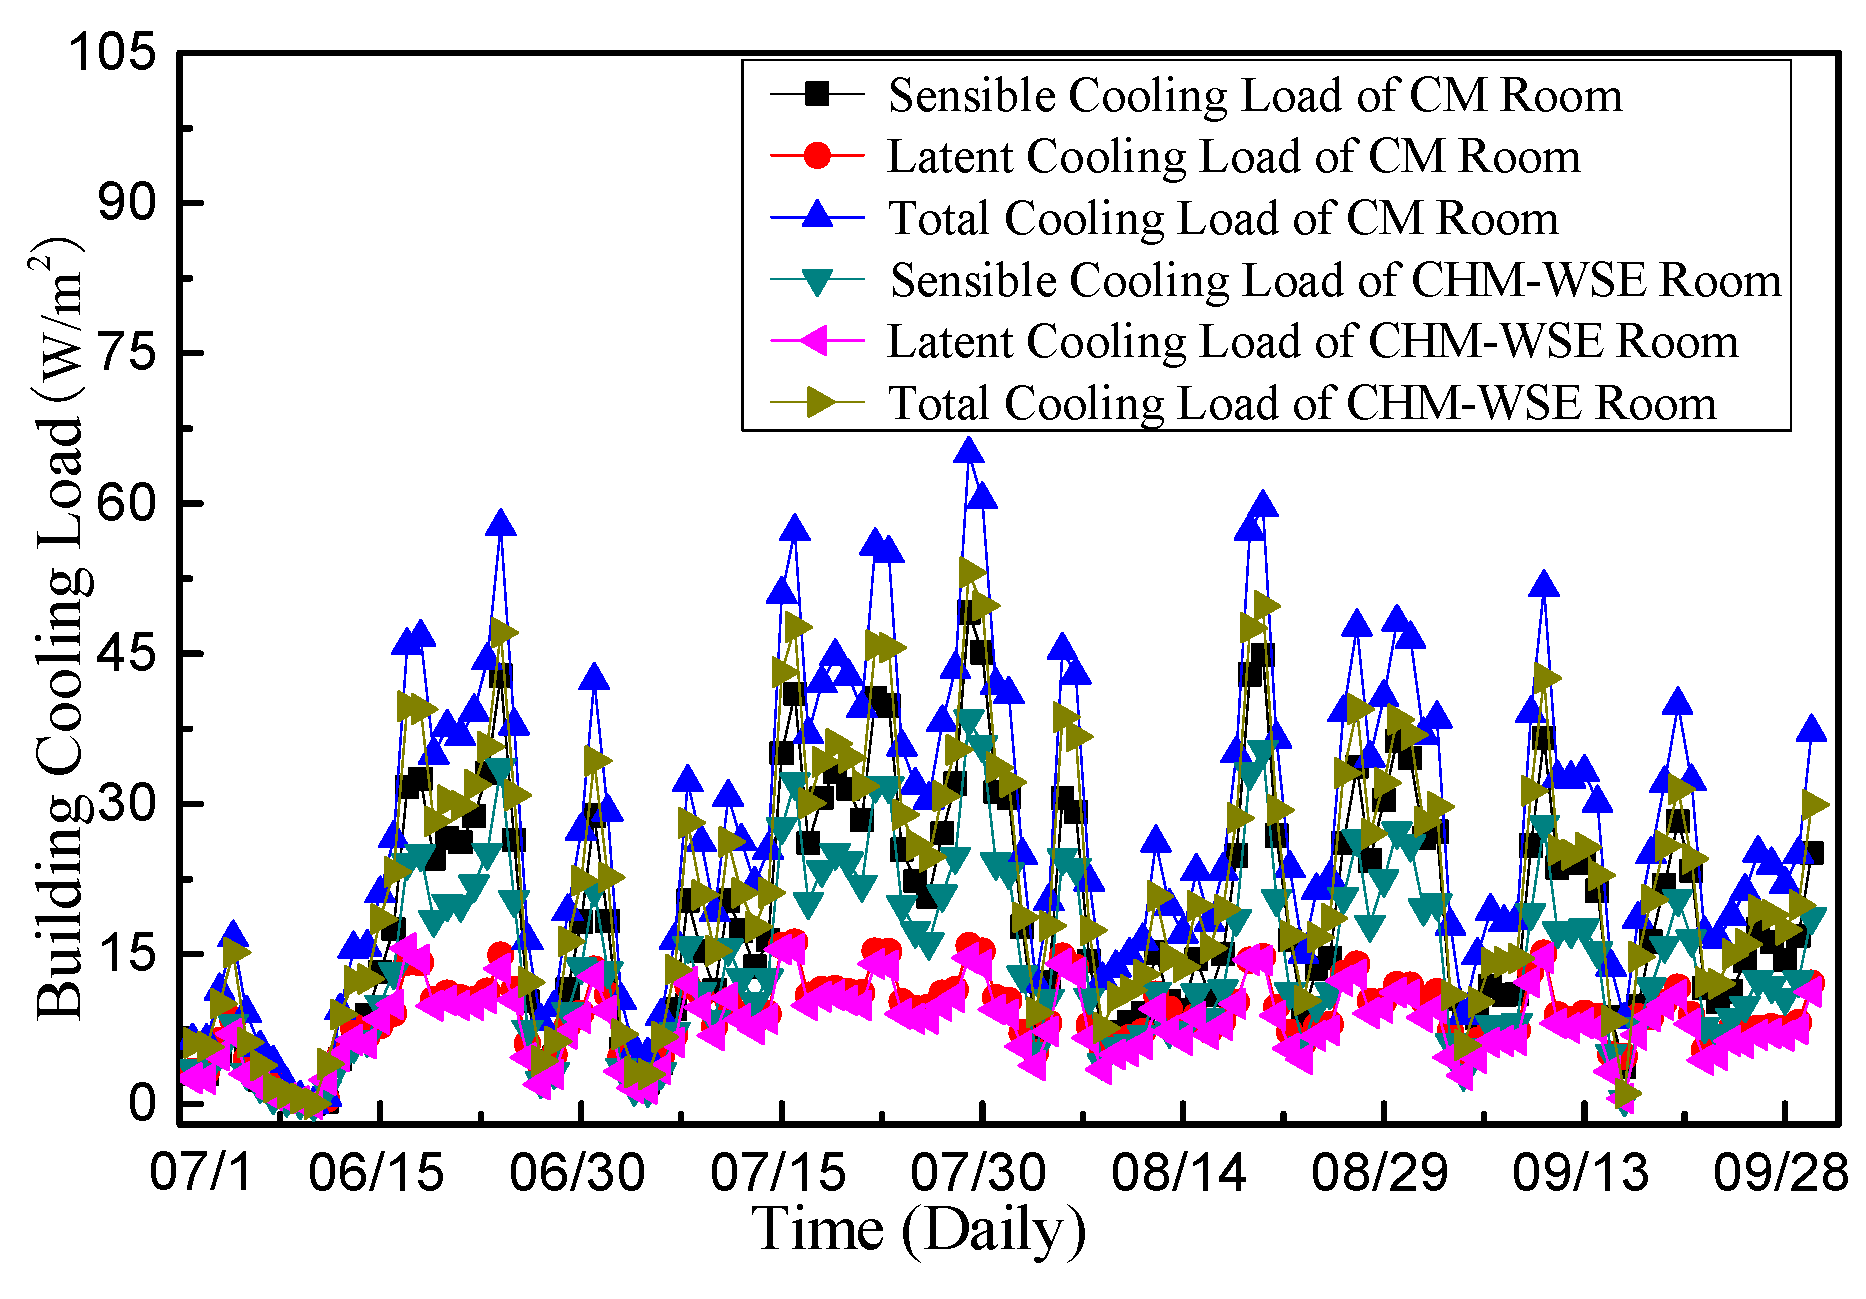
This paper mainly focuses on the hot summer and cold winter region with high humidity in both summer and winter. Therefore, three typical cities in this region, including Changsha, Wuhan, and Nanjing are selected to study the performance of CHM-WSE. In the hot summer and cold winter region where the relative humidity fluctuates greatly during day and night, the indoor relative humidity in the room with CHM-WSE is controlled at 35–65% in winter (Figure 23) and 50–70% in summer (Figure 24). The results show that the indoor relative humidity fluctuation of the room with CHM-WSE is about 10% lower than that of the room with CM. The results of building heating load show that the heating load of the room with CHM-WSE is obviously lower than that of the room with CM (Figure 25). The results of building cooling load show that the sensible cooling and latent cooling load of the room with CHM-WSE are lower than that of the room with CM (Figure 26).
(2) Cold region
This study chooses Xi’an as a typical city in the cold region. This region has dry and cold winters and humid and hot summers.
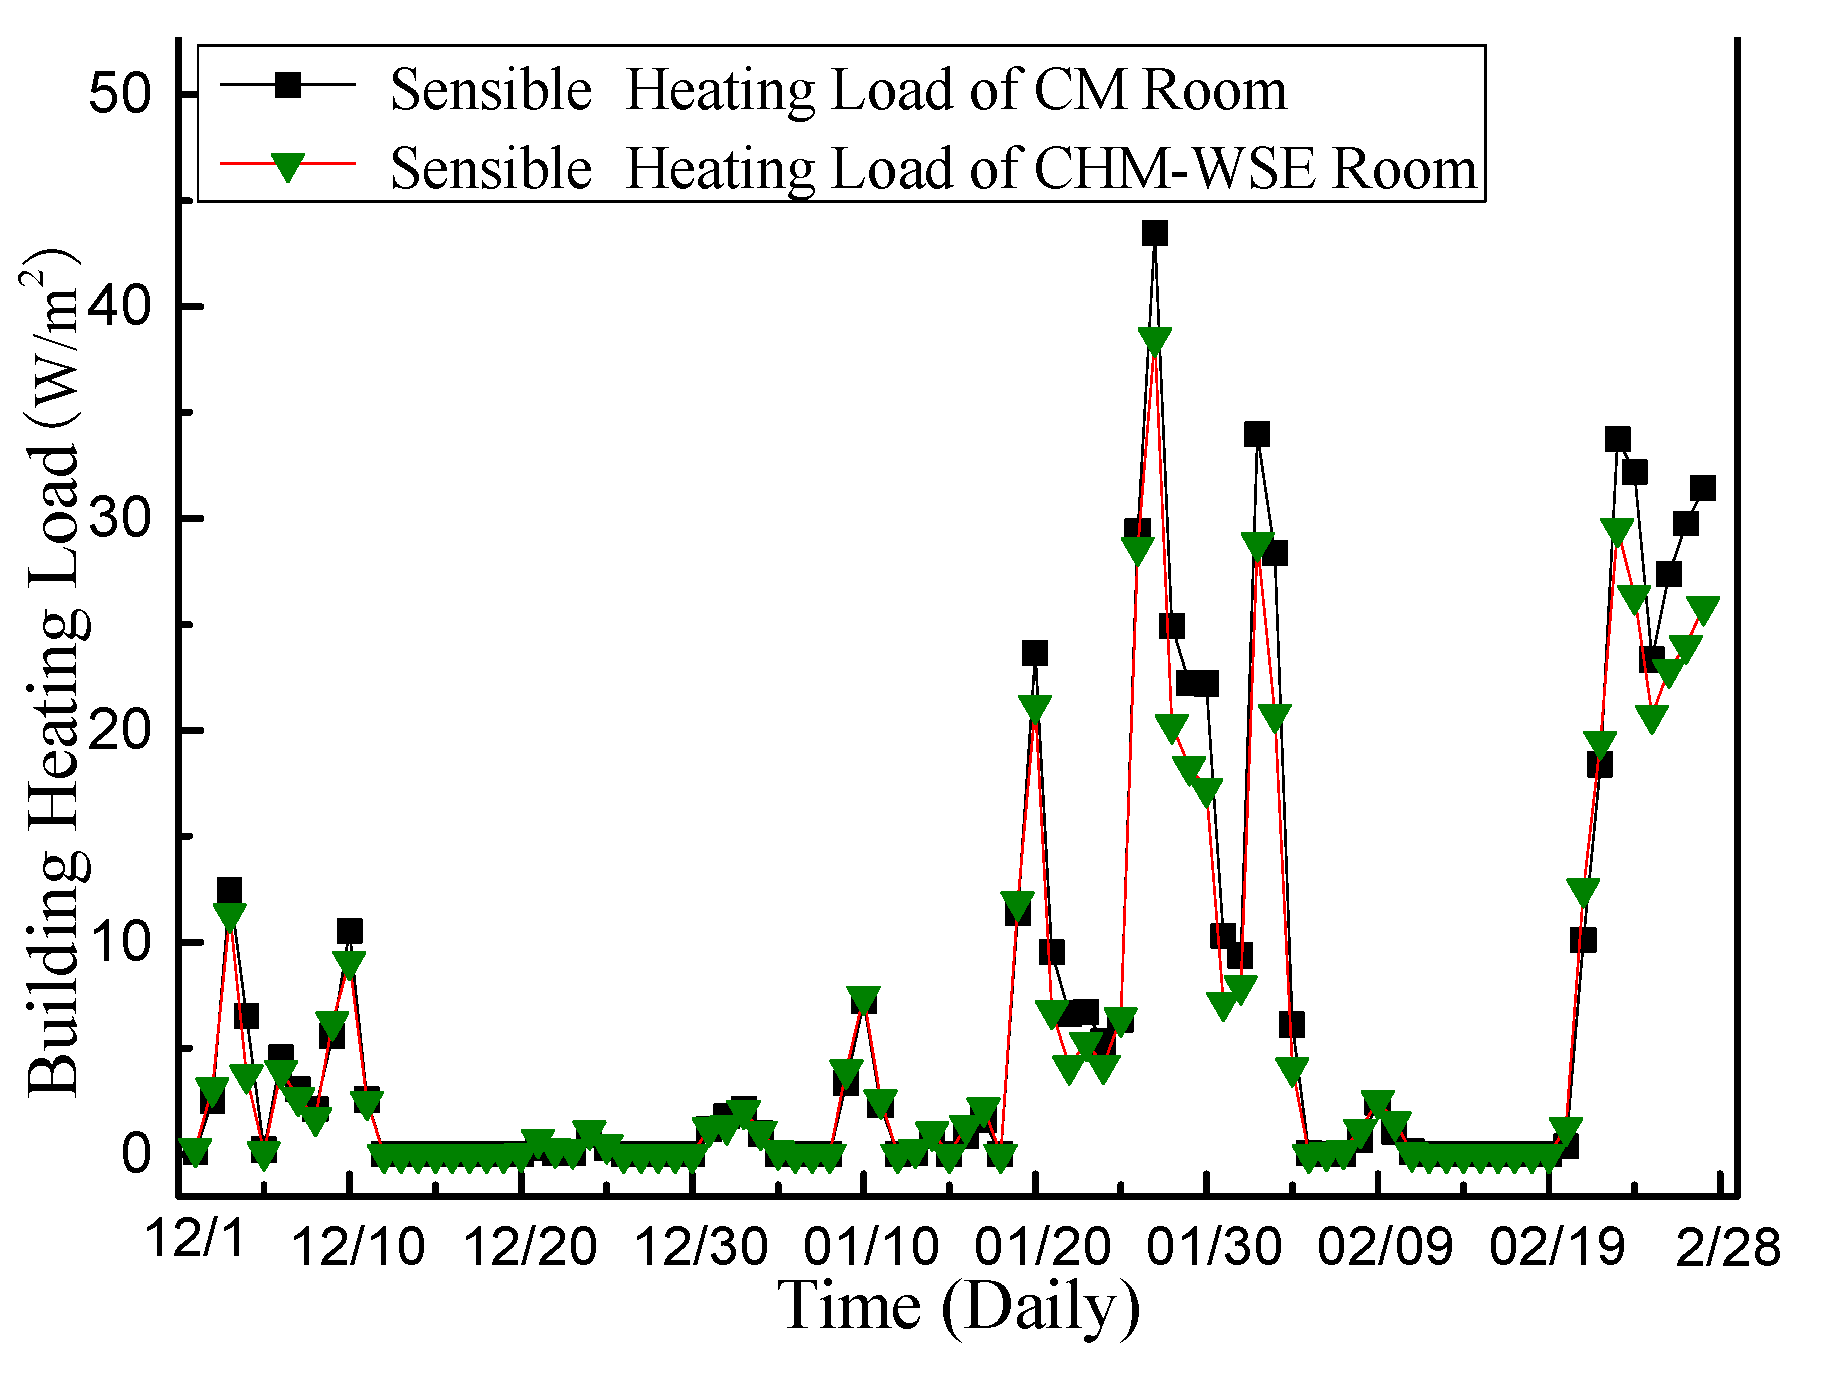
In the cold region where the relative humidity of day and night do not change obviously, the CHM-WSE has small effect on the indoor humidity environment in winter (Figure 27), but the indoor relative humidity is about 55% in summer (Figure 28), which is 10% higher than that of CM. The results (Figure 29 and Figure 30) of building load indicated that both the heating load and cooling load of the room with CHM-WSE is lower than that of the room with CM.
(3) Hot summer and warm winter region (HSWW)
Guangzhou is chosen as the typical city in the hot summer and warm winter region. This region has high humidity throughout the year. In the unheated hot summer and warm winter region, in the room where the CHM-WSE is used, the indoor relative humidity is reduced in winter by about 10% (Figure 31) and the relative humidity in summer is controlled at 55–70% with a small fluctuation range (Figure 32). It can be seen in Figure 33 that the heating load of Guangzhou is very small. The results also show that the building cooling load of the room with CHM-WSE is lower than that of the room with CM (Figure 34).
The relative humidity and energy saving rate of the two rooms are compared and analyzed based on the simulation results of different cities. The results in Table 15 shows that in the heating season, the room with CHM-WSE in the HSCW region has better energy-saving performance, and the energy consumption rate is 20% lower than that in the room with CM. The energy consumption rate of the latent cooling load in HSWW region is the lowest, which is 12.4% lower than that in the room with CM. In the cooling season, there is little difference in the energy-saving rate of the total cooling load, and the energy-saving performance of latent cooling load in the cold region is better.
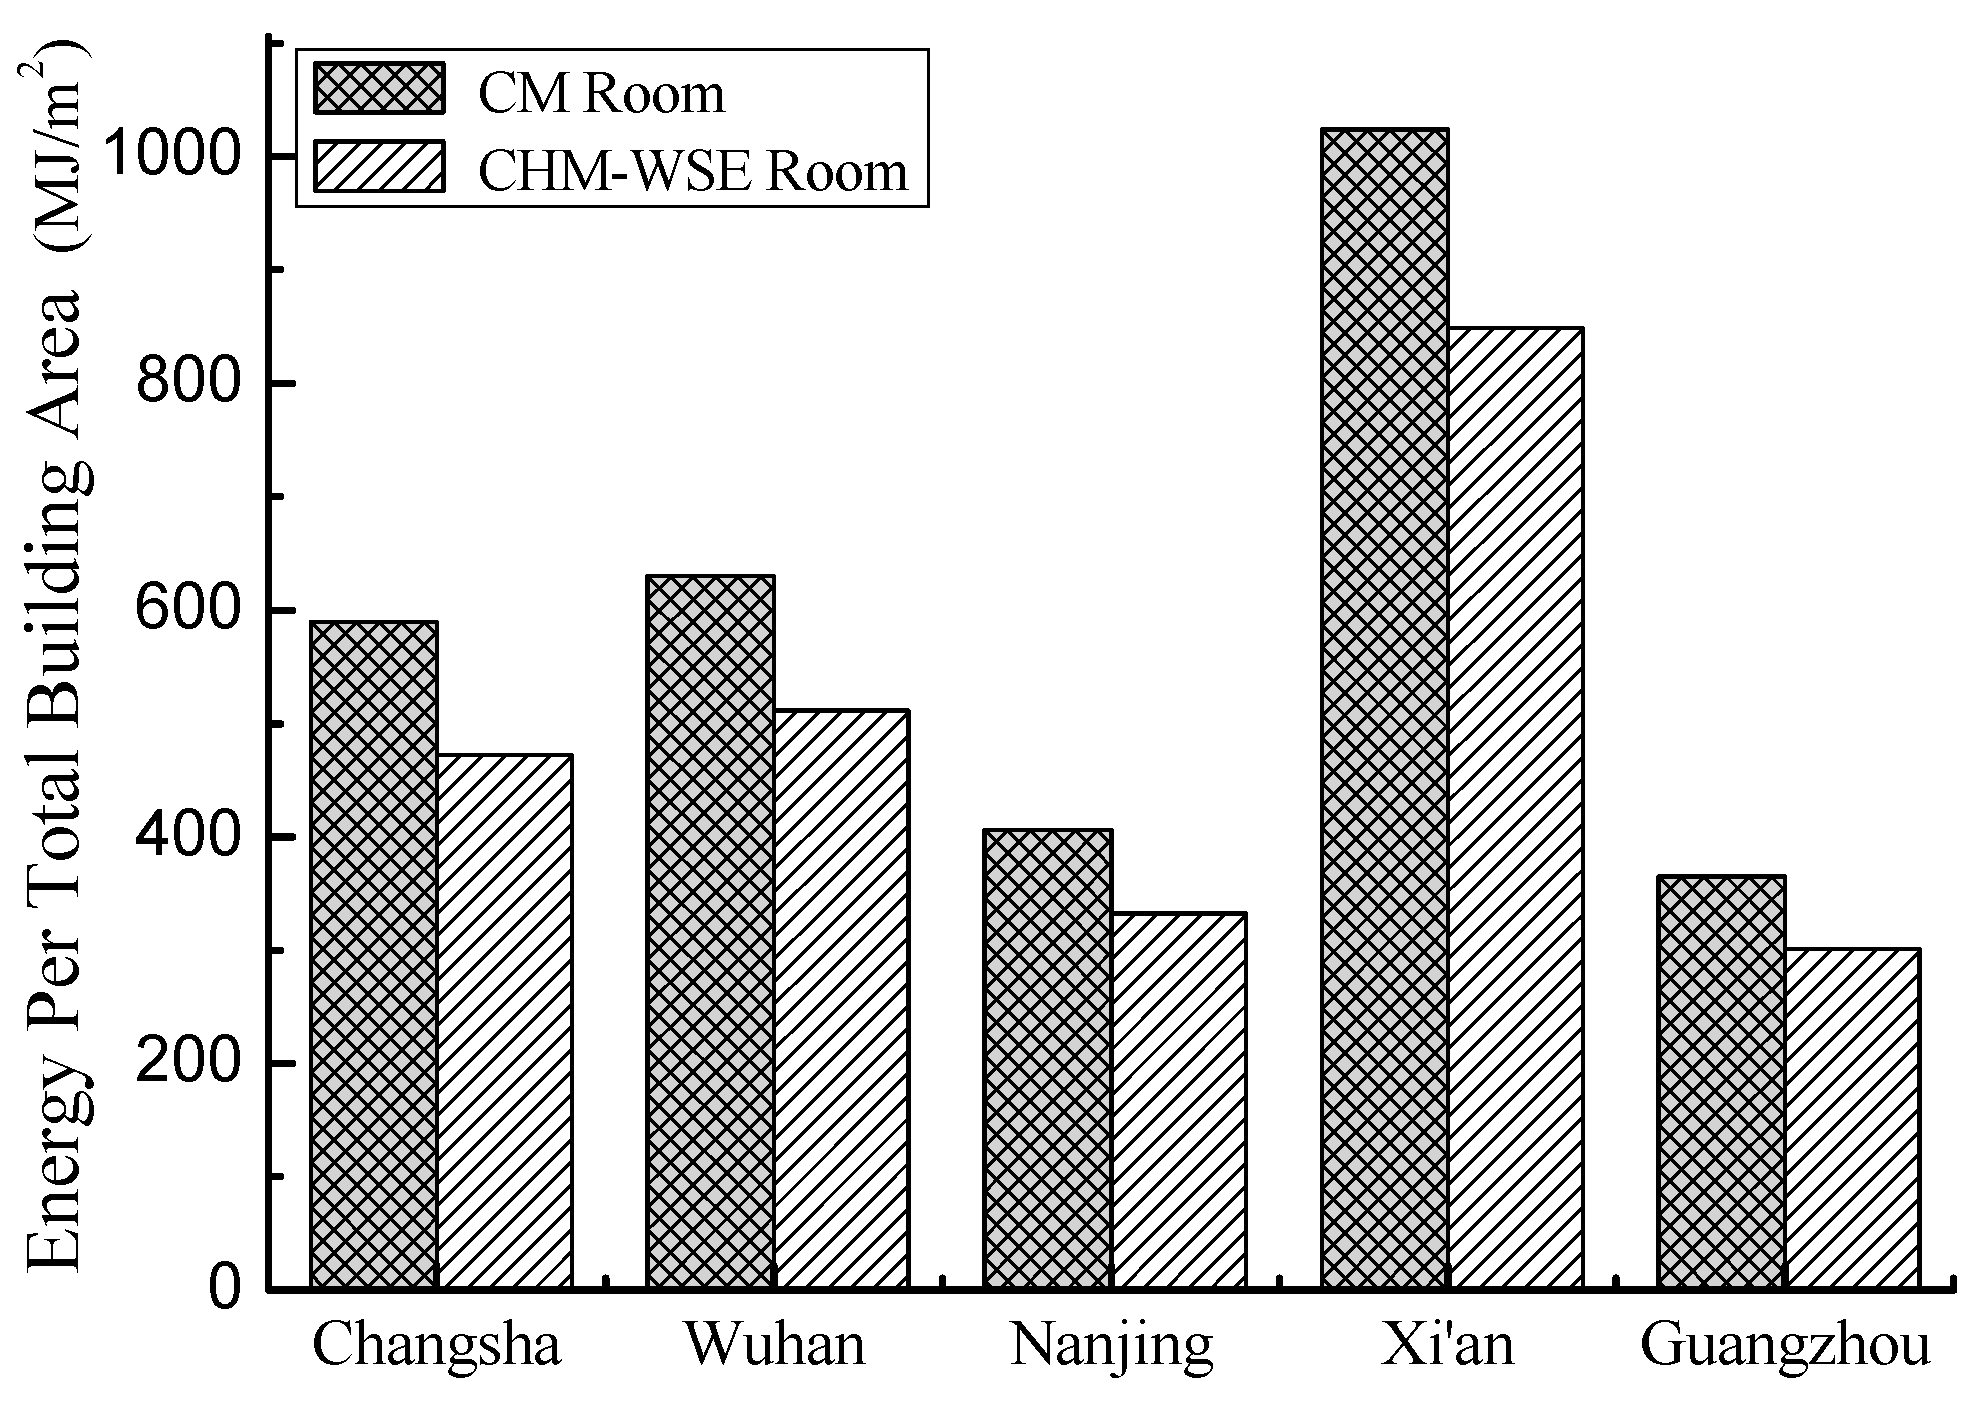
According to the simulation results, the compound humidity control mortar not only maintains the stable relative humidity in the room, but also has the function of heat preservation and humidity adjustment. Figure 35 indicates that annual energy-saving rate per unit area of Changsha, Wuhan, Nanjing, Guangzhou, Xi’an are about 24.8%, 23.2%, 22.3%, 21.3%, 20.6%, respectively. Compared with the room with CM, the energy saving rate of the room with CHM-WSE in the cold region is the smallest, followed by the hot summer and warm summer region. It can be concluded that the compound humidity control mortar can keep stable relative humidity indoor. At the same time it also can play as an insulation material for the building envelope.
4. Conclusions
The purpose of this study was to obtain a new type of composite hygroscopic building material and put forward methods for its application research. Through the preparation of hygroscopic materials, sample tests, large-scale space experiment and different climate region analysis, conclusions can be drawn as follows:
(1) A series of experiments assessing the properties of the new composite hygroscropic material are conducted. The microstructure and adsorption properties of multiple sets of CHM-WSE are studied. The mechanical properties and thermodynamic properties experiment is conducted of specimen has excellent hygroscopic property and a specific surface area of 33.331 m2/g, aiming to meet the engineering requirements. Importantly, the structural characteristics of the hygroscopic material are firstly considered for quantifying its performance of engineering requirements.
(2) A large-scale space comparison experiment is established. The test results show that the temperature and humidity uniformity in the room with CHM-WSE are better than that in the room with CM at 1.5 m from the floor. The relative humidity of the room with CHM-WSE is 14.3% lower than that of the room with CM in winter. The relative humidity of the room with CHM-WSE is lower than that of the room with CM by 6–10% in spring. Furthermore, the room with CHM-WSE has better moisture buffering performance than the room with CM, and the practical moisture buffering performance is better in spring and summer alternating season than in winter.
(3) The influence of CHM-WSE on the indoor humidity environment and energy consumption in the multi-climate zone is studied. The simulation results show that the relative humidity fluctuation of the room with CHM-WSE is about 10% lower than that of the room without CHM-WSE, which has better hygroscopic ability and energy saving potential, and is more suitable for hot summer and cold winter region.
The raw materials of the CHM-WSE presented in this paper are common environmental materials, which are cheap and easy to handle. The CHM-WSE not only meets the requirements of mechanics and thermodynamics, but also regulates indoor humidity environment, improves indoor comfort and reduces building energy consumption. It is a new type of composite hygroscopic building material which could replace the traditional mortar.
Acknowledgments
The authors are grateful for the financial support of the Major Science and Technology Projects of Hunan Province, China (No. 2010FJ1013), the International Science and Technology Cooperative in Project of China (No. 2010DFB63830), National Natural Science Foundation of China (Grant No. 51378186) and National Key Technology Support Program (No. 2015BAJ03B00).
Author Contributions
Huahui Xie and Guangcai Gong conceived and designed the experiments; Huahui Xie and Yi Wu performed the experiments; Huahui Xie and Guangcai Gong analyzed the data; Huahui Xie, Yi Wu, Yongchao Liu and Yingjuan Wang contributed materials/test/analysis tools; Huahui Xie wrote the paper.
Conflicts of Interest
The authors declare no conflict of interest.
References
- Bomberg, M.T.; Brown, W.C. Building envelope design through environmental control—Part 1: Heat, air and moisture interactions. Constr. Can. 1993, 2, 116–119. [Google Scholar] [CrossRef]
- Sato, M.; Fukayo, S.; Yano, E. Adverse environmental health effects of ultra-low relative humidity indoor air. J. Occup. Health 2003, 45, 133–136. [Google Scholar] [CrossRef] [PubMed]
- Fisk, W.J.; Lei-Gomez, Q.; Mendell, M.J. Meta-analyses of the associations of respiratory health effects with dampness and mold in homes. Indoor Air 2007, 17, 284–296. [Google Scholar] [CrossRef] [PubMed]
- Yang, W.; Wong, N.H.; Jusuf, S.K. Thermal comfort in outdoor urban spaces in Singapore. Build. Environ. 2013, 59, 426–435. [Google Scholar] [CrossRef]
- Mendes, N.; Winkelmann, F.C.; Lamberts, R.; Philippi, P.C. Moisture effects on conduction loads. Energy Build. 2003, 35, 631–644. [Google Scholar] [CrossRef]
- Chung, S.Y.; Lehmann, C.; Abd Elrahman, M.; Stephan, D. Pore characteristics and their effects on the material properties of foamed concrete evaluated using micro-CT images and numerical approaches. Appl. Sci. 2017, 7, 550. [Google Scholar] [CrossRef]
- Li, C.Q. Life Cycle Modeling of Corrosion Affected Concrete Structures: Propagation. J. Struct. Eng. 2003, 15, 753–761. [Google Scholar] [CrossRef]
- GB 50736::2012. Design Code for Heating Ventilation and Air Conditioning of Civil Buildings; Ministry of Housing and Urban-Rural Construction of the People’s Republic of China: Beijing, China, 2012.
- Kaufhold, S.; Dohrmann, R.; Klinkenberg, M.; Siegesmund, S.; Ufer, K. N2-BET specific surface area of bentonites. J. Colloid Interface Sci. 2010, 349, 275–282. [Google Scholar] [CrossRef] [PubMed]
- Allinson, D.; Hall, M. Hygrothermal analysis of a stabilised rammed earth test building in the UK. Energy Build. 2010, 42, 845–852. [Google Scholar] [CrossRef]
- Ashour, T.; Georg, H.; Wu, W. An experimental investigation on equilibrium moisture content of earth plaster with natural reinforcement fibres for straw bale buildings. Appl. Therm. Eng. 2011, 31, 293–303. [Google Scholar] [CrossRef]
- Hall, M.; Allinson, D. Analysis of the hygrothermal functional properties of stabilised rammed earth materials. Build. Environ. 2009, 44, 1935–1942. [Google Scholar] [CrossRef] [Green Version]
- Padfield, T. The Role of Absorbent Building Materials in Moderating Changes of Relative Humidity. Ph.D. Thesis, The Technical University of Denmark, Kongens Lyngby, Denmark, 1999. [Google Scholar]
- Murata, K.; Watanabe, Y.; Nakano, T. Effect of thermal treatment on fracture properties and adsorption properties of spruce wood. Materials 2013, 6, 4186–4197. [Google Scholar] [CrossRef] [PubMed] [Green Version]
- Fang, L.; Clausen, G.; Fanger, P.O. Impact of temperature and humidity on the perception of indoor air quality during immediate and longer whole-body exposures. Indoor Air 1998, 8, 276–284. [Google Scholar] [CrossRef]
- Simonson, C.J.; Salonvaara, M.; Ojanen, T. The effect of structures on indoor humidity-possibility to improve comfort and perceived air quality. Indoor Air 2002, 12, 243–251. [Google Scholar] [CrossRef] [PubMed]
- Kurnitski, J.; Kalamees, T.; Palonen, J.; Eskola, L.; Seppanen, O. Potential effects of permeable and hygroscopic lightweight structures on thermal comfort and perceived IAS in a cold climate. Indoor Air 2007, 17, 37–49. [Google Scholar] [CrossRef] [PubMed]
- Li, Z.; Chen, W.; Deng, S.; Lin, Z. The characteristics of space cooling load and indoor humidity control for residences in the subtropics. Build. Environ. 2006, 41, 1137–1147. [Google Scholar] [CrossRef]
- Woloszyn, M.; Kalamees, T.; Abadie, M.O.; Steeman, M.; Kalagasidis, A.S. The effect of combining a relative-humidity-sensitive ventilation system with the moisture-buffering capacity of materials on indoor climate and energy efficiency of buildings. Build. Environ. 2009, 44, 515–524. [Google Scholar] [CrossRef]
- Mitchell, M.R.; Link, R.E.; Fang, P.; Mukhopadhyaya, P.; Kumaran, K.; Shi, C. Sorption and thermal properties of insulating mortars with expanded and vitrified small ball (EVSB). J. Test. Eval. 2011, 39, 102378. [Google Scholar] [CrossRef]
- Osanyintola, O.F.; Talukdar, P.; Simonson, C.J. Effect of initial conditions, boundary conditions and thickness on the moisture buffering capacity of spruce plywood. Energy Build. 2006, 38, 1283–1292. [Google Scholar] [CrossRef]
- Osanyintola, O.F.; Simonson, C.J. Moisture buffering capacity of hygroscopic building materials, experimental facilities and energy impact. Energy Build. 2006, 38, 1270–1282. [Google Scholar] [CrossRef]
- Wu, Y.; Gong, G.; Yu, C.W.; Fang, P. The hygroscopic properties of wood fibre, sepiolite and expanded perlite-based breathable wall for moderating the humidity environment. Indoor Built Environ. 2014, 23, 299–312. [Google Scholar] [CrossRef]
- Rode, C.; Grau, K. Moisture Buffering of Building Materials; Department of Civil Engineering, Technical University of Denmark: Kongens Lyngby, Denmark, 2005; pp. 11–78. ISBN 87-7877-195-1. [Google Scholar]
- Test Method of Adsorption/Desorption Efficiency for Building Material to Regulate Indoor Humidity; JIS A 1470-1:2002; Japanese Industrial Standards, Japanese Standards Association: Tokyo, Japan, 2002.
- Hygrothermal Performance of Building Materials and Products-Determination of Moisture Adsorption/Desorption Properties in Response to Humidity Variation; ISO 24353:2008; International Organization for Standardization: Geneva, Switzerland, 2008.
- Xie, H.; Gong, G.; Wu, Y. Investigations of equilibrium moisture content with Kelvin modification and dimensional analysis method for composite hygroscopic material. Constr. Build. Mater. 2017, 139, 101–113. [Google Scholar] [CrossRef]
- Wu, Y.; Gong, G.; Yu, C.W.; Huang, Z. Proposing ultimate moisture buffering value (UMBV) for characterization of composite porous mortars. Constr. Build. Mater. 2015, 82, 81–88. [Google Scholar] [CrossRef]
- Pore Size Distribution and Porosity of Solid Materials by Mercury Porosimetry and Gas Adsorption-Part 1: Mercury Porosimetry; ISO 15901-1:2016; The British Standards Institution: London, UK, 2016; ISBN 9780580815584.
- Test Methods of Inorganic Rigid Thermal Insulation; GB/T5486.2:2001; Standardization Administration of China: Beijing, China, 2001.
- Hygrothermal Performance of Building Materials and Products—Determination of Hygroscopic Sorption Properties; ISO 12571:2013; British Standard: Geneva, Switzerland, 2013.
- Standard Test Method for Steady-State Thermal Transmission Properties by Means of the Heat Flow Meter Apparatus; ASTM Standard C518-04; ASTM International: West Conshohocken, PA, USA, 2010.
- Zhang, W.S. Study on the Performances of Heat Moisture and Air Permeation for the Wall Materials of Composite Insulation Block. Master’s Thesis, China University of Mining and Technology, Beijing, China, 2016. [Google Scholar]
- Design Code for Heating Ventilation and Air Conditioning of Civil Building; GB50736:2016; Standardization Administration of China: Beijing, China, 2016.
- Building Thermal Insulation Mortar; GB/T 20473:2006; Standardization Administration of China: Beijing, China, 2006.
- Multi-Layer Coating for Architecture; GB/T 9779:2015; Standardization Administration of China: Beijing, China, 2015.
- Hunan Universtiy; Tianjin University; Tongjing University; Southeast University. Civil Engineering Materials; China Architecture and Building Press: Beijing, China, 2003; pp. 253–254. ISBN 7-112-04784-6. [Google Scholar]
Figure 1.
The tested building.

Figure 2.
Drawing of the test room.

Figure 3.
The experimental set-up of text. (a) Cement paste mixer (b) Electronic balance (≤5 kg).

Figure 4.
Horizontal test point (h = 1.5 m).

Figure 5.
Vertical test point.

Figure 6.
SEM pictures.

Figure 7.
The adsorption-desorption isotherms of specimens.


Figure 8.
Equilibrium moisture content of specimens (20 °C, 25 °C, 40 °C).

Figure 9.
Thermal conductivity as a function of relative humidity for specimens.

Figure 10.
Two types of mortar wall (without primer and finish).

Figure 11.
Outdoor temperature and humidity test in January.

Figure 12.
Indoor temperature in the center of the room.

Figure 13.
Indoor relative humidity in the center of the room.

Figure 14.
Indoor air moisture content in the center of the room.

Figure 15.
Indoor relative humidity of room I.

Figure 16.
Indoor relative humidity of room II. (Ceiling: P10; South wall: P8; North wall: P9; Room center: P4).
Figure 16.
Indoor relative humidity of room II. (Ceiling: P10; South wall: P8; North wall: P9; Room center: P4).

Figure 17.
Indoor temperature and humidity distribution under air-conditioning condition. (Time: 8:30 the next day).
Figure 17.
Indoor temperature and humidity distribution under air-conditioning condition. (Time: 8:30 the next day).

Figure 18.
Outdoor temperature and humidity test in April.

Figure 19.
Temperature in the center of the room.

Figure 20.
Relative humidity in the center of the room.

Figure 21.
Air moisture content in the center of the room.

Figure 22.
Indoor temperature and humidity distribution. (Time: 8:30 the next day).

Figure 23.
Indoor relative humidity in heating season (Changsha).

Figure 24.
Indoor relative humidity in cooling season (Changsha).

Figure 25.
Heating Load (Changsha).

Figure 26.
Cooling load (Changsha).

Figure 27.
Indoor relative humidity in heating season (Xi’an).

Figure 28.
Indoor relative humidity in cooling season (Xi’an).

Figure 29.
Heating load (Xi’an).

Figure 30.
Cooling load (Xi’an).

Figure 31.
Indoor relative humidity in heating season (Guangzhou).

Figure 32.
Indoor relative humidity in cooling season (Guangzhou).

Figure 33.
Heating load (Guangzhou).

Figure 34.
Cooling load (Guangzhou).

Figure 35.
Energy per conditioned building area (MJ/m2).


Table 1.
Properties of insulated aggregates [16].
Table 1.
Properties of insulated aggregates [16].
| Raw Materials | Specific Surface Area (m2/g) | Total Pore Volume (mL/g) | Desorption of Pore Volume (mL/g) | Average Pore Diameter (nm) | Bulk Density (kg/m3) |
|---|---|---|---|---|---|
| Wood fibre | 3.000 | 0.0103 | 0.01122 | 13.733 | 86 |
| Expanded perlite | 2.851 | 0.0091 | 0.00989 | 12.77 | 76 |
| Sepiolite | 125.83 | 0.319 | 0.31969 | 10.14 | 277.5 |
Table 2.
Mix ratios of the experimental mortars.
| Mortar Samples | Wood Fibre (mL) | Sepiolite (mL) | Expanded Perlite (mL) | Polypropylene Fibre (g) | Redispersible Powder (g) | Portland Cement (g) | Diatom Ooze (g) |
|---|---|---|---|---|---|---|---|
| A-1 | 17 | 34 | 68 | 0.3 | 4 | 50 | 50 |
| A-2 | 17 | 34 | 68 | 0.9 | 4 | 70 | 25 |
| A-3 | 34 | 68 | 2.1 | 4 | 50 | 50 | |
| B-1 | 17 | 17 | 68 | 3 | 4 | 100 | 45 |
| C-1 | 17 | 34 | 68 | 3 | 4 | 100 | - |
| C-2 | 17 | 34 | 68 | 0 | 4 | 100 | - |
Table 3.
Water vapor diffusion coefficient of expanded perlite.
| Relative Humidity | 35.28–58.67% | 58.67–64.46% | 58.67–71.40% | 60.06–100% |
|---|---|---|---|---|
| (kg/(m∙Pa∙s)) | 2.953 × 10⁻¹¹ | 3.133 × 10⁻¹¹ | 2.980 × 10⁻¹¹ | 3.251 × 10⁻¹¹ |
Table 4.
Structural form of the building envelope.
| Position | Structure (From Inside to Outside) | |
|---|---|---|
| Roof | CM layer 20 mm + Steel Reinforced Concrete 100 mm + CM layer 20 mm + Waterproof layer + Plywood 25 mm + CM layer 20 mm | |
| Room I | Exterior wall | CM layer 20 mm + Porous brick 240 mm + CM layer 20 mm |
| Interior wall | CM layer20 mm + Porous brick 190 mm + CM layer 20 mm | |
| Room II | Exterior wall | CHM-WSE 20 mm + Porous brick 240 mm + CM layer 20 mm |
| Interior wall | CHM-WSE 20 mm + Porous brick 190 mm + CM layer 20 mm | |
| Window | Double Low-E glass window + Aluminum alloy frame | |
Table 5.
Equipment and technical indices.
| Equipment | Technical Index |
|---|---|
| Pt100 temperature sensor | ±0.15 °C |
| 48-Channel paperless recorder | ±(0.2% FS + 1), Supply voltage 85–240 VAC Ambient temperature: 0–50, Ambient humidity: 0–85% |
| ZDR-20 temperature and humidity automatic recorder | Temperature: −40 °C–100 °C, ±0.2 °C Relative humidity: 0–100%, ±3%RH |
Table 6.
Comparison of appearance properties.
| 1 | 2 | 3 |
|---|---|---|
 |  |  |
| A-1 * Smooth surface | A-2 Smooth but with a few concave points | A-3 Has a few micro cracks |
 |  |  |
| B-1 Smooth surface but with uneven color | C-1 Delicate and uniform color | C-2 Rough surface |
* The numbers of the specimen are their temporary numbers.
Table 7.
Pore structure analyses.
| Mortar Samples | Specific Surface Area (m2/g) | Total Pore Volume (mL/g) | Average Pore Diameter (nm) |
|---|---|---|---|
| A-3 | 7.656 | 0.02187 | 11.43 |
| B-1 | 11.434 | 0.0269 | 9.41 |
| C-1 | 33.331 | 0.1016 | 12.2 |
Table 8.
Distribution of the pore diameter.
| Mortar Samples | Distribution of the Pore Diameter (nm) (%) | |||||||
|---|---|---|---|---|---|---|---|---|
| <6 | 6–8 | 8–10 | 10–12 | 12–16 | 16–20 | 20–50 | >50 | |
| A-3 | 22.81 | 18.65 | 6.70 | 7.35 | 7.97 | 9.27 | 12.07 | 15.18 |
| B-1 | 27.27 | 8.97 | 2.42 | 2.51 | 2.93 | 9.26 | 12.04 | 34.60 |
| C-1 | 15.75 | 13.17 | 5.86 | 6.82 | 10.18 | 13.70 | 16.91 | 17.61 |
Table 9.
Testing of mechanical property.
| Mortar Samples | A-3 | B-1 | C-1 |
|---|---|---|---|
| Flexural strength (MPa) | 4.31 | 4.37 | 5.23 |
| Compressive strength (MPa) | 16.35 | 15.21 | 19.49 |
Table 10.
Non-uniformity coefficient under air-conditioning condition. (Time: 8:30 the next day).
| Room | Parameter | Position | Non-Uniformity Coefficient | ||||
|---|---|---|---|---|---|---|---|
| P2 | P3 | P4 | P5 | P6 | |||
| Room I (CM) | Temperature (°C) | 26.4 | 24.8 | 25.1 | 25.3 | 26.1 | 0.0238 |
| Relative humidity (%) | 48 | 46.8 | 51.1 | 50.4 | 49.6 | 0.0320 | |
| Room II (CHM-WSE) | Temperature (°C) | 25.1 | 24.1 | 24.2 | 25.2 | 24.8 | 0.0184 |
| Relative humidity (%) | 38.9 | 40.7 | 38.7 | 39.4 | 38.1 | 0.0224 | |
Table 11.
Non-uniformity coefficient. (Time: 8:30 the next day)
| Room | Parameter | Position | Non-Uniformity Coefficient | ||||
|---|---|---|---|---|---|---|---|
| P2 | P3 | P4 | P5 | P6 | |||
| Room I (CM) | Temperature (°C) | 13.8 | 14.1 | 16.5 | 14.2 | 14.1 | 0.0681 |
| Relative humidity (%) | 81.8 | 78.8 | 77.6 | 78.1 | 78.3 | 0.0189 | |
| Room II (CHM-WSE) | Temperature (°C) | 16.2 | 16.3 | 17.5 | 16.4 | 16.1 | 0.0309 |
| Relative humidity (%) | 73.3 | 72.3 | 70.2 | 72.3 | 73.2 | 0.0154 | |
Table 12.
Results of the MBVpractical.
| Room | Interior Wall Material | Dry Density (kg/m3) | MBVpractical (g/(m2%RH)@8/16h) | |
|---|---|---|---|---|
| Winter | Late Spring | |||
| Room I | CM | 20332 | 0.2 | 0.55 |
| Room II | CHM-WSE | 654 | 0.85 | 0.89 |
Table 13.
Properties of the wall components.
| Material | Thermal Conductivity (W/(m∙k)) | Thermal Storage Coefficient (W/(m2∙k)) | Density (kg/m3) | Specific Heat (kJ/(kg∙k)) | Thermal Inertia Index (D) | Water Vapor Permeability (kg/(m∙Pa∙s)) |
|---|---|---|---|---|---|---|
| CM | 0.930 | 11.30 | 1800 | 1.05 | 0.24 | 5.467 × 10⁻¹¹ |
| Porous brick | 0.580 | 7.87 | 1400 | 1.05 | 3.28 | 2.6 × 10⁻¹¹ |
| CHM-WSE | 0.115 | 2.45 | 654 | 1.05 | 0.80 | 5.08 × 10⁻¹¹ |
Table 14.
Schedule of residential building air conditioning in summer and winter.
| Season | Typical City | Operating Date | Time (Weekend) | Time (Weekday) |
|---|---|---|---|---|
| Winter | Guangzhou | 1.1–2.28 | 0:00–24:00 | 18:00–8:00 |
| Changsha, Wuhan, Nanjing | 12.1–2.28 | 0:00–24:00 | 18:00–8:00 | |
| Xi’an | 11.15–3.15 | 0:00–24:00 | 00:00–24:00 | |
| Summer | Guangzhou | 6.1–9.30 | 0:00–24:00 | 18:00–8:00 |
| Changsha, Wuhan, Nanjing | 7.1–9.30 | 0:00–24:00 | 18:00–8:00 | |
| Xi’an | 7.1–8.31 | 0:00–24:00 | 18:00–8:00 |
Table 15.
Hygroscopicity performance and energy saving rate of CM and CHM-WSE.
| Typical City | Heating Season | Cooling Season | ||||||
|---|---|---|---|---|---|---|---|---|
| Relative Humidity (%) | Sensible Heating Load | Relative Humidity (%) | Sensible Cooling Load | Latent Cooling Load | Total Cooling Load | |||
| CM | CHM-WSE | Energy Saving Rate * (%) | CM | CHM-WSE | Energ Saving Rate (%) | Energy Saving Rate (%) | Energy Saving Rate (%) | |
| Changsha | 50–70 | 45–65 | 20.6 | 40–90 | 50–70 | 24.0 | 12.3 | 20.5 |
| Wuhan | 40–72 | 40–65 | 18.4 | 40–97 | 50–60 | 24.8 | 12.4 | 20.9 |
| Nanjing | 35–72 | 35–60 | 19.4 | 45–95 | 55–60 | 24.4 | 11.1 | 20.5 |
| Xi’an | 25–68 | 30–55 | 17.2 | 40–90 | 50–70 | 21.8 | 15.7 | 20.1 |
| Guangzhou | 60–95 | 50–85 | 12.4 | 45–98 | 55–85 | 24.2 | 10.5 | 19.8 |
* Energy saving rate in % is calculated using the value of CM as the reference.
© 2018 by the authors. Licensee MDPI, Basel, Switzerland. This article is an open access article distributed under the terms and conditions of the Creative Commons Attribution (CC BY) license (http://creativecommons.org/licenses/by/4.0/).
Share and Cite
MDPI and ACS Style
Xie, H.; Gong, G.; Wu, Y.; Liu, Y.; Wang, Y. Research on the Hygroscopicity of a Composite Hygroscopic Material and its Influence on Indoor Thermal and Humidity Environment. Appl. Sci. 2018, 8, 430. https://doi.org/10.3390/app8030430
AMA Style
Xie H, Gong G, Wu Y, Liu Y, Wang Y. Research on the Hygroscopicity of a Composite Hygroscopic Material and its Influence on Indoor Thermal and Humidity Environment. Applied Sciences. 2018; 8(3):430. https://doi.org/10.3390/app8030430
Chicago/Turabian StyleXie, Huahui, Guangcai Gong, Yi Wu, Yongchao Liu, and Yingjuan Wang. 2018. "Research on the Hygroscopicity of a Composite Hygroscopic Material and its Influence on Indoor Thermal and Humidity Environment" Applied Sciences 8, no. 3: 430. https://doi.org/10.3390/app8030430
Note that from the first issue of 2016, this journal uses article numbers instead of page numbers. See further details here.