
Detection of Operator Fatigue in the Main Control Room of a Nuclear Power Plant Based on Eye Blink Rate, PERCLOS and Mouse Velocity

1
Institute of Human Factors, University of South China, Hengyang 421001, China
2
School of Computer Science, University of South China, Hengyang 421001, China
3
School of Nuclear Science and Technology, University of South China, Hengyang 421001, China
*
Author to whom correspondence should be addressed.
Appl. Sci. 2023, 13(4), 2718; https://doi.org/10.3390/app13042718
Submission received: 12 January 2023
/
Revised: 10 February 2023
/
Accepted: 13 February 2023
/
Published: 20 February 2023
Abstract
:Fatigue affects operators’ safe operation in a nuclear power plant’s (NPP) main control room (MCR). An accurate and rapid detection of operators’ fatigue status is significant to safe operation. The purpose of the study is to explore a way to detect operator fatigue using trends in eyes’ blink rate, number of frames closed in a specified time (PERCLOS) and mouse velocity changes of operators. In experimental tasks of simulating operations, the clustering method of Toeplitz Inverse Covariance-Based Clustering (TICC) is used for the relevant data captured by non-invasive techniques to determine fatigue levels. Based on the determined results, the data samples are given labeled fatigue levels. Then, the data of fatigue samples with different levels are identified using supervised learning techniques. Supervised learning is used to classify different fatigue levels of operators. According to the supervised learning algorithm in different time windows (20 s–60 s), different time steps (10 s–50 s) and different feature sets (eye, mouse, eye-plus-mouse) classification performance show that K-Nearest Neighbor (KNN) perform the best in the combination of the above multiple indexes. It has an accuracy rate of 91.83%. The proposed technique can detect operators’ fatigue level in real time within 10 s.
1. Introduction
Fatigue is an important factor affecting the safe operation of nuclear power plants [1]. A large number of accidents at nuclear power plants around the world are caused by human error [2] and fatigue is one of the main factors leading to human errors [3]. Not only can fatigue reduce a person’s performance, it can also affect health. The main control room of a nuclear power plant has gradually changed from traditional simulated control to digital control, while the operator’s task in the control room of the nuclear power plant has gradually shifted to monitoring tasks [4,5]. The main task of the operator in the main control room of a nuclear power plant is to monitor and analysis graphs, data and relevant parameters on multiple monitors over long periods of time. Their continuous attention and monotonous vigilance task lead to high mental load. Operators are easily fatigued by high mental workloads [6]. For the purposes of this article, fatigue refers to mental fatigue.
So far, methods of monitoring operator fatigue-related include task performance, subjective evaluation and physiological indicators [7,8,9]. The physiological indicators are objective data reflecting the fatigue state of an operator. Physiological indicators to detect fatigue include invasive and non-invasive detection. Invasive detection of fatigue is based on physiological signals stimulated by hormone levels, such as electroencephalogram (EEG), electrooculogram (EOG) and electrocardiogram (ECG). Our work is to combine blink rate (BR), number of frames closed in a specified time (PERCLOS) [10], average mouse velocity (AMV) and average value of mouse velocity (AOV) features in a non-invasive detection way to avoid interfering with the operator’s normal work. On the one hand, these four indicators can be acquired in a non-invasive way. This approach avoids interfering with the operator’s normal work; on the other hand, the combination of using the camera to capture changes in the eye, and to augment it with changes in the velocity of the mouse, and then combining these two types of feature sets, shows a significant improvement in fatigue recognition compared to using a single eye feature.
Blink rate and PERCLOS features are used to analyze and detect fatigue in automobile driving [11], aircraft driving [12] and human–computer interaction [13]. Eye aspect ratio (EAR) has been successfully used in operator fatigue detection in automated control systems [14,15]. First, the EAR values are obtained to generate the features associated with the eyes. Then, these features are used for supervised learning [11]. Using convolutional neural network, after a large number of eye opening and closing pictures are trained, a model for detecting eye opening and closing is obtained. Then, fatigue is determined according to predetermined rules and algorithms [16]. At present, when using eye-related features for non-invasive detection, the methods to obtain the eyelid closure state are roughly the two mentioned above. One is to calculate the eye-width ratio using facial landmark and determine the eye opening and closing by a predetermined threshold. The other uses a trained neural network to judge the opening and closing of the eyes directly from images. Then, the features are extracted again based on the opening and closing state of the eyes, such as blink rate or PERCLOS. Finally, the fatigue detection is implemented using the recognition fatigue algorithm, or blink rate and PERCLOS threshold size are used to determine fatigue according to predetermined rules. The above two single feature set methods are affected by facial images, lighting, motion blur or head deflection during the task.
Mental fatigue is a complex and individualized phenomenon that affects psychological, physiological and behavioral aspects [17]. Determining fatigue using a single indicator is unreliable. Few studies have been conducted to detect the fatigue status of operators in the main control room of a nuclear power plant based on the fusion of multiple indicators by machine learning [18]. In [19], mouse, facial features and eye gaze are used to recognize attention. EEG, ECG and EOG were selected for fatigue detection in [20]. It is fully proved that the fatigue detection performance of more features is better than that of fewer features. The dynamically changing features of the mouse are also currently used for the detection of physiological states associated with people, such as stress [21,22], mood [23,24], attention [19,25] or fatigue [26]. Changes in mouse velocity and distance are used to detect worker fatigue during human–computer interaction. This method has been shown to be able to quantify the fatigue state of workers for a long time without any interference in work [26]. At present, the dynamic features of mouse are mainly used for the detection of physiological states such as emotion and attention, and there are few studies on fatigue. Our goal is to achieve real-time and high-precision non-invasive fatigue status detection.
The research in this paper is focused on machine learning. In [27], it is summarized that the models used for the implementation of fatigue detection techniques include mathematical model-based, rule-based and machine-learning-based implementation methods. The current detection method used for main control operators in nuclear power plants is mainly through statistical analysis [7,8,9]. In [28] a machine learning clustering approach is used to evaluate operator fitness for duty based on operator fatigue status, but it cannot be used to detect fatigue in real time. Deep learning of complex models requires a lot of time for recognition. Traditional machine learning has low equipment requirements and is capable of achieving fast fatigue status recognition. We need to detect the level of operator fatigue in real time. We choose support vector machines (SVM), K-Nearest Neighbors (KNN) and random forests (RF) as machine learning algorithms to identify fatigue [13,29]. The use of machine learning for fatigue detection has become very widespread. The data used for training and testing in the existing studies are eye-related and mouse-related features.
Before supervised learning, it is necessary to segment the sample data and determine the fatigue level and labeled data. These sample data with fatigue level labels are used for training and evaluation algorithms [30]. The methods of data labelling can be broadly classified as follows, using subjective assessment methods [10,31], time-on-task phases [32] and trends in physiological changes [33]. The data labeling method of a single indicator is always unconvincing. Subjective evaluation depends on the ideas of the evaluators themselves. The time-on-task phases can easily confuse samples between two neighboring time-on-task phases and the trend of physiological changes cannot truly reflect the differences between different users. In 2017, Toeplitz Inverse Covariance-Based Clustering (TICC) was proposed [34]. The TICC clustering method cannot only find repeated patterns in the dataset, but also explain the clustering results. TICC was successfully used to cluster fatigue sensitive indicators in [30]. These fatigue-sensitive indexes include eye index, task performance index and subjective rating index. In nuclear power plants and many other human–computer interaction tasks, they use features such as blink rate or PERCLOS to detect and analyze fatigue. Blink rate and PERCLOS were shown to reflect the level of operator fatigue [9,35,36]. In [37,38], there is a negative correlation between mouse velocity change and operator fatigue. Previous studies have labeled fatigue levels into two categories: fatigue and non-fatigue. Fatigue is a process with complex physiological and psychological changes and accumulation. Fatigue occurs when cognitive load accumulates to a certain level [9,39,40,41]. Multi-level fatigue labeling helps improve our understanding of operator fatigue, providing a basis for developing techniques to prevent operators’ fatigue operation in an MCR.
In order to study the real time fatigue detection, an appropriate time window means a lot. We label data first and then start supervised learning. A suitable sliding window yields better results for our supervised learning to extract features. In [17] different feature extraction windows were tried. In our study different performance was achieved by comparing different feature windows and the overlap rate of the windows.
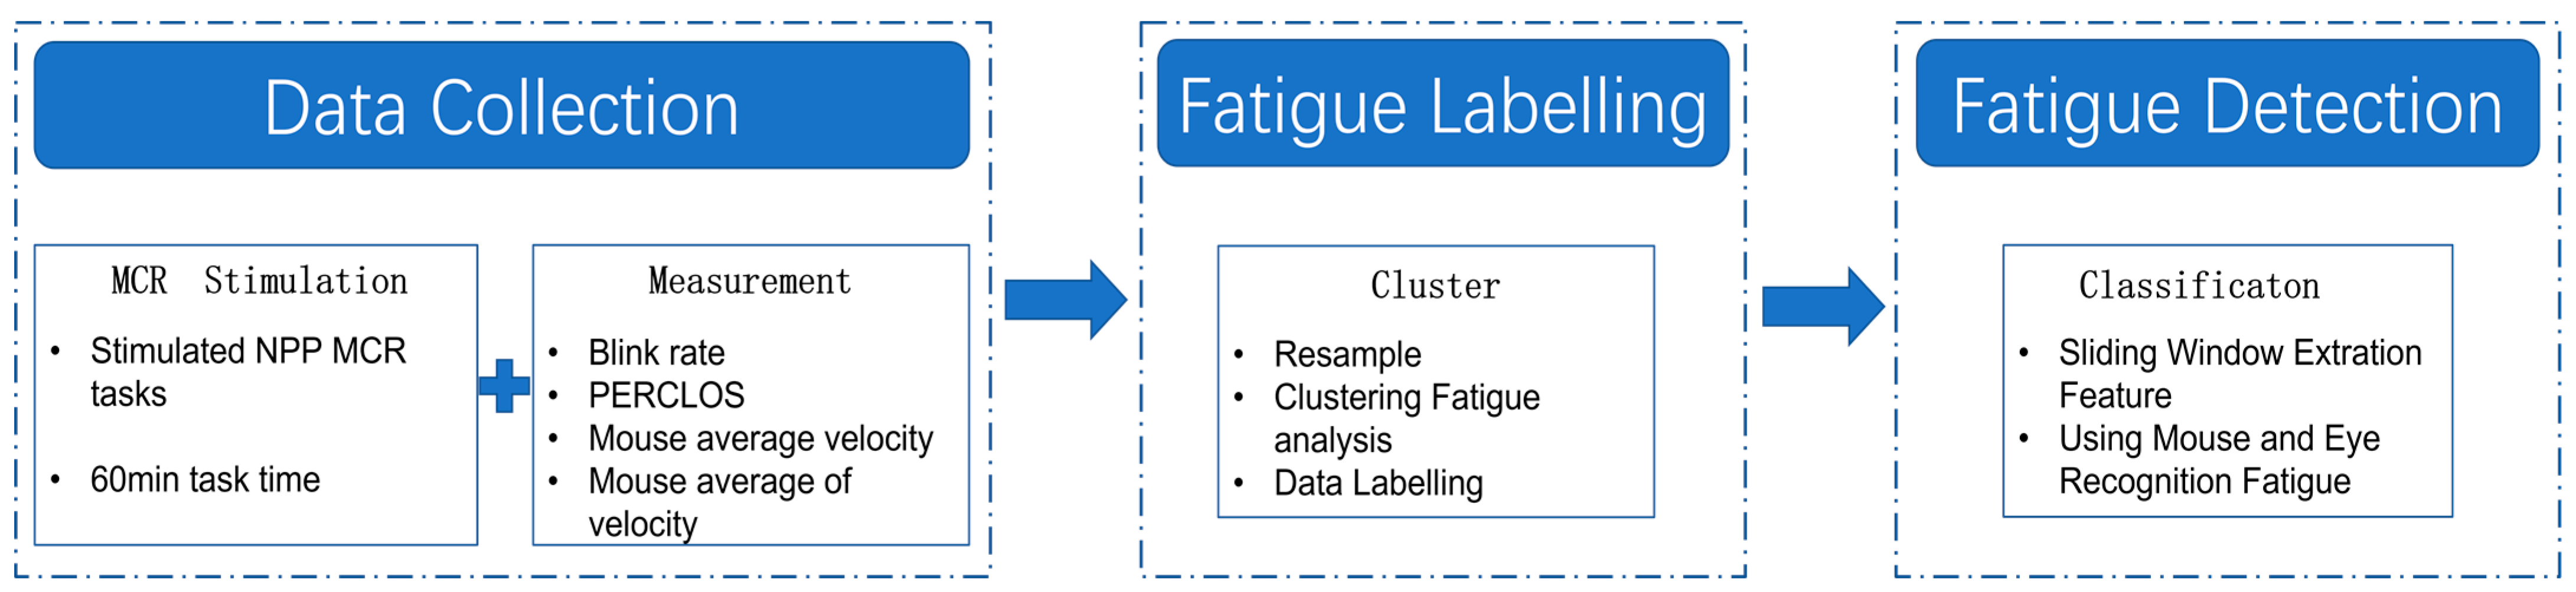
The structure of our paper is composed of five main sections, and the remaining sections are organized as follows. Section 2 presents the methodology and identification framework. Section 2 describes the simulation experiments and data collection. Section 3 presents the results. Section 4 provides the discussion and conclusion. The framework of our study is shown in Figure 1.
2. Materials and Methods
2.1. Fatigue Detection Framework and Methods
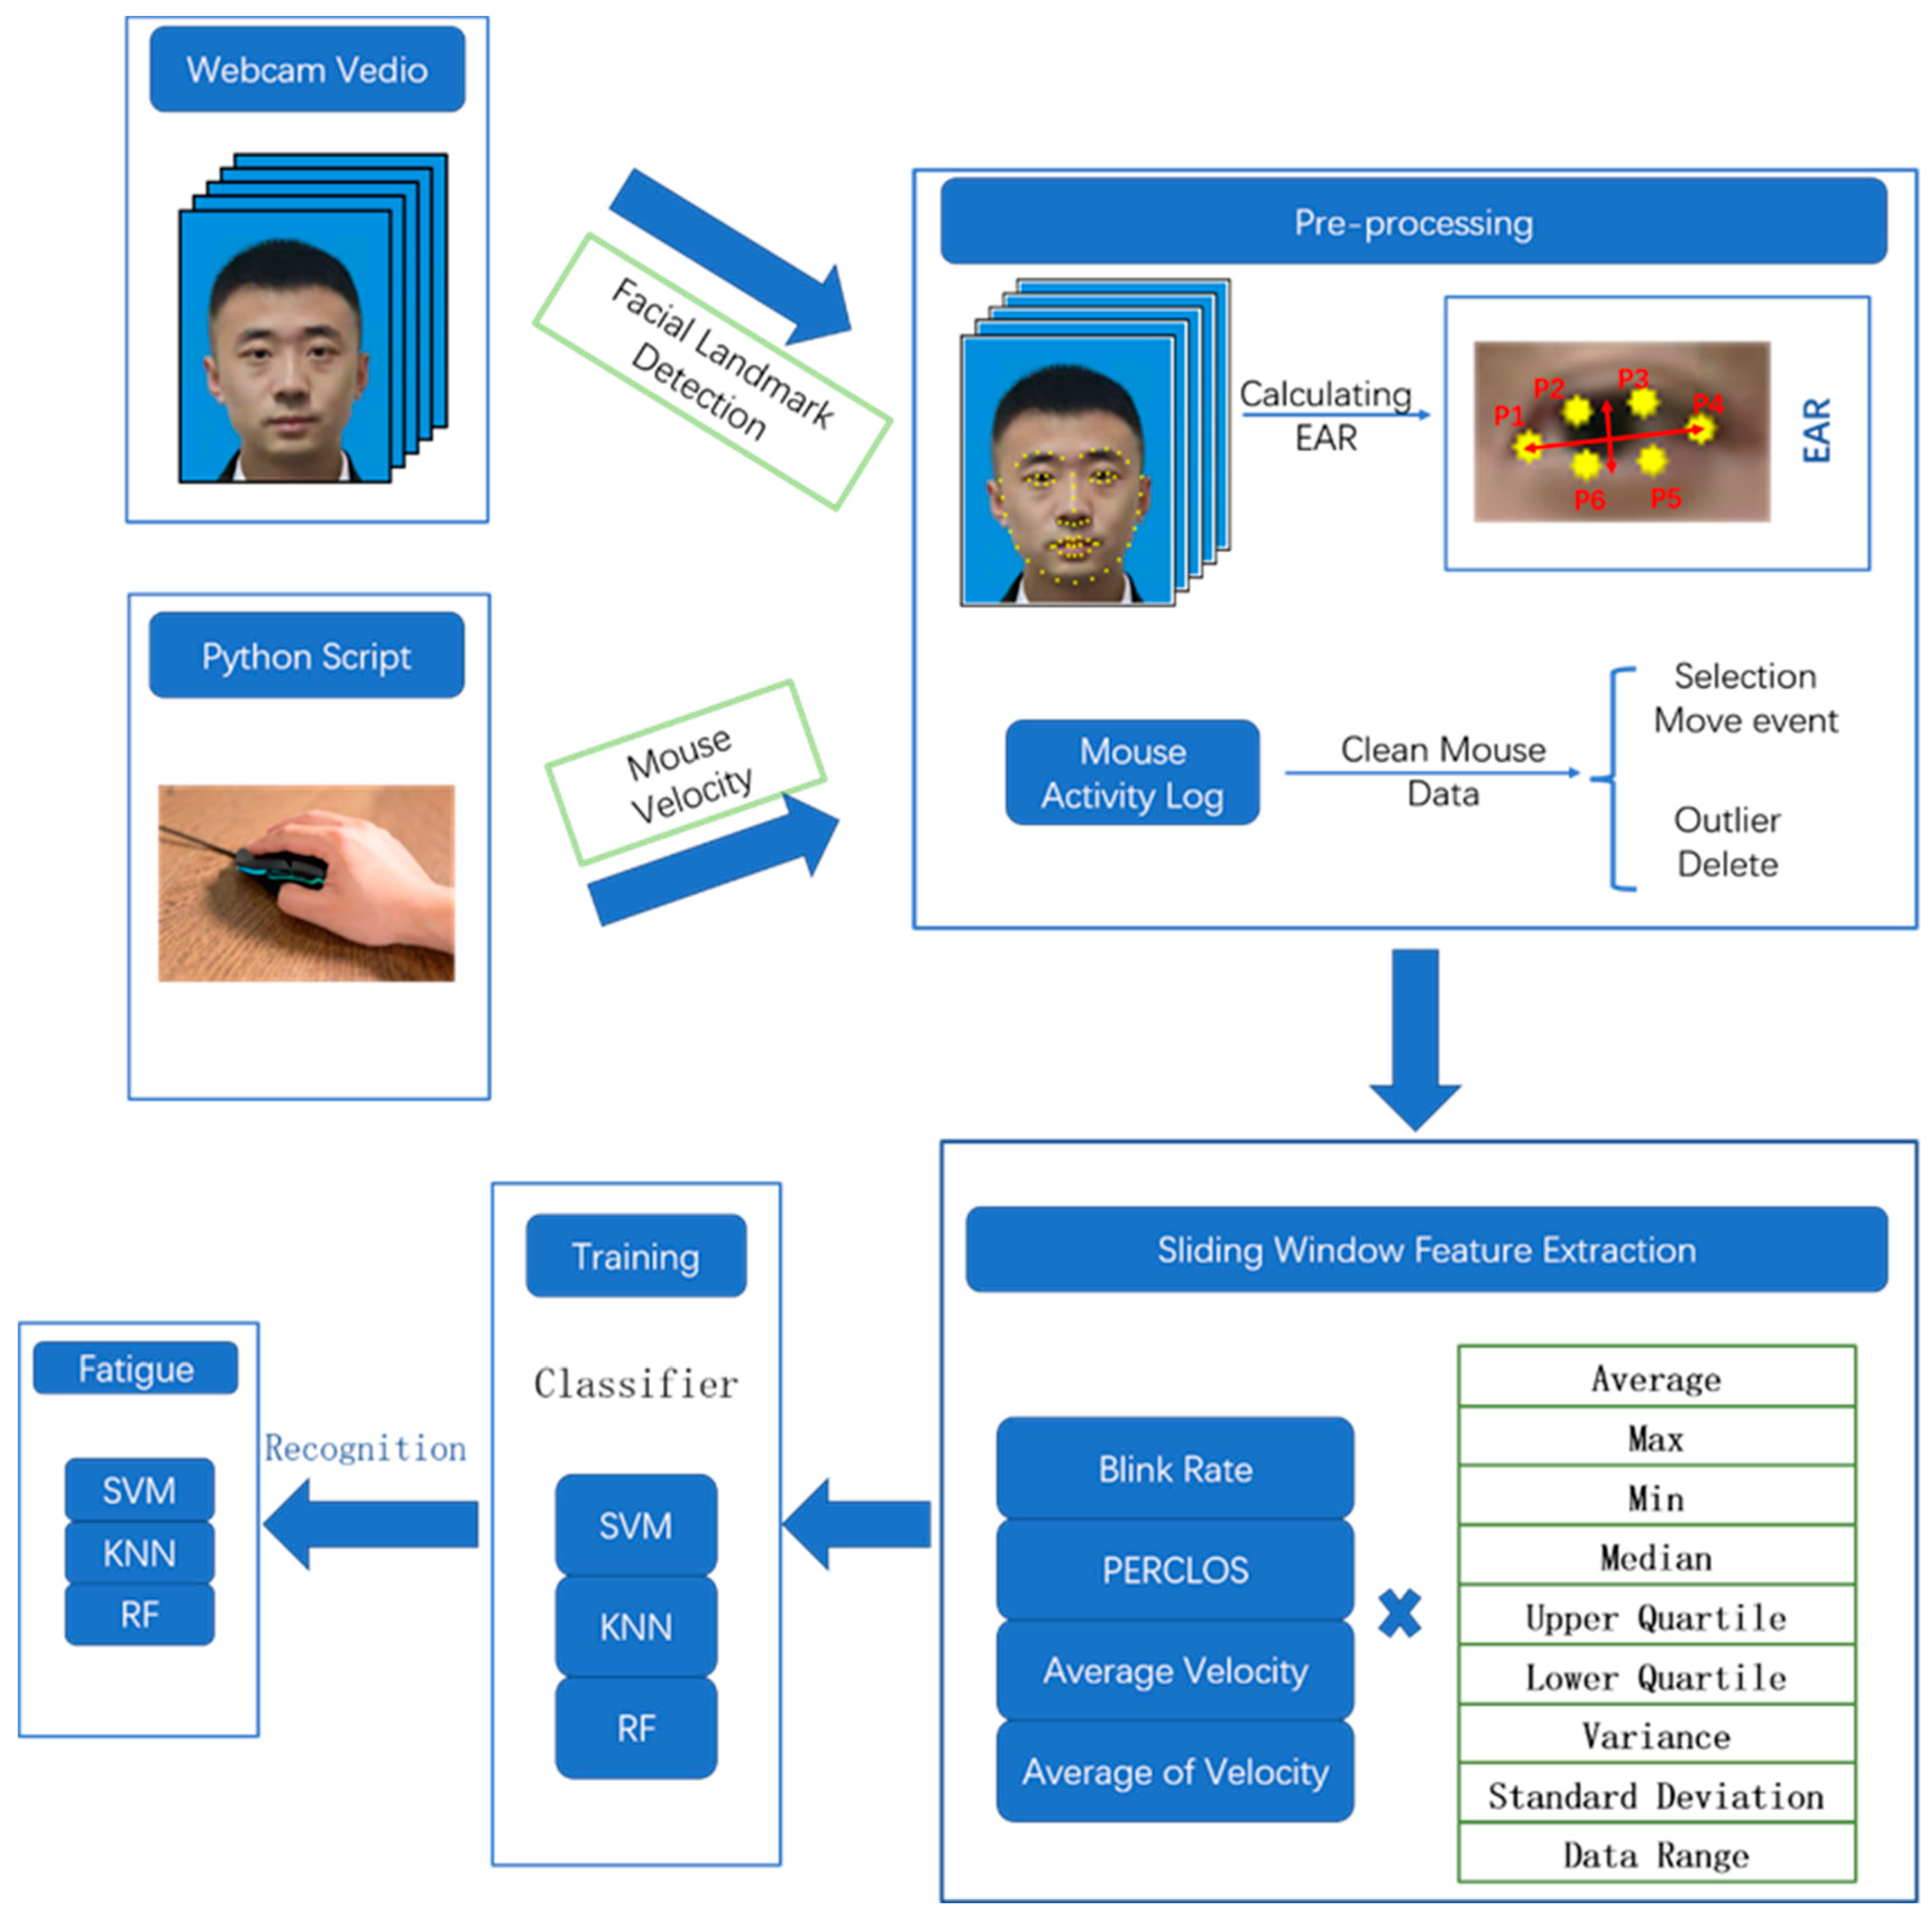
We combine blink rate, PERCLOS and mouse velocity to detect the fatigue status of the operators. We use two ways to gather data. A webcam is on the top of the computer screen to capture eye characteristics and a hidden program is installed to capture mouse movements. In the following, we will elaborate two mechanisms of input feature extraction. The overall input-output process of fatigue recognition is shown in Figure 2.
2.1.1. Blink Rate and PERCLOS
In Figure 2, after the camera captures the video frame, we use the Dlib library to detect face feature points. Dlib libraries are widely used in academia and industry [41]. This error is allowed to be ignored, and within the features of the eye, after data pre-processing and data resampling, those missing frames can hardly affect our experiments. In our research, since the blinking of the two eyes is simultaneous, we choose the right eye as our research object to reduce the amount of calculation. The camera has a sampling rate of 30 frames per second. We take the coordinates of the six points P1, P2, P3, P4, P5 and P6 of the eye image in the pre-processing stage, as in Figure 2, to find the corresponding EAR values. EAR is calculated by Equation (1) [15].
We calculate the EAR of each frame from the video at 30 frames per second. After resampling, we divide the whole process of data collection into equal time segments. We extract blink rate and PERCLOS in each segment again through EAR value. According to the description of blinking in [15], blink rate is represented by the number of times the EAR value is below 0.25 for more than three consecutive frames in each segment. According to [11], we measure the proportion of time when the EAR of each segment is lower than a certain value. Table 1 shows the formulae for blink rate and PERCCLOS.
2.1.2. Mouse Velocity Feature
In previous studies, mouse speed has been shown to be a non-invasive indicator of fatigue detection [37,38]. Fatigue increases while mouse movement velocity decreases. In the studies of [19,25], mouse and face features were combined for the detection of attention. Referring to this physiological state detection, we chose to combine the features of blink rate, PERCLOS and mouse velocity for the detection of fatigue. We correspond the extracted mouse velocity features to each segment of the eye-related features (time range after resampling).
As the fatigue recognition process depicted in Figure 2, after the Python script obtains the mouse log, we preprocessed the mouse log. We filter out the data related to mouse movement. The event logs triggered by mouse clicks and scrolls as well as outliers are removed. After preprocessing, the average mouse velocity (AMV) and the average value of the mouse velocity (AOV) during the sampling time are calculated.
Mouse velocity (AMV and AOV): We assume that any two consecutive points A and B during mouse movement, the coordinates of the two points are and (). The timestamps of the two points occurring separately and . The distance between the two points is:
The time duration of the two points is:
Finally, the average mouse velocity and the average value of mouse velocity are calculated separately during this time. The specific calculation formula and description are shown in Table 2.
2.1.3. TICC Clustering and Data Labelling
We use the TICC clustering method to determine the fatigue level and complete the data labelling by taking the six features of KSS score, SSS score, BR, PERCLOS, AMV and AOV as inputs. The indicators are shown in Table 3. The change trend of these multi-feature time series reflects the fatigue level of operators at different levels.
According to the method used for TICC in [30], we up-sampled the subjective scores separately, keeping the scores consistent for the same Time-On-Monitoring (TOM) task segment. Because the camera captures frame-level eye data, as well as the mouse coordinates captured by the Python script, the scale of change is less than 1 s. We chose 1 Hz as our resampling frequency. In order to ensure that the sampling frequency of features is consistent, we down-sampled the eye and mouse data, respectively, to obtain the blink rate per second, PERCLOS per second, average mouse velocity per second and the average value of mouse velocity per second. The above features are standardized. After preprocessing, a 6 × T × 1 multivariate time series is finally obtained.
TICC finds repetitive patterns from the multivariate time series in the above and describes each sample according to the corresponding fatigue status. For using TICC, we set the window value to 1 (1 sample). The penalty factor β is chosen from the range of 100 to 400 intervals and the regularization parameter λ is chosen from the range of 0.01 to 0.5.
2.1.4. Supervised Learning and Fatigue Recognition
For references [19,25,26], mouse features were used to detect fatigue or other physiological fields. Mouse features were extracted for supervised learning. We selected blink rate, PERCLOS and mouse velocity feature as indicators for our automated detection of fatigue.
Ref. [20] showed that physiological signals exhibited different performance in different feature extraction windows. In this study, we use a feature extraction window ranged from 20 s to 60 s and the range of using different sliding steps is from 10 s to 50 s. The data used for supervised learning is composed of the eye and mouse features mentioned above. Their sampling frequency is 0.1 HZ. Among them, we have compared three feature sets, namely eye feature set, mouse feature set and eye-plus-mouse feature set. In the three classification algorithms, 60 s feature extraction window and 10 s sliding step size have proved the best performance.
In our study, we resampled the features and used a sliding window to extract features from the resampled data. The features extracted using the feature window include mean, maximum, minimum, median, upper quartile, lower quartile, variance, standard deviation and data range. A total of 36 features were extracted. Data samples related to fatigue states were generated by feature extraction. Our studies were all implemented using Python code.
2.2. Simulation Experiments and Data Collection
2.2.1. Subjects
In order to ensure the acquisition of experimental data smoothly, we recruited 6 graduate students to do experiments on a nuclear power plant control room simulator. Students were between 25–27. The six graduate students we recruited were members of the Human Factors Institute. All experimenters were trained twice and independently completed at least eight experiments on the DCS simulator, with each experiment and training lasting more than one hour.
2.2.2. Simulator as Testbed
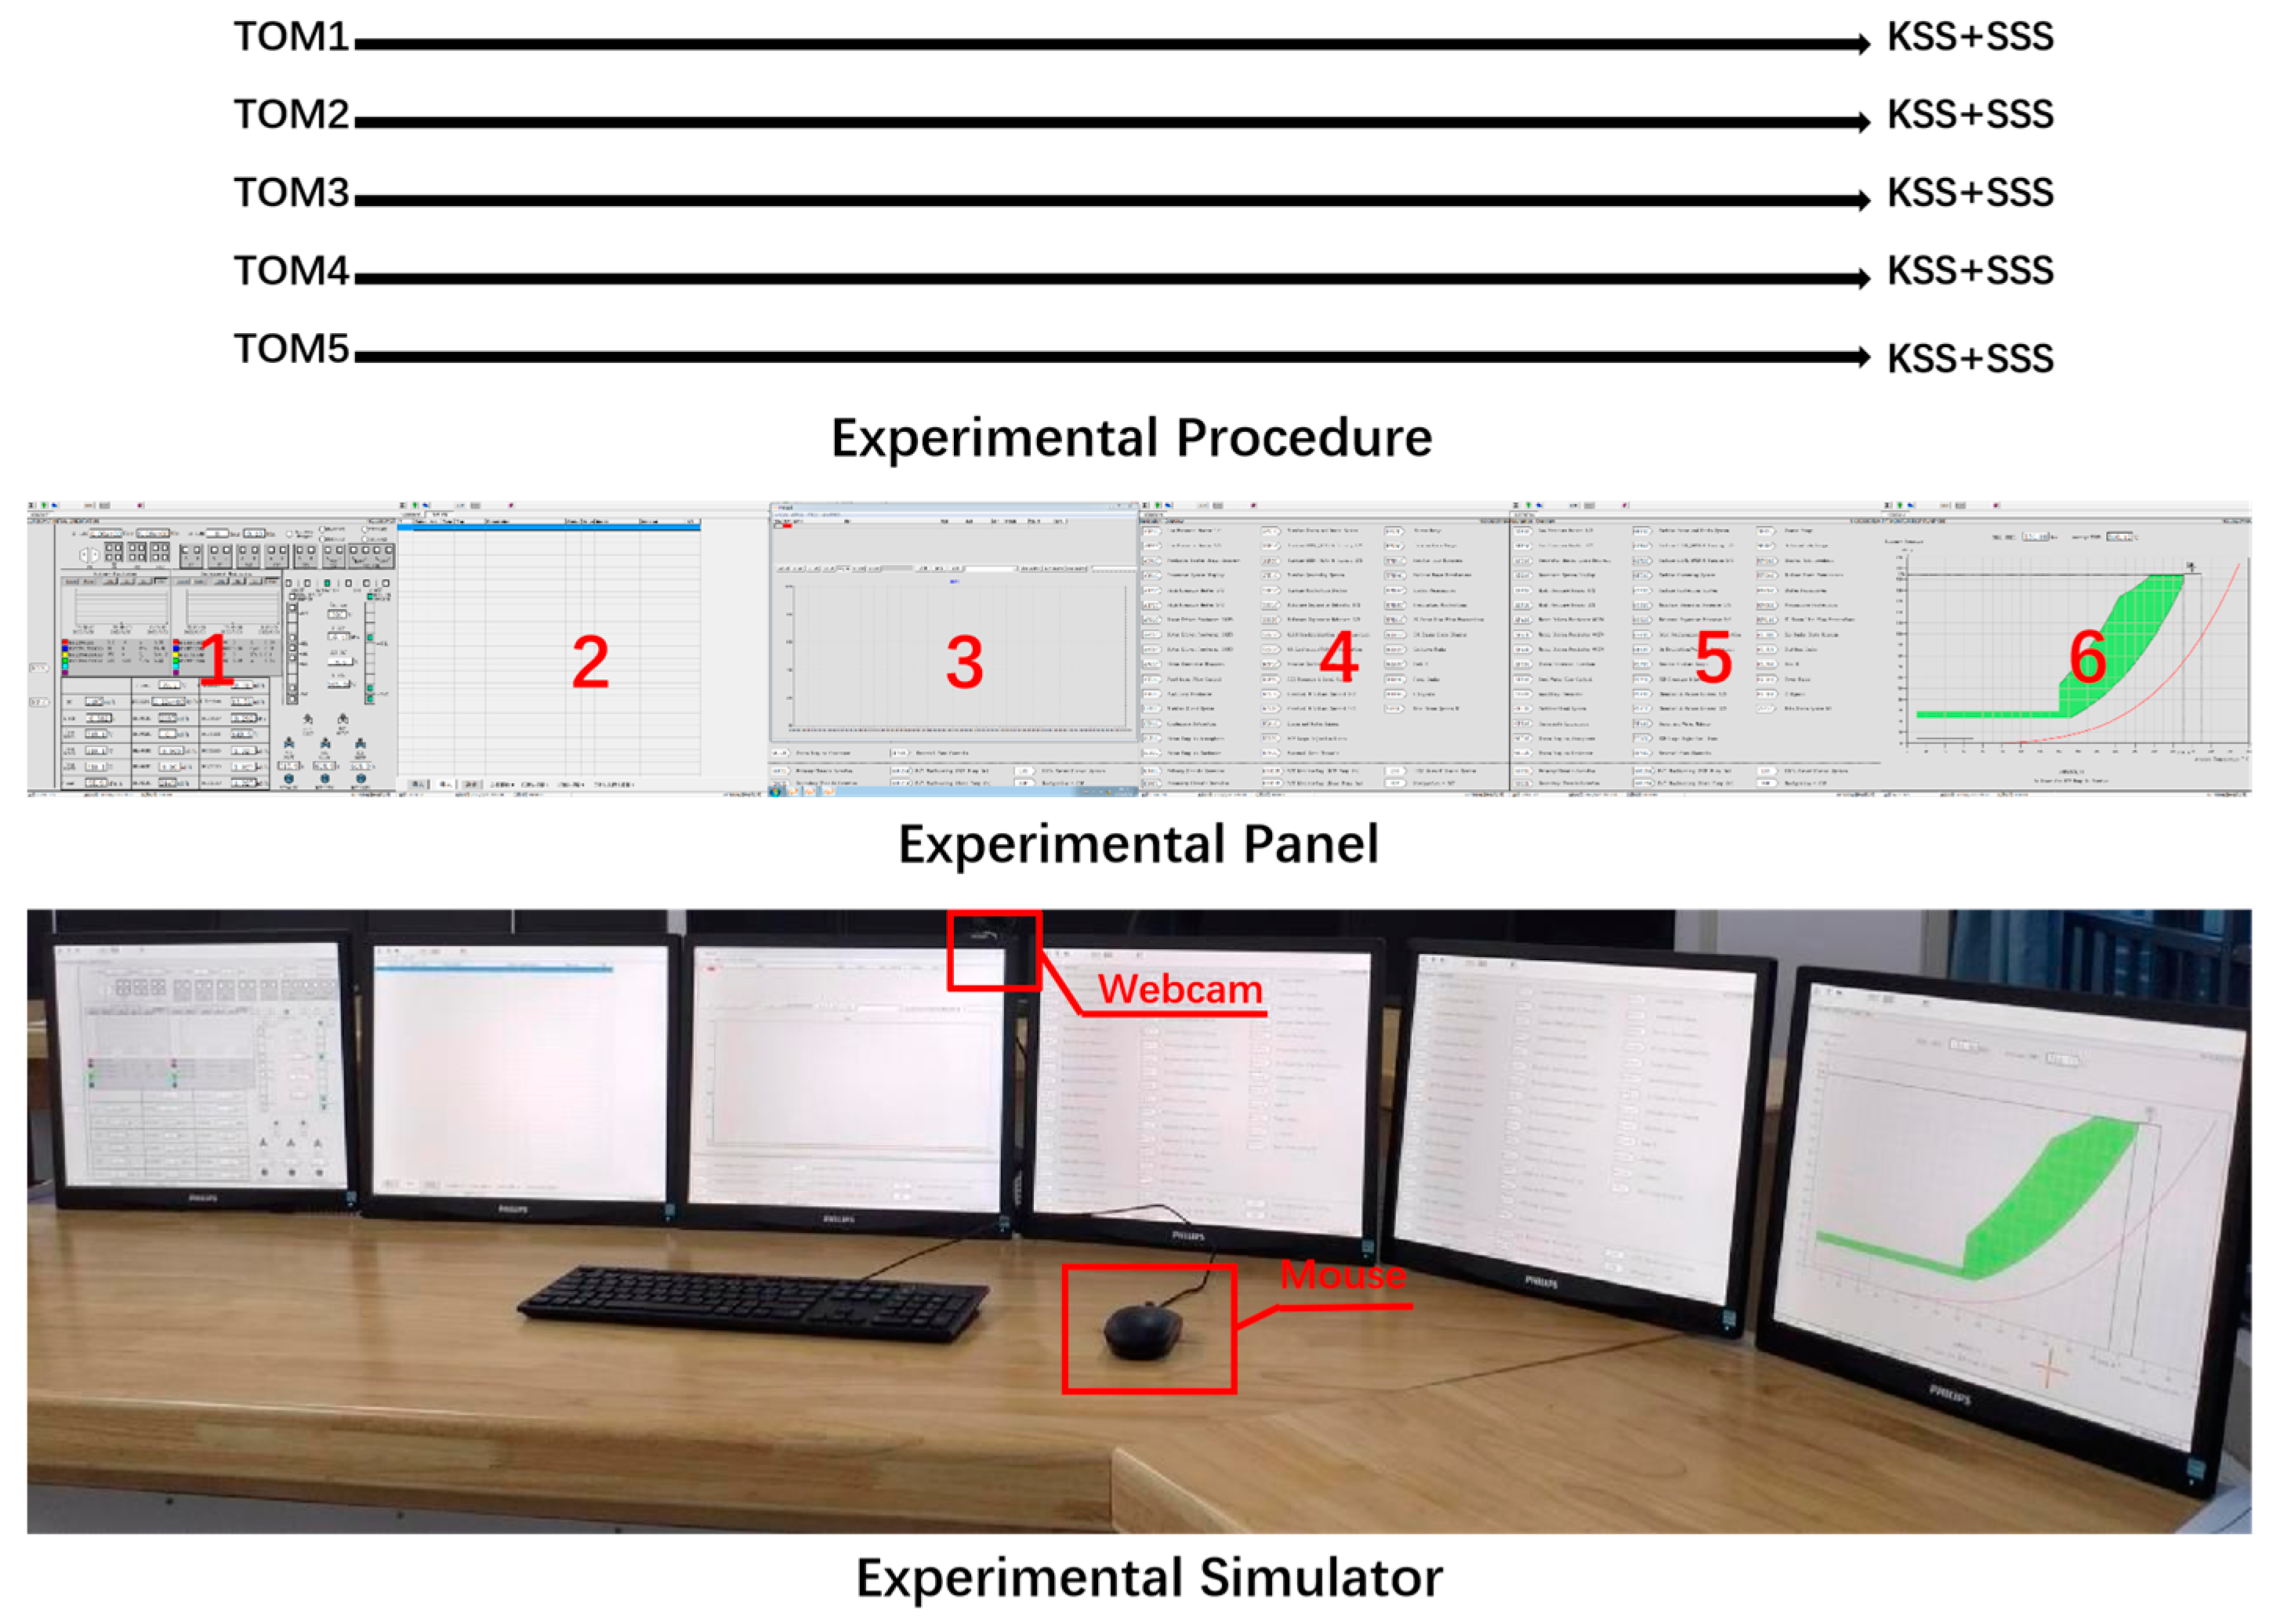
The experiments were conducted on the simulator as shown in Figure 3. The simulator could simulate normal start up and shut down and various accident scenario of a NPP reactor. The simulator consists of six displays with a resolution of 1280 × 1024 pixels with a mouse and keyboard. Displays 1–3 are general status of the plant, displays 4–5 are for system controls and display 6 is Pressure-Temperature (P-T) figure. The camera is a Hikvision E14a webcam that captures video of faces at a rate of 30 frames per second. The mouse data are gathered by a Python script built into the system.
2.2.3. Experimental Tasks and Procedures
Our experimental task is to reduce the temperature and pressure of the primary circuit in a Small-Break Loss-of-Coolant Accident (SLOCA). The experiment process is to reduce the temperature and pressure to the requirements of the procedures by observing various parameters on the simulator. The operator needs to find the specified component or valve with the mouse. Then, the operator performs the relevant operations.
All participants need to complete a TOM experiment procedure as shown in Figure 3. TOM is a very effective experimental design paradigm in inducing fatigue [30,42]. The duration of the whole experiment is slightly longer than 60 min. We need to take 60 min of eye and mouse data. We divide the whole experiment process into five stages. The duration of each TOM phase is 12 min. When each TOM task phase ends, the Python script running in the background will automatically trigger an event to pop up a reminder box. Operators are asked to fill in the SSS and KSS scales according to their actual status. The filling time is very short and can be ignored, which will not affect the normal test task.
2.2.4. Data Acquisition
After capturing the face data using the webcam, the timestamp of each frame is recorded and the EAR of the eyes in each frame is calculated using the Dlib library. A scripting program in Python was run to record the mouse trigger events as well as the coordinate points. Then, feature extraction is performed according to different resampling times.
3. Results
3.1. TICC Clustering Results
We had 6 subjects to do the experiments. In 6 experiments, 21,600 data samples were used for TICC clustering. The selection window size was 1, the regularization parameter λ was 0.02 and penalty factor β was 110. The final results of clustering after data standardization are shown in Table 4. In fact, we classify fatigue states into three levels.
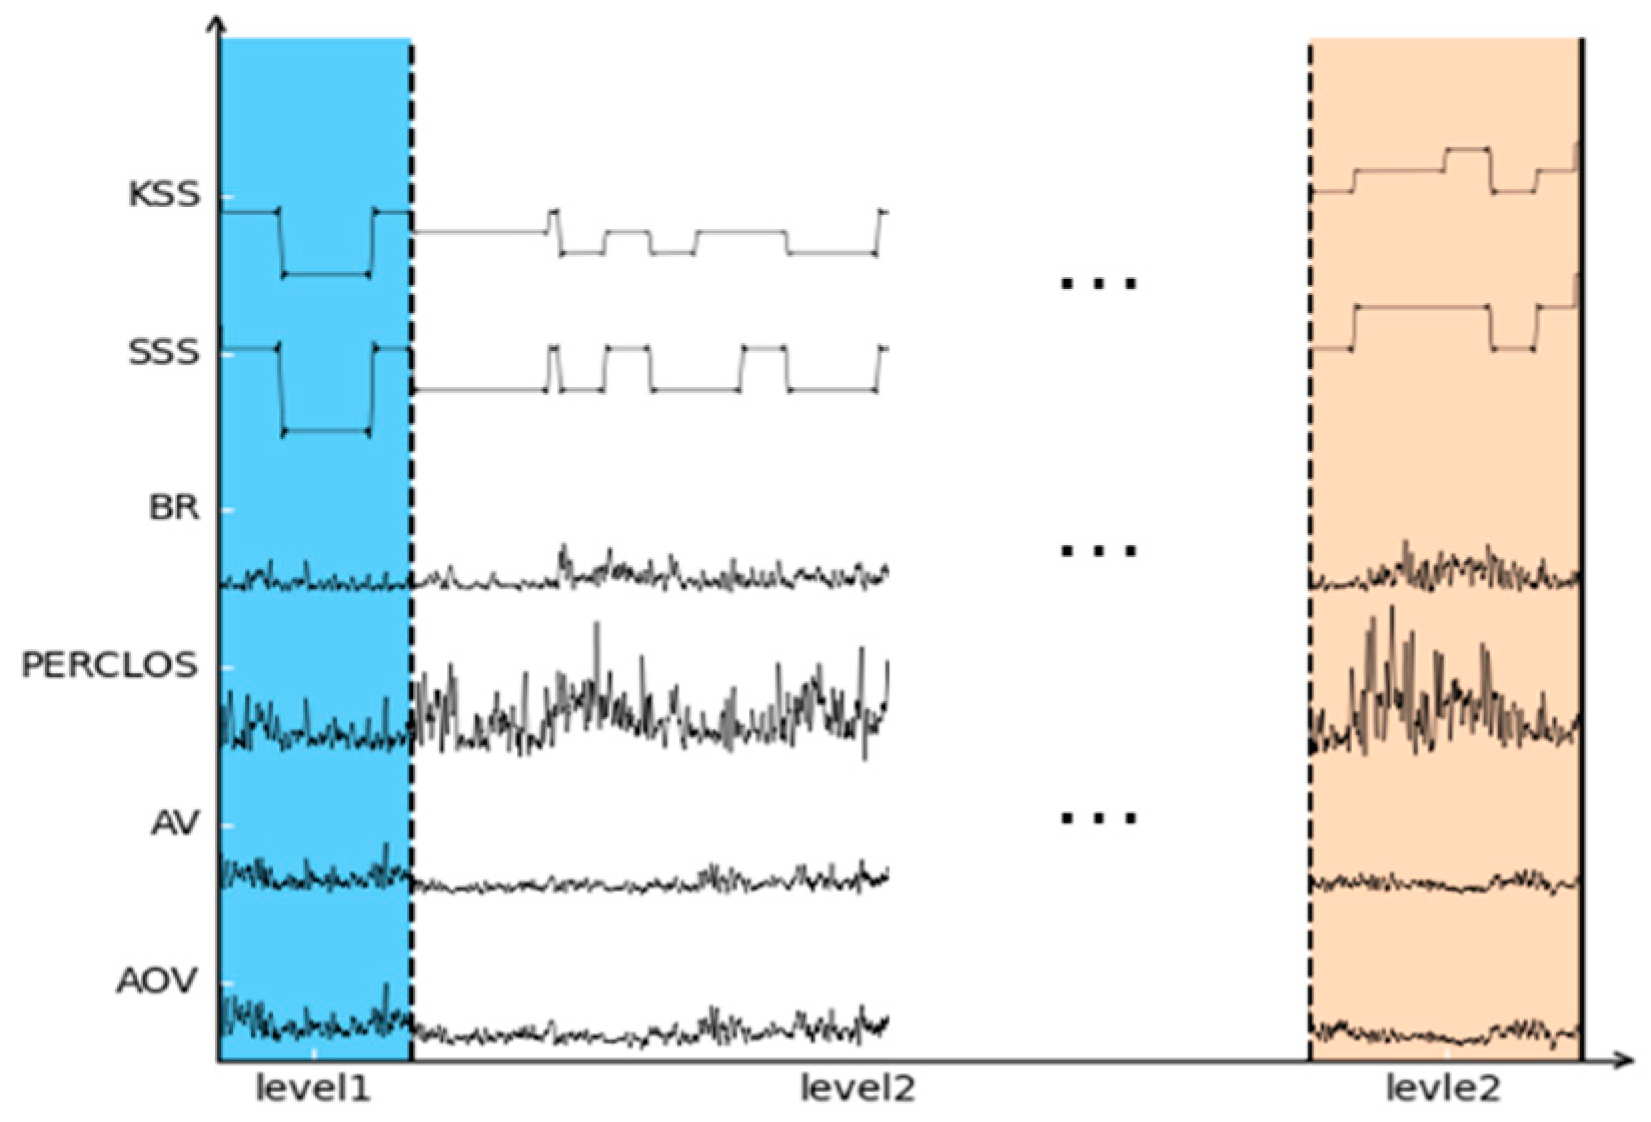
In order to describe the mental fatigue state of three-level operators obtained based on TICC clustering analysis, we used the average value of each cluster point to reflect the various effects of the operator at each fatigue state, such as subjective feelings, BR, PERCLOS and AMV during sampling time, and AOV during sampling time. As shown in the clustering results in Table 4, we can see that each feature is monotonic changes, but there were some differences between the mean change trends and fatigue levels, fully reflecting the characteristics of the different levels of fatigue. Among the three fatigue levels after clustering, BR, PERCLOS and subjective feeling were positively correlated with fatigue level. The velocity variation of mouse features is negatively correlated with the subjective score and fatigue levels. In fatigue level 1, operators have less eye closure, and the AMV and AOV of the operator is the highest. From fatigue level 1 to fatigue level 2, the subjective rating change is very small. From fatigue level 2 to fatigue level 3, subjective scores increase sharply, higher fatigue will significantly affect the subjective fatigue value of the operator, BR increases to a maximum, and the speed of the mouse becomes the slowest. Figure 4 shows the visualization results after clustering.
3.2. Supervised Learning Classification Results
To demonstrate the feasibility of mouse and eye features for fatigue detection, we constructed three feature sets for different combinations of mouse and eye.
The results show that the performance of multiple features is better than that of single features. The following are the results obtained from the cross-validation method 5-Fold cross-validation used.
Feature set 1: only eye-based features (18 features), the feature set includes BR and PERCLOS of each segment.
Feature set 2: only mouse’s velocity-based features (18 features).
Feature set 3: only eye-based and mouse’s velocity-based features (36 features).
In order to obtain an appropriate time window to extract features, we evaluated the performance of fatigue detection at different time windows and different time durations, respectively.
Table 5 and Table 6 show the results of the runs in the 20 s–60 s sliding window and the 10 s–50 s sliding step. The range of sliding window and sliding step size is consistent in all experiments. The following will not be repeated. We can conclude that feature set 1 is under the condition of 60 s sliding window and 10 s sliding step growth. RF gets the best classification accuracy. The accuracy of classification is 83.57. In feature set 1, with different sliding windows, we can conclude that the KNN and RF algorithms are more accurate in fatigue detection as the sliding window size gets longer. There is some fluctuation in SVM detection, but the maximum SVM accuracy is reached when a window size of 60 s is reached. With different steps, KNN is influenced by the sliding step. The KNN fluctuates in accuracy as the sliding step size increases. The accuracy of SVM is highest in the shortest time window.
Table 7 and Table 8 show the results about feature set 2. The best accuracy is obtained by KNN in 60 s sliding window and 10 s sliding step. The best accuracy was 86.71. The accuracy of these three algorithms increases monotonically as the sliding window changes. The KNN algorithm performs best in time windows of 20 s and 60 s. SVM presents poorer performance in all time windows. RF accuracy is highest in the 30 s and 40 s time windows. The accuracy of RF is highest in the 30 s and 40 s time windows. KNN showed the best results in the 20 s, 50 s and 60 s time windows. With different steps, only the changes in the RF algorithm show monotonic changes.
From Table 9 and Table 10, the results show that KNN algorithm has the best accuracy in 60 s window and 10 s step size in feature set 3. The accuracy rate was 91.83. The change of RF accuracy in all windows is relatively stable. With different sliding windows, a monotonic increase in performance occurred for all three algorithms. Furthermore, we found that KNN worked best in the 40 s, 50 s and 60 s time windows. The accuracy of the RF has improved steadily overall. With different steps, all three algorithms show a decreasing trend in accuracy.
From Table 5, Table 6, Table 7, Table 8, Table 9, Table 10 and Table 11, the above experimental results fully illustrate that the 60 s time window for extracting features is very effective for detecting fatigue. The model requires 60 s except for the first window, and then it only takes 10 s to detect fatigue in the future. In the comparison of the three feature sets, we can conclude that the highest accuracy is in feature set 3. We find that among all the sliding windows and sliding steps, the 60 s sliding step and the 10 s sliding step have the best performance. According to Table 11, our results show that the performance (91.83% accuracy, 89.71% macro-P, 88.86% macro-R and 89.16% macro-F1) of KNN classification algorithm is the best among the three classification algorithms. However, the performance of SVM is not high in any kind of feature set.
In fact, this is perfectly understandable that a larger sliding window contains richer information about fatigue and that fatigue itself affects human physiology, psychology and behavior. Smaller time windows lead to a lack of deeper understanding of sample features around time. In terms of overall performance, the KNN algorithm shows very good performance in all three feature sets. After exploring different feature sets, we also found that fatigue detection is very much influenced by feature variation. From the results, it can be concluded that the best results are obtained with multiple feature sets. Compared to feature set 1, feature set 2 will work better. This will be a major help for future in-depth exploration to extract features about the mouse.
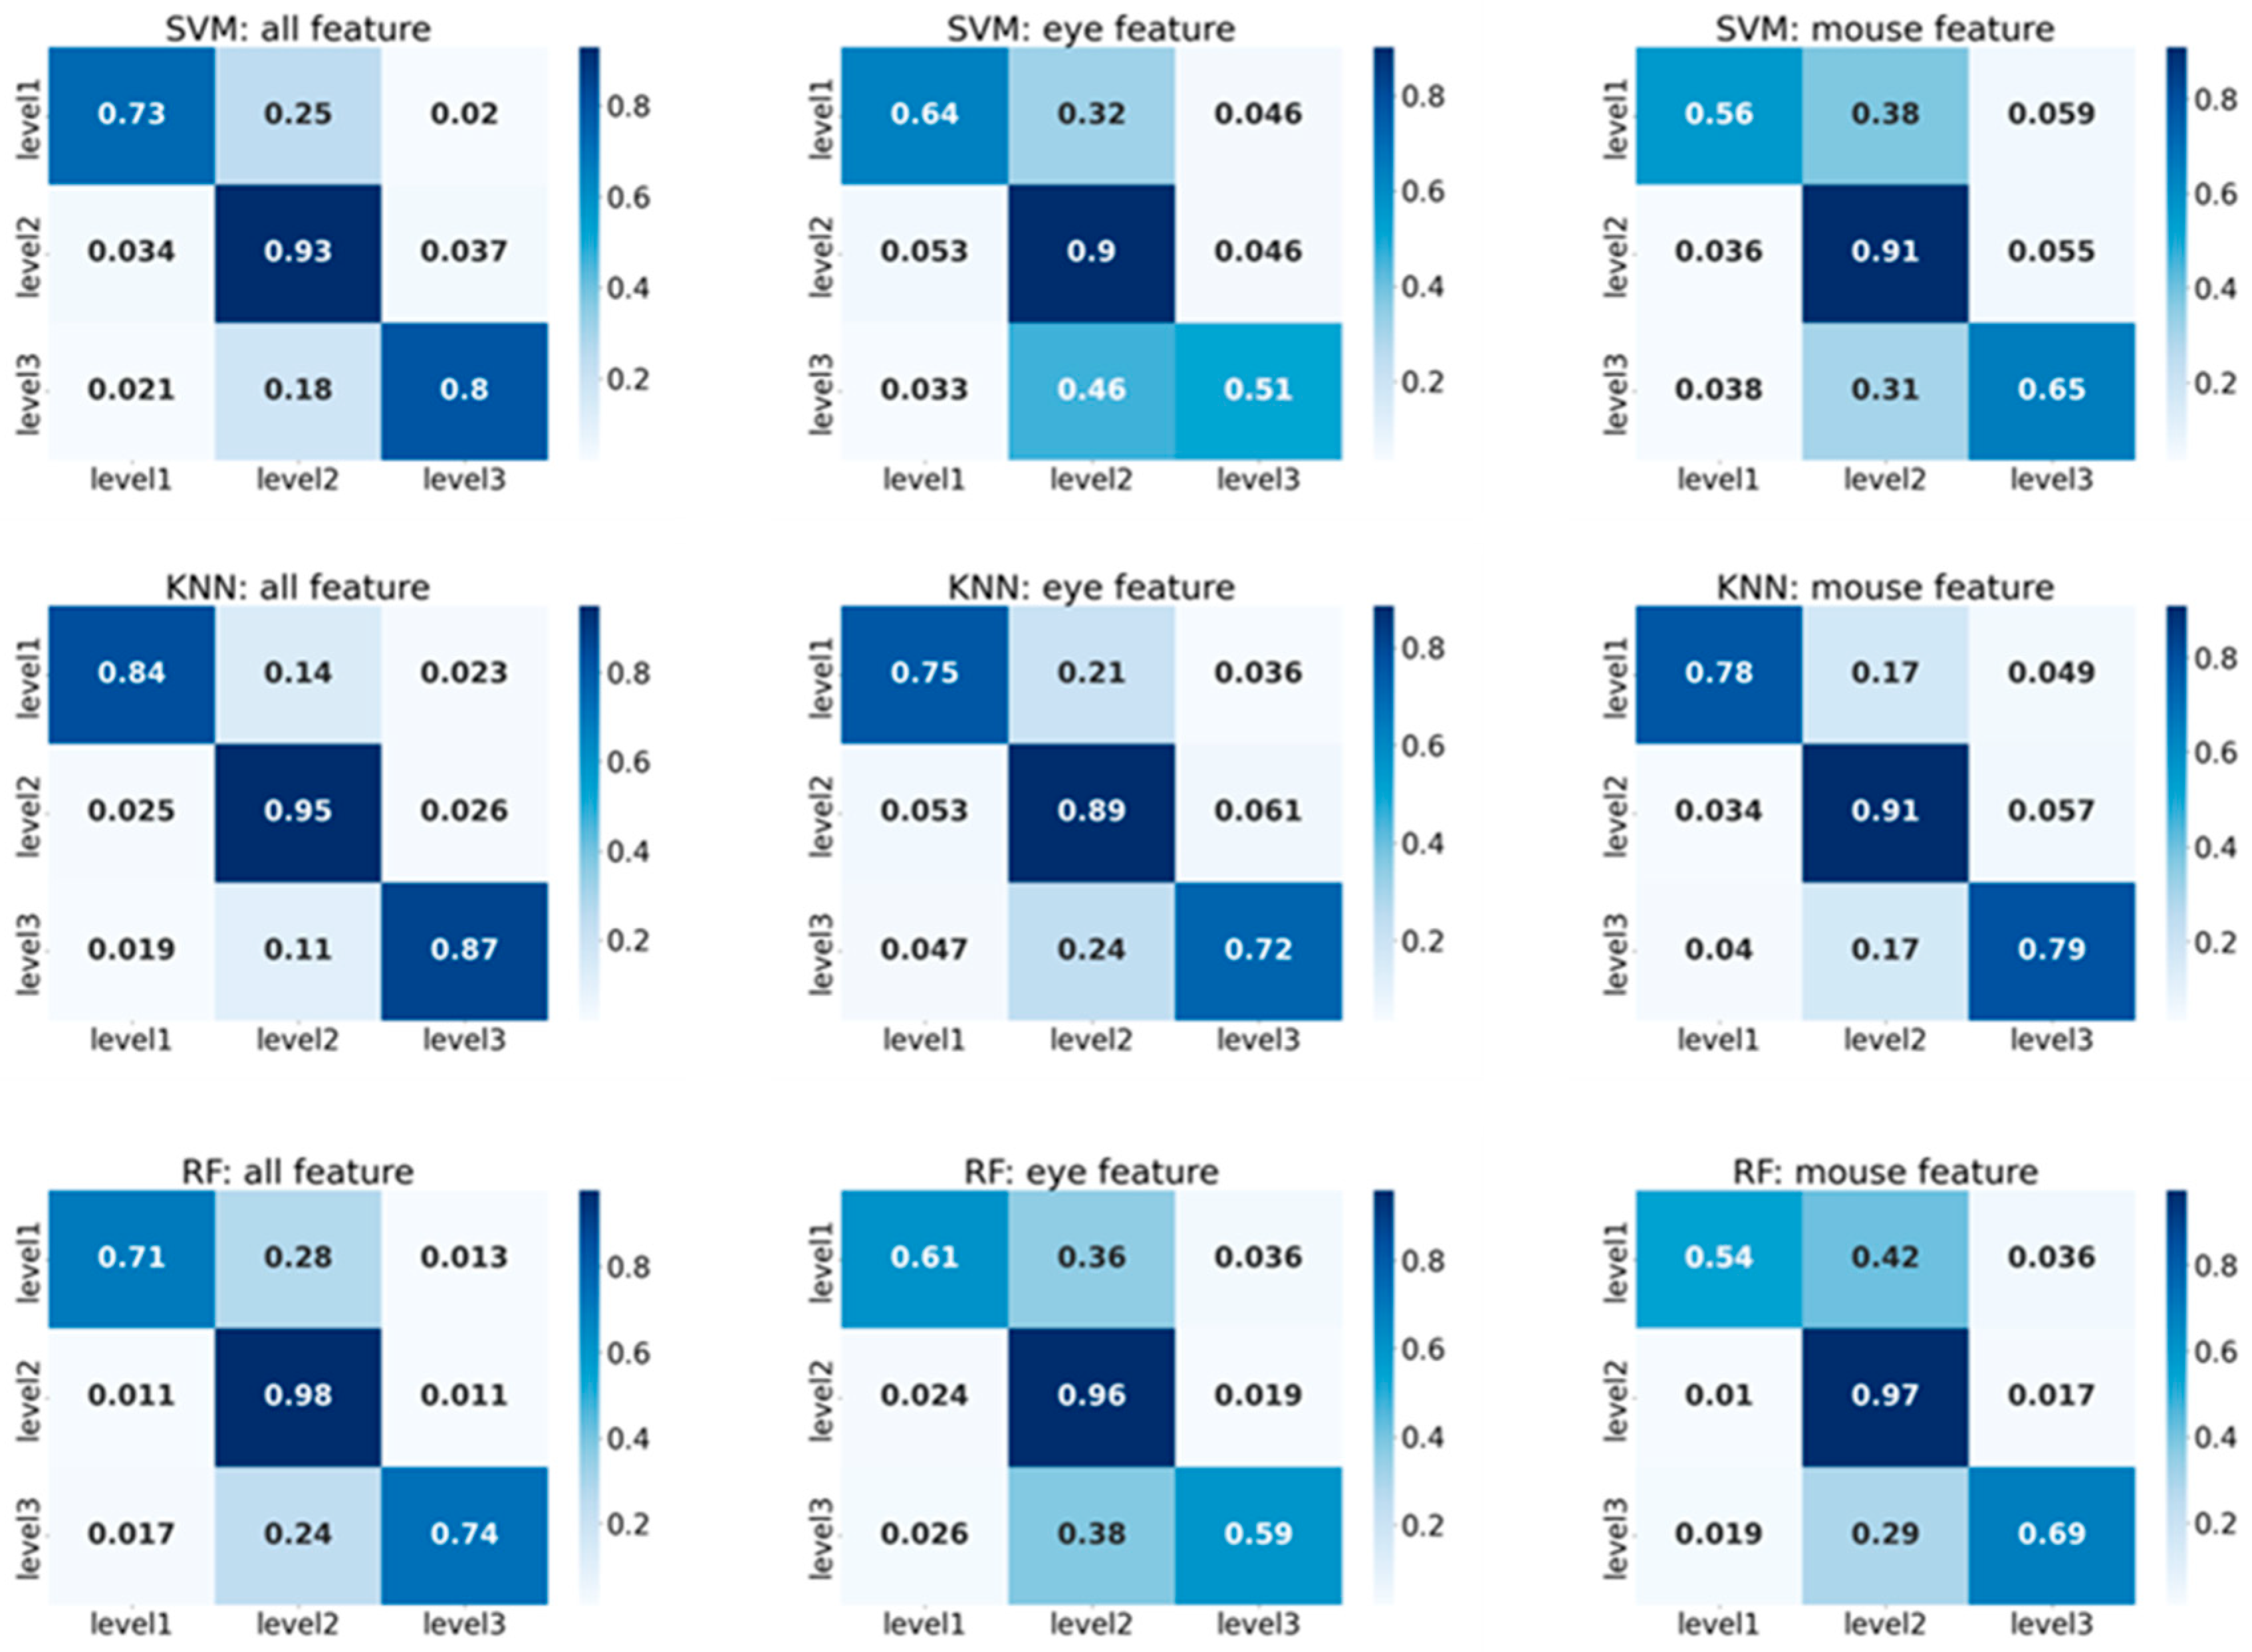
From the confusion matrix in Figure 5, it can be seen that the KNN algorithm has good performance in detecting all three fatigue classes. Although all three algorithms are very accurate at fatigue level 2. The accuracy of identifying fatigue level 1 and fatigue level 3 is low. The possible reason is that there is a difference in performance between the awake and tired states.
4. Discussion and Conclusions
It is found that TICC can objectively determine the fatigue level by using the change trend of subjective evaluation indicators (KSS and SSS scales), eye indicators (BR and PERCLOS) and mouse indicators (AMV and AOV within the sampling time). In the human–computer interaction environment of the main control room of a nuclear power plant, the results show that several widely used classification algorithms can perform fatigue detection with different feature sets. All have achieved good results. In particular, KNN shows excellent performance in various feature sets and the accuracy rate is above 85%. We find through experiments that, in a sliding window of 60 s and a sliding step of 10 s, the accuracy of the three algorithms is relatively high. Our model can basically identify the fatigue state of the operator in about 10 s, except for the initial 60 s data.
In comparing the performance of the eye and mouse features we find that previous studies have illustrated that eye-related features have very promising recognition performance in fatigue detection, but our research proves that the combination of mouse features and eye features can detect fatigue more accurately.
From the clustering results, it can also be obtained that the subjective scores of operators increase. Blink frequency and PERCLOS also increase. The movement velocity (AMV and AOV) of the mouse is reduced instead. It is confirmed that the characteristic changes of eyes and mouse are consistent with the change trend of fatigue in [9,30,37].
Our research is making efforts to solve the problem of real-time detection of operator fatigue in the main control room of nuclear power plants and help develop an operator fatigue detection method for nuclear power plants. However, we still need to do some further work. First, our study does not consider the effect of different simulation tasks on the data, so there may be different physiological and behavioral changes for fatigue states in different experimental scenarios, such as accident scenarios and normal start-stop pairs of scenarios. Second, our experimenters are all graduate students. Although our subjects all spent more than eight hours learning, there is still some difference compared to real plant operators.
By comparing the results of this experiment, we can understand that multiple features are more effective than a single feature. Possible future work will be to extract more features manually or to use more non-invasive devices to obtain fatigue indicators. The results and methodology of this study lay the groundwork for further explorations into mental fatigue in NPP MCR environments and could be applied to develop a reliable in MCR fatigue detection system in restricted NPP.
Author Contributions
Conceptualization, Y.L. and L.D.; methodology, Y.L.; software, Y.L.; validation, Y.L.; formal analysis, Y.L.; investigation, Y.L. and L.D; data curation, Y.L. and M.Z.; writing—original draft preparation, Y.L. and L.D.; writing—review and editing, Y.L. and L.D.; visualization, Y.L.; supervision, L.D.; project administration, L.D. All authors have read and agreed to the published version of the manuscript.
Funding
This research received no external funding.
Institutional Review Board Statement
Not applicable.
Informed Consent Statement
Informed consent was obtained from all subjects involved in the study.
Data Availability Statement
The data are not publicly available due to restriction of privacy.
Conflicts of Interest
The authors declare no conflict of interest.
References
- Caldwell, J.A.; Caldwell, J.L.; Thompson, L.A.; Lieberman, H.R. Fatigue and Its Management in the Workplace. Neurosci. Biobehav. Rev. 2019, 96, 272–289. [Google Scholar] [CrossRef] [PubMed]
- Stanton, N.A. Human Factors in Nuclear Safety; Taylor & Francis: London, UK, 1996; ISBN 978-0-203-22753-4. [Google Scholar]
- Griffith, C.D.; Mahadevan, S. Sleep Deprivation Effect on Human Performance: A Meta-Analysis Approach (PSAM-0010). In Proceedings of the Eighth International Conference on Probabilistic Safety Assessment & Management (PSAM), New Orleans, LA, USA, 14–19 May 2006; Stamatelatos, M.G., Blackman, H.S., Eds.; ASME Press: New York, NY, USA, 2006; pp. 1488–1496, ISBN 978-0-7918-0244-1. [Google Scholar]
- Liu, P.; Li, Z. Comparison between Conventional and Digital Nuclear Power Plant Main Control Rooms: A Task Complexity Perspective, Part I: Overall Results and Analysis. Int. J. Ind. Ergon. 2016, 51, 2–9. [Google Scholar] [CrossRef]
- Straeter, O. Human and Automation: System Design and Research Issues. Reliab. Eng. Syst. Saf. 2003, 81, 111–114. [Google Scholar] [CrossRef]
- Guo, Z.; Chen, R.; Zhang, K.; Pan, Y.; Wu, J. The Impairing Effect of Mental Fatigue on Visual Sustained Attention under Monotonous Multi-Object Visual Attention Task in Long Durations: An Event-Related Potential Based Study. PLoS ONE 2016, 11, e0163360. [Google Scholar] [CrossRef] [Green Version]
- Yan, S.; Tran, C.C.; Chen, Y.; Tan, K.; Habiyaremye, J.L. Effect of User Interface Layout on the Operators’ Mental Workload in Emergency Operating Procedures in Nuclear Power Plants. Nucl. Eng. Des. 2017, 322, 266–276. [Google Scholar] [CrossRef]
- Jou, Y.-T.; Yenn, T.-C.; Lin, C.J.; Yang, C.-W.; Chiang, C.-C. Evaluation of Operators’ Mental Workload of Human–System Interface Automation in the Advanced Nuclear Power Plants. Nucl. Eng. Des. 2009, 239, 2537–2542. [Google Scholar] [CrossRef]
- Gao, Q.; Wang, Y.; Song, F.; Li, Z.; Dong, X. Mental Workload Measurement for Emergency Operating Procedures in Digital Nuclear Power Plants. Ergonomics 2013, 56, 1070–1085. [Google Scholar] [CrossRef]
- Trutschel, U.; Sirois, B.; Sommer, D.; Golz, M.; Edwards, D. PERCLOS: An Alertness Measure of the Past. In Proceedings of the 6th International Driving Symposium on Human Factors in Driver Assessment, Training, and Vehicle Design: Driving Assessment 2011, Lake Tahoe, CA, USA, 27–30 June 2011; University of Iowa: Iowa City, IA, USA, 2011; pp. 172–179. [Google Scholar]
- Cheng, Q.; Wang, W.; Jiang, X.; Hou, S.; Qin, Y. Assessment of Driver Mental Fatigue Using Facial Landmarks. IEEE Access 2019, 7, 150423–150434. [Google Scholar] [CrossRef]
- Qin, H.; Zhou, X.; Ou, X.; Liu, Y.; Xue, C. Detection of Mental Fatigue State Using Heart Rate Variability and Eye Metrics during Simulated Flight. Hum. Factors Erg. Manuf. 2021, 31, 637–651. [Google Scholar] [CrossRef]
- Divjak, M.; Bischof, H. Eye Blink Based Fatigue Detection for Prevention of Computer Vision Syndrome. In Proceedings of the MVA, Yokohama, Japan, 20–22 May 2009; pp. 350–353. [Google Scholar]
- Maior, C.B.S.; Moura, M.J.d.C.; Santana, J.M.M.; Lins, I.D. Real-Time Classification for Autonomous Drowsiness Detection Using Eye Aspect Ratio. Expert Syst. Appl. 2020, 158, 113505. [Google Scholar] [CrossRef]
- Cech, J.; Soukupova, T. Real-Time Eye blink detection using facial landmarks. In Proceedings of the 21st Computer Vision Winter Workshop, Rimske Toplice, Slovenia, 3–5 February 2016; pp. 1–8. [Google Scholar]
- Zhao, Z.; Zhou, N.; Zhang, L.; Yan, H.; Xu, Y.; Zhang, Z. Driver Fatigue Detection Based on Convolutional Neural Networks Using EM-CNN. Comput. Intell. Neurosci. 2020, 2020, 1–11. [Google Scholar] [CrossRef] [PubMed]
- Van Cutsem, J.; Marcora, S.; De Pauw, K.; Bailey, S.; Meeusen, R.; Roelands, B. The Effects of Mental Fatigue on Physical Performance: A Systematic Review. Sport. Med 2017, 47, 1569–1588. [Google Scholar] [CrossRef] [PubMed] [Green Version]
- Zhang, G.; Mei, S.; Xie, K.; Yang, Z. Multi-Index Measurement of Fatigue Degree Under the Simulated Monitoring Task of a Nuclear Power Plant. Nucl. Technol. 2021, 207, 1564–1577. [Google Scholar] [CrossRef]
- Li, J.; Ngai, G.; Leong, H.V.; Chan, S.C.F. Multimodal Human Attention Detection for Reading from Facial Expression, Eye Gaze, and Mouse Dynamics. SIGAPP Appl. Comput. Rev. 2016, 16, 37–49. [Google Scholar] [CrossRef]
- Laurent, F.; Valderrama, M.; Besserve, M.; Guillard, M.; Lachaux, J.-P.; Martinerie, J.; Florence, G. Multimodal Information Improves the Rapid Detection of Mental Fatigue. Biomed. Signal Process. Control 2013, 8, 400–408. [Google Scholar] [CrossRef]
- Pepa, L.; Sabatelli, A.; Ciabattoni, L.; Monteriu, A.; Lamberti, F.; Morra, L. Stress Detection in Computer Users From Keyboard and Mouse Dynamics. IEEE Trans. Consum. Electron. 2021, 67, 12–19. [Google Scholar] [CrossRef]
- Ciabattoni, L.; Foresi, G.; Lamberti, F.; MonteriU, A.; Sabatelli, A. A Stress Detection System Based on Multimedia Input Peripherals. In Proceedings of the 2020 IEEE International Conference on Consumer Electronics (ICCE), Las Vegas, NV, USA, 4–6 January 2020; IEEE: Las Vegas, NV, USA; pp. 1–2. [Google Scholar]
- Yi, Q.; Xiong, S.; Wang, B.; Yi, S. Identification of Trusted Interactive Behavior Based on Mouse Behavior Considering Web User’s Emotions. Int. J. Ind. Ergon. 2020, 76, 102903. [Google Scholar] [CrossRef]
- Tsoulouhas, G.; Georgiou, D.; Karakos, A. Detection of Learner’s Affective State Based on Mouse Movements. J. Comput. 2011, 3, 9–18. [Google Scholar]
- Li, J.; Ngai, G.; Va Leong, H.; Chan, S. Multimodal Human Attention Detection for Reading. In Proceedings of the 31st Annual ACM Symposium on Applied Computing, Pisa, Italy, 4 April 2016; ACM: Pisa, Italy; pp. 187–192. [Google Scholar]
- Pimenta, A.; Carneiro, D.; Neves, J.; Novais, P. A Neural Network to Classify Fatigue from Human–Computer Interaction. Neurocomputing 2016, 172, 413–426. [Google Scholar] [CrossRef]
- Sikander, G.; Anwar, S. Driver Fatigue Detection Systems: A Review. IEEE Trans. Intell. Transport. Syst. 2019, 20, 2339–2352. [Google Scholar] [CrossRef]
- Choi, M.K.; Seong, P.H. A Methodology for Evaluating Human Operator’s Fitness for Duty in Nuclear Power Plants. Nucl. Eng. Technol. 2020, 52, 984–994. [Google Scholar] [CrossRef]
- Kim, K.G. Book Review: Deep Learning. Heal. Inf. Res 2016, 22, 351. [Google Scholar] [CrossRef] [Green Version]
- Li, J.; Li, H.; Umer, W.; Wang, H.; Xing, X.; Zhao, S.; Hou, J. Identification and Classification of Construction Equipment Operators’ Mental Fatigue Using Wearable Eye-Tracking Technology. Autom. Constr. 2020, 109, 103000. [Google Scholar] [CrossRef]
- McDonald, A.D.; Lee, J.D.; Schwarz, C.; Brown, T.L. A Contextual and Temporal Algorithm for Driver Drowsiness Detection. Accid. Anal. Prev. 2018, 113, 25–37. [Google Scholar] [CrossRef]
- Yamada, Y.; Kobayashi, M. Detecting Mental Fatigue from Eye-Tracking Data Gathered While Watching Video: Evaluation in Younger and Older Adults. Artif. Intell. Med. 2018, 91, 39–48. [Google Scholar] [CrossRef]
- Zandi, A.S.; Quddus, A.; Prest, L.; Comeau, F.J.E. Non-Intrusive Detection of Drowsy Driving Based on Eye Tracking Data. Transp. Res. Rec. 2019, 2673, 247–257. [Google Scholar] [CrossRef]
- Hallac, D.; Vare, S.; Boyd, S.; Leskovec, J. Toeplitz Inverse Covariance-Based Clustering of Multivariate Time Series Data. In Proceedings of the 23rd ACM SIGKDD International Conference on Knowledge Discovery and Data Mining, Halifax, NS, Canada, 4 August 2017; ACM: Halifax, NS, Canada; pp. 215–223. [Google Scholar]
- Sun, L.; Guo, Z.; Yuan, X.; Wang, X.; Su, C.; Jiang, J.; Li, X. An Investigation of the Effects of Brain Fatigue on the Sustained Attention of Intelligent Coal Mine VDT Operators. Int. J. Environ. Res. Public Health 2022, 19, 11034. [Google Scholar] [CrossRef]
- Nie, B.; Huang, X.; Chen, Y.; Li, A.; Zhang, R.; Huang, J. Experimental Study on Visual Detection for Fatigue of Fixed-Position Staff. Appl. Ergon. 2017, 65, 1–11. [Google Scholar] [CrossRef]
- Pimenta, A.; Carneiro, D.; Novais, P.; Neves, J. Monitoring Mental Fatigue through the Analysis of Keyboard and Mouse Interaction Patterns. In Hybrid Artificial Intelligent Systems; Pan, J.-S., Polycarpou, M.M., Woźniak, M., de Carvalho, A.C.P.L.F., Quintián, H., Corchado, E., Eds.; Lecture Notes in Computer Science; Springer: Berlin, Heidelberg, 2013; Volume 8073, pp. 222–231. ISBN 978-3-642-40845-8. [Google Scholar]
- Grimes, G.M.; Valacich, J.S. Mind Over Mouse: The Effect of Cognitive Load on Mouse Movement Behavior. In Proceedings of the Thirty Sixth International Conference on Information Systems, Fort Worth, TX, USA, 13–16 December 2015. [Google Scholar]
- Borghini, G.; Astolfi, L.; Vecchiato, G.; Mattia, D.; Babiloni, F. Measuring Neurophysiological Signals in Aircraft Pilots and Car Drivers for the Assessment of Mental Workload, Fatigue and Drowsiness. Neurosci. Biobehav. Rev. 2014, 44, 58–75. [Google Scholar] [CrossRef]
- Reinerman-Jones, L.; Matthews, G.; Mercado, J.E. Detection Tasks in Nuclear Power Plant Operation: Vigilance Decrement and Physiological Workload Monitoring. Saf. Sci. 2016, 88, 97–107. [Google Scholar] [CrossRef]
- King, D.E. Dlib-Ml: A Machine Learning Toolkit. J. Mach. Learn. Res. 2009, 10, 1755–1758. [Google Scholar]
- Faber, L.G.; Maurits, N.M.; Lorist, M.M. Mental Fatigue Affects Visual Selective Attention. PLoS ONE 2012, 7, e48073. [Google Scholar] [CrossRef] [PubMed] [Green Version]
Figure 1.
Methodological framework of the study.

Figure 2.
Fatigue identification process.

Figure 3.
Experimental equipment and experimental process.

Figure 4.
Trend graph of each fatigue grade index of clustering results.

Figure 5.
Confusion matrix corresponding to the three types of feature sets of the three algorithms.
Figure 5.
Confusion matrix corresponding to the three types of feature sets of the three algorithms.


Table 1.
Blink rate and PERCLOS formulae.
| Indicators | Formula | Description |
|---|---|---|
| PERCLOS | The proportion of frames with EAR less than the specified threshold 0.25 within the specified time frame. | |
| Blink Rate | M | The number of consecutive three frames less than the specified threshold of 0.25 in the specified time interval is M. |
Table 2.
Average mouse velocity and average value of the mouse velocity.
| Indicators | Formula | Description |
|---|---|---|
| Average Mouse Velocity (AMV) | The ratio of the total distance of mouse movement in the specified time interval to the total time of each interval, is the Euclidean distance of the Dth mouse movement, is the time interval of the Dth mouse movement process. | |
| Average Value of Mouse Velocity (AOV) | The average of the velocities of two consecutive mouse movement positions captured during the specified time interval, is the Euclidean distance of the Dth mouse movement, is the time interval of the Dth mouse movement process. |
Table 3.
Multi-level mental fatigue recognition based on TICC multi-feature index.
| Indicators | Description |
|---|---|
| Subject Score | KSS score and SSS score for each TOM stage |
| Eye Related Feature | BR (times/sec); PERCLOS (%) |
| Mouse Velocity Feature | AMV (pixels/sec); AOV (pixels/sec) |
Note: SSS = Stanford Sleepiness Scale; KSS = Karolinska Sleepiness Scale; BR = blink rate; AMV = average mouse velocity; AOV = average value of mouse velocity.
Table 4.
TICC clustering results.
| Fatigue Level | Subject Score | Eye-Related Feature | Mouse Speed Feature | |||
|---|---|---|---|---|---|---|
| SSS | KSS | BR | PERCLOS | AMV | AOV | |
| 1 | 0.357 | 0.268 | 0.040 | 0.099 | 0.041 | 0.059 |
| 2 | 0.396 | 0.272 | 0.086 | 0.224 | 0.035 | 0.049 |
| 3 | 0.889 | 0.805 | 0.095 | 0.255 | 0.030 | 0.041 |
Table 5.
Feature set 1—different windows.
| Algorithm | Classification Performance (%) | ||||
|---|---|---|---|---|---|
| 20 s | 30 s | 40 s | 50 s | 60 s | |
| SVM | 66.81 | 66.67 | 70.54 | 72.52 | 78.54 |
| KNN | 66.02 | 68.02 | 74.09 | 78.42 | 83.29 |
| RF | 66.71 | 68.62 | 75.72 | 80.01 | 83.57 |
Table 6.
Feature set 1—different steps.
| Algorithm | Classification Performance (%) | ||||
|---|---|---|---|---|---|
| 10 s | 20 s | 30 s | 40 s | 50 s | |
| SVM | 78.54 | 70.22 | 68.07 | 67.03 | 66.92 |
| KNN | 83.29 | 73.69 | 66.67 | 67.40 | 66.21 |
| RF | 83.57 | 74.63 | 69.61 | 69.10 | 65.98 |
Table 7.
Feature set 2—different windows.
| Algorithm | Classification Performance (%) | ||||
|---|---|---|---|---|---|
| 20 s | 30 s | 40 s | 50 s | 60 s | |
| SVM | 66.39 | 68.86 | 73.20 | 76.73 | 80.85 |
| KNN | 67.88 | 70.95 | 76.28 | 85.39 | 86.71 |
| RF | 67.78 | 73.23 | 78.24 | 81.88 | 85.49 |
Table 8.
Feature set 2—different steps.
| Algorithm | Classification Performance (%) | ||||
|---|---|---|---|---|---|
| 10 s | 20 s | 30 s | 40 s | 50 s | |
| SVM | 80.85 | 70.41 | 68.20 | 67.40 | 68.56 |
| KNN | 86.71 | 73.88 | 68.63 | 68.90 | 69.50 |
| RF | 85.49 | 75.09 | 69.47 | 68.71 | 68.33 |
Table 9.
Feature set 3—different windows.
| Algorithm | Classification Performance (%) | ||||
|---|---|---|---|---|---|
| 20 s | 30 s | 40 s | 50 s | 60 s | |
| SVM | 67.92 | 70.90 | 77.73 | 83.05 | 87.42 |
| KNN | 69.55 | 74.58 | 83.71 | 90.92 | 91.83 |
| RF | 71.54 | 76.63 | 81.89 | 86.94 | 89.25 |
Table 10.
Feature set 3—different steps.
| Algorithm | Classification Performance (%) | ||||
|---|---|---|---|---|---|
| 10 s | 20 s | 30 s | 40 s | 50 s | |
| SVM | 87.42 | 79.68 | 69.05 | 68.72 | 66.45 |
| KNN | 91.83 | 82.49 | 72.69 | 69.65 | 66.92 |
| RF | 89.25 | 79.87 | 73.26 | 72.47 | 67.62 |
Table 11.
Classification performance of different classification algorithms with different feature sets.
Table 11.
Classification performance of different classification algorithms with different feature sets.
| Algorithm | Feature Set | Classification Performance (%) | |||
|---|---|---|---|---|---|
| Accuracy | Macro-P | Macro-R | Macro-F1 | ||
| SVM | 1 | 78.54 | 74.70 | 68.32 | 70.49 |
| 2 | 80.85 | 76.77 | 71.02 | 73.33 | |
| 3 | 87.42 | 84.91 | 82.05 | 83.23 | |
| KNN | 1 | 83.29 | 78.32 | 78.60 | 78.32 |
| 2 | 86.71 | 82.54 | 82.87 | 82.60 | |
| 3 | 91.83 | 89.71 | 88.86 | 89.16 | |
| RF | 1 | 83.57 | 83.97 | 71.99 | 76.28 |
| 2 | 85.49 | 87.24 | 73.58 | 78.40 | |
| 3 | 89.25 | 91.01 | 81.15 | 85.13 | |
Disclaimer/Publisher’s Note: The statements, opinions and data contained in all publications are solely those of the individual author(s) and contributor(s) and not of MDPI and/or the editor(s). MDPI and/or the editor(s) disclaim responsibility for any injury to people or property resulting from any ideas, methods, instructions or products referred to in the content. |
© 2023 by the authors. Licensee MDPI, Basel, Switzerland. This article is an open access article distributed under the terms and conditions of the Creative Commons Attribution (CC BY) license (https://creativecommons.org/licenses/by/4.0/).
Share and Cite
MDPI and ACS Style
Dai, L.; Li, Y.; Zhang, M. Detection of Operator Fatigue in the Main Control Room of a Nuclear Power Plant Based on Eye Blink Rate, PERCLOS and Mouse Velocity. Appl. Sci. 2023, 13, 2718. https://doi.org/10.3390/app13042718
AMA Style
Dai L, Li Y, Zhang M. Detection of Operator Fatigue in the Main Control Room of a Nuclear Power Plant Based on Eye Blink Rate, PERCLOS and Mouse Velocity. Applied Sciences. 2023; 13(4):2718. https://doi.org/10.3390/app13042718
Chicago/Turabian StyleDai, Licao, Yu Li, and Meihui Zhang. 2023. "Detection of Operator Fatigue in the Main Control Room of a Nuclear Power Plant Based on Eye Blink Rate, PERCLOS and Mouse Velocity" Applied Sciences 13, no. 4: 2718. https://doi.org/10.3390/app13042718
Note that from the first issue of 2016, this journal uses article numbers instead of page numbers. See further details here.