Article

Reinforced Concrete Building with IED Detonation: Test and Simulation

by
Anastasio P. Santos
1,
Ricardo Castedo
1,*,
Lina M. López
1,
María Chiquito
1,
José I. Yenes
2,
Alejandro Alañón
3,
Elisa Costamagna
4 and
Santiago Martínez-Almajano
2
1
E.T.S.I. Minas y Energía—Universidad Politécnica de Madrid, 28003 Madrid, Spain
2
Escuela Politécnica Superior del Ejército—Ministry of Defense, 28071 Madrid, Spain
3
Escuela Politécnica Superior de Ávila—Universidad de Salamanca, 05003 Ávila, Spain
4
Department of Environment, Land and Infrastructure Engineering (DIATI), Politecnico di Torino, 10129 Torino, Italy
*
Author to whom correspondence should be addressed.
Appl. Sci. 2022, 12(15), 7803; https://doi.org/10.3390/app12157803
Submission received: 10 July 2022 / Revised: 29 July 2022 / Accepted: 31 July 2022 / Published: 3 August 2022
(This article belongs to the Special Issue Blast and Impact Engineering on Structures and Materials)

Abstract

:
There is growing concern about the possibility of a suicide bomber being immolated when the army forces or the law enforcement agencies discover the place where they prepare their material or simply find themselves inside a building. To study the possible effects that these improvised explosive devices (IEDs) would have on the structures, eight tests were carried out with various configurations of IEDs with vest bombs inside a reinforced concrete (including walls and roof) building constructed ad hoc for these tests. These vests were made with different explosives (black powder, ANFO, AN/AL, PG2). For the characterization of these tests, a high-speed camera and pressure and acceleration sensors were used. The structure behaved surprisingly well, as it withstood all the first seven detonations without apparent structural damage. In the last detonation, located on the ground and with a significant explosive charge, the structural integrity of the roof and some of the walls was compromised. The simulation of the building was carried out with the LS-DYNA software with a Lagrangian formulation for the walls, using the LBE (based on CONWEP) module for the application of the charge. Despite the difficulty of this simulation, the results obtained, in terms of applied pressures and measured accelerations, are acceptable with differences of about 20%.

1. Introduction

The risk of an attack in the operating area or in the neutral zone has increased in the last decades. Many of these attacks are carried out using improvised explosive devices (IEDs) which are unconventional weapons that can be easily fabricated. Access to the products and knowledge necessary for the use and creation of IEDs has risen in recent years. As an example, terrorist attacks such as Flight 9268 which covered the Egypt–Russia route (2015), Paris (2015), Belgium (2016), Germany (2016), England (2017) and Spain (2017), all of which resulted in fatalities, demonstrate the urgent need to better understand the possible effects of these devices on people and/or structures [1,2,3]. Most of the IED attacks over the past 15 years involved small bombs of less than 5 kg [4] or a person-borne improvised explosive device (PBIED) usually containing less than 10 kg of explosives [5,6]. Moreover, terrorist actions may most often be carried out in crowded areas, in urban environments, near critical infrastructure or even inside buildings. For this reason, there has been considerable research on structural damage and blast effects on buildings, and therefore, much literature has been published on blast mitigation and retrofit methods [7,8]. However, many of these works are not based on experimental tests and use numerical modeling to predict the structural response in different scenarios by comparing it with empirical equations [9,10]. Other times, numerical modeling results are validated with experimental data found in the literature [11,12]. In these scenarios, comparisons can only be made with the available data which in some cases are deficient. Numerical modeling is a good alternative and a very useful tool, but in the case of blast loading, it must be calibrated and validated by corresponding field tests.
Since concrete is a construction material widely used in many building structures, its behavior has been extensively studied through experimental tests and numerical simulation. Experimental data are essential to understand the explosive phenomenon and predict the structural response, but this kind of experiment is very difficult to implement and has a high cost. For these reasons, many of the experiments are based on single structural elements such as beams [13,14] or slabs [15,16,17] which are easier to handle and monitor. The data obtained in this type of trial can be used to calibrate numerical models as well as to check different laws of materials’ behavior. However, these results cannot be used to analyze and predict the structural response of a whole building, as the element failure causes loads to be redistributed to the neighboring supporting elements. The failure of individual structural elements can have a decisive influence on whether or not the structure collapses. Progressive collapse of structures has also been studied by numerous researchers, although not many have conducted experimental tests at full scale [18,19,20], and there are even fewer cases in which, in addition to the structure, non-structural elements such as masonry walls or the roof are represented [21,22].
However, in the last decade, most casualties of terrorism have been caused by shootings, vehicle impacts or PBIED attacks [23]. In these scenarios, there is no need to protect any kind of structure. In addition, existing infrastructure has proven to be highly resilient and robust against blast loadings. On the other hand, there is a research gap related to primary and secondary blast injuries, even though they are the main source of fatalities. Primary blast injuries are caused by the blast pressure wave and generally affect gas-containing organs, usually the eardrums and lungs. The secondary blast injuries result from the direct impact of airborne debris due to the blast wind [24,25]. Therefore, more research is needed to understand casualty risks from bomb fragmentation and blast overpressure hazards, especially from IEDs and PBIEDs produced inside buildings. In this situation, the overpressure is amplified by the reflection of the blast wave on the enclosure walls, and the explosion yield can be increased up to eight times.
In this research, eight tests were carried out with different IED configurations simulating a PBIED inside a building using vest bombs. The building consisted of a small concrete structure of 6.80 × 5 m with a corridor and an inner room. This work focuses on the analysis of the high-speed video, pressures and accelerations recorded during the tests and the development of a suitable numerical model capable of reproducing the behavior of the blast effects inside the building.

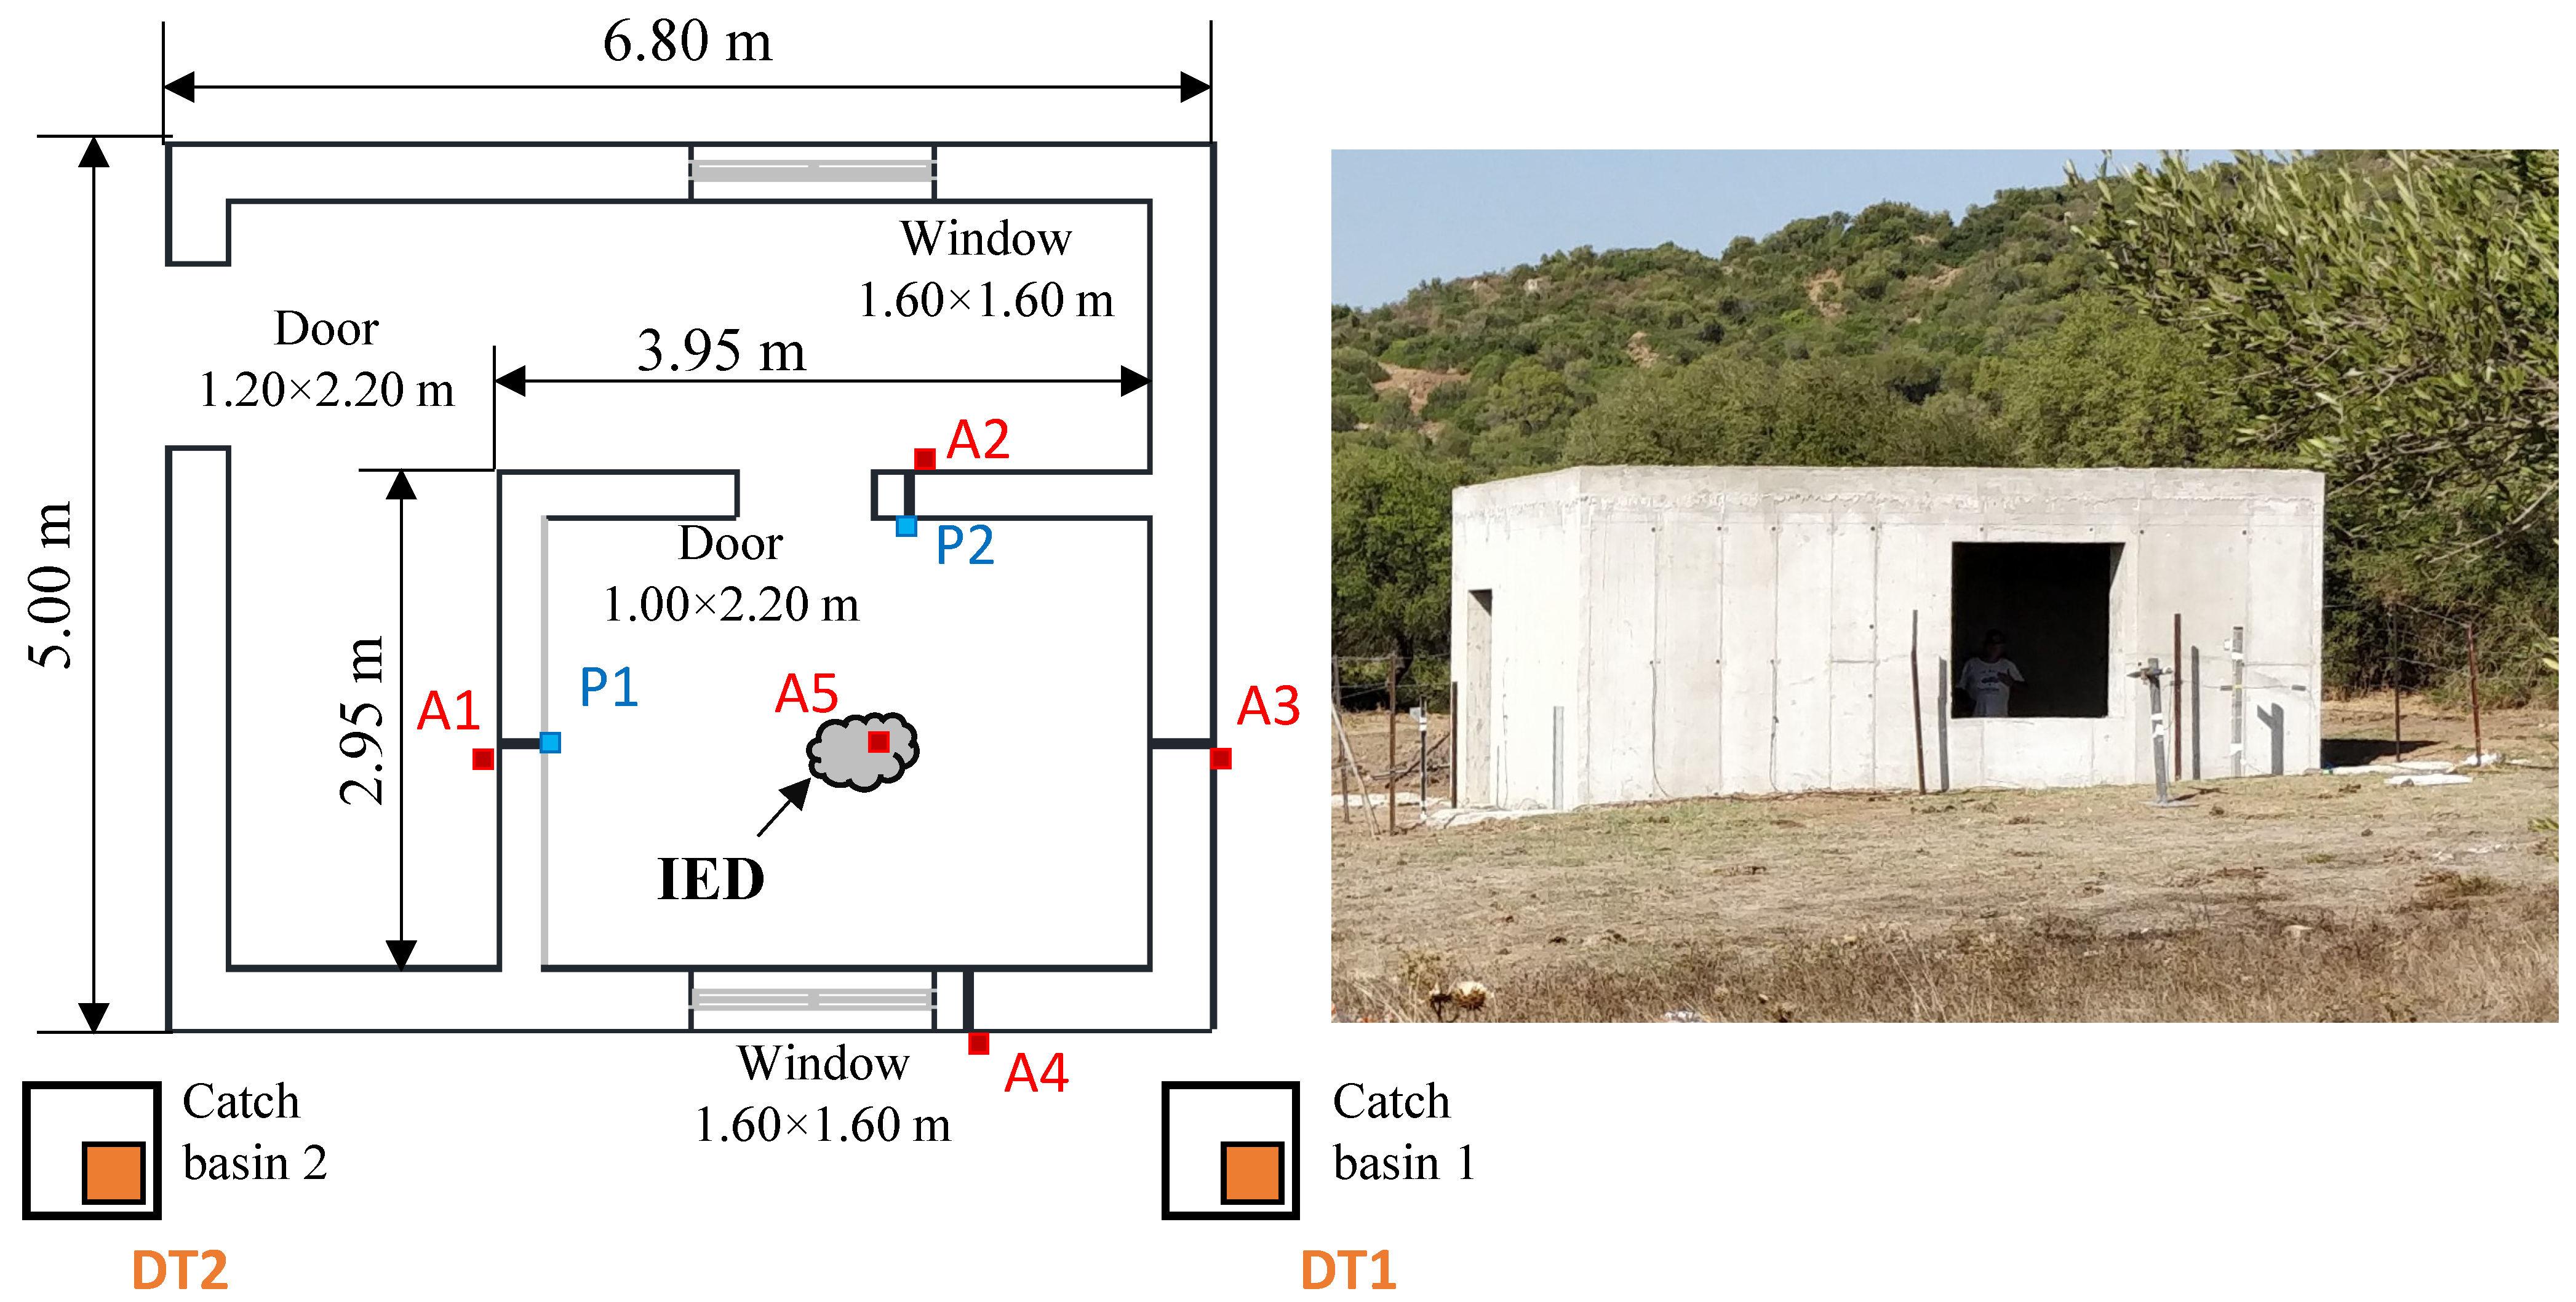
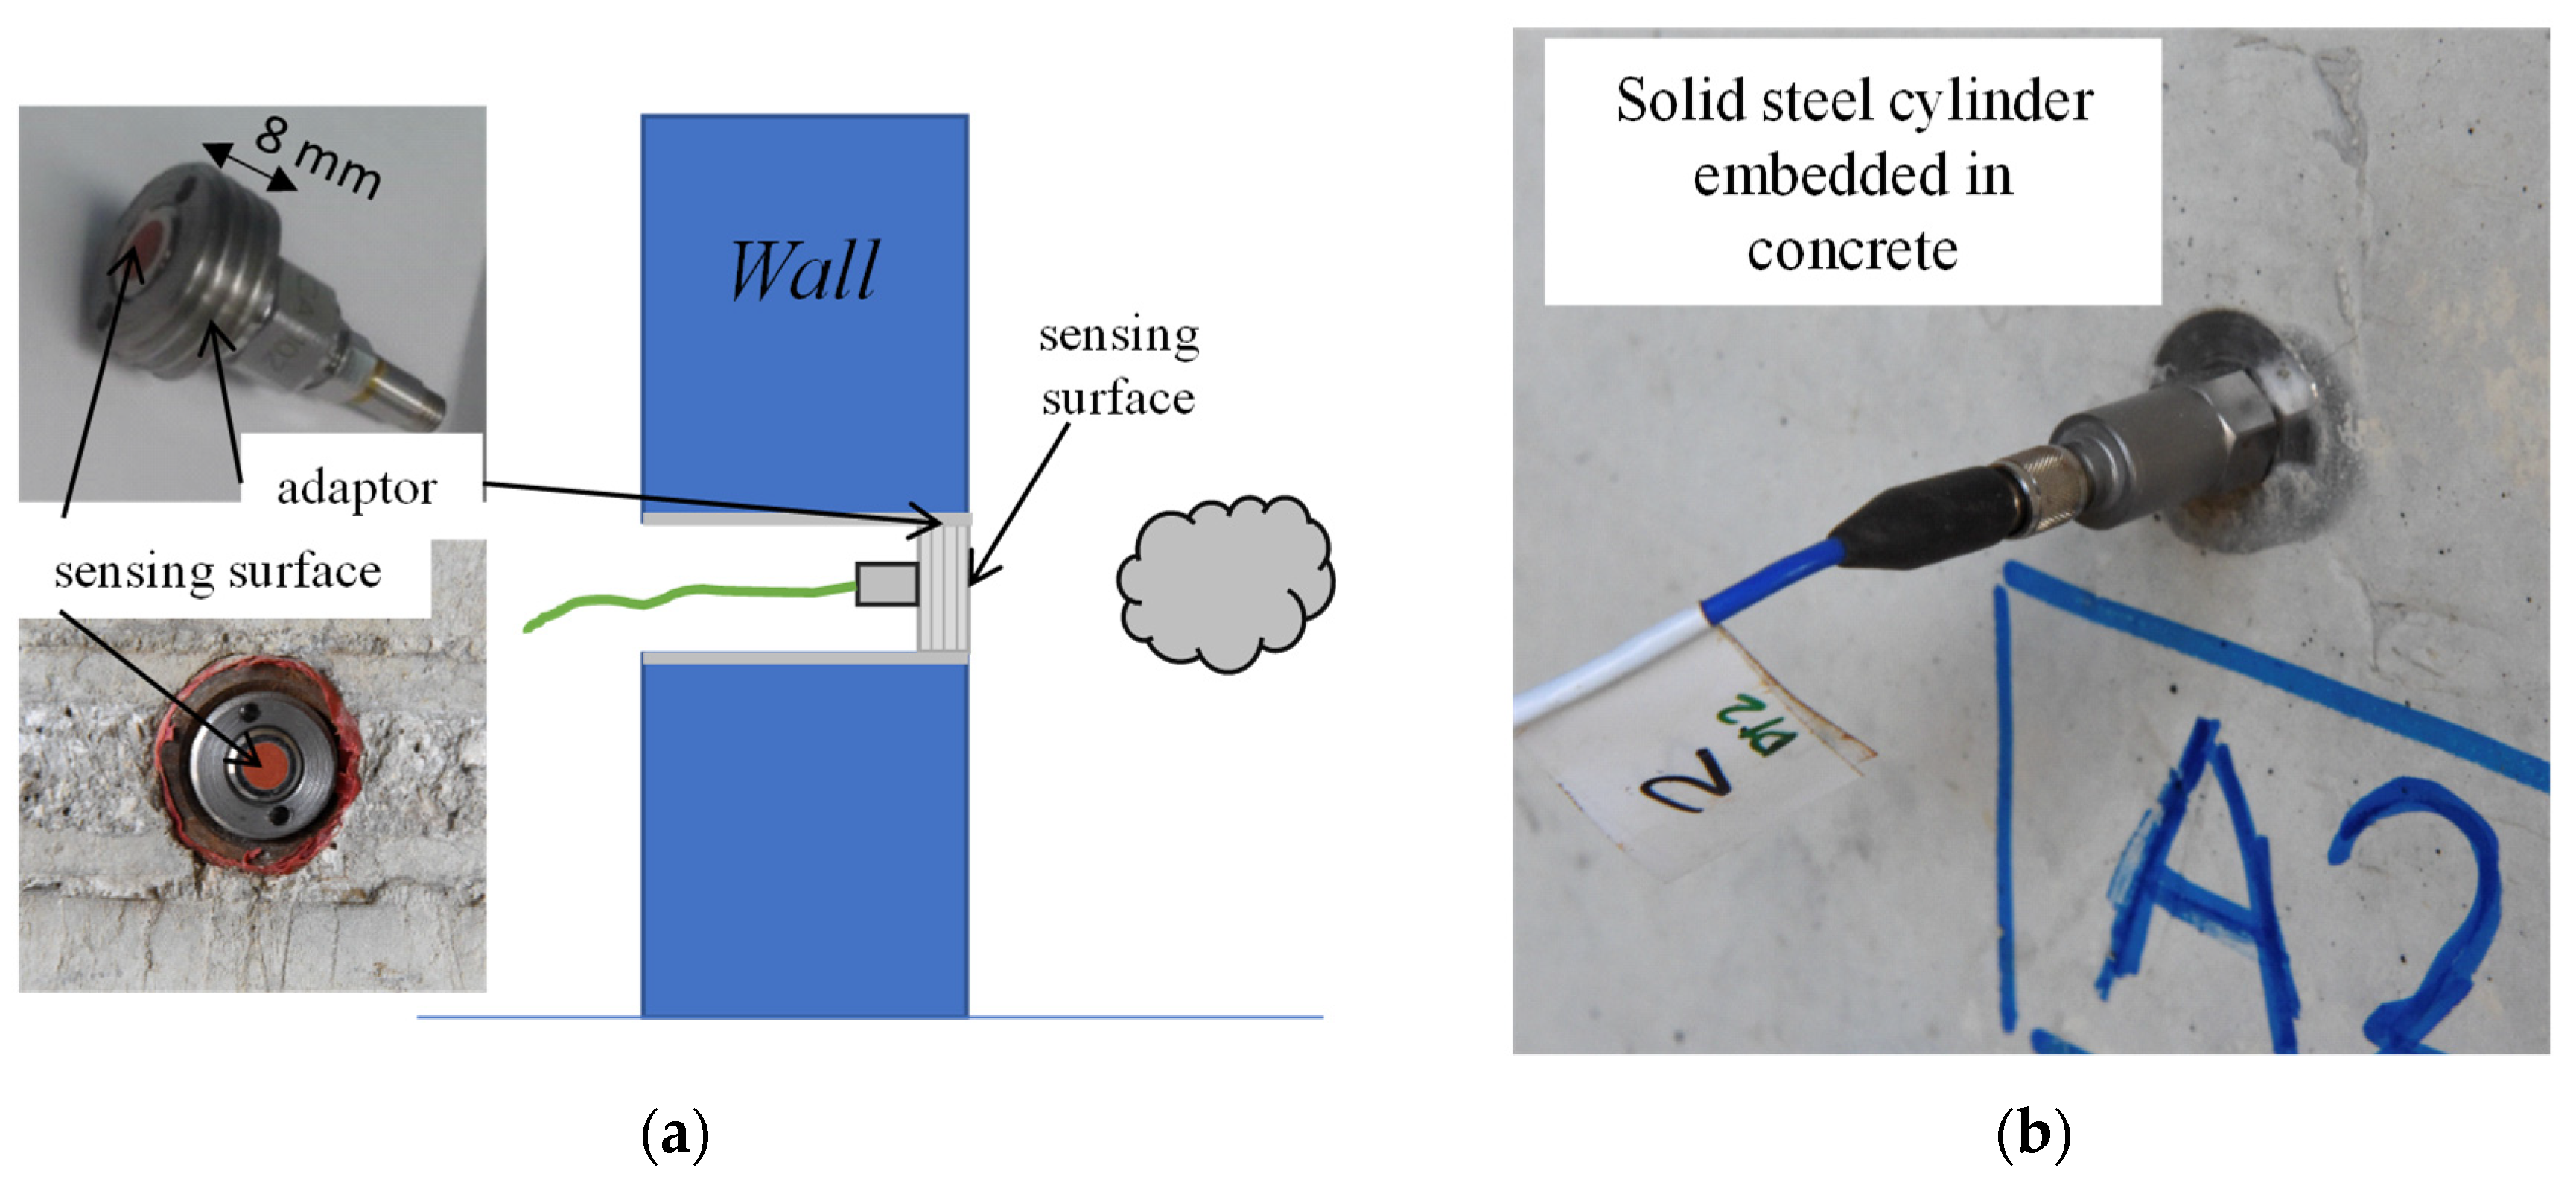
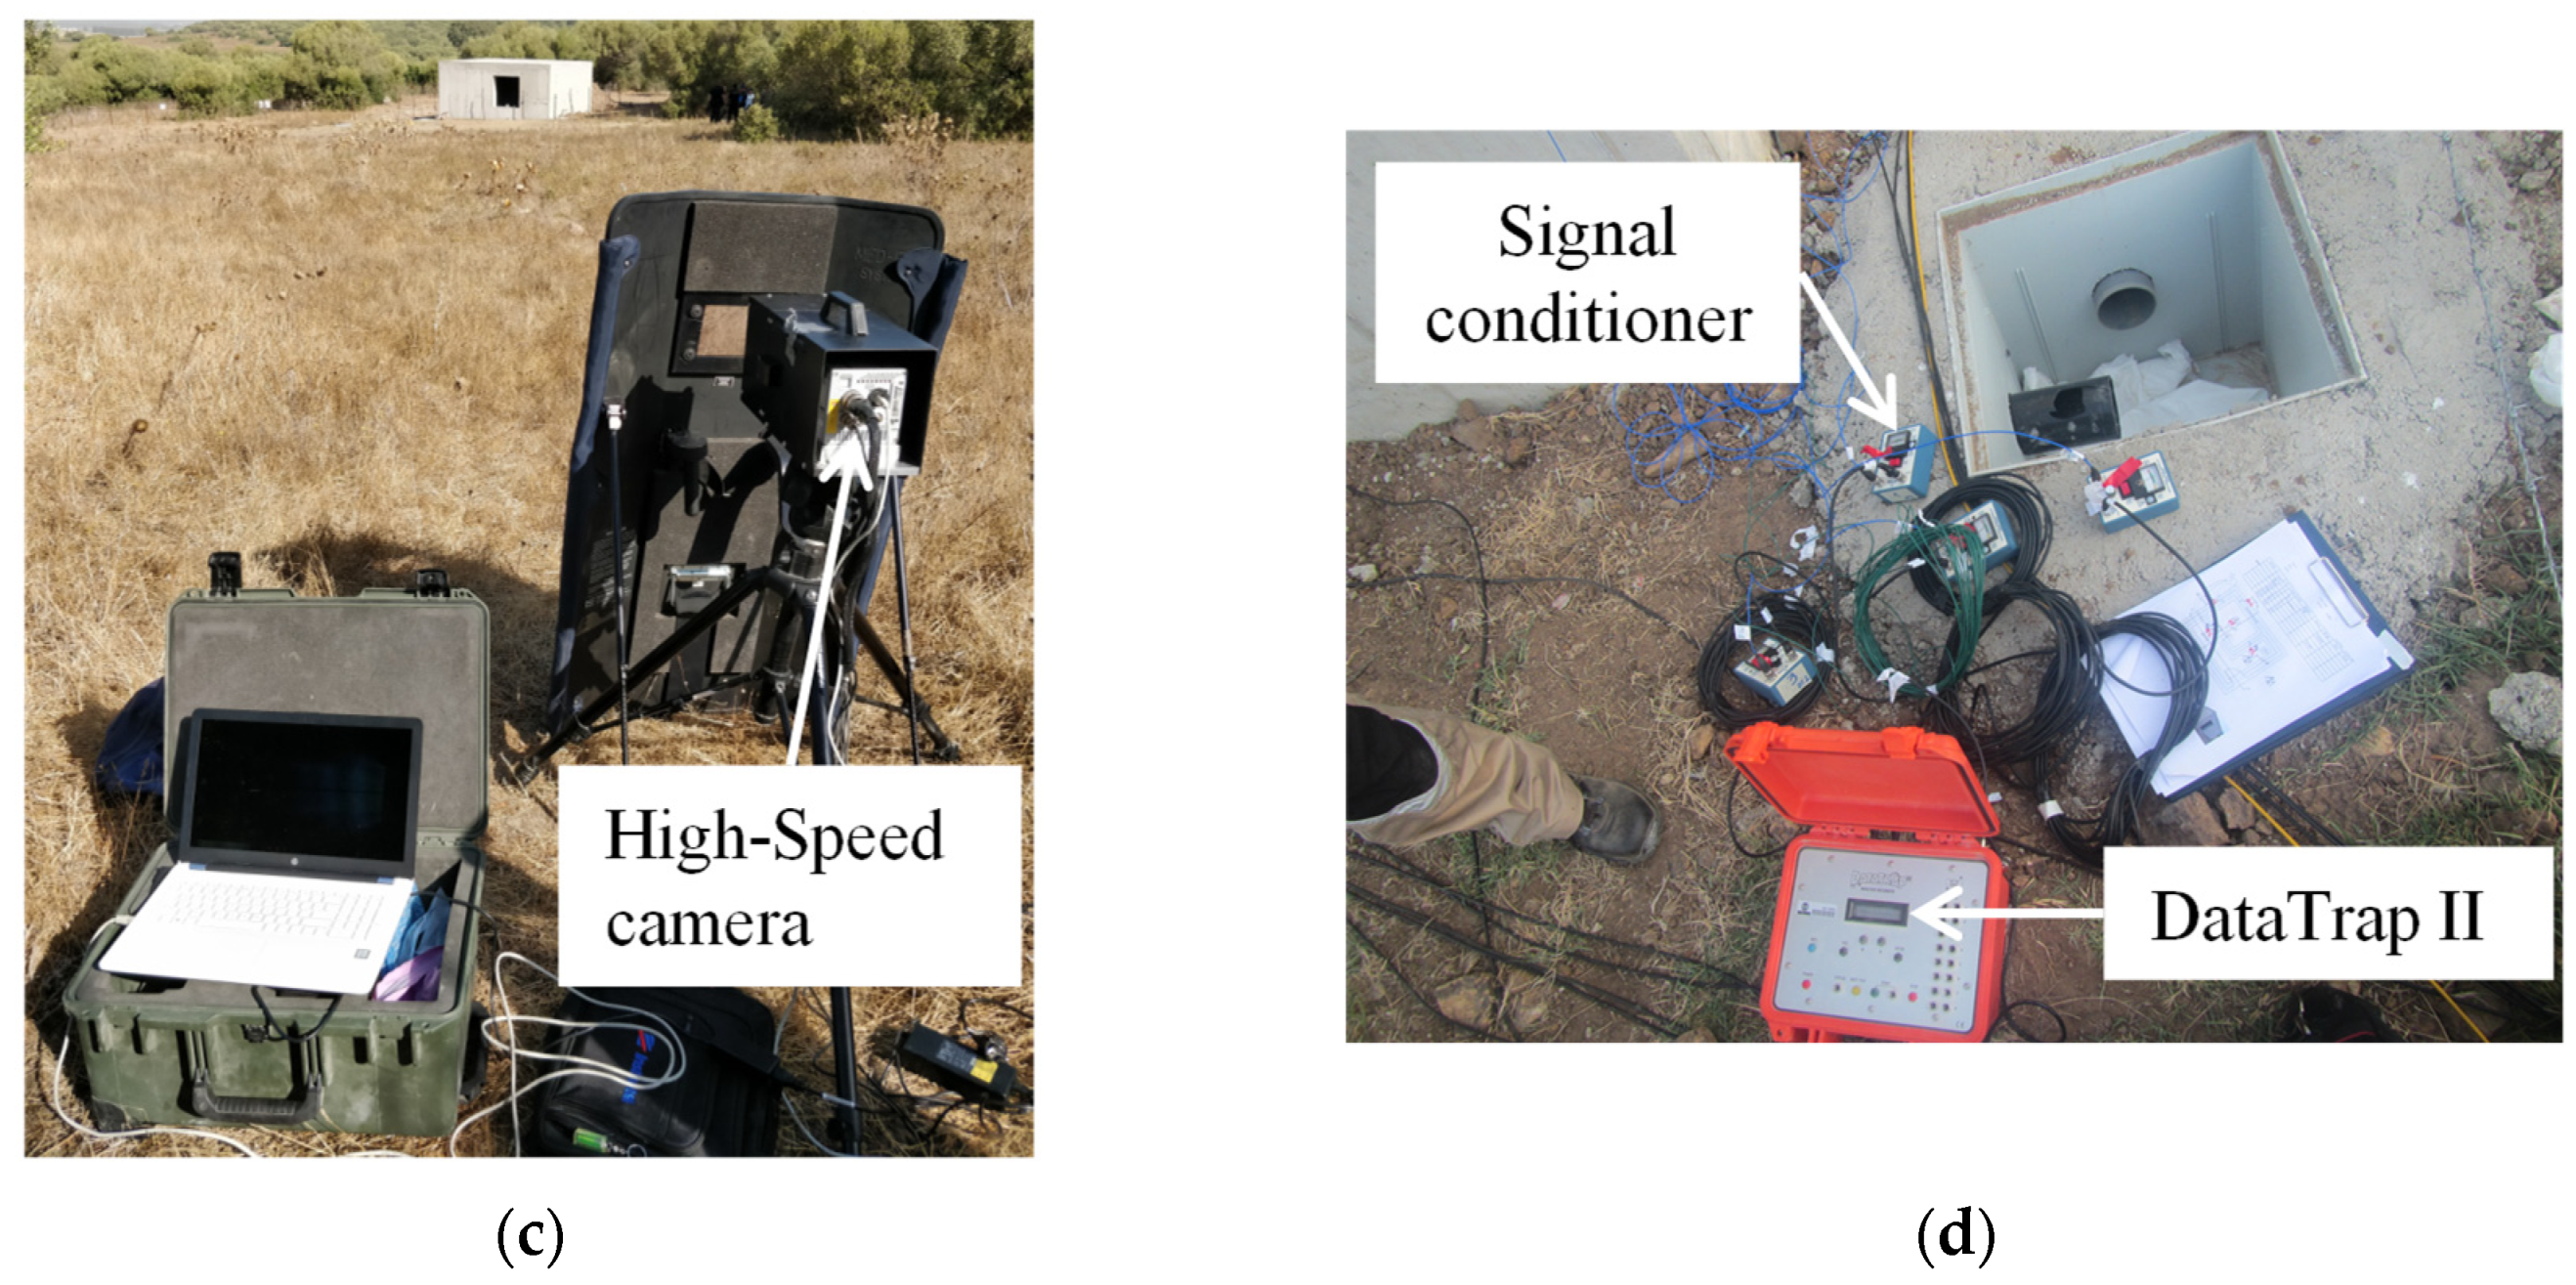
2. Test Description and Instrumentation

In this context, the German Federal Office of Criminal Investigation (namely BKA), which is part of the Federal Ministry of the Interior, started a project in 2017 on the effects of IEDs on state security forces personnel. This project consisted of numerous tests carried out in Germany, with different types of explosive charges, with and without shrapnel, and at different targets. During the project, the BKA had the collaboration of the Centre of Excellence against Improvised Explosive Devices (C-IED COE), a member of the NATO Centre of Excellence community, to advise on the creation of the IEDs.
The last phase of testing consisted of creating a reinforced concrete structure that reproduces a possible location where terrorists prepare their material and detonate them before counter-terrorism police can get in and arrest them. This phase was carried out at the Sierra del Retín maneuvering and firing range, Barbate, Cádiz, from 18 to 20 September 2018. The concrete structure was designed by the “Subdirección General de Proyectos y Obras—DIGENIN” (part of the Spanish Ministry of Defense), while the instrumentation, measurements and modeling were carried out by the staff of the E.T.S.I. Minas y Energía (Universidad Politécnica de Madrid—UPM). Finally, the explosive charges and their detonations were prepared by the Explosive Ordnance Disposal Section (SEDEX) of the Amphibious Mobility Group (GRUMA) of the Third Army (TEAR)—Marines in collaboration with personnel from NATO’s Counter Improvised Explosive Devices Centre of Excellence (C-IED COE).
The structure built ad hoc for the tests was made of reinforced concrete and consisted of a perimeter corridor and an interior room in which the IEDs were placed. The design of the structure was based on the project requirements suggested by the BKA. The original idea was to have brick enclosures, but these were going to be destroyed after each trial making the project unfeasible in terms of time and money. For this reason, the structure was redesigned with reinforced concrete walls, with greater thicknesses in the exterior walls than in the interior walls. Doors and windows were also aligned to improve the venting of the shock wave. CYPECAD code was used for the design, and it was developed under the Spanish Technical Building Code (CTE) based on Eurocodes required by the European Union. The ground plan dimensions of the structure are shown in Figure 1, with the height between the floor and ceiling of the structure equal to 3 m. The outer walls were built with a thickness of 40 cm while the inner walls were 30 cm thick and the roof slab 25 cm. The concrete used for both the walls and the roof slab had a nominal compressive strength of 40 MPa, a density equal to 2300 kg/m3, a tensile strength of 3.5 MPa, an elastic modulus equal to 30.9 GPa and a 20 mm maximum aggregate size. The reinforcement of the structure, made of B-500 C corrugated steel, was equally distributed on both sides of the walls and the roof slab in both directions (vertical and horizontal). The vertical reinforced steel of outer walls was constructed with a 12 mm diameter rebar evenly spaced at 300 mm, while in the inner walls, the diameter of the rebar used was 10 mm spaced at 200 mm. The horizontal steel of the outer walls had a diameter equal to 8 mm spaced at 150 mm; although in the inner walls the diameter used was the same, the spacing was increased to 200 mm. The reinforcement of the roof was made symmetrically on both sides, the inside of the cubicle where the detonation was located and the outside, using 12 mm diameter rebars with a square mesh of 150 mm on each side. In height, both reinforcements were 180 mm apart, with the thickness of the slab equal to 250 mm; therefore, a sufficient concrete layer was ensured on both sides. Finally, there was a perimeter reinforcement in all the joints between the walls and the roof, with 16 mm diameter rebars separated in height by 160 mm. The steel was assumed to have a density of 7850 kg/m3, Young’s modulus equal to 200 GPa, yield strength of 500 MPa, Poisson’s ratio of 0.3 and tangent modulus of 20 GPa, following the EN 1992-1-1:2004 [26] and EN 1998-2:2:2005 [27]. Finally, the floor of the structure was covered with a concrete-reinforced layer with a steel mesh of #15 × 15 × 6 of 15 cm thick.
Eight tests were carried out (Table 1), and a previous (test) shot was performed to verify the operation of the measurement and recording equipment deployed in the area. The explosives used in the tests were black powder, ANFO, AN/AL and PG-2 (like the US C-4). The black powder used has a composition of potassium nitrate (75%), sulfur (10%) and carbon (15%) and is always granulated and graphitized, with particle sizes ranging from 0.1 to 4 mm. ANFO (ammonium nitrate and fuel oil) is the stoichiometric mixture of ammonium nitrate and fuel oil. AN/AL consists of a mixture of ammonium nitrate and aluminum powder. Finally, PG-2 is a military explosive whose composition is mainly RDX embedded in plastic additives.
The IEDs created for these trials were attached to different types of personal vests and in some cases were confined to steel tubes. The design of the explosive charges used in each test was based on the quantities of each of the explosives that can be included in a typical suicide vest configuration: in the case of tests T1 to T6 (black powder, ANFO and AN/AL), explosives inside steel tubes, and in the case of tests T7 and T8 (plastic explosive—PG2), packages directly attached to the inside of the vest. In all vest and tube tests (tests T1 to T6), 0.7 m of 15 g/m detonating cord was used to initiate the main charge. Instead, 3.7 m of detonating cord was used in tests where the explosive was directly stuck to the vest (without tubes—T7 and T8). Note that the explosive mass in test T8 is higher than the PG2 equivalent as the remaining charges were included.
The instrumentation of the tests consisted of accelerometers, pressure sensors, recording equipment and a high-speed camera. Figure 1 shows the location of the pressure sensors (P1 and P2), the accelerometers (A1–A5) and the two pieces of recording equipment used (DT1 and DT2).
The two pressure sensors used were 5000 PSI (344.7 MPa) PCB model 102B with ablative protection for the fireball. The sensors were placed with a passing tube on the concrete wall so that the sensing surface was normal to the main direction of the impact. In this way, the first wave registered would be the one reflected by the wall where the sensor is located. These sensors were at a height of 1.51 m and 1.55 m in the case of P1 and P2, respectively. Piezoelectric shock PCB accelerometers located on the opposite side of the wall from the explosive charge of 5000 or 10,000 g measurement limit were used (Table 2). In the accelerometer position called A1, one sensor was used for tests T0 to T4 and a different one for the last three tests (T5 to T7), due to the breakage of the sensor during the T4 test. No measuring equipment was used in the last test (T8) for fear of complete destruction of the structure or, at least, of compromising its structural stability. Note that the sensor located at position A5 was placed on the roof of the structure on the outside of the structure (Figure 1). Two Datatrap II recorders from MREL were used for data acquisition. This system has up to eight recording channels, with a sampling rate in each channel of 10 MHz with a resolution of 14 bits. It is a portable and very robust piece of equipment prepared to work outdoors, in dust, rain and a wide range of temperatures. Figure 1 shows the location of the data acquisition equipment, inside interconnected chambers (catch basin). Signal conditioners PCB 480E09 were used, necessary to feed and condition both the pressure sensors and the accelerometers. See Figure 2 for more details of the measuring equipment and positions.
Finally, the high-speed camera (CAV) used was a Photron Fastcam SA3-120k, adapted for explosion testing with a steel case. It reaches a recording speed of 5000 images per second for a resolution of 512 × 512 pixels, reaching up to 120,000 fps for a resolution of 128 × 16 pixels.

3. Numerical Model

The 3D numerical models were made using the LS-DYNA Version 971-R11 software [28], which is based on explicit numerical methods that are suitable for solving problems associated with large deformations subjected to blasting. The destructive effect of these kinds of blast tests, along with the fast structures’ reaction and short duration of the explosive event, makes the detailed study of these events very complex.

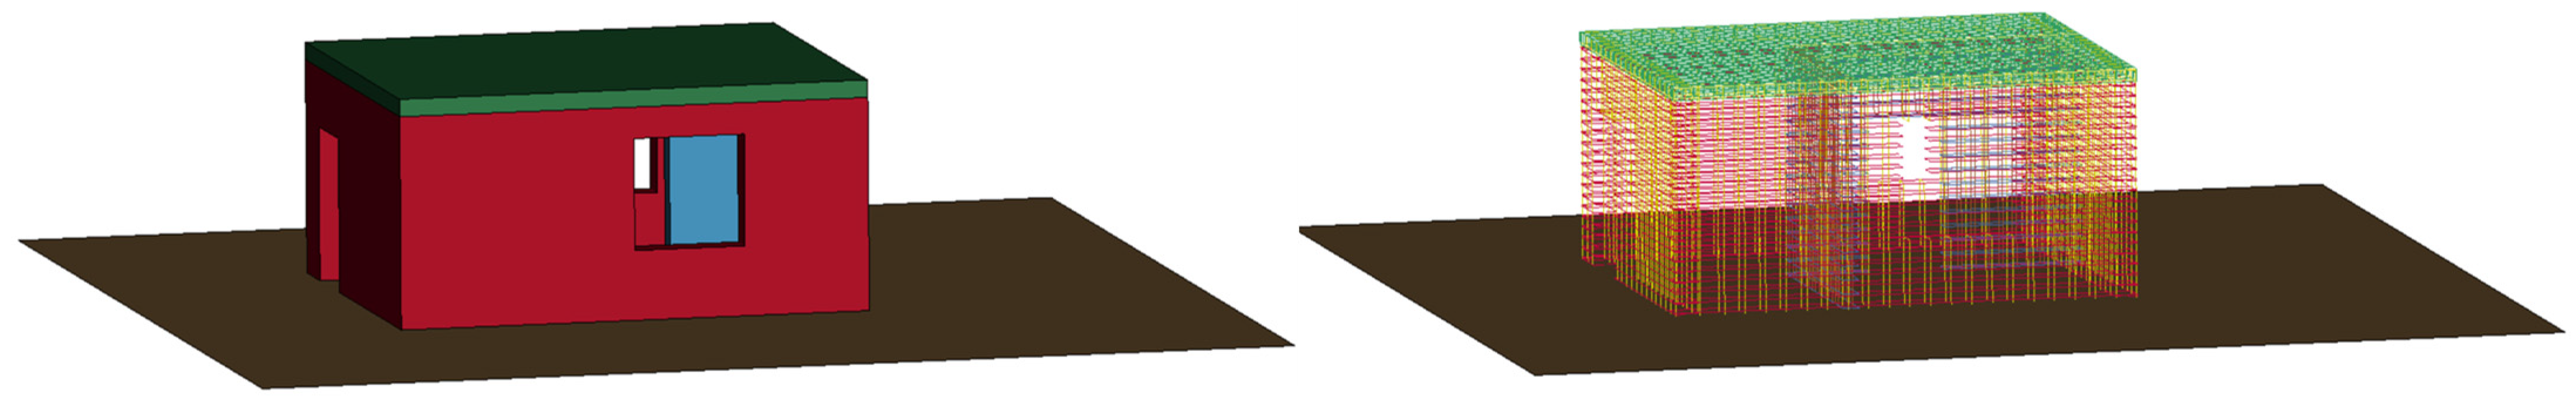
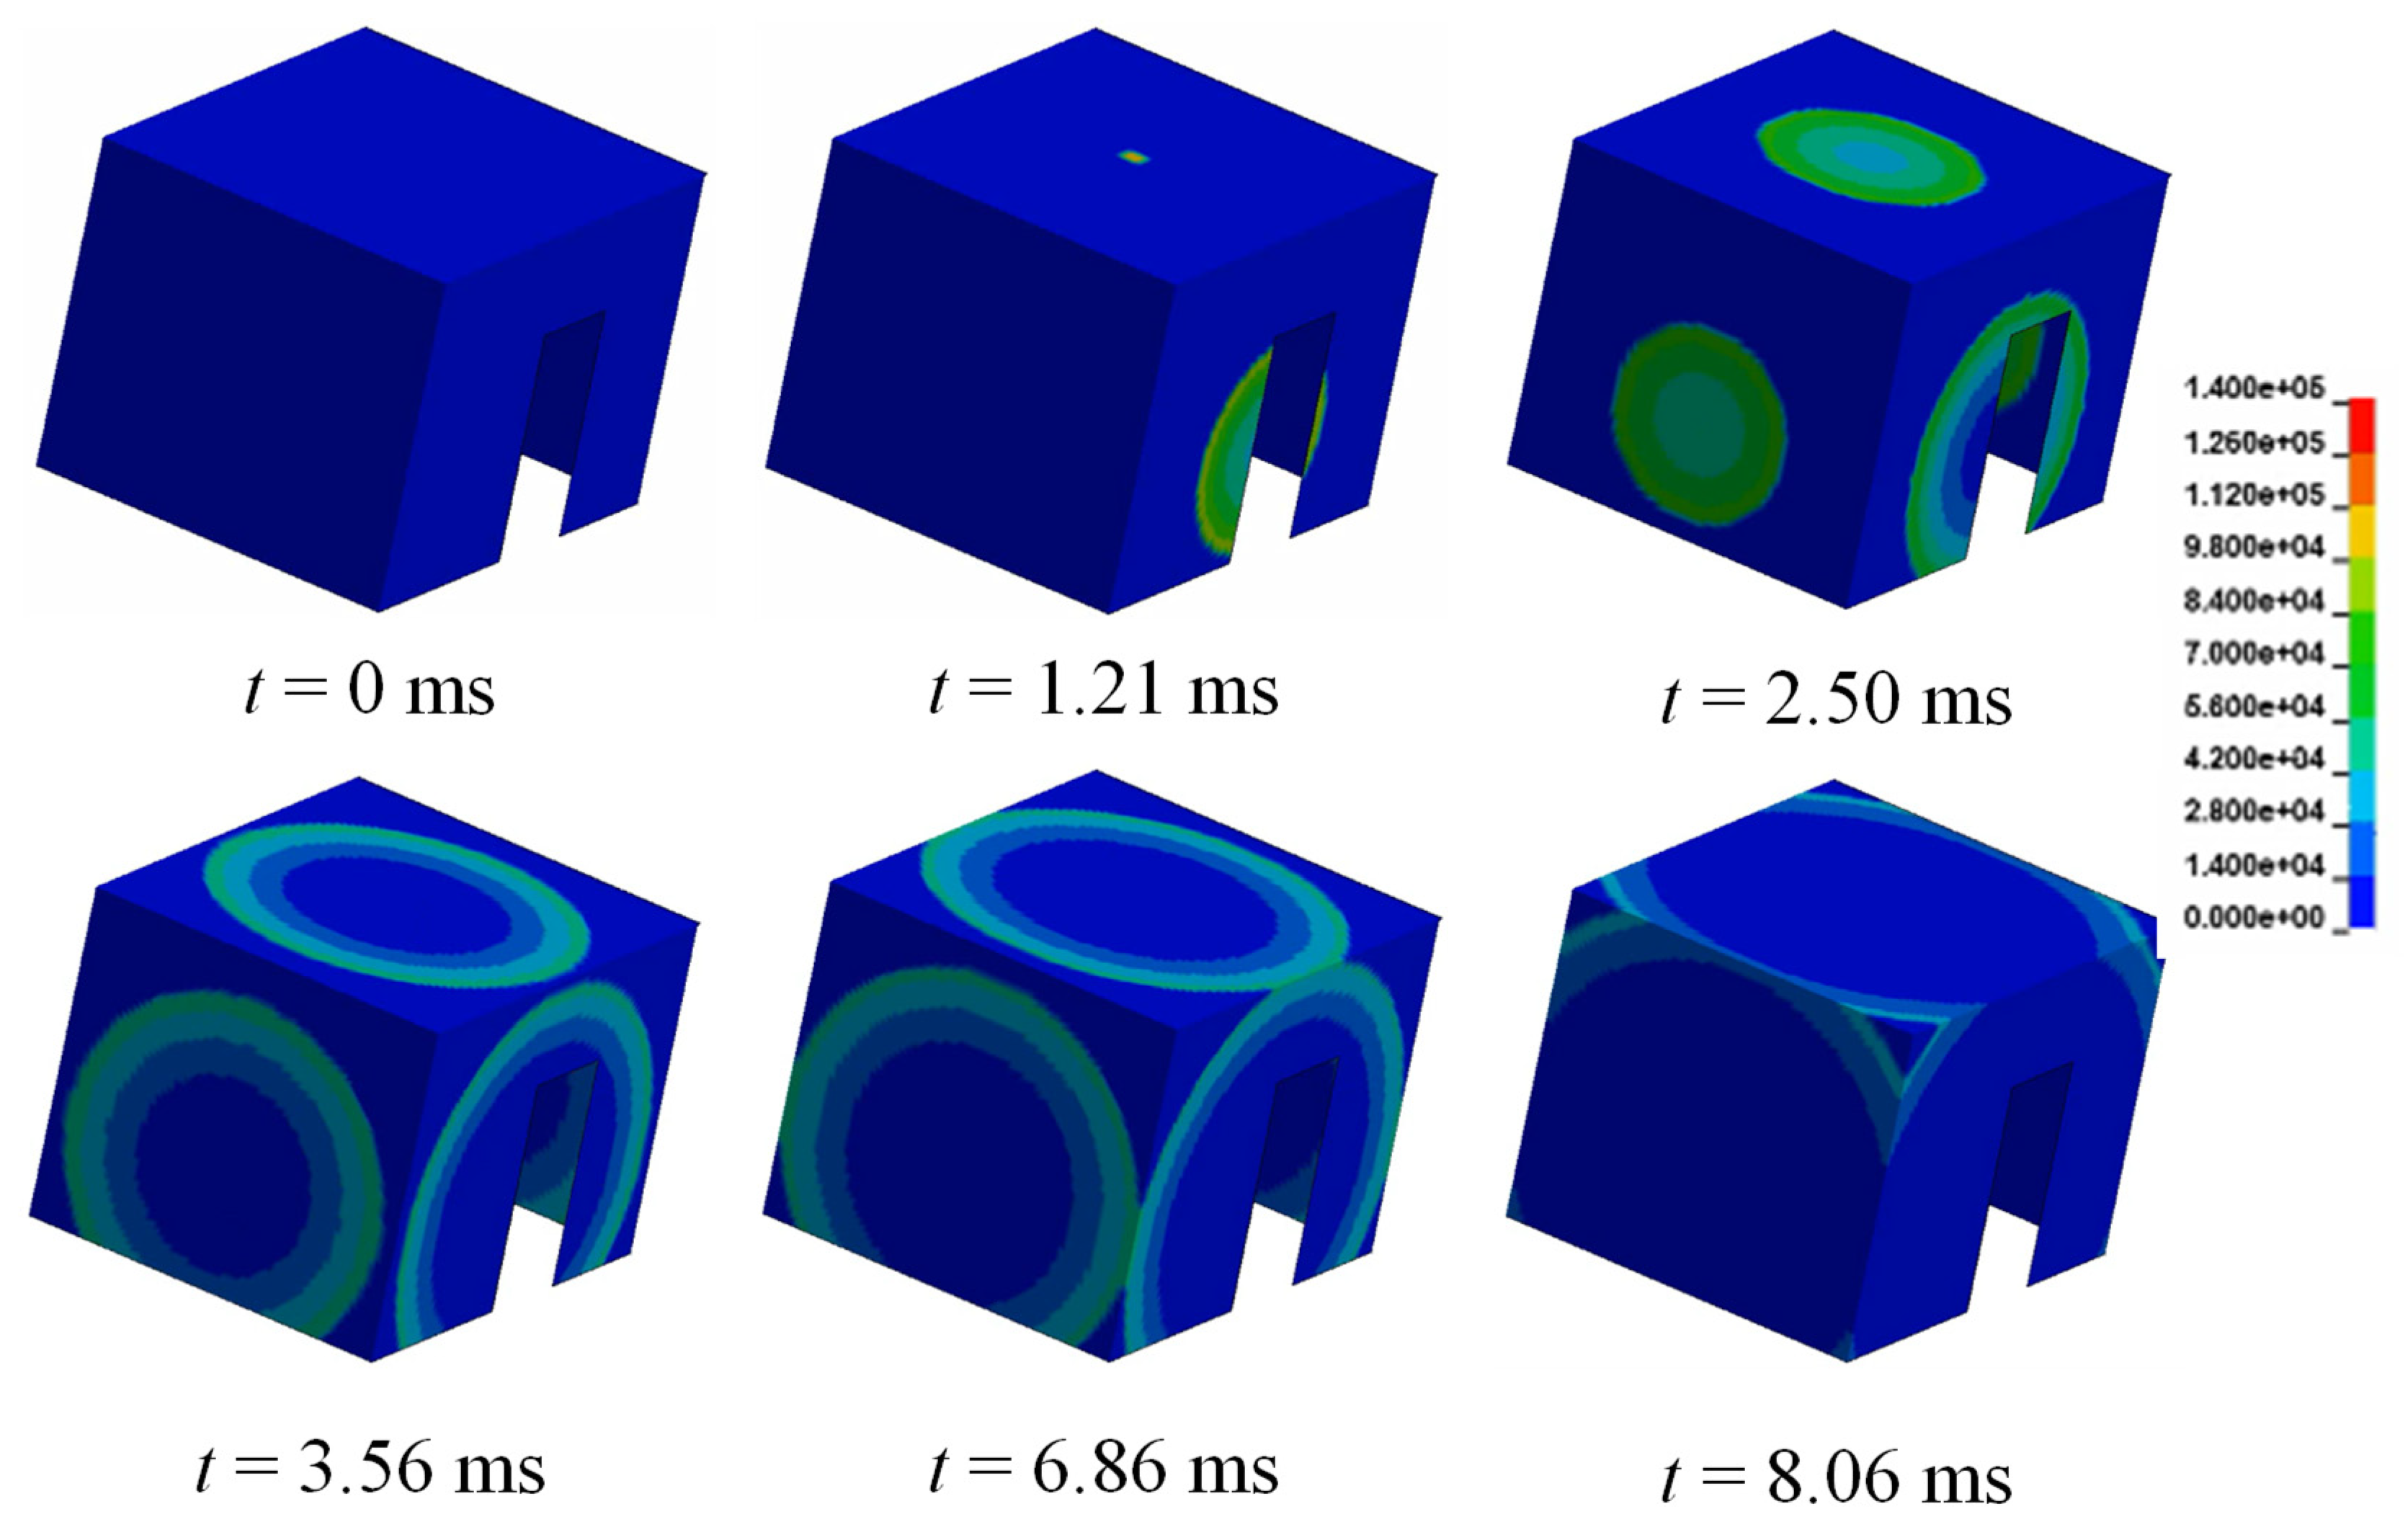
3.1. Finite Element Model

This model was made of two main critical parts: concrete and steel rebar. In addition, the ground was also introduced into the model but only for visualization purposes (Figure 3). The functionality of “Constrained Lagrange in Solid” was used for the correct operation of both materials as a single assembly. This option can be used as the interaction between parts (steel and concrete) can be presumed to be ideal as the event is almost instantaneous [29,30]. Moreover, the structure was fixed into the ground by using the single point constraint (SPC), canceling displacements and rotations in all directions of space.
The concrete was defined with 3D Lagrangian solid elements with reduced integration to decrease the computational time. The element size used for the concrete was 20 mm, based on previous studies of the concrete blasting response under similar conditions and charges [30,31,32]. The reinforcement was modeled using beam-type elements with a size of 50 mm in length. The number of solids elements was 5,150,187 while the number of beams was 64,266.
To solve the model, LS-DYNA offers two parallel programming methods: symmetric multi-processing (SMP) and massively parallel processing (MPP). SMP runs on a computer with multiple identical cores with the cores and memory connected via a shared data bus, being scalable up to 8 CPUs. MPP uses various separate CPUs running in parallel, each with its own memory to execute a single analysis, performing a domain decomposition of the problem and then distributing the sub-domains to different cores. This solver is scalable over a wide range of CPUs. Although the MPP method allows a reduction in computation time, the size of the model, the lack of symmetries and the complexity of the problem to be solved are considerable. The simulation time was lengthened to 2.5 s, which in SMP resulted in 306 h and 53 min, while in MPP, this time can be reduced to 151 h and 25 min. The computer used for these simulations has two Intel XEON E5-2630 v4 processors at 2.20 GHz (10 cores each, 2 threads per core), with 64 GB of RAM and a Windows 10 operating system.
Moreover, dynamic relaxation (DR) was included in the model. DR is the recommended way to preload a model before the application of dynamic loads in the subsequent transient analysis. This technique makes it possible to achieve a steady-state preload condition free of dynamic oscillations (or nearly free). It is important in cases like this work to apply gravity before the transient analysis (detonation) to avoid an unstressed state at the beginning of the analysis. If the gravitational load is suddenly applied, dynamic oscillations could be enhanced that would invalidate the utility of any calculation. The application of gravity is performed by the Load Body command (see [28] for more details). In this command, a first curve is defined for the quasi-static analysis (dynamic relaxation) of gravity. For this purpose, a curve is created where the acceleration rises linearly from zero to the constant value (gravity) for a short period of time and then remains constant. Then, a second curve of constant value (gravity) is created which will be used for the rest of the simulation time. The Control Dynamic Relaxation card is also used but with the LS-DYNA default values.
Acceleration in LS-DYNA can be measured with the use of sensors at certain coordinates [28]. The processing of these data is sometimes complex and does not usually work well when the blast processing is performed with tabulated values such as the Load_Blast_Enhanced command. Another alternative is using the *Database_History_Node command to explicitly track the history of features of that node (i.e., acceleration, velocity, displacement, etc.). A shorter time interval between acceleration data in those nodes (i.e., 1 × 10⁻⁶ s) than the normal one determined between drawings (0.01 s on the D3Plot card) can be used which improves performance, computation time and hard disk space occupied.

3.2. Blast Implementation

Explosive charge implementation can be handled from two different approaches: using the parameters of the explosive material and its equation of state [17]; or by using a TNT equivalent for the load and its implementation with the load blast enhanced (LBE) function. This last option is usually simpler to implement, as well as computationally faster, producing very good results [33,34,35].
As for the application of the load, the LBE was used here, which is the way LS-DYNA introduces the CONWEP [36]. This can be used assuming that the steel tubes would have a potentially lethal effect on people but are quite harmless to the structure. With the LBE instructions, the necessary input parameters to calculate and apply the generated pressure (incident and reflected) on the concrete elements are the type of shock wave, the equivalent mass of TNT, the coordinates of the load center and the concrete sides where the pressure wave will be applied. The software applies the pressures following Friedlander’s equation to calculate the pressure curve, including the negative phase. It should be noted that with this methodology only the pressure peak set by the measured signal is reproduced, and it is not possible to reproduce reflections of the wave or shrapnel produced during the explosive detonation inside the tubes. In addition, the pressures were only recorded in the room where the IEDs were located. This makes that the pressures were only applied with LBE on all faces of this room (including the ceiling) and not outside of it such as the corridor.

3.3. Materials

LS-DYNA offers more than 25 models that can be used to describe the concrete, some require many input parameters while others work with reduced data, but not all of them perform well under blasting events [37,38,39].
In this research, the continuous surface cap model (CSCM) concrete was used to describe the concrete behavior. The automatic generation of parameters was based on introducing the values of the compressive strength, the aggregate maximum size (maximum) and the density. The model is plasticity based with the implementation of shear failure surfaces corresponding to the elastic limit, residual strength and failure. This model works based on an isotropic elastic behavior before cracking to move to a plastic behavior limited by the failure surfaces. This model implements an internal calculation of the damage that allows the erosion of the elements when they reach 99% of the damage limit [28,40] and the maximum principal strain in the element exceeds a value defined by the user, known as ERODE. The default value of 1.05 was used for the ERODE parameter [40]. The CSCM includes a dynamic increase factor (DIF), governed by specific data from the CEB-FIP design code using the Duvaut–Lions overstress formulation based on time rather than strain rate [41]. The material properties used in this model are shown in Table 3.
The steel used in the reinforcement was the classic B-500 S, introduced in the model as the material model “Piecewise Linear Plasticity”. In this work, the option of defining the rupture based on the effective plastic deformation was chosen, as opposed to the rupture based on the time step of the numerical model achieved by the convergence of the method. The value entered was equal to 0.075 [30], i.e., when the plastic strain reaches this value, the element is deleted from the calculation. In addition, to define the stress–strain behavior, a bilinear stress–strain curve was applied by using the tangent modulus. Moreover, the strain rate effects were included in the steel model based on the scale yield stress by using the Cowper–Symonds model (C equal to 25.36 s−1 and P equal to 2.52) [28,37,42].

4. Results and Discussion

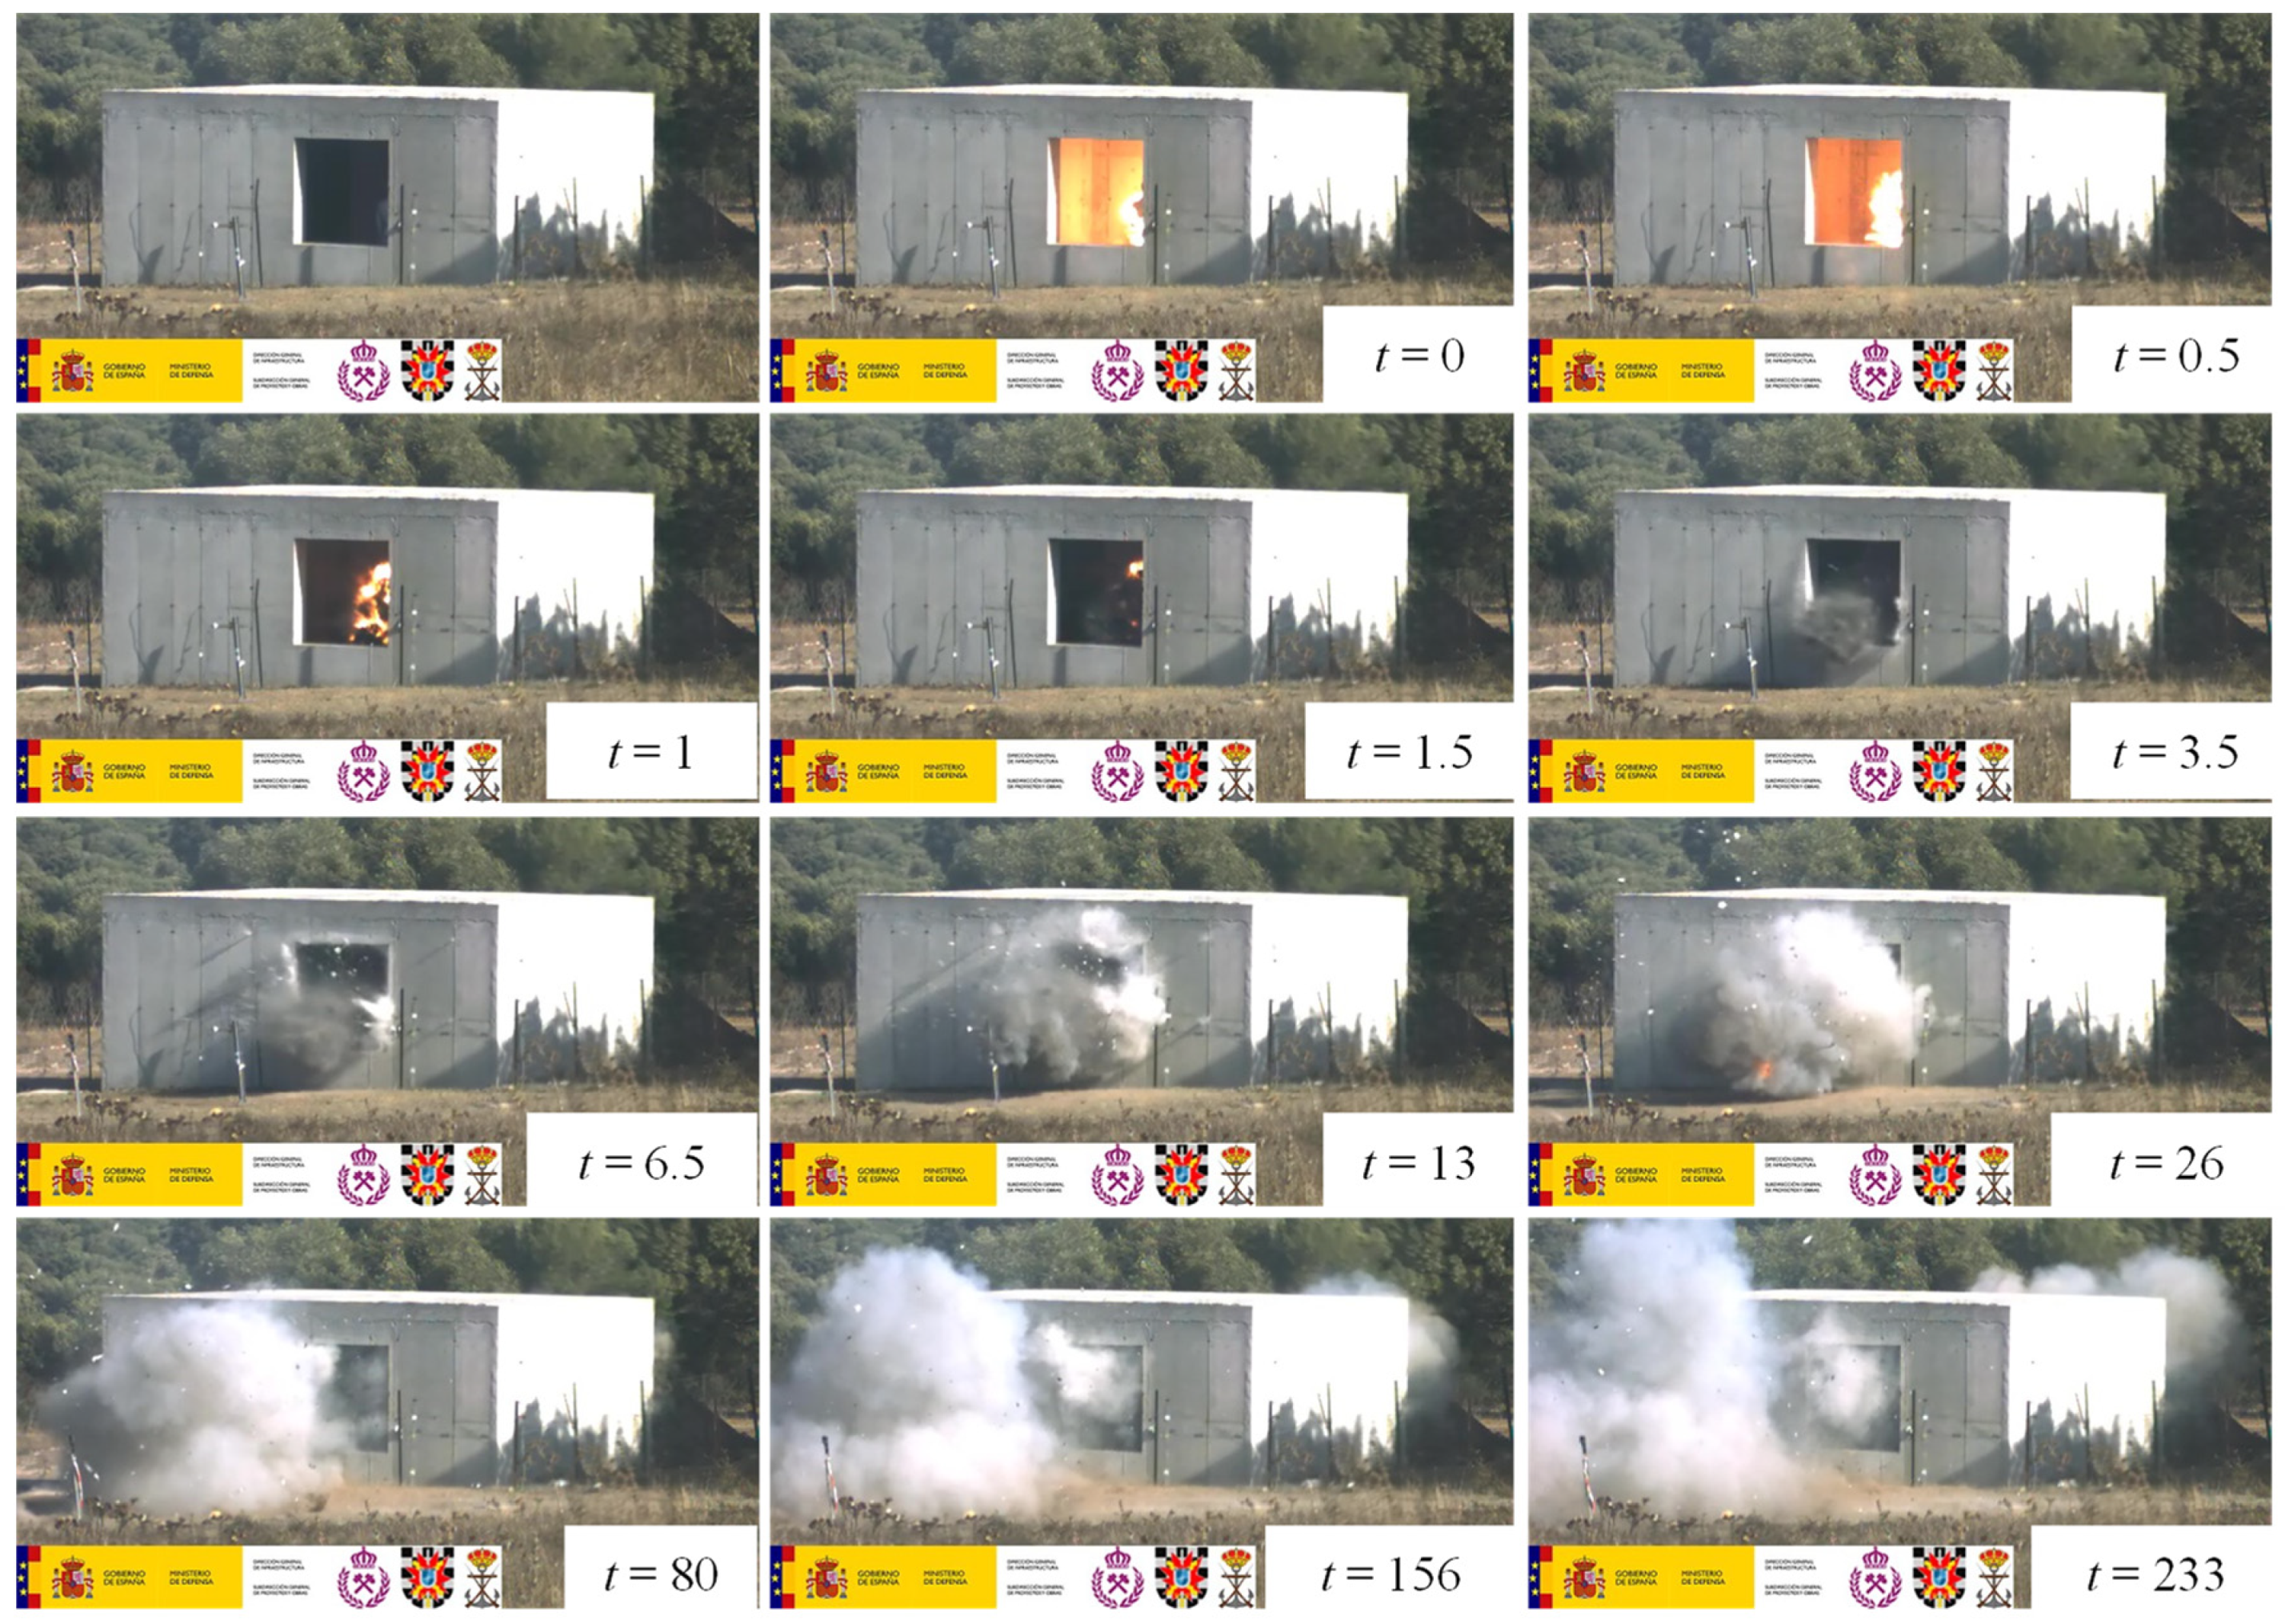
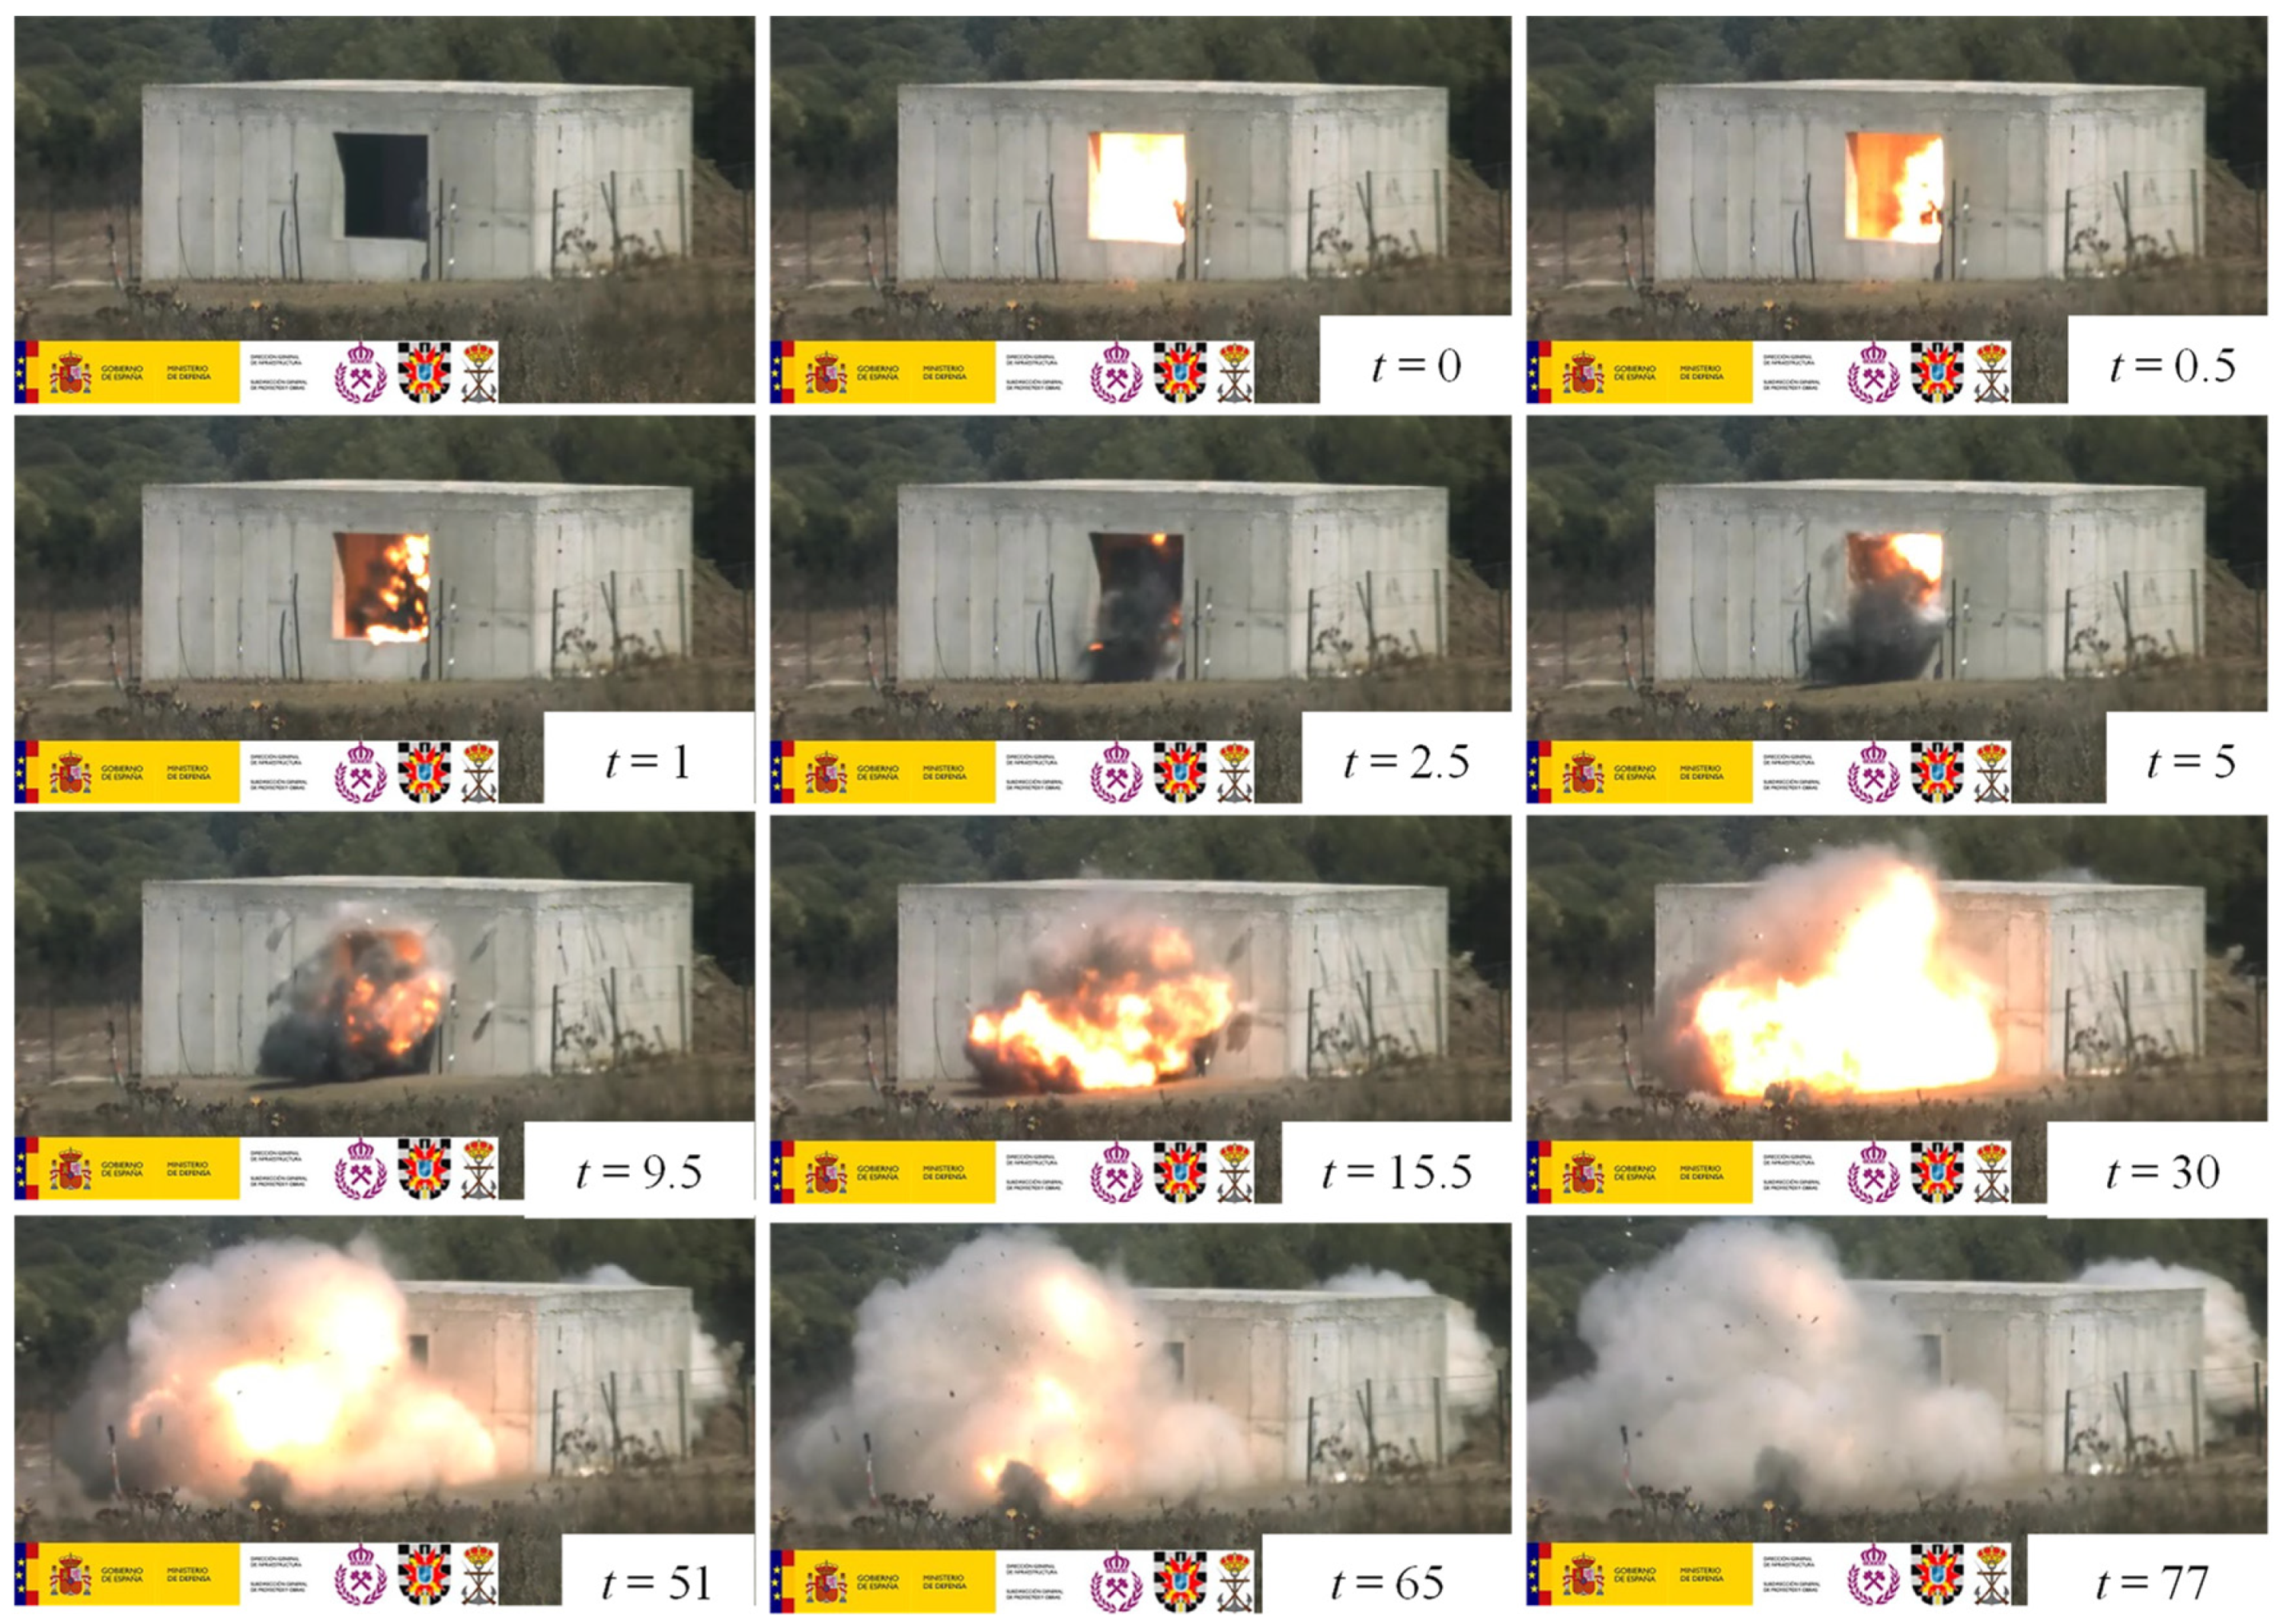
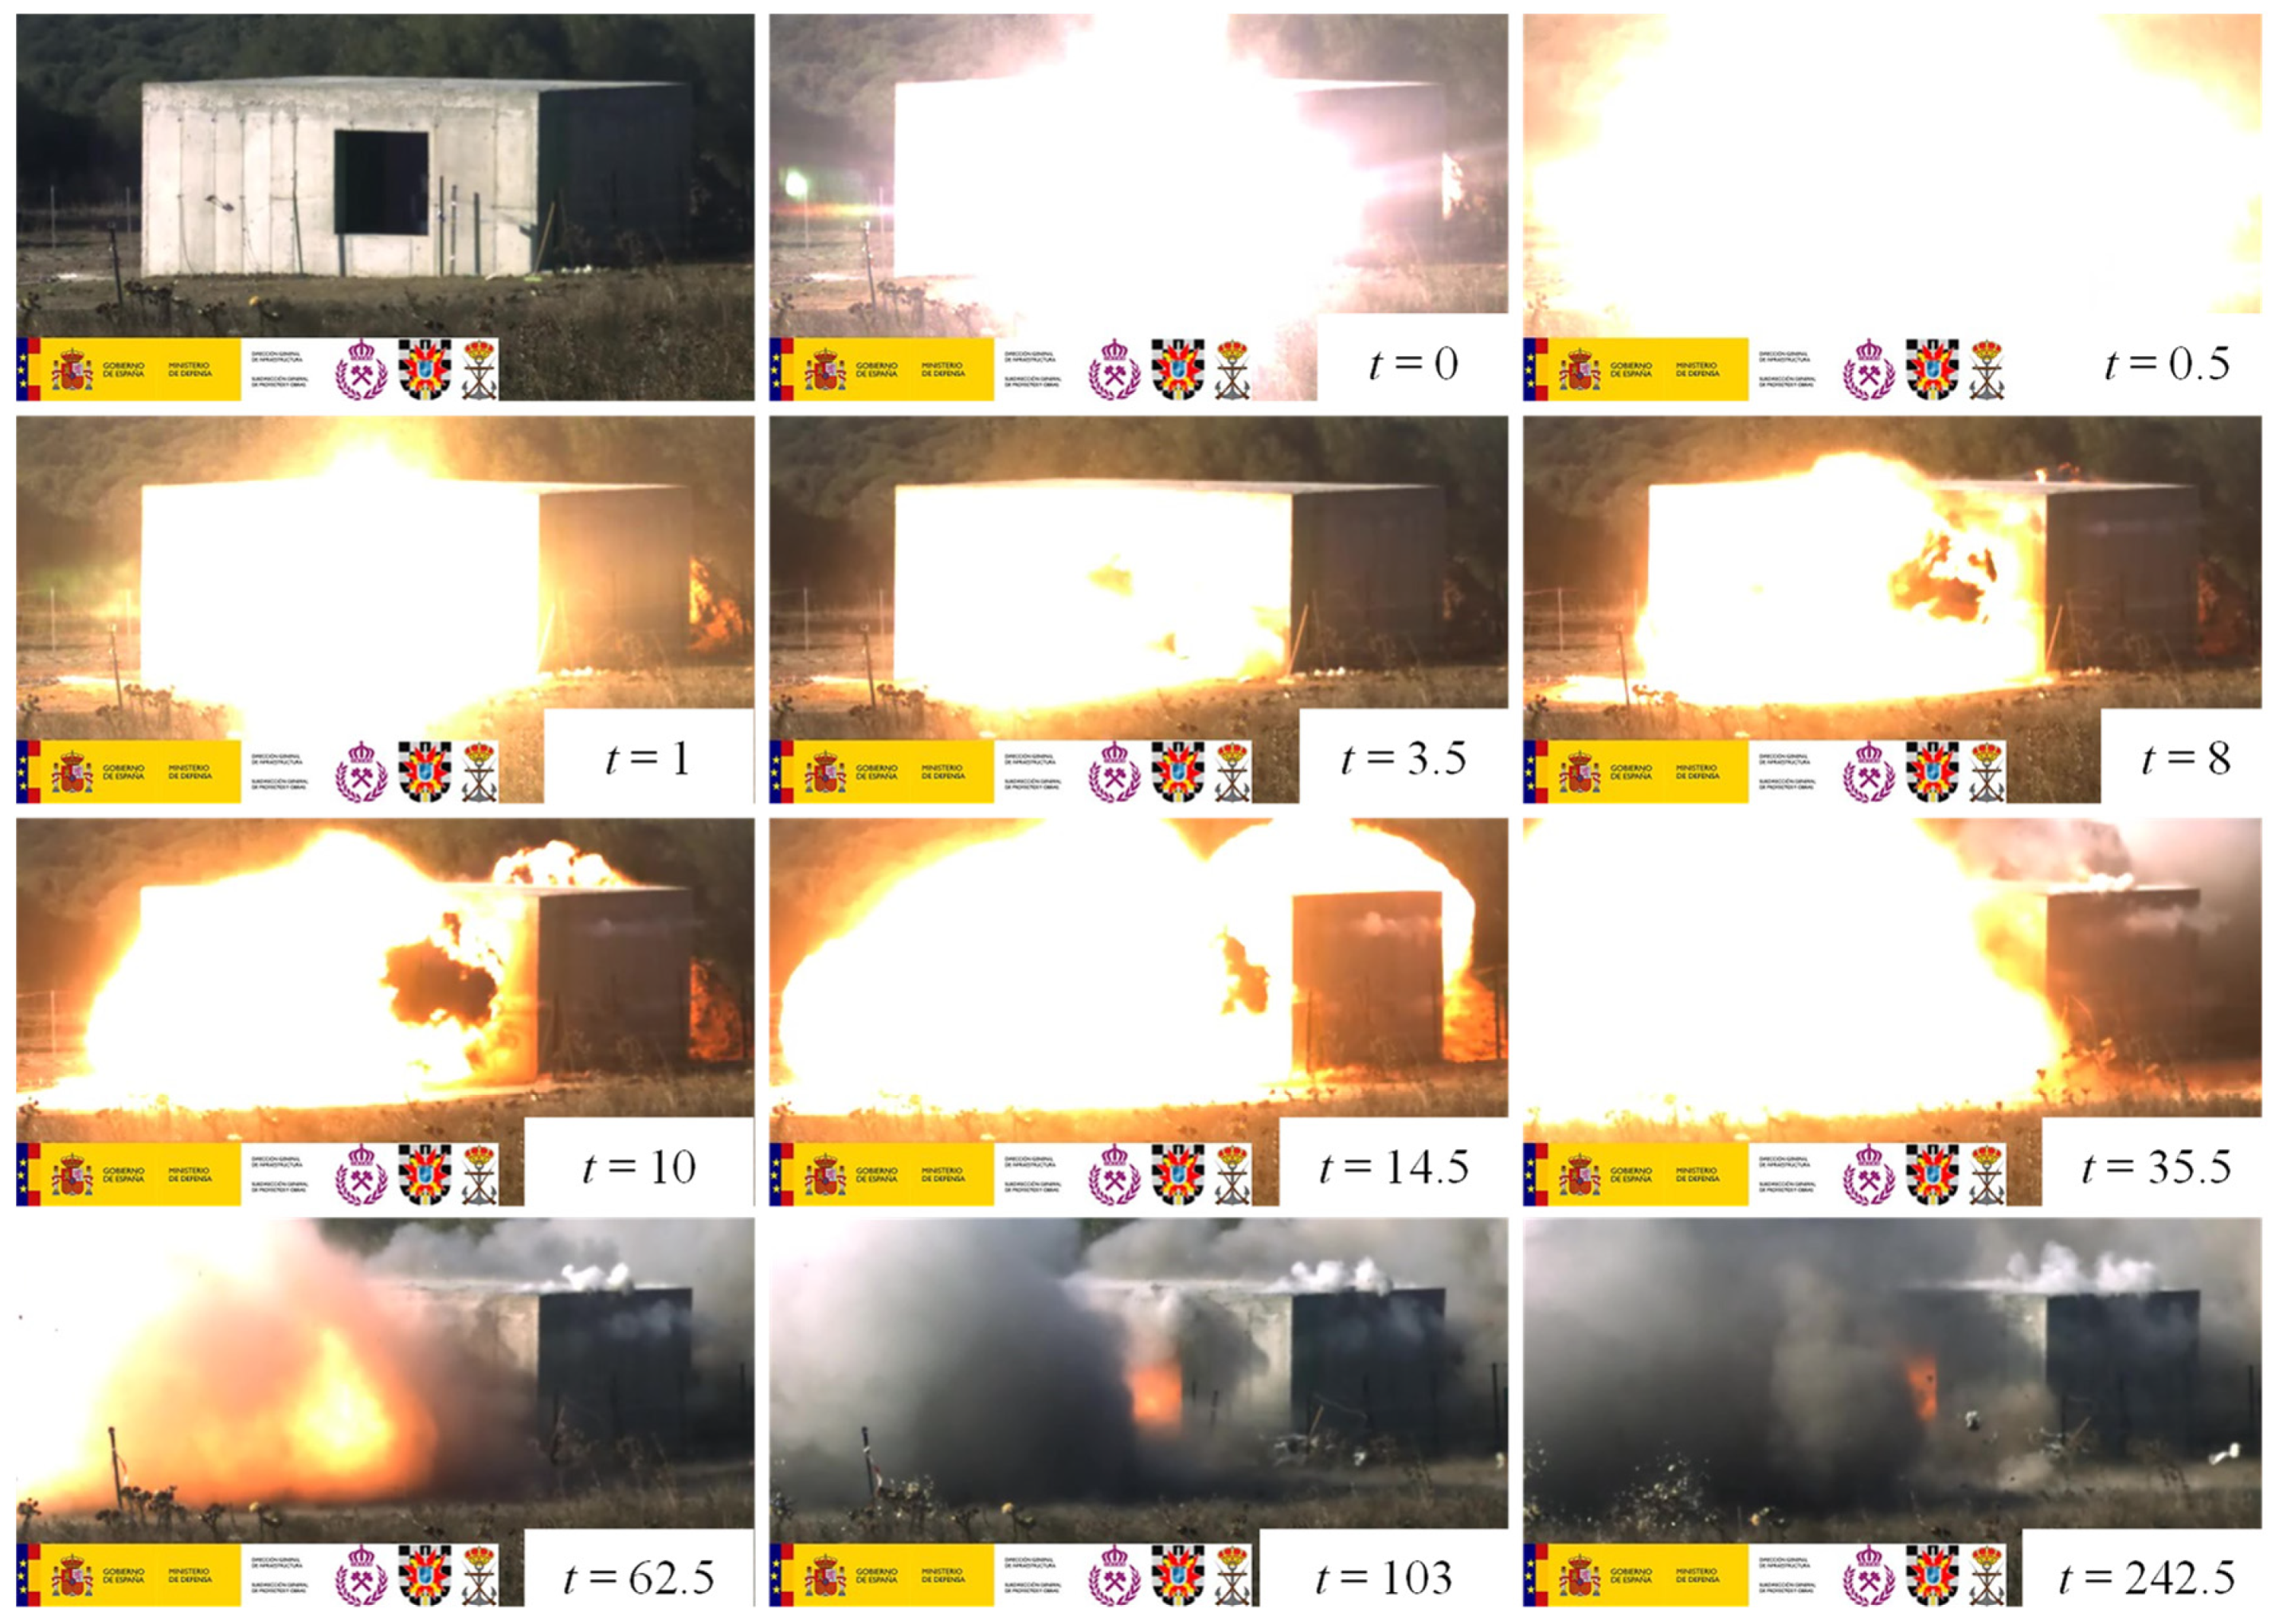
4.1. High-Speed Camera

The images were captured at a speed ranging from 3000 to 5000 fps. Figure 4 shows a sequence of images of the video obtained in the T2 test with black powder in steel tubes. It shows the extension of the fireball that reaches up about two meters outside the cubicle in the vicinity of the window. The powder generated a significant volume of gases that are expelled practically simultaneously through the two openings to the outside of the cubicle: the window directly to the charge and the window at the rear of the image connected to the main room by a door. If the images of the gunpowder test are compared with those recorded in the ANFO test (T4) shown in Figure 5, important differences are observed in terms of the extension of the fireball and the volume of gases generated. The fireball did not reach the outside in the case of the ANFO test, and the volume of gases was clearly lower. Figure 6 shows a sequence of 12 images obtained in a test with AN/AL (T6). The fireball extended considerably more than in the ANFO test due to the aluminum in its composition.
Figure 7 shows a similar sequence of images for test T7 in which a vest without steel tubes was fired with 7 kg of PG2 plastic explosive. The extension of the fireball reaches the facade completely on both the front and rear faces of the cubicle. The first images just after the start of the detonation show a large white glow indicating very high temperatures. The escape of gases that comes at the same time as the fireball takes place through the openings mentioned above (windows) and gas escape can be seen in the upper part of the cubicle, probably due to the displacement of the upper slab.

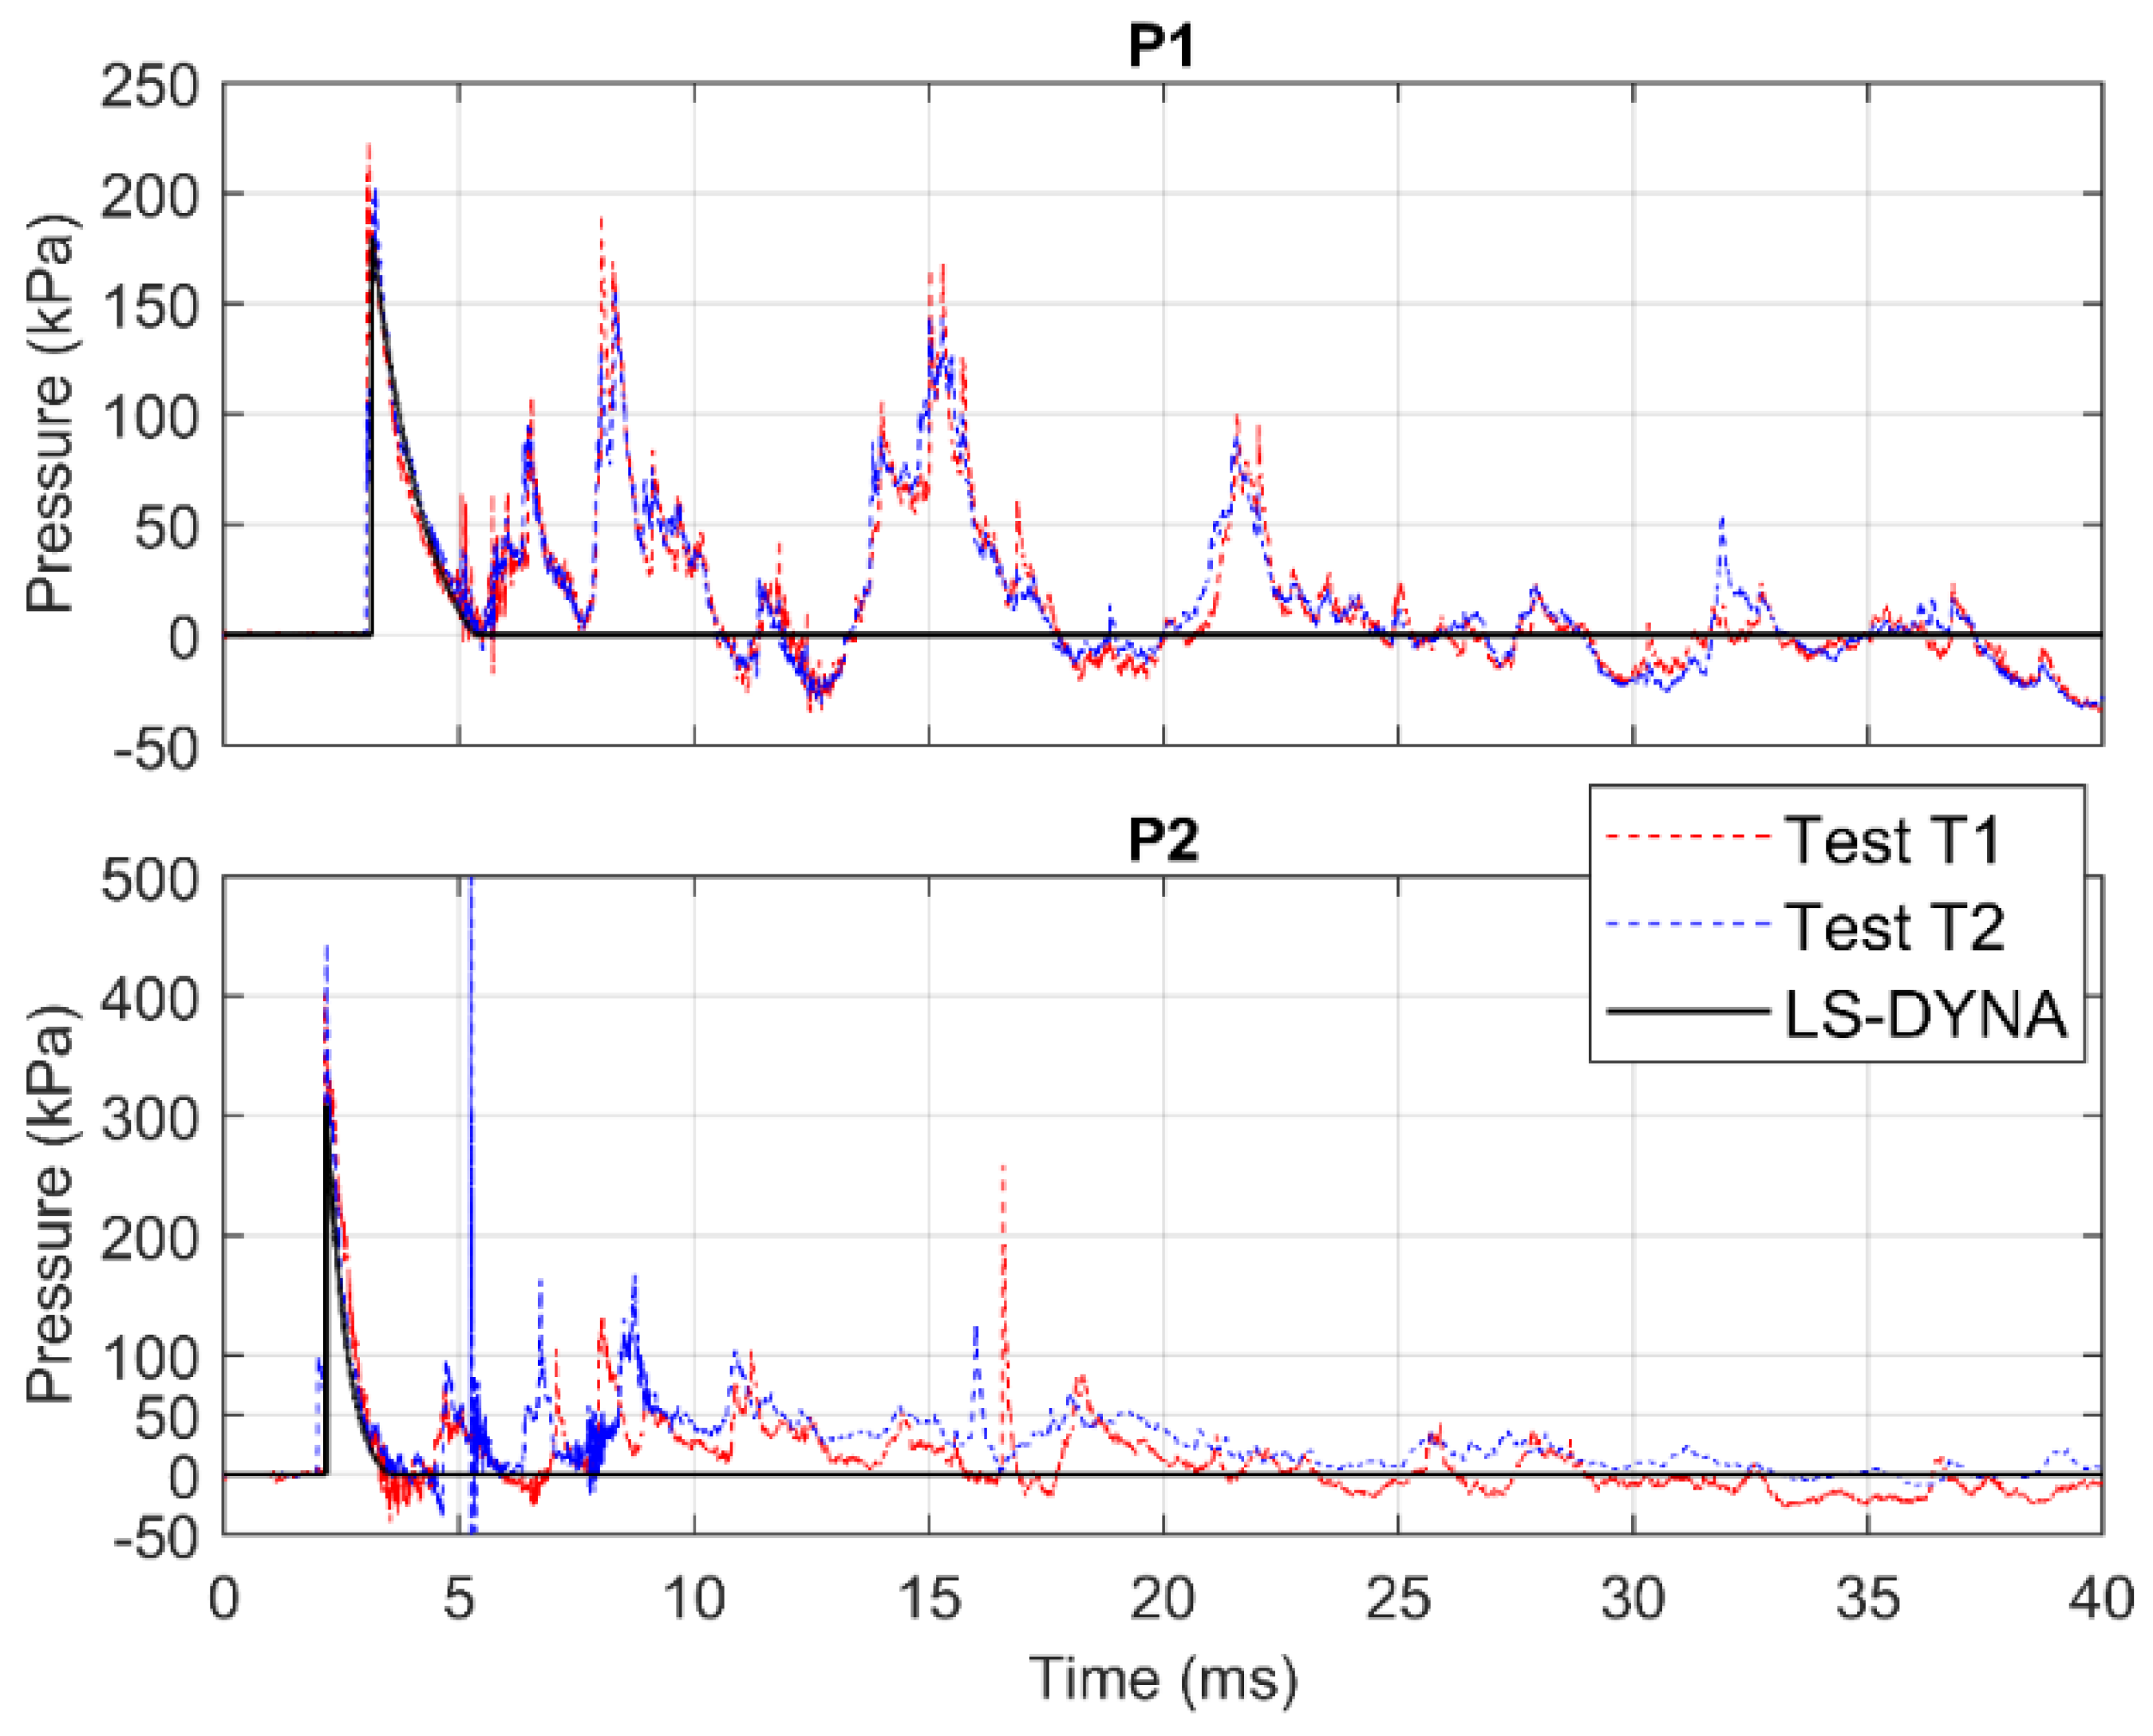
4.2. Pressure Signals

In some cases, the registration of the different pressure–time signals presented an important level of noise that can mask the real signal. In these cases, filtering the signal is necessary to obtain the parameters of the shock wave. Details of the procedure followed can be found in the work published by Chiquito et al., 2019 [43]. In the first test with ANFO (T1) there was a problem with the trigger of one of the DT2 recording systems, and therefore, no data were obtained from the P2 sensor. The P1 sensor in that test suffered the impact of fragments, and therefore, it did not record anything either. In the following tests (T2 onwards), no more sensors were placed.
Pressure measurements were recorded with some reliability in tests T0 to T2 (see Table 4). The simulation values are compared with the average (field) values when there is more than one signal. See Figure 8 as an example of the pressure application. The sequence shows how the wave first reaches the inner wall of the door (area closest to the IED) and then the ceiling. It then reaches the rest of the surfaces and expands in a very similar manner. The expansion pattern is the classic one in a shock wave of this type from the center to the sides, ending at the corners. Once the pressure front passes a point, the pressure decays to the initial pressure. As shown in Table 4, the values simulated with the LBE card are quite similar to those obtained in the field, with relatively low errors given the nature of the phenomenon. As mentioned in Section 3.2, LBE only reproduces the first pressure peak, and this is what is compared in Table 4. This is obviously an important limitation of the simulation, but the other available techniques (i.e., SPH, ALE or PBM), which might be able to reproduce the behavior more realistically, become unfeasible due to the resources required (meshing, number of elements, computational time, etc.). The results show differences of about 11%. This shows that the simulation is relatively reliable and that the TNT equivalent used in the description of the explosives was quite accurate.
All logs show multiple reflections on the various walls, but no sustained gas pressure is observed due to the large vent provided by the window and access door, as shown in Figure 4. Figure 9 shows how the simulation with LBE only reproduces the first peak of the signal recorded by the sensors. It can also be seen how well the model is able to reproduce the shape (duration and impulse) of the recorded shock wave. Moreover, the pressures recorded in sensor P1 are much lower, almost half, than those of sensor P2. This may be due to the orientation of the explosive device focused more directly toward P2, not having a direct “view” of the sensor located at P1. However, the different reflections to which the sensor is subjected are greater in P1, which makes sense, since it is farther away from the large vents that are the doors and windows.

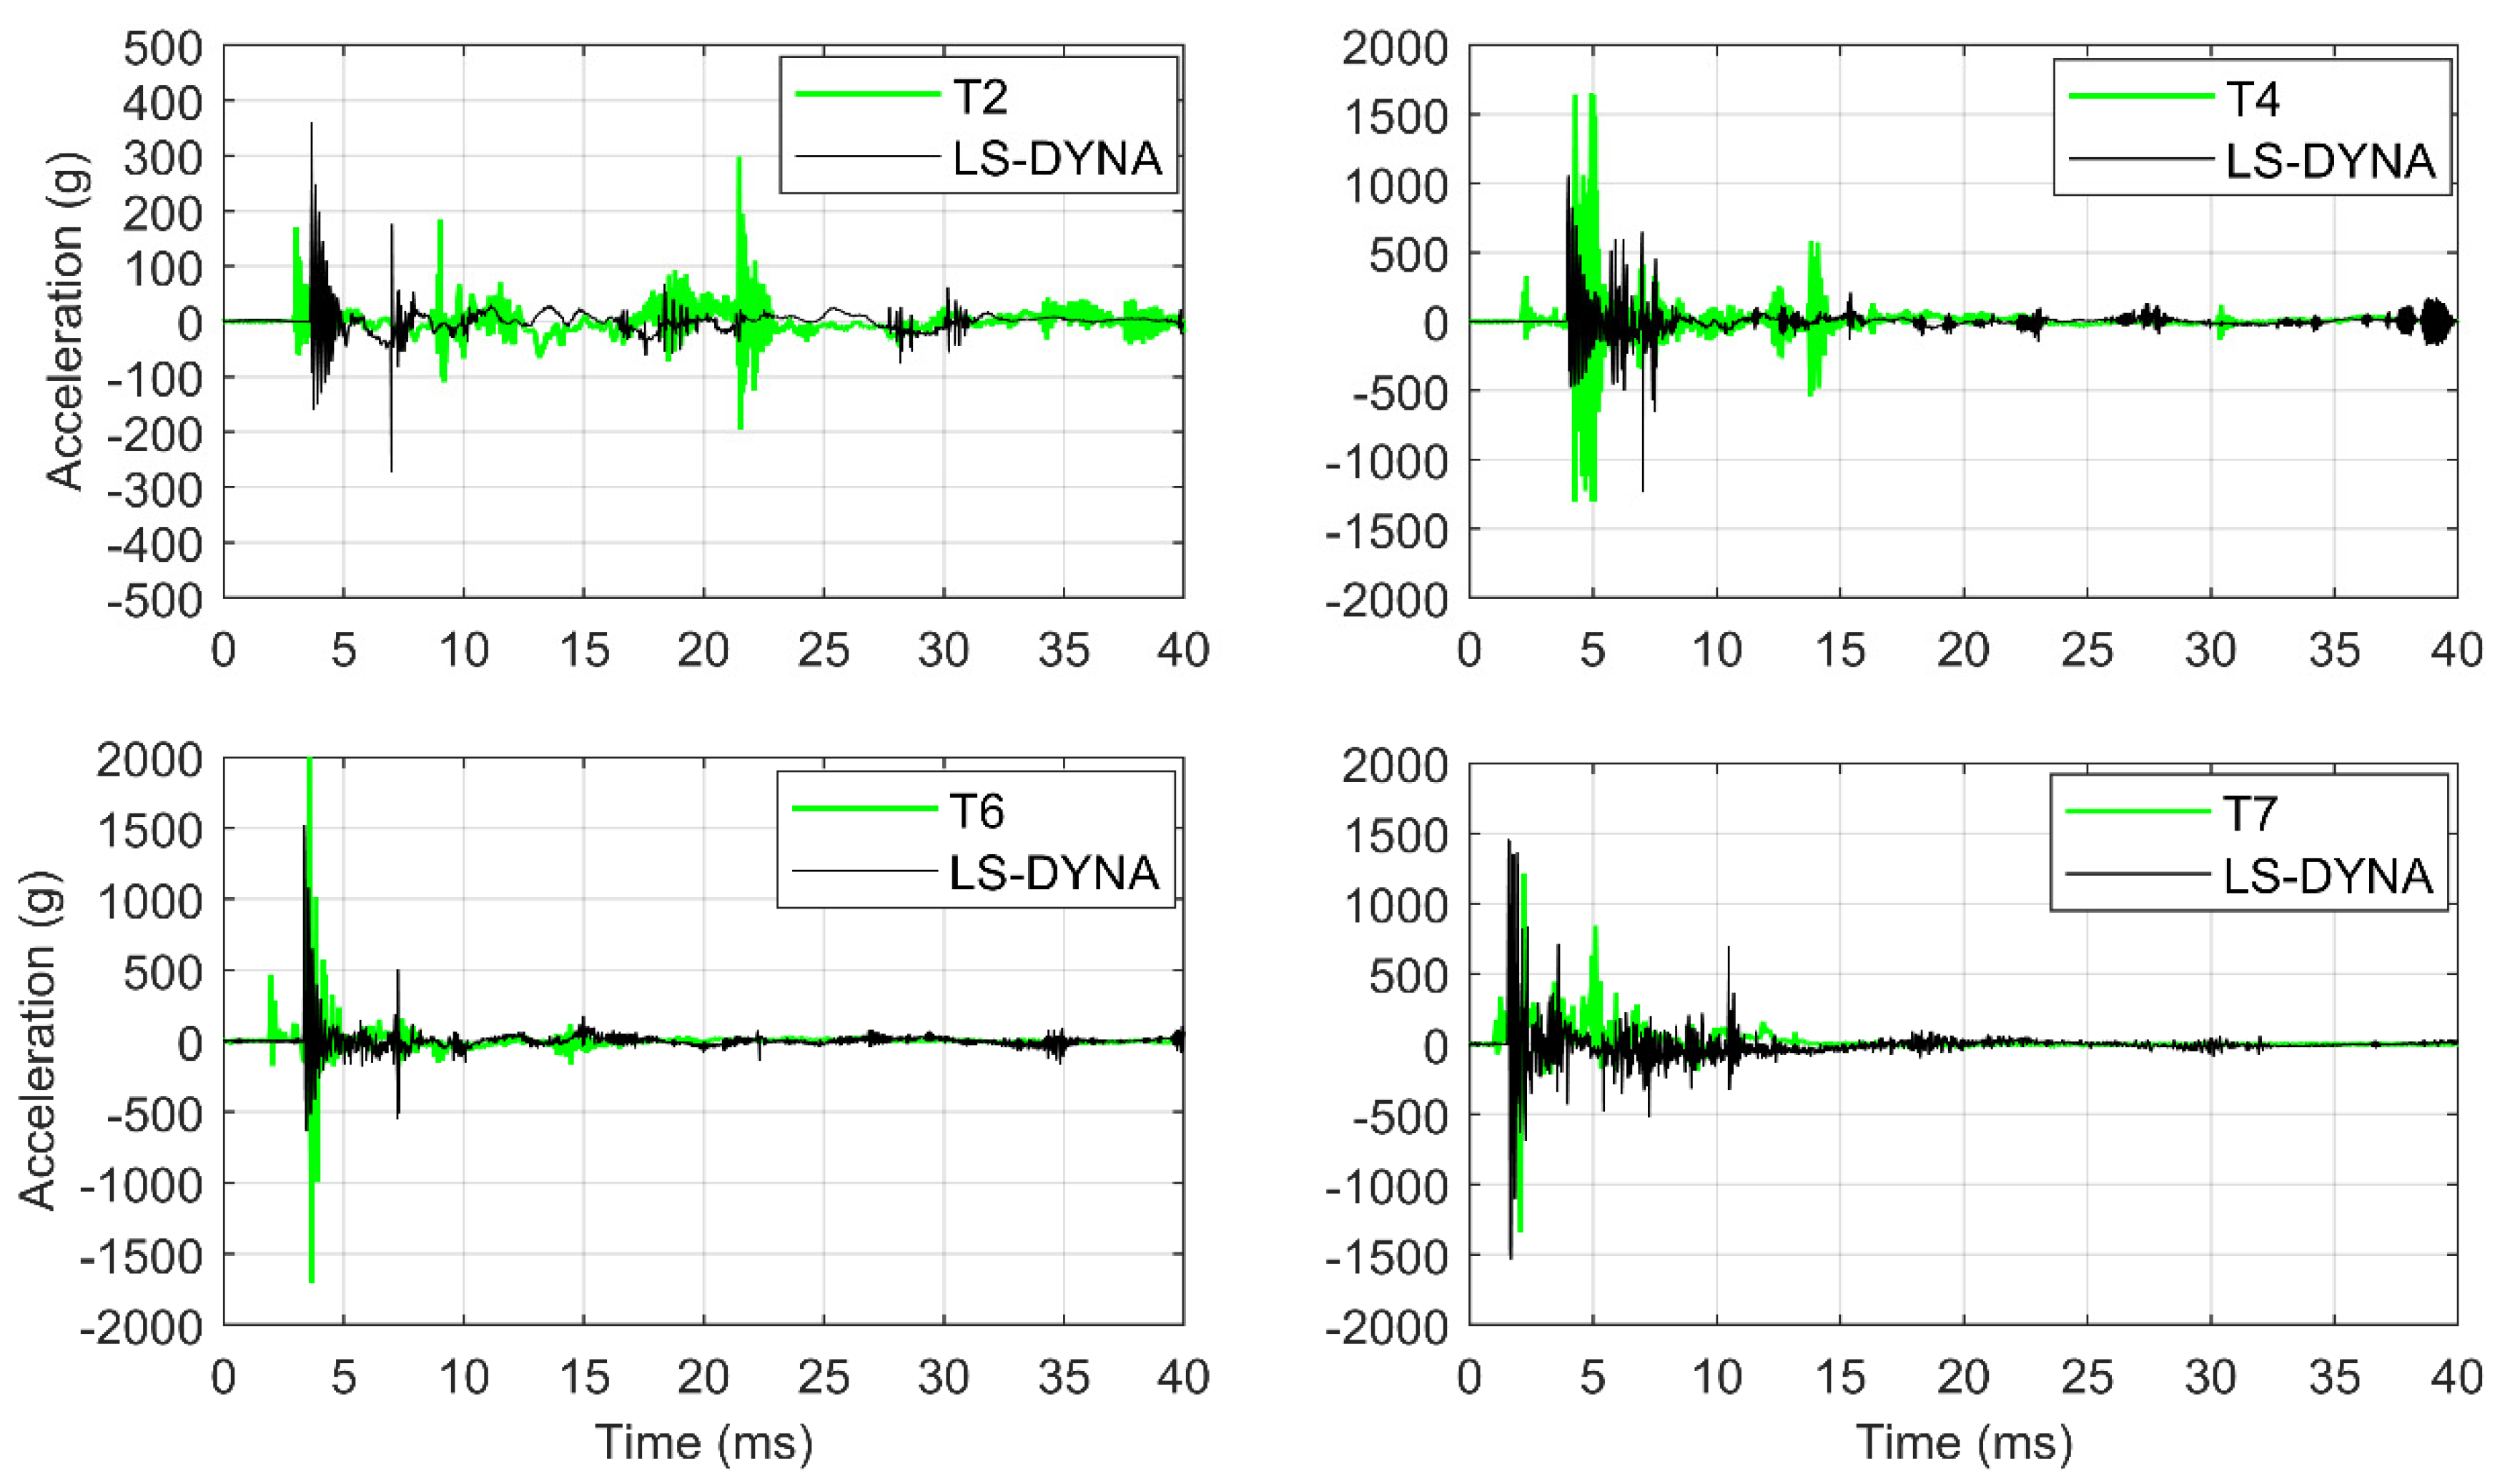
4.3. Acceleration Signals
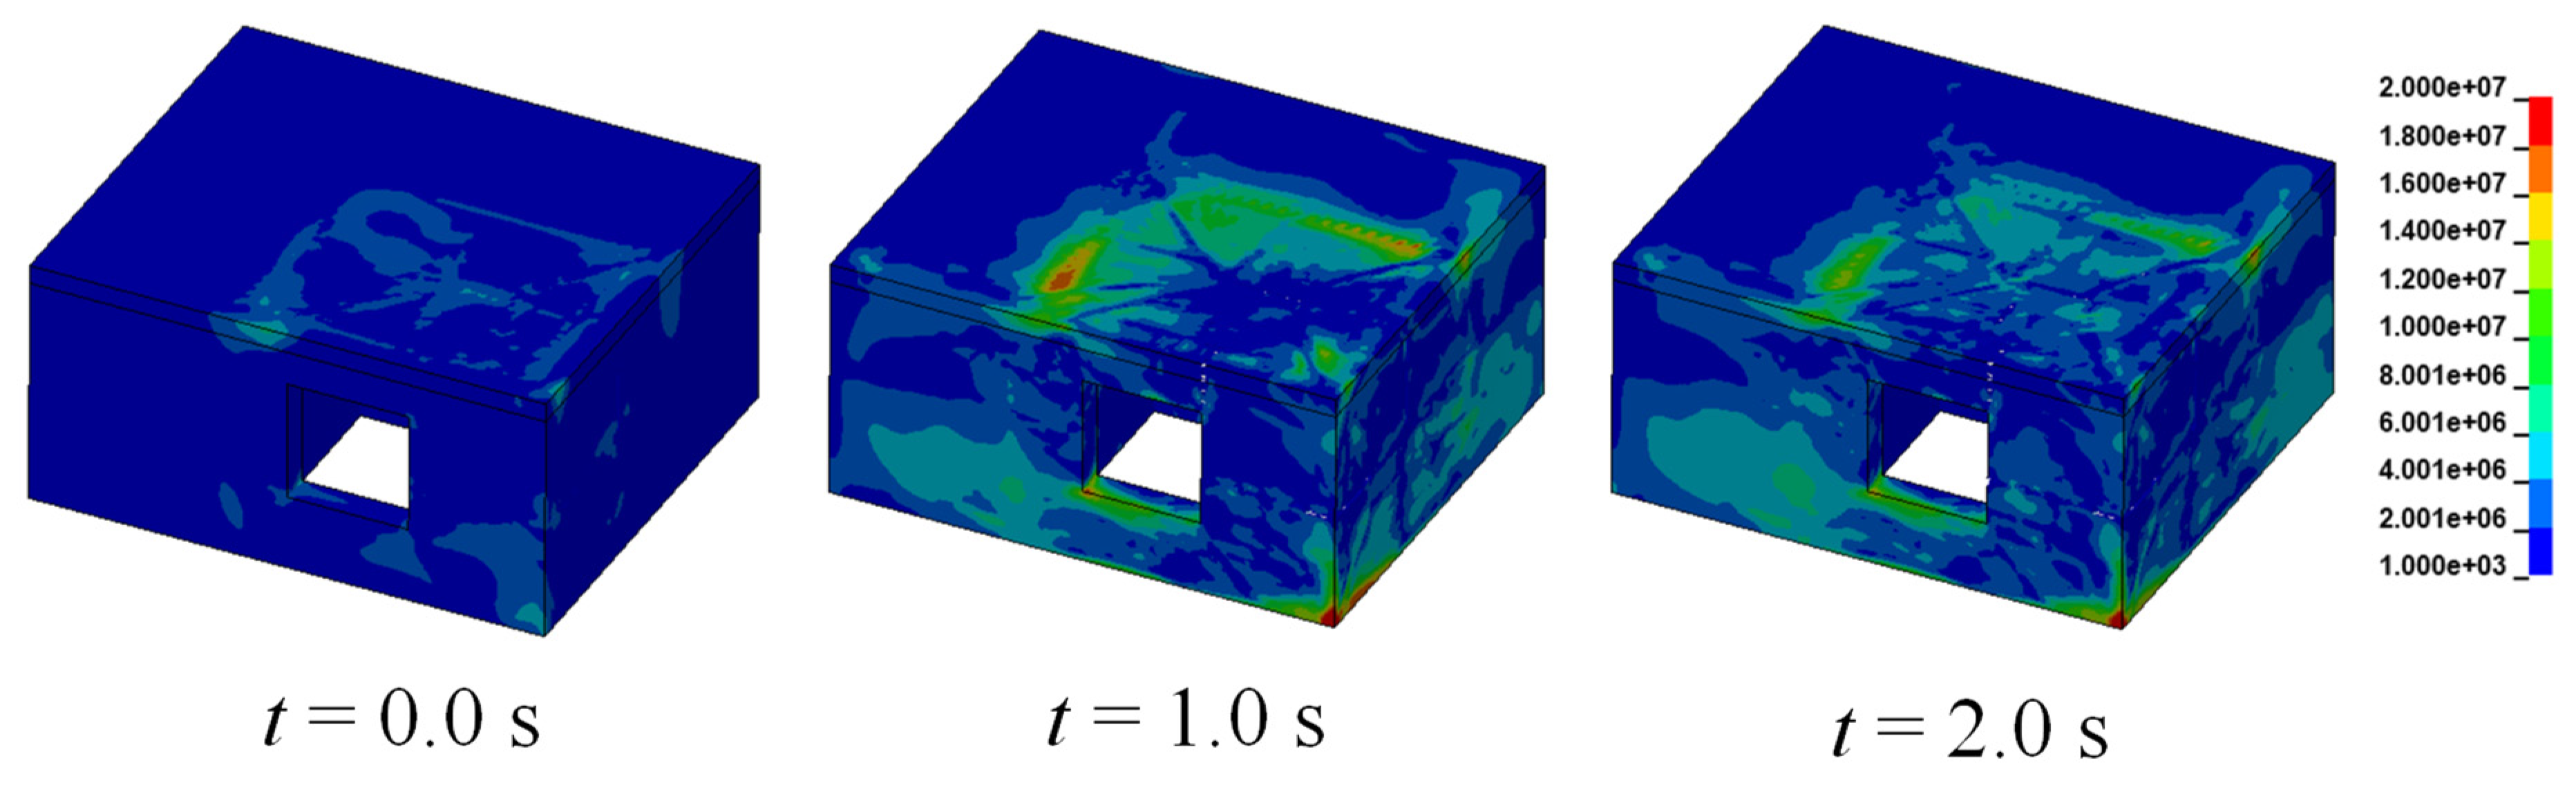
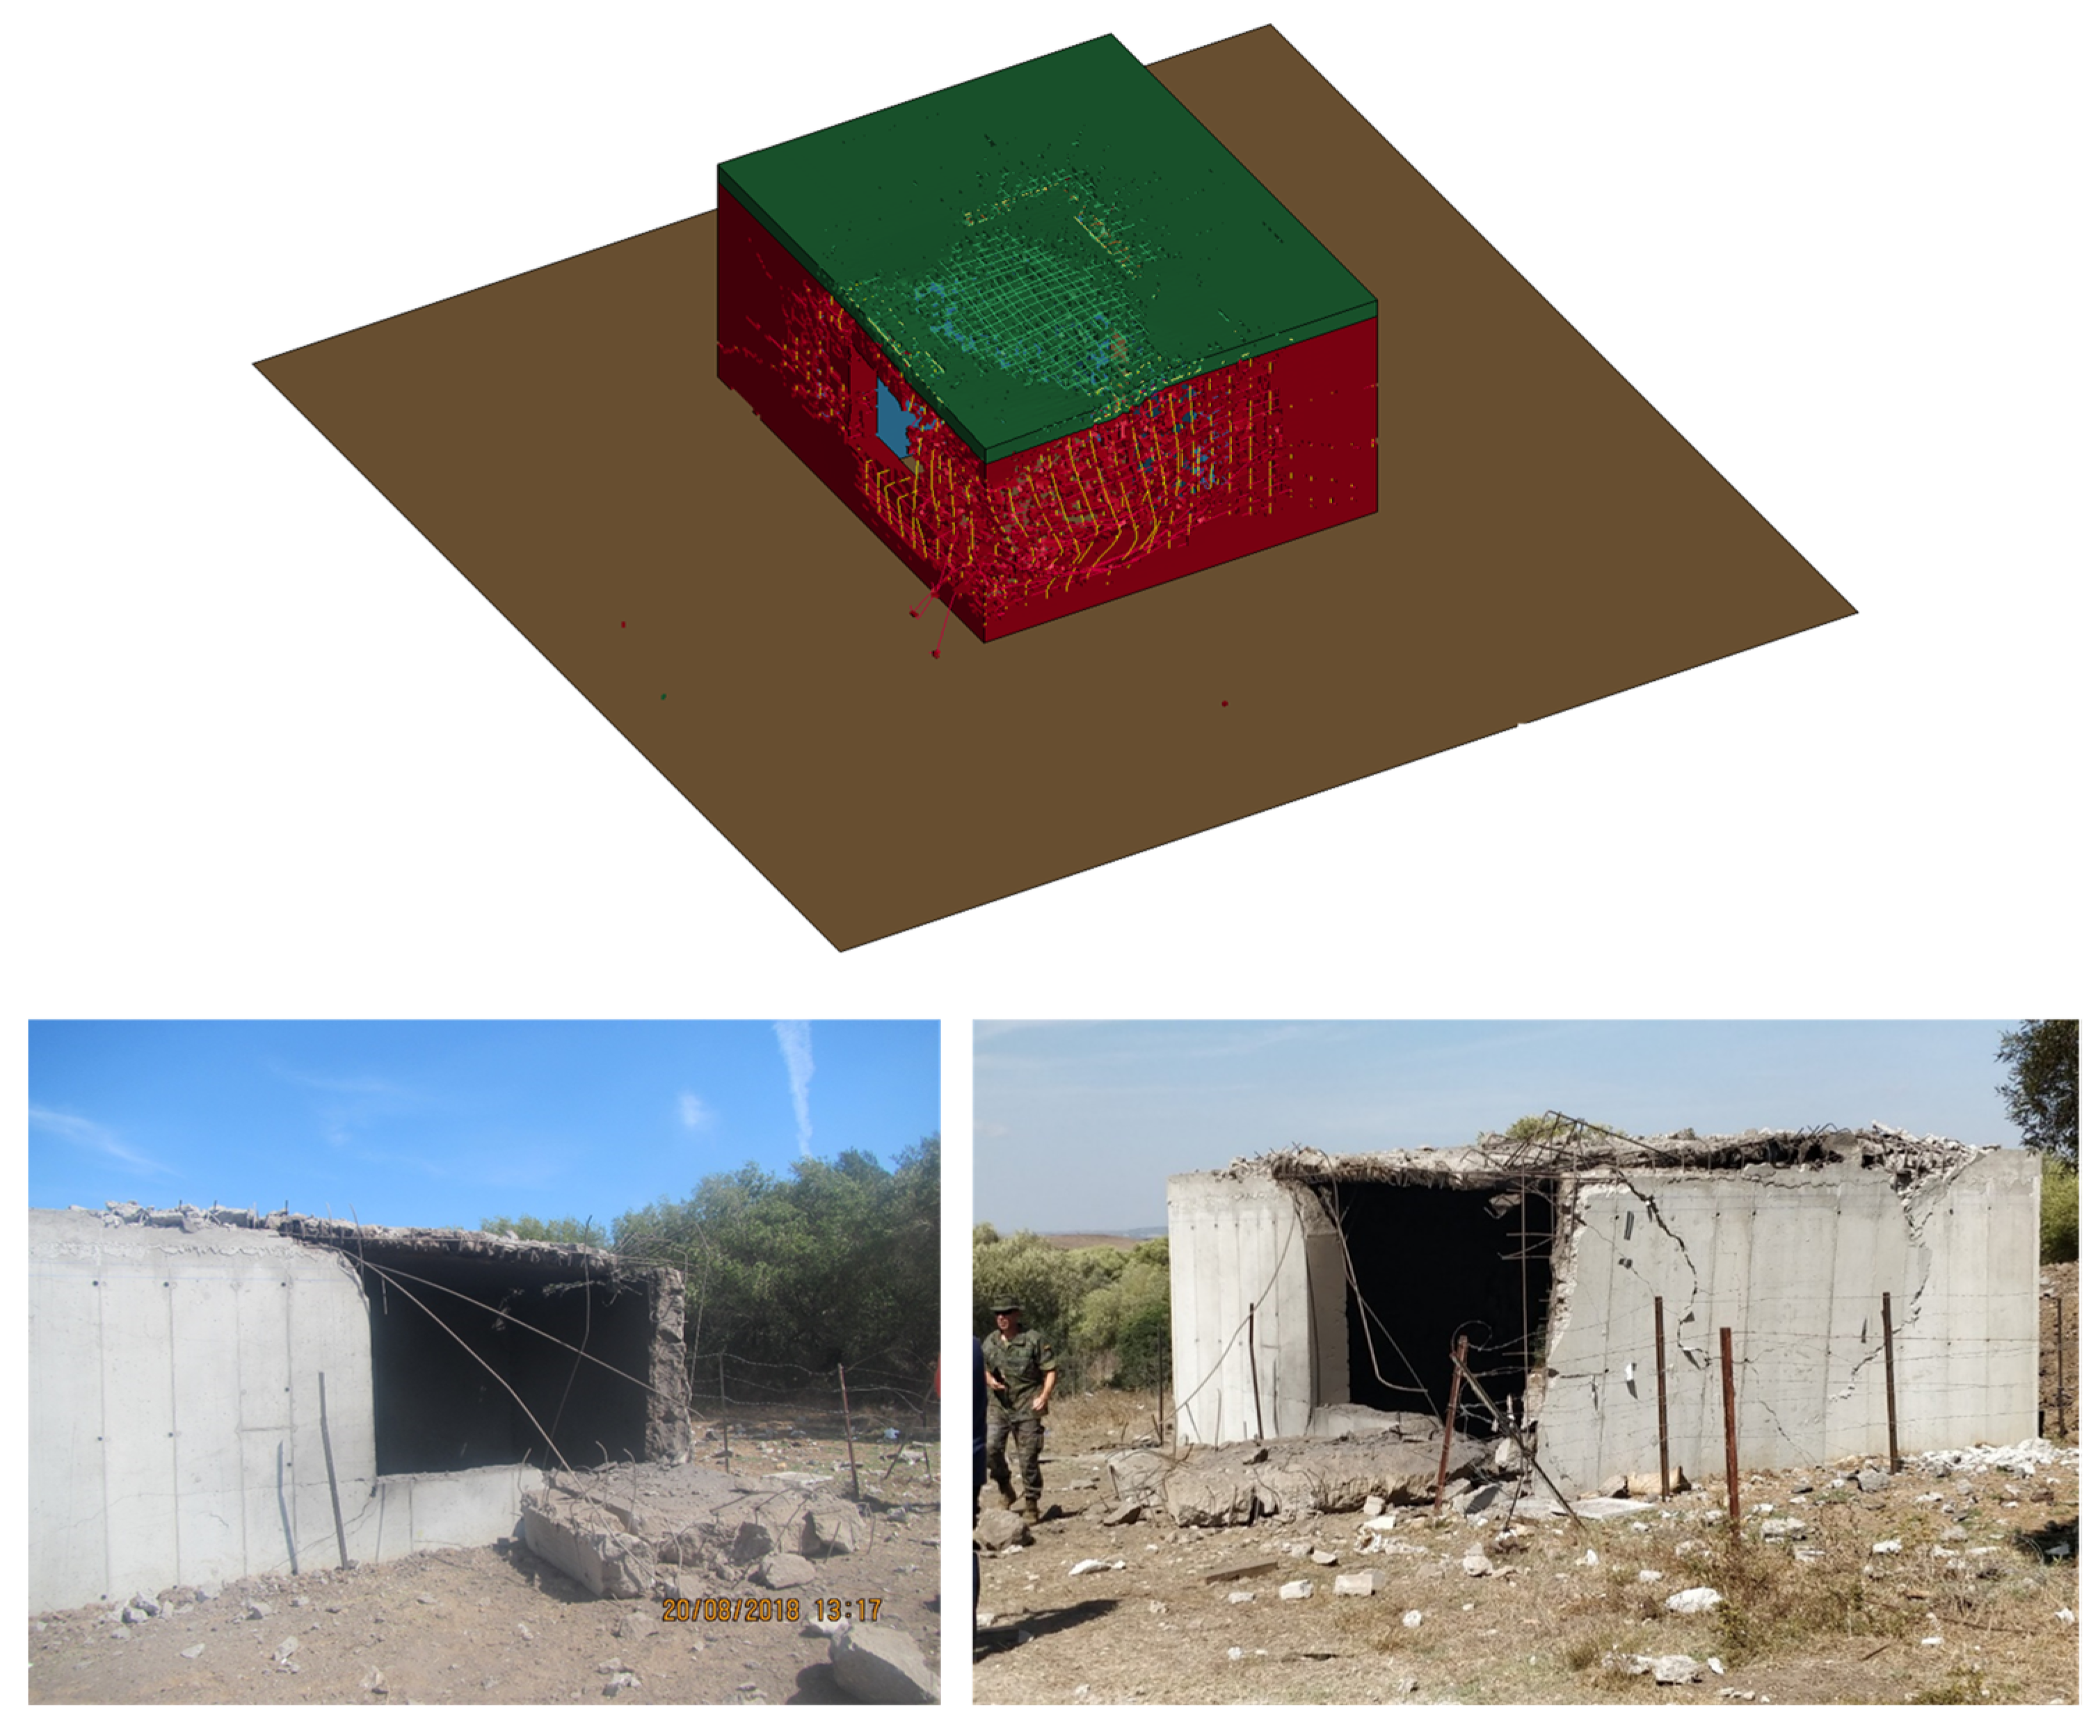
Peak acceleration values comparing all the simulations performed and the measurements with the different sensors (A1–A4, Figure 1 and Table 2) can be found in Table 5. A filter was applied to the acceleration signals to eliminate noise and electrical peaks. The filtering applied was the Butterworth low-pass type of order 4; in addition, if the signal presented an offset, it was also corrected. Sensors that were not measured in the field are not reflected in Table 5, which is used to show the differences between measured and simulated values. Measurement failures were sometimes due to poor sensor coupling, failures in the trigger system or measurements that did not make sense because of the extreme (high/low) values obtained.
As can be seen in Table 5 for sensors A1 to A4, the acceleration data obtained are quite large for the ANFO, AN/AL and PG2 tests, with values between 1000 and 5000 g, while in the black powder tests, the acceleration values are around 400 g. This clearly indicates that accelerations increase with the use of more powerful charges, as expected. Given the non-linear nature of the phenomenon, as well as the limitations of the simulation itself, the differences between the model and the real data are quite good with an average absolute value of 20%. Therefore, the model can reproduce with some reliability the acceleration peaks. The highest difference is found in the only useful measurement of sensor A2 and sensor A3 in test T1. On the other hand, the lowest value is also found at sensor A3 in test T7, followed by sensor A4 in tests T5 and T6. The lowest values are generally found in sensor A4, but it is also the sensor that shows the largest deviations from the mean value. The highest mean values are found in sensor A1 but with the smallest deviations. Considering the results obtained, it can be deduced that the differences between measured and simulated values on sensor A1 are the most important. This may be since the behavior of this interior wall is not well reproduced, being more rigid in the model than it should be. The opposite is true for the outer wall where sensor A4 is located, where the model reproduces quite faithfully the behavior of sensor A4.
However, sensor A5, located on the roof of the structure (see Figure 1), shows somewhat different results (see Table 5 and Figure 10). In general, the model can reproduce the results measured in the field with errors averaging (and in absolute value) around 25%. Figure 10 shows how the accelerations look similar in all cases. In the T2 test, the peak accelerations were not recorded with the first arrival of the wave as in the other cases, as always happens in the modeling. Therefore, in this test, the acceleration peaks between LS-DYNA and the tests do not coincide in time, although they do coincide in peak values. Despite the increase in the explosive load, the maximum accelerations recorded on the roof slightly decreased, contrary to the rest of the sensors. This was especially noticeable in the case of test T7, with 7 kg of PG2. This may be a consequence of the decrease in the stiffness of the structure due to the accumulated damage after performing the tests consecutively without intermediate reinforcement or support actions on the structure.
The extra stiffness provided by the double reinforcement used in the roof slab may have lost its effect after so many tests, but it was probably the one that prevented an earlier collapse of the structure. To reinforce this idea, in the model (Figure 11), it is easy to observe how stress accumulations occur in the window and in the joints of the roof slab with the walls, and therefore, these are the areas that withstood the most stresses throughout the tests. The sequence of images shows how in two seconds the stresses produced in the structure have already stabilized. It can be seen in Figure 8 how the effect of the detonation is only 4 ms when the sequence of images in Figure 11 is every second. It can also be observed that after the T7 test, the stress state of the structure is considerably higher than before.

4.4. Final Test E8

In this test, the explosive charge was placed on the ground in the corner between the walls of the access door and where the P1 sensor was located (see Figure 1). Figure 12 shows the result of the structure after the last test (T8). It can be seen how the structure is destroyed on the window wall and on the adjoining one on the DT1 side (see Figure 1). The gases try to exit through that area (as seen in the previous test T7, Figure 7), projecting most of the shock wave energy on this side of the already weakened structure. Consequently, the walls and part of the roof collapse, leaving the reinforcement exposed. In the model, something similar happens: although the roof seems to be somewhat more damaged than the real structure, the side wall shows significant damage as it happened in the test.

4.5. Effects of the IED Type

In general, the type of IED used can have a major impact on human casualties related to the air blast wave or shrapnel impact. However, it is not very common that they can affect entire structures or parts of them, especially in cases of small charges. This work, although with repeated explosive charges on a structure accumulating some damage, can serve as a small case study.
The results show that the IEDs used in the tests (T1–T6), where explosives that are not too powerful and with low charge are confined in tubes, can produce high accelerations. These pressures are surely produced by the confinement of the explosive in a steel tube since its attempted detonation in air would probably produce milder effects. This fact results in greater damage to the structure given the high accelerations. See Figure 13 for details of the interior parts of the structure affected by successive detonations. It can be seen how the black powder tests hardly affect the structure or the concrete (Figure 13A). In the case of ANFO, whose charge is more powerful, some spalling of the concrete near the interior door can be observed (Figure 13B). The same happens in the case of AN/AL, leaving even the first reinforcements of the structure visible, indicating that the erosion has already been significant (Figure 13C). The case of the plastic explosive (T7–T8) is slightly different because it is a very powerful explosive that does not need confinement to improve its performance. It is known that these explosives are used by security forces and corps for the destruction or demolition of parts of a structure or even the full structure. In this case, it is no different, producing significant damage to the structure as seen in the cracks generated in the interior wall (Figure 13D), which although in principle does not have to compromise the stability of the structure, does leave it very damaged. As discussed above, in the last test (T8), the load was appreciably higher, and this caused the roof to decouple from the walls (Figure 13E), in addition to the obvious collapse occurring in the area of the exterior window.

5. Conclusions

A total of eight tests were carried out with different types of IEDs on the same reinforced concrete structure, simulating a scenario where charges are detonated at the entrance of the State security forces and bodies. Some conclusions can be extracted as follows:
  • The high-speed camera images allow us to see the correct detonation of the explosive, while the pressure log allows us to validate the model input data.
  • The acceleration recorded at the roof of the structure decreases as more tests are performed due to the loss of stiffness of the structure.
  • IEDs of relatively low power (with homemade explosives or low-TNT equivalent), although they cause significant accelerations in the structure, do not compromise its structural stability, while more powerful IEDs (plastic explosives), although with similar accelerations, do put the structural stability of the building at risk.
  • A solid element model using LBE offers, even in complex cases such as this one, a reasonable reproduction of the behavior of a structure reducing testing costs by being able to reproduce with some certainty different scenarios.

Author Contributions

Conceptualization, R.C., A.P.S., L.M.L. and J.I.Y.; methodology, R.C., L.M.L. and M.C.; software, A.P.S., A.A. and S.M.-A.; validation, A.P.S., S.M.-A., L.M.L. and M.C., formal analysis, R.C., A.A. and E.C.; investigation, A.P.S., R.C., L.M.L. and M.C.; writing—original draft preparation, R.C., M.C. and E.C.; supervision, R.C., L.M.L. and J.I.Y.; project administration, R.C.; funding acquisition, R.C., A.P.S. and J.I.Y. All authors have read and agreed to the published version of the manuscript.

Funding

This research was funded by the “Subdirección General de Proyectos y Obras—DIGENIN” of the Spanish Ministry of Defense, grant number 340/OD (SEF), File 1004218000499, project code P1806490081.

Institutional Review Board Statement

Not applicable.

Informed Consent Statement

Not applicable.

Data Availability Statement

The data presented in this study are available on request from the corresponding author. The data are not publicly available due to sensible information and the misuse that can be made of them.

Acknowledgments

The authors of this work would like to thank the different institutions involved (BKA, C-IED COE, DIGENIN, GRUMA, TEAR) for their good work in the development of the corresponding tasks and the good atmosphere generated during the trials.

Conflicts of Interest

The authors declare no conflict of interest.

References

  1. Kamel, H. Review of design techniques of armored vehicles for protection against blast from improvised explosive devices. In Proceedings of the International Mechanical Engineering Congress and Exposition, Salt Lake City, UT, USA, 11–14 November 2019; Volume 10227, pp. 1–18. [Google Scholar]
  2. Fan, W.; Zhou, N.; Jiao, Q.; Shi, J.; Tang, K. Investigation on the explosive characteristics and damage mode of cylindrical improvised explosive devices. J. Appl. Mech. Tech. Phys. 2020, 61, 1024–1032. [Google Scholar] [CrossRef]
  3. Liu, H.; Huang, G.; Guo, Z.; Feng, S. Fragments Velocity Distribution and Estimating Method of Thin-Walled Cylindrical Improvised Explosive Devices with Different Length-to-Diameter Ratios. Thin-Walled Struct. 2022, 175, 109212. [Google Scholar] [CrossRef]
  4. Williams, D.S. Enhancing the Applicability of Blast Modelling and Advice. Int. J. Prot. Struct. 2015, 6, 701–710. [Google Scholar] [CrossRef]
  5. Price, M.A.; Nguyen, V.; Hassan, O.; Morgan, K. An Approach to Modeling Blast and Fragment Risks from Improvised Explosive Devices. Appl. Math. Model. 2017, 50, 715–731. [Google Scholar] [CrossRef] [Green Version]
  6. Sielicki, P.W.; Stewart, M.G.; Gajewski, T.; Peksa, P.; Al-rifaie, H.; Studzi, R. Field Test and Probabilistic Analysis of Irregular Steel Debris Casualty Risks from a Person-Borne Improvised Explosive Device. Def. Technol. 2021, 17, 1852–1863. [Google Scholar] [CrossRef]
  7. Draganić, H.; Gazić, G.; Varevac, D. Experimental Investigation of Design and Retrofit Methods for Blast Load Mitigation—A State-of-the-Art Review. Eng. Struct. 2019, 190, 189–209. [Google Scholar] [CrossRef]
  8. Goswami, A.; Adhikary, S. Das Retrofitting Materials for Enhanced Blast Performance of Structures: Recent Advancement and Challenges Ahead. Constr. Build. Mater. 2019, 204, 224–243. [Google Scholar] [CrossRef]
  9. Tai, Y.S.; Chu, T.L.; Hu, H.T.; Wu, J.Y. Dynamic Response of a Reinforced Concrete Slab Subjected to Air Blast Load. Theor. Appl. Fract. Mech. 2011, 56, 140–147. [Google Scholar] [CrossRef]
  10. Zhao, C.F.; Chen, J.Y.; Wang, Y.; Lu, S.J. Damage Mechanism and Response of Reinforced Concrete Containment Structure under Internal Blast Loading. Theor. Appl. Fract. Mech. 2012, 61, 12–20. [Google Scholar] [CrossRef]
  11. Lin, X.; Zhang, Y.X.; Hazell, P.J. Modelling the Response of Reinforced Concrete Panels under Blast Loading. J. Mater. 2014, 56, 620–628. [Google Scholar] [CrossRef]
  12. Jayasooriya, R.; Thambiratnam, D.P.; Perera, N.J.; Kosse, V. Blast and Residual Capacity Analysis of Reinforced Concrete Framed Buildings. Eng. Struct. 2011, 33, 3483–3495. [Google Scholar] [CrossRef]
  13. Zhang, D.; Yao, S.J.; Lu, F.; Chen, X.G.; Lin, G.; Wang, W.; Lin, Y. Experimental Study on Scaling of RC Beams under Close-in Blast Loading. Eng. Fail. Anal. 2013, 33, 497–504. [Google Scholar] [CrossRef]
  14. Codina, R.; Ambrosini, D.; Borbón, F. De Alternatives to Prevent the Failure of RC Members under Close-in Blast Loadings. EFA 2016, 60, 96–106. [Google Scholar] [CrossRef]
  15. Hajek, R.; Fladr, J.; Pachman, J.; Stoller, J.; Foglar, M. An Experimental Evaluation of the Blast Resistance of Heterogeneous Concrete-Based Composite Bridge Decks. Eng. Struct. 2019, 179, 204–210. [Google Scholar] [CrossRef]
  16. Zhao, C.; Lu, X.; Wang, Q.; Gautam, A.; Wang, J.; Mo, Y.L. Experimental and Numerical Investigation of Steel-Concrete (SC) Slabs under Contact Blast Loading. Eng. Struct. 2019, 196, 109337. [Google Scholar] [CrossRef]
  17. Reifarth, C.; Castedo, R.; Santos, A.P.; Chiquito, M.; López, L.M.; Pérez-Caldentey, A.; Martínez-Almajano, S.; Alañon, A. Numerical and experimental study of externally reinforced RC slabs using FRPs subjected to close-in blast loads. Int. J. Impact Eng. 2021, 156, 103939. [Google Scholar] [CrossRef]
  18. Shi, Y.; Li, Z.; Hao, H. A New Method for Progressive Collapse Analysis of RC Frames under Blast Loading. Eng. Struct. 2010, 32, 1691–1703. [Google Scholar] [CrossRef]
  19. Bermejo, M.; Santos, A.P.; Goicolea, J.M. Development of Practical Finite Element Models for Collapse of Reinforced Concrete Structures and Experimental Validation. Shock. Vib. 2017, 2017, 4636381. [Google Scholar] [CrossRef] [Green Version]
  20. Alshaikh, I.M.H.; Bakar, B.H.A.; Alwesabi, E.A.H.; Akil, H. Experimental Investigation of the Progressive Collapse of Reinforced Concrete Structures: An Overview. Structures 2020, 25, 881–900. [Google Scholar] [CrossRef]
  21. Kernicky, T.P.; Whelan, M.J.; Weggel, D.C.; Rice, C.D. Structural Identification and Damage Characterization of a Masonry Infill Wall in a Full-Scale Building Subjected to Internal Blast Load. J. Struct. Eng. 2015, 141, D4014013. [Google Scholar] [CrossRef]
  22. Xiao, W.; Andrae, M.; Steyerer, M.; Gebbeken, N. Investigations of Blast Loads on a Two-Storeyed Building with a Gable Roof: Full-Scale Experiments and Numerical Study. J. Build. Eng. 2021, 43, 103111. [Google Scholar] [CrossRef]
  23. Stewart, M.G.; Mueller, J. Terrorism Risks, Chasing Ghosts and Infrastructure Resilience. Sustain. Resilient Infrastruct. 2020, 5, 78–89. [Google Scholar] [CrossRef]
  24. Dante, D.; William, Y. Primary Blast Injuries—An Updated Concise Review. World J. Surg. 2012, 36, 966–972. [Google Scholar] [CrossRef]
  25. Mathews, Z.R.; Koyfman, A. Blast Injuries. J. Emerg. Med. 2015, 49, 573–587. [Google Scholar] [CrossRef]
  26. EN 1992-1-1; Eurocode 2: Design of Concrete Structures—Part 1-1: General Rules and Rules for Buildings. European Committee for Standardization: Brussels, Belgium, 2004.
  27. EN 1998-2; Eurocode 8: Design of Structures for Earthquake Resistance—Part 2: Bridges. European Committee for Standardization: Brussels, Belgium, 2005.
  28. Livermore Software Technology Corporation (LSTC). LS-DYNA Keyword User´s Manual—R11; Livermore Software Technology Corporation: Livermore, CA, USA, 2018; p. 3186. [Google Scholar]
  29. Castedo, R.; Segarra, P.; Alañon, A.; Lopez, L.M.; Santos, A.P.; Sanchidrian, J.A. Air Blast Resistance of Full-Scale Slabs with Different Compositions: Numerical Modeling and Field Validation. Int. J. Impact Eng. 2015, 86, 145–156. [Google Scholar] [CrossRef]
  30. Castedo, R.; Santos, A.P.; Alañón, A.; Reifarth, C.; Chiquito, M.; López, L.M.; Martínez-Almajano, S.; Pérez-Caldentey, A. Numerical Study and Experimental Tests on Full-Scale RC Slabs under Close-in Explosions. Eng. Struct. 2021, 231, 111774. [Google Scholar] [CrossRef]
  31. Alañón, A.; Cerro-Prada, E.; Vázquez-Gallo, M.J.; Santos, A.P. Mesh Size Effect on Finite-Element Modeling of Blast-Loaded Reinforced Concrete Slab. Eng. Comput. 2018, 34, 649–658. [Google Scholar] [CrossRef]
  32. Feng, W.; Chen, B.; Yang, F.; Liu, F.; Li, L.; Jing, L.; Li, H. Numerical Study on Blast Responses of Rubberized Concrete Slabs Using the Karagozian and Case Concrete Model. J. Build. Eng. 2021, 33, 101610. [Google Scholar] [CrossRef]
  33. Abedini, M.; Zhang, C.; Mehrmashhadi, J.; Akhlaghi, E. Comparison of ALE, LBE and Pressure Time History Methods to Evaluate Extreme Loading Effects in RC Column. Structures 2020, 28, 456–466. [Google Scholar] [CrossRef]
  34. Suhaimi, K.; Sohaimi, R.M.; Knight, V.F.; Sheng, T.K.; Ahmad, M.M.H.M.; Isa, M.F.M.; Sohaimi, A.S.M.; Noordin, M.N.H.; Syaharani, A. Simulation of Hybrid-III Dummy Response Using Three LS-DYNA Blast Methods. Def. S T Tech. Bull. 2017, 10, 111–120. [Google Scholar]
  35. Hilding, D. Methods for Modelling Air Blast on Structures in LS-DYNA. In Proceedings of the Nordic LS-DYNA Users’ Conference, Gothenburg, Sweden, 13–14 October 2016; p. 65. [Google Scholar]
  36. Hyde, D.W. Microcomputer Programs CONWEP and FUNPRO, Applications of TM 5-855-1, ’Fundamentals of Protective Design for Conventional Weapons’(User’s Guide); No. WES/IR; Army Engineer Waterways Experiment Station Vicksburg MS Structures Lab.: Vicksburg, MS, USA, 1988. [Google Scholar]
  37. Abedini, M.; Zhang, C. Performance Assessment of Concrete and Steel Material Models in LS-DYNA for Enhanced Numerical Simulation, A State of the Art Review. Arch. Comput. Methods Eng. 2021, 28, 2921–2942. [Google Scholar] [CrossRef]
  38. Tabatabaei, Z.S.; Volz, J.S.; Baird, J.; Gliha, B.P.; Keener, D.I. Experimental and Numerical Analyses of Long Carbon Fiber Reinforced Concrete Panels Exposed to Blast Loading. Int. J. Impact Eng. 2013, 57, 70–80. [Google Scholar] [CrossRef]
  39. Brad, D.; Michael, O.; Joseph, M. Modeling Reinforced Concrete Protective Construction for Impact Scenarios. In Proceedings of the International Explosives Safety Symposium and Exhibition, San Diego, CA, USA, 6–9 August 2018; p. 298. [Google Scholar]
  40. Murray, Y.D. Users Manual for LS-DYNA Concrete Material Model 159; Federal Highway Administration: Washington, DC, USA, 2007. [Google Scholar]
  41. Brannon, R.M.; Leelavanichkul, S. Survey of Four Damage Models for Concrete; Sandia National Laboratories: Albuquerque, NM, USA, 2009. [Google Scholar]
  42. Cadoni, E.; Dotta, M.; Forni, D.; Tesio, N. High Strain Rate Behaviour in Tension of Steel B500A Reinforcing Bar. Mater. Struct. Constr. 2015, 48, 1803–1813. [Google Scholar] [CrossRef]
  43. Chiquito, M.; Castedo, R.; Lopez, L.M.; Santos, A.P.; Mancilla, J.M.; Yenes, J.I. Blast Wave Characteristics and TNT Equivalent of Improvised Explosive Device at Small Scaled Distances. Def. Sci. J. 2019, 69, 328–335. [Google Scholar] [CrossRef] [Green Version]
Figure 1. Details of the structure, location of the measuring equipment and photograph of the structure. The letters P refer to pressure sensors, the letters A are accelerometers, and the DTs are Datatrap II recording equipment.
Applsci 12 07803 g001
Figure 2. (a) Pressure sensors (PCB 102B), details of the P1. (b) Accelerometer in position A2. (c) Location of the high-speed camera in one of the tests. (d) Signal conditioners and DataTrap II recording equipment.
Applsci 12 07803 g002aApplsci 12 07803 g002b
Figure 3. Details of the complete 3D model made with LS-DYNA and details of the steel armor.
Applsci 12 07803 g003
Figure 4. Sequence of images obtained with HSC in trial T2: black powder. Time in milliseconds; the reference time is the first frame of the video where the detonation is observed.
Applsci 12 07803 g004
Figure 5. Sequence of images obtained with HSC in trial T4: ANFO. Time in milliseconds; the reference time is the first frame of the video where the detonation is observed.
Applsci 12 07803 g005
Figure 6. Sequence of images obtained with HSC in trial T6: AN/AL. Time in milliseconds; the reference time is the first frame of the video where the detonation is observed.
Applsci 12 07803 g006
Figure 7. Sequence of images obtained with HSC in trial T7: PG2. Time in milliseconds; the reference time is the first frame of the video where the detonation is observed.
Applsci 12 07803 g007
Figure 8. Pressure isovalues (view from the inner door) on the interior faces of the room where the detonations were carried out for the T0 test. The color scale is the pressure values in Pa.
Applsci 12 07803 g008
Figure 9. Pressure signals (P1 and P2) for tests T1 and T2: black powder, and the simulated signal with LS-DYNA.
Applsci 12 07803 g009
Figure 10. Accelerations from tests T2, T4, T6 and T7, in position A5 (see Figure 1) and their comparison with LS-DYNA.
Applsci 12 07803 g010
Figure 11. Effective stress (scale in Pa) of trial T7. The first image with time zero corresponds to the stress state when the T7 test load is detonated in the model.
Applsci 12 07803 g011
Figure 12. Final test (T8) results: numerical model and photographs.
Applsci 12 07803 g012
Figure 13. Different effects of IEDs on the interior structure: (A) after the two black powder tests (T1–T2); (B) after the ANFO tests (T3–T4); (C) after the AN/AL tests (T5–T6); (D) after the first PG2 test (T7); (E) after the second PG2 test (T8).
Applsci 12 07803 g013
Table 1. Load characteristics during the tests carried out.
TestDayExplosive TypeCharge (kg)PETN (g)TNT Equivalent Mass (kg)Confinement
T018 September 2018PG-20.1000.14--
T118 September 2018Black Powder3.3710.50.79Steel tubes
T218 September 2018Black Powder3.2710.50.77Steel tubes
T318 September 2018ANFO2.2910.51.48Steel tubes
T419 September 2018ANFO2.2010.51.42Steel tubes
T519 September 2018AN/AL2.1610.51.88Steel tubes
T619 September 2018AN/AL2.2510.51.95Steel tubes
T720 September 2018PG-27.00559.87Vest
T820 September 2018PG-28.205514.21Vest
Table 2. Characteristics of the accelerometers used and the height at which they were positioned.
#SensorModelMeasurement Range (g)TestHeight (m)
A1350C23±10,000T0–T41.375
A1350C04±5000T5–T71.375
A2350C04±5000T0–T71.370
A3350C23±10,000T0–T71.395
A4350B04±5000T0–T71.370
A5350B04±5000T0–T73.300
Table 3. Concrete and steel properties used in the numerical modeling.
PropertyConcreteSteel
Density (kg/m3)23007850
Uniaxial compressive strength (MPa)40-
Maximum aggregate size (m)0.02-
Young modulus (MPa)-2 × 10⁵
Poisson’s ratio-0.3
Yield stress (MPa)-5 × 10²
Tangent modulus (MPa)-2 × 10⁴
Table 4. Pressure sensor results. Friedlander adjustment.
TestExplosiveSensorPr (kPa)Pr (LS-DYNA) (kPa)Relative Dif. (%)
T0PG-2P188.7299.67−12.34
T0PG-2P2129.80136.02−4.79
T1Black PowderP1193.11181.216.71
T2Black PowderP1195.38
T1Black PowderP2372.27309.6417.93
T2Black PowderP2382.36
Table 5. Peak acceleration values for different sensors and trials. BP means black powder.
TestExplosive#SensorMeasured Acceleration (g)Model Acceleration (g)Difference (%)
T0PG2A244.426.340.77
A377.157.825.03
A429.630.2−1.94
T1BPA1207.2152.826.25
A3699.3416.540.44
A469.279.9−15.49
T2BPA1105.275.428.30
A3430.3403.66.21
A5298.8354.8−18.76
T3ANFOA11048.9852.418.73
T4ANFOA11113.6928.316.64
A31048.2809.922.74
A4259.8349.4−34.50
A51646.41056.035.86
T5AN/ALA1998.91115.2−11.64
A33786.54192.0−10.71
A44685.54896.0−4.49
A52683.101691.536.96
T6AN/ALA1903.41126.5−28.68
A35600.64305.023.13
A44828.65094.0−5.50
A51996.251518.423.94
T7PG2A1902.7652.027.77
A31507.901521.83.12
A45171.83464.433.01
A51342.31505.0−12.12
Publisher’s Note: MDPI stays neutral with regard to jurisdictional claims in published maps and institutional affiliations.

