Article

A Multi-Analytical Approach to Infer Mineral–Microbial Interactions Applied to Petroglyph Sites in the Negev Desert of Israel

1
Institute of Natural Sciences and Technology in the Arts (INTK), Academy of Fine Arts Vienna, Schillerplatz 3, 1010 Vienna, Austria
2
Avram and Stella Goldstein-Goren Department of Biotechnology Engineering, Ben-Gurion University of the Negev, 8410501 Be’er Sheva, Israel
3
Ilse Katz Institute for Nanoscale Science and Technology, Ben-Gurion University of the Negev, 8410501 Be’er Sheva, Israel
4
Institute of Chemical Technology and Analytics, TU Wien, Getreidemarkt 9/164, 1060 Vienna, Austria
5
Department of Applied Life Sciences, University of Applied Sciences, FH Campus Wien, Favoritenstraße 226, 1100 Vienna, Austria
*
Author to whom correspondence should be addressed.
Appl. Sci. 2022, 12(14), 6936; https://doi.org/10.3390/app12146936
Submission received: 25 May 2022 / Revised: 4 July 2022 / Accepted: 5 July 2022 / Published: 8 July 2022
(This article belongs to the Special Issue Interdisciplinary Researches for Cultural Heritage Conservation)

Abstract

:
Petroglyph sites exist all over the world. They are one of the earliest forms of mankind’s expression and a precursor to art. Despite their outstanding value, comprehensive research on conservation and preservation of rock art is minimal, especially as related to biodeterioration. For this reason, the main objective of this study was to explore the factors involved in the degradation of petroglyph sites in the Negev desert of Israel, with a focus on biodegradation processes. Through the use of culture-independent microbiological methods (metagenomics), we characterized the microbiomes of the samples, finding they were dominated by bacterial communities, in particular taxa of Actinobacteria and Cyanobacteria, with resistance to radiation and desiccation. By means of XRF and Raman spectroscopies, we defined the composition of the stone (calcite and quartz) and the dark crust (clay minerals with Mn and Fe oxides), unveiling the presence of carotenoids, indicative of biological colonization. Optical microscopy and SEM–EDX analyses on thin sections highlighted patterns of weathering, possibly connected to the presence of biodeteriorative microorganisms that leach the calcareous matrix from the bedrock and mobilize metal cations from the black varnish for metabolic processes, slowly weathering it.

1. Introduction

Rock art, in the form of petroglyphs and pictograms, is found worldwide and has an undoubtedly immense value as it is considered one of the first forms of expression of ancient societies and the prehistoric precursor to art [1,2,3,4]. As part of the natural landscape, petroglyphs are constantly exposed to anthropogenic and natural weathering processes [5,6,7], but despite this, knowledge regarding preservation and conservation of this valuable cultural heritage is limited.
Although there is considerable research and published work focusing on the physical state of rock art sites worldwide [7,8,9], research focusing on the role of biological agents in the deterioration of rock art is still minimal. Nevertheless, physical and chemical weathering processes initiated by stone-dwelling microorganism (biodeterioration) can play a significant role in the degradation patterns of the stone [10]. Biodeterioration includes surface alterations by crusts and pigments that can change the color of the surface [11], physico–chemical disintegration of the stone material, and dissolution of the lithic substrate by inorganic and organic acids [12]. For example, hyphal growth and biofilm development can cause physical disruptions and cracks in stone materials, while the release of acids can dissolve carbonates, such as limestone, as well as quartz, causing mineral leaching [13]. All these processes contribute to weakening the stone matrix.
In the Negev desert of Israel, the majority of petroglyph sites are spread throughout the Negev central highlands and offer a window into the life and culture of desert people who inhabited the region since prehistoric times [14]. The petroglyphs are considered to be from 3000 BCE [15] and include figurative images (zoomorphic and anthropomorphic), geometric shapes, symbols and inscriptions. The engravings are carved through a dark crust, the so called desert or rock varnish, which coats the local Eocene and late Cretaceous limestone rocks [16]. Desert varnish is defined as a thin (10–200 µm), dark coating highly enriched in manganese that forms on exposed rock surfaces in arid and hyper-arid environments. It is composed of clay minerals and amorphous silica (~70%) in a matrix of poorly crystallized manganese (Mn) and iron (Fe) oxides and hydroxides [17,18,19]. Despite the fact that geochemical aspects of rock varnish have been thoroughly investigated [19,20,21,22,23,24] and it is believed that its primary source of material is airborne dust, there is an ongoing debate about the exact process of formation and specifically whether or not microorganisms are involved in this process [5,25,26]. In a recent study, Lingappa et al. [27] proposed a new hypothesis for varnish formation. They state that Cyanobacteria accumulate manganese as a nonenzymatic antioxidant system and that, consequently to the cells death, the manganese-rich residue left behind is oxidized to generate the manganese oxides present in the varnish.
Cyanobacteria are often reported as one of the dominant phyla present in rock varnish, along with Actinobacteria, Proteobacteria, Bacteroidetes and Chloroflexi [16,28]. In fact, despite the harsh environmental conditions, microbial studies revealed a broad spectrum of stone-dwelling microorganism associated with desert varnish [29,30]. Just as it is not fully understood the role played by the microorganisms in the formation of the rock varnish, it is also uncertain if and how the microbial community influences the weathering of the stone. In fact, the literature available about this topic is very limited. A few studies report serious damage in numerous rock art sites due to lichen colonization [31,32]. Nir et al. [33], with a study combining scanning electron microscopy (SEM) and metagenomic sequencing methods, suggest that the stone surface of petroglyphs in the Negev desert is colonized by a complex microbial and lichen community with the biochemical potential to induce biodeterioration. Despite these studies, comprehensive research on deterioration of rock art panels, particularly by microorganisms, is still needed.
For these reasons, the aim of the present study was to investigate the potential microbial involvement in the weathering of petroglyph sites through a multi-analytical approach based on culture-independent microbiological methods (metagenomics) to investigate the microbiome associated with the petroglyph panels, and on microscope observation and physico–chemical methods to analyze the lithic substrate.

2. Materials and Methods

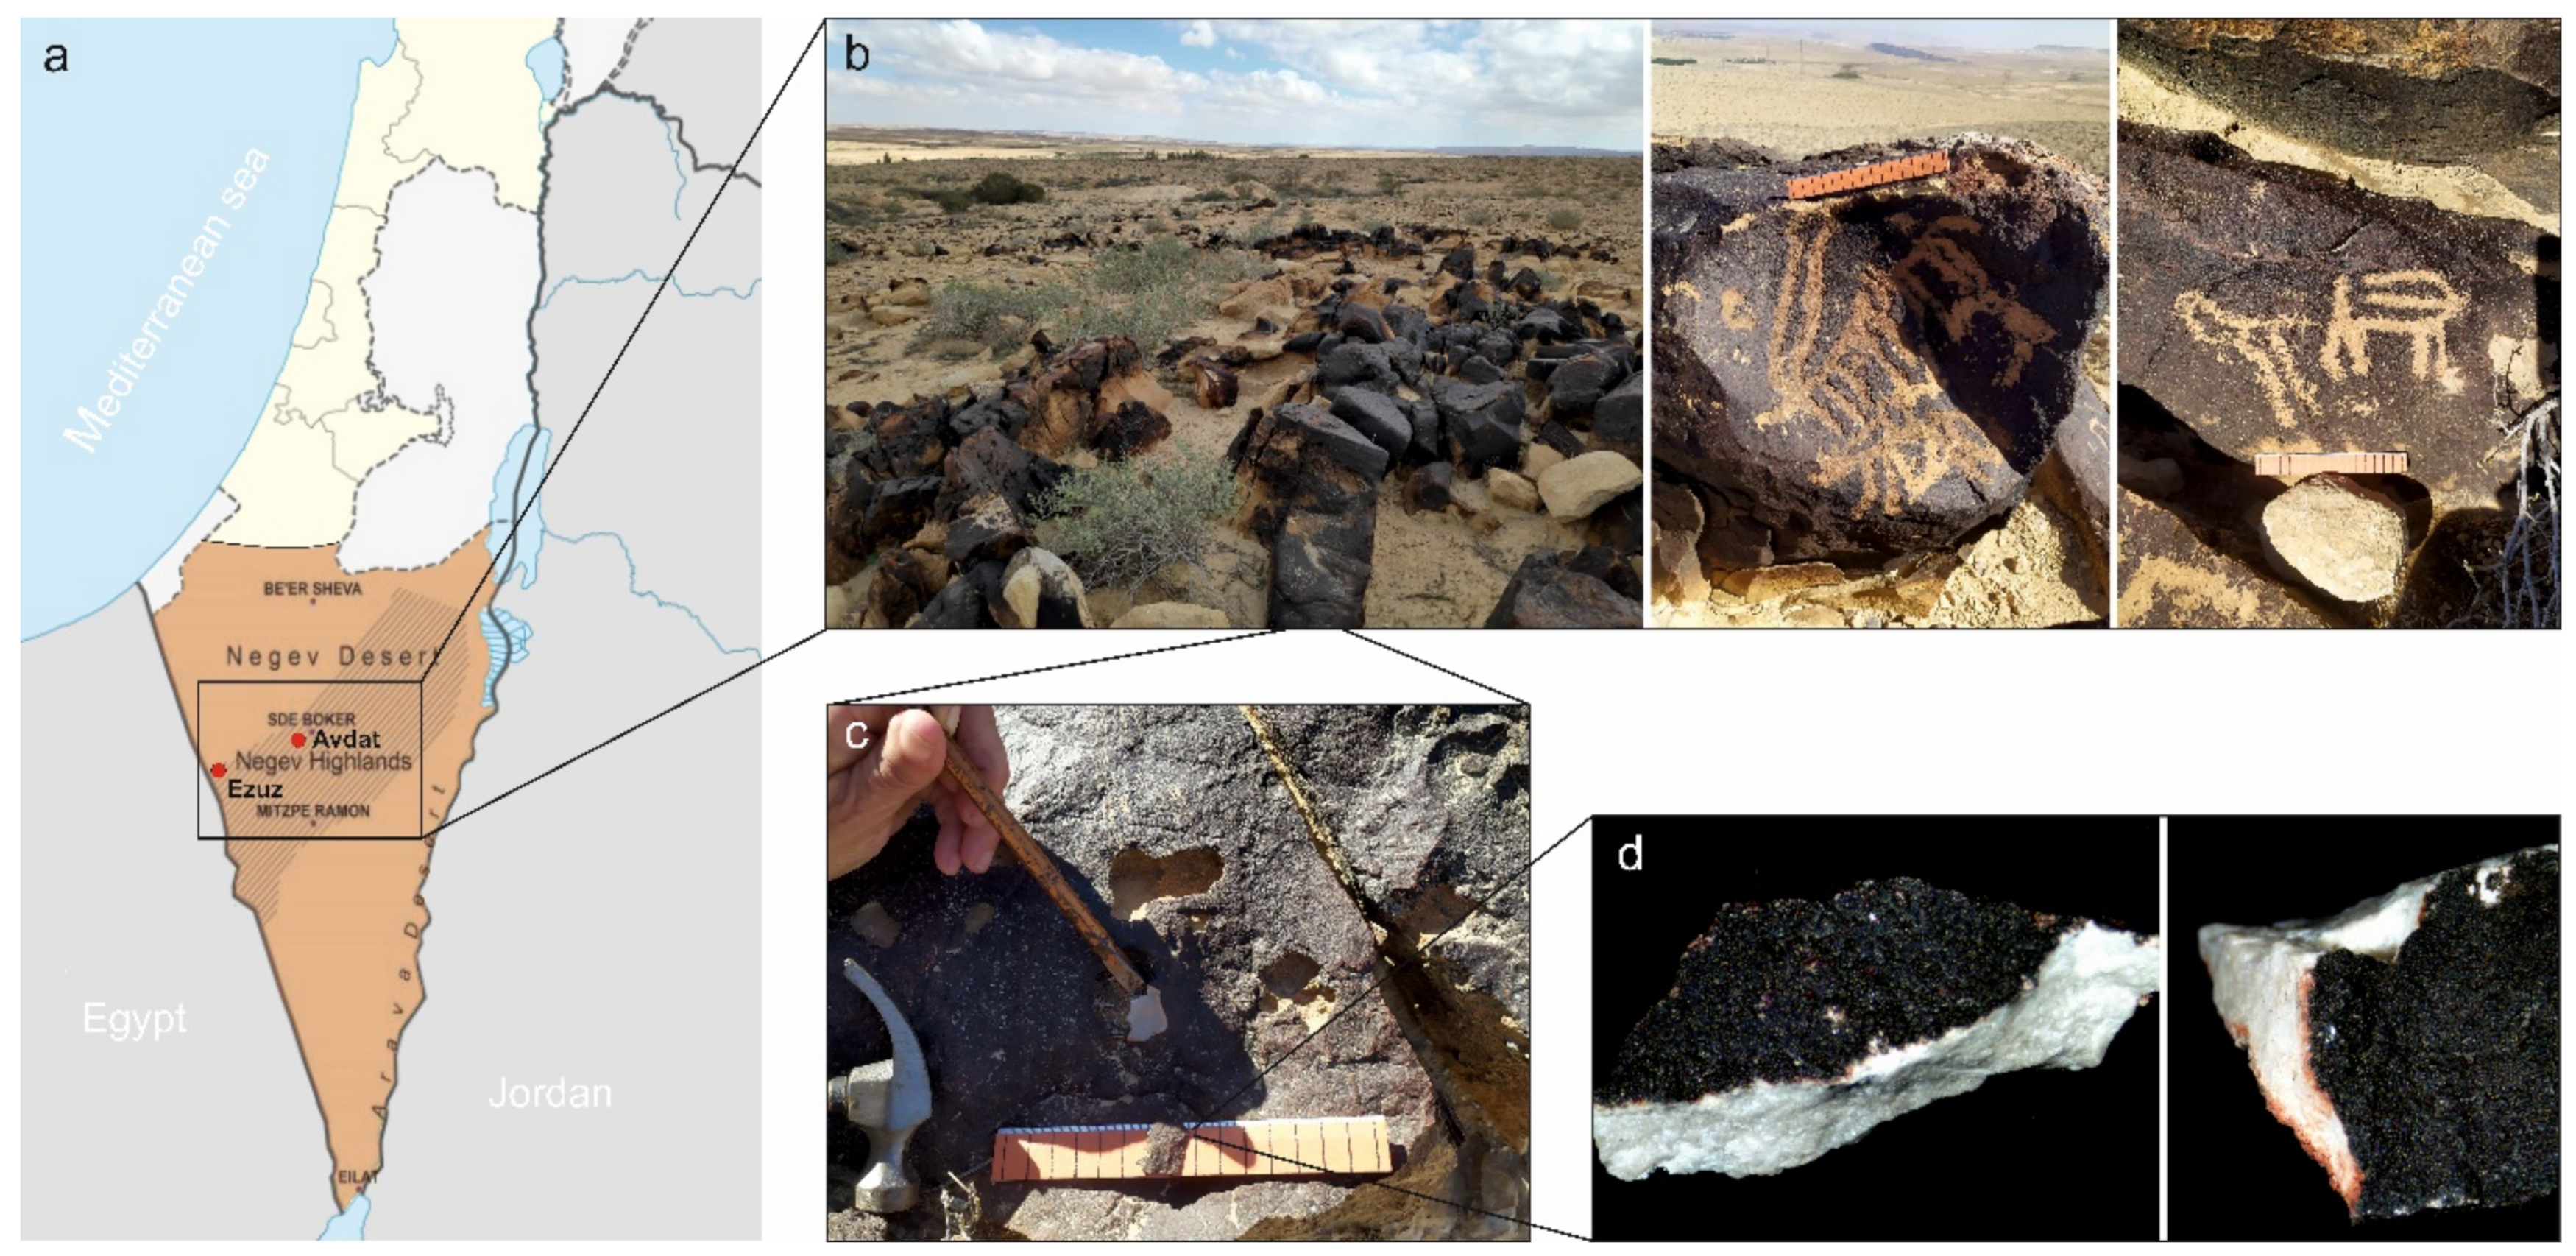
2.1. Study Location and Sampling

Two petroglyph sites in the Negev desert were considered for this study (Figure 1a,b): one is located in the central highlands, close to the ruins of the ancient city of Avdat (N 30″47′10°; E 34″46′20°), and the second one is in the west highlands close to the community settlement of Ezuz (N 30″48′5°; E 34″28′30°).
Both areas are considered an arid climatic zone. The annual temperature in this region ranges between −3.5 °C in winter and 40 °C in summer (Israel Meteorological Service, Sde Boker station), while precipitation ranges from 90 to 100 mm, mostly during the winter season [34,35]. There are about 200 nights of dew/year, providing abundant liquid water for microbial lithobiontic colonization in this desert [36].
Sampling was carried out during winter (February and March) 2021. In these months, meteorological measurements were implemented with an in situ monitoring system (situated at Carmey Avdat farm, about 100 m from the petroglyph sites) to define local environmental factors. The monitoring system contained a Campbell CR6 data logger (Campbell Scientific Inc., Logan, UT, USA) with sensors for air temperature (°C), air relative humidity (RH), and rock surface temperature (thermocouples). In addition, it can also measure the amount of rain received in the area. The data are recorded every 15 min and every whole hour. Thus, it was found that the air temperature from January–April 2021 ranged from a minimum of 1.9 °C to a maximum of 38.5 °C, with daily temperature fluctuation up to 20 °C, and the area received 22.5 mm of rain (Supplementary Figure S1a,b). Additionally, previous measurements revealed that the average rock surface temperature was relatively higher than the average air temperature, reaching up to 56.3 °C in summer.
The stone samples were collected from similar rock types (limestone covered with desert varnish) in close proximity to the petroglyphs using a hammer and chisel previously sterilized with 70% ethanol (Figure 1c,d). Seven sampling points were chosen, and from each one different slabs of rock surface, about 3 cm × 3 cm in size, were taken and placed in sterile plastic bags (Table 1). For each sampling point, part of the slabs was transferred to the Ben Gurion University of the Negev, Be’er Sheeva, Israel where Raman and XRF analysis were done, and part to the microbiology laboratory of the Academy of Fine Arts of Vienna, Austria, where the rest of the analyses were performed.
Six of the samples (AV1, AV2, AV3, EZ1, EZ2, EZ4) were prepared as polished petrographic thin sections. The samples were vacuum-impregnated with epoxy resin from Struers, Denmark. For better visualization of the porosity of clear minerals, the resin was dyed with a blue dye (EpoBlue from Buehler GmbH, Düsseldorf, Germany). After impregnation, the samples were cut into thin sections, mounted on glass slides and polished to approximately 30 µm in thickness. The samples were left uncovered for analysis by transmitted and reflected light optical microscopy and SEM–EDX.

2.2. DNA Extraction, Whole Genome Amplification (WGA), Library Preparation and Sequencing

To assess the composition of the stone microbiome, genomic DNA was extracted from 4 samples using the FastDNA SPIN Kit for soil (MP Biomedicals, Illkrich, France) following the instruction of the manufacturer. For each sample, two DNA extractions with 0.5 g of crushed stone were performed, and the obtained DNA was pooled to proceed with the library preparation. DNA yields were quantified using a Qubit 2.0 fluorometer (Thermo Fisher Scientific, Waltham, MA, USA) with the Qubit dsDNA HS Assay Kit. The “Premium whole genome amplification protocol” available in the online Oxford Nanopore community was followed to perform the WGA and library preparation. All reactions for the WGA were executed in a BioRad C 1000 Thermal Cycler. The REPLI-g Midi Kit (Qiagen, Hilden, Germany) was employed, which uses innovative multiple displacement amplification (MDA) technology. Library preparation was performed following all the steps described by Piñar et al. [37], using the Ligation Sequencing Kit 1D SQK-LSK109 and the Flow cell Priming Kit EXP-FLP001 (Oxford Nanopore Technologies, Oxford, UK).
Once the library was prepared, the MinKNOW™ software 21.02.2 (Oxford Nanopore Technologies, Oxford, UK) was used to perform quality control of the flow cells (SpotOn Flow cell Mk I R9 Version, FLO-MIN 106D) prior to priming and loading of the DNA library. Sequencing was performed in the MinIon Mk1C device for 48 h.

2.3. Sequence Analysis

The latest version of high accuracy basecalling of the fast5 files was conducted with Guppy basecalling software (Oxford Nanopore Technologies, Limited) v5.0.11 + 2b6dbff using the dna_r9.4.1_450bps_hac model. The acquired reads were filtered to obtain Q scores > 9 and to remove adapter sequences (120 bases trimmed at 5′ and 3′ ends). The shortest 5% of all reads were also removed from the analysis. After filtering, the median quality scores were between 13.1 and 13.5, representing a mean error rate of 4.9%. To compensate for the remaining error rate, classification was performed with a more conservative value for the minimum length of partial hits (50).
Taxonomic classification was carried out using Centrifuge v1.0.4 (Johns Hopkins University CCB, Baltimore, MD, USA) with a custom database containing reference genomes for Bacteria, Archaea and Fungi retrieved from NCBI. For Bacteria and Archaea, genomes with complete genome status, and for Fungi, genomes with the complete and draft genome indication were chosen. Addition of draft genomes for Fungi was selected due to their somewhat larger and more complex genomes resulting in a low number of complete genome entries. In addition to the default parameters, the minimum length of partial hits was set to 50, and k, the number of distinct primary assignments per read, was set to 1. Relative abundances were calculated for all genera with a read count abundance of more than 0.5% in at least one sample and used for the clustered heatmap, which was generated with the R package pheatmap. All data are available at the NCBI BioProject PRJNA847191.

2.4. Optical Microscopy (OM)

For preliminary observation of the samples, a stereomicroscope (Wild M650, Heerbrugg, Switzerland) with magnification up to 40× was employed. The system was equipped with a digital camera connected to a computer, and AmScopeX software allowed acquisition of images at different magnifications.
Detailed morphological analysis of the sample surfaces and observations of thin sections were performed using a VHX-6000 digital microscope (Keyence, Osaka, Japan). Observations were completed with plane polarized light (PPL), cross polarized light (XPL) or with normal transmitted light. The microscope has an LED light source (5700 K). With this microscope, it is possible to obtain fully focused images of uneven surfaces by a depth composition function, which also allows the creation of a 3D image with 3D height information. The pictures were recorded using a VH-Z20 objective with a magnification range from 20× to 200× and a VH-Z100 objective with a magnification range from 100× to 1000×. Measurements of features of interest were performed directly with the microscope software.

2.5. X-ray Fluorescence (XRF)

The stone slabs were examined with a portable ELIO spectrometer (XGLab, Milan, Italy) equipped with a rhodium (Rh) X-ray tube with a maximum power of 4 W at 50 kV and a silicon drift chamber detector (SDD) with a thin beryllium window. The X-ray beam had a diameter of about 1 mm. The analyses were carried out in air; therefore, elements with atomic number lower than silicon (Si) cannot be detected. The measurements were performed on the crust of the samples and on the bedrock, positioning the stone slab in such a way that only the contribution of the rock was measured. The time of acquisition was set at 60 s, the excitation voltage was 40 kV, and the tube current was 60 µA. The results were elaborated using Elio Software v1.6.0.29.
With a Dremel tool, the black varnish, the orange layer and the bedrock of one sample were separated, and the loose powders were analyzed with a wavelength dispersive (WDXRF) spectrometer Axios (1 kW) with SuperQ version 5 software (PANalytical B.V. Almelo, The Netherlands). The special software Omnian, based on the fundamental parameter method, was used for quantitative analysis. All elements (from fluorine onwards) that could be identified by the method were summed and normalized to 100%.

2.6. Scanning Electron Microscopy Coupled with Energy Dispersive X-ray Spectroscopy (SEM–EDX)

Small slabs of the stone samples and the thin sections were analyzed by SEM FEI Quanta 200 scanning electron microscope (SEM) combined with an EDX Ametek Octane Pro system. The stone slabs were placed on a sulfur-free carbon adhesive glued onto an aluminum stub. SEM images of the examined surfaces were obtained in low vacuum mode, without the need of a conductive coating, with a secondary electron LFD detector for morphological analysis of the stone slabs or a dual backscattered electrons (BSE) detector for analysis of the thin sections, at 20 kV voltage, an average working distance of 10 mm and a chamber pressure between 70 and 90 Pa. EDX analyses were performed to gain chemical information about areas of interest both as punctual measurement and elemental maps. For punctual measurements, the acquisition time was set at 50 s.

2.7. Micro-Raman Spectroscopy

Micro-Raman spectroscopy was used on the untreated stone slabs to study both the mineralogical and biological components of the crust and associated rock substrate. The measurements were done with a confocal Horiba LabRam HR Evolution (Kyoto, Japan), equipped with a Syncerity CCD detector (deep-cooled to –60° C, 1024 × 256 pixels). The excitation source was a 532 nm laser with power on the sample between 0.5 and 5 mW. Laser power was kept particularly low (>1 mW) on the black crust since some iron minerals are easily transformed when heated up by the laser.
The laser was focused with a 50× LWD objective (Olympus LMPlanFL-N, NA = 0.5) to a spot of about 1.3 mm. The measurements were taken using a 600 g mm−1 grating and a 100 mm confocal hole. Spectral acquisition times were between 3 and 40 s, with variable accumulations from 1 to 10. The spectra were baseline corrected and denoised directly with the instrument’s software (LabSpec 6, v6.5.1.24, Horiba, Kyoto, Japan). Further processing of the Raman spectra, such as normalization, was performed with OPUS 7.5 spectroscopy software by Bruker. Identification of the compounds was done either by comparison to spectra obtained with Raman spectral databases (KnowItAll Informatics Systems 2021, RruffTM Project [38] and Pigments Checker Raman Database [39]) or by comparison with Raman spectra in literature.

3. Results

3.1. Metagenomic Analysis

3.1.1. DNA Yield and Sequencing Analysis

Four sequencing runs were carried out, each in an independent nanopore flow cell loaded with a DNA library prepared from each stone sample. The total reads generated per sequencing run ranged from 1,240,915 to 3,329,384, with total yields between 5.1 to 15.7 Gb. After a first filtering, the total reads per run ranged from 1,080,553 to 2,885,034, and about 2% of the analyzed reads in each sample were phylogenetically assigned. In addition, the mean length of the DNA fragments sequenced was 4678 Kb with an average quality score of 13.2. Details about the sequencing data are summarized in Supplementary Table S1.

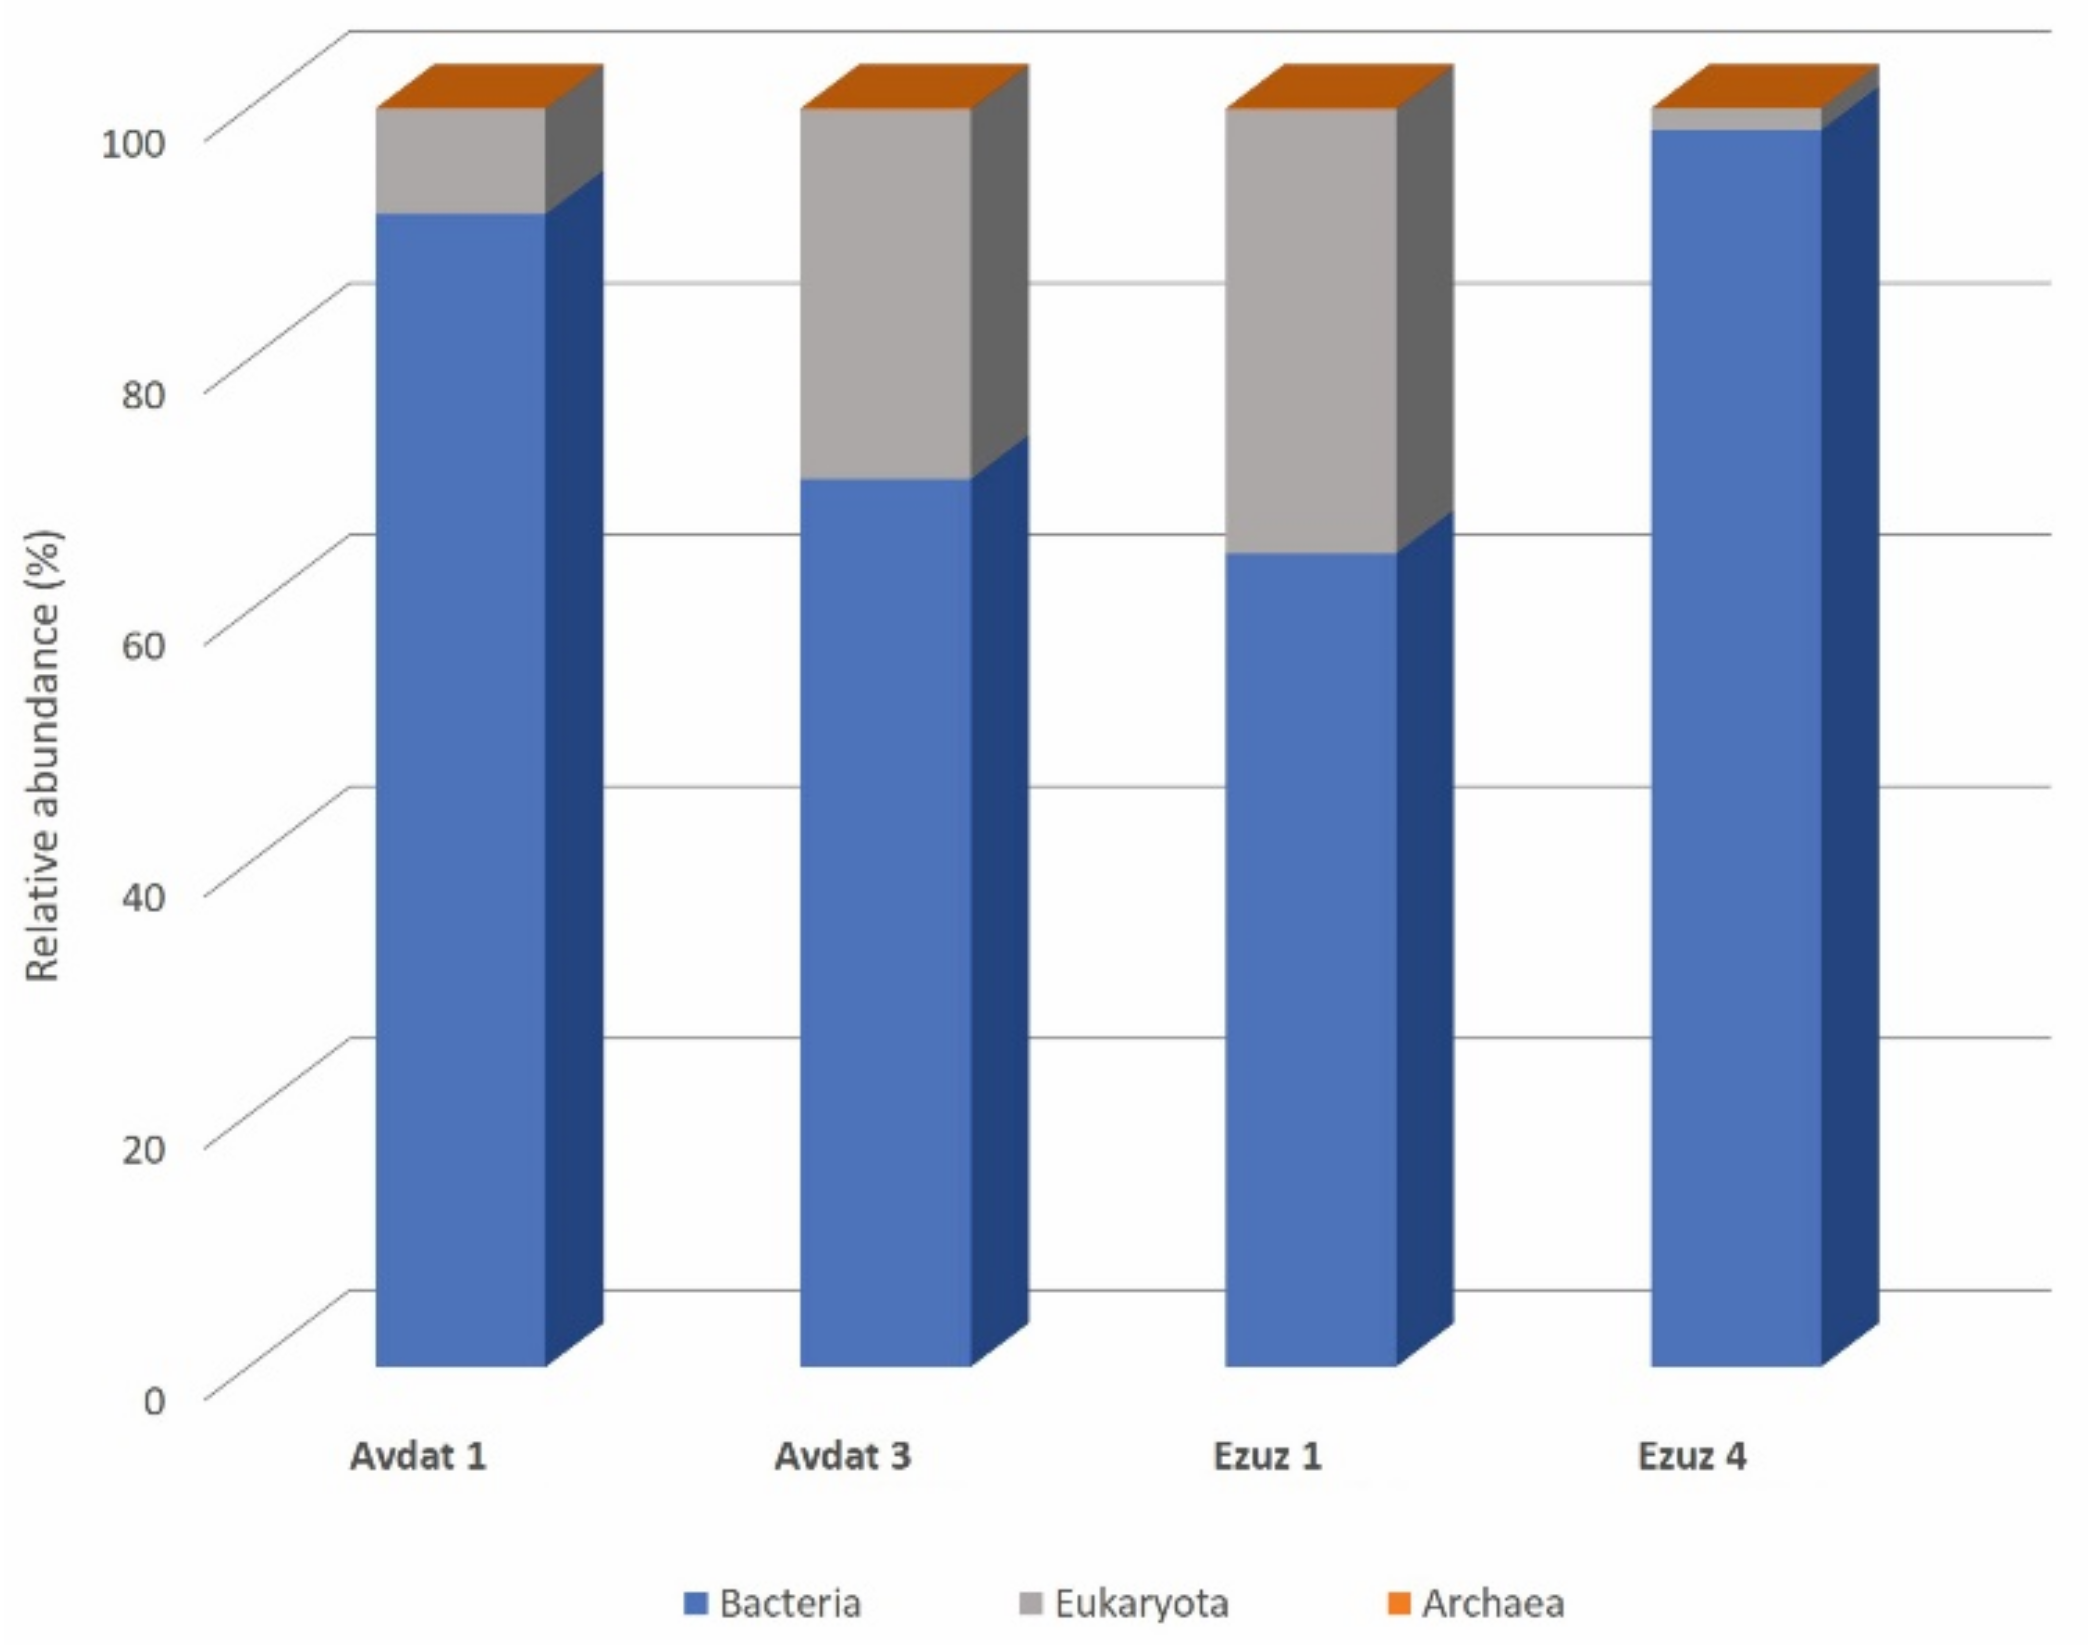
3.1.2. Microbiomes of the Stone Samples

The results of the analyzed reads of the DNA sequencing data that could be phylogenetically assigned revealed a similar distribution of superkingdoms among the investigated samples (Figure 2), showing a microbiome dominated by bacteria, with a lower proportion of eukaryotes and a very small proportion of archaea. More specifically, samples AV1 and EZ4 showed the highest relative abundance of bacterial communities (92% and 98%, respectively), while the microbiomes of samples AV3 and EZ1 showed higher proportions of eukaryotes (29 and 35%, respectively). A very small fraction of identified reads was assigned to archaea, which represented less than 1% of the total microbiome of all the samples.

3.1.3. Bacterial Communities

Analysis of the bacterial communities, which dominated over the eukaryotic communities, revealed six main phyla, namely Cyanobacteria, Actinobacteria, Proteobacteria, Bacteroidetes, Firmicutes and Deinococcus-Thermus, representing together on average 98% of the total bacteria, in addition to some other phyla, each representing less than 0.5% of the total bacterial community and marked as “others” in Figure 3.
The most dominant phylum was Actinobacteria (54–61.5% of bacteria), with the exception of sample Ezuz 1, which showed a massive dominance of the phylum Cyanobacteria (68% of bacteria) and a lower proportion of Actinobacteria (14% of bacteria). The second most abundant phylum was Cyanobacteria in samples Avdat 1 and Avdat 3 (26–39% of bacteria), while in sample Ezuz 4, Cyanobacteria represented only 0.6% of the bacterial community. The phylum Proteobacteria was present with a relative high abundance (21% of bacteria) in Ezuz 4 and with lower proportions in the other samples (1–9%), followed by the phyla Bacteroidetes (6–16% of bacteria) and Firmicutes (0.5–2%). The last two phyla accounted for less than 0.5% in sample Avdat 1. The phylum Deinococcus-Thermus was identified in very low proportions in all the samples, reaching more than 0.5% only in samples Avdat 3 and Ezuz 4 (0.5–0.8% of bacteria).
In Supplementary Figure S2, the relative abundance of the bacterial communities at the class level is presented, while all the genera representing more than 0.5% of the total microbiome in each of the samples are summarized in the form of a heatmap in Figure 4. The heatmap shows the relative abundance of each genus in each sample, highlighting differences and similarities between them.
Within the phylum Actinobacteria, the dominant class was Rubrobacteria, with all the members identified belonging to the Rubrobacter genus, present with a very high relative abundance (35–58% of total reads) in all the samples and a lower abundance in Ezuz 1 (8% of total reads) (Figure 4). Members of the class Actinomycetia were detected in all the samples with low relative proportions (0.6–4% of bacteria), but Streptomyces was the only genus present with more than 0.5% relative abundance in samples Avdat 1 and Avdat 3 (Figure 4).
Cyanobacteria were the second most represented phylum within the bacteria and the one with the highest biodiversity, except in Ezuz 4 where no genus of cyanobacteria was significantly abundant (above 0.5% of total reads). Inside this phylum, in samples AV1, AV2 and EZ1, members of the order Nostocales were detected, such as the genus Nostoc, which was present with a relatively high abundance in samples AV1 and EZ1 (~10% of total reads) but was also relatively abundant in AV3 (4% of total reads); the genus Calothrix, present with a relative low abundance (1–2% of total reads), and the genera Richelia and Anabaena were found solely in sample EZ1. Other members of the Nostocales, such as the genera Fischerella, Tolypothrix, Rivularia, and Nodularia were also identified, but contributed less than 0.5% of the total reads. Among the Oscillatoriales, the genus Crinalium, was the most abundant (2–4% of total reads), followed by the genus Allocoleopsis (0.5–2% of total reds) and the genus Oscillatoria, present only with low abundance in samples AV3 and EZ1 (~0.6% of total reads). Members of the order Synechococcales were identified in low proportions only in two samples, being the genus Synechocystis only present in AV1, and the genus Synechococcus only present in EZ1. Whitin the order Chroococcales, the genus Gloeocapsa was the only one well-represented in all the samples, with high relative abundance in EZ1 (9% of total reads) and lower proportions in samples AV1 (5% of total reads) and AV3 (2% of total reads). In addition, the genus Chroococcidiopsis (order Chroococcidiopsidales) was identified in AV1, AV3 and EZ1 in similar proportions (~1% of total reads), while Leptolyngbya (order Pseudanabaenales) was detected only in sample EZ1 (2% of total reads) and in lower proportion in AV1.
The phylum Proteobacteria was present in all the samples, with Gammaproteobacteria class being the most abundant in samples AV1, EZ1 and EZ4. Inside this class, members of the order Moraxellales were detected, such as the genus Acinetobacter, which accounted for over 18% of the total microbiome of EZ4 but was below 0.5% of total reads of the other samples. The genus Psychrobacter was instead identified in significant proportion only in sample EZ1 (Figure 4).
In contrast, members of the class Alphaproteobacteria were more abundant in sample AV3, with the genus Brevundimonas representing 4% of the total reads. Within this class, the genus Mesorhizobium was only significantly represented in sample EZ1.
The phylum Bacteroidetes was well-represented in all the samples except AV1, in which this phylum was below 0.5% of the bacterial reads. Whitin this phylum, the class Cytophagia was the most abundant, with the genus Adhaeribacter being present in AV3, EZ1 and EZ4 (0.7–1.5% total reads) and the genus Hymenobacter only significantly identified in samples AV3 and EZ4. Interestingly, the Pontibacter genus was detected with a relative high abundance (12% of total reads) in sample EZ4 but did not account for more than 0.5% of the total reads in the other samples (Figure 4). The Chitinophagia class was present with more than 0.5% of bacterial reads only in samples AV3 and EZ1. Inside this class, only the genus Filimonas accounted for more than 0.5% of the total reads and was exclusively in sample EZ1.
The phylum Firmicutes was represented in samples AV3, EZ1 and EZ4 with members of the Bacilli class, but each of the identified genera within this class contributed less than 0.5% of the total reads.
Finally, the phylum Deinococcus-Thermus was only significantly represented in AV3 and EZ4 with the class Deinococci, but no genera accounted for more than 0.5% of the total reads.

3.1.4. Eukaryotic Communities

Eukaryotic communities were mainly present in samples AV3 and EZ1 and only represented a low proportion of the microbiome of samples AV1 and EZ4. The eukaryotic sequences were affiliated with the fungi kingdom, in which the phylum Ascomycota represented more than 98% of the total fungi reads, with the phylum Basidiomycota around 1%. The phylum Mucoromycota was present only in two samples with very low relative abundance, less than to 0.1%.
The relative abundance of fungal communities at the class level is reported in Supplementary Figure S3. Within the phylum Ascomycota, the Dothideomycetes class was dominant in samples AV1, EZ1 and EZ4 with a very high relative abundance (42–58% of fungi) and accounted for 19% in sample AV3. The classes Sordariomycetes, Leotiomycetes and Eurotiomycetes were represented in all the samples with similar proportions, ranging from 7 to 17% of the total fungi, followed by the class Pezizomycetes, which contributed between 1 and 6% of the total fungal reads. The class Lecanoromycetes was well-represented in sample AV3 (21% of fungi) and in lower proportion in AV1 and EZ1 (1 and 7%, respectively). Finally, the class Orbiliomycetes was only significant in sample AV3 (0.6%).
The phylum Basidiomycota was mainly represented by the Agaricomycetes class, present with low relative abundance (~0.6% of fungi) in samples AV1, AV3 and EZ4.
Differently from the bacterial communities, which clearly showed the dominance of some genera, fungal communities revealed very high biodiversity but no dominant taxa, with most of the genera accounting for less than 1% of the total microbiome of each sample. Nevertheless, in samples AV3 and EZ1, a few genera contributing with higher proportion were detected (Figure 4). In sample AV3 the genus Letharia (class Lecanoromycetes) represented 6% of the total reads, while the genus Tuber (class Pezizomycetes) and the genus Pseudogymnoascus (class Leotiomycetes) accounted for 1.3% of the total microbiome. In sample EZ1, the genera Alternaria (class Dothideomycetes), Lachnellula (class Leotiomycetes), Letharia (class Lecanoromycetes) and Metarhizium (class Sordariomycetes) were present with a relative abundance of around 2.5%, while the genera Diplodia (class Dothideomycetes), Talaromyces (class Eurotiomycetes) and Verruconis (class Dothideomycetes) made up between 1 and 1.9% of the total reads.

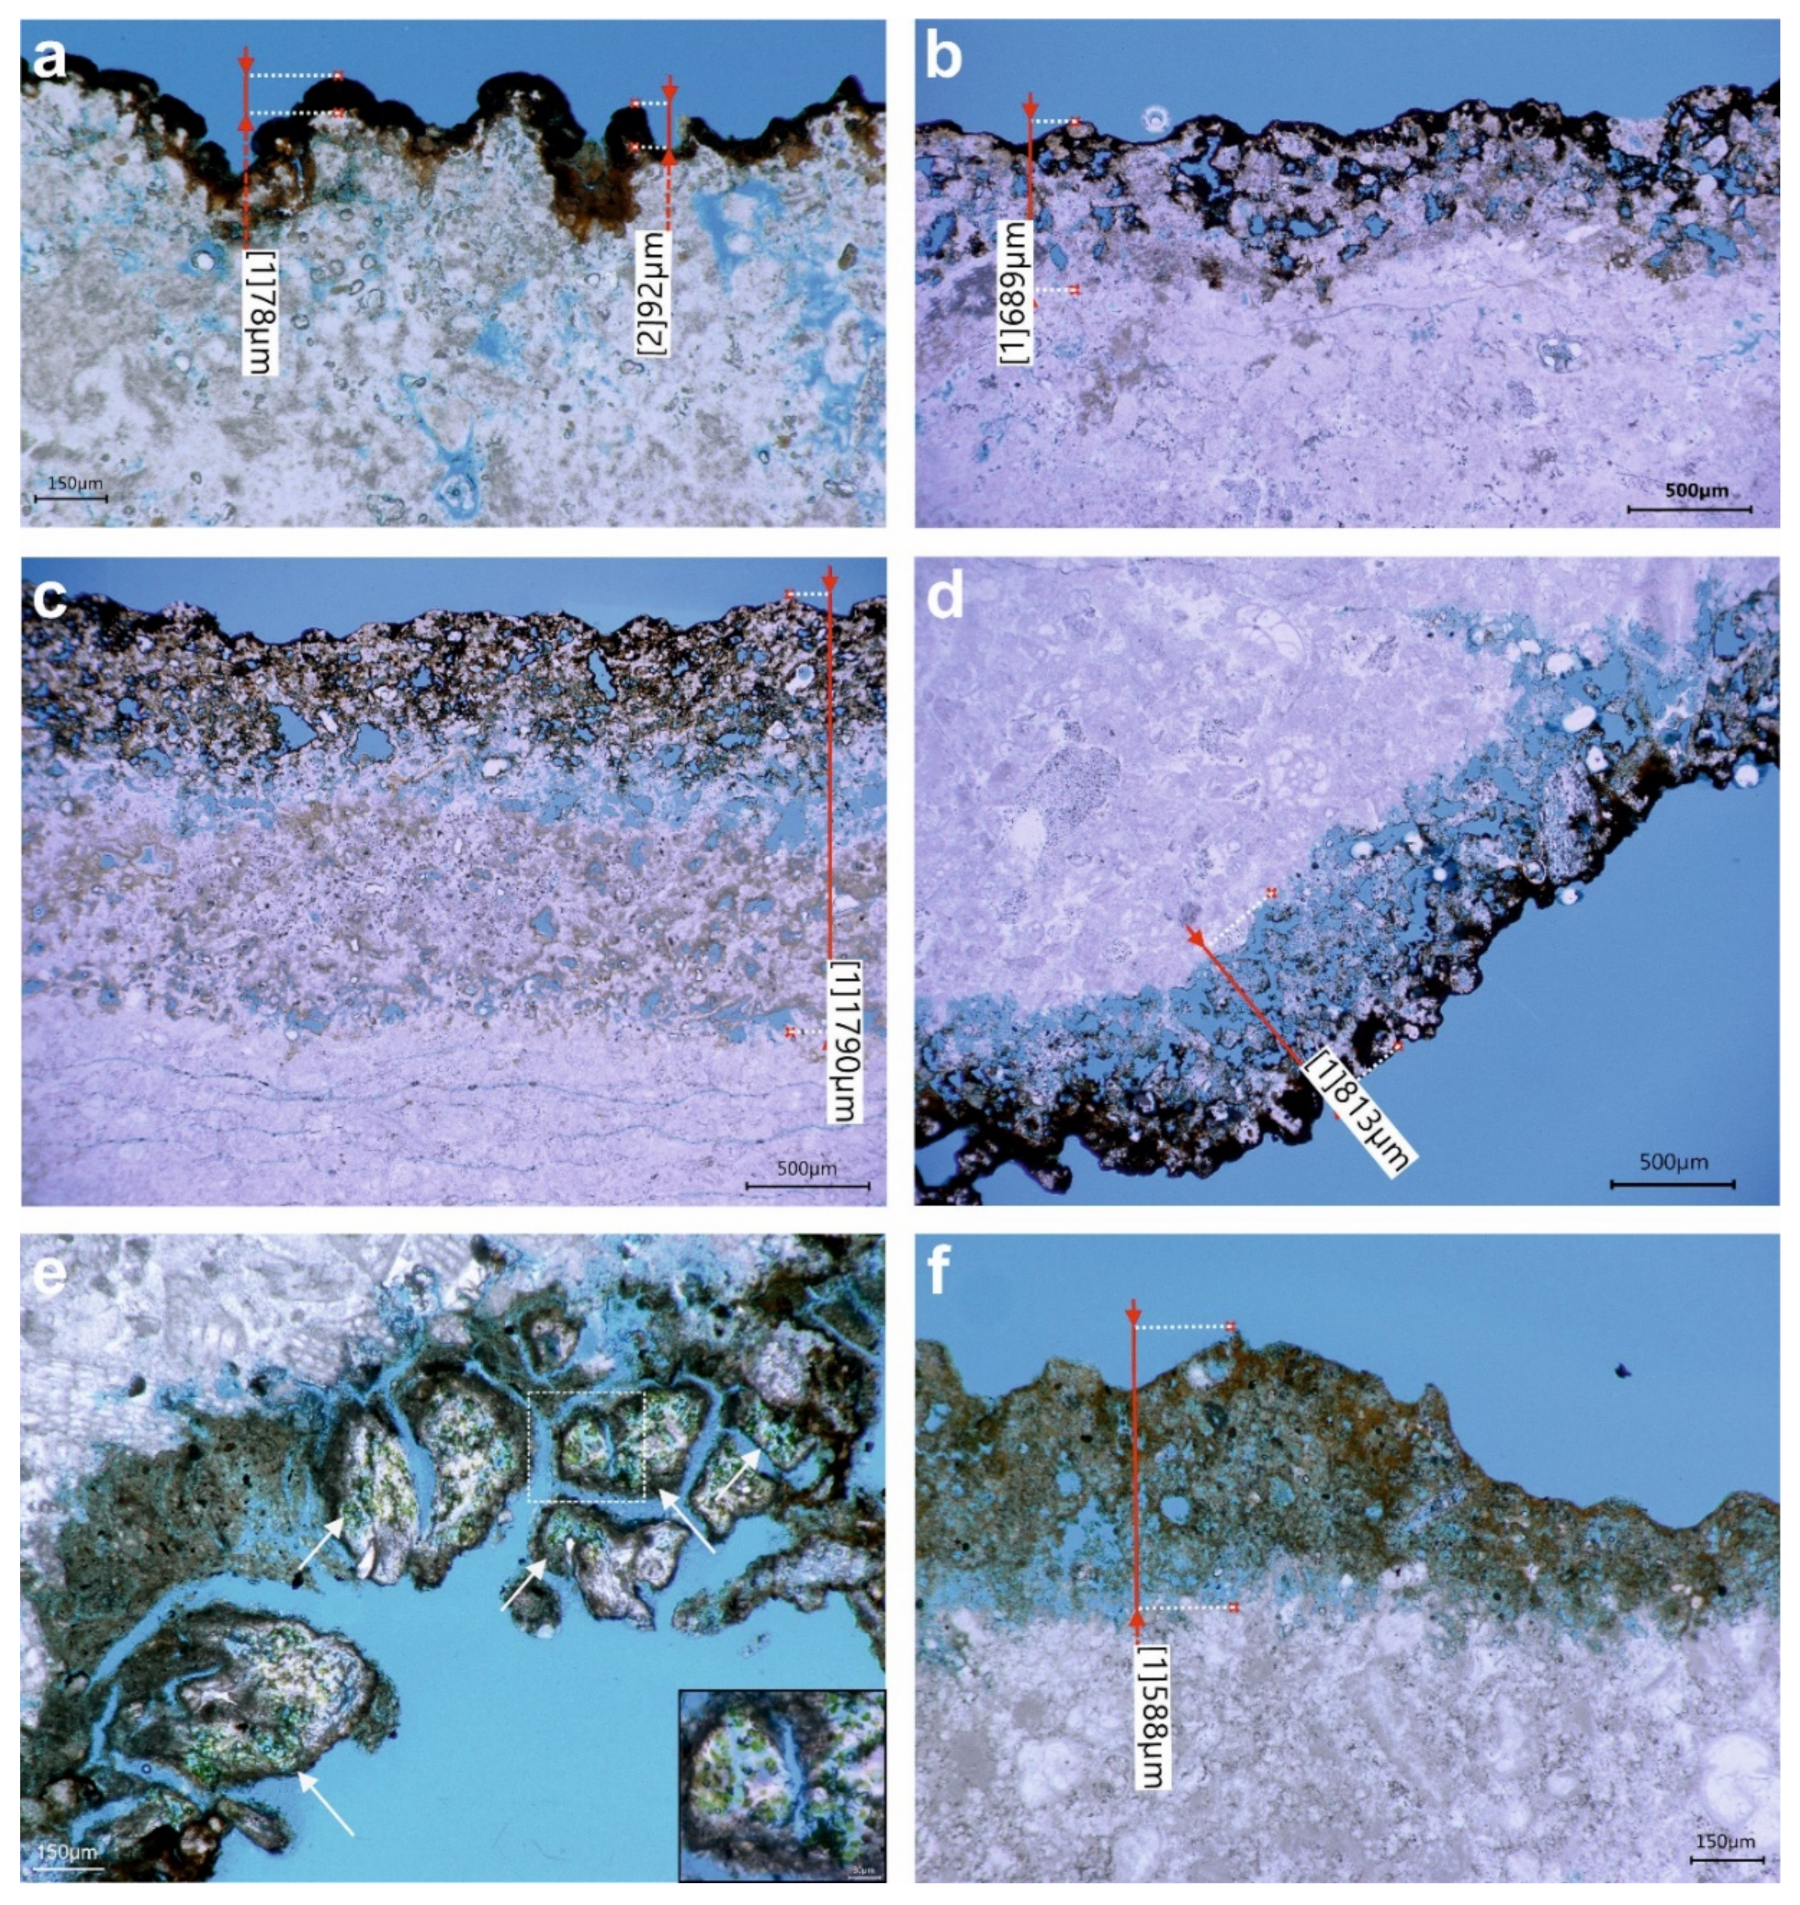
3.2. Digital Optical Microscopy

The samples collected from the petroglyph sites were first studied under the microscope without any preparation to gather an overview of their physical characteristics (microscope images of the samples are reported in Supplementary Figure S4), while microscope observation of thin sections allowed us to evaluate different aspects such as the thickness of the varnish, the possible presence of weathered areas in the bedrock, and where visible, the penetration of microorganisms in the stone.
Six of the rock samples (AV1, AV2, AV3, EZ1, EZ2, EZ3) collected from the petroglyph sites are coated with a black crust (Supplementary Figure S4a), the so-called desert varnish. It has been observed that underneath the thin black outer layer, a bright reddish layer is present, which is intermixed with the stone grains (Supplementary Figure S4b). The black varnish has a compact, shiny appearance, but when observed under microscope, the surface is not homogeneous and presents reddish and white patches. Indeed, in the highest points, the black layer is missing and the orange layer or the white rock are exposed. In the lowest points (depressions) an accretion of brownish material is visible, with an accumulation of dust grains in the micro-basins. The appearance of the black crust can vary from sample to sample and be thinner and/or more intermixed with the reddish layer (Supplementary Figure S4c). In addition, the black crust does not occur homogeneously throughout the same sample, and different stages of weathering of the outer black layer can be observed. Sample EZ4 differs from the others and is covered by an orange crust (Supplementary Figure S4d). In some areas of sample EZ4, it appears that traces of the black varnish are present. Finally, the presence of cyanobacterial aggregates was extensively detected in the samples (Supplementary Figure S4e,f).
The thin sections showed that the limestone bedrock of all the samples mainly consists of microfossils of foraminifera, bryozoans, diatoms and turritella. Samples AV1, AV2, AV3, EZ1, EZ2 and EZ3, which are characterized by the black coating, presented similar features.
The black varnish has a variable width, ranging from about 20 µm in the thinnest areas to about 130 µm in the thickest parts (Figure 5a), but never exceeding 150 µm. The reddish layer is not homogeneously distributed and is present only in some areas. What is clearly visible in all samples is a weathered area underneath the varnish. In Figure 5b–e, examples of this phenomenon are shown. The zones below the black varnish appear to be moderately to heavily weathered, and grains of the bedrock have been leached, leaving behind a very porous area with an average depth of about 800 µm but that can also reach about 1.8 mm, as observed in sample EZ3 (Figure 5c), which shows different layers of weathering. In the porous weathered areas, it can be noticed that the cavities and pores close to the surface are coated by the dark crust (see also Supplementary Figure S5). In other areas, beneath the black coating, the bedrock is heavily weathered, and the stone appears completely fragmented into small particles with loose arrangement (Figure 5d). In these areas it can be observed that the shells of the fossils seem to be more resistant to the weathering processes and remain almost intact, while the softer stone matrix is leached. In sample AV1, mixed with the loose grains of the weathered stone, we observed a granular brown material. Aggregates of cyanobacteria colonized this area, as is well-illustrated in Figure 5e. It can be noticed that in this zone, the black varnish appears completely fragmented and detached from the bedrock, and in some areas is no longer present.
A different situation was observed in the thin section of sample EZ4. The orange crust is very porous and reaches a thickness greater than 1 mm. Interestingly, underneath the orange layer, no weathered area was observed. The bedrock looks undamaged till the boundary with the crust. Here, the stone seems to gradually merge into the orange layer (Figure 5f).

3.3. X-ray Fluorescence Spectroscopy (XRF)

Preliminary analysis performed with the portable XRF showed that the dominant elements of the black varnish (samples AV1, AV2, AV3, EZ1, EZ2, EZ3) are Fe, Mn and Si, with lower counts of K, Ca and Ti, thus in agreement with the composition described in the literature, i.e., clay minerals mixed with iron and manganese oxides. In sample EZ4, which does not have the black crust but presents instead a thicker orange crust, Mn shows much lower counts or, depending on the spot of analysis, is not present at all. Fe presents high counts, while Ti, K, Ca and Si are detected with low counts. The bedrock is mainly composed of Ca and Si.
To better understand the composition of the different layers (white bedrock, black coating and orange layer beneath it) the powders obtained from each layer of sample AV1 were analyzed with WDXRF, and the results are reported in Table 2.
The results confirmed that the black varnish is rich in Fe and Mn with a high content of Si and lower of Ca and highlighted the presence of light elements (not detectable with the portable XRF) such as Mg, Al, P and S in the sample. Mg is present in higher amounts in the bedrock, while Al, S and P showed the highest percentages in the black varnish, followed by the reddish layer. Low amounts of Ti and Ba were also detected in the black and reddish layers; the latter being present only in the black varnish. While Mn is mostly present only in the black coating, Fe is present in higher amounts also in the reddish layer, which seems to be composed mainly of Si and lower percentages of Ca, Al, K and Mg. In the bedrock, in addition to the presence of Ca and Si, low percentages of Mg, Al and Fe were also detected.
Because of the difficulty in accurately separating the layers, some elements might show a higher percentage due to contamination coming from the adjacent layer.
The distribution of the elements in the samples is further discussed in the following section.

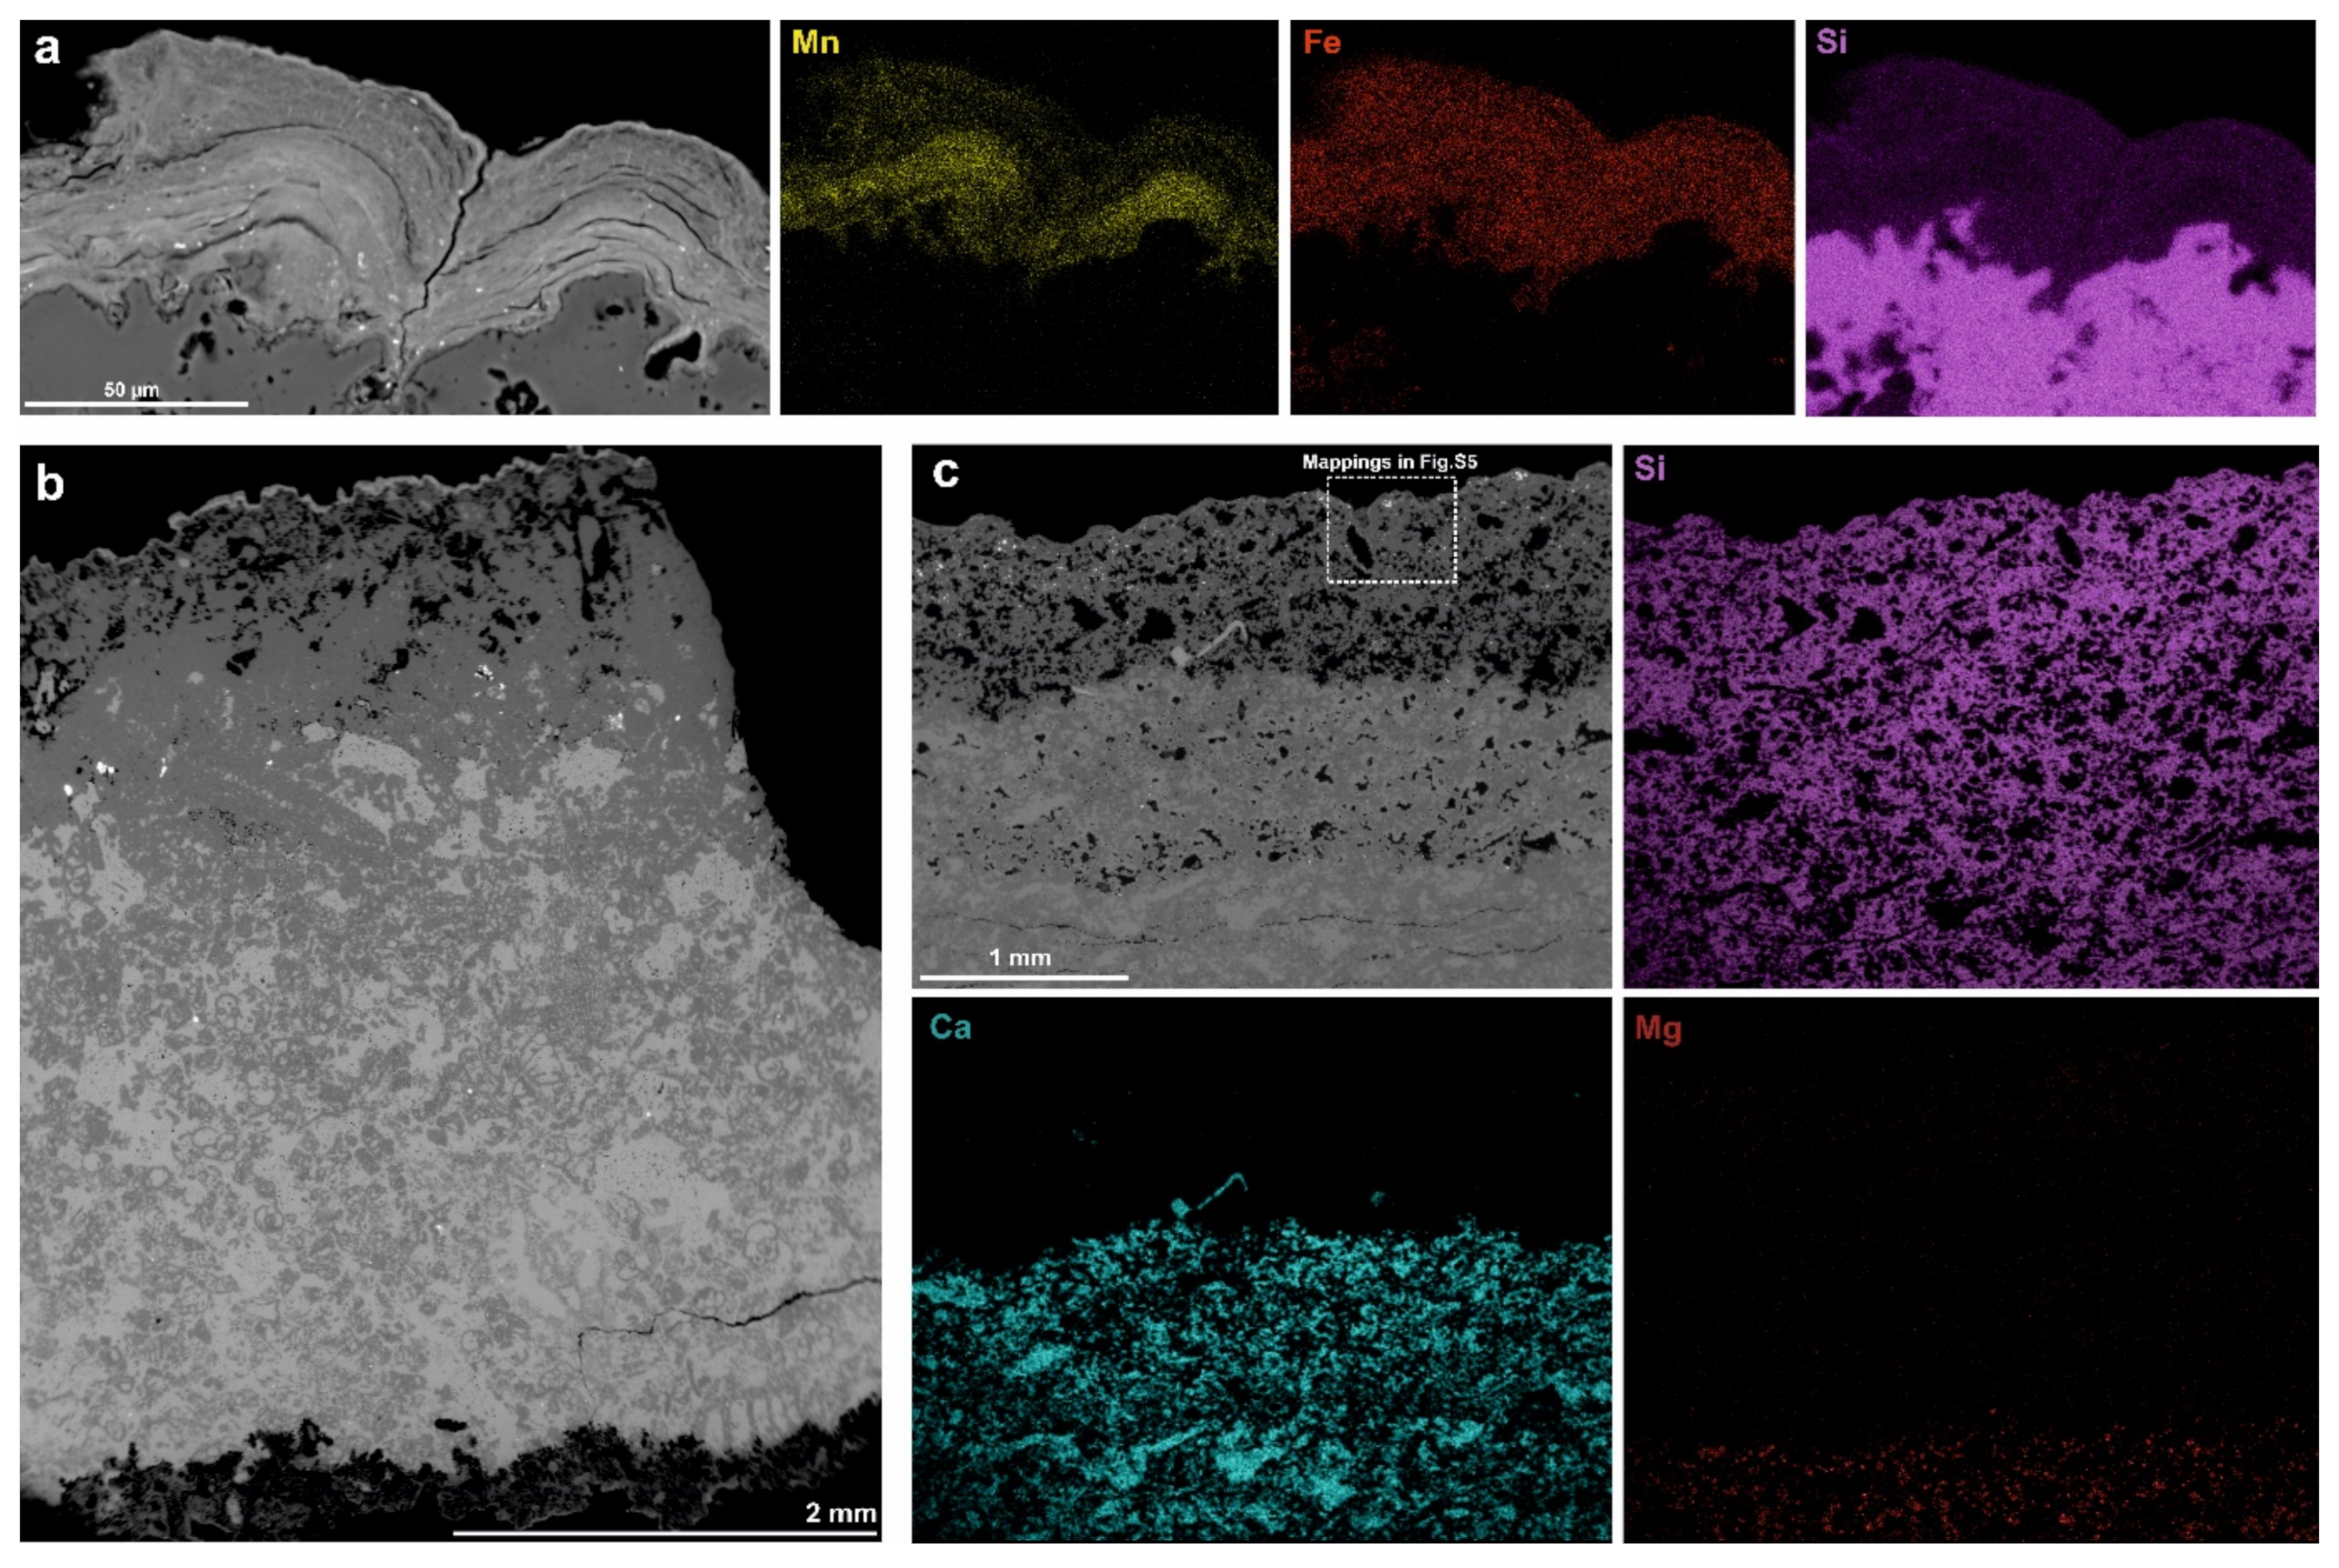
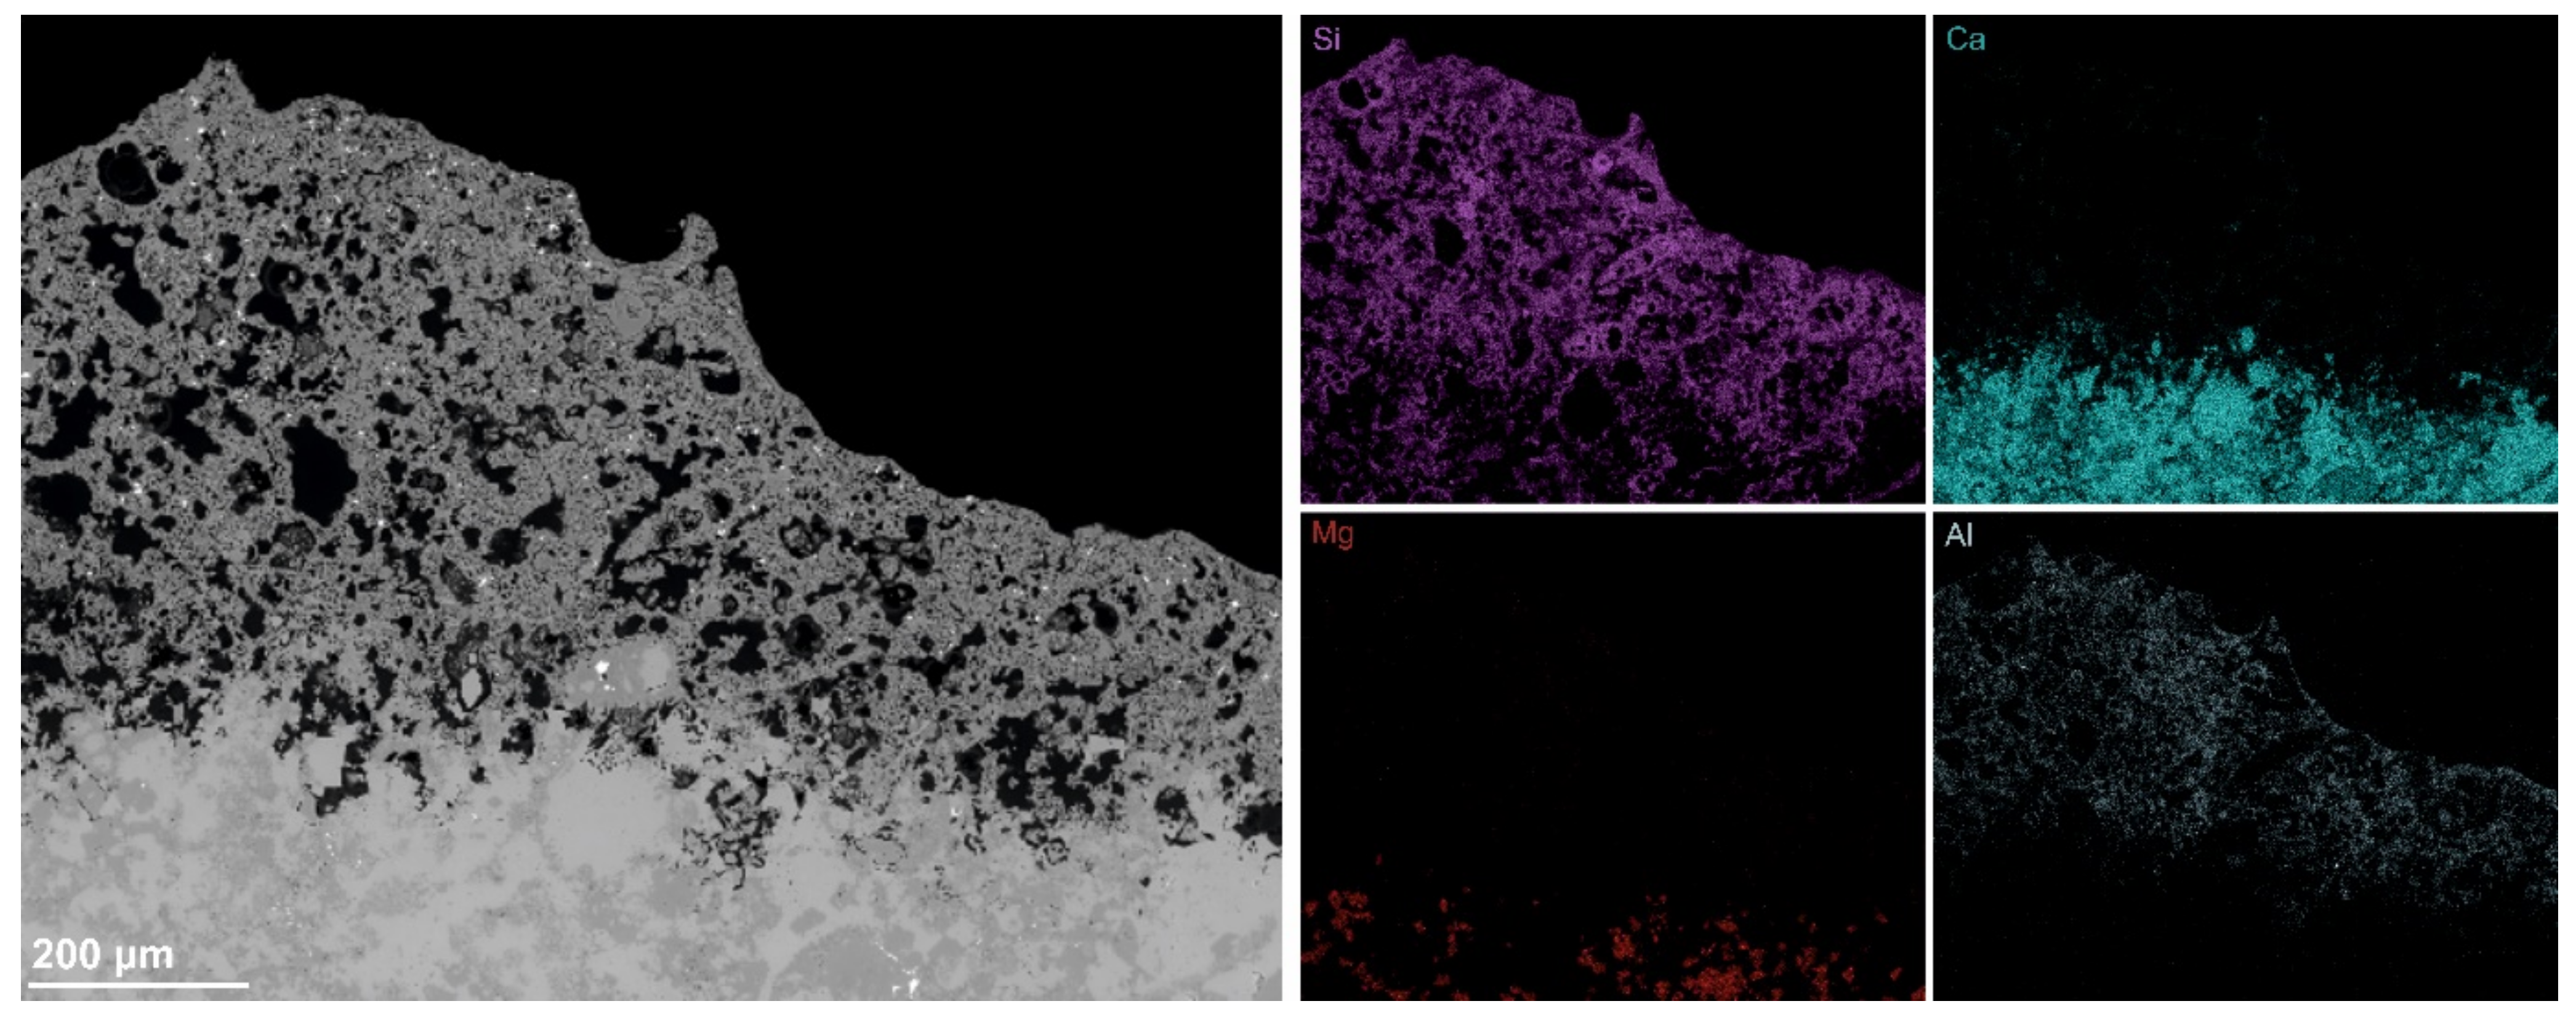
3.4. Scanning Electron Microscopy Coupled with EDX Microanalysis (SEM–EDX)

SEM–EDX was initially used for observation of the stone slabs without any preparation to detect the presence of microorganisms both in the crust and in the bedrock. On the black coating, no biological colonization was detected, but at the transversal section of the samples, putative bacteria (coccoid shape) were revealed (Figure 6a), occupying the microcavities close to the surface beneath the black layer. In other areas of the samples, cyanobacterial biofilms were detected (Figure 6b). In addition, on the surface of sample EZ4, fungal hyphae were observed (Figure 6c).
Observation of surface morphology was also performed by SEM–EDX, and punctual analyses were carried out to locally characterize the elemental composition of the black crust, which exhibits strongest maxima of Si and Al, followed by Fe, Mg and Mn and in lower proportions Ca, K and Ti, thus confirming the results of XRF analysis. The black coating observed from the external surface shows a structure with mounds and depressions, where the upper parts appear smoother and more compact while the lower parts appear more crumbled. EDX performed on different points revealed that Mn is present in higher amounts on the more compact parts, while in areas that appear more crumbled, the peak of Mn is lower or not detected at all.
Examination of the black varnish in the petrographic thin sections revealed a clear micron-size laminated pattern (Figure 7a) with a curved shape and oriented parallel to the surface. This micro texture is defined as a stromatolite structure and is typical of desert varnish [17,19,27]. Mappings of the elemental composition of the black crust revealed that Mn and Fe are not homogeneously distributed, but their content varies in the different layers of the coating. Specifically, we observed that the upper part of the varnish is Mn-depleted, along with the part in contact with the bedrock, while an accumulation of Mn is present in the central area. Other elements such as Al, Mg and K are equally distributed throughout the crust. In addition, accumulation of detrital particles was observed in the depressions of the outer layer. These particles were mostly composed of clay minerals (Si, Al, K, Mg and Fe), while the Mn-rich material that characterizes the varnish is only present in the coating itself (Supplementary Figure S5). Surprisingly, no calcium was detected in the rock beneath the crust, but only silicon, which was in contrast with the results of XRF analyses. Therefore, a more thorough analysis of the bedrock was carried out through EDX punctual measurements, which revealed that the bedrock is composed of a calcitic matrix with lower content of Mg in which silicate grains and silicified microfossils are embedded. Interestingly, backscattered images of the thin sections (sample AV1 is reported as an example in Figure 7b) showed that the bedrock is not homogeneous and, in the areas corresponding to the porous weathered zones previously observed with the optical microscope, the calcitic matrix (light grey) is missing except for sporadic grains, and only the silicate component (dark grey) is left. This phenomenon is clearly illustrated in Figure 7c, where elemental mapping of the weathered area of sample EZ3 is reported. Mg is present only in the intact bedrock (and in the black varnish on the surface), while in the weathered layer in contact with it we observed an initial leaching of Ca, which then disappears completely in the upper layer, leaving a very porous zone. In this area we observed only the silicate component, which seems to be homogeneous throughout the sample. In the upper layer Al, K, Mg, Fe and Mn are distributed in the black crust, thus along the edges of the pores and on the surface of the sample (Supplementary Figure S5). In this area, barium sulphate was also detected (bright white grains in the backscattered image of Figure 7c) but mostly concentrated towards the surface of the sample (maximum of 400 µm depth).
The backscattered image of sample AV1 (Figure 7b) shows that in the heavily weathered area that lies at the bottom, where aggregates of cyanobacteria were extensively detected by optical microscopy, the Ca and Si components of the bedrock seem to be equally leached, and loosely arranged mineral particles are observed. Mapping of this area indeed revealed that the mineral fragments in the proximity of the cyanobacteria cells are mainly composed of Ca and Si, along with Mg-rich grains and other minerals such as Al, Fe and K (Supplementary Figure S6).
Punctual EDX analysis of the orange crust of sample EZ4 showed that it is mainly composed of Si, Fe, Al and K (as shown by XRF results), and a low proportion of Mn depending on the point of analysis. The elemental mapping carried out on this sample revealed some interesting results (Figure 8). We noticed that the distribution of the elements showed a pattern similar to the one displayed in the weathered areas of the other samples: Ca and Mg are detected only in the intact bedrock, while silicon is homogeneously distributed (in the bedrock and in the orange crust). In addition, the map of silicon showed the presence of silicified fossils in the orange layer. Aluminum is detected solely in the orange layer, with a distribution similar to that in the surface layer of sample EZ3, i.e., more concentrated along the edges of the pores, but in this case it appears more spread throughout the layer. Iron is mostly present in the orange part and seems to be homogenously distributed, while the mapping of Mn did not give a clear distribution.

3.5. Micro-Raman Spectroscopy

Raman spectra acquired on the black varnish were quite complex. Depending on the measurement spot, the spectra displayed different features confirming the heterogeneity of the varnish composition. In many cases, the overall spectral profile matches well the spectral features of the pigment burnt Sienna, which is a mixture of iron oxides, quartz and aluminum oxides. An example is reported in Figure 9a—spectrum A, in which, more specifically, the bands at 224, 291, 408 and 1322 cm−1 can be assigned to hematite (α-Fe3O4), while the band around 670 cm−1 is diagnostic for magnetite (Fe2O3) [40]. In the region between 500 and 700 cm−1, the peaks of the spectra acquired on the black varnish are not well resolved and a broad band with shoulders is observed; therefore, clear assignment of signals is challenging. In this spectral region, the characteristic peaks of Mn oxides are found, so their presence could not be clearly identified. Nevertheless the peaks visible at around 400 cm−1, at 502 cm−1 and at 574 cm−1 (Figure 9a—spectrum B) might be assigned to birnessite or birnessite-like minerals [41], a manganese oxide often reported in the literature as part of the desert varnish [19]. Quartz (sharp band at 465 cm−1) was often identified in the spectra of the black varnish, and in some areas anatase (TiO2) (band at 143 cm−1) and pseudobrookite (Fe2TiO5) were also detected.
The spectra obtained on the orange layer emerging from the black varnish (Figure 9a—spectrum C) showed a spectral profile similar to the one of the orange crust of sample EZ4 (Figure 9a—spectrum D), showing characteristic features of iron oxides (bands around 220, 290 and 400 cm−1) and quartz (bands at 207 and 465 cm−1) at lower wavenumbers. In the range from 1000 to 1800 cm−1, EZ4 presented a complex spectrum, with overlapping broad bands that did not allow clear interpretation. The peaks in this range might be related to organic pigments such as carotenoids combined with amorphous carbon (peaks at 1320 and 1600 cm−1).
The presence of carotenoids was clearly confirmed in a reddish area beneath the black varnish (transversal section of the sample). Indeed, the Raman spectrum of the area analyzed (Figure 9b) showed three sharp bands at 1000 cm−1, 1151 cm−1 and 1505 cm−1 typical of carotenoids, which are characterized by three main skeletal features: the stretching of C=C in the region around 1520 cm−1, the stretching of C–C around 1150 cm−1 and the bending of C=CH around 1000 cm−1 [42].
On one sample, Raman spectra were acquired in a green area visibly colonized by cyanobacterial aggregates. The spectral features of carotenoids were again identified but with a shift in the wavenumbers (1002 cm−1, 1152 cm−1 and 1510 cm−1) compared to the spectrum obtained on the reddish area (Figure 9b). The shift might indicate the presence of a different type of carotenoid pigment in the green area. According to Jehlička et al. [42], the position of the stretching band of the C=C group is diagnostic for the discrimination of different carotenoids, and they assigned the band at 1506 cm−1 to the carotenoid pigment bacterioruberin and the C=C signal at higher wavenumbers (1510 cm−1) to β-carotene. The positions of the two bands correspond very well to the one shown in the Raman spectra of carotenoids obtained in this study: 1505 cm−1 in the case of the orange spot and 1510 cm−1 in the case of the green spot. Despite this, attribution of the two spectra to one carotenoid pigment rather than the other cannot be certain solely by Raman spectroscopy.
In addition, the signal of carotenoids on the green spot was detected along with calcite (band at 1084 cm−1), while on the orange area anatase (band at 141 cm−1) was also identified.

4. Discussion

The multi-analytical approach used in this study allowed us to characterize the microbiome of stones associated with petroglyph sites and, at the same time, to characterize the lithic substrate, thus obtaining a deeper knowledge of possible mineral–microbial interactions.
The microbiomes of the samples were generated using nanopore sequencing technology, which has been employed in different studies in the cultural heritage field [37,43,44,45], showing some advantages compared to next-generation sequencing methods. In fact, this technology, which offers an easier workflow and much more affordable prices, when combined with whole genome amplification (WGA) protocol allows simultaneous obtainment of the real proportions of different groups of microorganisms (fungi, bacteria and archaea) as a whole in a given sample, which was one of the first aims of this study.
The microorganism communities associated with rock varnish have been previously studied to determine whether or not there is a connection between the varnish and the microorganisms inhabiting the stone. The results of our metagenomic study are consistent with the findings reported in the literature [25,33], revealing a microbiome dominated by bacteria, with lower proportions of eukaryotes, and archaea representing less than 1% of the total assigned reads. Within the bacteria, Actinobacteria and Cyanobacteria were the most abundant phyla, followed by Proteobacteria and Bacteroidetes, as found also by other authors in metagenomics studies on microbial communities of stones in desert environments [16,27,30]. Notable is that sample EZ4, which does not present the superficial black varnish, showed a different microbiome, in which the genus Rubrobacter (Actinobacteria phylum) together with the genus Acinetobacter (Proteobacteria phylum) and the genus Pontibacter (Bacteroidetes phylum) made up almost 90% of the total reads, while Cyanobacteria represented less than 1%.
In the other samples (AV1, AV3 and EZ1), Cyanobacteria represented between 26 and 39% of the bacterial communities, with a rather high biodiversity. Cyanobacteria are common photoautotroph bacteria inhabiting rocks in desert environments [29,46,47]; they are considered primary producers with the ability to withstand stressful environmental conditions due to their thick cell wall and the production of protective pigments such as scytonemin and carotenoids, which protect them against photooxidative damage [16,48]. Among the cyanobacteria, the order Nostocales, a nitrogen-fixing family that contains several pigment-secreting taxa, was dominant, with Nostoc spp. being the most abundant. The order Nostocales was previously reported to be desiccation resistant [49] and radiation tolerant and a dominant taxa in hypolith communities of the Atacama desert [50]. The genus Crinalium (order Oscillatoriales) and the genus Gloeocapsa (order Chroococcales) had relatively high abundance in our samples and are also known to be well adapted to harsh environments [51,52]. Within the order Chroococcales, the extremely desiccation and radiation resistant genus Chroococcidiopsis is often indicated as dominant in cyanobacterial communities on stone in deserts [27,53,54]; however, in our study it represented only around 1% of total reads.
Cyanobacteria, as many other microorganisms, can form biofilms, which have huge weathering potential [55] and can cause both physical and chemical degradation of the stone. The physical actions involve breaking of the surface and penetration of the microorganisms between the grains of the rock with consequent decreases in grain cohesion, while chemical actions include dissolution and chelating processes bringing chemical changes to the stone substrate [56]. In our study, through optical microscopy and the use of SEM, we could visualize areas of the samples with cyanobacterial biofilms that were heavily weathered. In fact, associated with cyanobacteria aggregates, we observed disintegration of the rock, with loose mineral fragments and consequent detachment of the black crust (Supplementary Figure S6). Species of the genus Gloeocapsa, which was relatively abundant in our samples, and of the genus Leptolyngbya, also detected in our metagenomic analysis but with lower proportions, were, for example, found responsible for the formation of biofilms in historic stone monuments, with resulting bioweathering of the lithic substrate [57].
Within the Actinobacteria, the genus Rubrobacter was very dominant in all the samples (as clearly visible in the heatmap of Figure 4). Rubrobacter spp. are often associated with desert varnish and in general as a bacterium inhabiting stones in desert environments [16,58]. This genus is known to be highly resistant to many types of environmental stress, such as exposure to gamma and UV radiation, desiccation, high temperature fluctuations, low water availability and high levels of salts [59,60]. In fact, Rubrobacter spp. are often reported to grow on walls and stone monuments rich in salts, causing the so-called rosy discoloration due to the release of carotenoid pigments such as Bacterioruberin [61,62,63].
The genera Pontibacter, Hymenobacter and Adhaeribacter are also highly radiation resistant bacteria [64] with the ability to synthesize carotenoids and indeed show pink to red shades [65,66].
The eukaryotic communities were affiliated with the fungi kingdom, which was mostly represented by the phylum Ascomycota. High biodiversity at the genus level was observed, but each genus showed low proportion and no dominant taxa, except for a few genera contributing with slightly higher proportions, such as Letharia, Alternaria, Lachnellula, Metharizium and Talaromyces. Most of the fungi detected are not stone-dwelling species, but they are found ubiquitously in the environment and are probably deposited on the stone as spores. In fact, we found little evidence that fungi are established on the rock surface. Within the fungi detected in this study, only the order Chaetothyriales, with Exophiala spp. and the genus Coniosporium, with the Coniosporium apollinis species, might actually be established on the rock. The aforementioned fungi are in fact part of the black fungi, or black meristematic fungi group, which have an extraordinary tolerance to extreme environmental conditions and are known to inhabit stone surfaces in hot deserts and moderate climates [67,68,69].
Previous studies mentioned the presence of fungi and lichens, such as Caloplaca sp., as a weathering agent of rock substrates due to the production of oxalic acid and consequent formation of calcium oxalates that can facilitate the disintegration of the calcareous matrix [33]. In this study, however, we could not detect the presence of calcium oxalates. Further culture-dependent and culture-independent microbiological studies are being carried out to have better insight of the fungal communities associated with the rocks of petroglyph sites.
The characterization of the black crust through XRF and SEM–EDX analysis confirmed that the varnish is composed of clay minerals and Fe and Mn oxides, as reported by many studies [18,23,24]. Specifically, the varnish is highly enriched in Mn compared to the windborne dust deposited in the micro-basins of the surface. This was proven both by punctual EDX analysis, which showed that the crumbled parts of the surface (loose material) have low Mn content compared to the compact surface of the varnish, and SEM–EDX elemental mapping, in which it is clearly visible that the dust deposited in the depressions of the crust is mainly composed of Al, K and Fe, while Mn is concentrated in the actual varnish layer. Enrichment of Mn in the varnish layer by a factor of ~100 [19] compared to its primary source of material, i.e., windborne dust, is one of the main points of discussion in the literature, especially related to whether or not Mn enrichment is due to abiotic [19,70,71] or biogenic factors [26,27,46].
Raman analysis allowed us to partially characterize the minerals present in the black varnish. Identification of iron oxides was quite straightforward, and hematite and magnetite were detected, consistent with the results of other Raman studies on rock varnish [72,73,74]. The identification of Mn oxides was more challenging, as also previously reported by Malherbe et al. [72], who were not able to identify Mn oxides by Raman spectroscopy on the rock varnish analyzed. Nevertheless, our results seem to indicate that birnessite-like Mn oxides might be present, which are addressed as the most common Mn compounds in desert varnish [19]. Interestingly, the Raman spectra of the orange layer of sample EZ4 and of the reddish layer emerging from the black crust of the other samples showed similar spectral features, indicating the presence of iron oxides, a possible presence of Mn oxides, and, at higher wavenumber, the peaks around 1320 and 1600 cm−1 suggested the presence of carbon. Although it is believed that Raman spectroscopy cannot distinguish between biogenic and abiotic sources of carbon, Malherbe et al. [72] address the possibility that the graphitic carbon found on the desert varnish in their study might be the result of “highly thermally process carbonaceous residues from living organisms”.
Raman spectroscopy also pointed out the presence of carotenoid pigments in the samples, which are used by microorganism as protection against radiation, therefore indicative of microbial activity. A wide variety of bacteria detected in this study are known to synthesize carotenoids, for example the bacterioruberin from Rubrobacter spp., which might be the source of the carotenoid pigment we detected on the reddish layer beneath the black crust. We could also prove the presence of carotenoids directly on cyanobacteria aggregates, in which the most common pigment is β-carotene. The Raman measurements to detect biopigments were preliminary, and these results could be implemented in future studies.
The combination of microscope observations and SEM–EDX analysis on the petrographic thin sections showed very interesting results. Optical microscopy unveiled the presence of weathered areas beneath the black crust, and SEM–EDX elemental maps revealed that in these areas only the Si component of the bedrock is present while the Ca and Mg matrix is missing. The same elemental distribution was observed in sample EZ4, in which the orange layer was mainly composed of Si, also highlighting the presence of silicified fossils widely present in the bedrock and the lack of the Ca matrix. These observations brought us to the conclusion that the orange layer, rather than a different kind of superficial crust, might be a weathered area of the bedrock similar to the ones observed in the other samples, but in this case, the superficial black varnish is completely missing. The typical elements normally detected in it, such as Al, K and Fe, are distributed in the weathered area, including also a low proportion of Mn. These observations might suggest that elements present in the black crust had been mobilized by microorganisms, contributing to the slow degradation of the black varnish.
The lack of Ca in the superficial layers of rocks coated by the desert varnish was previously observed by other authors [33,46], who attribute the calcite matrix deficiency to dissolution actions by microorganisms. Biodeterioration of calcareous rocks due to microbial colonization is a well-studied phenomenon [56,75,76,77], and acidification due to the production of carbonic, sulfuric and nitric acids as byproducts of cell metabolisms has been proposed as a possible cause of calcium carbonate dissolution [29,78]. In particular Lian et al. [79] mention cyanobacteria genera such as Gloeocapsa, Nostoc and Oscillatoria as able to degrade calcareous rocks. These cyanobacteria genera were all detected as part of the bacterial communities by the metagenomic analysis carried out in this study. The presence of microorganisms in the microcavities below the crust was detected by SEM analysis; further, by means of Raman spectroscopy, we were able to identify carotenoid pigments in the reddish layer below the dark coating, indicating biological colonization. Moreover, extensive microbial colonization in the cavities and discontinuities of the rocks associated with petroglyph sites through SEM–BSE was previously broadly studied by Nir et al. [33], who identified a complex microbial community (cyanobacteria, heterotrophic bacteria, free-living fungi and lichens) inhabiting the superficial layers of the rocks in which the Ca matrix is no longer present.
Krumbein and Jens [46] state that cyanobacteria and fungi dissolve the carbonates in limestone rocks to reach optimal living conditions such as temperature, humidity and nutrient supply. Indeed, the interior of the rocks can be a suitable niche for microorganisms to survive harsh condition due to better nutrient and water availability [54,55]. In the case of stones covered with desert varnish, this might act as an extra shelter from the extreme environmental conditions [16]. Moreover, Lang-Yona et al. [25] hypothesized that some species might take advantage of the rich transition-metal coating, being able to utilize the varnish minerals; they give as an example the use of Mn by cyanobacteria in their photosynthetic apparatus. Moreover, the authors of this study report that they detect enrichment in the metabolic process genes of microorganisms that relay on varnish-enriched transition metals.
It is known that a wide variety of endolithic microorganism has the ability to mobilize metal cations [55] and in particular iron [72] and manganese, which are key metals used by microorganism for protection against UV radiation. Webb and Di Ruggiero [60] state that the cellular accumulation of Mn by microorganisms might be a widespread mechanism to survive oxidative stress, and they investigated Mn2+ function in Rubrobacter spp., suggesting that Mn–antioxidant complexes are involved in radiation resistance, while a recent study [80] on the radiation resistance of Deinococcus Radiodurans established the key role played by intracellular Fe and Mn in oxidative protection of this microorganism.
In this study, Rubrobacter spp. were dominant in all of our samples, and especially in sample EZ4, and might uptake both iron and manganese from the black crust. Moreover, the genus Rubrobacter, as mentioned previously, is known to grow on stone monuments with the ability to form biofilms and penetrate the porous rock, enhancing mechanical damage through the detachment of mineral grains [62].
These observations support the hypothesis that in sample EZ4, the black varnish might have been degraded by microorganism, including the genus Acinetobacter (18% of total reads of sample EZ4), which is reported to be able to solubilize Al, Si and Fe from rocks [58].
More and more recent studies seem to support the hypothesis that the black crust is of biological origin [25,27,81,82,83] and is possibly produced by microorganisms to protect themselves from the adverse conditions. In our study, patterns of weathering of the black crust are observed, and this might be explained as a succession of biogeochemical cycles. We hypothesize that what we observed in sample EZ4 (presence of a weathering layer and lack of the black crust) might be a later stage of weathering compared to the other samples. After an initial protective colonization, the microorganisms that are established in the superficial layer of the rock, shielded by the black crust, leach the Ca matrix to reach optimal living conditions. At this point, some species, for example Rubrobacter spp., might take advantage of the Mn and Fe and uptake the cations to survive oxidative stress, leading to a very slow deterioration of the crust, which is also enhanced by the mechanical detachment caused by weakening of the bedrock.
In support of this theory, we observed also a different microbial community in sample EZ4 that could be explained in terms of microbial succession. Cyanobacteria, which are the pioneering colonizers of the stone surface, although able to withstand a stressful environment, need the protection of the black crust to survive the harsh desert conditions. With the loss of the black crust, cyanobacterial communities are probably too exposed to the extreme environmental conditions (high T, low water availability, high irradiation) and thus gradually disappear, followed by the establishment of more resistant taxa, such as, in the case of sample EZ4, Rubrobacter, Acinetobacter and Pontibacter.

5. Conclusions

Our results pointed out that:
  • most of the microorganisms detected by metagenomic analysis are taxa adapted to live in harsh environmental condition such as the Negev desert, with a high resistance to radiation and desiccation;
  • weathering of the stone beneath the black crust was associated with the potential of the species detected to leach the calcareous matrix of the rock in order to find optimal conditions of growth while being sheltered by the black desert varnish;
  • in sample EZ4, the orange layer is probably not a different kind of coating, but it is actually a weathered area of the bedrock in which the black varnish is no longer present; therefore, we hypothesize that this sample is in a later stage of weathering compared to the others;
  • we acknowledge the possible microbial involvement in the origin of the crust, as previously reported by many authors in the literature, and, on the other hand, what we observe in our study are patterns of deterioration in the bedrock and in the black varnish, feasibly connected to microbial action. The two hypotheses can be viewed in terms of succession of biogeochemical processes and of microbial communities.
Further research is needed to better understand the mineral–microbial interaction; therefore, the goal of future research will be to further explore the genome of microbial communities inhabiting stones associated with petroglyph sites and get insight into functional genes.

Supplementary Materials

The following supporting information can be downloaded at: https://www.mdpi.com/article/10.3390/app12146936/s1, Table S1: Details of the sequencing runs. Figure S1: Charts of the meteorological measurements. Figure S2: Relative abundance of the bacterial communities at the class level. Figure S3: Relative abundance of the fungal communities at the class level. Figure S4: 3D pictures of the stone slabs acquired with the Keyence digital microscope. Figure S5: SEM–BSE image and digital OM picture of a detail of sample EZ3 with EDX elemental mappings. Figure S6: SEM–BSE image and digital OM picture of a cyanobacteria colonized area with EDX elemental mappings.

Author Contributions

Conceptualization, K.S., G.P. and A.K.; analytical measurements, L.R., I.N., E.E. and M.J.P.; molecular analysis, L.R. and G.P.; bioinformatic analysis, M.W. and A.G.; writing—original draft preparation, L.R., K.S. and G.P.; writing—review and editing, L.R., G.P., K.S., I.N. and A.K. All authors have read and agreed to the published version of the manuscript.

Funding

This research was funded by the Austrian Science Fund (FWF—Der Wissenschaftsfonds) project I 4748-B Stone cultural heritage in Austria and Israel.

Institutional Review Board Statement

Not applicable.

Informed Consent Statement

Not applicable.

Data Availability Statement

All data are available in the NCBI database.

Acknowledgments

The authors gratefully acknowledge the Austrian Science Fund (FWF, Der Wissenschaftsfonds) and the Ministry of Science and Technology (MOST), Israel for funding the project. We would also like to acknowledge Dubravka Jembrih-Simbürger, Academy of Fine Arts, Vienna, for help with initial XRF analysis, Mirsky Yelena, Ben-Gurion University, for WDXRF analysis, Chris Mckay, NASA-Aimes, U.S.A for climatic measurement support, and the Israel Nature and Parks Authorities (INPA) for sampling permission.

Conflicts of Interest

The authors declare no conflict of interest.

References

  1. Aubert, M.; Lebe, R.; Oktaviana, A.A.; Tang, M.; Burhan, B.; Hamrullah; Jusdi, A.; Abdullah; Hakim, B.; Zhao, J.-X.; et al. Earliest hunting scene in prehistoric art. Nature 2019, 576, 442–445. [Google Scholar] [CrossRef] [PubMed]
  2. Brumm, A.; Oktaviana, A.A.; Burhan, B.; Hakim, B.; Lebe, R.; Zhao, J.-X.; Sulistyarto, P.H.; Ririmasse, M.; Adhityatama, S.; Sumantri, I.; et al. Oldest cave art found in Sulawesi. Sci. Adv. 2021, 7, eabd4648. [Google Scholar] [CrossRef] [PubMed]
  3. Francis, A.; Loendorf, L.L. Ancient Visions: Petroglyphs and Pictographs of the Wind River and Bighorn Country, Wyoming and Montana; University of Utah Press: Salt Lake City, UT, USA, 2004. [Google Scholar]
  4. Bednarik, R.G. Pleistocene Palaeoart of Africa. Arts 2013, 2, 6–34. [Google Scholar] [CrossRef] [Green Version]
  5. Dorn, R.I. Anthropogenic Interactions with Rock Varnish. In Biogeochemical Cycles: Ecological Drivers and Environmental Impact; John Wiley & Sons: New York, NY, USA, 2020; pp. 267–283. [Google Scholar]
  6. Smith, B.W.; Black, J.L.; Hoerle, S.; Ferland, M.A.; Diffey, S.M.; Neumann, J.T.; Geisler, T. The Impact of Industrial Pollution on the Rock Art of Murujuga, Western Australia. J. Aust. Rock Art Res. Assoc. 2022, 39, 3–14. [Google Scholar]
  7. Neumann, J.T.; Black, J.L.; Hœrlé, S.; Smith, B.W.; Watkins, R.; Lagos, M.; Ziegler, A.; Geisler, T. Artificial weathering of rock types bearing petroglyphs from Murujuga, Western Australia. Herit. Sci. 2022, 10, 77. [Google Scholar] [CrossRef]
  8. Fernandes, A.P.B. The Conservation Programme of the Côa Valley Archaeological Park: Philosophy, Objectives and Action. Conserv. Manag. Archaeol. Sites 2007, 9, 71–96. [Google Scholar] [CrossRef]
  9. Siegesmund, S.; Snethlage, R. Stone in Architecture. Properties, Durability, 5th ed.; Springer: Berlin/Heidelberg, Germany, 2014. [Google Scholar]
  10. Gorbushina, A.A.; Krumbein, W. Role of Microorganisms in Wear Down of Rocks and Minerals. Microorg. Soils Roles Genes. Funct. 2005, 3, 59–84. [Google Scholar] [CrossRef]
  11. Sterflinger, K.; Krumbein, W.E.; Lellau, T.; Rullkötter, J. Microbially mediated orange patination of rock surfaces. Anc. Biomol. 1999, 3, 51–65. [Google Scholar]
  12. Steiger, M.; Charola, E.; Sterflinger, K. Weathering and Deterioration. In Stone in Architecture: Properties, Durability, 5th ed; Springer: Berlin/Heidelberg, Germany, 2014; pp. 225–316. [Google Scholar]
  13. Louati, M.; Ennis, N.J.; Ghodhbane-Gtari, F.; Hezbri, K.; Sevigny, J.L.; Fahnestock, M.F.; Cherif-Silini, H.; Bryce, J.G.; Tisa, L.S.; Gtari, M. Elucidating the ecological networks in stone-dwelling microbiomes. Environ. Microbiol. 2020, 22, 1467–1480. [Google Scholar] [CrossRef]
  14. Eisenberg-Degen, D.; Rosen, S.A. Chronological Trends in Negev Rock Art: The Har Michia Petroglyphs as a Test Case. Arts 2013, 2, 225–252. [Google Scholar] [CrossRef] [Green Version]
  15. Eisenberg-Degen, D.; Nash, G. Hunting and Gender as Reflected in the Central Negev Rock Art, Israel. Time Mind 2014, 7, 259–277. [Google Scholar] [CrossRef]
  16. Nir, I.; Barak, H.; Kramarsky-Winter, E.; Kushmaro, A. Seasonal diversity of the bacterial communities associated with petroglyphs sites from the Negev Desert, Israel. Ann. Microbiol. 2019, 69, 1079–1086. [Google Scholar] [CrossRef]
  17. Perry, R.S.; Adams, J.B. Desert varnish: Evidence of cyclic deposition of manganese. Nature 1978, 276, 489–491. [Google Scholar] [CrossRef]
  18. Martínez-Pabello, P.U.; Villalobos, C.; Sedov, S.; Solleiro-Rebolledo, E.; Solé, J.; Pi-Puig, T.; Chávez-Vergara, B.; Díaz-Ortega, J.; Gubin, A. Rock varnish as a natural canvas for rock art in La Proveedora, northwestern Sonoran Desert (Mexico): Integrating archaeological and geological evidences. Quat. Int. 2021, 572, 74–87. [Google Scholar] [CrossRef]
  19. Goldsmith, Y.; Stein, M.; Enzel, Y. From dust to varnish: Geochemical constraints on rock varnish formation in the Negev Desert, Israel. Geochim. Cosmochim. Acta 2014, 126, 97–111. [Google Scholar] [CrossRef]
  20. Andreae, M.O.; Al-Amri, A.; Andreae, C.M.; Guagnin, M.; Jochum, K.P.; Stoll, B.; Weis, U. Archaeometric studies on the petroglyphs and rock varnish at Kilwa and Sakaka, northern Saudi Arabia. Arab. Archaeol. Epigr. 2020, 31, 219–244. [Google Scholar] [CrossRef]
  21. Harmon, R.S.; Khashchevskaya, D.; Morency, M.; Owen, L.A.; Jennings, M.; Knott, J.R.; Dortch, J.M. Analysis of Rock Varnish from the Mojave Desert by Handheld Laser-Induced Breakdown Spectroscopy. Molecules 2021, 26, 5200. [Google Scholar] [CrossRef]
  22. Otter, L.M.; Macholdt, D.S.; Jochum, K.P.; Stoll, B.; Weis, U.; Weber, B.; Scholz, D.; Haug, G.H.; Al-Amri, A.M.; Andreae, M.O. Geochemical insights into the relationship of rock varnish and adjacent mineral dust fractions. Chem. Geol. 2020, 551, 119775. [Google Scholar] [CrossRef]
  23. Andreae, M.O.; Al-Amri, A.; Andreae, T.W.; Garfinkel, A.; Haug, G.; Jochum, K.P.; Stoll, B.; Weis, U. Geochemical studies on rock varnish and petroglyphs in the Owens and Rose Valleys, California. PLoS ONE 2020, 15, e0235421. [Google Scholar] [CrossRef]
  24. Macholdt, D.; Jochum, K.; Pöhlker, C.; Arangio, A.; Förster, J.-D.; Stoll, B.; Weis, U.; Weber, B.; Müller, M.; Kappl, M.; et al. Characterization and differentiation of rock varnish types from different environments by microanalytical techniques. Chem. Geol. 2017, 459, 91–118. [Google Scholar] [CrossRef]
  25. Lang-Yona, N.; Maier, S.; Macholdt, D.S.; Müller-Germann, I.; Yordanova, P.; Rodriguez-Caballero, E.; Jochum, K.P.; Al-Amri, A.; Andreae, M.O.; Fröhlich-Nowoisky, J.; et al. Insights into microbial involvement in desert varnish formation retrieved from metagenomic analysis. Environ. Microbiol. Rep. 2018, 10, 264–271. [Google Scholar] [CrossRef] [PubMed]
  26. Dorn, R.I.; Oberlander, T.M. Microbial Origin of Desert Varnish. Science 1981, 213, 1245–1247. [Google Scholar] [CrossRef] [PubMed] [Green Version]
  27. Lingappa, U.F.; Yeager, C.M.; Sharma, A.; Lanza, N.L.; Morales, D.P.; Xie, G.; Atencio, A.D.; Chadwick, G.L.; Monteverde, D.R.; Magyar, J.S.; et al. An ecophysiological explanation for manganese enrichment in rock varnish. Proc. Natl. Acad. Sci. USA 2021, 118, e2025188118. [Google Scholar] [CrossRef] [PubMed]
  28. Esposito, A.; Ahmed, E.; Ciccazzo, S.; Sikorski, J.; Overmann, J.; Holmström, S.J.M.; Brusetti, L. Comparison of Rock Varnish Bacterial Communities with Surrounding Non-Varnished Rock Surfaces: Taxon-Specific Analysis and Morphological Description. Microb. Ecol. 2015, 70, 741–750. [Google Scholar] [CrossRef] [PubMed]
  29. Wierzchos, J.; de los Ríos, A.; Ascaso, C. Microorganisms in desert rocks: The edge of life on Earth. Int. Microbiol. 2012, 15, 173–183. [Google Scholar] [CrossRef] [Green Version]
  30. Northup, D.E.; Snider, J.R.; Spilde, M.N.; Porter, M.L.; Van De Kamp, J.L.; Boston, P.J.; Nyberg, A.M.; Bargar, J.R. Diversity of rock varnish bacterial communities from Black Canyon, New Mexico. J. Geophys. Res. Biogeosci. 2010, 115, G2. [Google Scholar] [CrossRef] [Green Version]
  31. Knight, K.; St. Clair, L.L.; Gardner, J. Lichen Biodeterioration at Inscription Rock, El Morro National Monument, Ramah, New Mexico, USA. In Biodeterioration of Stone Surfaces; St. Clair, L.L., Seaward, M.R.D., Eds.; Springer: Dordrecht, The Netherlands, 2004; pp. 129–163. [Google Scholar]
  32. Dandridge, D.E. Lichens: The Challenge for Rock Art Conservation. Ph.D. Thesis, Texas A & M University, College Station, TX, USA, 2007. [Google Scholar]
  33. Nir, I.; Barak, H.; Kramarsky-Winter, E.; Kushmaro, A.; Ríos, A. Microscopic and biomolecular complementary approaches to characterize bioweathering processes at petroglyph sites from the Negev Desert, Israel. Environ. Microbiol. 2022, 24, 967–980. [Google Scholar] [CrossRef]
  34. Evenari, M.; Shanan, L.; Tadmor, N. The Negev: The Challenge of a Desert; Harvard University Press: Cambridge, MA, USA, 1982. [Google Scholar]
  35. Hillel, D. Negev Land, Water, and Life in a Desert Environment; Praeger: New York, NY, USA, 1982. [Google Scholar]
  36. Kidron, G.J. Altitude dependent dew and fog in the Negev Desert, Israel. Agric. For. Meteorol. 1999, 96, 1–8. [Google Scholar] [CrossRef]
  37. Piñar, G.; Poyntner, C.; Lopandic, K.; Tafer, H.; Sterflinger, K. Rapid diagnosis of biological colonization in cultural artefacts using the MinION nanopore sequencing technology. Int. Biodeterior. Biodegrad. 2020, 148, 104908. [Google Scholar] [CrossRef]
  38. RRUFF Database. Available online: https://rruff.info/ (accessed on 3 May 2022).
  39. Caggiani, M.; Cosentino, A.; Mangone, A. Pigments Checker version 3.0, a handy set for conservation scientists: A free online Raman spectra database. Microchem. J. 2016, 129, 123–132. [Google Scholar] [CrossRef]
  40. Hanesch, M. Raman spectroscopy of iron oxides and (oxy)hydroxides at low laser power and possible applications in environmental magnetic studies. Geophys. J. Int. 2009, 177, 941–948. [Google Scholar] [CrossRef]
  41. Bruins, J.H.; Petrusevski, B.; Slokar, Y.M.; Kruithof, J.C.; Kennedy, M.D. Manganese removal from groundwater: Characterization of filter media coating. Desalin. Water Treat. 2015, 55, 1851–1863. [Google Scholar] [CrossRef]
  42. Jehlička, J.; Edwards, H.; Oren, A. Bacterioruberin and salinixanthin carotenoids of extremely halophilic Archaea and Bacteria: A Raman spectroscopic study. Spectrochim. Acta Part A Mol. Biomol. Spectrosc. 2013, 106, 99–103. [Google Scholar] [CrossRef]
  43. Piñar, G.; Sclocchi, M.C.; Pinzari, F.; Colaizzi, P.; Graf, A.; Sebastiani, M.L.; Sterflinger, K. The Microbiome of Leonardo da Vinci’s Drawings: A Bio-Archive of Their History. Front. Microbiol. 2020, 11, 593401. [Google Scholar] [CrossRef]
  44. Planý, M.; Pinzari, F.; Šoltys, K.; Kraková, L.; Cornish, L.; Pangallo, D.; Jungblut, A.D.; Little, B. Fungal-induced atmospheric iron corrosion in an indoor environment. Int. Biodeterior. Biodegrad. 2021, 159, 105204. [Google Scholar] [CrossRef]
  45. Grottoli, A.; Beccaccioli, M.; Zoppis, E.; Fratini, R.S.; Schifano, E.; Santarelli, M.L.; Uccelletti, D.; Reverberi, M. Nanopore Sequencing and Bioinformatics for Rapidly Identifying Cultural Heritage Spoilage Microorganisms. Front. Mater. 2020, 7, 14. [Google Scholar] [CrossRef] [Green Version]
  46. Krumbein, W.E.; Jens, K. Biogenic rock varnishes of the negev desert (Israel) an ecological study of iron and manganese transformation by cyanobacteria and fungi. Oecologia 1981, 50, 25–38. [Google Scholar] [CrossRef]
  47. Vikram, S.; Guerrero, L.D.; Makhalanyane, T.P.; Le, P.; Seely, M.; Cowan, D.A. Metagenomic analysis provides insights into functional capacity in a hyperarid desert soil niche community. Environ. Microbiol. 2015, 18, 1875–1888. [Google Scholar] [CrossRef]
  48. Hirschberg, J.; Chamovitz, D. Carotenoids in Cyanobacteria BT-The Molecular Biology of Cyanobacteria; Bryant, D.A., Ed.; Springer: Dordrecht, The Netherlands, 1994; pp. 559–579. [Google Scholar]
  49. Perera, I.; Subashchandrabose, S.R.; Venkateswarlu, K.; Naidu, R.; Megharaj, M. Consortia of cyanobacteria/microalgae and bacteria in desert soils: An underexplored microbiota. Appl. Microbiol. Biotechnol. 2018, 102, 7351–7363. [Google Scholar] [CrossRef]
  50. Lacap, D.C.; Warren-Rhodes, K.A.; McKay, C.P.; Pointing, S.B. Cyanobacteria and chloroflexi-dominated hypolithic colonization of quartz at the hyper-arid core of the Atacama Desert, Chile. Extremophiles 2010, 15, 31–38. [Google Scholar] [CrossRef] [Green Version]
  51. Mishra, S. Chapter 1-Cyanobacterial imprints in diversity and phylogeny. In Advances in Cyanobacterial Biology; Singh, P.K., Kumar, A., Singh, V.K., Shrivastava, C.B., Eds.; Academic Press: Cambridge, MA, USA, 2020; pp. 1–15. [Google Scholar]
  52. Abed, R.M.; Al Kharusi, S.; Schramm, A.; Robinson, M.D. Bacterial diversity, pigments and nitrogen fixation of biological desert crusts from the Sultanate of Oman. FEMS Microbiol. Ecol. 2010, 72, 418–428. [Google Scholar] [CrossRef] [PubMed] [Green Version]
  53. Wierzchos, J.; Ascaso, C.; McKay, C.P. Endolithic Cyanobacteria in Halite Rocks from the Hyperarid Core of the Atacama Desert. Astrobiology 2006, 6, 415–422. [Google Scholar] [CrossRef] [PubMed]
  54. Wierzchos, J.; DiRuggiero, J.; Vítek, P.; Artieda, O.; Souza-Egipsy, V.; Škaloud, P.; Tisza, M.; Davila, A.F.; Vílchez, C.; Garbayo, I.; et al. Adaptation strategies of endolithic chlorophototrophs to survive the hyperarid and extreme solar radiation environment of the Atacama Desert. Front. Microbiol. 2015, 6, 934. [Google Scholar] [CrossRef] [PubMed] [Green Version]
  55. Mergelov, N.; Mueller, C.W.; Prater, I.; Shorkunov, I.; Dolgikh, A.; Zazovskaya, E.; Shishkov, V.; Krupskaya, V.; Abrosimov, K.; Cherkinsky, A.; et al. Alteration of rocks by endolithic organisms is one of the pathways for the beginning of soils on Earth. Sci. Rep. 2018, 8, 3367. [Google Scholar] [CrossRef] [PubMed] [Green Version]
  56. Ríos, A.D.L.; Ascaso, C. Contributions of in situ microscopy to the current understanding of stone biodeterioration. Int. Microbiol. 2005, 8, 181–188. [Google Scholar]
  57. Grbic, M.L.; Vukojevic, J.; Subakov-Simic, G.; Krizmanic, J.; Stupar, M. Biofilm forming cyanobacteria, algae and fungi on two historic monuments in Belgrade, Serbia. Arch. Biol. Sci. 2010, 62, 625–631. [Google Scholar] [CrossRef]
  58. Genderjahn, S.; Lewin, S.; Horn, F.; Schleicher, A.; Mangelsdorf, K.; Wagner, D. Living Lithic and Sublithic Bacterial Communities in Namibian Drylands. Microorganisms 2021, 9, 235. [Google Scholar] [CrossRef]
  59. Ferreira, A.C.; Nobre, M.F.; Moore, E.; Rainey, F.A.; Battista, J.R.; Da Costa, M.S. Characterization and radiation resistance of new isolates of Rubrobacter radiotolerans and Rubrobacter xylanophilus. Extremophiles 1999, 3, 235–238. [Google Scholar] [CrossRef]
  60. Webb, K.M.; DiRuggiero, J. Role of Mn2+ and Compatible Solutes in the Radiation Resistance of Thermophilic Bacteria and Archaea. Archaea 2012, 2012, 845756. [Google Scholar] [CrossRef] [Green Version]
  61. Piñar, G.; Ettenauer, J.; Sterflinger, K. ‘La vie en ros’: A review of the rosy discoloration of subsurface monuments. In The Conservation of Subterranean Cultural Heritage; Saiz-Jimenez, C., Ed.; CRC Press: Boca Raton, FL, USA, 2014; pp. 113–124. [Google Scholar] [CrossRef]
  62. Laiz, L.; Miller, A.Z.; Jurado, V.; Akatova, E.V.; Sanchez-Moral, S.; Gonzalez, J.M.; Dionísio, A.; Macedo, M.F.; Sáiz-Jiménez, C. Isolation of five Rubrobacter strains from biodeteriorated monuments. Naturwissenschaften 2009, 96, 71–79. [Google Scholar] [CrossRef]
  63. Tescari, M.; Visca, P.; Frangipani, E.; Bartoli, F.; Rainer, L.; Caneva, G. Celebrating centuries: Pink-pigmented bacteria from rosy patinas in the House of Bicentenary (Herculaneum, Italy). J. Cult. Heritage 2018, 34, 43–52. [Google Scholar] [CrossRef]
  64. Maeng, S.; Park, Y.; Lee, S.E.; Han, J.H.; Cha, I.-T.; Lee, K.-E.; Lee, B.-H.; Kim, M.K. Pontibacter pudoricolor sp. nov., and Pontibacter russatus sp. nov. radiation-resistant bacteria isolated from soil. Int. J. Gen. Mol. Microbiol. 2020, 113, 1361–1369. [Google Scholar] [CrossRef]
  65. Zhang, J.-Y.; Liu, X.-Y.; Liu, S.-J. Adhaeribacter terreus sp. nov., isolated from forest soil. Int. J. Syst. Evol. Microbiol. 2009, 59, 1595–1598. [Google Scholar] [CrossRef] [Green Version]
  66. Klassen, J.L.; Foght, J.M. Differences in Carotenoid Composition among Hymenobacter and Related Strains Support a Tree-Like Model of Carotenoid Evolution. Appl. Environ. Microbiol. 2008, 74, 2016–2022. [Google Scholar] [CrossRef] [Green Version]
  67. Sterflinger, K.; Tesei, D.; Zakharova, K. Fungi in hot and cold deserts with particular reference to microcolonial fungi. Fungal Ecol. 2012, 5, 453–462. [Google Scholar] [CrossRef]
  68. Sterflinger, K.; De Baere, R.; De Hoog, G.; De Wachter, R.; Krumbein, W.E.; Haase, G. Coniosporium perforans and C. apollinis, two new rock-inhabiting fungi isolated from marble in the Sanctuary of Delos (Cyclades, Greece). Int. J. Gen. Mol. Microbiol. 1997, 72, 349–363. [Google Scholar] [CrossRef]
  69. Coleine, C.; Stajich, J.E.; de Los Ríos, A.; Selbmann, L. Beyond the extremes: Rocks as ultimate refuge for fungi in drylands. Mycologia 2020, 113, 108–133. [Google Scholar] [CrossRef]
  70. Engel, C.; Robert, S. Chemical data on desert varnish. Bull. Geol. Soc. Am. 1958, 69, 487–518. [Google Scholar] [CrossRef]
  71. Liu, T.; Broecker, W.S. How fast does rock varnish grow? Geology 2000, 28, 183. [Google Scholar] [CrossRef]
  72. Malherbe, C.; Ingley, R.; Hutchinson, I.; Edwards, H.; Carr, A.; Harris, L.; Boom, A. Biogeological Analysis of Desert Varnish Using Portable Raman Spectrometers. Astrobiology 2015, 15, 442–452. [Google Scholar] [CrossRef]
  73. Ren, G.; Yan, Y.; Nie, Y.; Lu, A.; Wu, X.; Li, Y.; Wang, C.; Ding, H. Natural Extracellular Electron Transfer Between Semiconducting Minerals and Electroactive Bacterial Communities Occurred on the Rock Varnish. Front. Microbiol. 2019, 10, 293. [Google Scholar] [CrossRef]
  74. Edwards, H.G.M.; Moody, C.A.; Villar, S.E.J.; Mancinelli, R. Raman spectroscopy of desert varnishes and their rock substrata. J. Raman Spectrosc. 2004, 35, 475–479. [Google Scholar] [CrossRef]
  75. Skipper, P.J.A.; Skipper, L.K.; Dixon, R.A. A metagenomic analysis of the bacterial microbiome of limestone, and the role of associated biofilms in the biodeterioration of heritage stone surfaces. Sci. Rep. 2022, 12, 1–19. [Google Scholar] [CrossRef]
  76. Ríos, A.D.L.; Cámara, B.; del Cura, M.G.; Rico, V.J.; Galván, V.; Ascaso, C. Deteriorating effects of lichen and microbial colonization of carbonate building rocks in the Romanesque churches of Segovia (Spain). Sci. Total Environ. 2009, 407, 1123–1134. [Google Scholar] [CrossRef]
  77. Subrahmanyam, G.; Vaghela, R.; Bhatt, N.P.; Archana, G. Carbonate-Dissolving Bacteria from ‘Miliolite’, a Bioclastic Limestone, from Gopnath, Gujarat, Western India. Microbes Environ. 2012, 27, 334–337. [Google Scholar] [CrossRef] [Green Version]
  78. Uroz, S.; Calvaruso, C.; Turpault, M.; Sarniguet, A.; de Boer, W.; Leveau, J.; Frey-Klett, P. Efficient mineral weathering is a distinctive functional trait of the bacterial genus Collimonas. Soil Biol. Biochem. 2009, 41, 2178–2186. [Google Scholar] [CrossRef]
  79. Lian, B.; Chen, Y.; Zhu, L.; Yang, R. Effect of Microbial Weathering on Carbonate Rocks. Earth Sci. Front. 2008, 15, 90–99. [Google Scholar] [CrossRef]
  80. dos Santos, S.I.P.; Yang, Y.; Rosa, M.T.G.; Rodrigues, M.A.A.; De La Tour, C.B.; Sommer, S.; Teixeira, M.; Carrondo, M.A.; Cloetens, P.; Abreu, I.A.; et al. The interplay between Mn and Fe in Deinococcus radiodurans triggers cellular protection during paraquat-induced oxidative stress. Sci. Rep. 2019, 9, 17217. [Google Scholar] [CrossRef]
  81. Bernardini, S.; Bellatreccia, F.; Columbu, A.; Vaccarelli, I.; Pellegrini, M.; Jurado, V.; Del Gallo, M.; Saiz-Jimenez, C.; Sodo, A.; Millo, C.; et al. Morpho-Mineralogical and Bio-Geochemical Description of Cave Manganese Stromatolite-Like Patinas (Grotta del Cervo, Central Italy) and Hints on Their Paleohydrological-Driven Genesis. Front. Earth Sci. 2021, 9, 642667. [Google Scholar] [CrossRef]
  82. Saiz-Jimenez, C.; Miller, A.Z.; Martin-Sanchez, P.M.; Hernández-Mariné, M. Uncovering the origin of the black stains in Lascaux Cave in France. Environ. Microbiol. 2012, 14, 3220–3231. [Google Scholar] [CrossRef] [Green Version]
  83. Barboza, N.R.; Amorim, S.S.; Santos, P.A.; Reis, F.D.; Cordeiro, M.M.; Guerra-Sá, R.; Leão, V.A. Indirect Manganese Removal by Stenotrophomonas sp. and Lysinibacillus sp. Isolated from Brazilian Mine Water. BioMed Res. Int. 2015, 2015, 925972. [Google Scholar] [CrossRef] [PubMed] [Green Version]
Figure 1. Map of the Negev desert indicating the location of the two petroglyph sites (a); view of the rock art site in Ezuz with examples of rock engravings (b); image of a sampling point (c); and the sample observed by stereomicroscope (6×) (d).
Applsci 12 06936 g001
Figure 2. Relative abundance of bacteria, eukaryotes and archaea in the microbiomes of the four samples analyzed.
Applsci 12 06936 g002
Figure 3. Relative abundance of bacterial communities at the phylum level (cutoff 0.5%).
Applsci 12 06936 g003
Figure 4. Heatmap displaying the relative abundance (%) of the total microbial community (bacteria and fungi) at the genus level in each sample; the genera represent an abundance greater than 0.5% in at least one sample.
Applsci 12 06936 g004
Figure 5. Pictures of the petrographic thin sections acquired with the Keyence digital microscope in transmitted light: (a) detail of the black varnish and of the reddish layer underneath it of sample AV1; (bd) examples of the weathered area occurring beneath the black coating in samples EZ1, EZ3 and AV2; (e) weathered area colonized by cyanobacteria aggregates in sample AV1; (f) detail of the orange crust of sample EZ4.
Applsci 12 06936 g005
Figure 6. SEM images in secondary electron mode showing putative bacteria in the microcavities of the stone (a), a cyanobacterial biofilm (b) and fungal hyphae (c).
Applsci 12 06936 g006
Figure 7. SEM–EDX analyses on petrographic thin sections: (a) SEM image in backscattered electron mode and EDX elemental mapping (Mn, Fe and Si) of the black varnish; (b) SEM image in backscattered electron mode of the thin section of sample AV1 showing the lack of Ca in the upper part of the sample and a heavily weathered area at the bottom; (c) SEM image in backscattered electron mode with EDX elemental mapping (Si, Ca and Mg) of the weathered area of sample EZ3 (additional elemental mappings of the area in the dashed box in Supplementary Figure S5).
Applsci 12 06936 g007
Figure 8. SEM image in backscattered electron mode and EDX elemental mapping (Si, Ca, Mg and Al) of sample EZ4.
Applsci 12 06936 g008
Figure 9. (a) Normalized Raman spectra collected from the black varnish on two different spots (A, B), on the orange layer emerging from the black varnish (C) and on the orange crust of sample EZ4 (D) compared with reference spectra of burnt Sienna (E) (Pigments Checker Raman Database [39]), hematite (F) and magnetite (G) (RRUFF [38]) in the spectral range between 150 and 1700 cm−1. (b) Normalized Raman spectra collected on the orange layer beneath the black crust (a) and on a spot colonized by cyanobacteria (b) in the range from 900 cm−1 to 1700 cm−1, showing the characteristic peaks of carotenoids.
Applsci 12 06936 g009
Table 1. List of samples collected at the two petroglyph sites with brief description.
SamplePetroglyph SiteBrief Description of the Crust
AV1AvdatVery dark crust covering a reddish layer
AV2AvdatVery dark crust covering a reddish layer
AV3AvdatThinner black crust, intermixed with reddish layer
EZ1EzuzVery dark crust covering a reddish layer
EZ2EzuzVery dark crust covering a reddish layer
EZ3EzuzDark crust covering a reddish layer
EZ4EzuzOrange thick crust
Table 2. XRF data (%) of the three layers of sample AV1.
Elements *Black Varnish (%)Reddish Layer (%)Bedrock (%)
Mg1.11.12.0
Al8.47.03.2
Si66.173.448.9
P1.10.50
S1.00.30.1
K1.11.10.4
Ca8.39.940.9
Ti0.60.50.1
Mn3.10.80.1
Fe8.04.71.2
Ba0.300
* Only the main elements are shown.
Publisher’s Note: MDPI stays neutral with regard to jurisdictional claims in published maps and institutional affiliations.

