
SLedge: Scheduling and Load Balancing for a Stream Processing EDGE Architecture


1
Escuela de Informática y Telecomunicaciones, Facultad de Ingeniería, Universidad Diego Portales, Santiago 8581169, Chile
2
Departamento de Informática, Universidad Técnica Federico Santa María, Santiago 8940572, Chile
3
Departamento de Ingeniería Informática, Universidad de Santiago de Chile, Santiago 9170124, Chile
*
Author to whom correspondence should be addressed.
Appl. Sci. 2022, 12(13), 6474; https://doi.org/10.3390/app12136474
Submission received: 16 May 2022
/
Revised: 19 June 2022
/
Accepted: 22 June 2022
/
Published: 25 June 2022
(This article belongs to the Collection Big Data Analysis and Visualization Ⅱ)
Abstract
:Natural disasters have a significant impact on human welfare. In recent years, disasters are more violent and frequent due to climate change, so their impact may be higher if no preemptive measures are taken. In this context, real-time data processing and analysis have shown great potential to support decision-making, rescue, and recovery after a disaster. However, disaster scenarios are challenging due to their highly dynamic nature. In particular, we focus on data traffic and available processing resources. In this work, we propose SLedge—an edge-based processing model that enables mobile devices to support stream processing systems’ tasks under post-disaster scenarios. SLedge relies on a two-level control loop that automatically schedules SPS’s tasks over mobile devices to increase the system’s resilience, reduce latency, and provide accurate outputs. Our results show that SLedge can outperform a cloud-based infrastructure in terms of latency while keeping a low overhead. SLedge processes data up to five times faster than a cloud-based architecture while improving load balancing among processing resources, dealing better with traffic spikes, and reducing data loss and battery drain.
1. Introduction
Every year we witness an increasing number of natural phenomena hitting the world, unleashing major disasters. Millions of people worldwide are affected directly or indirectly by disasters, therefore a primary concern for any disaster-prone country. Disasters have high human and financial costs in multi-hazard countries like Chile. Chile is a country frequently hit by natural disasters such as violent earthquakes, tsunamis, volcanic eruptions, and landslides, among others (https://thinkhazard.org; accessed on 2 May 2022). Nowadays, disasters are more violent and frequent due to climate change, so their impact may be higher if no preemptive measures are taken. The United Nations Office for Disaster Risk Reduction has established in [1] the necessity to enhance the decision-making process and invest in disaster risk reduction mechanisms as critical actions to increase countries’ resilience to disasters.
In this context, we propose a resilient and low latency processing infrastructure to support post-disaster data processing operations. Timely responses are critical in such a scenario for saving lives and making informed decisions related to the situation recovery. The processing infrastructure must be efficient when extracting information, recognizing the relevant information, and dealing with the challenging conditions: processing resources availability and the requirement of timely responses.
We specifically tackle how to create a resilient system with low latency responses. In our proposal, we schedule and load balance operators in an integration model with a pool of mobile devices to deploy small tasks as part of a well-known SPS called Apache Storm [2]. Mobile phones have a massive penetration in the country and are built with high computing power. Most of them are multi-core with more than 1 GB of RAM [3], so they can provide processing resources to support the processing platform. The system is based on an edge architecture. Currently, SPSs cannot integrate mobile devices and execute on edge architectures. However, some works explore the opportunity of exploiting the mobile resources to deploy operators [4,5,6]. It requires the design of an SPS solution that is robust and can efficiently connect the distributed hardware resources and control the network flows to facilitate real-time IoT analytics in this context.
Data analysis in disaster/crisis scenarios is defiant since data traffic is highly dynamic, and processing resources may become scarce due to communication infrastructure failures. A system able to cope with these problems can greatly impact disaster preparedness, mitigation, and response phases. In 2010, Chile was hit by an 8.8 earthquake, challenging government disaster response strategies. In this scenario, social media, particularly Twitter (twitter.com; accessed on 2 May 2022), provided helpful information to coordinate the people and government response [7]. However, its impact was limited due to the lack of a specialized processing system. The importance of processing data in disaster scenarios by SLedge is also useful considering that crime is incremented in these situations. In [8], authors have proposed to process social media data to prepare police and law enforcement agencies to prevent criminal activities during and after a large crisis/disaster situation. A more recent application is related to the COVID-19 pandemic. With the unpredictability of global events, preparing a crisis management strategy at the macro-level in each country is necessary to respond to crises. In [9], authors discover critical priorities and agendas in crisis management in Saudi Arabia by grasping the most recent social issues of the COVID-19 pandemic addressed in the most trusted media sources. This research also shows how a country can use big data to detect key-social issues and then make a subsequent strategy or decision-making system to develop a public communication or new policy in future events. In this work, we propose a post-disaster application scenario in which real-time IoT analytics is performed over a fog infrastructure for face detection from a data stream generated by security cameras (see Section 3.1). This analysis can be helpful for post-disaster scenarios, securing airports, large shopping areas, and inside public transportation, among others.
Literature has extensively demonstrated that social media analysis provides valuable information and can have a positive impact on the disaster phases. However, a specially suited processing system is required to cope with the challenging conditions of the scenario [10,11].
In this context we propose SLedge (Scheduling and Load balancing for a stream processing EDGE Architecture), a low-latency system with a two-level control loop that automatically schedules SPS’s tasks over connected devices and balances the load they receive, considering mobile device characteristics and preventing draining of the devices’ battery.
The main contribution of our work are:
- a system model that improves resiliency specially suited for disaster/crisis scenarios,
- the model provides low-latency events processing,
- an utilization-based scheduling mechanism to balance load among processing nodes.
The methodology used to evaluate the proposal is based on a simulation that uses a benchmark with real devices. We compare SLedge with a cloud architecture to highlight the benefits of the approach and evaluate the system behavior by measuring latency and utilization of each component of the system in a changing environment.
The remainder of the article is organized as follows: Section 2 introduces the main background concepts and related work. Section 3 details SLedge, the system we propose to schedule and load balancing SPS’s tasks over a set of available mobile devices. Experimental evaluation is presented in Section 4 with concluding remarks in Section 5.
2. Background and Related Work
2.1. Stream Processing Systems
An SPS is a distributed system that processes the flow of events in real-time. Streams are built with an unbounded number of continuous events, the basic unit of the data generated by applications. Generally, SPSs are deployed in a cluster of computers. The SPSs applications are represented using a graph-based paradigm, specifically building a directed acyclic graph with processing operators as vertices and the flow of events as edges. Processing operators may be of diverse complexity, for example, a union, filter, or counting of events. These operators are distributed over processing nodes using virtualized processing resources.
We base our work on Storm [2], which is widely used for its simple programming model by applications of companies such as Spotify, Twitter, Yahoo, and Alibaba. The processing graph in Storm differentiates between two types of processing operators: spouts and bolts. Spouts transform data from an external source into events (tuples), and bolts execute topology processing tasks. Storm architecture has three main components: Zookeeper, Nimbus, and processing nodes (workers). Zookeeper [12] is a service layer that coordinates applications in a distributed and concurrent mode and is used to transmit application information and the cluster’s state between Nimbus and the processing nodes. Nimbus is the master node, distributes the application among the processing nodes, and applies corrective policies in case of failure. A process called supervisor manages one or more workers in a physical machine.
Scheduling events in SPSs have several approaches. In Spark, a delayed event is retransmitted to another operator, improving events’ processing delay. Rychlý et al. [13] state that the hardware resources of the processing nodes and the operators’ characteristics should be considered when planning events. To that end, each application evaluates benchmark operators in different machines to find the best configuration performance. In Storm, eight types of event distribution techniques are available. For example, shuffle grouping distributes events randomly between bolts, and field grouping distributes events by their attributes, causing events with the same attribute to be processed by the same bolt. Cardellini et al. designed and evaluated a QoS-aware scheduler in Storm [14] that allows the system to automatically change operator placement, locating them as near as possible to the data sources and the final consumer. These techniques work in static nodes that deploy the SPS. However, unlike SLedge, they do not fit an edge architecture built with mobile devices integrating the SPS.
2.2. Edge Computing Architectures
There are three different edge computing schemes: Cloudlet Computing, Mobile Edge Computing, and Fog Computing [15,16]. In this work, we use a fog computing approach, a hierarchical and distributed architecture for large-scale computing. The system is built with heterogeneous devices between the end-users and the cloud, for example, mobile nodes. We aim to process data close to the end-user to decrease latency in the SPS’s responses.
Fog computing schemes use a three-layer architecture: the end-users, a fog layer, and the cloud. This approach was first proposed in [17] and was designed for applications that require very low and predictable latency. One crucial component in the architecture is providing service orchestration by monitoring the health and state of the physical machines and services provided. Another essential component is a framework that discovers and allocates mobile resources at the edge. Kinaara [18], for example, does this job by using a multi-tier organization.
At edge nodes, conventional approaches propose to offload heavy tasks that cannot be handled by end-users, collecting data and locally pre-processing it before sending aggregated data to the cloud [16]. Recently, some authors have stated the edge/fog architectures are well suited for stream processing systems [14,19,20,21]. Cardellini et al. [14] made Storm suitable for execution in a geographically distributed environments. Goldstein et al. have performed continuous tasks on streaming data at an edge architecture [19] using a publish/subscribe method.
2.3. Mobile Stream Processing
Using mobile devices to execute tasks taking advantage of available idle resources has been used in the last decade in different contexts considering limited characteristics of the mobile nodes [22,23]. Liu et al. [24] propose offloading a heavy computation task to mobile devices to reduce latency and provide location awareness for end-users. This approach considers the limited computational resources of mobile devices as well as the short battery life. The authors develop a system that minimizes energy consumption and reduces response times by delegating the pre-processing to mobile devices. Comito et al. [4] propose an energy-aware scheduling algorithm that prolongs the network’s lifetime, maximizing the number of alive nodes for ad hoc wireless networks. The authors use two-phased heuristic-based scheduling that uses a local and a global assignment in the wireless network.
Several authors have proposed to execute an SPS in smartphones, which is called Mobile Stream Processing [5,6,20,25].
Ning et al. focus on the implementation of Storm over Android devices and proposes Mobile Storm [5], a system that leverages mobile node clusters to process data in real-time, without offloading computation to remote servers. Other works put the main focus on resilience and fault tolerance. Mobistreams [6] is an SPS that reduces the load in servers and network congestion in the cellular network by offloading computation towards mobile devices. The devices build an ad hoc network using WiFi, and the graph topology is mapped over the available devices. This work proposes a broadcast-based approach and token-triggered checkpointing. Similarly, our previous work, Symbiosis [25], is concerned with fault tolerance when using mobile resources as processing operators. It proposes a checkpointing approach triggered by the signal strength and the energy level of the devices. Chao and Stoleru proposed R-MStorm [20], which aims to make a mobile stream processing system more resilient by providing better survivability. R-MStorm provides diversity on the stream paths and assigns tasks to the nodes that provide better availability to the whole system. Our work complements those proposals by focusing on scheduling and load balance. In [26], the authors propose an optimization problem for the placement of stream processing operators. This problem was tailored to consider fog computing environments.
Our proposal’s main difference is that we use a hybrid graph topology that integrates the mobile resources into the conventional static resources, producing a more resilient network that can execute without mobile nodes. Mobile nodes’ processing resources allow for a reduction of the latency compared to a cloud-based processing system while increasing the system’s resiliency.
3. SLedge Model
In this section, we propose the SLedge model to schedule tasks in mobile devices whose resources are integrated into an SPS and load balance the load they receive. We use an edge architecture assisted with mobile devices and a two-level control loop to schedule and tolerate failures.
3.1. Application Scenario
The application for SLedge is real-time IoT analytics performed over a fog infrastructure. A fog-dedicated infrastructure gives complete responses based on local real-time analysis over data generated nearby. To exemplify, we consider an image processing application that can be in charge of performing face recognition in images of a security camera. The application receives 60 pictures (frames) per second, converts the image to black and white, detects faces in each image, crops them, and recognizes the face in the cropped images. This type of analysis can be helpful when securing airports, large shopping areas, or inside public transportation. Besides security, this application can count people or other objects for dynamic planning in a smart city context or intelligent traffic systems.
We are mainly motivated by disaster scenarios, where there is the need to perform situation awareness, and processing nearby images to detect people that need help. Latency is crucial under these circumstances, and Internet connectivity to a cloud service should not be taken for granted. We assume there is no global infrastructure and expect to have only local resources available, such as mobile nodes, for example. In this context, volunteer teams can go with a camera to the affected field, take pictures of the surroundings, and locally process the streams of data generated in the neighborhood to obtain situational awareness for the fast response of first rescue teams. The system can detect people and obstacles that have changed the city map after the disaster.
Moreover, this approach can build a cloud-fog collaboration so that edge analytics can complement the centralized architecture. A cloud-fog scenario generally offers real-time partial responses to clients close to where the data is being generated, avoiding raw data traveling through the Internet backbone towards a data center. Besides improving latency, this approach decongests the network, considering a growing amount of data generated at the edge of the network, for example, in the IoT context expected to dominate Internet traffic in the future. In our particular scenario, only the cropped faces resulting from the stream processing system may travel towards the Cloud for a centralized analysis, but also a fast response is provided to the local stakeholders.
3.2. Architecture
We propose an integration model for Apache Storm that extends the processing platform to support the use of external resources such as mobile phones, tablets, Etc. This model was designed to enable the SPS to provision external processing resources under post-disaster situations when traditional processing infrastructure may be scarce. In this model, we consider mobile phones as external processing resources due to their penetration in the country.
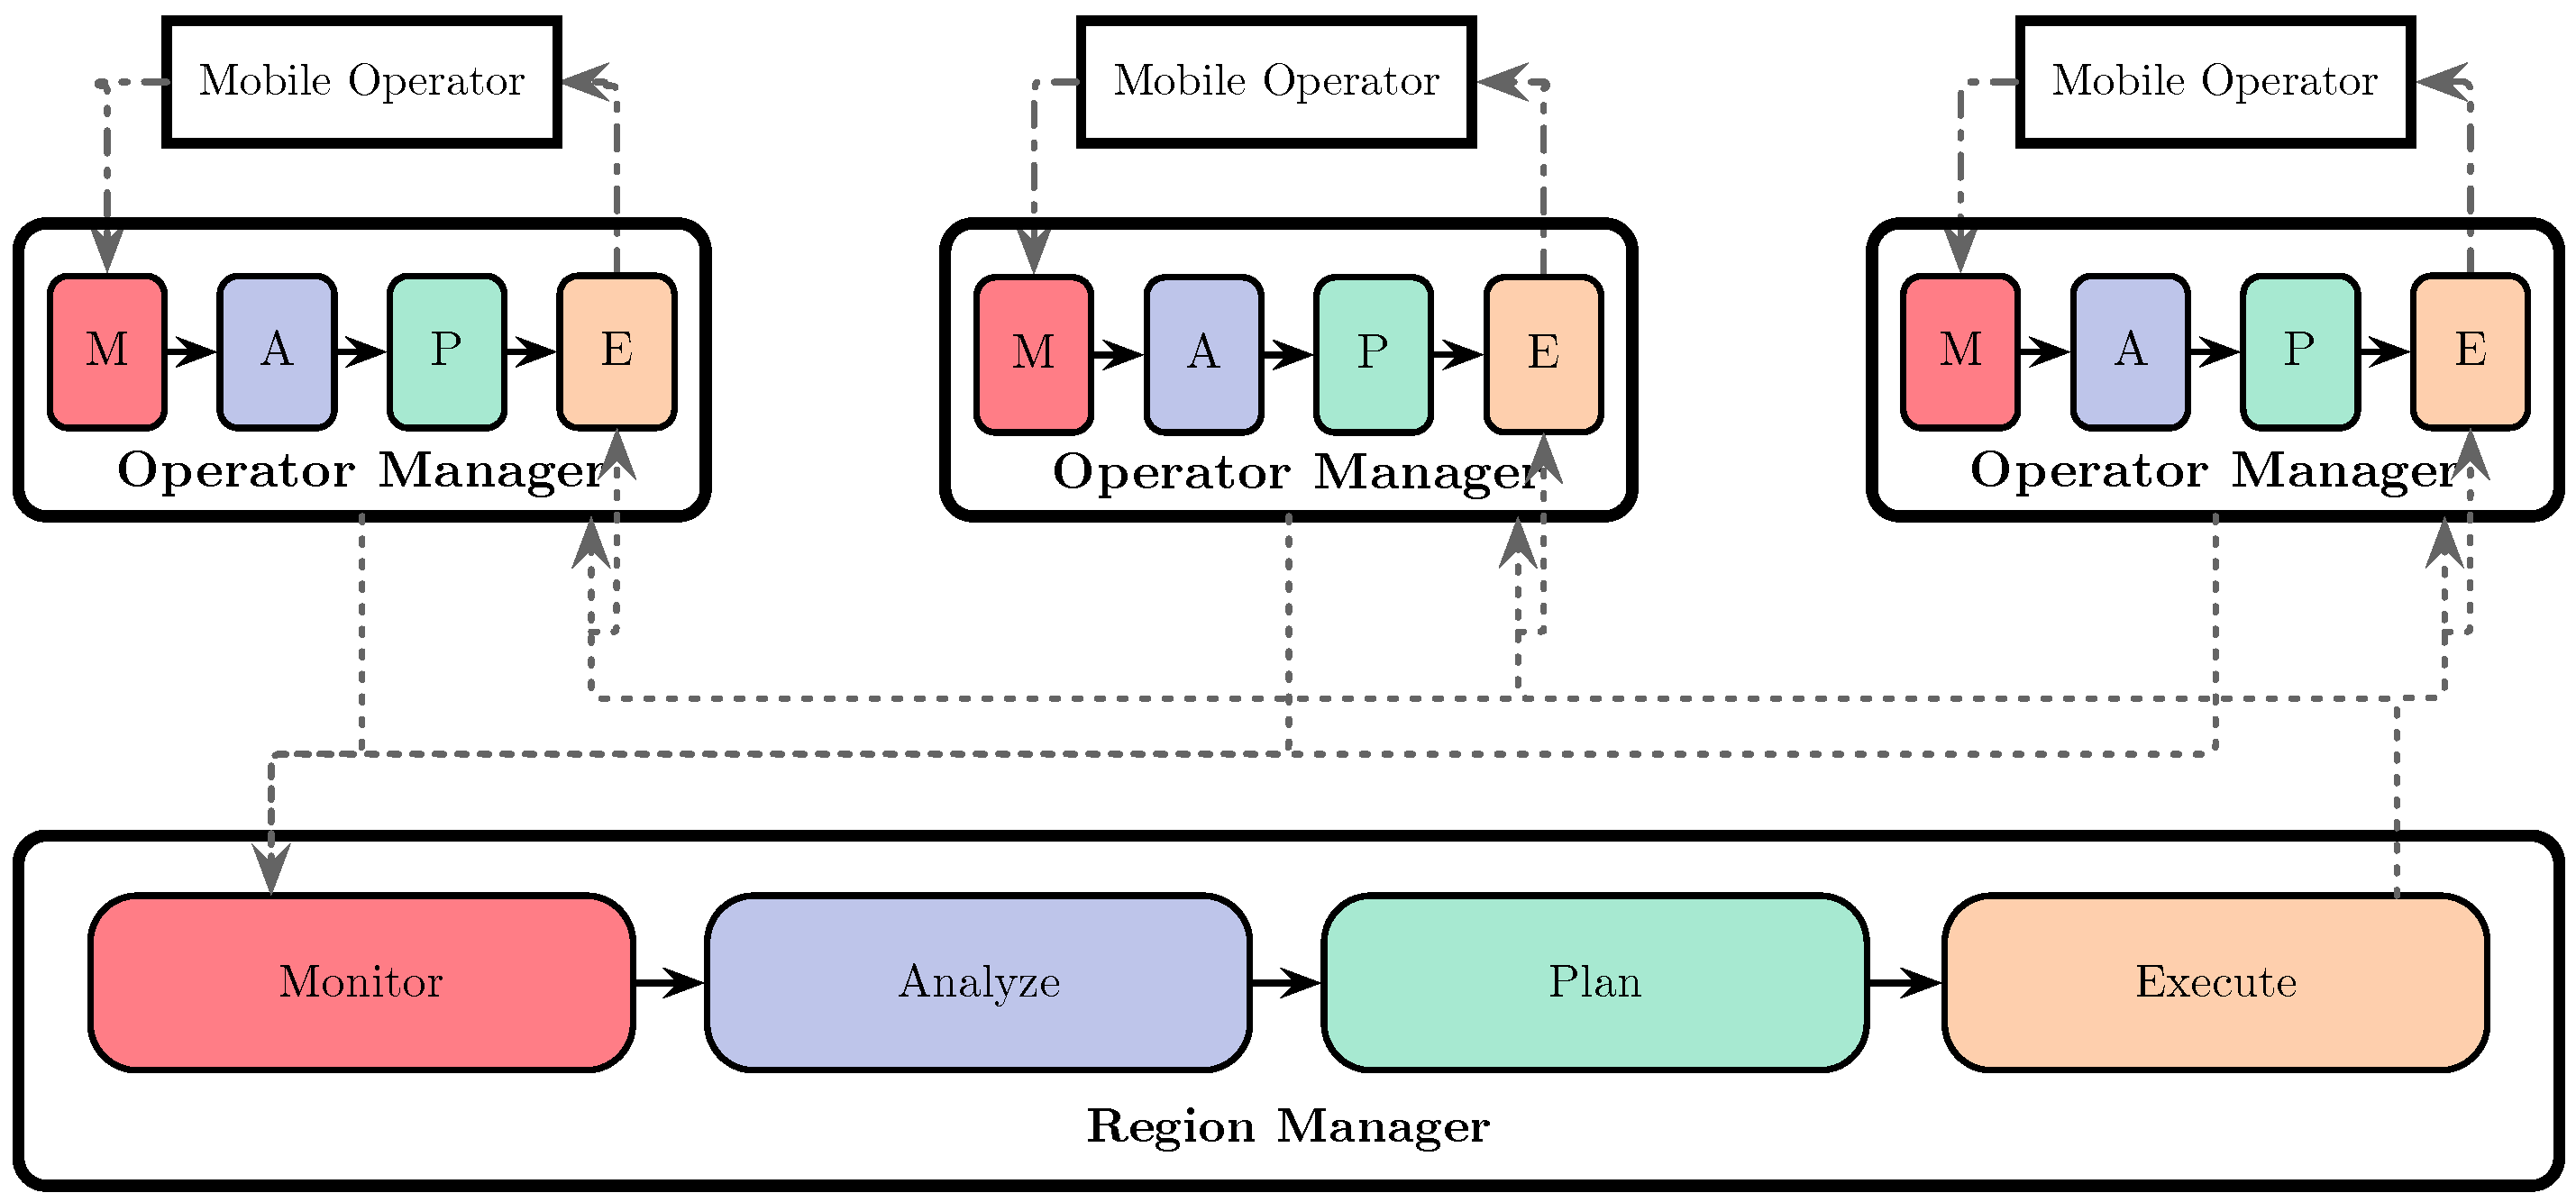
The integration model proposed uses the MAPE control loop [27], a well-known model for self-adaptive systems composed of four phases: Monitor, Analyze, Plan, and Execute. We create a hierarchical MAPE control pattern of two levels, as shown in Figure 1. This two-level model enables to steer the system’s adaptation. With multiple control loops, we can work at different time scales and manage different resources or different kinds of resources. This pattern provides a layered separation of concerns to manage the elasticity of complex systems [28]. Such hierarchical design allows overcoming the system bottleneck represented by the centralized components of the MAPE loop in the master-slave pattern for its application to elastic data stream processing, especially when the system is composed of a multitude of processing entities scattered in a large-scale geo-distributed environment [29].
At the highest level, the RM (Regional Manager) builds and maintains the cluster with the available mobile nodes. At the lowest level, the OM (Operator Manager) monitors and coordinates the mobile node at a local level, considering the operators deployed inside.
Different groups of devices may collaborate with computing power, which we call processing regions. The devices connected to the same access point constitute a region. Moreover, an SPS may use several regions that interact independently with the central SPS cluster.
The physical nodes (static and mobile nodes) in the architecture are the operator’s containers. We classify the operators according to their function in source operators, processing operators, or terminal operators. The source operators (spouts in Storm terminology) capture data from external sources and transform data into events to send them downstream into the graph topology. It is possible to have more than one source operator.
We differentiate between the Storm’s bolts to maintain persistence, making two groups of operators, processing and terminal: mobile devices can only host processing operators but no terminal operators. Those operators receive events from upstream nodes and send them downstream in the graph. A terminal operator, on the other hand, is where the processed data converge. The terminal operator outputs the processed information towards databases, visualization tools, a new stream of events, and the like.
Within a processing region, we define the following components:
- Region Manager (RM): It is located in a static node and coordinates and monitors the region.
- Operator Manager (OM): It is located in the nodes that interact with the processing operator hosted by mobile devices. It is responsible for the communication with the RM and OMs of the nodes connected downstream and upstream in the processing graph. This component manages load balance among mobile devices.
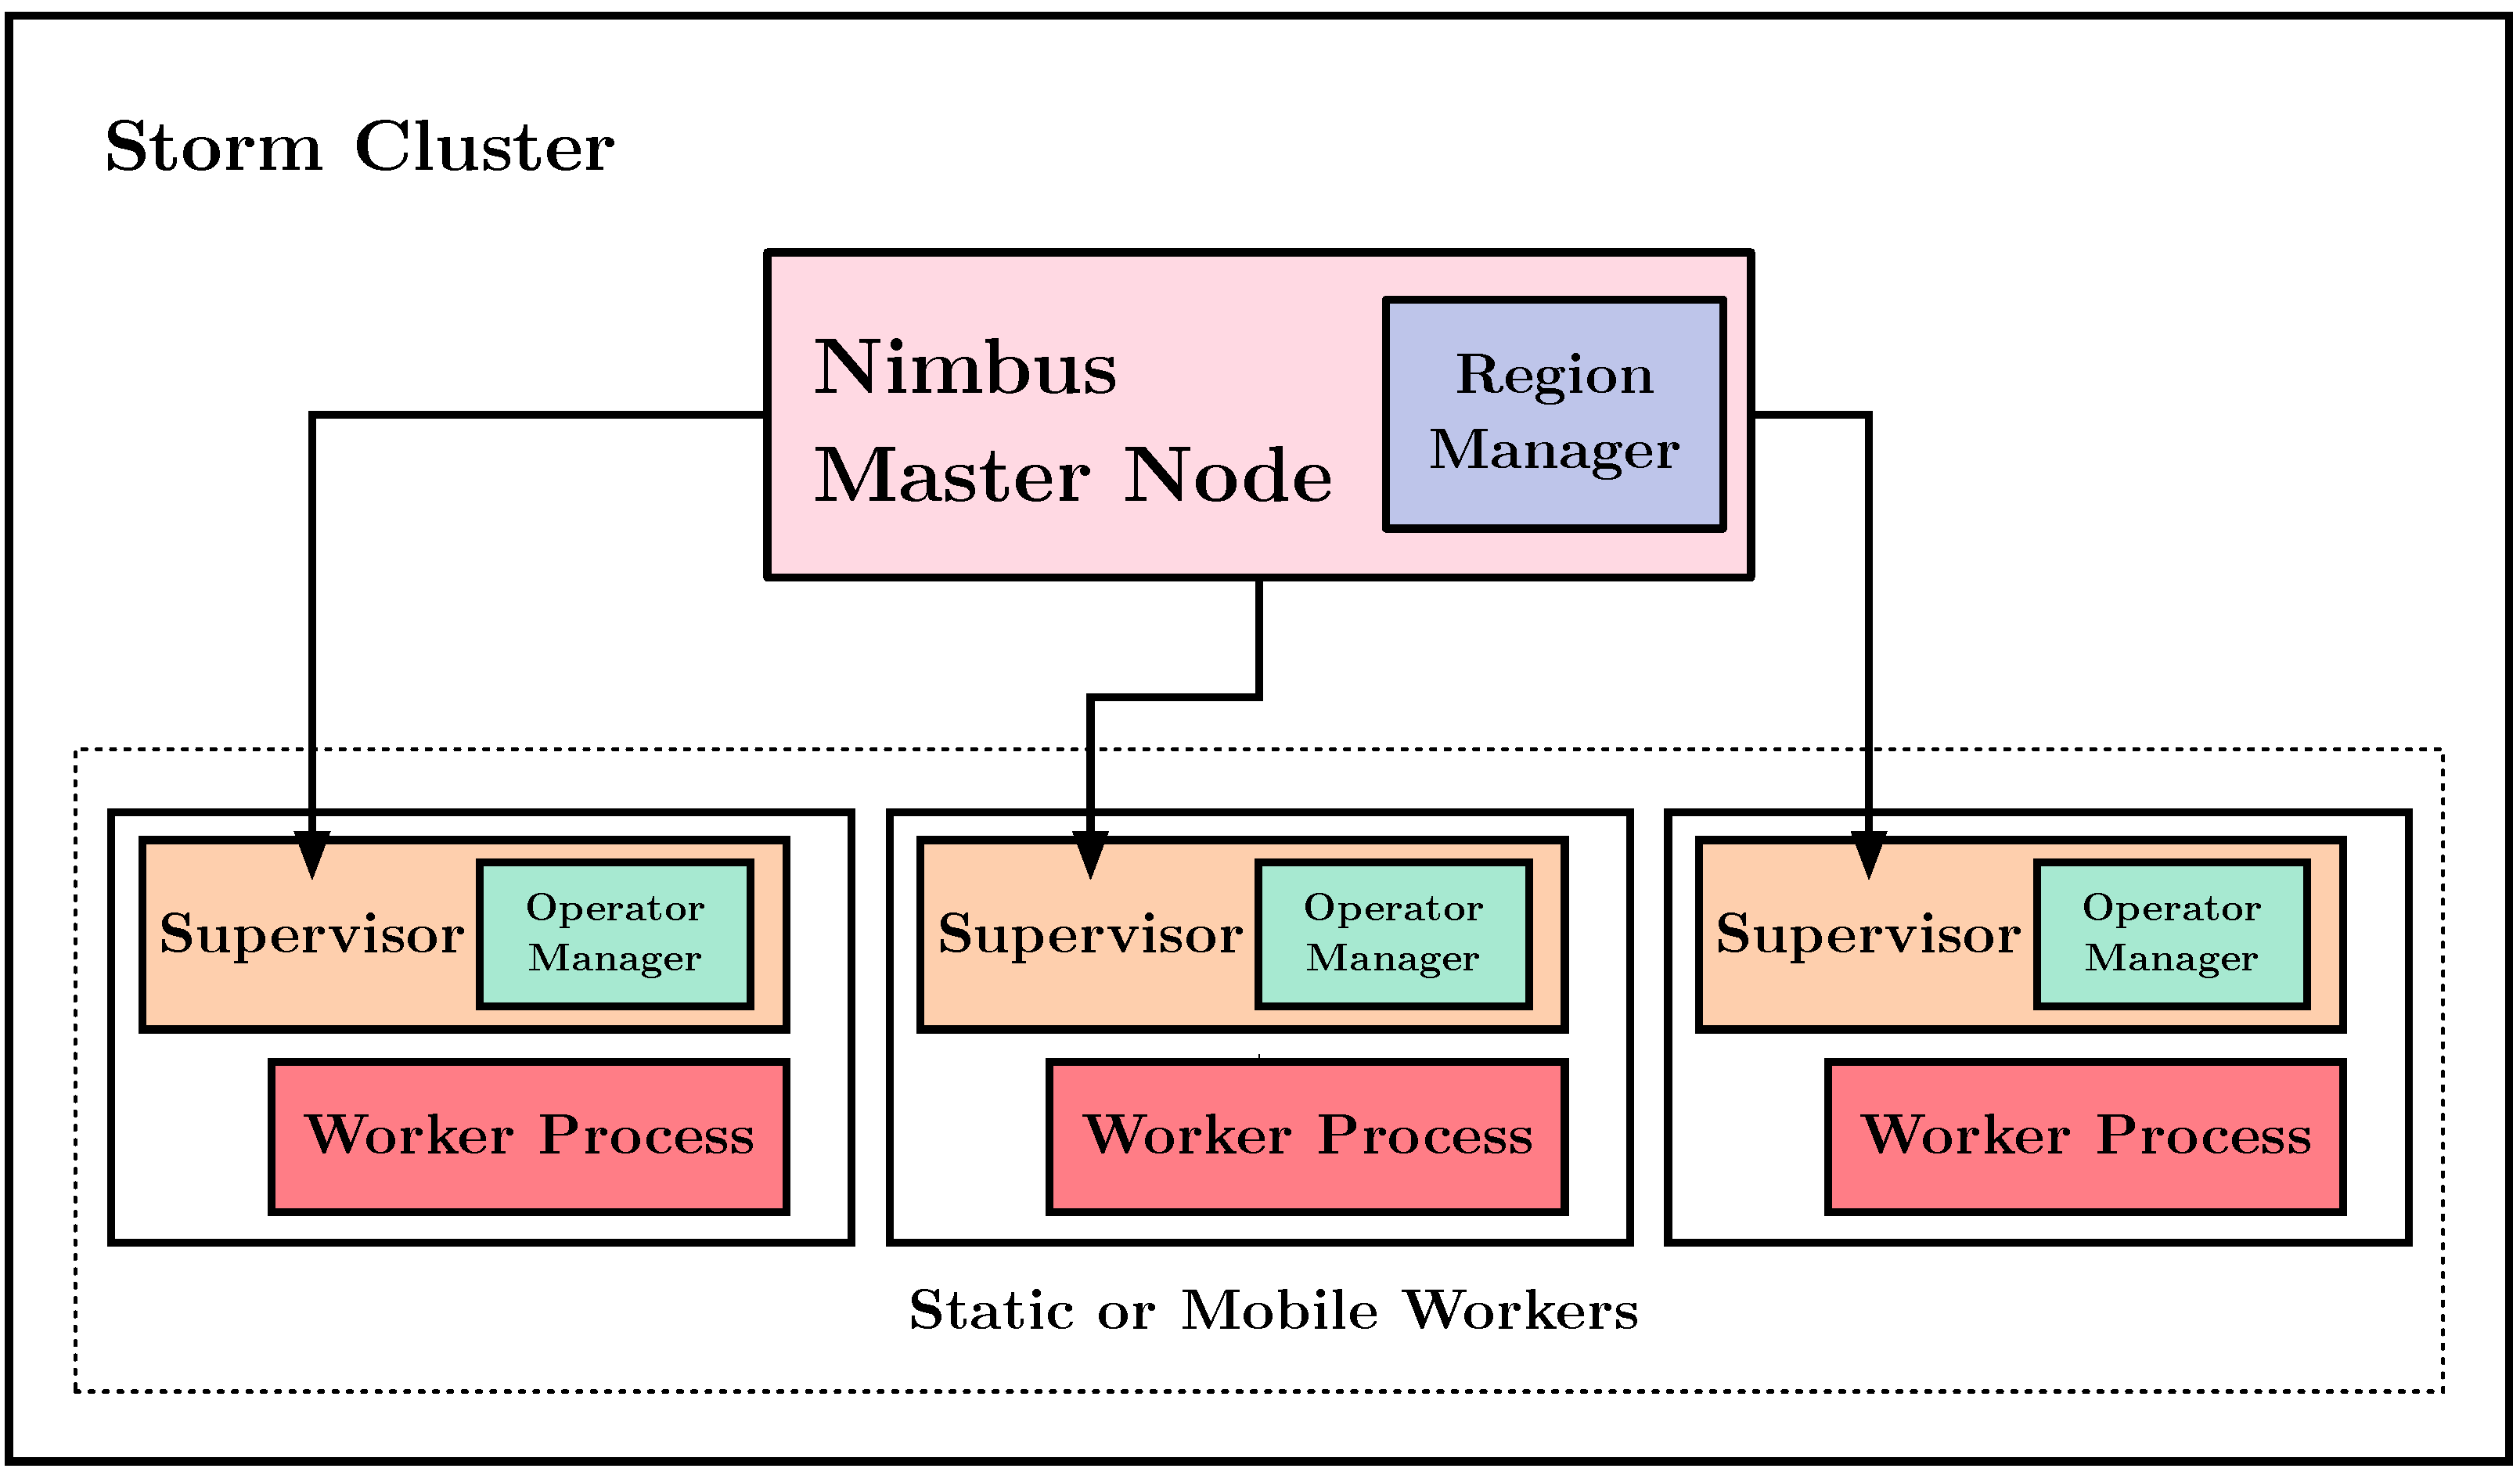
Figure 2 shows the integration between the components of our architecture and Storm’s architecture. We include the RM alongside Nimbus for the control of the nodes and the OM with the Worker Supervisor for the node’s administration.
A node is considered different in our model if deployed in a mobile device or a static device; we call them mobile node (MN) and static node (SN). A static node is a common SPS node deployed in a cluster machine that is permanently connected to electric power and the Internet. A mobile node is deployed in a mobile device that shares its processing power with an SPS. Only processing operators should be deployed over a mobile node, and they have a static node as a backup replica for fault tolerance. Our fault tolerance mechanism is presented in Section 3.4.
During the system’s execution, a process located in the RM constantly receives admission requests from mobile devices. This request contains the state’s values of the mobile device’s critical resources: energy and signal strength. Then, the RM creates a worker node (with its corresponding OM) inside the device that requested the entry, and it is currently in the state waiting. This model distributes the operators automatically using the MAPE control loop that the RM executes:
- Monitor: The RM recollects the resource state of the mobile nodes using asynchronous communication. At each loop, the monitor phase considers the devices with updated information.
- Analyze: The RM uses the information of the monitor phase to create a list of mobile nodes categorizing their resources (i.e., energy and signal strength) into normal or low compared to a pre-defined threshold (Algorithm 1).
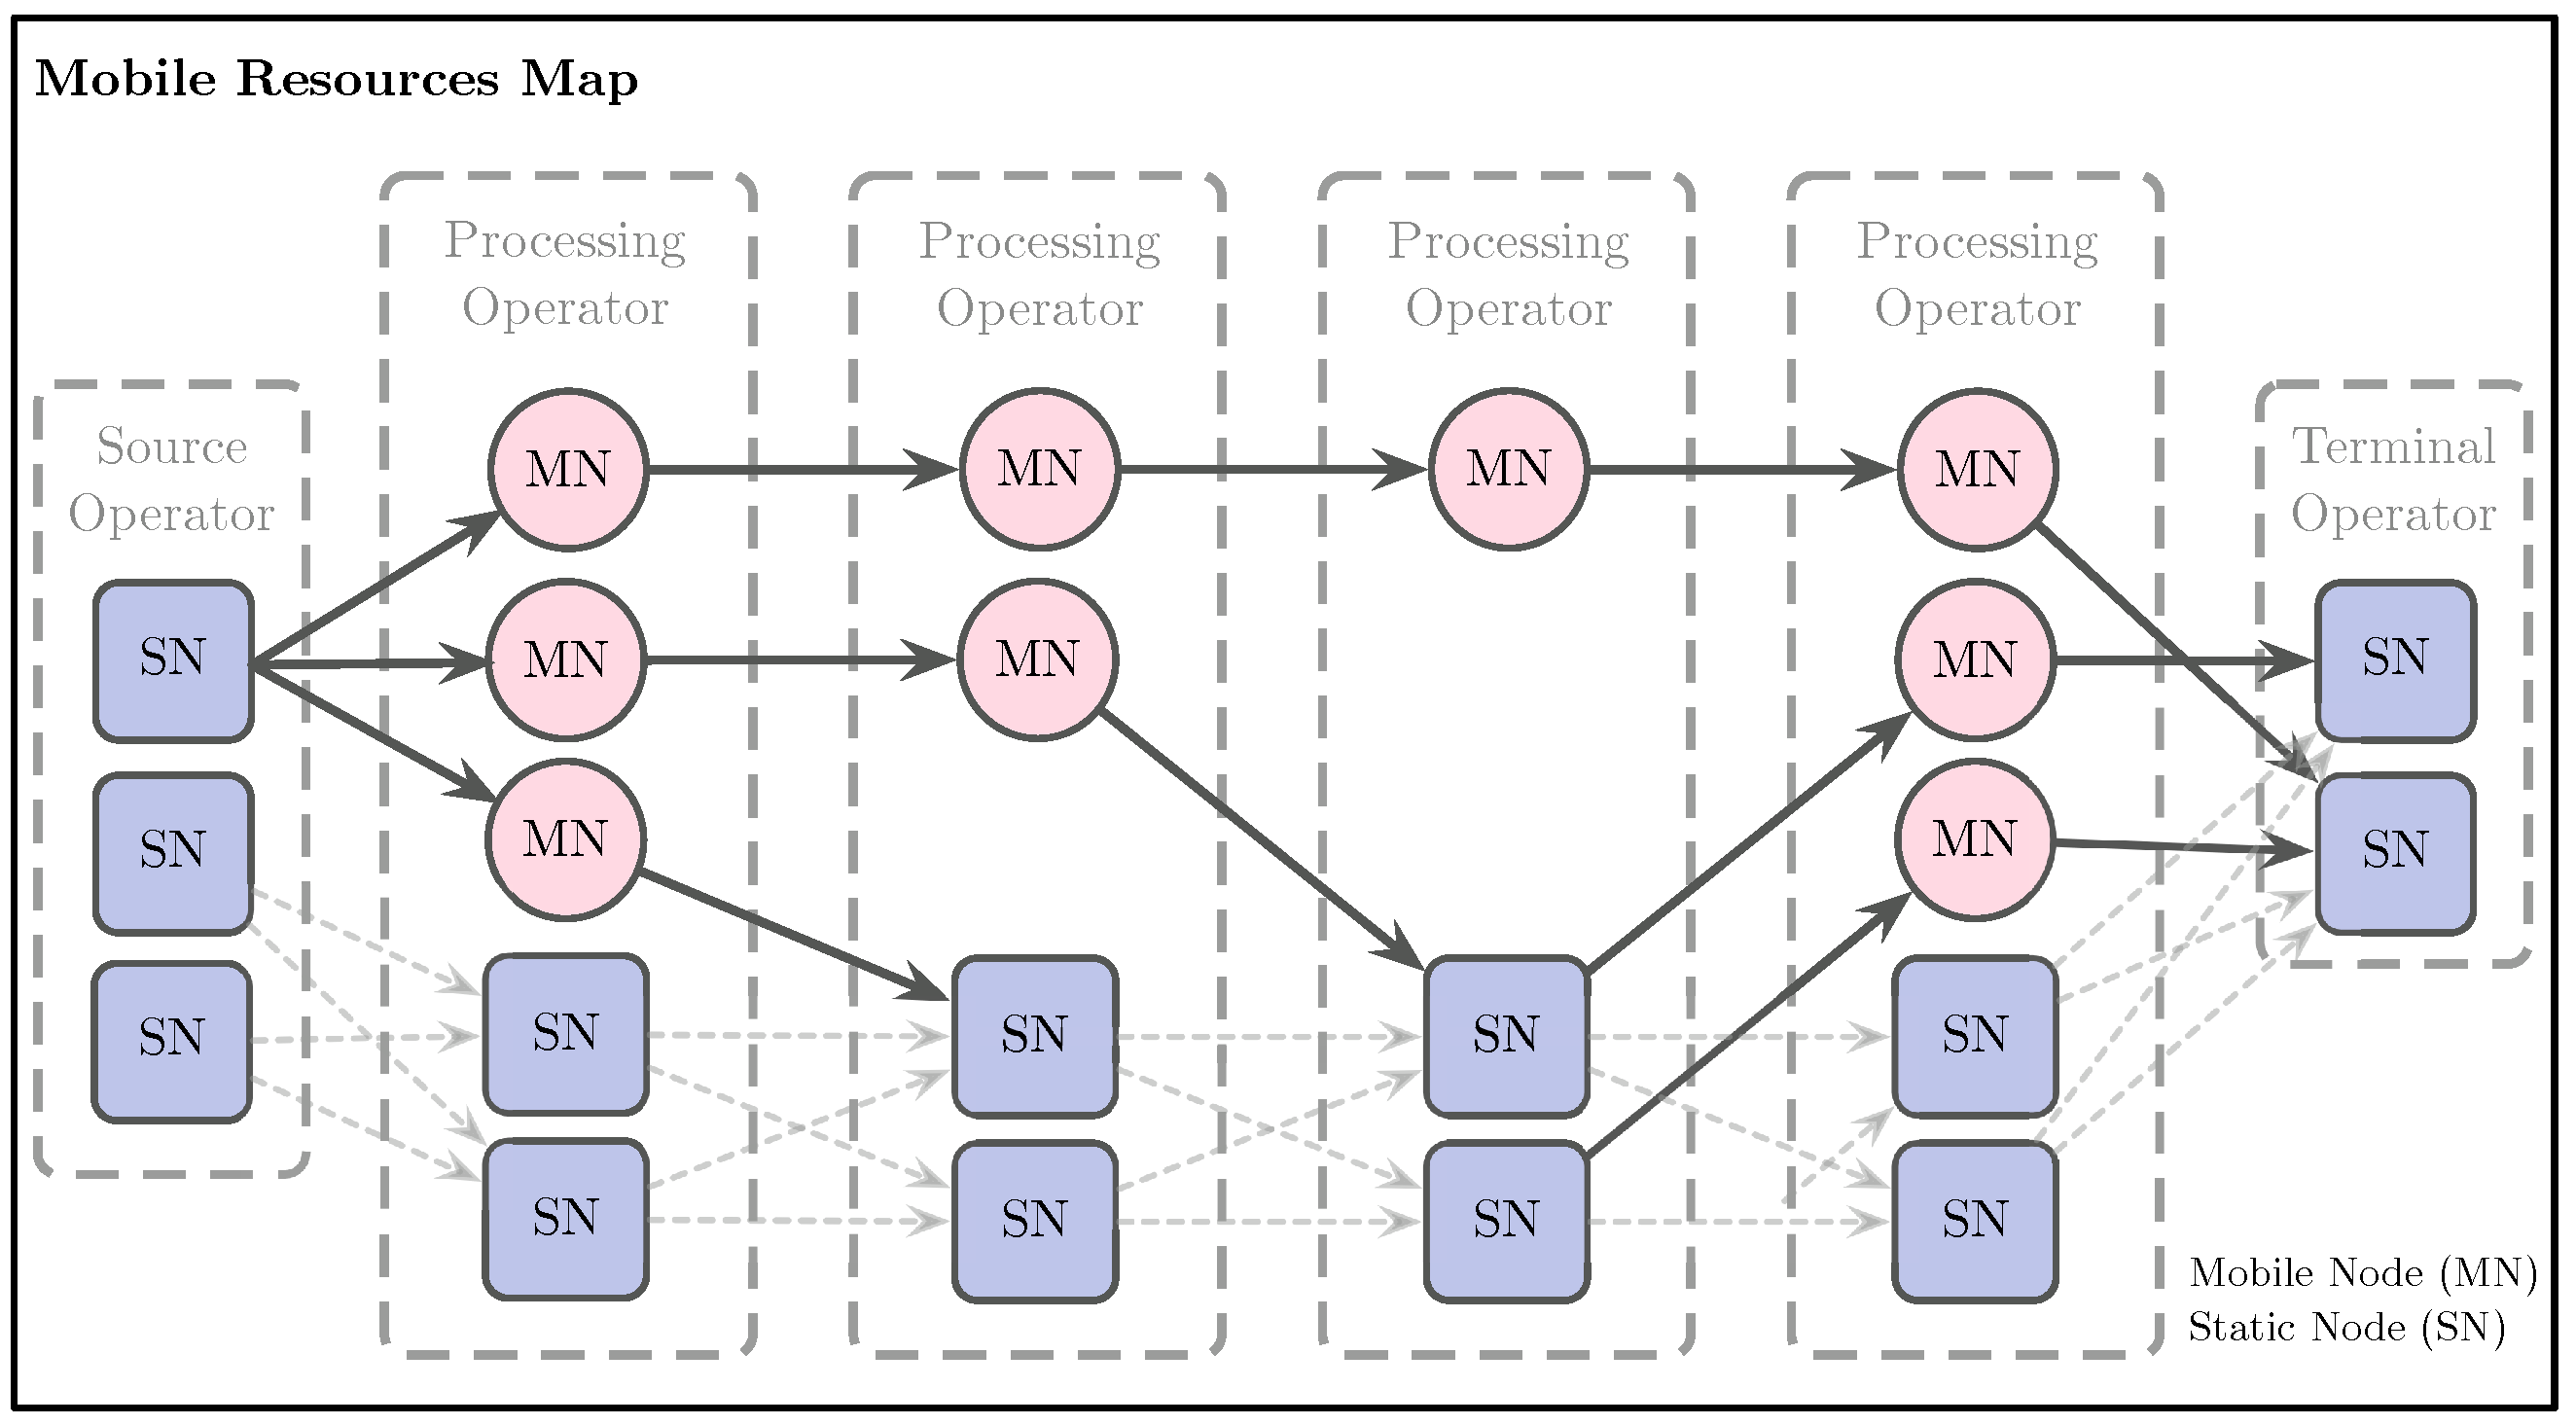
- Plan: The system activates and deactivates mobile nodes according to the categorization obtained in the Analyze phase. The system only uses mobile devices in a normal state. Deactivation prevents using devices with dangerous energy levels and low signal strength (outside the coverage cell). The activation of mobile nodes indicates that they can host processing operators. The system builds a mapping between the mobile nodes available and the processing operators of the graph topology. In our model, we consider that a processing operator may require replication many times. Mobile nodes are assigned with processing operators considering the task complexity and the mobile device’s resources. We categorize mobile devices as high-end, those devices with specs similar or higher than a Samsung S10 (see Table 1). On the other hand, low-end devices are those with lower specs than Samsung S10. Algorithm 2 describes this procedure. Figure 3 shows how the RM maintains the node’s state and the assigned operators using a virtual map and other operators’ downstream connections.
- Execute: The system sends the order to the corresponding OMs to remove operators from their mobile nodes or create new operators using the deactivation and activation lists. Moreover, the RM sends the system’s information to the OMs to make them aware of the downstream operators’ location.
| Algorithm 1 Critical resources’ state categorization |
| Require: |
| Ensure: |
|
| Algorithm 2 Operator selection |
| Require: |
| Ensure: |
|
3.3. Event Flow and Load Balancing
We include mechanisms for balancing load and fault tolerance. For operators deployed over static nodes, the SPS uses the default communication model of the SPS. For the mobile nodes, the system uses the same Storm’s model, a push model, where the events are sent directly to the mobile nodes. The OMs coordinate the event distribution towards the mobile nodes.
The number of upstream connections of an operator in a mobile device is limited to one; this restriction curbs network congestion and reduces the energy spent by the amount of event processed. Furthermore, the RM forbids the assignation of operators that have more than one downstream connection to mobile devices, avoiding multiple communication channels. We allow direct connections in the system between processing operators located on mobile devices to avoid a bottleneck in the cluster.
Figure 3 shows an example of a flow of events among operators. We describe the exchanges between the static operators with a dashed line in the figure.
The second level of the MAPE control loop manages local resources inside the mobile devices and implements a load balance mechanism:
- Monitor: The OM measures CPU utilization considering the processor state, the I/O operations, and the memory usage.
- Analysis: The OM decides if a mobile operator is overloaded, healthy, or underloaded using two CPU utilization thresholds (high and low). This mechanism avoids consuming all the mobile node resources with the load assigned by the RM and assigns a sufficient amount of load to under-utilized nodes.
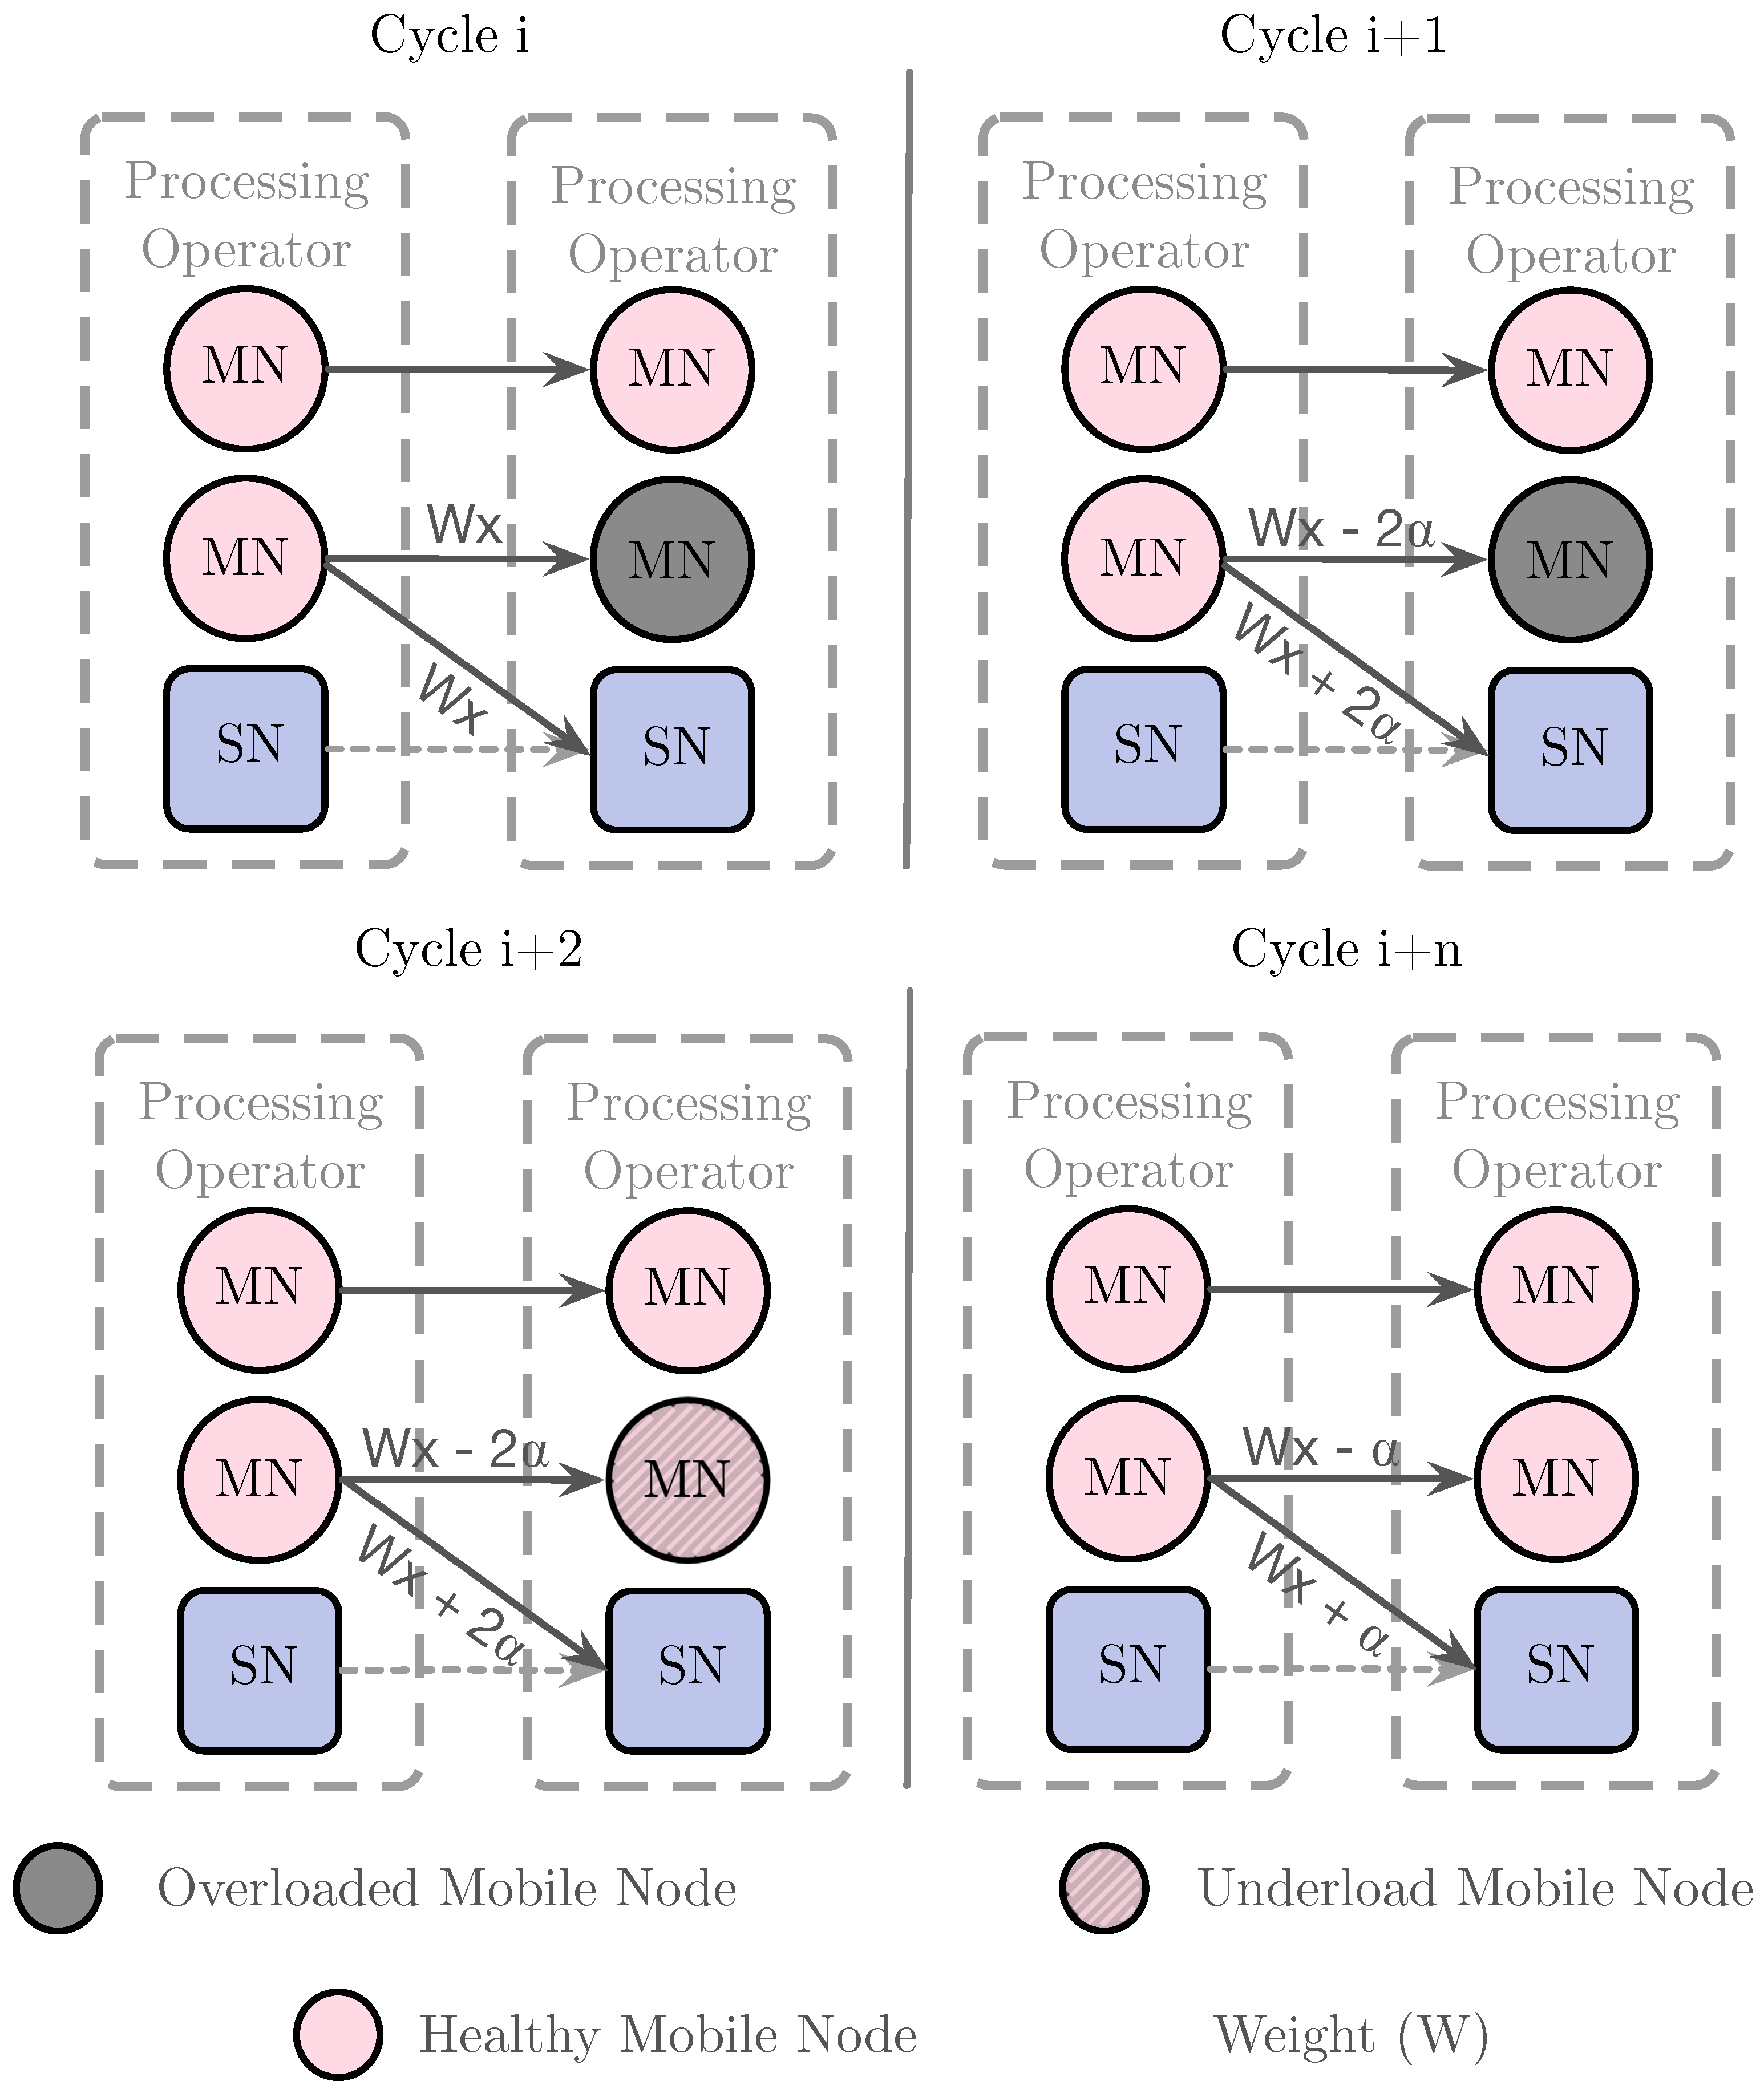
- Planning: If the mobile node is overloaded, the OM changes the upstream node’s scheduling algorithm to decrease the number of events received. The system offloads the remaining events to a static node that deploys a processing operator’s replica. We use the weighted round-robin load algorithm that adapts the weights (representing the load of events) at each MAPE loop cycle. The algorithm decreases the number of events sent to an overloaded node while increasing the static replica’s events. The scheduling process starts with equal weights and changes them in each loop until the device is no longer overloaded.In case a mobile node is underloaded, the system increases the weight of the underloaded node in the upstream node connection, so the number of events received by the node also increases. Figure 4 shows this process: In the ith cycle, a mobile node is overloaded, so the system divides the flow of events between the node and a static node, giving both of them a weight of ; in the th cycle, the mobile node still is overloaded, so the system increases in the weight of the static node decreasing the flow that is sent to the mobile node; in the th cycle, the mobile node is underloaded, then the system increases the weight of the mobile node by ; in the th cycle, the mobile node is in a healthy state.
- Execution: The OM performs the actions defined in the previous phase.
3.4. Fault Tolerance
The static part of this model inherits the Storm’s checkpointing, which creates an additional spout specialized in the emission of checkpointing tuples. The stateful bolts receive the tuples and trigger the bolt’s state to be saved, emitting the checkpointing tuple to the stream.
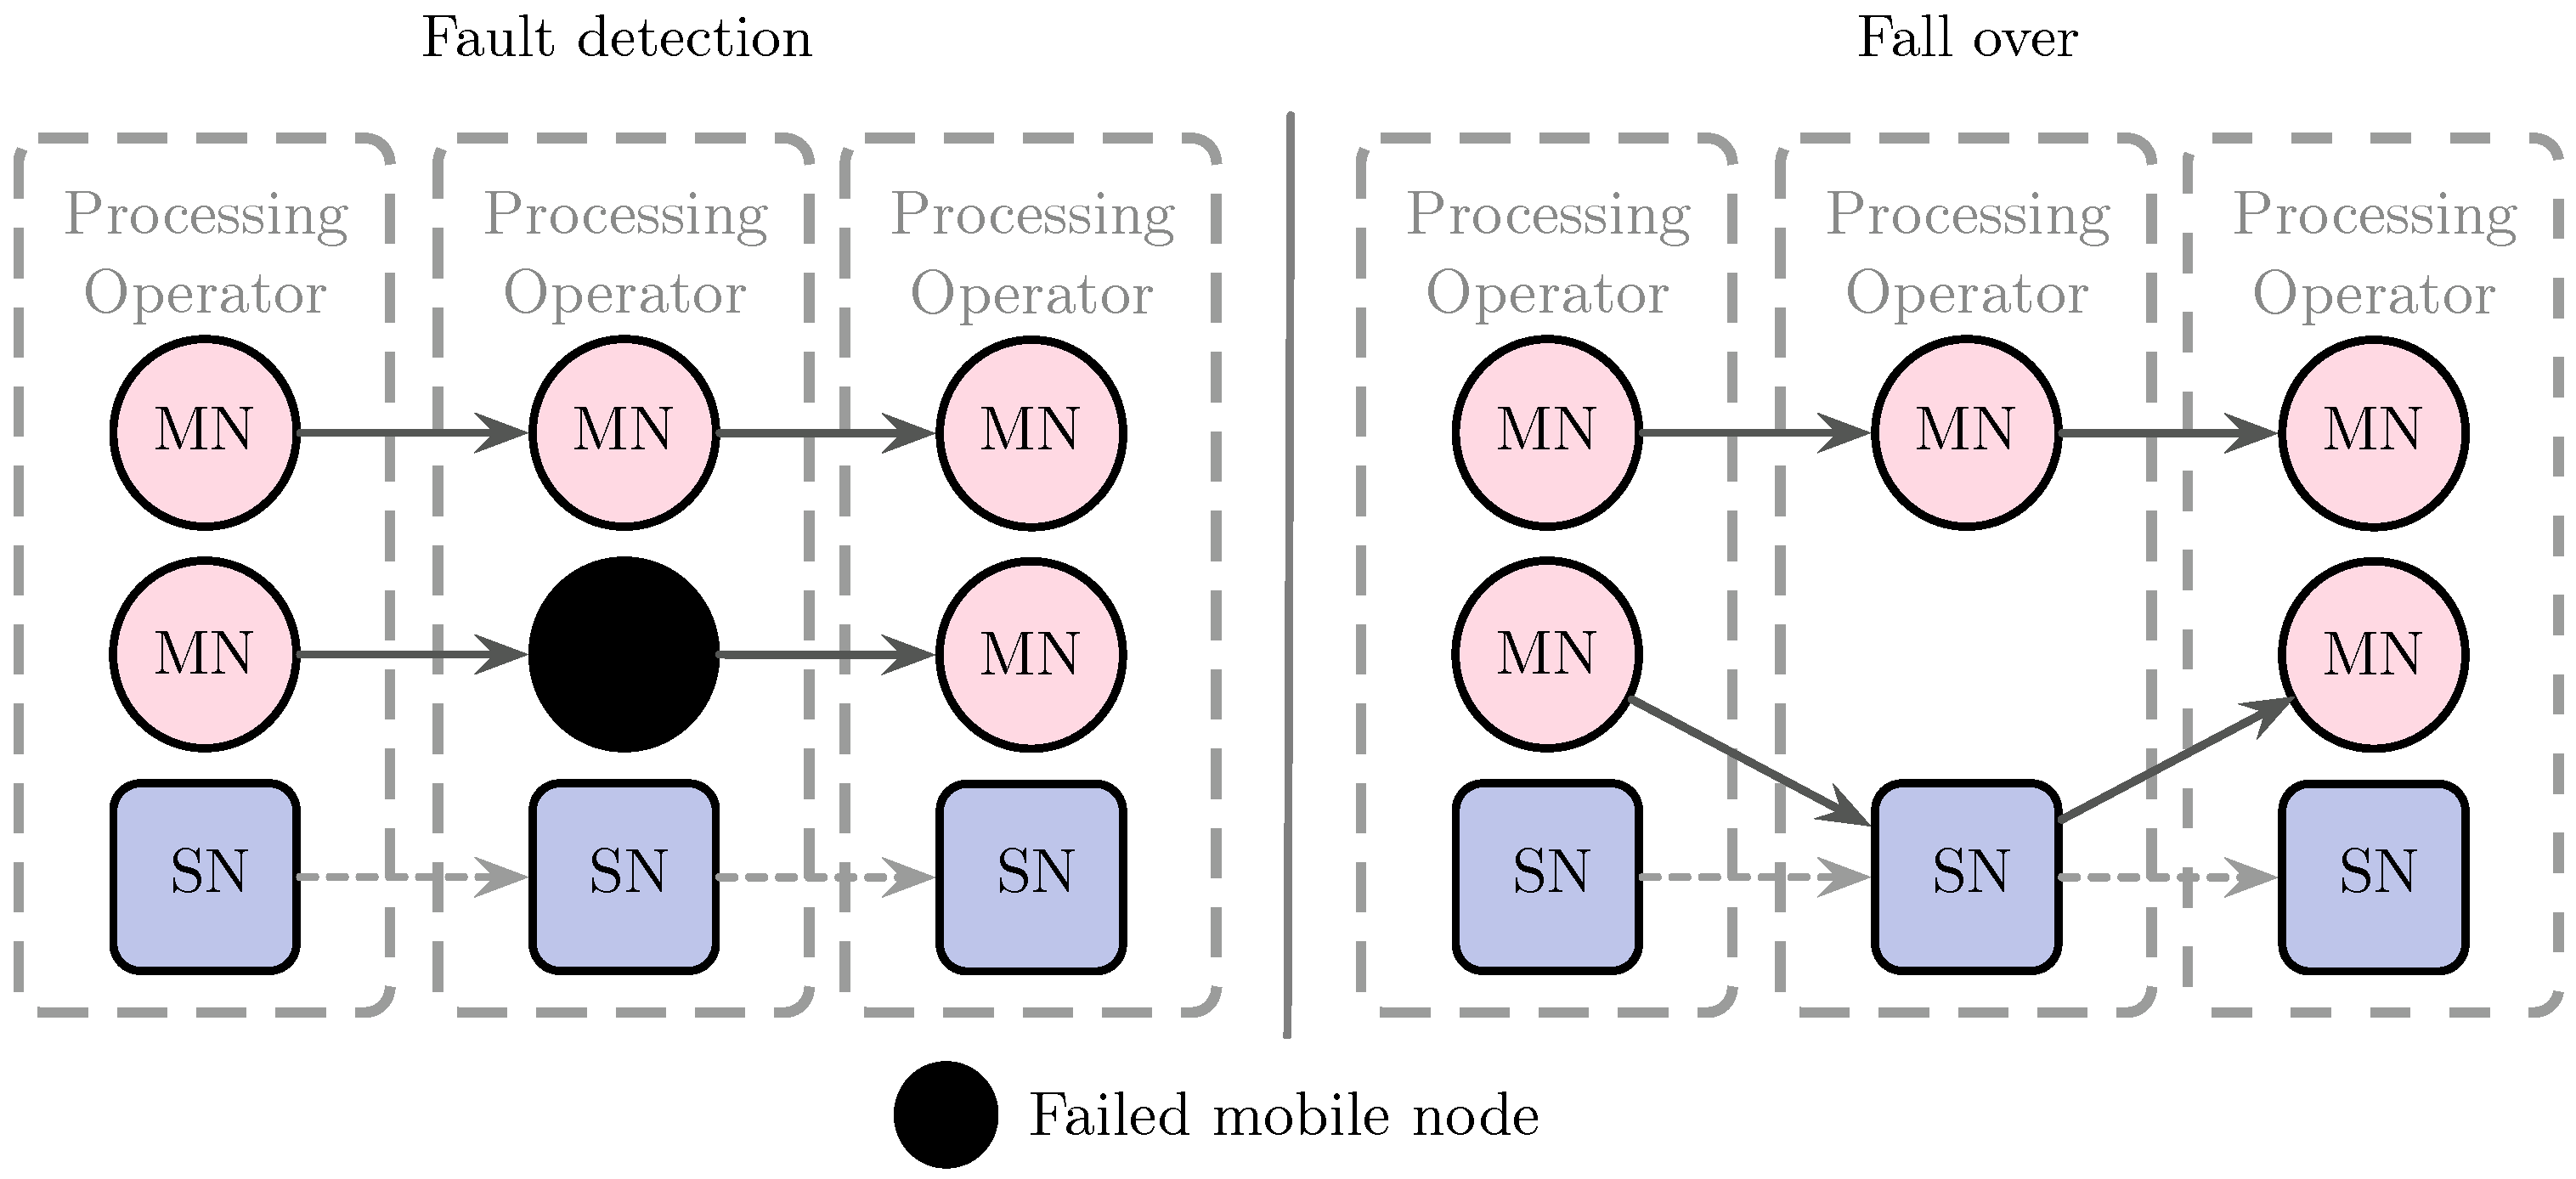
For the mobile nodes, the model detects if the RM does not receive the resources report of an OM, assuming the device is unavailable. Moreover, if an OM detects a processing operator deployed in a mobile node downstream in the graph fails, it first verifies its reachability. It then changes the scheduling process to send all the events to the processing operator that replicates the missing operator in a static node.
Figure 5 shows the recovery of the system when a downstream mobile processing operator fails. The OM replaces the missing processing operator with its static replica. If the node that fails is located upstream in the processing graph, the mobile operator starts receiving events from the failed node’s static replica.
We use the checkpointing-based approach proposed in [25] to decrease the number of event losses due to signal loss or battery drained in the device. Our model performs checkpointing in the mobile devices when the state of the resources is at a critical level (i.e., signal and battery) and every OM’s MAPE cycle. In both cases, the OM manages the checkpointing mechanism, monitors the mobile device, and sends the checkpoint state to the deployed operator’s static replica. With this mechanism, we can guarantee an at-least-once semantic for the processing events as the Storm system. However, we recommend using stateless topologies due to the mobile devices’ volatility in a processing region, where a node may come in and out of the region multiple times.
4. Experimental Evaluation
The methodology used to evaluate SLedge is based on simulation, which allows experimenting with many devices and node’s movements. We defined four stages: (1) experimental design, (2) benchmarking with real devices, (3) implementation in the NS-3 network simulator, and (4) experiment execution and analysis of results. In this section, we detail the main parts of the methodology.
4.1. Experimental Design
In this evaluation, our goal is two-fold:
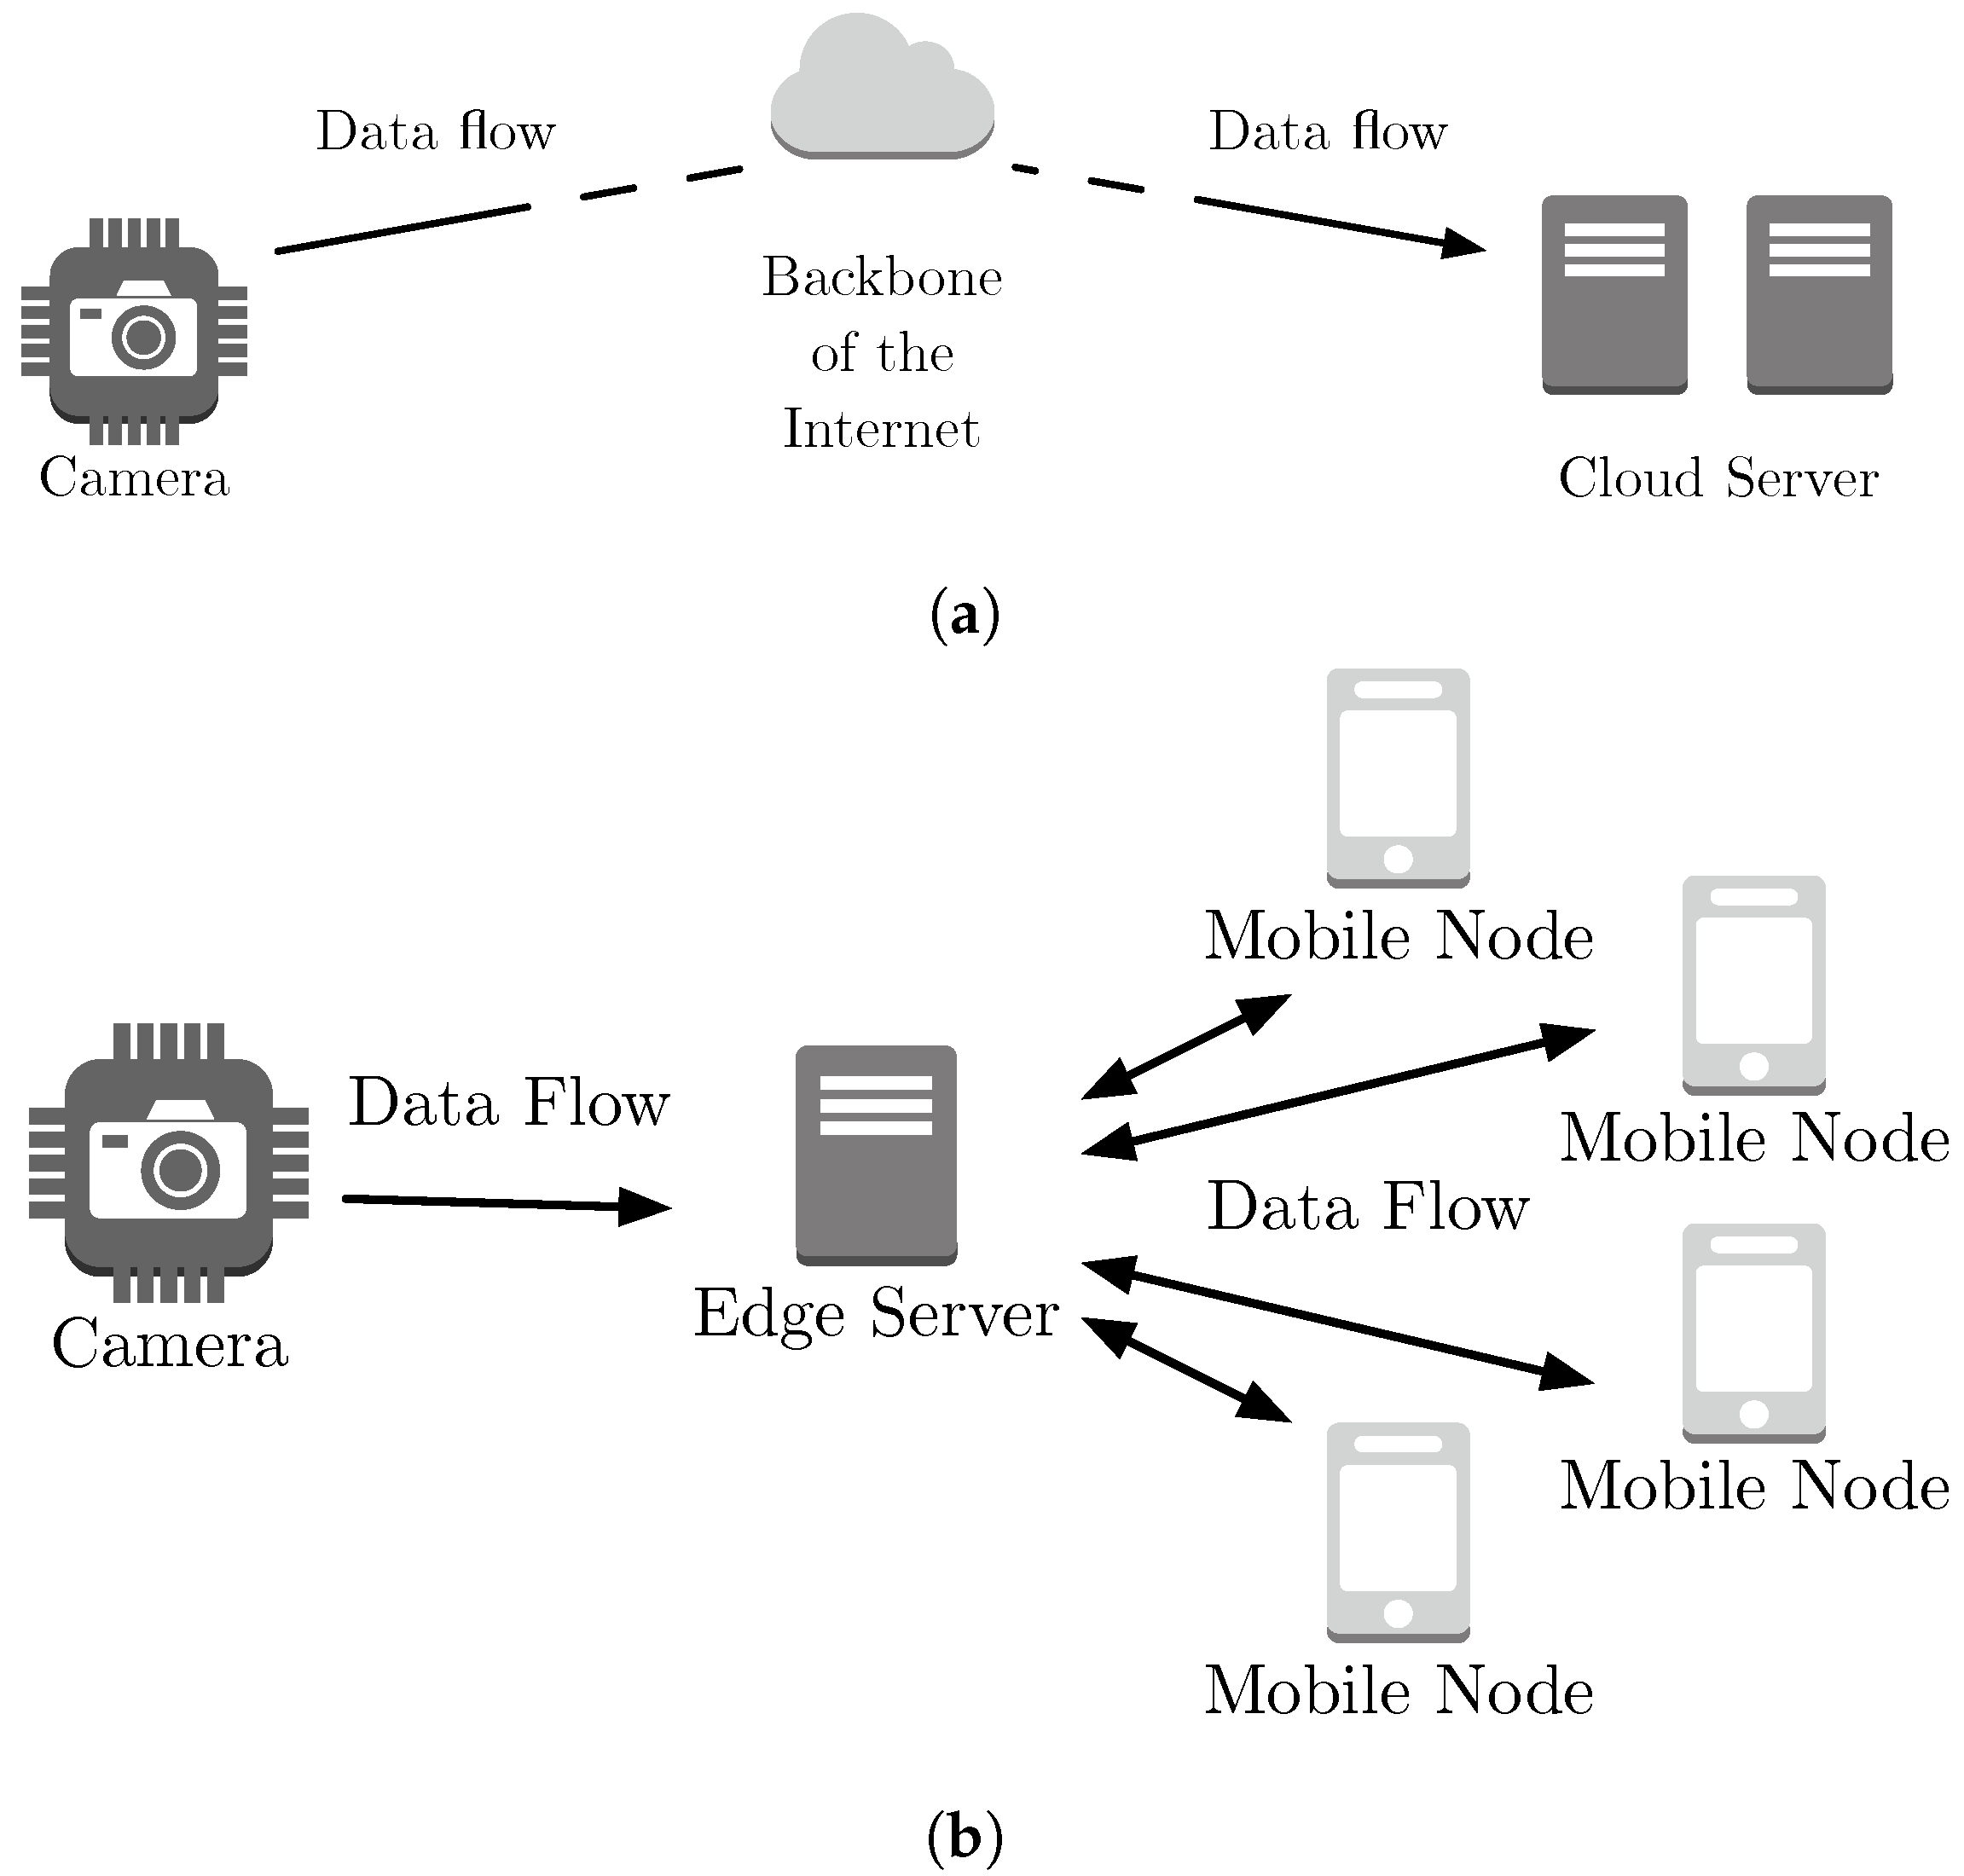
- Compare a stream processing system executing in a cloud architecture versus SLedge, an edge architecture with integrated mobile devices. We aim at measuring the resources required at the edge to achieve an equal or greater performance than the cloud architecture and identify the trade-offs involved. Figure 6 shows both considered architectures. We represent the cloud architecture with a server at the Internet core that dedicates resources to execute more workers than one edge server or one mobile device can dedicate.
- Evaluate the SLedge performance under different settings, such as the overload of mobile devices, increasing or decreasing the flow of events into the system, adding or removing devices to the pool of available resources, and failure of mobile nodes that are working as part of SLedge.
4.2. Benchmarks and Parameterization
Aiming to simulate the environment for evaluating SLedge precisely, we implemented a benchmark with real devices for the three types of architecture components: the cloud server, the edge server, and mobile devices. In particular, we measured the time it takes for an event to go through a bolt in a Storm topology. We call this metric processing latency. The processing latency results are an input to the simulator, configuring the model with the measured behavior of the real components.
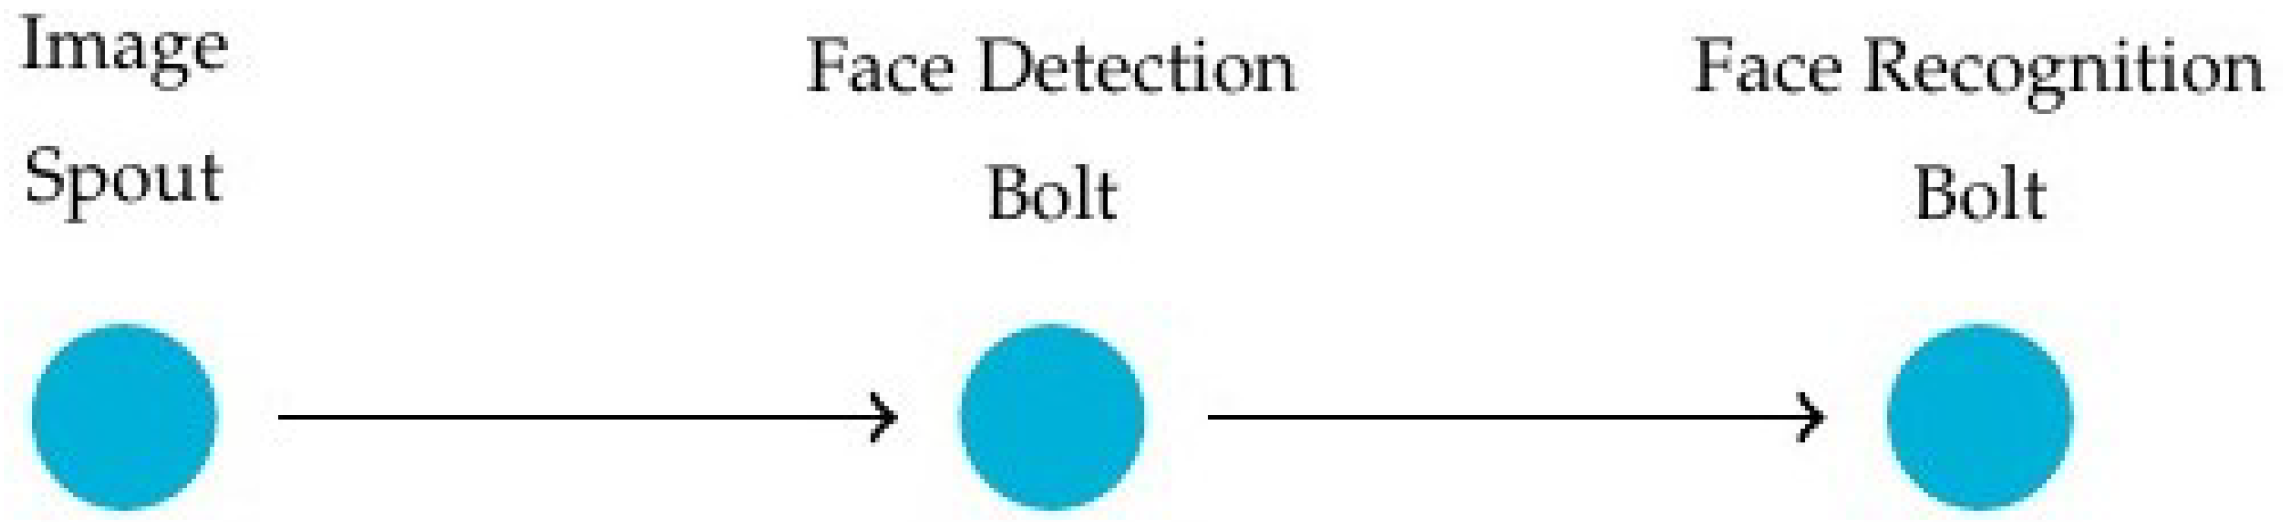
In this benchmark, a real implementation of Storm is used. The Storm application topology used is presented in Figure 7. First, the Image Spout emits a black and white image. The Face Detection Bolt receives the image and detects the faces it contains using the Haar Cascade algorithm [30]. The Face Detection Bolt emits a cropped image for each face. Finally, the Face Recognition Bolt takes the cropped images and uses the LBPH algorithm [31] to recognize a face. This topology is simple and highly parallelizable, with bolts that do not save state (stateless).
Table 1 presents the hardware characteristics of the devices that executed the topology, and Table 2 presents the benchmark results with the processing latency for each bolt and the number of workers that the device can deploy. The processor frequency and the number of workers per component impact the latency results. Even though the latency in the cloud server is higher than the other components, its throughput is higher since the processor allows more workers per server. On the other hand, SLedge forces only one worker per mobile node, which also produces minor congestion.
We observe in the results that the lowest processing latency is obtained by the mobile device and the highest one is obtained by the cloud server. We attribute these to two factors: first, due to the parallelization capacity of each device, specifically, the cloud server has the greatest parallelization capacity due to its large number of cores, which allows it to process a greater number of events simultaneously, compared to edge server or mobile device. Furthermore, Second, because the restriction imposed by the SLedge system was respected, only one worker was hosted on the mobile device, which means that the processing queues are emptier, unlike the servers’ behaviour which has the highest utilization possible.
From this benchmark, we establish the range of latency values for the simulation shown in Table 3. We uniformly generate latency values within the range.
Besides latency, communication time is an important parameter to define for the simulation model. In order to simulate the network latency to the cloud, we assumed the distance between a server in S ao Paulo and Santiago, Chile (https://wondernetwork.com/pings; accessed on 13 April 2021), which are common locations for datacenter infrastructure in South America.
Finally, to simulate video feed processing, we define the size of each image frame using the distribution presented in [32] that found that the Pearson distributions are the best fit for the dataset used using both the graphical method and the hypothesis test.
4.3. Experiments and Results
The scenario of the experiments that we carried out is a system that processes a video feed. We executed each simulation ten times, and computed average values and standard deviation values, represented in the graphs with . The default parameters are the following:
- The number of events per second emitted by the camera is 60, corresponding to the number of frames per second.
- Nodes are static during the participation in the SLedge system so no mobility model is required.
- CPU utilization thresholds are 0.4 and 0.9 for low and high thresholds, respectively.
- is 15%. We employ the basic energy model provided by NS3. This model determines the energy spent in the transmission of a message (tx), in the reception of a message (rx), and a harvester (hv), that drains energy periodically from the device. We configured the values based on the benchmark results (Energy model parametrization values: rx = 3.373, tx = 3.373, hv = −0.179). We assigned an initial battery power randomly between 15% and 100% of the maximum device capacity (3400 mAh).
- RM’s MAPE cycle is 5 s.
- OM’s MAPE cycle is 6 s.
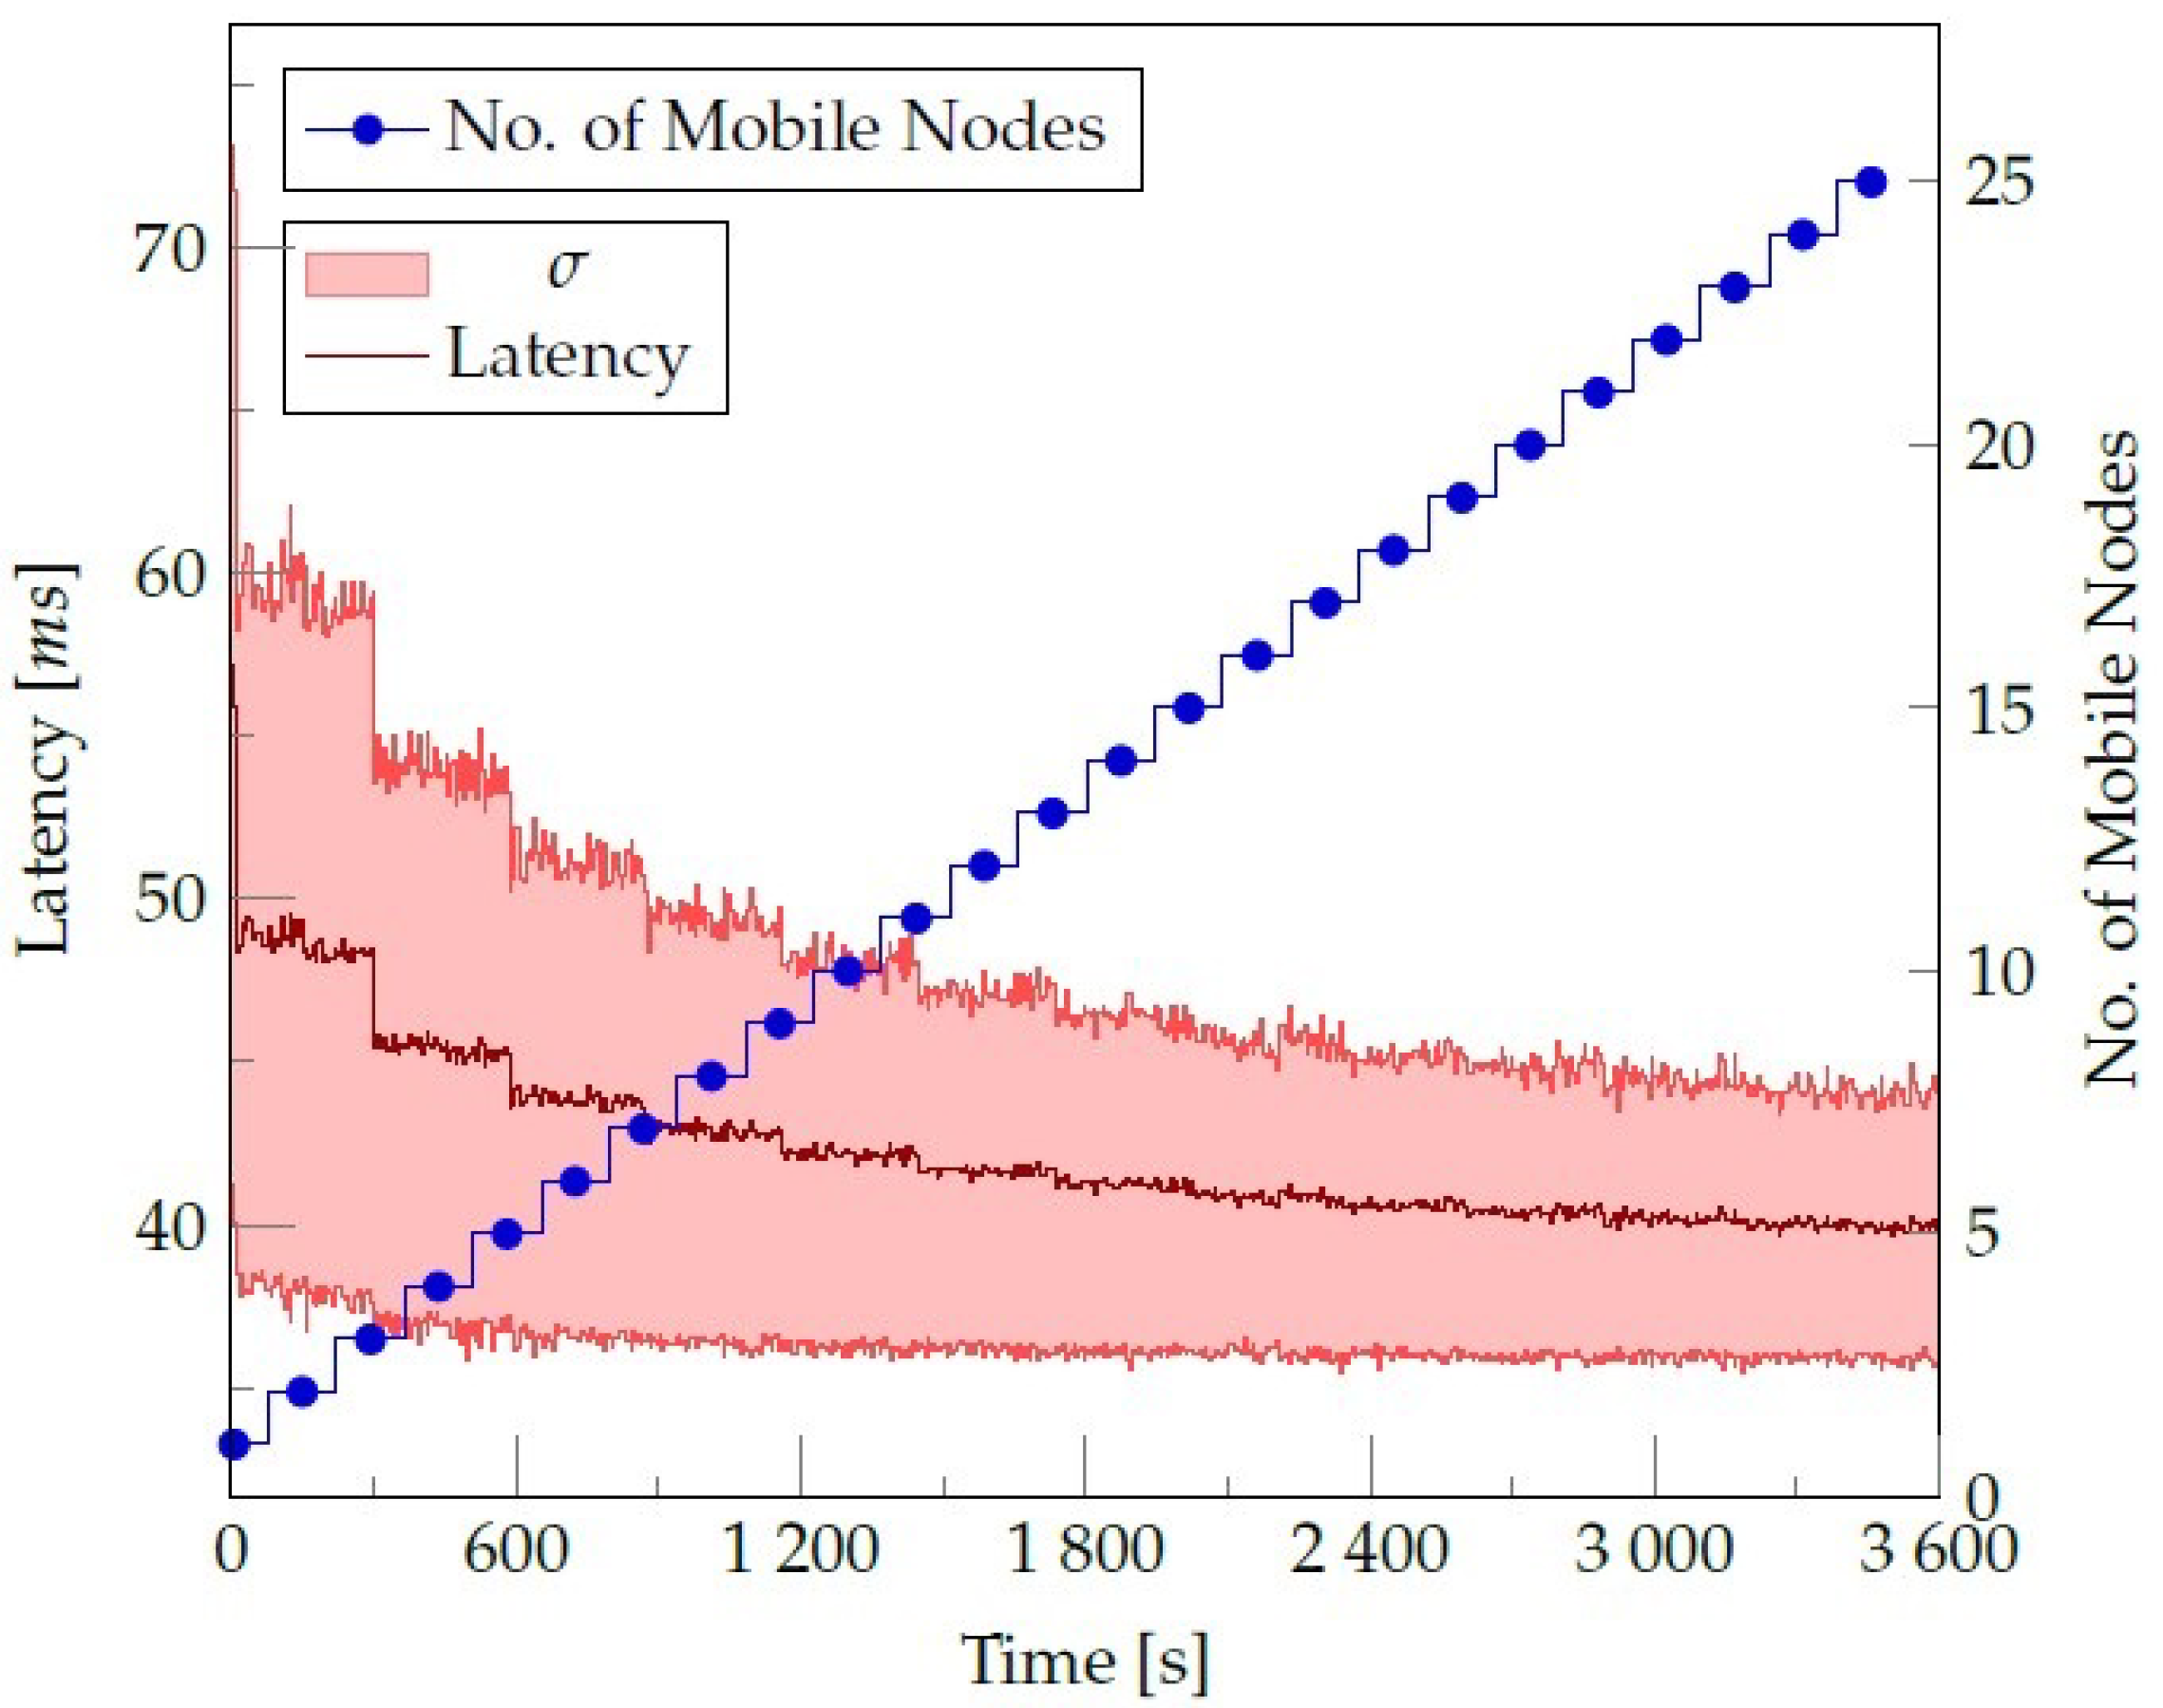
In the first experiments, we analyze the contribution of the mobile nodes to the system in general, particularly how the event’s latency is affected when changing the number of mobile nodes in the SLedge. We measure latency as the time an event goes through the whole topology, from the moment the spout generates the event until the terminal node consumes the event. The topology has two processing operators (bolts), with a replication of three nodes each. Twenty-five mobile nodes enter one by one in the SLedge system. Figure 8 shows the results.
After a certain number of nodes enter the system, the contribution of new nodes becomes marginal to the latency reduction; this number is around ten mobile nodes in our simulations. This behavior results from the communication overhead produced by the distributed model of SLedge, where each worker is in a different mobile node. We conclude that the system should limit the number of mobile nodes allowed in SLedge at the same time, considering this latency measure if the data arrival rate is constant like in this scenario. However, in a dynamic scenario, the number of nodes that parallelize the processing system decreases latency changes. The adaptability and self-adjustment of the system are important, and in SLedge the number of nodes does not harm the latency metric; it only stops improving.
In the next experiment, we simulate the system over both architectures described in Figure 6, the cloud architecture versus the SLedge model. We measure the event’s latency to compare the systems. The delay between the end-user and the cloud server was set to 137 ms, while the number of mobile devices was set to ten nodes, considering the previous experimentation results.
The result obtained in this simulation is that the average latency of events of the edge architecture is 42 ms and 228 ms for the cloud architecture. The edge architecture has a lower event latency since the data generation is much closer to where it is being processed. Moreover, even if we decrease the delay between the user and the cloud server, the edge architecture still performs better since the flow of events congests the server. The size of the server processing capacity impacts the results together with the communication latency through the Internet backbone.
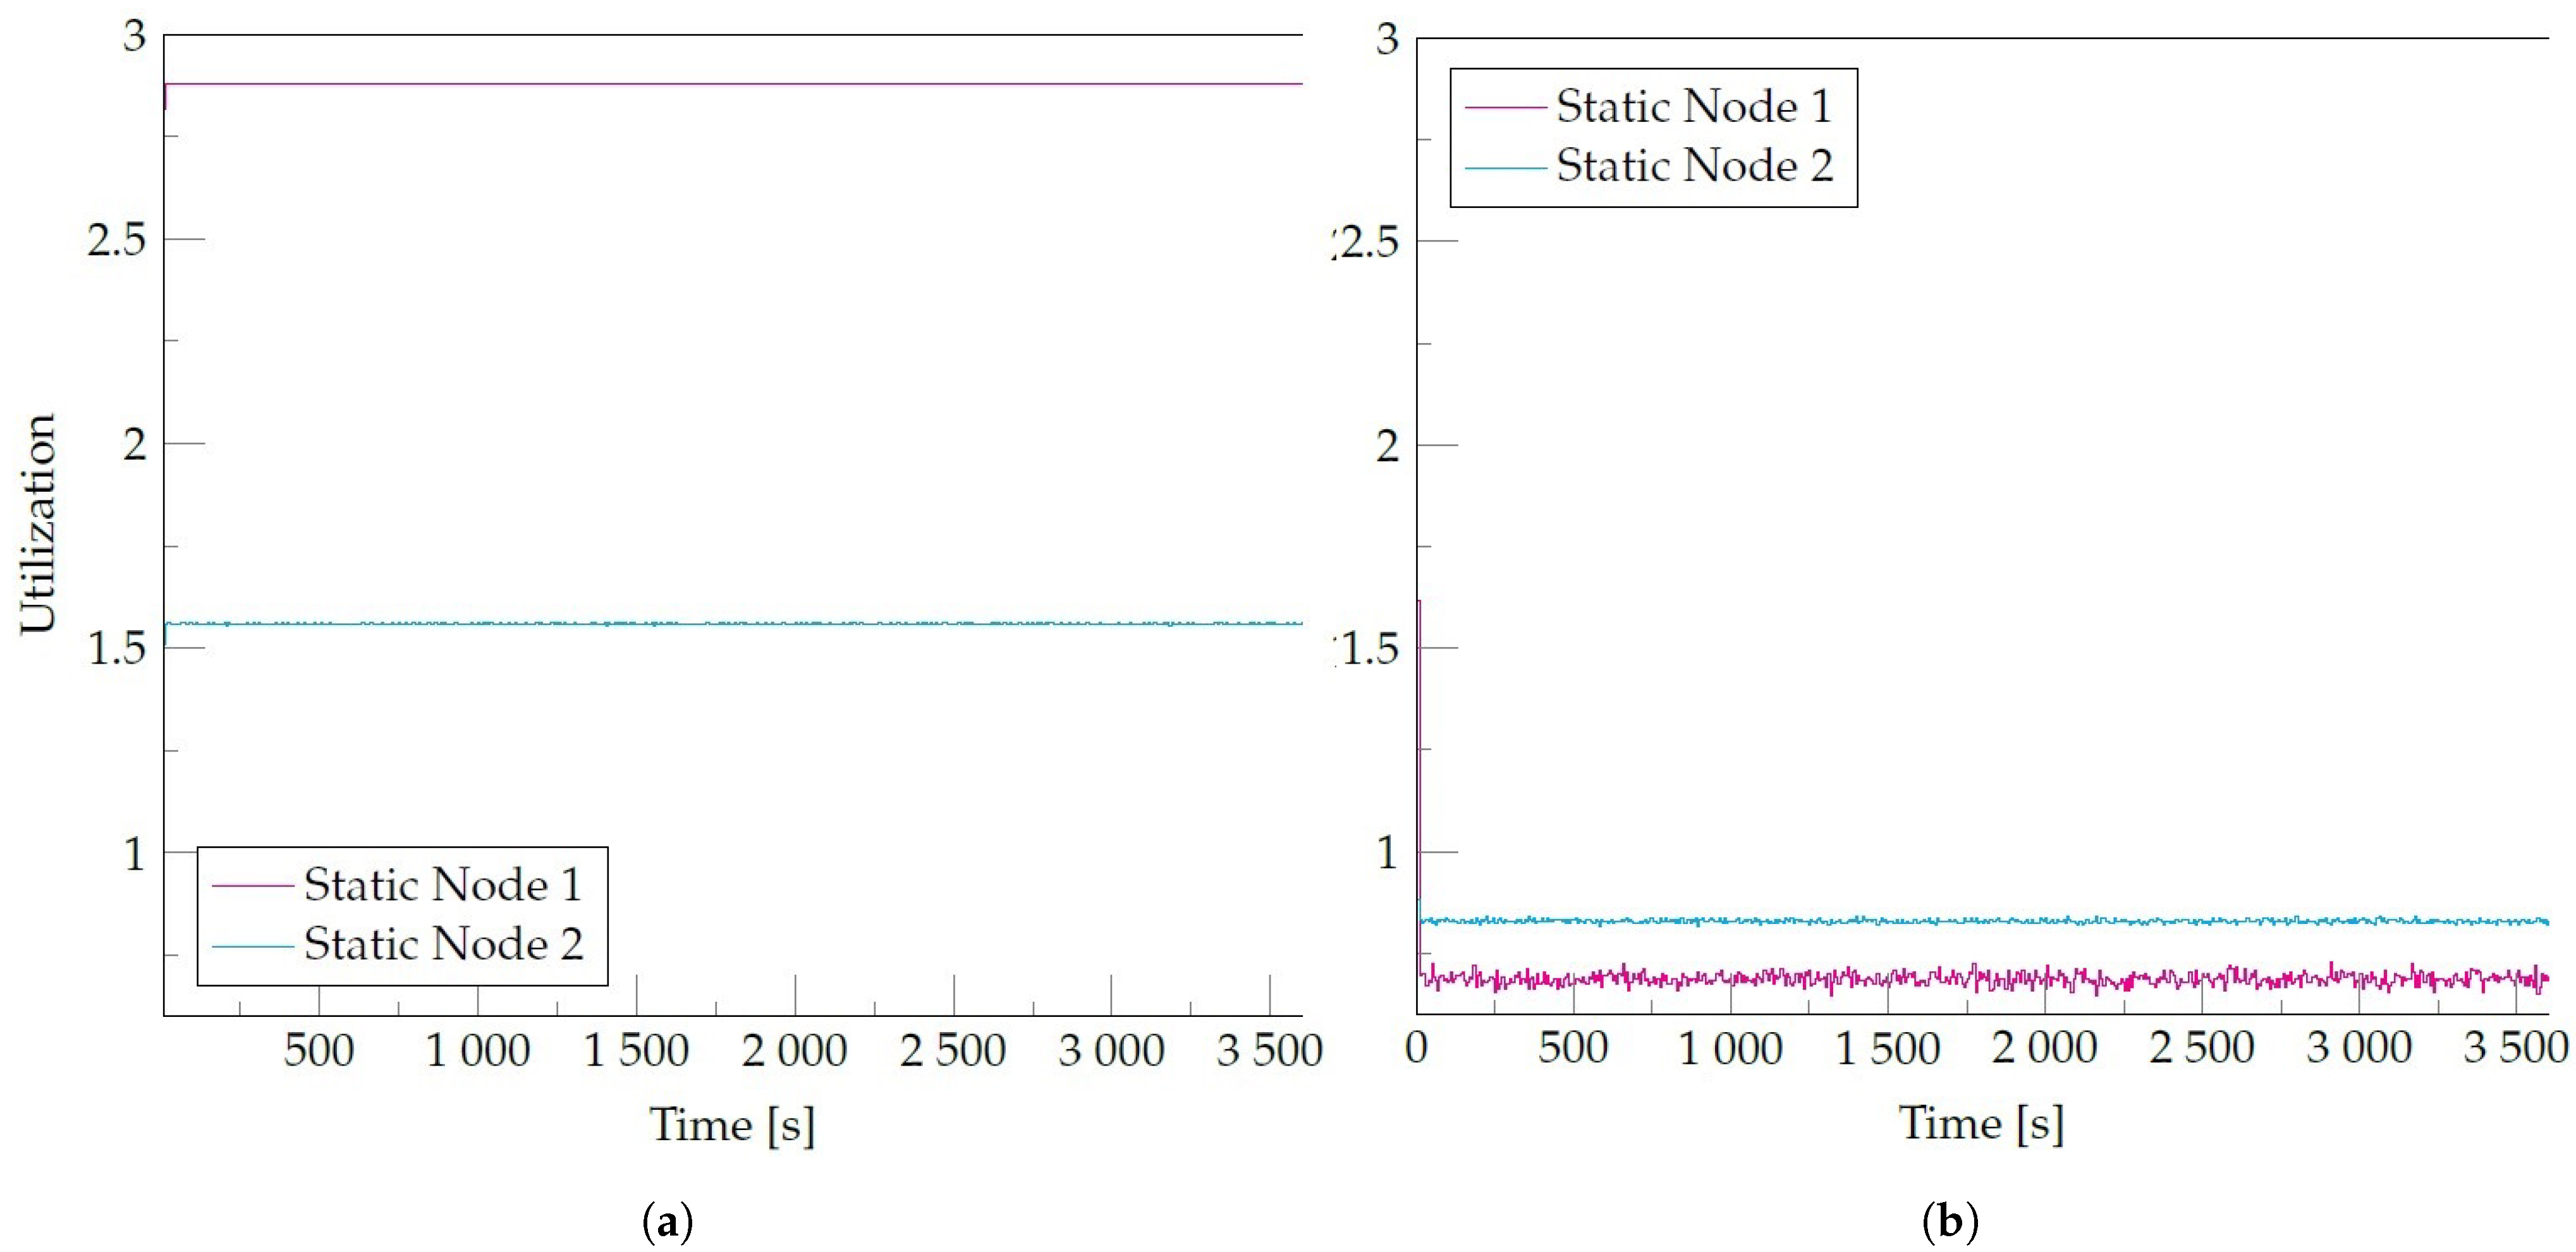
We will use this scenario to see the effect that the SLedge system has on the nodes located in the servers (static nodes) to analyze how the mobile nodes alleviate their load. We measured the utilization of the static nodes following Equation (1) previously introduced in [33]. This metric considers the time it takes to a static node to process an event, a value obtained from a benchmark, and the number of events arrived over an observation window. A utilization value of 1 means 100% utilization of the node, while greater values represent an overloaded node. On the other hand, values smaller than 1 represent an underloaded node.
Figure 9 shows utilization for the Static Node 1 and Static Node 2 that represent the components of the topology that are located in the edge server. We can observe that nodes of the cloud architecture are overloaded. According to the utilization metric, utilization greater than 1 reflects such a state. Overloaded nodes cause the event latency to increase since they cannot process the number of events that arrive. On the other hand, the static nodes of the SLedge present utilization of lower than 1, not overloaded. This behavior results from redirecting load towards the mobile nodes, which mainly support the node that receives the most significant load in the topology, Static Node 1.
In the cloud, congestion can be avoided with auto-scalable algorithms that increase processing resources available in the system in a dynamic way. The trade-off to consider is the energy spent on the new devices and networking used when the data travels through different Autonomous Systems. Latency can improve in this scenario; however, as the processing elements are further away than on edge, the latency metric will still be a problem.
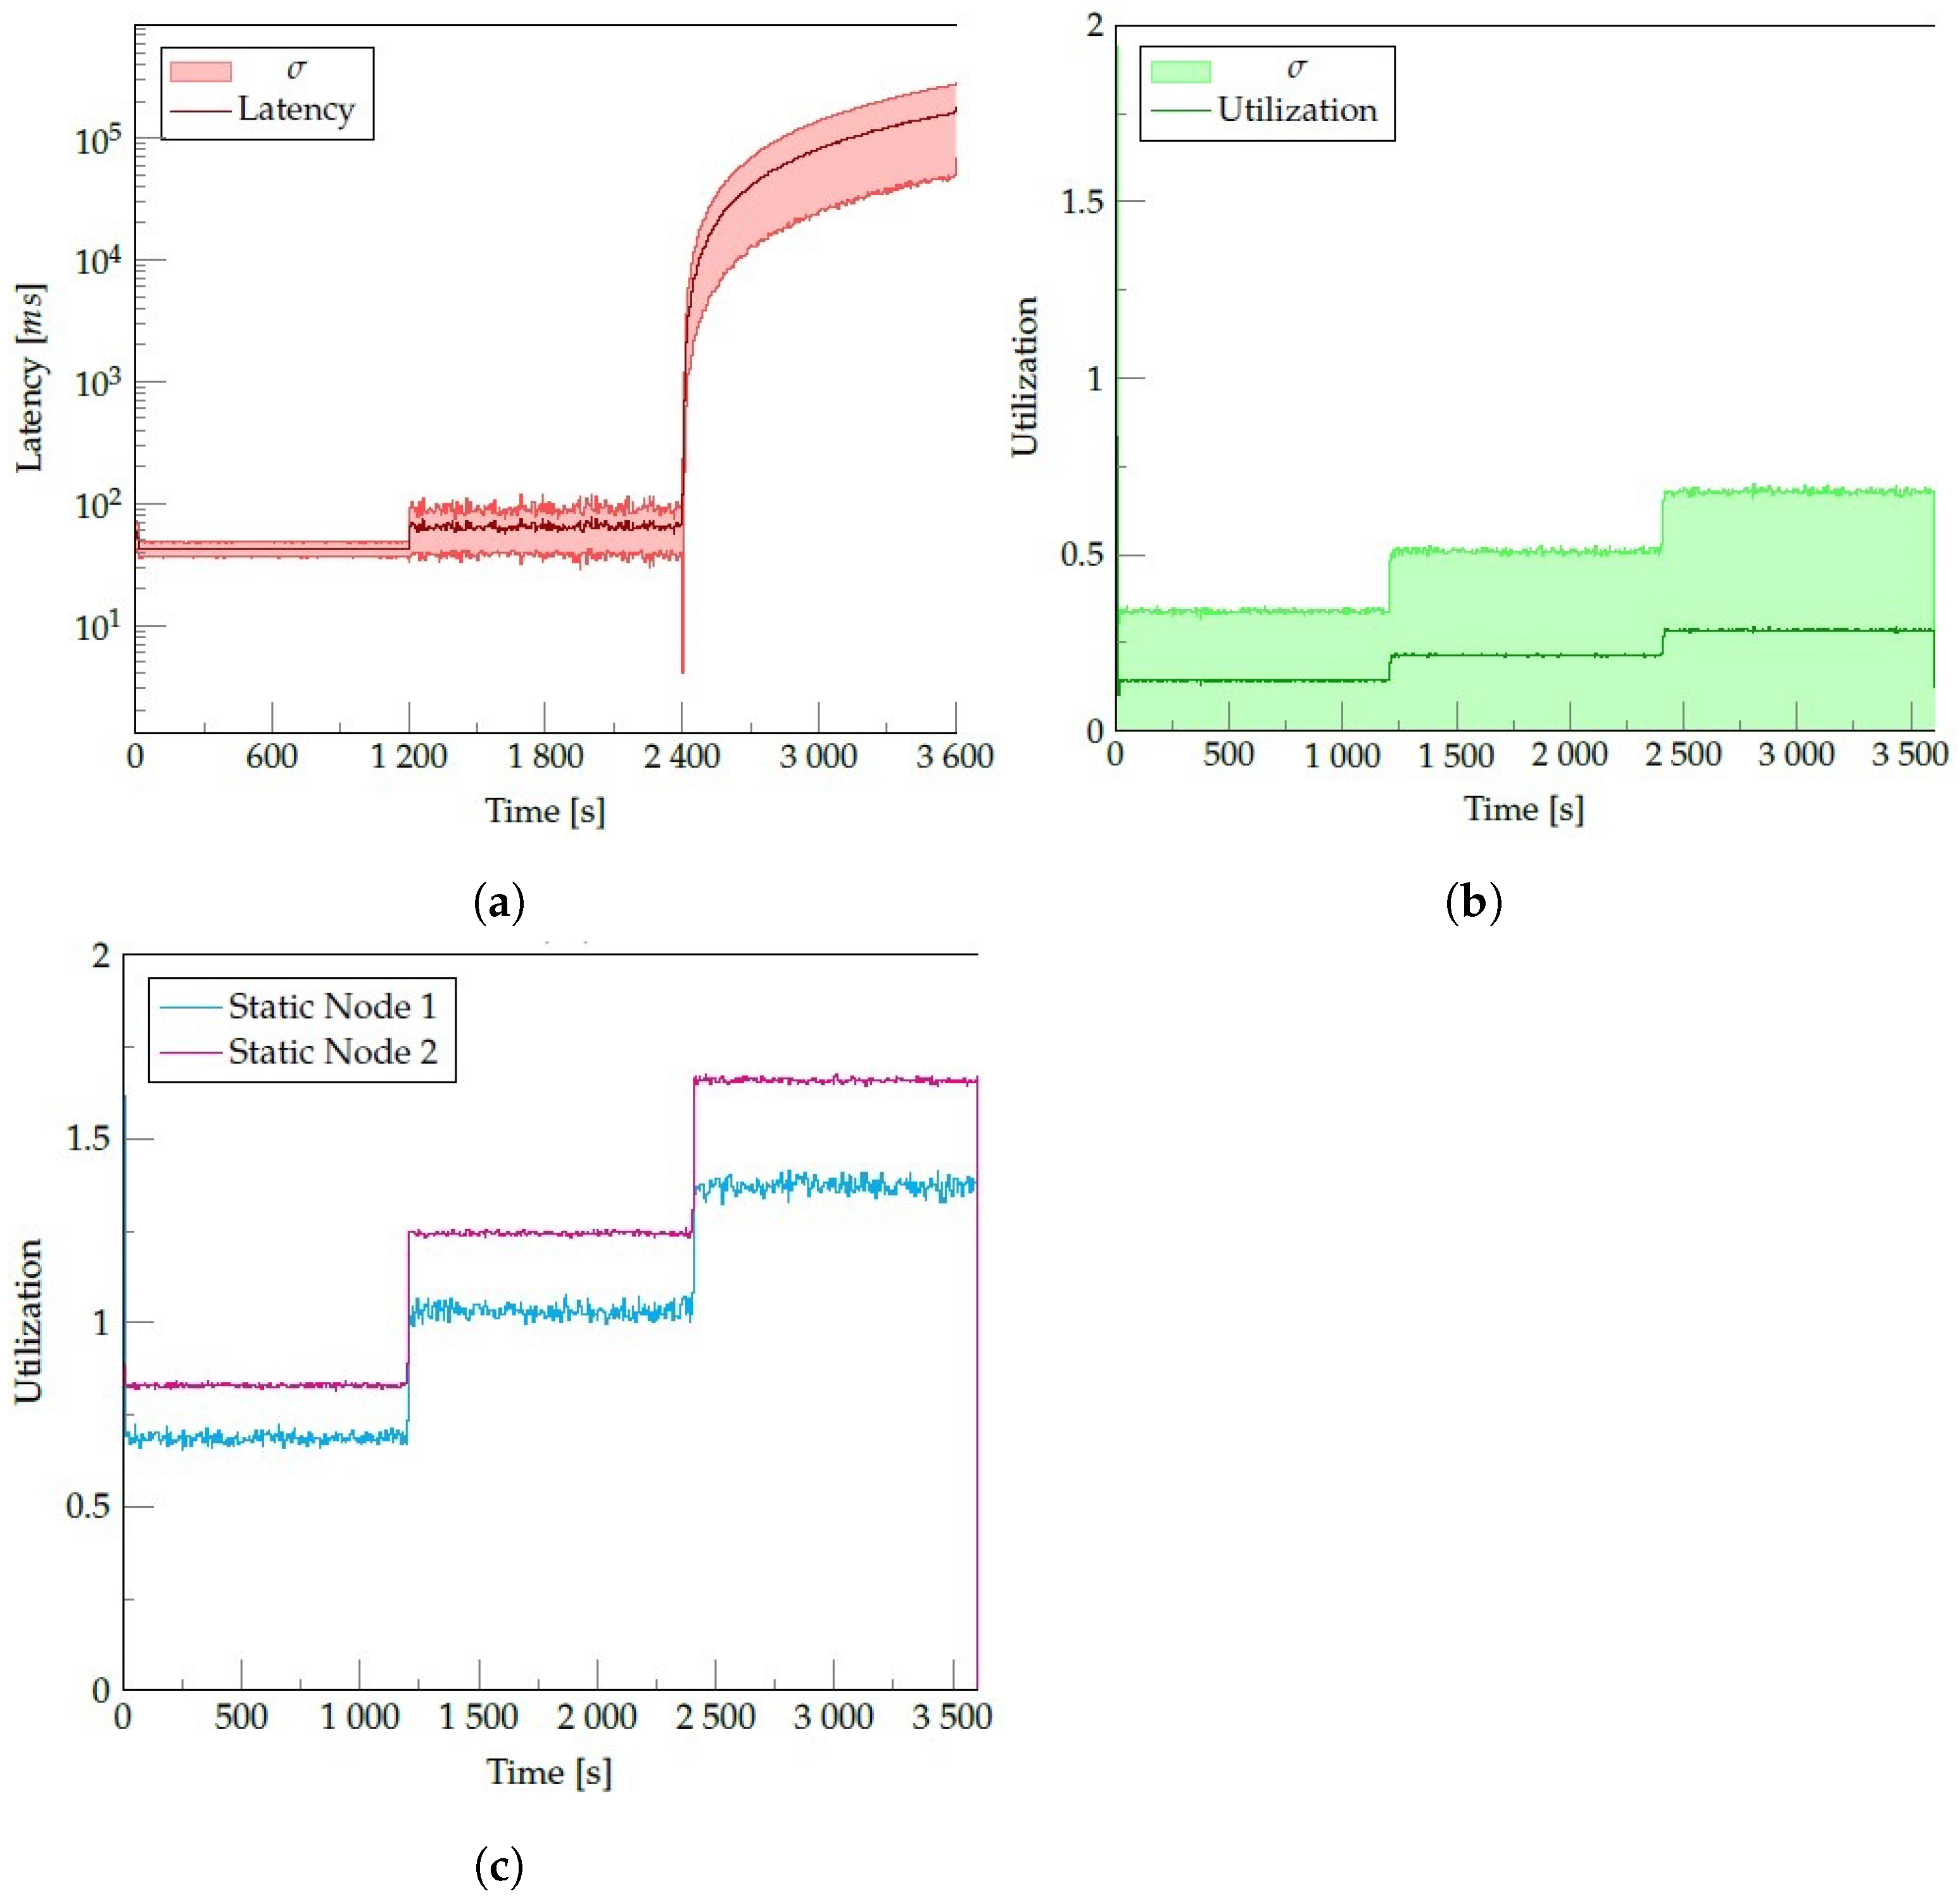
With these results in mind, we want to observe the capacity of the processing system to adapt to changes in the size of the flow of input events. We will analyze the behavior of the edge architecture with the SLedge system supported by ten nodes. The flow of events starts at 60 events per second, increasing up to 90 and 120 events per second. We will measure both the event latency and the general utilization of the mobile nodes and the static nodes.
Figure 10 shows the performance of the SLedge system in terms of both metrics: latency and utilization. From the figure, we can observe three different behaviors. Before the second 1200, the number of events remains fixed at 60 events per second; afterward, the flow increases to 90 events per second after the second 1200. Finally, after the second 2400, the event rate increases to 120 events per second. From Figure 10c, we notice that our system can adapt to the flow of 90 events per second, but for 120 events per second, latency suddenly increases exponentially since the static nodes in the edge server become overloaded. On the other hand, Figure 10b shows that the utilization of the mobile nodes in SLedge remains stable, increasing in a controlled manner. This result is the consequence of using a weight-based load balancing mechanism, taking into account the system’s dynamism.
For the SLedge system, it is important to avoid overloading mobile nodes since the incentives to participate in the system decrease if the energy spent on the devices is high. As the static nodes at the edge handle the number of events not processed by mobile nodes, they are the ones congested, and this is not transferred onto the mobile nodes. We believe this decision strongly impacts the proposed system’s usability.
Finally, we analyze the network overhead produced by the SLedge system due to the coordination messages between the nodes and the managers RM and OM. In SLedge we have four types of messages: checkpoint, overload, delete, and update messages. These messages represent the messages exchanged between the OM and the RM:
- CHECKPOINT: a checkpoint is performed.
- OVERLOAD: a node becomes overloaded.
- DELETE: to discard an active connection.
- UPDATE: to update the node.
To reflect changes in the number of available processing resources, we introduce a Gauss–Markov mobility model for simulating the mobile nodes’ movements. Mobility triggers the fault tolerance mechanism that enables the system to create a checkpoint when the state of the resources is at a critical level (i.e., signal and battery). The energy model used and its parametrization was described in Section 4.3.
Table 4 summarizes the number of messages sent of each type of message in this scenario. We collect 2,160,001 messages where 10.28% correspond to messages related to the system organization (22,226 messages). From the ten executions of the scenario, only an average of 0.1% of events were lost. SLedge system maintains a low overhead in the system to avoid draining excessive energy from the mobile devices; which is our main concern. This result can be further diminished by lengthening the duration of the RM’s and OM’s cycles.
There is a relation between the speed of change in the node’s behavior and the number of messages that need to be exchanged to avoid data loss. As discussed in Section 3.1, we propose to deploy this system over semi-static nodes to maintain a low overhead of messages related to checkpointing.
5. Conclusions
In this article, we have proposed SLedge an edge-based processing model that enables the use of external processing resources such as mobile devices to support stream processing systems under post-disaster scenarios. The model consists of a two-level control loop that automatically schedules SPS’s tasks over connected devices and balances the load they receive, considering mobile devices’ characteristics and preventing draining of the devices’ battery. We specifically tackle scheduling and load balance operators in an integration model with a pool of mobile devices to deploy small tasks as part of an SPS.
The ability to exploit external processing resources (e.g., mobile phones, tablets, etc.) to allocate processing tasks brings resilience to the processing systems by provisioning resources to keep the systems running. In particular, stream processing systems are prompt to data loss and compromise their output accuracy. The latter is crucial in disaster scenarios where accurate and timely information is vital for saving lives or reducing the disaster’s impact. Latency is critical in decision-making, SLedge provides a reduction of more than five times the event latency compared to a cloud architecture, as can be seen in Figure 8.
Disaster scenarios are highly dynamic scenarios where traffic can suddenly change. In this context, we demonstrate that SLedge can cope with such behavior by providing better load balancing than the cloud architecture. A better load balancing also enables the system to deal with traffic spikes. The latter is the main source of data loss in stream processing systems. Figure 9 and Figure 10 validate our claims. SLedge arrives to distribute the load better, not overloading its resources while keeping nodes’ utilization stable. Low utilization is a key feature for mobile processing resources in disaster scenarios since it can optimize battery energy. With Sledge, we can exploit external processing resources to analyze data in real-time to enrich government formal data sources and support decision-making. Mobile phone processing resources are frequently underused and SLedge exploits these resources to support processing activities and improve the system resilience and performance under critical scenarios.
Author Contributions
Conceptualization, N.H. and E.R.; Formal analysis, E.R.; Funding acquisition, N.H. and E.R.; Investigation, N.H., E.R. and T.S.; Methodology, E.R. and T.S.; Validation, T.S. and J.M.; Writing—original draft, N.H., E.R. and T.S. All authors have read and agreed to the published version of the manuscript.
Funding
This research was funded by Agencia Nacional de Investigación y Desarrollo (ANID) grant number 11190314 and 11181028.
Institutional Review Board Statement
Not applicable.
Informed Consent Statement
Not applicable.
Acknowledgments
Nicolás Hidalgo wants to thank the project FONDECYT Iniciación No. 11190314, ANID, Chile. Erika Rosas wants to thank the project FONDECYT Iniciación No. 11181028, ANID, Chile.
Conflicts of Interest
The authors declare no conflict of interest.
References
- Aitsi-Selmi, A.; Egawa, S.; Sasaki, H.; Wannous, C.; Murray, V. The Sendai Framework for Disaster Risk Reduction: Renewing the Global Commitment to People’s Resilience, Health, and Well-being. Int. J. Disaster Risk Sci. 2015, 6, 164–176. [Google Scholar] [CrossRef] [Green Version]
- Storm Concepts. 2020. Available online: https://storm.incubator.apache.org/documentation/Concepts.html (accessed on 12 March 2022).
- Association, G. The Mobile Economy 2020, Tech Report. 2020. Available online: https://www.gsma.com/mobileeconomy/ (accessed on 12 March 2022).
- Comito, C.; Falcone, D.; Talia, D.; Trunfio, P. Energy-aware task allocation for small devices in wireless networks. Concurr. Comput. 2017, 29, e3831. [Google Scholar] [CrossRef]
- Ning, Q.; Chen, C.; Stoleru, R.; Chen, C. Mobile storm: Distributed real-time stream processing for mobile clouds. In Proceedings of the 2015 IEEE 4th International Conference on Cloud Networking (CloudNet), Niagara Falls, ON, Canada, 5–7 October 2015; pp. 139–145. [Google Scholar]
- Wang, H.; Peh, L.S. MobiStreams: A Reliable Distributed Stream Processing System for Mobile Devices. In Proceedings of the 2014 IEEE 28th International Parallel and Distributed Processing Symposium, Phoenix, AZ, USA, 19–23 May 2014; pp. 51–60. [Google Scholar]
- Mendoza, M.; Poblete, B.; Castillo, C. Twitter under crisis: Can we trust what we RT? In Proceedings of the first workshop on social media analytics, Washington, DC, USA, 25 July 2010; pp. 71–79. [Google Scholar]
- Domdouzis, K.; Akhgar, B.; Andrews, S.; Gibson, H.; Hirsch, L. A social media and crowdsourcing data mining system for crime prevention during and post-crisis situations. J. Syst. Inf. Technol. 2016, 18, 364–382. [Google Scholar] [CrossRef]
- Park, Y.E. Developing a COVID-19 crisis management strategy using news media and social media in big data analytics. Soc. Sci. Comput. Rev. 2021, 21, 08944393211007314. [Google Scholar] [CrossRef]
- Al-Omoush, K.S.; Zardini, A.; Al-Qirem, R.M.; Ribeiro-Navarrete, S. Big crisis data, contradictions and perceived value of social media crowdsourcing in pandemics. Econ. Res. Ekon. Istraž. 2021, 34, 450–468. [Google Scholar] [CrossRef]
- Castillo, C. Big Crisis Data: Social Media in Disasters and Time-Critical Situations; Cambridge University Press: Cambridge, UK, 2016. [Google Scholar]
- Hunt, P.; Konar, M.; Junqueira, F.P.; Reed, B. ZooKeeper: Wait-Free Coordination for Internet-Scale Systems. In USENIX ATC; USENIX Association: Berkeley, CA, USA, 2010; pp. 1–11. [Google Scholar]
- Rychlý, M.; Skoda, P.; Smrz, P. Heterogeneity-aware scheduler for stream processing frameworks. Int. J. Big Data Intell. 2015, 2, 70–80. [Google Scholar] [CrossRef]
- Cardellini, V.; Grassi, V.; Presti, F.L.; Nardelli, M. On QoS-aware scheduling of data stream applications over fog computing infrastructures. In Proceedings of the 2015 IEEE Symposium on Computers and Communication (ISCC), Larnaca, Cyprus, 6–9 July 2015; pp. 271–276. [Google Scholar]
- Talebkhah, M.; Sali, A.; Marjani, M.; Gordan, M.; Hashim, S.J.; Rokhani, F.Z. Edge computing: Architecture, Applications and Future Perspectives. In Proceedings of the 2020 IEEE 2nd International Conference on Artificial Intelligence in Engineering and Technology (IICAIET), Kota Kinabalu, Malaysia, 26–27 September 2020; pp. 1–6. [Google Scholar] [CrossRef]
- Hamdan, S.; Ayyash, M.; Almajali, S. Edge-Computing Architectures for Internet of Things Applications: A Survey. Sensors 2020, 20, 6441. [Google Scholar] [CrossRef] [PubMed]
- Bonomi, F.; Milito, R.A.; Natarajan, P.; Zhu, J. Fog Computing: A Platform for Internet of Things and Analytics. In Big Data and Internet of Things: A Roadmap for Smart Environments; Springer: Berlin/Heidelberg, Germany, 2014; Volume 546, pp. 169–186. [Google Scholar]
- Salem, A.; Salonidis, T.; Desai, N.; Nadeem, T. Kinaara: Distributed Discovery and Allocation of Mobile Edge Resources. In Proceedings of the 2017 IEEE 14th International Conference on Mobile Ad Hoc and Sensor Systems (MASS), Orlando, FL, USA, 22–25 October 2017; pp. 153–161. [Google Scholar] [CrossRef]
- Goldstein, O.; Shah, A.; Shiell, D.; Rad, M.A.; Pressly, W.; Sarrafzadeh, M. Edge Architecture for Dynamic Data Stream Analysis and Manipulation. In Edge Computing—EDGE 2020; Katangur, A., Lin, S.C., Wei, J., Yang, S., Zhang, L.J., Eds.; Springer International Publishing: Cham, Switzerland, 2020; pp. 33–49. [Google Scholar]
- Chao, M.; Stoleru, R. R-MStorm: A Resilient Mobile Stream Processing System for Dynamic Edge Networks. In Proceedings of the 2020 IEEE International Conference on Fog Computing (ICFC), Sydney, Australia, 21–24 April 2020; pp. 64–72. [Google Scholar] [CrossRef]
- Marah, B.D.; Jing, Z.; Ma, T.; Alsabri, R.; Anaadumba, R.; Al-Dhelaan, A.; Al-Dhelaan, M. Smartphone Architecture for Edge-Centric IoT Analytics. Sensors 2020, 20, 892. [Google Scholar] [CrossRef] [PubMed] [Green Version]
- Busching, F.; Schildt, S.; Wolf, L. DroidCluster: Towards Smartphone Cluster Computing—The Streets Are Paved with Potential Computer Clusters. In Proceedings of the 2012 32nd International Conference on Distributed Computing Systems Workshops, Macau, China, 18–21 June 2012; pp. 114–117. [Google Scholar]
- Szpakowski, M. Native Port of the Boinc Client for Android Devices. 2013. Available online: http://nativeboinc.org/site/uncat/start (accessed on 12 March 2022).
- Liu, C.; Cao, Y.; Luo, Y.; Chen, G.; Vokkarane, V.; Yunsheng, M.; Chen, S.; Hou, P. A new deep learning-based food recognition system for dietary assessment on an edge computing service infrastructure. IEEE Trans. Serv. Comput. 2017, 11, 249–261. [Google Scholar] [CrossRef]
- Morales, J.; Rosas, E.; Hidalgo, N. Symbiosis: Sharing mobile resources for stream processing. In Proceedings of the 2014 IEEE Symposium on Computers and Communications (ISCC), Madeira, Portugal, 23–26 June 2014; pp. 1–6. [Google Scholar]
- Hiessl, T.; Karagiannis, V.; Hochreiner, C.; Schulte, S.; Nardelli, M. Optimal placement of stream processing operators in the fog. In Proceedings of the 2019 IEEE 3rd International Conference on Fog and Edge Computing (ICFEC), Larnaca, Cyprus, 14–17 May 2019; pp. 1–10. [Google Scholar]
- Weyns, D.; Schmerl, B.; Grassi, V.; Malek, S.; Mirandola, R.; Prehofer, C.E.A. On Patterns for Decentralized Control in Self-Adaptive Systems. In Software Engineering for Self-Adaptive Systems II; Springer: Berlin/Heidelberg, Germany, 2013; pp. 76–107. [Google Scholar]
- Cardellini, V.; Grbac, T.G.; Nardelli, M.; Tanković, N.; Truong, H.L. QoS-Based elasticity for service chains in distributed edge cloud environments. In Autonomous Control for a Reliable Internet of Services; Springer: Cham, Switzerland, 2018; pp. 182–211. [Google Scholar]
- Cardellini, V.; Lo Presti, F.; Nardelli, M.; Russo Russo, G. Optimal operator deployment and replication for elastic distributed data stream processing. Concurr. Comput. Pract. Exp. 2018, 30, e4334. [Google Scholar] [CrossRef]
- Soo, S. Object detection using Haar-cascade Classifier. Inst. Comput. Sci. Univ. Tartu 2014, 2, 1–12. [Google Scholar]
- Zhao, X.; Wei, C. A real-time face recognition system based on the improved LBPH algorithm. In Proceedings of the 2017 IEEE 2nd International Conference on Signal and Image Processing (ICSIP), Singapore, 4–6 August 2017; pp. 72–76. [Google Scholar]
- Ahmadpour, S.; Wan, T.C.; Toghrayee, Z.; HematiGazafi, F. Statistical analysis of video frame size distribution originating from scalable video codec (SVC). Complexity 2017, 2017, 8098574. [Google Scholar] [CrossRef]
- Hidalgo, N.; Wladdimiro, D.; Rosas, E. Self-adaptive processing graph with operator fission for elastic stream processing. J. Stat. Softw. 2017, 127, 205–216. [Google Scholar] [CrossRef]
Figure 1.
Hierarchical integration model with MAPE control loops.

Figure 2.
Integration of the model’s components with Storm.

Figure 3.
Example of mapping mobile resources.

Figure 4.
Example of the weighted round—robin scheduling algorithm.

Figure 5.
Example scenario of a mobile node failure and fail over process in SLedge.

Figure 6.
Architectures for experimentation: (a) Cloud Architecture and (b) SLedge Edge Architecture.
Figure 6.
Architectures for experimentation: (a) Cloud Architecture and (b) SLedge Edge Architecture.

Figure 7.
Storm application topology used in benchmarks.

Figure 8.
Event’s latency over time. Participant mobile nodes number was varied at constant time intervals.
Figure 8.
Event’s latency over time. Participant mobile nodes number was varied at constant time intervals.

Figure 9.
Cloud and Edge architecture statics nodes utilization over time. (a) Cloud Architecture. (b) SLedge Edge Architecture.
Figure 9.
Cloud and Edge architecture statics nodes utilization over time. (a) Cloud Architecture. (b) SLedge Edge Architecture.

Figure 10.
Static nodes utilization over time under traffic spikes for Edge architecture. (a) Event Latency. (b) Mobile node utilization. (c) Static node utilization.
Figure 10.
Static nodes utilization over time under traffic spikes for Edge architecture. (a) Event Latency. (b) Mobile node utilization. (c) Static node utilization.


Table 1.
Processing resources characteristics used in benchmarks.
| Cloud Server | Edge Server | Mobile Device | |
|---|---|---|---|
| Processor | 2× Intel Xeon Silver 4116 | AMD Ryzen 7 3700× | Exynos 9820 |
| Total Cores | 2 × 24 | 8 | 8 |
| Frequency | 48 × 2.1 GHz | 8 × 3.6 GHz | 2 × 2.73 GHz 2 × 2.31 GHz 4 × 1.95 GHz |
| RAM | 128 GB | 16 GB | 8 GB |
| Model | - | - | Samsung Galaxy S10 |
Table 2.
Latency benchmark results.
| Face Detection Bolt | Face Recognition Bolt | Number of Workers | |
|---|---|---|---|
| Cloud Server | 25.871 ms | 47.462 ms | 12 |
| Edge Server | 15.272 ms | 29.171 ms | 6 |
| Mobile Device | 10.220 ms | 23.365 ms | 1 |
Table 3.
Latency ranges for simulation.
| Face Detection Bolt | Face Recognition Bolt | |
|---|---|---|
| Cloud Server | 25.5–26.5 ms | 47.5–48.5 ms |
| Edge Server | 14.5–15.5 ms | 29.5–30.5 ms |
| Mobile Device | 9.5–10.5 ms | 22.5–23.5 ms |
Table 4.
The number of messages measured on processing events with mobile nodes following a Gauss–Markov mobility model.
Table 4.
The number of messages measured on processing events with mobile nodes following a Gauss–Markov mobility model.
| No of Message | ||
|---|---|---|
| CHECKPOINT | 3220.80 | 920.64 |
| OVERLOAD | 8359.50 | 828.25 |
| DELETE | 2016.00 | 531.87 |
| UPDATE | 8631.00 | 670.79 |
Publisher’s Note: MDPI stays neutral with regard to jurisdictional claims in published maps and institutional affiliations. |
© 2022 by the authors. Licensee MDPI, Basel, Switzerland. This article is an open access article distributed under the terms and conditions of the Creative Commons Attribution (CC BY) license (https://creativecommons.org/licenses/by/4.0/).
Share and Cite
MDPI and ACS Style
Hidalgo, N.; Rosas, E.; Saavedra, T.; Morales, J. SLedge: Scheduling and Load Balancing for a Stream Processing EDGE Architecture. Appl. Sci. 2022, 12, 6474. https://doi.org/10.3390/app12136474
AMA Style
Hidalgo N, Rosas E, Saavedra T, Morales J. SLedge: Scheduling and Load Balancing for a Stream Processing EDGE Architecture. Applied Sciences. 2022; 12(13):6474. https://doi.org/10.3390/app12136474
Chicago/Turabian StyleHidalgo, Nicolas, Erika Rosas, Teodoro Saavedra, and Jefferson Morales. 2022. "SLedge: Scheduling and Load Balancing for a Stream Processing EDGE Architecture" Applied Sciences 12, no. 13: 6474. https://doi.org/10.3390/app12136474
Note that from the first issue of 2016, this journal uses article numbers instead of page numbers. See further details here.