
Landslide Susceptibility Assessment by Using Convolutional Neural Network


1
Department of Geology, University of Yazd, Yazd 8915818411, Iran
2
Department of Civil Engineering, University of Tabriz, Tabriz 5166616471, Iran
3
Department of Geological Engineering, Middle East Technical University (METU), 06800 Ankara, Turkey
4
Department of Geology, Shahid Bahonar University of Kerman, Kerman 7616913439, Iran
5
Department of Earth Sciences, Utrecht University, 3584CB Utrecht, The Netherlands
*
Author to whom correspondence should be addressed.
Appl. Sci. 2022, 12(12), 5992; https://doi.org/10.3390/app12125992
Submission received: 24 April 2022
/
Revised: 2 June 2022
/
Accepted: 8 June 2022
/
Published: 13 June 2022
(This article belongs to the Special Issue Geotechnical Engineering Hazards)
Abstract
:This study performs a GIS-based landslide susceptibility assessment using a convolutional neural network, CNN, in a study area of the Gorzineh-khil region, northeastern Iran. For this assessment, a 15-layered CNN was programmed in the Python high-level language for susceptibility mapping. In this regard, as far as the landside triggering factors are concerned, it was concluded that the geomorphologic/topographic parameters (i.e., slope curvature, topographical elevation, slope aspect, and weathering) and water condition parameters (hydrological gradient, drainage pattern, and flow gradient) are the main triggering factors. These factors provided the landside dataset, which was input to the CNN. We used 80% of the dataset for training and the remaining 20% for testing to prepare the landslide susceptibility map of the study area. In order to cross-validate the resulting map, a loss function, and common classifiers were considered: support vector machines, SVM, k-nearest neighbor, k-NN, and decision tree, DT. An evaluation of the results of the susceptibility assessment revealed that the CNN led the other classes in terms of 79.0% accuracy, 73.0% precision, 75.0% recall, and 77.0% f1-score, and, hence, provided better accuracy and the least computational error when compared to the other models.
1. Introduction
In recent years, population growth and the expansion of settlements and lifelines have largely increased the impact of geo-hazards both in industrialized and developing countries. In many countries, the economic losses and causalities due to geo-hazards such as earthquakes, landslides, floods, avalanches, hurricanes, tsunamis, and windstorms are being reported continuously [1,2]. Meanwhile, landslides are considered the second most significant geo-hazard associated with catastrophic events, loss of lives, and property damage [3]. Thus, geological engineers develop and apply empirically-based assessment methods for understanding features, recognizing triggering elements, failure mechanisms, monitoring, and stabilization, which are termed susceptibility assessments [4,5]. Landslide susceptibility is defined as the proneness of the terrain to produce slope failures, usually expressed in a cartographic way [6,7]. A landslide susceptibility map depicts areas likely to have landslides in the future by correlating some of the principal factors that contribute to landslides with the past distribution of slope failures. Because many factors can play a role in the occurrence of mass movements, susceptibility analysis is complicated and requires not only a large number of input variables but techniques of analysis that may be very costly and time-consuming [8]. Consequently, attention was given to seeking and developing methods and techniques to enable the faster and more efficient acquisition and processing of the geological/geomorphological data, which are both relevant in assessing landslide susceptibility that is mappable at an effective cost over wide regions [9,10,11,12]. To this end, successful approaches that have been applied to susceptibility assessments can be formulated as deterministic methods (these methods are built on mathematical calculations, computational modelling, physical and geomechanical identification, mechanism recognition, slope failure stability and stabilisation), statistical methods (these methods are effective in accuracy and cover compiling, mapping, and digitising ground data by using statistical distributions, like bivariate, multivariate, and data-driven statistical applications), heuristic methods (these methods are based on comparing and qualitative estimation of actual landslide information with geomorphology and geological characteristics), inventory methods (these methods are based on a combination of landslide triggering factors, such as key functional procedure of quantitative predictions which are determined by stochastic, statistical, or probabilistic methods), geostatistical methods (these methods are used in natural phenomena modelling, missing values evaluation, gap covering, and reduced errors in statistical limitation and data filtrations), and knowledge-based analysis (these methods use computer modelling of a learning process for extracting patterns, and datasets) [13,14,15,16,17,18,19,20]. Although each of the methods described above has advantages and disadvantages [21,22], several methods, such as knowledge-based analysis by using computational intelligence for analyses, have always been much more suitable for susceptibility assessments and have marked milestones to accurately predict the slip potential [23].
The application of knowledge-based analysis to susceptibility assessment is growing significantly and more scholars have used artificial intelligence techniques, such as fuzzy logic, adaptive network-based fuzzy inference system (ANFIS), support vector machines (SVM), k-nearest neighbors (k-NN), decision tree (DT), and random forest (RF), logistic regression, multilayer perceptron (MLP), etc. [24,25,26,27,28]. Although the use of knowledge-based analysis in susceptibility assessment has expanded drastically, deep-learning methods, such as convolutional neural networks (CNN), have received less attention. Using machine learning to residual uncertainty within landslide susceptibility assessments has led to the development of more complex approaches to attain acceptable levels of accuracy. The largest sources of uncertainty in susceptibility modeling are related to the inventory database. Geological complexity, geomorphological deformations, and land-use and landscape changes are the main causes of the uncertainties. In this regard, the development of more accurate models is important. Recently, machine-learning techniques have been applied to landslide susceptibility mapping to increase mapping accuracy, which provides the learning rate from the inventory database and reduces errors. These errors were estimated based on loss functions and error tables (e.g., MSE, MAPE, and RMSE) [29,30,31].
This study has attempted to use CNN for susceptibility zonation of the Gorzineh-khil region. The innovation point in this research is the application of a deep learning-based method to CNN models in order to provide a landslide susceptibility assessment for the study region. The application of CNN, which has received significant success in landslide susceptibility, is one of the most recent geo-hazard evolution methods in deep learning. CNN is capable to apply on satellite images to extract features, classify the prone area for sliding and predict the hazard risk potential. In this regard, a 15-layered CNN model was performed to detect and classify the sliding features based on the triggering factors. As a justification, the proposed model was justified through a comparison of the common machine-learning classifiers such as SVM, k-NN, and DT algorithms based on performance indices.
2. Study Area
2.1. Geological Setting
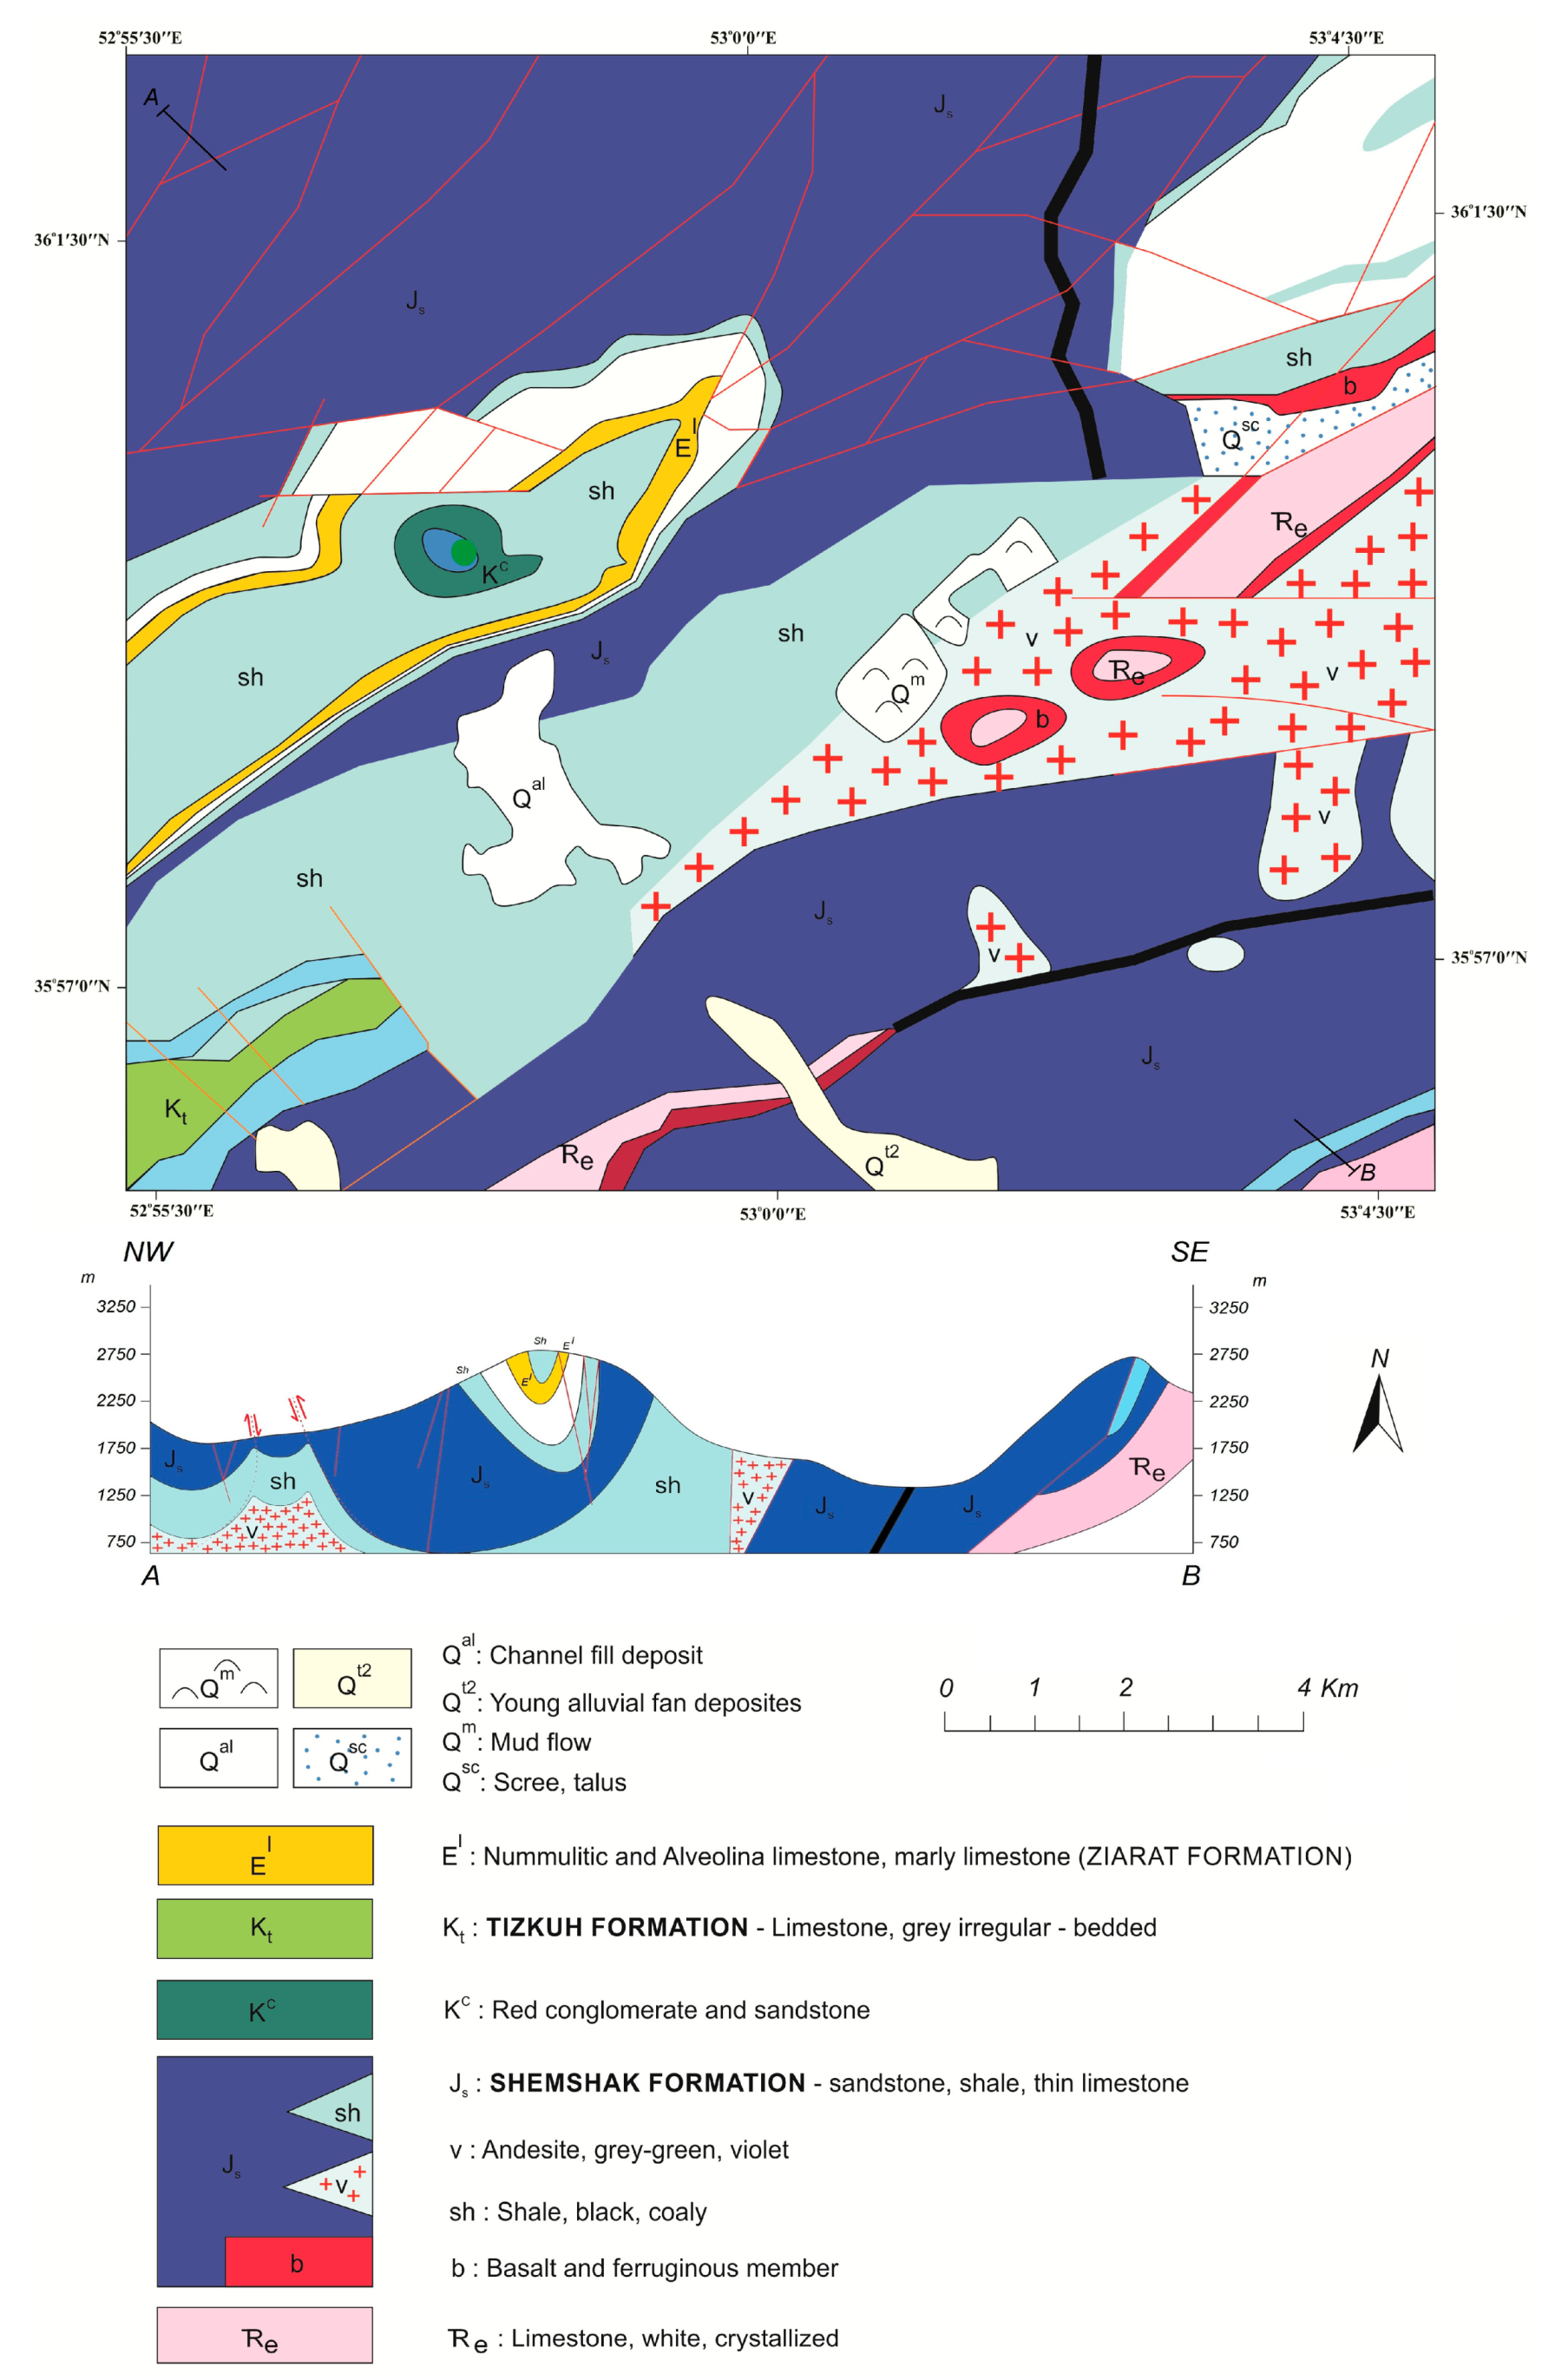
The Gorzineh-khil region is located in the Savadkooh county, southern Mazandaran province, with center coordinates of 35°57′55″ N, 52°27′30″ E. Climatologically, the area has a mild and humid climate with cold winters. The average annual total precipitation in the area is measured to be about 600 mm, where the rainiest month is October (203.8 mm) and the driest month is August (39.5 mm). The average temperature is 14 °C where the hottest month is August (28.8 °C) and the coolest month is February (6.5 °C). In addition, the evaporation rate of the area is measured to be about 600–750 mm. The study area is located in the category of a warm and humid climate, which is effective on vegetation and increases weathering in mountainous areas [32]. The topographical elevation values of the Gorzineh-khil region are between 296 m and 3724 m (A.S.L.), which includes slope angle variations from 0° to 89° (with a general range between 60° and 80°). The site is covered with forests (40%), pastures/farms (25%), meadows/boglands (18%), residential areas (12%), and wastelands (5%). Figure 1 presents the location of the project site which covers an area of approximately 145 km2. In terms of geological setting, the oldest geological units of the study area are the Shemshak formation (Jurassic shale, sandstone, siltstone, claystone, marl, coal-bearing, calcareous sandstone, sandy shale, limestone, and conglomerate) and its outskirts are formed by the Lar formation (Jurassic ammonite limestone, dolomitic limestone, limestone, calcareous shale, and dolomite). The Tizkuh (Cretaceous orbitolinalimestone) and Ziarat (Eocene tuff, tuffaceous sandstone, shale, and minor nummulitic limestone) formations and quaternary alluvium deposits are considered as the subset of the central Alborz zone [33,34]. Figure 2 depicts the study area’s geological map. The central Alborz zone, or the middle Alborz Mountain range, insulates the south Caspian Sea from the Iranian plateau by its E–W strike in the north of Iran. In terms of geo-structures and tectonics, this region is a part of the continental-continental collision of the central Iranian plate with the Eurasian plate. Recent seismotectonic studies indicate that the region is active [35,36].
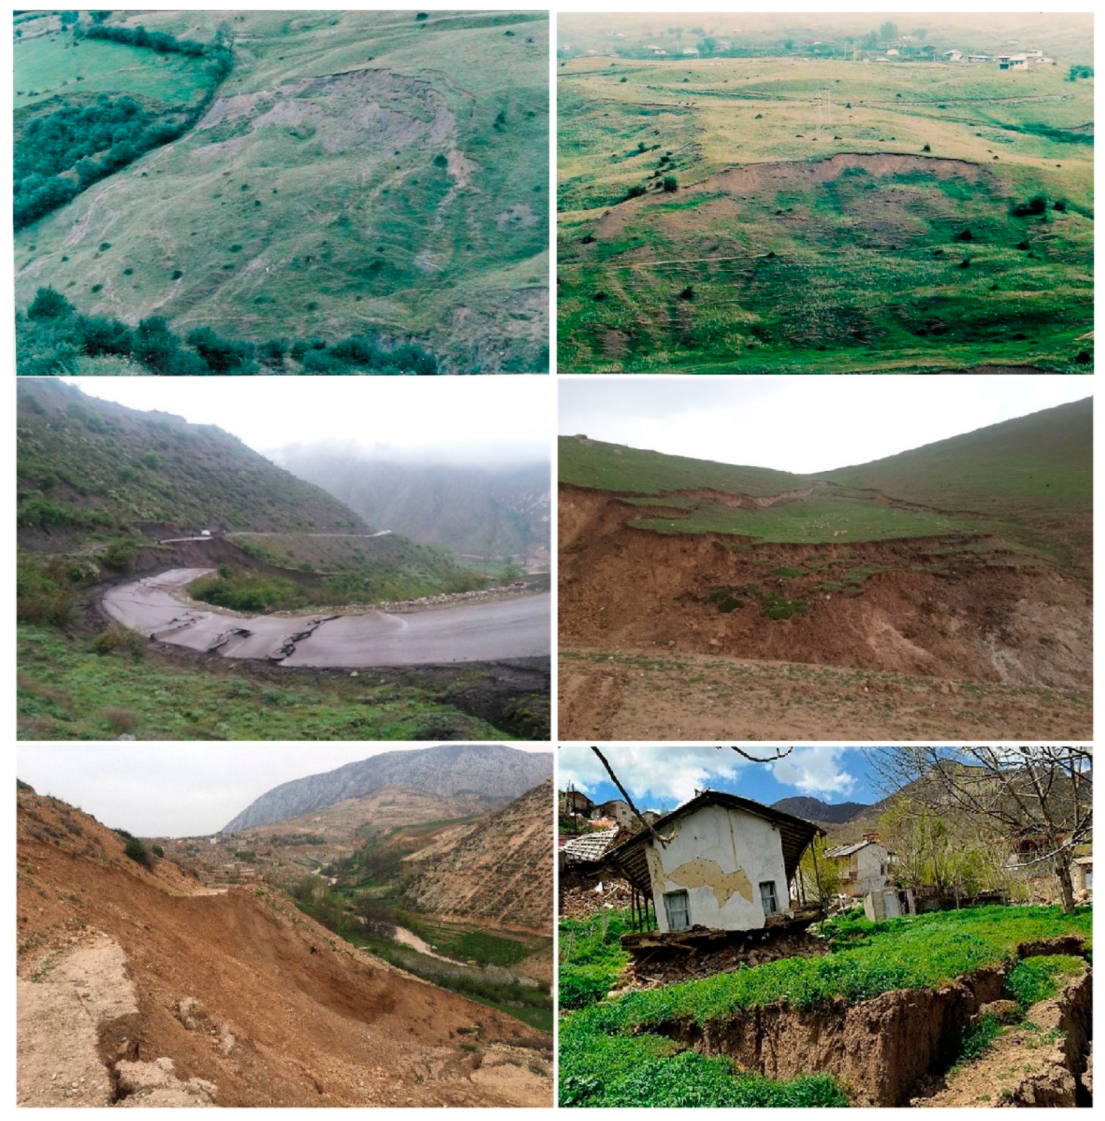
Multiple historical ground movements, creeps, and local landslides in the studied area indicate the region’s potential landslide activity. In some parts of the Gorzineh-khilregion, especially towards the middle section, several local landslides have been observed, amongst which the landslide involving the Gorzineh-khil village itself is significantly dangerous. During the field survey in the studied area, at least 30 local landslides were detected, which are mostly classified as shallow sliding. Figure 3 provides views of typical landslide cases, including the trace of the main sliding of the Gorzineh-khil village in the study area. As seen in this figure, most of the local sliding has occurred in the soil mass in the study region. The field survey that conducted in studied region has provides information about historical landslides which is used in assessment. In addition, the exposed rock surfaces on the slopes in the study region indicate the depth of weathering in the Gorzineh-khil region. With respect to these historical landslides, it can be stated that the region has a high potential for slides of different scales. As depicted in Figure 1, the studied area is situated in the Central Alborz Mountains in northern Iran, which is a suitable area for mass slipping. In addition, the climate is conducive to triggering the movements. Figure 3 illustrates several historical landslides that have occurred in the region. This evidence indicates that the region requires a landslide susceptibility and zonation assessment. Referring to Figure 3, it can be stated that the predominant type of the landslides that occurred in the region under study was shallow sliding in soil/sediment mass. The detection of these landslides is based on ground deformations and mass sliding downstream, which cause damage to roads and structures. During the field survey, landslides were noted based on tensile cracks, small-scale slips, and uplifts.
2.2. Landslide Influencing Factors
A successful landslide susceptibility analysis requires the collection of comprehensive information on land-sliding. In the meantime, the differentiation of the identified triggering factors can be a very important step. Highland and Bobrowsky [37] have classified the landslide triggering factors into topographic, geological, climatological, seismological, and human activity-related classes, which all depend on the environmental conditions. Landslide triggering factors are the effective factors that influence landslide movements but may/may not be the cause of sliding. The triggering factors selection is considered an important step in providing the inventory database or primary dataset that is used in landslide susceptibility assessment. In this regard, comprehensive field surveys and remote sensing observations are required, which lead to providing detailed information about the land-sliding in the region. Selection of the triggering factors required several considerations related to the dependency of triggering elements, measurability, non-redundancy, and relevance of geological characteristics. The main factors influencing landslide occurrence were identified by preparing a spatial landslide inventory database that included the spatiotemporal distribution of historical landslides and a set of potential influencing factors. Based on a field study and reviews of the Ministry of Agriculture Jihad-Mazandaran Branch (MAJ) and Forests, Range, and Watershed Management Organization (FRWMO) reports in the studied region, major recorded landslide events which are related to geomorphological/topographical changes exist in the region. The other factors, such as geological, climatological, seismological, and human-related activities, have indirect effects with respect to this main factor. During the field survey, it appeared that the reported geomorphologic, topographic, and water conditions as triggering factors concluded slope curvature, topographical elevation, slope aspect, weathering, hydrological gradient, drainage pattern, and flow gradient play considerable roles in landslide occurrence. On the other hand, the presence of thick sediment layers (soil) in the region has obscured the main geological structures in the rural areas where landslides have mostly occurred as shallow massive (circular) movements. As a result, these two main groups of factors are identified as the most effective covariates that triggered landslides in the studied region. In addition, the most important human structures created in the region include villages (residential areas) and transportation roads, which, as may be observed in Figure 3, can directly be affected by changes in morphology. Thus, the topographic factor has been taken into account as the main triggering factor, and the others have been considered as triggering factors. This factor alone could not be enough to lead to landslide occurrence, but it is strongly believed to have had a significant effect on land movements in Gorzineh-khil. Topography also influences other parameters such as vegetation, wind, sunlight, and freezing, which are directly related to weathering. For this reason, this study has attempted to evaluate this stimulus as one of the basic triggering factors for the landslides in the studied area. It is necessary to state that, although geological, climatological, seismological, and human-related activities must be considered in comprehensive studies, application of the main triggering factors for the detection of the hazard potential of the region by using such machine-learning techniques could provide reliable results for landslide susceptibility assessment. For this purpose, with the aid of the geomorphological and altitudinal changes, the related data extracted from Landsat satellite images (TM8) and DEM data to provide the main dataset followed by rastering of the water conditions (i.e., hydrological gradient, drainage pattern, and flow gradient) as the second group of the triggering factors, has led to the improvement of the dataset.
Landsat TM8 is the most recently launched Landsat satellite and carries the operational land imager (OLI) and the thermal infrared sensor (TIRS) instruments to provide more accurate data in regards to high spatial and spectral resolution (15 m × 15 m) and proper scene size images (185 km × 180 km) on earth. Landsat acquires about 740 scenes a day on the worldwide reference system-2 (WRS-2) path/row system, with a swath overlap varying from 7% at the equator to a maximum of approximately 85% at extreme latitudes [38]. The DEM data represents the digital elevation data of the earth’s surface, which is used for landscape modeling, city modeling, and visualization applications, where a digital terrain model (DTM) is often required for flood or drainage modeling along with land-use studies [39]. In fact, the DEM model is a raster in a GIS environment where each cell has a Z value or height (m). DEM data is therefore a file containing the height in a particular area and a regular grid on the bare surface of the earth. Smaller cells represent greater detail in determining the elevation of the surface. There are many sources for generating a DEM, and one of these sources is satellite imagery. The DEMs extracted from these images have different resolutions depending on the type of image. The DEM data used in this study as a dataset has been provided by the USGS at 12.5 m resolution [40].
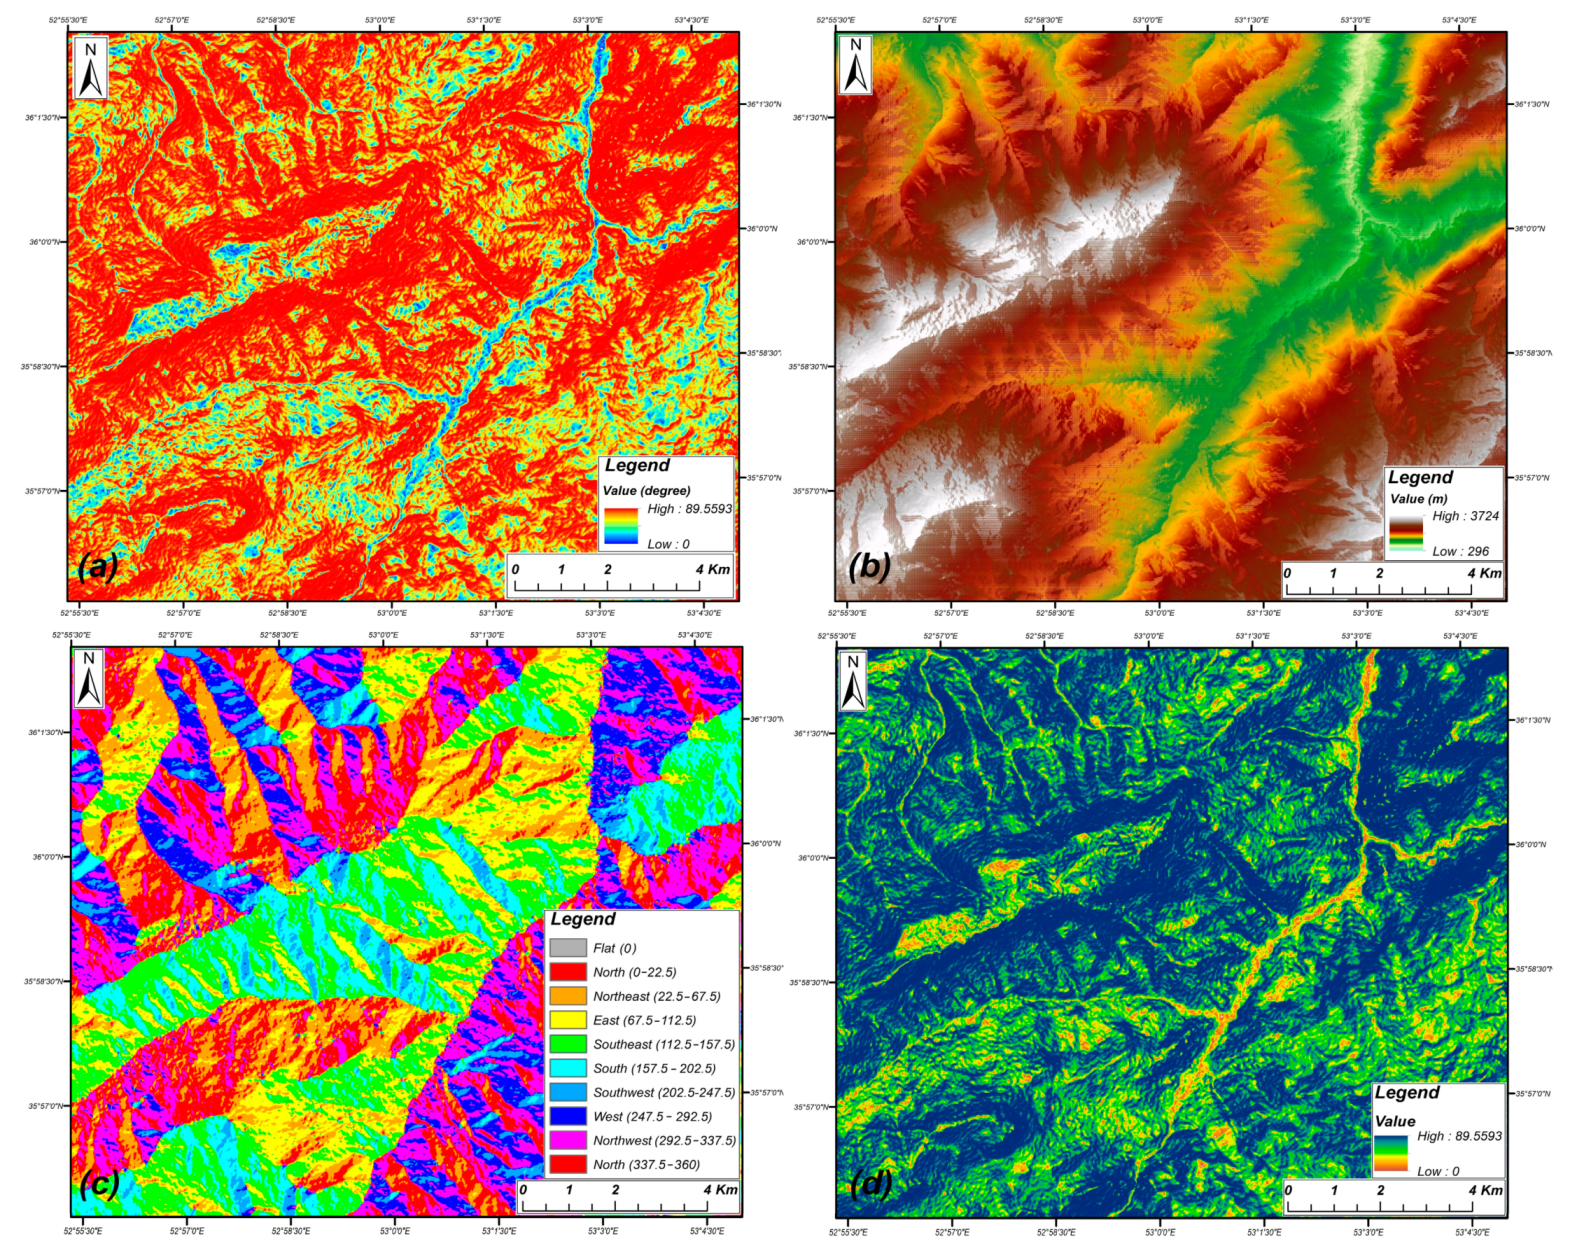
According to the dataset, the main triggering factors involved in landslide instability in the study area have been identified and are presented in Figure 4 and Figure 5. As presented in Figure 4, slope curvature and slope angle variations between 0°–89° in the area have led to increasing sliding instability (regardless of the geological features, slopes steeper than 35° are susceptible to sliding). The topographical elevation change of the study site shows that it varies extensively as a result of high geo-tectonic activity in the central Alborz zone and the intercontinental tectonic plate conflict. Although the slope aspect and mass movement relationship are not clear, the slope aspect affects the site’s general physiographic trend, main precipitation path, and drainage pattern, which are all considered important parameters in landslide instabilities. To evaluate the water condition in the study area, the main water condition factors, such as hydrological gradient, drainage pattern, and flow gradient (Figure 5), were extracted from Landsat satellite imagery to provide the sensitivity of the Gorzineh-khil region in generating massive movements in soil based on climatological variations that are related to a humid climate. As it is known, the presence of water in the soil is an important factor in creating instability since major landslides almost always occur after a rainstorm. In this regard, identification of the drainage pattern and catchment status as well as the flow condition can be very effective in landslide susceptibility analysis. In the meantime, the main factor for feature extraction was considered to be topographic parameters, which were at the pixel level for landslide-prone area detection. For this purpose, spectral information, topographic variations, and geo-structural landscapes were used to prepare the dataset (the dataset was identified by a layer that covered all of this mentioned information). The dataset was filtered by pre-processing (by correcting and deleting instances) and processed in ArcGIS 10.4 [41], where the integration of the layers has presented more reliable data for landslide-prone area detection.
3. Materials and Methods
3.1. CNN-Based Model
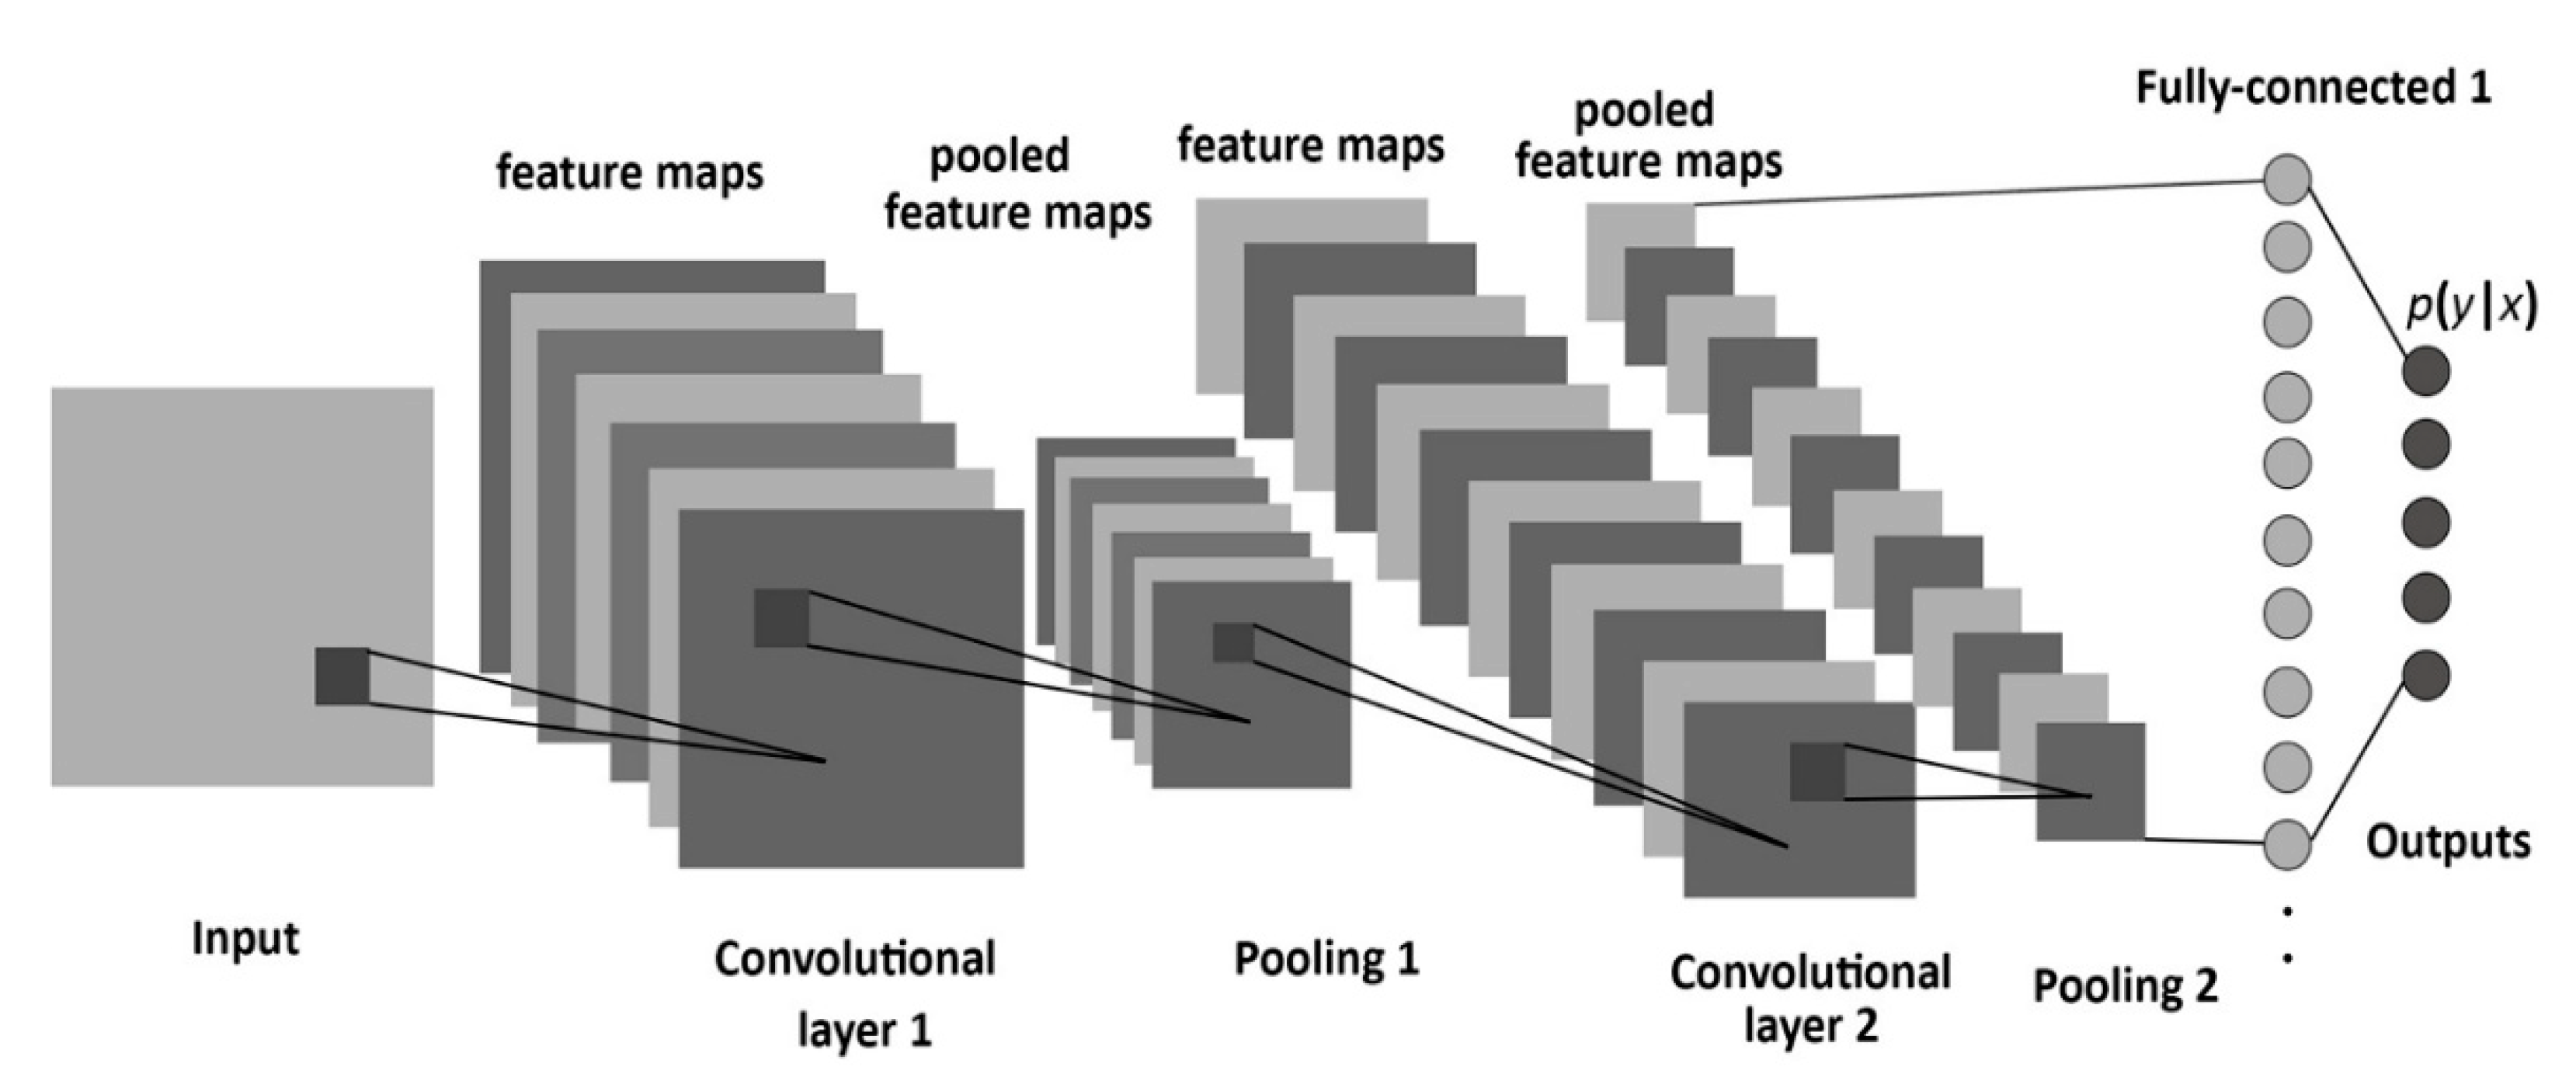
CNNs is a deep-learning-based feed-forward neural network that is applied to the analysis of visual imagery [42]. They are neural networks that use convolution instead of general matrix multiplication in at least one of their layers, which consists of an input and an output layer, as well as multiple hidden layers [42]. The basic architecture of the applied CNN algorithm is presented in Figure 6. CNN’s hidden layers typically consist of convolutional layer series that convolve with multiplication or other dot product [43]. The activation function is usually the RELU layer and is, subsequently, followed by additional convolutions, such as pooling layers, fully connected layers, and normalization layers, referred to as hidden layers because their inputs and outputs are masked by the activation function and final convolution [43]. When the evaluation reaches the end of each stage and desires to reduce the sampling, the spatial information storage capacity decreases. So, in order to keep this information, the pooling functions are utilized. The final convolution, on the other hand, frequently involves backpropagation in order to achieve a more precise weighting of the end-product. This path helps to achieve high precision in feature extraction form in visual imagery [44].
A look at the development of machine-learning models and their ability to adapt to GIS has led various researchers to use a variety of prediction models to assess landslides [45,46,47]. Among these, the susceptibility models can be classified into fuzzy-based, shallow learning, deep learning, hybrid, and/or metaheuristic algorithms. Each of these approaches has its own advantages and disadvantages, such as integration, the possibility of considering large data, implementation with data containing high uncertainty, and so on. In the meantime, deep learning methods have received more attention due to providing more accurate and reliable results. CNN net is capable of extracting varied information from satellite images, which is useful in susceptibility zonations for landslides [48].
3.2. Model Data and Implementation
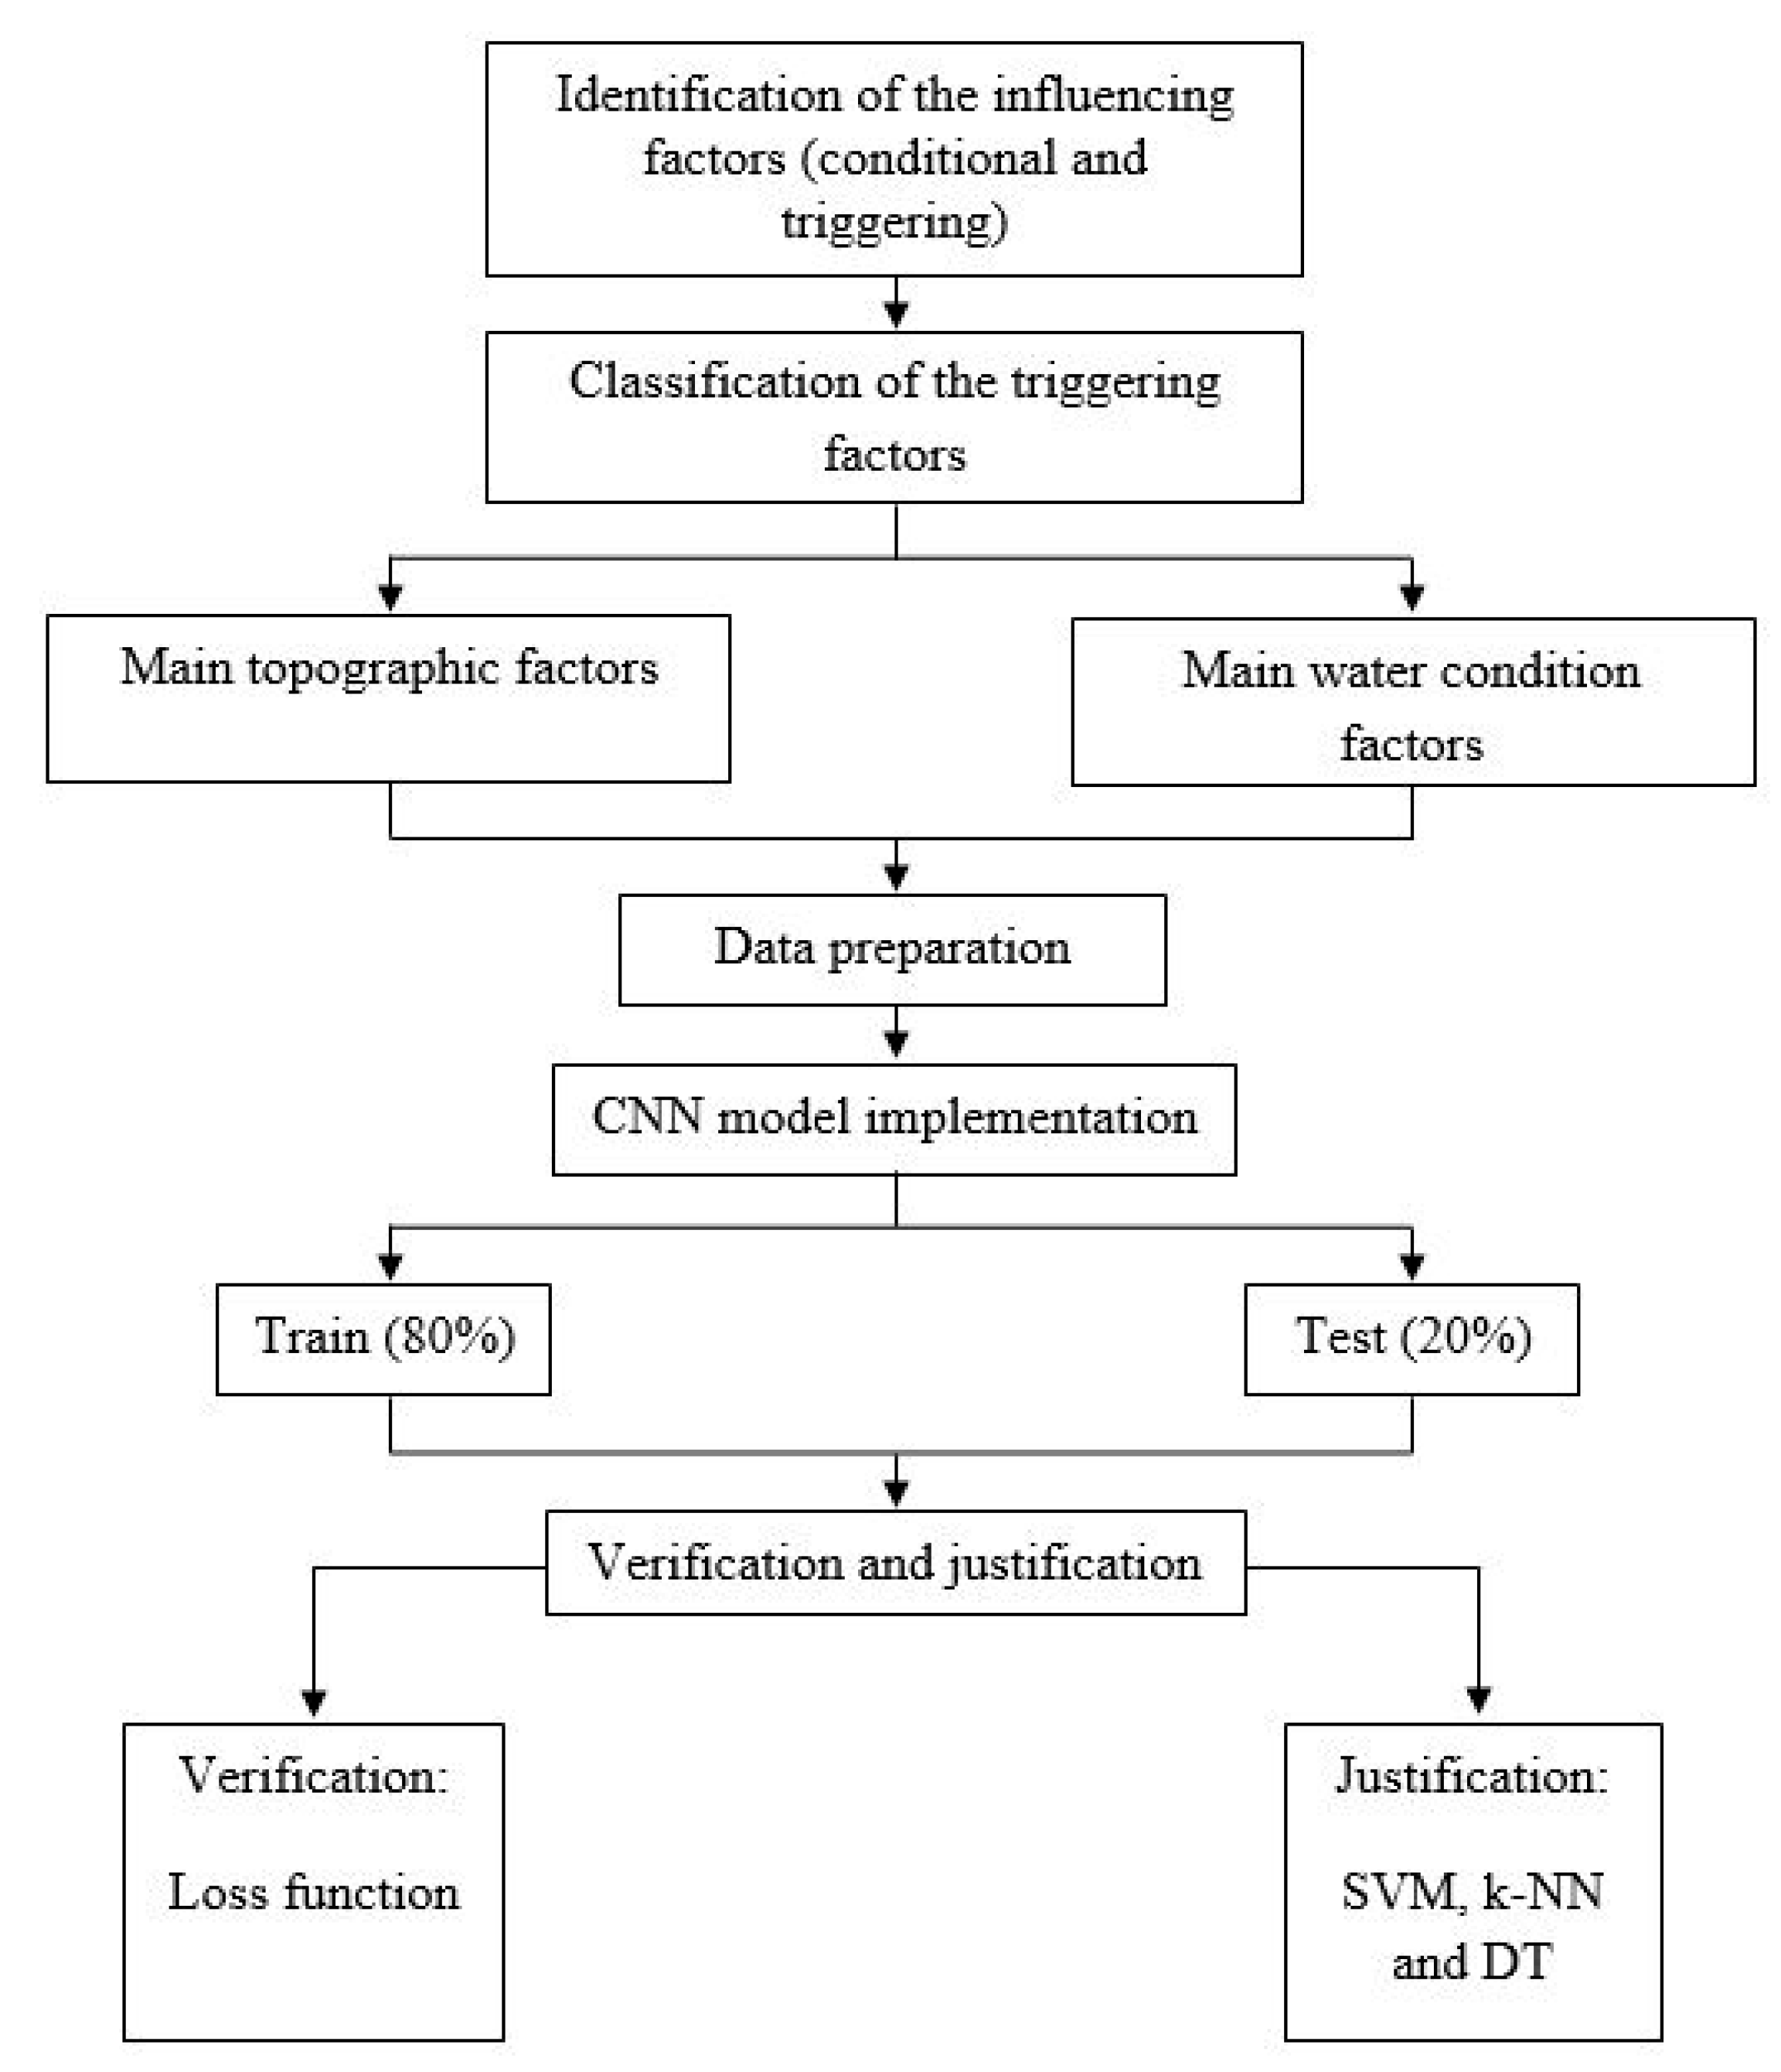
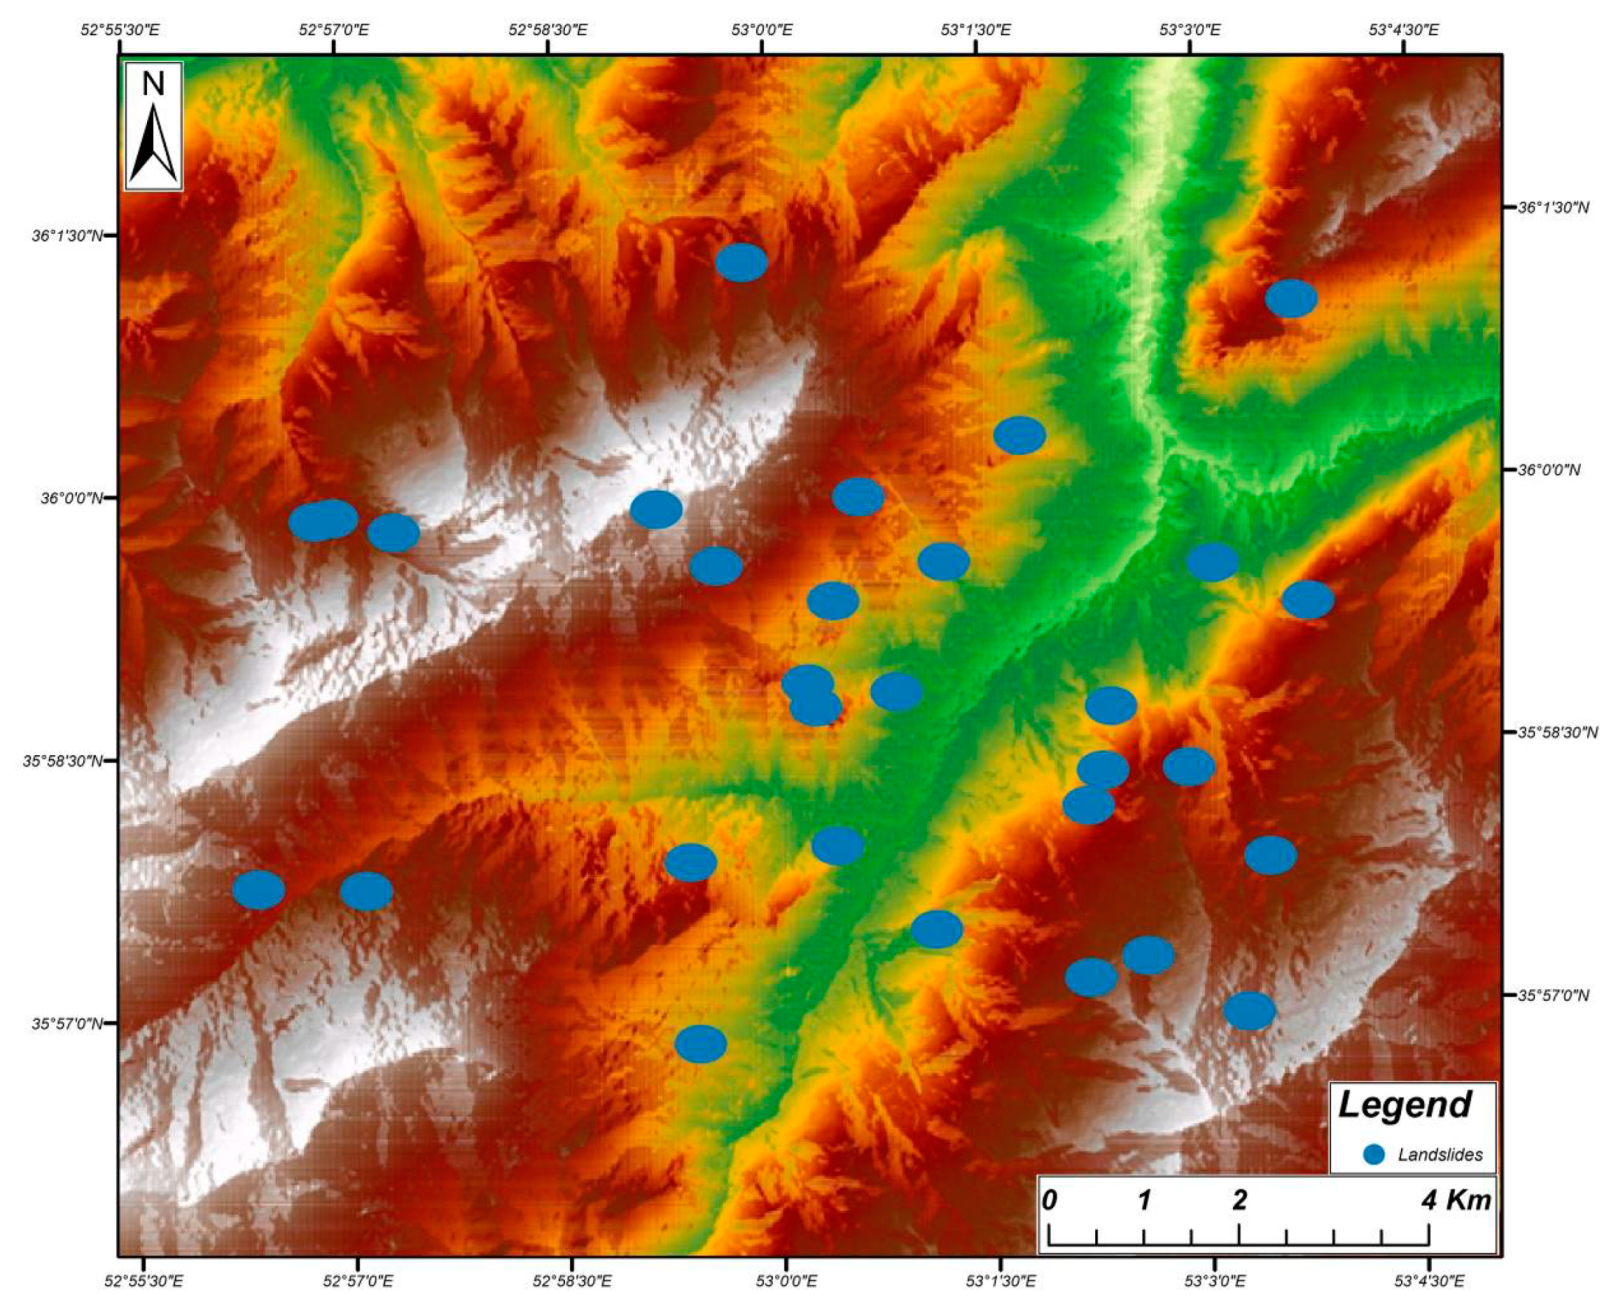
This study provides a CNN-based model for investigating the landslide susceptibility of the Gorzineh-khil region. For susceptibility zonation, the triggering factors such as the topographic parameters (as the main triggering factors) and water conditions were categorized and exposed to the CNN algorithm that was implemented by the Python high-level programming language and conducted for landslide detection. Landslide-prone areas from the entire dataset were selected for the training (80%) and the tests (20%). In this regard, the topographic factor that includes slope curvature, topographical elevation, slope aspect, and weathering were considered the main susceptibility factors. Figure 7 presents the flowchart of the applied CNN method. The presented algorithm took into consideration the spatial dependency of the occurred landslides and surrounding areas based on neighborhood sensitivity to enter highly susceptible areas into the training dataset. As verification, the loss function for both the test sets and training sets was evaluated which indicated the amount of computational and processing error. The loss function is the function that computes the distance between the current output of the algorithm and the expected output. It’s a method to evaluate how your algorithm models the data. On the other hand, by using the common classification algorithms in machine learning that include SVM, k-NN, and DT classifiers, the utilized CNN-based model was justified. Table 1 presents the relation between the applied triggering factors and landslide susceptibility conditions in the CNN-based methodology, which is implemented in the basic map (Figure 8). This map is used for all of the susceptibility assessment steps performed in this study and concluded by the 15 layers CNN-based algorithm. As observed in Figure 8, all 30 landslides (Table 2) that have occurred in the area and their surroundings represent historically high-susceptible zones with a spatial dependency of which neighboring pixels for preparing predictor variables were incorporated into the training dataset. These training points aided CNN’s learning process to develop high-susceptible zones and these locations generated the pattern of high- to low-susceptible for landside occurrence in the studied area. The historical landside locations have been prepared based on MAJ and FRWMO reports. Table 2 presents additional information about the historical landslides used in this study as spatial dependency points for high-susceptible zones (landslide-prone areas).
3.3. Model Cross-Verification
In order to estimate the CNN model performance, which is implemented on the input data for the assessment of landslide susceptibility, the model was verified by obtaining a loss function. For justification and assessment of the model’s accuracy, confusion matrix components (i.e., precision, recall, and f1-score) were estimated. The matrix has been calculated from the following equations [44]:
where, P = positive; N = negative; TP = true positive; FP = false positive; TN = true negative; and FN = false negative. The confusion matrix is a table indicating a detailed analysis of the retrieved documents (estimated by the model) and relevant documents (measured data). For classification tasks, the terms TP, TN, FP, and FN compare the classifier’s results under test with trusted external judgments. The terms positive and negative refer to the classifier’s prediction, and the terms true and false refer to whether that prediction corresponds to the external judgment. In this regard, the matrix provides the indices which show the reliability of model performance so that for indicators closer to 1 (100%), the accuracy and performance of the model increase [44].
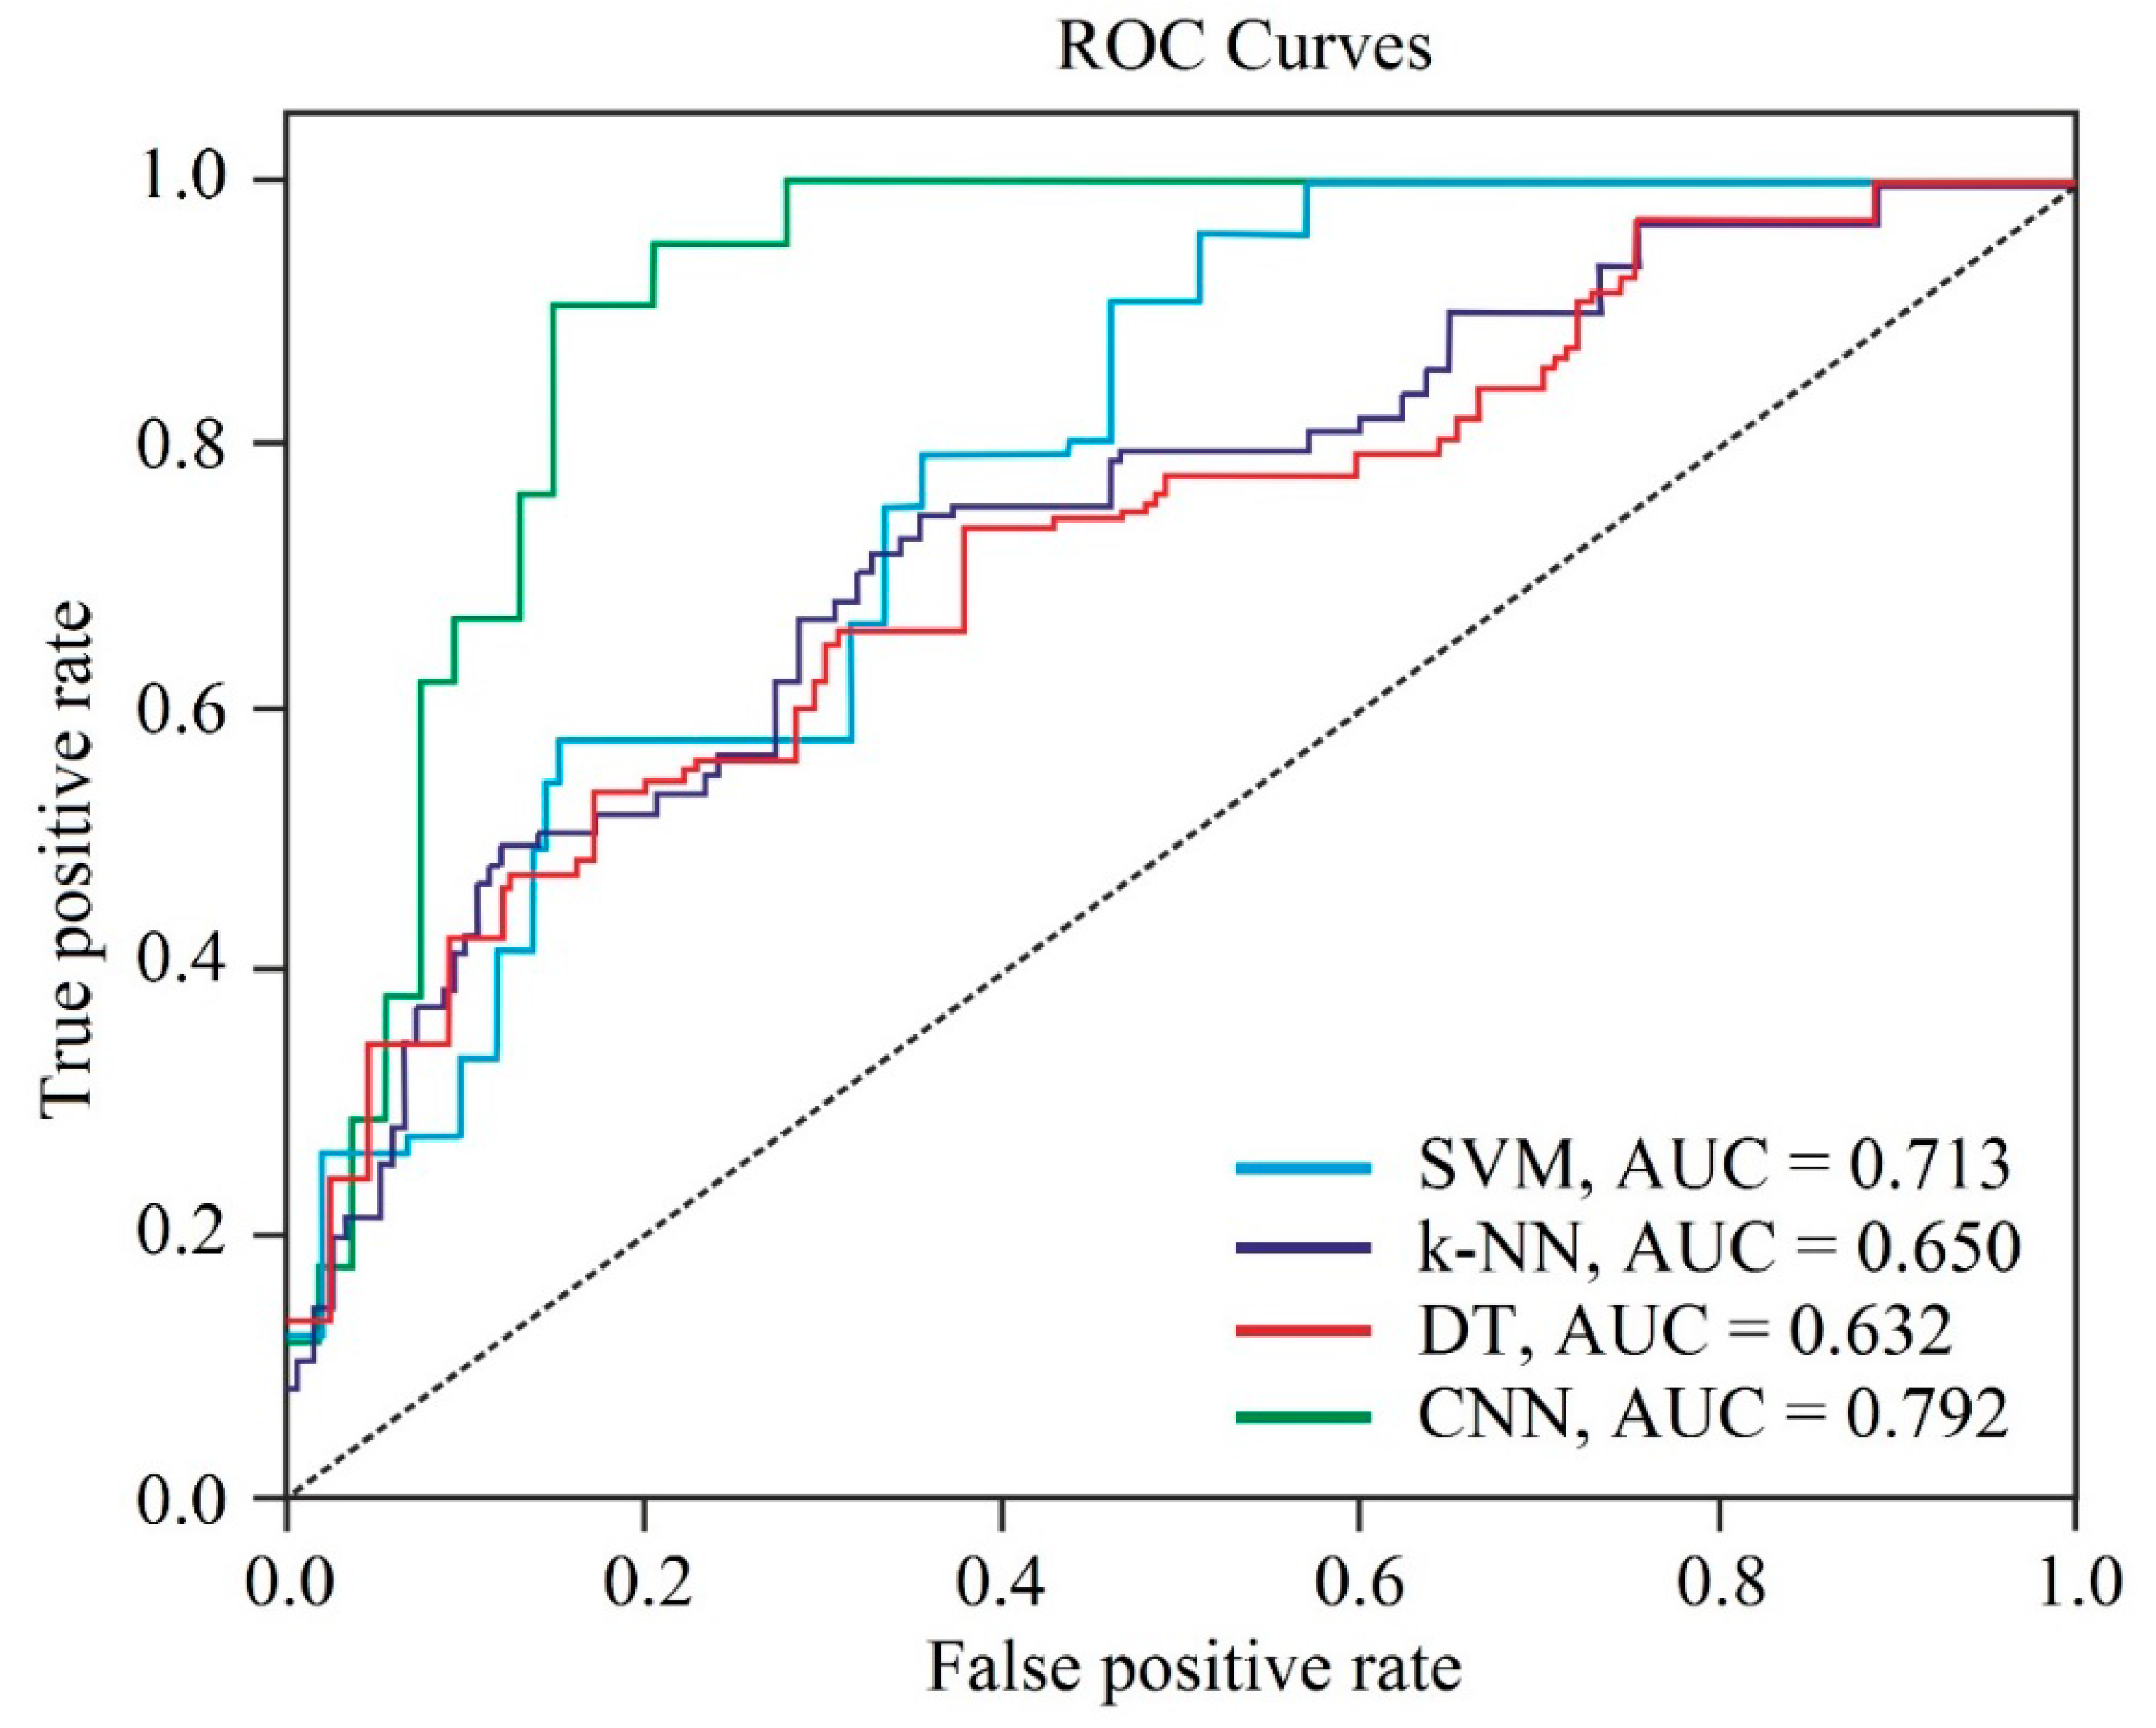
The justification was applied by using common machine-learning classifiers, such as SVM, k-NN, and DT algorithms, based on performance indices. SVM is a supervised learning model with associated learning algorithms that analyzes data for classification and regression analysis purposes. k-NN is a non-parametric method proposed by Thomas Cover that is used for classification and regression, which involves the k closest training examples in the feature space. DT is a decision-making tool that employs a tree-like model of decisions and their potential outcomes, such as chance event outcomes, resource costs, and utility. It is one way to show an algorithm that is only made up of conditional control statements. Decision trees are commonly used in operations research, specifically in decision analysis, to help identify a strategy most likely to achieve a goal and are also a popular tool in machine learning [42,44]. The error models were used to provide the performance analysis for all algorithms, which concluded that the mean squared error (MSE), root mean square error (RMSE), and mean absolute percentage error (MAPE) were used to measure the models’ error rates and compared with the others. On the other hand, the receiver operating characteristic (ROC) curve was used to demonstrate the overall accuracy variation for entire models. ROC is a graphical plot that illustrates the diagnostic ability of a binary classifier system as its discrimination threshold varied, which is created by plotting the TP against the FP rates. ROC analysis provides the criterion for changes in machine-learning models based on overall accuracy compression. This curve was used to provide the comparative verification in this study as well.
4. Results and Discussion
4.1. Results
To provide landslide susceptibility mapping with high accuracy, machine learning and deep neural network have successfully been implemented. The application of such networks requires preparing a dataset from triggering factors and historical landslides, which is used to develop proper zonation maps. The prepared dataset forms the landslide triggering factors, and historical landslides were used for training and evaluating the predictive capability of the landslide occurrence in the regions. These parameters, which are mentioned in Table 1, were utilized to produce a 15-layered CNN-based framework and to predict the sliding prone areas. The applied CNN-based landside prediction algorithm trained the 80% overall landslide-prone dataset where each of the pixelated grid cells was used for susceptibility assessment. To achieve accurate results, the trained estimated grid cells were used for pixel intensity evaluations.
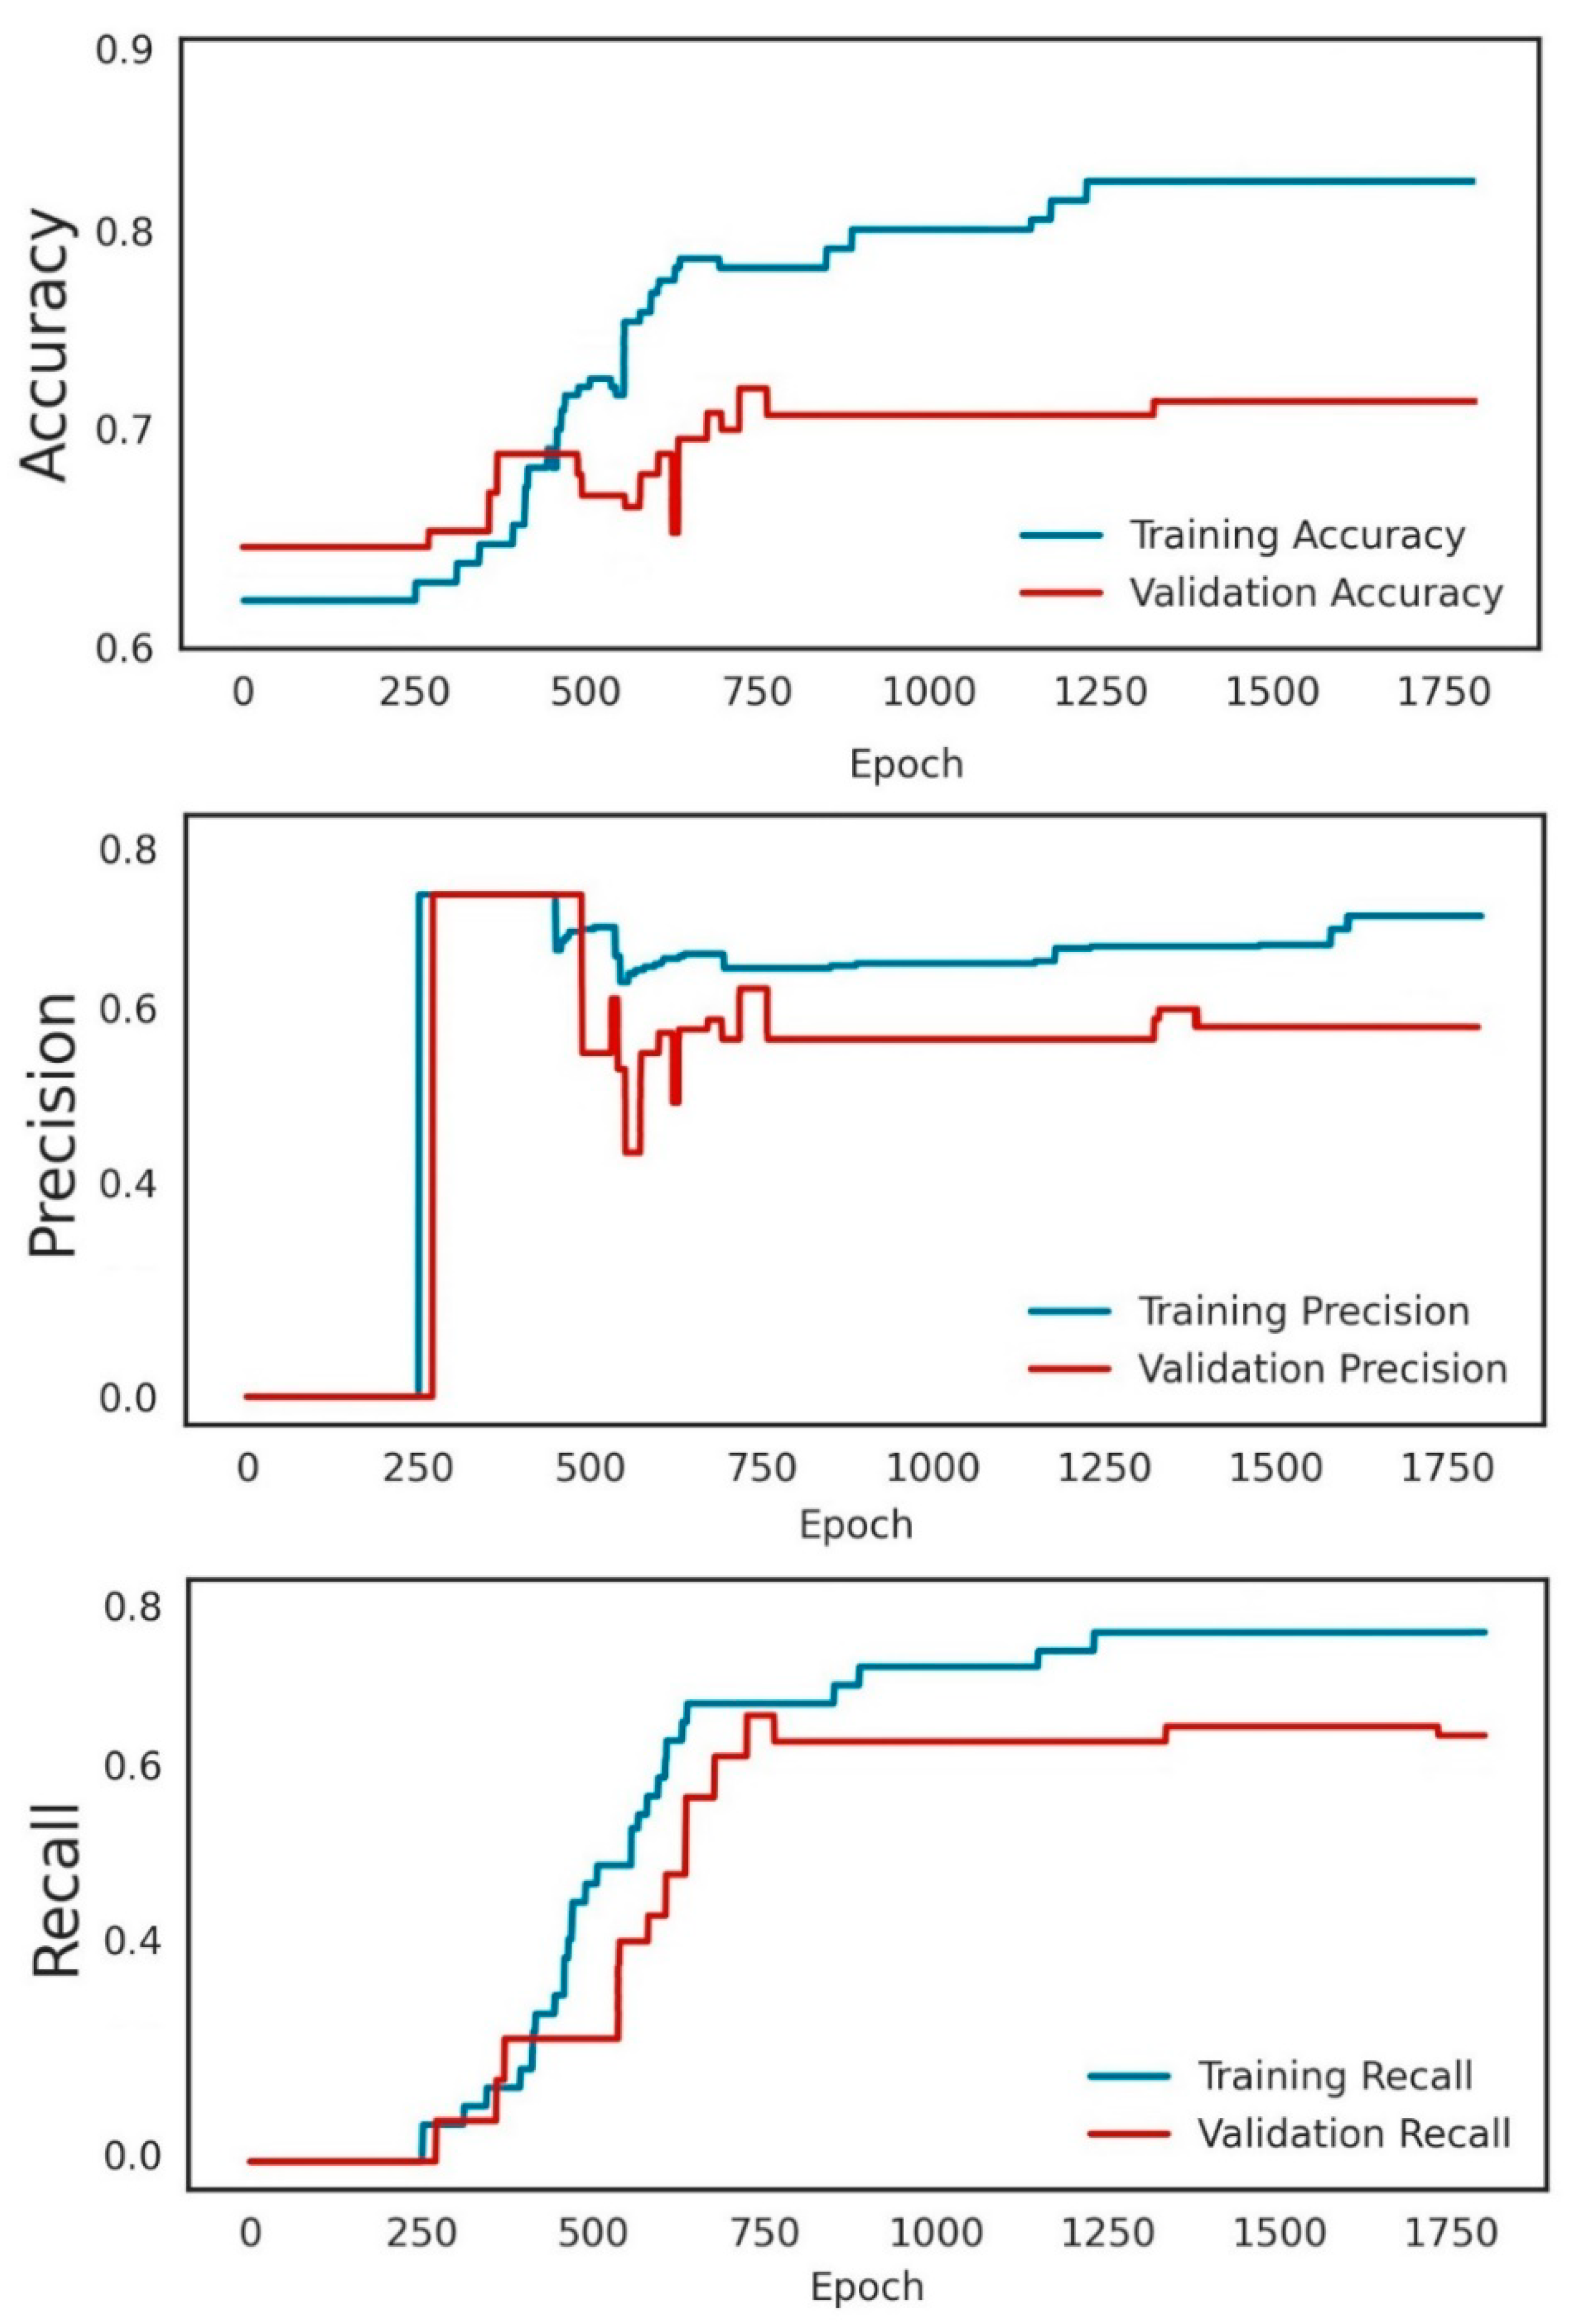
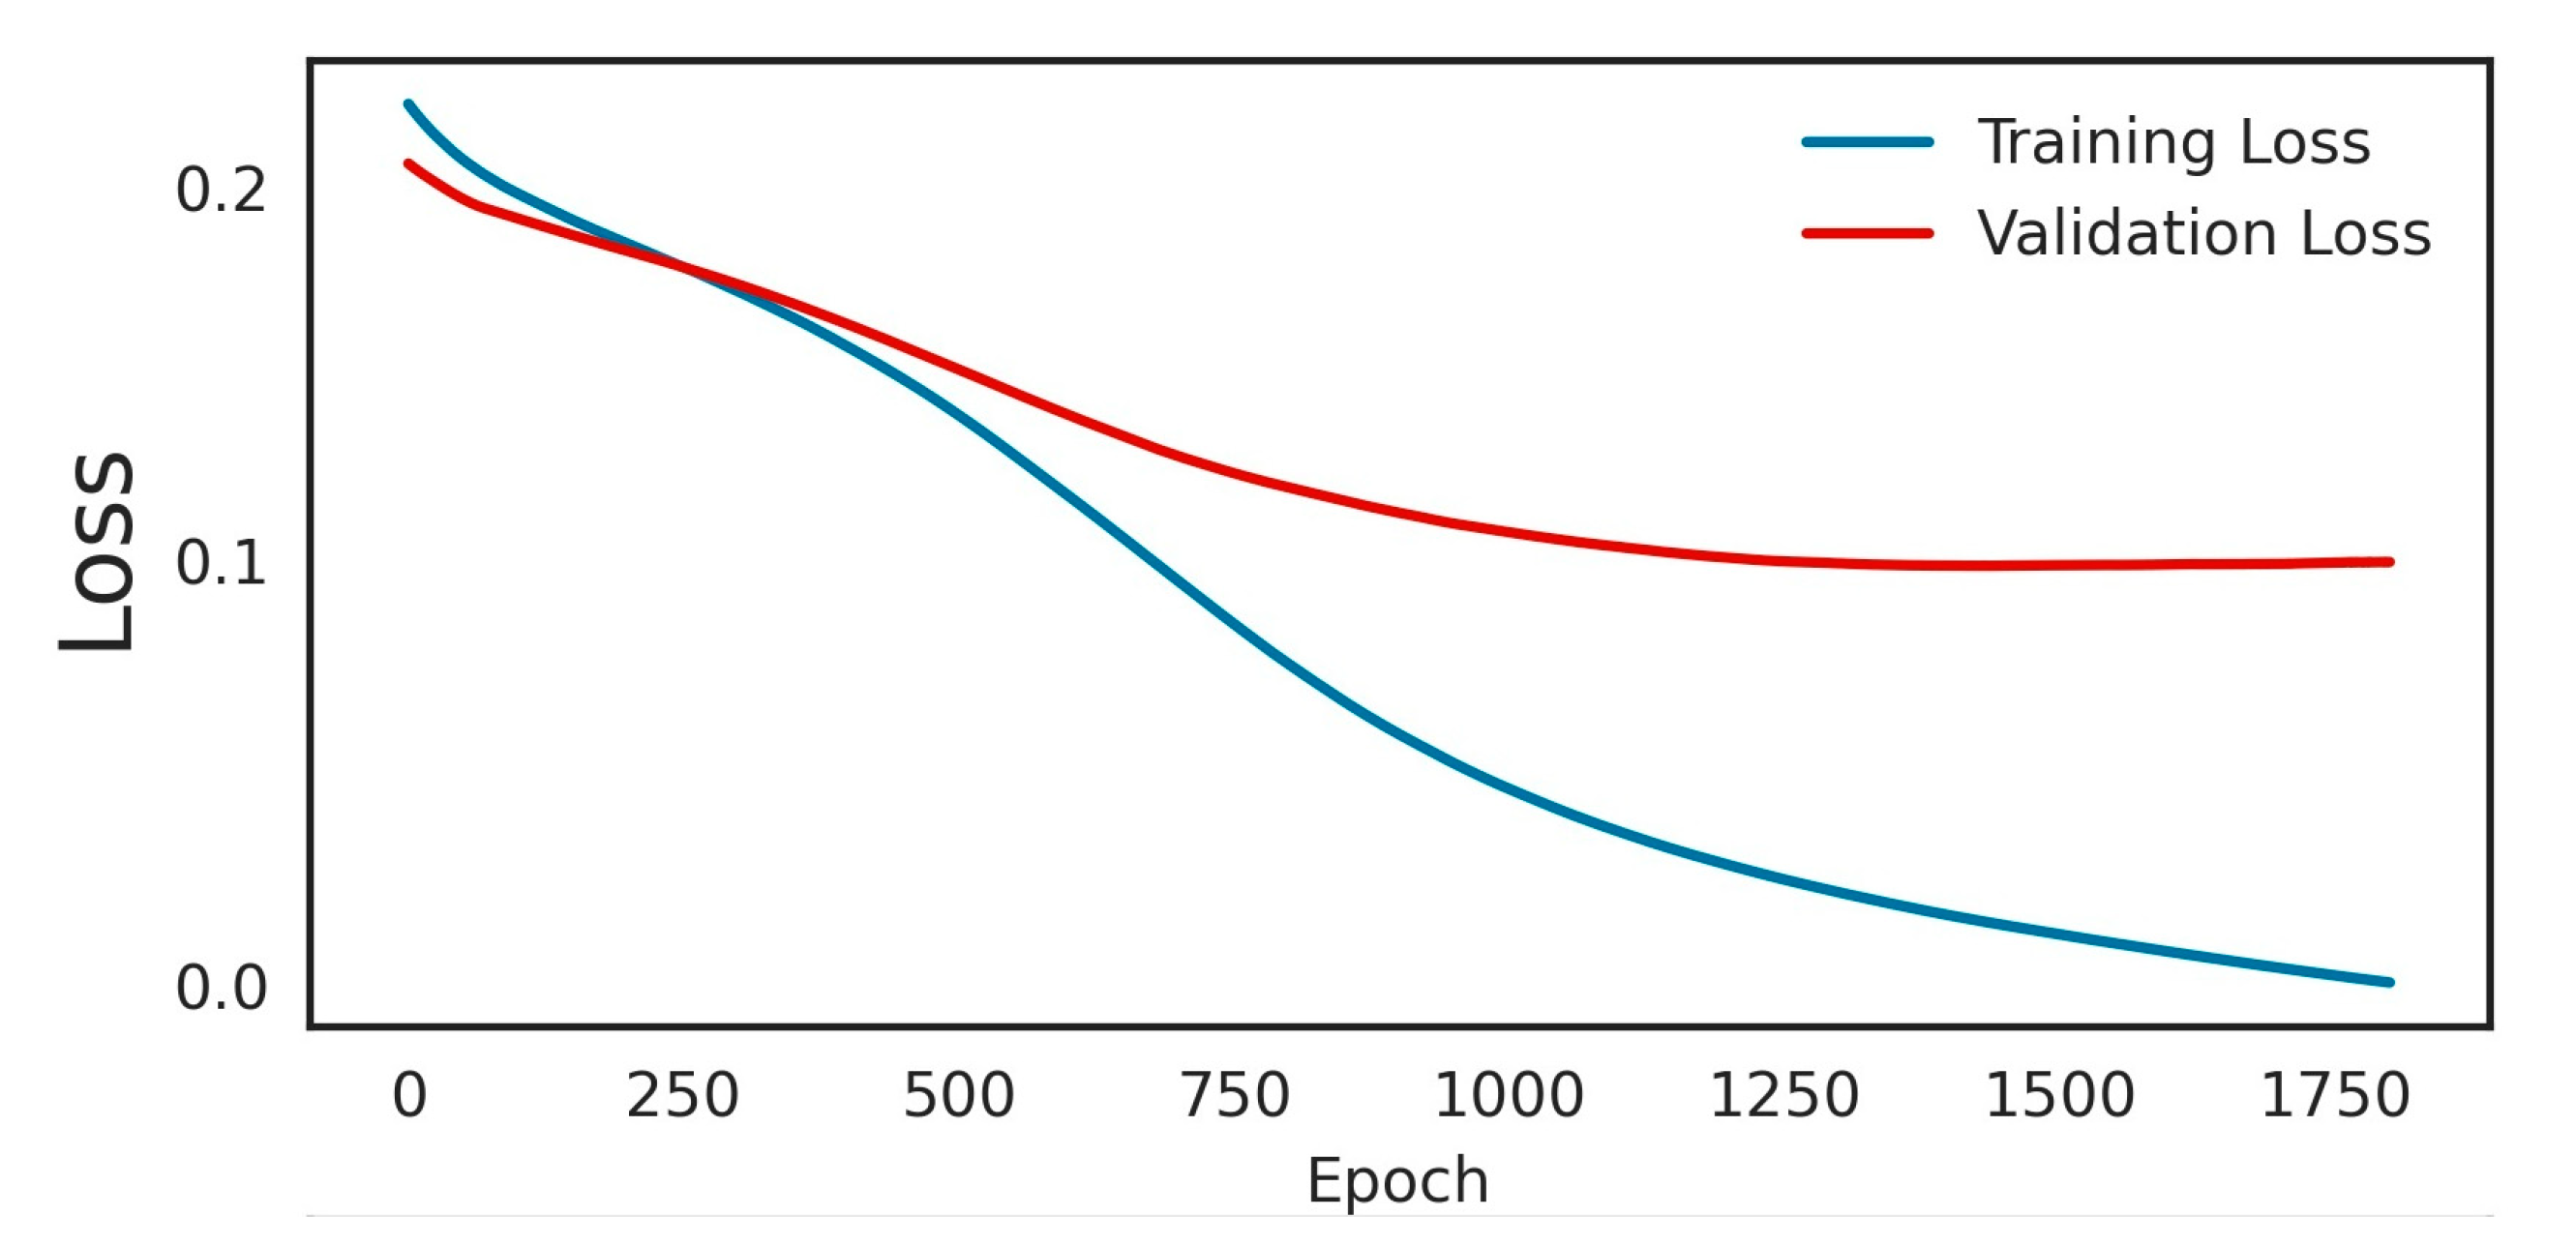
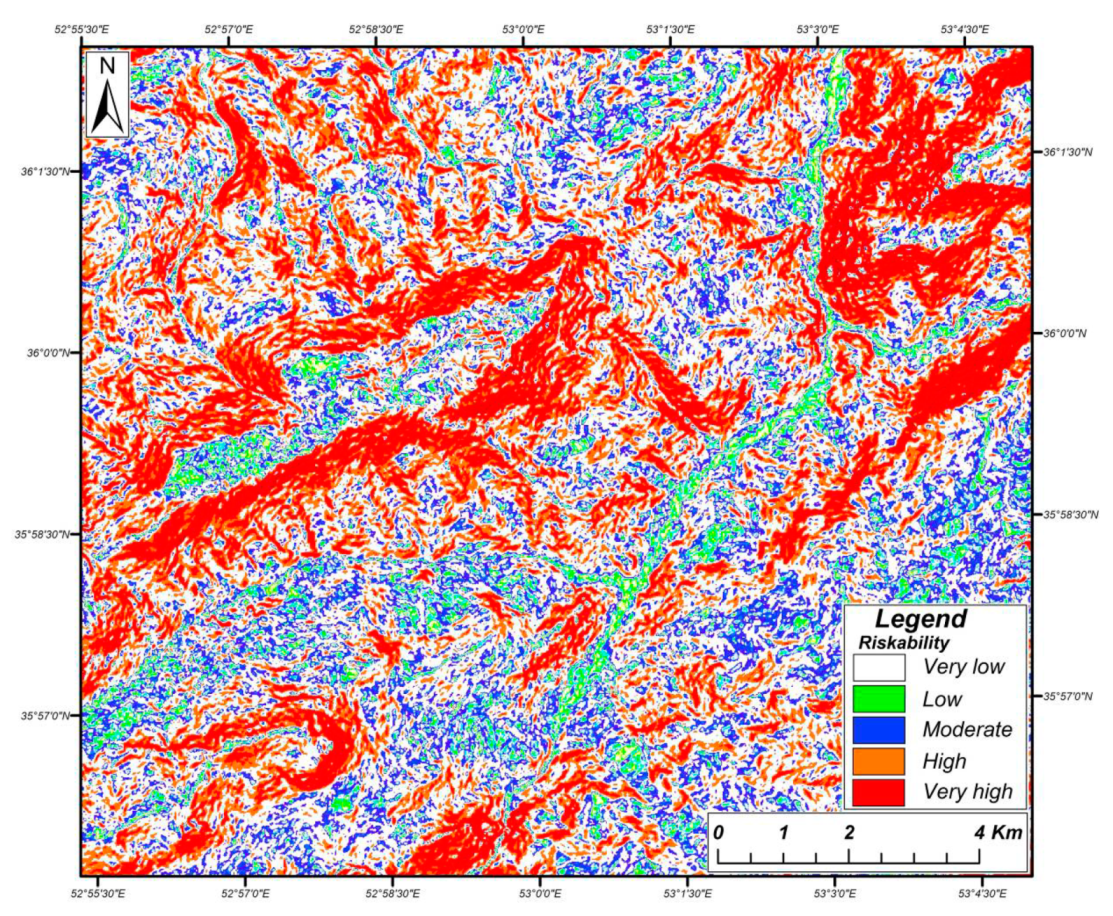
The result of the evaluation is presented in Figure 9. After training the dataset, the remaining 20% was tested. The ratio of the test to train is important for the model’s learning rate, which is a response to the estimated error each time the model weights are updated. In fact, the learning rate controls how quickly the model adapts to the problem. Smaller learning rates require more training epochs, whereas larger learning rates result in rapid changes and require fewer training epochs. Specifically, the learning rate is a configurable hyperparameter used in the training of neural networks that has a small positive value, often in the range between 0.0 and 1.0. This rate is used to evaluate the overall accuracy and models’ performance. Figure 9 provides the pre-processing to filter out feature redundancy and to ensure the overall performance consistency of the CNN model to aid in increasing the accuracy and detectability of the images. After conducting the pre-processing on the training datasets, which plays a crucial role in improving the performance of the CNN model, the model must be quantified so that the test dataset learns as a trained set for predictive detection. Figure 10 presents the results of the overlaying convolution implementation test and trained relevance maps. A comparison of the pixelated classifications (i.e., TP, FP, TN, and FN) according to Table 3 is used for detecting the corrected classification and recognition of the landslide susceptibility indices. A loss function has been estimated for the training-test description. Figure 11 provides the diagrams of training and validation based on the confusion matrix for the CNN model. Regarding this figure, the evaluation parameters (accuracy, precision, and recall) are estimated as the basic matrix of performance for the learning model. Also, Figure 12 illustrates the loss model. Referring to Figure 11 and Figure 12, the estimated loss for the model performance is less than 0.02 (average value) over 1750 epochs, which is considerable. The estimated accuracy for the model is 0.79 (average value), precision is 0.73 (average value), and recall is 0.75 (average value). Figure 13 presents the landslide susceptibility map. Due to the landslide susceptibility assessment results, the main focus of the landslide sliding hazard is striped in high elevations in the middle and north-northwest parts of the study region, where the landside susceptibility is classified into 5 classes, as obtained from the CNN model, and the performance matrix results, as indicated in Figure 14. By considering the estimated loss function for the CNN model, it can be clearly stated that the evaluation error rate has been reduced to 0.02 for the training dataset and to 0.01 for the test dataset in 1750 epochs. This indicates the high accuracy of the calculations. Based on Figure 14, it can be stated that the performance indicators show substantial scores for each of the evaluation criteria as indicated in Table 3. For justification of the estimated results, the model was comparatively compared with the results of the common learning models such as SVM, k-NN, and DT. Table 4 presents the results of the justifications. Also, the error rates were used to estimate the overall error table for various machine-learning algorithms. Table 5 shows the MSE, MAPE, and RMSE variations for all predictive models. As seen in these tables, the CNN-based model provides results with the highest accuracy and the least computational error as compared to the results of the other models. The ROC curve was used to control the overall accuracy, which is shown in Figure 15. The figure shows that the CNN model can make the most accurate predictions compared to other classifiers.
4.2. Discussion
As mentioned, the main uncertainties in the susceptibility assessment are related to the inventory dataset that belongs to the data gathering, historical landslides, site information, etc., which requires high definition and experience to minimize the error. An approach has been re-evaluated to overcome such uncertainties. After providing the detailed dataset, the CNN-based model was implemented to estimate the susceptibility of landslides in the Gorzineh-khil region. The algorithm used the DEM and Landsat TM8 satellite data to evaluate the hazard susceptibility zonation in the studied area. The main landslide inventory dataset was divided into the training (80%) and testing (20%) sets randomly and used in the analysis. The CNN predictive model was utilized to produce a susceptibility map for the Gorzineh-khil region with appropriate accuracy. The results show a considerable increase in landslide susceptibility prediction accuracy compared to the benchmark models. Regardless of the higher accuracy achieved by the model than other classifiers, this study is associated with some limitations that could be considered in future research. These limitations can be categorized as:
- The primary database was provided based on reports, historical landslide locations, field surveys, and remote sensing data, which is challenged by a limited personal budget;
- The triggering factors’ data is highly dependent on the satellite imagery resolution and DEM data quality, which affect directly the primary dataset; and
- Deep learning requires strong processing hardware to conduct accurate mapping.
Nevertheless, by using the CNN model, the susceptibility map of the studied area was obtained. The model was verified by using the SVM, k-NN, and DT classifiers. To justify the model, loss function, error table (MSE, MAPE, and RMSE), and ROC were used. According to the results, the proposed model has the highest accuracy value.
5. Conclusions
Landslides are complicated geological events that are controlled by many variables such as topographic, geologic, climatologic, seismic, human activity-related factors, etc., which are associated with numerous uncertainties in susceptibility evaluations. In this regard, many procedures are used in susceptibility assessments, which are mainly classified as quantitative and qualitative methods. In the meantime, quantitative procedures, especially knowledge-based methods (due to their ability to cover more variables), have gained importance nowadays. This study presents an application of the convolutional neural network (CNN) as one of the recent concepts of knowledge-based methodology to landslide susceptibility assessment in the Gorzineh-khil region located in the Savadkooh county, Mazandaran province, northeast of Iran. The study followed three steps for landslide hazard zonation and for providing hazard potential maps. In the first step, by using satellite images, DEM data, and a field survey, the landslide influencing (triggering) factors were identified. In Step Two, the dataset was provided and a CNN model to extract the relevant features was performed. In Step three, verification and justification of the model by using a loss function and regular machine-learning classifiers (e.g., SVM, k-NN, and DT) were performed.
As a result of the study, the topographic factor has been taken into account as the main triggering factor, and the others were considered as triggering factors. This factor alone would not be enough to lead to a landslide occurrence, but it has had a significant effect on land movements in Gorzineh-khil. Topography also influences other parameters such as vegetation, wind, sunlight, and freezing, which are directly related to weathering.
The 15-layer convolutional neural network model was used to classify the hazard potential of the studied region into five susceptibility classes to prepare the hazard potential map of the Gorzineh-khil region. According to the results, the main focus of the landslide sliding hazard is striped in high elevations in the middle and north-northwest parts of the studied region.
For estimating the CNN model’s performance, the model was verified by a loss function and justified by SVM, k-NN, and DT. Based on the loss function, it can be stated that the evaluation error rate has been reduced to 0.02 for the training dataset and to 0.033 for the test dataset in 200 epochs and performance evaluations for the susceptibility assessment. The CNN, with 79.0% accuracy, 73.0% precision, 75.0% recall, and 77.0% f1-score, was capable of providing results with better accuracy as compared to the other models with the least computational error.
Author Contributions
S.N. and M.A.: writing—original draft preparation, methodology, conceptualization, investigation, resources, validation, visualization, formal analysis; H.A.: validation, visualization, supervision, writing—review and editing; R.D.: supervision, writing—review and editing. All authors have read and agreed to the published version of the manuscript.
Funding
This research received no external funding.
Institutional Review Board Statement
Not applicable.
Informed Consent Statement
Not applicable.
Data Availability Statement
All data is provided within the paper.
Conflicts of Interest
The authors declare no conflict of interest.
References
- Nanehkaran, Y.A.; Mao, Y.; Azarafza, M.; Kockar, M.K.; Zhu, H.-H. Fuzzy-based multiple decision method for landslide susceptibility and hazard assessment: A case study of Tabriz, Iran. Geomech. Eng. 2021, 24, 407–418. [Google Scholar] [CrossRef]
- Rashidi, A.; Khatib, M.M.; Derakhshani, R. Structural Characteristics and Formation Mechanism of the Earth Fissures as a Geohazard in Birjand, Iran. Appl. Sci. 2022, 12, 4144. [Google Scholar] [CrossRef]
- Azarafza, M.; Azarafza, M.; Akgün, H.; Atkinson, P.M.; Derakhshani, R. Deep learning-based landslide susceptibility mapping. Sci. Rep. 2021, 11, 24112. [Google Scholar] [CrossRef] [PubMed]
- Akgun, A. A comparison of landslide susceptibility maps produced by logistic regression, multi-criteria decision, and likelihood ratio methods: A case study at İzmir, Turkey. Landslides 2012, 9, 93–106. [Google Scholar] [CrossRef]
- Pourkhosravani, M.; Mehrabi, A.; Pirasteh, S.; Derakhshani, R. Monitoring of Maskun landslide and determining its quantitative relationship to different climatic conditions using D-InSAR and PSI techniques. Geomat. Nat. Hazards Risk 2022, 13, 1134–1153. [Google Scholar] [CrossRef]
- Ercanoglu, M.; Gokceoglu, C. Assessment of landslide susceptibility for a landslide-prone area (north of Yenice, NW Turkey) by fuzzy approach. Environ. Geol. 2002, 41, 720–730. [Google Scholar] [CrossRef]
- Ercanoglu, M.; Gokceoglu, C. Use of fuzzy relations to produce landslide susceptibility map of a landslide prone area (West Black Sea Region, Turkey). Eng. Geol. 2004, 75, 229–250. [Google Scholar] [CrossRef]
- Akgun, A.; Dag, S.; Bulut, F. Landslide susceptibility mapping for a landslide-prone area (Findikli, NE of Turkey) by likelihood-frequency ratio and weighted linear combination models. Environ. Geol. 2008, 54, 1127–1143. [Google Scholar] [CrossRef]
- Abella, E.A.C.; Van Westen, C.J. Qualitative landslide susceptibility assessment by multicriteria analysis: A case study from San Antonio del Sur, Guantánamo, Cuba. Geomorphology 2008, 94, 453–466. [Google Scholar] [CrossRef] [Green Version]
- Arabameri, A.; Pradhan, B.; Rezaei, K.; Lee, C.-W. Assessment of landslide susceptibility using statistical-and artificial intelligence-based FR–RF integrated model and multiresolution DEMs. Remote Sens. 2019, 11, 999. [Google Scholar] [CrossRef] [Green Version]
- Arabameri, A.; Pradhan, B.; Rezaei, K.; Lee, S.; Sohrabi, M. An ensemble model for landslide susceptibility mapping in a forested area. Geocarto Int. 2020, 35, 1680–1705. [Google Scholar] [CrossRef]
- Arabameri, A.; Pradhan, B.; Rezaei, K.; Sohrabi, M.; Kalantari, Z. GIS-based landslide susceptibility mapping using numerical risk factor bivariate model and its ensemble with linear multivariate regression and boosted regression tree algorithms. J. Mt. Sci. 2019, 16, 595–618. [Google Scholar] [CrossRef]
- Duman, T.; Can, T.; Gokceoglu, C.; Nefeslioglu, H.; Sonmez, H. Application of logistic regression for landslide susceptibility zoning of Cekmece Area, Istanbul, Turkey. Environ. Geol. 2006, 51, 241–256. [Google Scholar] [CrossRef]
- Nefeslioglu, H.A.; Duman, T.Y.; Durmaz, S. Landslide susceptibility mapping for a part of tectonic Kelkit Valley (Eastern Black Sea region of Turkey). Geomorphology 2008, 94, 401–418. [Google Scholar] [CrossRef]
- Ruff, M.; Czurda, K. Landslide susceptibility analysis with a heuristic approach in the Eastern Alps (Vorarlberg, Austria). Geomorphology 2008, 94, 314–324. [Google Scholar] [CrossRef]
- Yilmaz, I. Landslide susceptibility mapping using frequency ratio, logistic regression, artificial neural networks and their comparison: A case study from Kat landslides (Tokat—Turkey). Comput. Geosci. 2009, 35, 1125–1138. [Google Scholar] [CrossRef]
- Othman, A.N.; Naim, W.M.; Noraini, S. GIS based multi-criteria decision making for landslide hazard zonation. Procedia Soc. Behav. Sci. 2012, 35, 595–602. [Google Scholar] [CrossRef] [Green Version]
- Papathanassiou, G.; Valkaniotis, S.; Ganas, A.; Pavlides, S. GIS-based statistical analysis of the spatial distribution of earthquake-induced landslides in the island of Lefkada, Ionian Islands, Greece. Landslides 2013, 10, 771–783. [Google Scholar] [CrossRef]
- Azarafza, M.; Akgün, H.; Feizi-Derakhshi, M.-R.; Azarafza, M.; Rahnamarad, J.; Derakhshani, R. Discontinuous rock slope stability analysis under blocky structural sliding by fuzzy key-block analysis method. Heliyon 2020, 6, e03907. [Google Scholar] [CrossRef] [PubMed]
- Azarafza, M.; Akgün, H.; Ghazifard, A.; Asghari-Kaljahi, E.; Rahnamarad, J.; Derakhshani, R. Discontinuous rock slope stability analysis by limit equilibrium approaches–a review. Int. J. Digit. Earth 2021, 14, 1918–1941. [Google Scholar] [CrossRef]
- Eker, A.M.; Dikmen, M.; Cambazoglu, S.; Duzgun, S.H.; Akgun, H. Application of artificial neural network and logistic regression methods to landslide susceptibility mapping and comparison of the results for the ulus district, bartin. J. Fac. Eng. Archit. Gazi Univ. 2012, 27, 163–173. [Google Scholar]
- Eker, A.M.; Dikmen, M.; Cambazoğlu, S.; Düzgün, Ş.H.; Akgün, H. Evaluation and comparison of landslide susceptibility mapping methods: A case study for the Ulus district, Bartın, northern Turkey. Int. J. Geogr. Inf. Sci. 2015, 29, 132–158. [Google Scholar] [CrossRef]
- Zhu, A.-X.; Miao, Y.; Wang, R.; Zhu, T.; Deng, Y.; Liu, J.; Yang, L.; Qin, C.-Z.; Hong, H. A comparative study of an expert knowledge-based model and two data-driven models for landslide susceptibility mapping. Catena 2018, 166, 317–327. [Google Scholar] [CrossRef]
- Pham, B.T.; Bui, D.T.; Dholakia, M.; Prakash, I.; Pham, H.V. A comparative study of least square support vector machines and multiclass alternating decision trees for spatial prediction of rainfall-induced landslides in a tropical cyclones area. Geotech. Geol. Eng. 2016, 34, 1807–1824. [Google Scholar] [CrossRef]
- Hong, H.; Pourghasemi, H.R.; Pourtaghi, Z.S. Landslide susceptibility assessment in Lianhua County (China): A comparison between a random forest data mining technique and bivariate and multivariate statistical models. Geomorphology 2016, 259, 105–118. [Google Scholar] [CrossRef]
- Hong, H.; Tsangaratos, P.; Ilia, I.; Chen, W.; Xu, C. Comparing the Performance of a Logistic Regression and a Random Forest Model in Landslide Susceptibility Assessments. The Case of Wuyaun Area, China. In Advancing Culture of Living with Landslides; Workshop on World Landslide, Forum; Mikos, M., Tiwari, B., Yin, Y., Sassa, K., Eds.; Springer: Berlin/Heidelberg, Germany, 2017; pp. 1043–1050. [Google Scholar]
- Chen, W.; Pourghasemi, H.R.; Naghibi, S.A. A comparative study of landslide susceptibility maps produced using support vector machine with different kernel functions and entropy data mining models in China. Bull. Eng. Geol. Environ. 2018, 77, 647–664. [Google Scholar] [CrossRef]
- Chen, W.; Pourghasemi, H.R.; Zhao, Z. A GIS-based comparative study of Dempster-Shafer, logistic regression and artificial neural network models for landslide susceptibility mapping. Geocarto Int. 2017, 32, 367–385. [Google Scholar] [CrossRef]
- Adnan, M.S.G.; Rahman, M.S.; Ahmed, N.; Ahmed, B.; Rabbi, M.; Rahman, R.M. Improving spatial agreement in machine learning-based landslide susceptibility mapping. Remote Sens. 2020, 12, 3347. [Google Scholar] [CrossRef]
- Rossi, M.; Guzzetti, F.; Reichenbach, P.; Mondini, A.C.; Peruccacci, S. Optimal landslide susceptibility zonation based on multiple forecasts. Geomorphology 2010, 114, 129–142. [Google Scholar] [CrossRef]
- Guzzetti, F.; Reichenbach, P.; Ardizzone, F.; Cardinali, M.; Galli, M. Estimating the quality of landslide susceptibility models. Geomorphology 2006, 81, 166–184. [Google Scholar] [CrossRef]
- Iran Meteorological Organization. Climatological Data from Mazandaran Station. Available online: https://www.irimo.ir (accessed on 6 June 2019).
- Aghanabati, A. Geology of Iran; Geological Survey of Iran: Tehran, Iran, 2004. [Google Scholar]
- Geological Survey of Iran (GSI). Geological Map of Mazandaran–Scales: 1:250,000 and 1:100,000; Geological Survey of Iran Press: Tehran, Iran, 2009. [Google Scholar]
- Rashidi, A.; Derakhshani, R. Strain and Moment- Rates from GPS and Seismological Data in Northern Iran: Implications for an Evaluation of Stress Trajectories and Probabilistic Fault Rupture Hazard. Remote Sens. 2022, 14, 2219. [Google Scholar] [CrossRef]
- Nemati, M.; Derakhshani, R. Short-term seismicity patterns along the most active faults in Iran. J. Iber. Geol. 2021, 47, 441–459. [Google Scholar] [CrossRef]
- Highland, L.; Bobrowsky, P.T. The Landslide Handbook: A Guide to Understanding Landslides; US Geological Survey: Reston, VA, USA, 2008. [Google Scholar]
- US Geological Survey (USGS). Landsat Series of Earth Observation Satellites. Earth Explorer: US Geological Survey. Available online: https://earthexplorer.usgs.gov (accessed on 6 June 2019).
- Li, Z.; Zhu, C.; Gold, C. Digital Terrain Modeling: Principles and Methodology; CRC Press: Boca Raton, FL, USA, 2004; p. 340. [Google Scholar]
- Alaska Satellite Facility. Digital Elevation Data (DEM) for Savadkooh County, Southern Mazandaran, Alaska Satellite Facility Distributed Active Archive Centre (ASF DAAC). Available online: https://search.asf.alaska.edu (accessed on 6 June 2019).
- ArcGIS Software, version 10.4; International Supplier of Geographic Information System Software, Web GIS and Geodatabase Management Applications; ESRI: Redlands, CA, USA, 2018. Available online: https://www.esri.com/en-us/arcgis/products/arcgis-online/overview (accessed on 6 June 2019).
- Aggarwal, C.C. Neural Networks and Deep Learning; A Textbook; Springer: New York, NY, USA, 2018. [Google Scholar]
- Wang, Y.; Fang, Z.; Hong, H. Comparison of convolutional neural networks for landslide susceptibility mapping in Yanshan County, China. Sci. Total Environ. 2019, 666, 975–993. [Google Scholar] [CrossRef] [PubMed]
- Chollet, F. Deep Learning with Python; Simon and Schuster: New York, NY, USA, 2021. [Google Scholar]
- Albelwi, S.; Mahmood, A. A framework for designing the architectures of deep convolutional neural networks. Entropy 2017, 19, 242. [Google Scholar] [CrossRef] [Green Version]
- Chen, W.; Peng, J.; Hong, H.; Shahabi, H.; Pradhan, B.; Liu, J.; Zhu, A.-X.; Pei, X.; Duan, Z. Landslide susceptibility modelling using GIS-based machine learning techniques for Chongren County, Jiangxi Province, China. Sci. Total Environ. 2018, 626, 1121–1135. [Google Scholar] [CrossRef]
- Kalantar, B.; Ueda, N.; Saeidi, V.; Ahmadi, K.; Halin, A.A.; Shabani, F. Landslide susceptibility mapping: Machine and ensemble learning based on remote sensing big data. Remote Sens. 2020, 12, 1737. [Google Scholar] [CrossRef]
- Chen, W.; Li, Y. GIS-based evaluation of landslide susceptibility using hybrid computational intelligence models. Catena 2020, 195, 104777. [Google Scholar] [CrossRef]
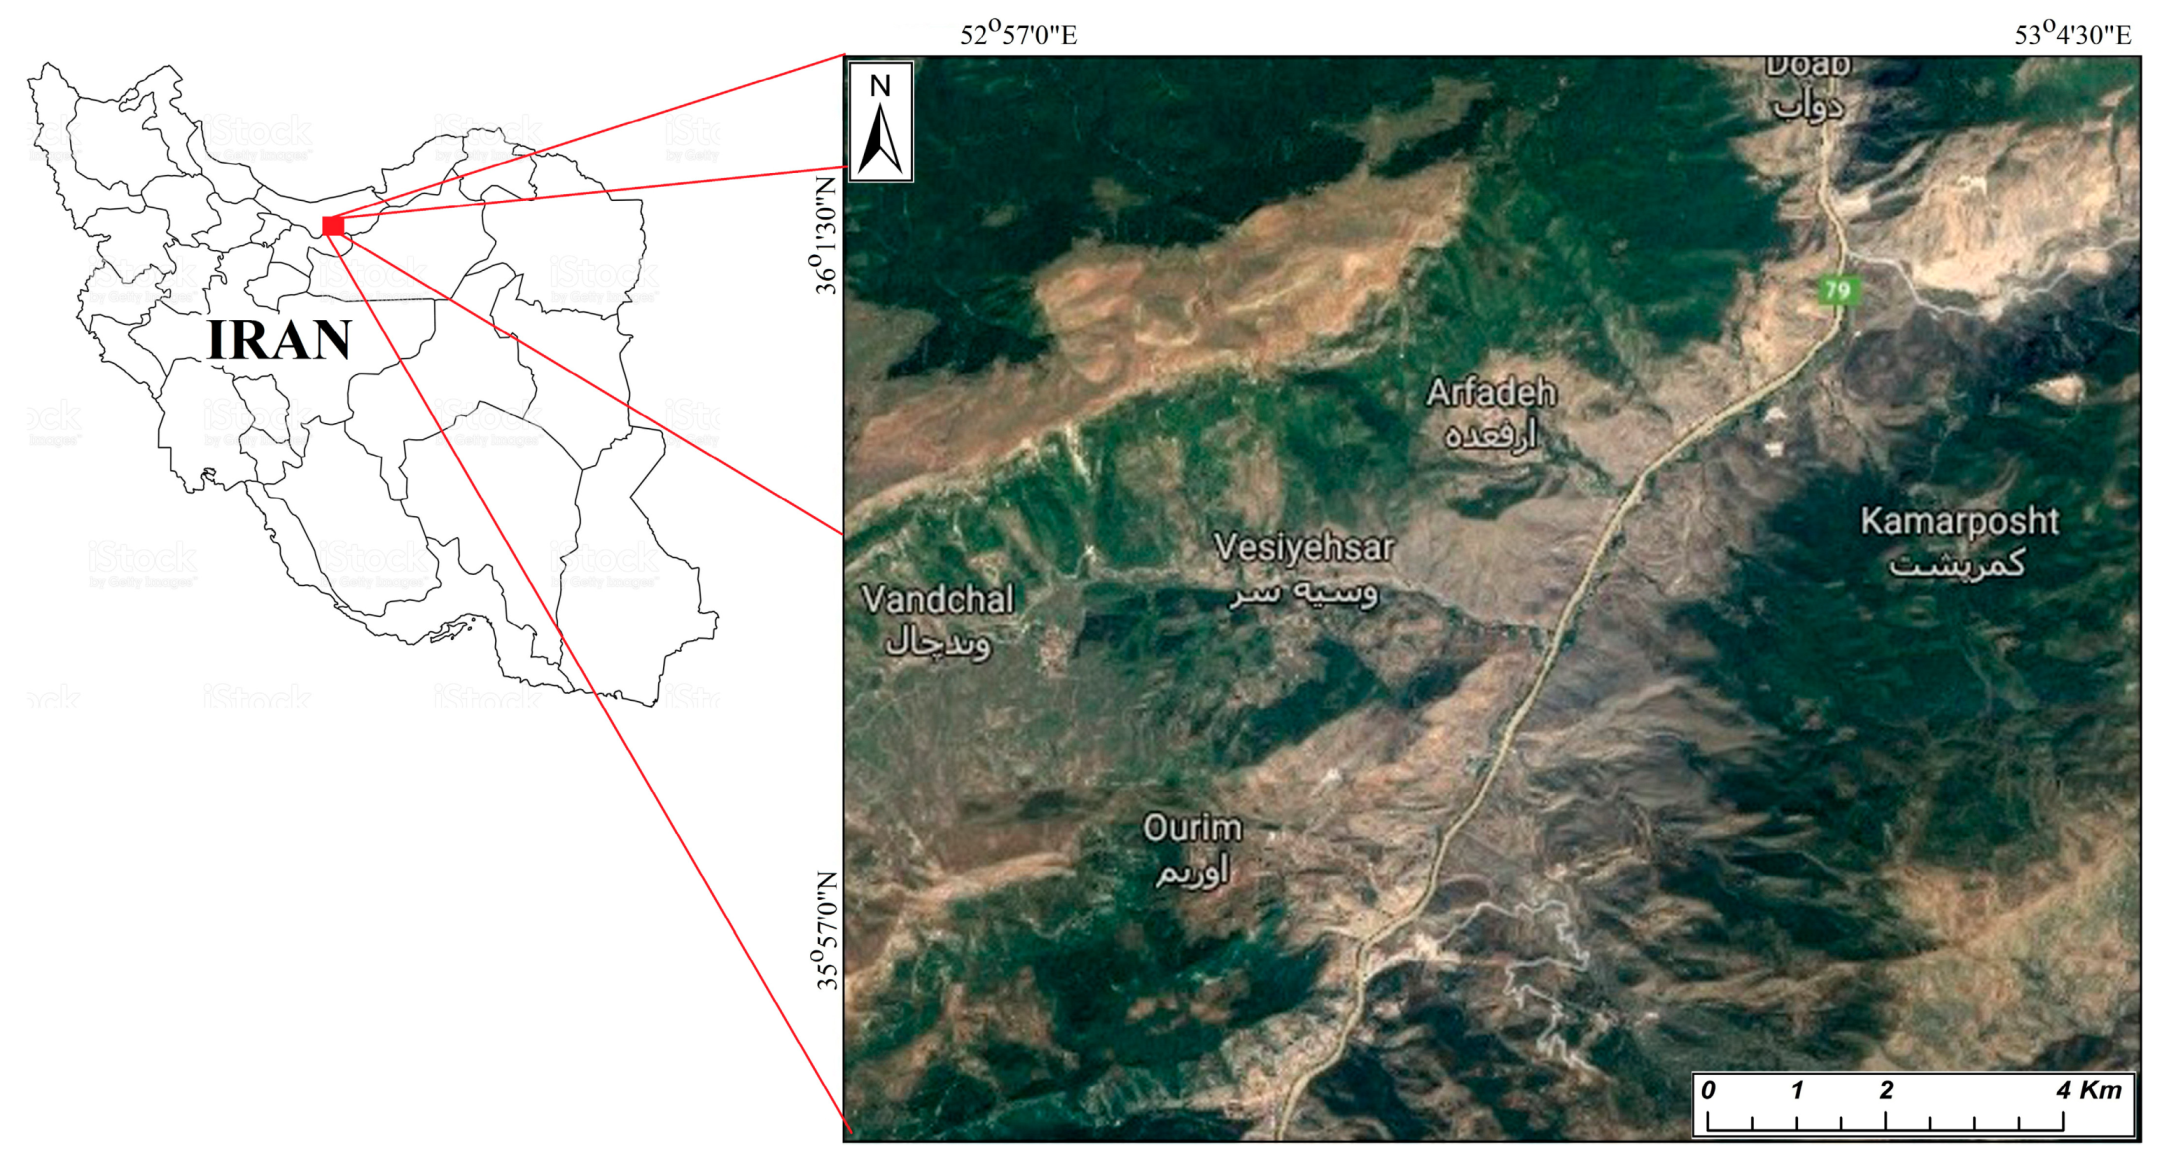
Figure 1.
Location of the Gorzineh-khil region (studied area) in Iran by Google Earth.

Figure 2.
Geological map and cross-section of the Gorzineh-khil region (studied area) [34].
Figure 2.
Geological map and cross-section of the Gorzineh-khil region (studied area) [34].

Figure 3.
A view of several of historical landslides in the study area.

Figure 4.
The geomorphologic/topographic triggering factors: (a) slope curvature, (b) topographical elevation, (c) slope aspect, and (d) weathering.
Figure 4.
The geomorphologic/topographic triggering factors: (a) slope curvature, (b) topographical elevation, (c) slope aspect, and (d) weathering.

Figure 5.
The water conditional triggering factors: (a) hydrological gradient, (b) drainage pattern, and (c) flow gradient.
Figure 5.
The water conditional triggering factors: (a) hydrological gradient, (b) drainage pattern, and (c) flow gradient.


Figure 7.
Flowchart of the CNN-based methodology.

Figure 8.
Basic map of the CNN-based susceptibility analysis.

Figure 9.
Pixel grid cells intensity evaluations during processing of images.

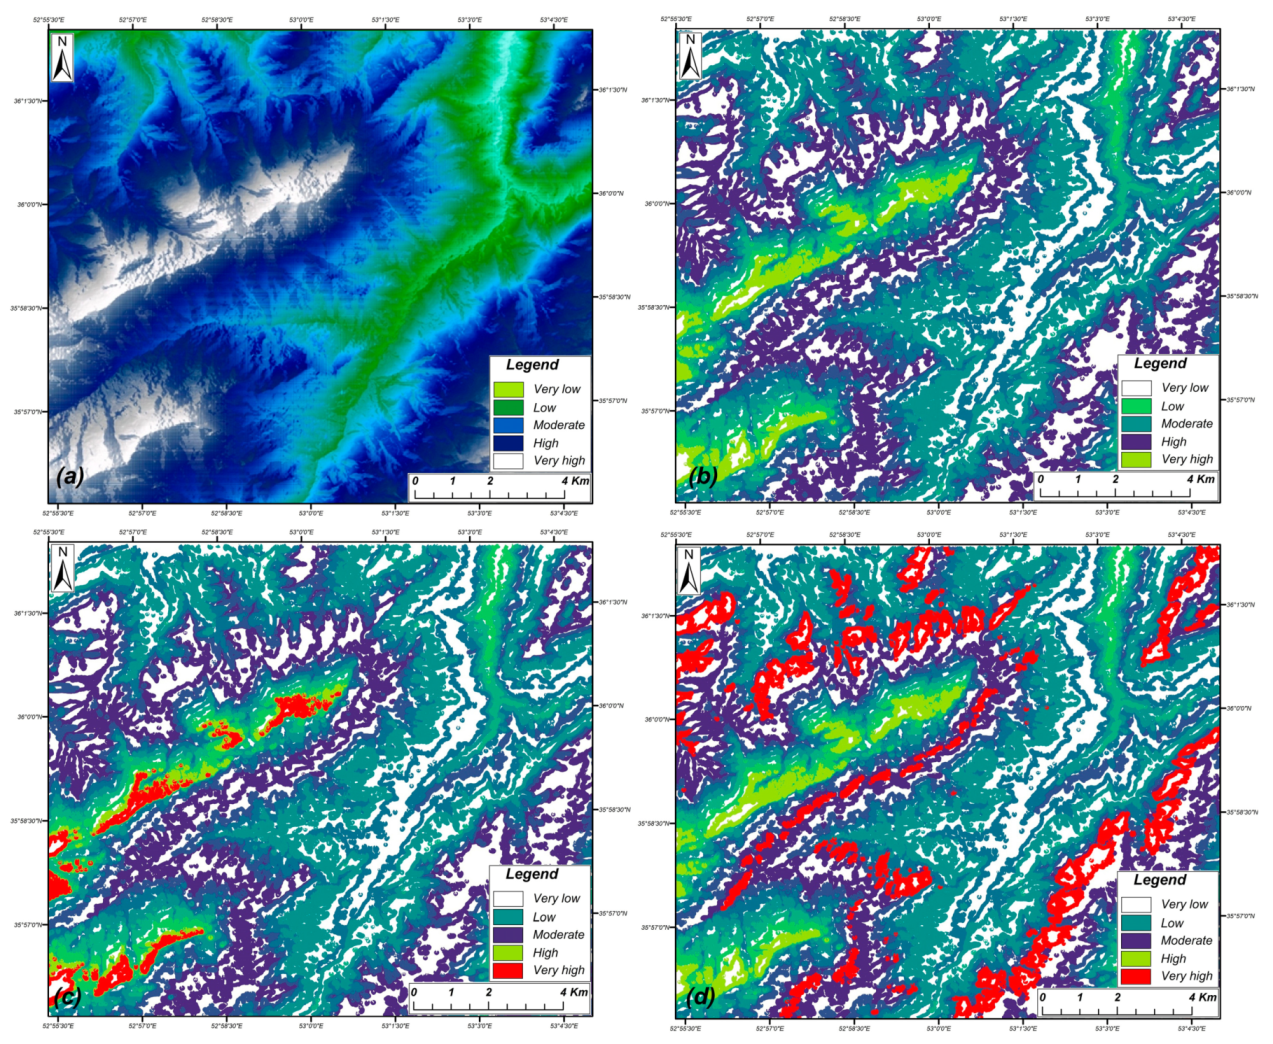
Figure 10.
The overlaying results of convolution implementation (CNN-based relevance maps) to estimate the region landslides susceptibility (a) CNN class 1, (b) CNN class 2, (c) CNN class 3, (d) CNN class 4.
Figure 10.
The overlaying results of convolution implementation (CNN-based relevance maps) to estimate the region landslides susceptibility (a) CNN class 1, (b) CNN class 2, (c) CNN class 3, (d) CNN class 4.

Figure 11.
Training and validation diagrams for CNN model.

Figure 12.
Loss function for landslide susceptibility assessment.

Figure 13.
CNN-based landslide susceptibility map.

Figure 14.
The confusion matrix of landslide susceptibility modelling performance.

Figure 15.
ROC results for all machine-learning models in susceptibility assessment.


Table 1.
Relations between the triggering factors and landslide susceptibility conditions.
| Triggering Factor | Class | Number of Landslides | Pixel Intensity | Landslide per Cent |
|---|---|---|---|---|
| Slope curvature | <10 | 0 | 207.738 | 7.84 |
| 10–25 | 6 | 278.819 | 12.12 | |
| 25–50 | 7 | 323.206 | 18.20 | |
| 50–75 | 7 | 393.633 | 27.73 | |
| >75 | 10 | 277.958 | 34.11 | |
| Topographical elevation | 0–800 | 4 | 264.081 | 10.28 |
| 800–1600 | 2 | 749.392 | 11.61 | |
| 1600–2400 | 8 | 435.844 | 21.81 | |
| 2400–3200 | 6 | 489.861 | 24.33 | |
| 3200–4000 | 10 | 392.303 | 31.97 | |
| Slope aspect | Flat | 0 | 21.630 | 0.00 |
| North | 9 | 428.201 | 25.65 | |
| South | 7 | 482.767 | 19.84 | |
| East | 6 | 375.932 | 33.28 | |
| West | 8 | 441.835 | 21.23 | |
| Weathering | Fresh | 0 | 14.468 | 4.68 |
| Low | 3 | 389.459 | 11.50 | |
| Moderate | 7 | 370.655 | 28.38 | |
| High | 12 | 497.019 | 33.35 | |
| In-situ soil | 8 | 289.014 | 22.09 | |
| Hydrological gradient | <10 | 0 | 218.778 | 7.54 |
| 10–25 | 2 | 461.844 | 14.68 | |
| 25–50 | 6 | 492.993 | 19.26 | |
| 50–75 | 9 | 841.890 | 31.41 | |
| >75 | 13 | 982.711 | 27.11 | |
| Drainage pattern | 0–800 | 1 | 427.140 | 12.56 |
| 800–1600 | 7 | 400.198 | 14.37 | |
| 1600–2400 | 5 | 481.806 | 22.66 | |
| 2400–3200 | 7 | 828.263 | 23.28 | |
| 3200–4000 | 10 | 810.997 | 27.13 | |
| Flow gradient | 0–120 | 1 | 630.293 | 4.39 |
| 120–240 | 1 | 827.213 | 10.55 | |
| 240–360 | 9 | 975.399 | 27.59 | |
| 360–480 | 14 | 644.767 | 19.00 | |
| 480–600 | 5 | 862.620 | 38.47 |
Table 2.
A summary of the historical landsides.
| # | Location | Height | Slope Dip | Geology | Failure Type | Tensile Crack | |
|---|---|---|---|---|---|---|---|
| 1 | 53.038 E | 36.013 N | 120 | 47 | Sediment | Massive | Yes |
| 2 | 53.056 E | 35.984 N | 200 | 40 | Sediment | Massive | Yes |
| 3 | 53.045 E | 35.987 N | 79 | 46 | Sediment | Planar | Yes |
| 4 | 53.044 E | 35.984 N | 35 | 57 | Sediment | Planar | Yes |
| 5 | 53.042 E | 35.979 N | 150 | 55 | Sediment | Massive | Yes |
| 6 | 53.041 E | 35.976 N | 63 | 50 | Sediment | Massive | Yes |
| 7 | 53.051 E | 35.979 N | 47 | 60 | Sediment | Planar | Yes |
| 8 | 53.067 E | 35.974 N | 100 | 47 | Sediment | Massive | Yes |
| 9 | 53.059 E | 35.954 N | 210 | 63 | Rock | Sliding | No |
| 10 | 53.036 E | 35.965 N | 120 | 57 | Sediment | Massive | Yes |
| 11 | 53.033 E | 35.961 N | 70 | 55 | Sediment | Massive | Yes |
| 12 | 53.017 E | 35.962 N | 32 | 45 | Sediment | Massive | Yes |
| 13 | 53.010 E | 35.964 N | 120 | 67 | Sediment | Massive | Yes |
| 14 | 53.993 E | 35.968 N | 150 | 57 | Sediment | Massive | Yes |
| 15 | 53.004 E | 35.956 N | 200 | 63 | Sediment | Massive | Yes |
| 16 | 53.960 E | 35.965 N | 170 | 64 | Sediment | Massive | Yes |
| 17 | 53.951 E | 35.972 N | 120 | 57 | Sediment | Massive | Yes |
| 18 | 53.995 E | 35.005 N | 220 | 67 | Rock | Sliding | No |
| 19 | 53.960 E | 35.992 N | 170 | 55 | Sediment | Massive | Yes |
| 20 | 53.965 E | 35.990 N | 100 | 47 | Sediment | Massive | Yes |
| 21 | 53.964 E | 35.990 N | 120 | 45 | Sediment | Massive | Yes |
| 22 | 53.047 E | 36.000 N | 37 | 47 | Sediment | Massive | Yes |
| 23 | 53.041 E | 35.992 N | 32 | 45 | Sediment | Massive | Yes |
| 24 | 53.037 E | 35.993 N | 100 | 55 | Sediment | Massive | Yes |
| 25 | 53.002 E | 35.996 N | 205 | 60 | Sediment | Planar | Yes |
| 26 | 53.008 E | 35.990 N | 120 | 47 | Sediment | Massive | Yes |
| 27 | 53.023 E | 35.982 N | 75 | 63 | Sediment | Massive | Yes |
| 28 | 53.019 E | 35.979 N | 32 | 55 | Sediment | Massive | Yes |
| 29 | 53.008 E | 35.977 N | 120 | 63 | Sediment | Massive | Yes |
| 30 | 53.013 E | 35.976 N | 30 | 60 | Sediment | Massive | Yes |
Table 3.
The evaluated confusion matrix for landslide susceptibility indices.
| CNN Classification * | Assessment Score | Accuracy | ||
|---|---|---|---|---|
| Precision | Recall | F1-Score | ||
| Class 1 | 0.76 | 0.79 | 0.74 | 0.78 |
| Class 2 | 0.75 | 0.77 | 0.79 | 0.81 |
| Class 3 | 0.73 | 0.75 | 0.79 | 0.79 |
| Class 4 | 0.73 | 0.72 | 0.77 | 0.80 |
| Class 5 | 0.70 | 0.73 | 0.79 | 0.78 |
| Total (avg.) | 0.734 | 0.752 | 0.772 | 0.792 |
* Susceptibility classes (see Table 1) avg. is average.
Table 4.
Justification results for the proposed landslide susceptibility model.
| Justification Method | Assessment Score | Accuracy | ||
|---|---|---|---|---|
| Precision | Recall | F1-Score | ||
| SVM | 0.70 | 0.71 | 0.70 | 0.71 |
| k-NN | 0.65 | 0.61 | 0.61 | 0.65 |
| DT | 0.60 | 0.63 | 0.65 | 0.63 |
| CNN | 0.73 | 0.75 | 0.77 | 0.79 |
Table 5.
The error table for different machine-learning modeling.
| Classifier | MSE | MAPE | RMSE |
|---|---|---|---|
| SVM | 0.2237456 | 0.3449610 | 0.2365904 |
| k-NN | 0.1307752 | 0.1975660 | 0.1469843 |
| DT | 0.2359663 | 0.2275315 | 0.2085891 |
| CNN | 0.0135980 | 0.0102987 | 0.0175438 |
Publisher’s Note: MDPI stays neutral with regard to jurisdictional claims in published maps and institutional affiliations. |
© 2022 by the authors. Licensee MDPI, Basel, Switzerland. This article is an open access article distributed under the terms and conditions of the Creative Commons Attribution (CC BY) license (https://creativecommons.org/licenses/by/4.0/).
Share and Cite
MDPI and ACS Style
Nikoobakht, S.; Azarafza, M.; Akgün, H.; Derakhshani, R. Landslide Susceptibility Assessment by Using Convolutional Neural Network. Appl. Sci. 2022, 12, 5992. https://doi.org/10.3390/app12125992
AMA Style
Nikoobakht S, Azarafza M, Akgün H, Derakhshani R. Landslide Susceptibility Assessment by Using Convolutional Neural Network. Applied Sciences. 2022; 12(12):5992. https://doi.org/10.3390/app12125992
Chicago/Turabian StyleNikoobakht, Shahrzad, Mohammad Azarafza, Haluk Akgün, and Reza Derakhshani. 2022. "Landslide Susceptibility Assessment by Using Convolutional Neural Network" Applied Sciences 12, no. 12: 5992. https://doi.org/10.3390/app12125992
Note that from the first issue of 2016, this journal uses article numbers instead of page numbers. See further details here.